

1
School of Business, Society & Engineering Bachelor Thesis in Economics Spring 2013
Empirical investigation of the Nexus between Foreign Direct Investment and
Economic Growth in Africa
Farshad Farzadi Analytical finance Student [email protected]
Kigha Nubitgha,Franklin Analytical finance Student [email protected]
Zara Daghbashyan Thesis Supervisor [email protected]

2
Acknowledgment First and foremost we will like to thank Zara for supervising us in this thesis. Kigha Nubitgha Franklin I will like to thank Farshad for his support and corporation during this thesis, not forgetting the support of my lovely wife Sen Sani Florence and my son Kigha Nubitgha Bahbit Louis . Special thanks to Gehmi Amos Samgwa and his entire family for their support. Farshad Farzadi I would like to say ‘Thank You’ to each person who supported me during my bachelor program, specially my family , friends and my lover Shaghayegh kashani. More special thanks to my father Firouz Farzadi, my mother Farideh Mortazavi, for giving me life.
3
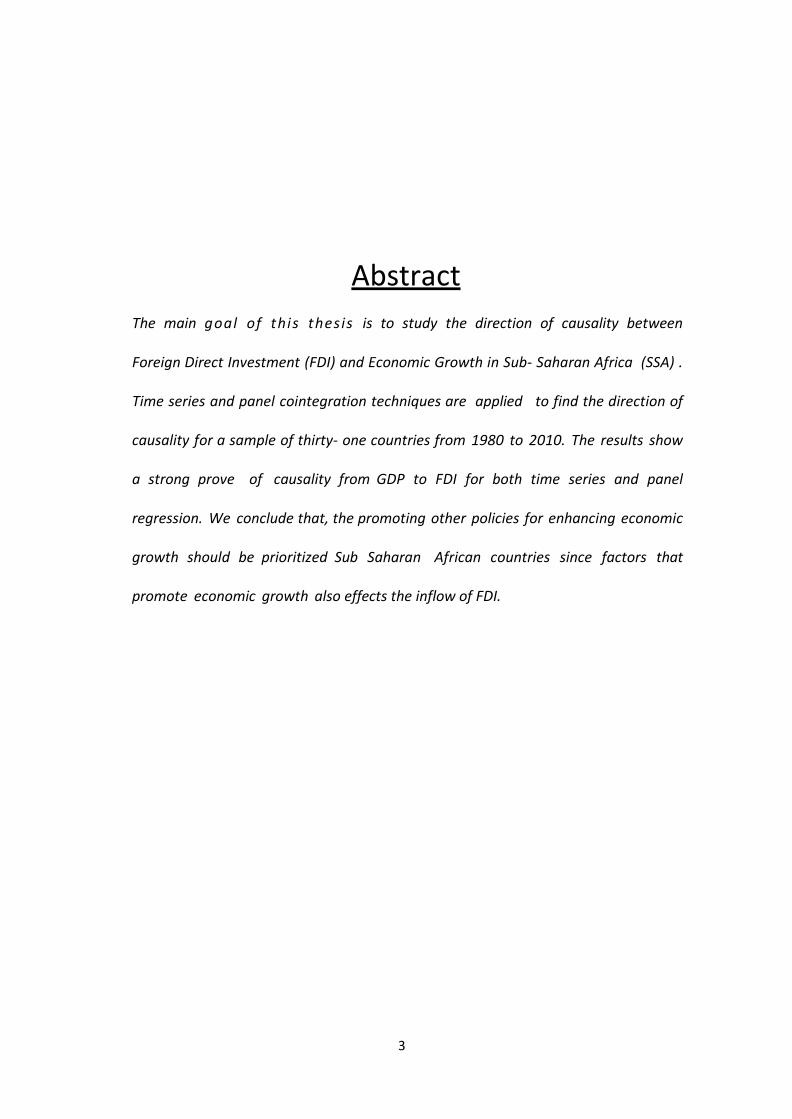
Abstract
The main goal of this thesis is to study the direction of causality between
Foreign Direct Investment (FDI) and Economic Growth in Sub- Saharan Africa (SSA) .
Time series and panel cointegration techniques are applied to find the direction of
causality for a sample of thirty- one countries from 1980 to 2010. The results show
a strong prove of causality from GDP to FDI for both time series and panel
regression. We conclude that, the promoting other policies for enhancing economic
growth should be prioritized Sub Saharan African countries since factors that
promote economic growth also effects the inflow of FDI.

4
Table of Contents
TITLE........................................................................................................1
Acknowledgment….............................................................................2
ABSTRACT...............................................................................................3
List of tables...........................................................................................5
1. INTRODUCTION............................................................................6
1.1 Background …….......................................................................6 1.2 Research question……………………………………………………………….8 1.3: FDI to SUB-SAHARA AFRICA: STYLISED FACTS..................... 10
2. LITERATURE REVIEW...................................................................13
2.1:From FDI to growth…………………………………………………………….13
2.2 Another stand of literature...................................................... 15
3. METHODOLOGY............................................................................18
3.1 DATA AND VARIABLE MEASUREMENT……………………......................18
3.2EMPIRICAL STRATEGY.................................................................19
4. RESULTS AND ANALYSIS...............................................................22
4.1RESULTS OF THE PANEL (GROUP) INVESTIGATION........................................22
4.2RESULTS OF THE TIME SERIES (INDIVIDUAL COUNTRY) INVESTIGATION.......26
4.2.1UNIT ROOT TEST..........................................................................................26
4.2.2COINTEGRATION AND GRANGER CAUSALITY TEST RESULTS.....................27
5. CONCLUSIONS AND RECOMMENDATIONS...................................30
6. REFERENCES....................................................................................32
7. APPENDICES................................................................................... 36

5
List of Tables
1.1 Pattern of FDI flows to SSA since 1996 1.3.1 GDP differences for SSA countries
1.3.2 Inflow (US & bn) in SSA Countries 4.1 Results of IPS Unit Root test results
4.2 Panel Cointegration test results
4.3 Results of the Panel Granger causality test for the pair wise case
4.4 Results of the Panel Granger causality test for the VECM
4.5 Bivariate Granger causality test between FDI and GDP/GDP per capita for Chad and Mauritania
4.6 Bivariate Granger causality test between FDI and GDP/GDP per capita for Ghana and Mauritius
4.7 Bivariate Granger causality test between FDI and GDP/GDP per capita for Madagascar, Malawi, Mali, Senegal, South Africa and Zambia

6
1.0: INTRODUCTION
1.1 Background
Foreign Direct Investment (FDI) is defined as an investment made by a resident of one
economy in another economy which is of long term nature or of ‘lasting interest’
(UNCTAD 2009)1 . Many countries have developed numerous strategies to attract foreign
investment and expertise in the quest to increase economic output. Most developing
countries turn to look at investment in the form of foreign capital as being more favorable
because it has no strings attached . Foreign direct investment (FDI) has greatly been
encouraged by government leaders in developing countries of sub-Sahara Africa
countries because most of these countries ,face inadequate resources to finance long
term projects .
Carkovic and Levine (2002), investigating the impact of FDI and economic growth has
important policy implications. If FDI has a positive effect on economic growth , other growth
determinants, then the argument of restricting FDI is weakened. If, on the other hand, FDI is
found to increase or exert a positive impact on economic growth, then there should be a
reconsideration of incentives like infrastructure subsidies, tax reductions, import duty
exemptions and other methods used to attract FDI.
Lots of research have been carried out to examine the link between Foreign Direct
Investment (FDI) and economic growth with emphasis on both developing and industrial
economies. They suggest that FDI has bring some important benefits to the host country. In
particular FDI serves as a source of capital, managerial skills and technical know-how.it
contributes to technology transfers to compliment domestic firms to opening up the
market to the international production networks, development of human capital through
employee training and the transfer of knowledge and, finally, increases the overall
economic growth of the host country. FDI fills in the savings –investment gap which gives
the host country access to productive capacity, technology and management resources.
1 United Nations Conference on Trade and Development (UNCTAD) work programme on FDI statistics analyses
regional and global trends on FDI and helps developing countries formulate FDI policies based on availability of
quality data and reports from Multi-National Company’s (MNCs) operating in the region.

7
Rolmer (1993) argues that there are important ‘idea gaps’ between the rich and poor
countries and FDI can ease the transfer of technological business transfer know how
between rich and poor countries. Foreign firms are argued to bring Investment into the
host country and in the process bring secondary benefits, resulting in increased
productivity and growth. Borensztein and Lee (1998) suggest that FDI by Multinationals
Companies (MNCs) is considered a major channel for developing countries to have access
to advanced technologies as MNCs are among the most technically advanced firms in the
world and accounting for a substantial part of the world’s research and development. De
Mello (1999) also makes an interesting analysis on how FDI can affect the host economy.
According to him the impact of FDI on growth is expected to be two-fold. First, FDI can
be growth enhancing through capital accumulation and, secondly, through
knowledge transfers, FDI is expected to increase the existing stock of knowledge in the
recipient economy through labor training, skills acquisition and through the
introduction of alternate management practices and organizational arrangements.
But, there are some researchers which argued that the positive spillover of FDI to
domestic firms is only theoretical and not practical. Hanson (2000), for example, argues
that the location of Ford and General Motors in Brazil have failed to show the expected
positive spillover benefits. GÖrg and Greenaway (2003) examine in detail and provide a
comprehensive evaluation of the empirical evidence on FDI on productivity, wages and
export spillovers in developing, developed and transitional economies. They argue that
MNCs may be effective in ensuring that firm specific assets and advantages do not spill
over. In this case, the firm internalizes certain transactions to protect its brand, technology
or marketing advantages. The paper concluded that although theory can identify a
range of possible spillover channels, empirical support for these positive spillovers is
not well defined. In order to tap the full effects of FDI in the economy, one has to test the
direction of causality between the two parameters .The traditional assumption is that there

8
is a one-way causal link from FDI to economic growth. Recent investigations have
considered the chances of a two-way (bidirectional) and a situation where causality is non-
existent in either way among the parameters of interest.
1.2Research question
The aim of this research is to find the direction of causality between Foreign Direct
Investment (FDI) and economic growth in Sub- Saharan Africa.
1. Results from this investigation should help clarify the causal link and thus contribute
to our understanding of the importance of Foreign Direct Investment (FDI) for economic
growth in Sub Sahara Africa (SSA) since the lack of empirical investigations means that
discussion about the importance of FDI for economic growth especially in SSA is hardly
informed by rigorous evidence.
2. The doubt of whether the link between FDI and economic growth is similar across
countries and continents is an important point. While earlier study on causal link
between Foreign Direct Investment (FDI) and economic development in non-SSA
countries largely suggest some positive causal relationship, it is unclear whether the
evidence can be replicated in SSA. It is therefore important that conclusions about the
causal link between FDI and economic growth in other countries are validated in a
diverse context such as SSA where there appears to be an increasing emphasis on the
importance of FDI for economic growth. Results from this research will contribute greatly
to our knowledge in this regard.
3. To significantly investigate the causal link between FDI and economic growth useful for
policy consideration. It is necessary that the studies utilize the most accurate method
in establishing the relationship between FDI and economic development. Thus, the use
of time series and panel data will give a more robust results which is supposed to aid
and guide policy makers in the region to more informed decision, and formulate
effective rules to attract FDI to the region should a positive connection be confirmed and

9
vice versa.
1) What factors drive FDI in Developing countries?
2) Are those factors equally relevant to SSA?
3) Why has SSA been relatively unsuccessful in attracting FDI despite policy reform?
Our first limitation is the quality of the data and this is true for most African countries.
Due to these irregularities, we could only work with thirty-one countries out of the forty-
eight countries in our sample.
Grainger causality test is not reliable enough in this analysis to imply true causality because
it is meant to handle two variables thus the results can be misleading when it has to do with
three or more variables. Research in the future can elaborate the content of this research by
analyzing the direction of causality in a multi Vector Auto Regression (VAR) system that take
in to consideration more variables such as rules of law , corruption , openness and so on
that have impact on economic growth and the inflow of FDI. More robust results can be
gotten in this way for more studier conclusions.
This thesis is divided into five chapters. The next chapter bring some evidence from Sub
Sahara Africa (SSA). The third chapter reviews the literature on the link between FDI and
economic growth. The forth chapter focuses on the research methodology; the data
(statistics) source, model and estimation procedure are explained in details in this chapter.
Chapter five presents results based of the different estimations.

10
1.3: FDI TO SUB-SAHARAN AFRICA: STYLISED FACTS
Sub-Saharan Africa’s (SSA) share of Foreign Direct Investment (FDI) continues to drop
regardless of all efforts to improve their environmental policy. Table 1.1 shows figures
from the Economic Intelligence Unit (2011) about patterns of FDI flows to SSA countries
since 1996. As the figures shows, FDI inflows to SSA fell to $12.2bn in 2006 after reaching
a record high of more than $15bn in 2005. According to the Report, large inflows of FDI
into the region in 2005 were dominated by many MNCs in South Africa as seen in the
case of the buying of South African Bank by Barclays Bank, UK. Thus, large disinvestment
in South Africa, which meant a slightly negative inward FDI inflow, caused the total drop
down in FDI inflows in the overall region in 2006.
Here we can see GDP growth and GDP per capita between 1981-2010 in SSA:
1.3.1 GDP differences for SSA countries

11
Table 1 .1: Pattern of FDI flows to SSA since 1996.
SSA 1996 1997 1998 1999 2000 2001 2002 2003 Inflows (US $ bn) 4.5 8.4 6.7 9.0 5.7 13.6 9.0 13.4 % of world total 1.1 1.7 0.9 0.8 0.4 1.6 1.5 2.4 % change year on year -0.9 87.2 -20.6 34.0 -35.9 137.7 -34.1 49.3 % of GDP 1.5 2.6 2.2 3.0 1.9 4.6 3.0 3.4
Table 1.1: cont.
SSA 2004 2005 2006 2007 2008 2009 2010 2011 Inflows (US $ bn) 11.3 15.2 12.2 13.4 13.9 16.1 17.1 18.1 % of world total 1.5 1.6 0.9 0.9 1.0 1.1 1.1 1.1 % change year on year -15.9 34.3 -19.6 10.3 3.0 16.3 6.3 5.7 % of GDP 2.3 2.7 2.0 2.0 1.9 2.1 2.1 2.0
Source: National Statistics; Economic Intelligence Unit; IMF
1.3.2 Inflow (US & bn) in SSA Countries
In their 2010 report, UNCTAD (United Nations Conference on Trade and Development )
showed that global inflows of FDI amounted to $1.24 trillion, representing an increase
of about 5%. Though there was a rise in FDI figures globally, the total amount to Africa fell
about 9%, representing a value of $55bn.

12
According to Asiedu (2003: page number 2), ‘when it comes to FDI, Africa’s
experience vis-à-vis other developing countries can be characterized as absolute progress
but relative decline.’ And thus, analyzing this results critically one will ask at this point,
why is the inflow of FDI to SSA still declining? There are many factors that can influence
the inflow of FDI into the host country. These factors include the size of the host
country’s market, openness, labour cost and productivity, infrastructure, political risk,
incentives and operating conditions and privatization2. The EIC (2011), however, showed
that the bulk of SSA FDI inflow remains concentrated in the resource based industries
thus making resource rich countries – Nigeria, Angola and South Africa3 the largest
receivers of FDI in the Sub Sahara countries .The African Economic Outlook (2011) says that ,
Angola is likely to have received about 15% of the total FDI inflow in Subsahara
African which amounts to US$6.8 bill ion . Nigeria was in third position after Egypt
with a total of US$ 4.5 billion leaving South Africa in the eight positions with a total
amount of US$ 2 billion in 2010. Nigeria and Angola are in these positions because they
got more driving force from the availability of oil and gas while the attraction to South
Africa has been more diverse. The EIC (2011) says that ‘in addition to the mineral wealth in
South Africa, there is also appeal of relative financial sophistication and closer integration
with the global economy.’ As a results of all the analysis explained above on figures and
tables FDI has been randomly increasing in SSA during these period (1980-2010).
2 In Ghana, for example, inflow of FDI was relatively low, averaging US$ 11.7m during the periods 1986-92.
However, the privatisation of Ashanti Goldfields in March 1994, led to the increased in FDI inflow more than 17
times to an average of US$ 201m in the period 1993-95. 3
Ranking countries in the world on average FDI inflows from 2007 – 2011, South Africa ranked 49 with a share
of 3.2billion dollars, followed by Nigeria taking the 58th
place with an FDI amount of $2.1bn and Angola
following closely behind Nigeria occupying 60th
position with an amount of $1.9bn. The rest were Egypt,
Tunisia, Libya and Morocco, which place 41st
, 61st
, 62nd
and 65th
respectively. These latter countries are, however, all North African countries.

13

14
2.0: LITERATURE REVIEW
In the last two decades there have been a plethora of studies concerning FDI and
Economic growth with a few relating to the direction of causality.
2.1:From FDI to growth
Four prominent studies exist, which focus on closely related aspects of how FDI affects
economic growth and development in the host country. First, Borensztein, Gregorio and
Lee (1997) examine empirically the complementarities between Foreign Direct
Investment (FDI) and human capital in the process of productivity growth. The research
was based on cross-country analysis of data on FDI flows from Industrial countries to 69
developing countries in the period of 1970 to 1989. they show the conclusion that the
contribution of FDI to economic growth is boosted by its interaction with the level of
human capital in the host country
To support their results, Wu and Chih-Chiang (2008) examine if Foreign Direct Investment
(FDI) impact on economic growth is reliant on different absorptive capacities. Wu and
Chih-Chiang named these absorptive capacities as initial GDP per capita, human capital
and volume of trade. The study resorted to a survey based on statistics from sixty-two
countries from 1975 to 2000. They concluded that under threshold regression developed
by Caner and Hansen (2004), that FDI has a significant and positive effect on economic
growth when the host country has better levels of human capital and initial GDP.
Secondly, Balasubramanyam, Sapsford and Salisu (1996) used the new growth theory to
test the relationship between trade and FDI in increasing growth in developing countries.
Another empirical investigation conducted by Alfaro, Kalemli Ozcan, Sayek and Chanda
(2002) examined the different interrelations between FDI, financial markets and growth.
They show that, development of the financial sector, is important potential positive FDI
externalities.

15
Finally, Blomsrtom, Lipsey and Zejan (1992), draw attention to per capita income as they
find that FDI promotes economic growth in countries sufficiently rich in per capita income.
The research attempted to explain why developing countries do not converge to that
of their rich counterparts . In other words, why do developing countries not grow? The
paper looked at the determinates of economic growth of several variables taken
into consideration two international indicatators,such as inflow of FDI and the imports
of machinery and transport equipments.
Carkovic and Levine (2002) discover an interesting finding, in contrast to the results
discussed above. They discover that FDI and the interaction term ‘school’ did not yield
any significant results in any of the OLS regressions. In the panel regression however, FDI
and the interaction term ‘school’ was occasionally significant but this does not conform
to theory. The coefficient of FDI assumes a positive value while that of the interaction
term,‘school’ assumes a negative value. The results suggest that FDI is only growth
enhancing with countries with low educational attainment. They concluded that the
impact of FDI growth does not robustly vary with the level of educational
attainment.
Makki and Somwaru (2004) supported this finding. They conducted an empirical research
to analyze the effects of FDI and trade on economic growth and to examine how FDI
interacts with trade, human capital and domestic investment in advancing economic growth
in developing countries. Again, Carkovic and Levine (2002), in their paper examined
whether the relationship between FDI and economic growth varies with the degree of
Openness. They concluded no robust link between FDI and growth even when allowing
the relationship to vary with trade openness . They concluded that FDI flows to
financially developed economies do not exert an exogenous impact on growth. Lastly,
Blomstrom et al’s argument on FDI’s interaction with sufficient levels of per capita income
as key to significant growth effect was again dismissed by Carkovic et al who did not find

16
any link between growth and FDI when allowing the impact of growth and FDI to depend
on the level of per capita income. These results rule in favour of Carkovic et al against
Borensztein et al’s conclusion that human capital stock is necessary for FDI to be growth
enhancing. Hansen and Rand (2006) studied the effect of FDI on economic growth on
thirty-one countries of Asia, Latin America and Africa. The research use data from the
World Development Indicators (2002) and UNCTAD Foreign Direct Investment (FDI)
database for more than thirty- one years. Though the main aim of the paper was to
examine the causal relations between FDI and economic growth in developing countries,
the analysis gave room to assess the validity of threshold effects and how they impact
on economic growth in the host country.
The discussions above show that the impact of FDI on economic growth is a controversial
one. These theories explained above do not dispute the fact that FDI is important to
economic growth.
2.2 Another stand of literature
One has to ask himself the question of ‘what causes what?’ Researchers think there are
three ways in which Foreign Direct Investment (FDI) can affect economic growth. Causal
relation can run from FDI to growth (FDI led growth), and from growth to FDI (growth-
led FDI) or a bidirectional causality that runs in both directions. The direction of causality
has had a lot of attention in recent research works, as the link between the effects of FDI
on economic growth cannot be lined out either theoretically or empirically. Due to the
scope of this assessment, the second part of the review will focus on the causal relation
between FDI and economic growth. Since this thesis will empirically test this finding for
Sub Saharan African countries, (developing countries), we will broadly extend the
review on causality covering developing countries from all continents.

17
Zhang (1999) investigated the direction of causality between Foreign Direct Investment
(FDI) and economic growth for eleven developing countries of East Asia and Latin
America. The investigation used real GDP and argues that using FDI stock instead of flows
was the more suitable variable for the analysis in relation to GDP. However, there exist a
positive causality from GDP to FDI in Brazil in the short run and Columbia in the long run.
Zhang therefore concludes that proof of FDI –led growth hypothesis is mixed and the effect
of FDI on economic growth depends on the host country’s specific uniqueness such as
trade, human capital etc. Zhang (1999a) in another research used co- integration and
error correction models technique to find the long-term connection or short-term
dynamics between FDI and Economic growth in China. He discovered a long run
equilibrium relationship between the two variables However, there was a two-way
Granger causal relationship between FDI and economic growth in the Chinese economy.
It is not surprising since the Chinese economy is one of the fastest growing economies in
the world and the world’s most populated with huge markets and a state of the art
infrastructure, at least in parts of the country. A bidirectional relationship indicates that
the rapidity of growth in China also has an effect on the inflow of FDI into the country.
De Mello (1997), investigated the direction of causality from FDI to economic growth in
thirty- two countries. The thirty-two countries were all Organization for Economic Co-
operation and Development (OECD) countries except seventeen, which were not. He finds
no causation from FDI to economic growth in the non-OECD countries and concluded
that the level which FDI enhances economic growth depends on the particular
characteristics of the host country. Nair-Reichert and Weinhold (2001) test for causality
for cross country panels, using statistics for twenty- four developing countries for
twenty-five years in the interval 1971-1995. They found a causal link from FDI to
economic growth with proof that the efficacy of FDI on economic growth is higher in
economies which are more open as argued by Balasubramanyam et al (2004) though the
18
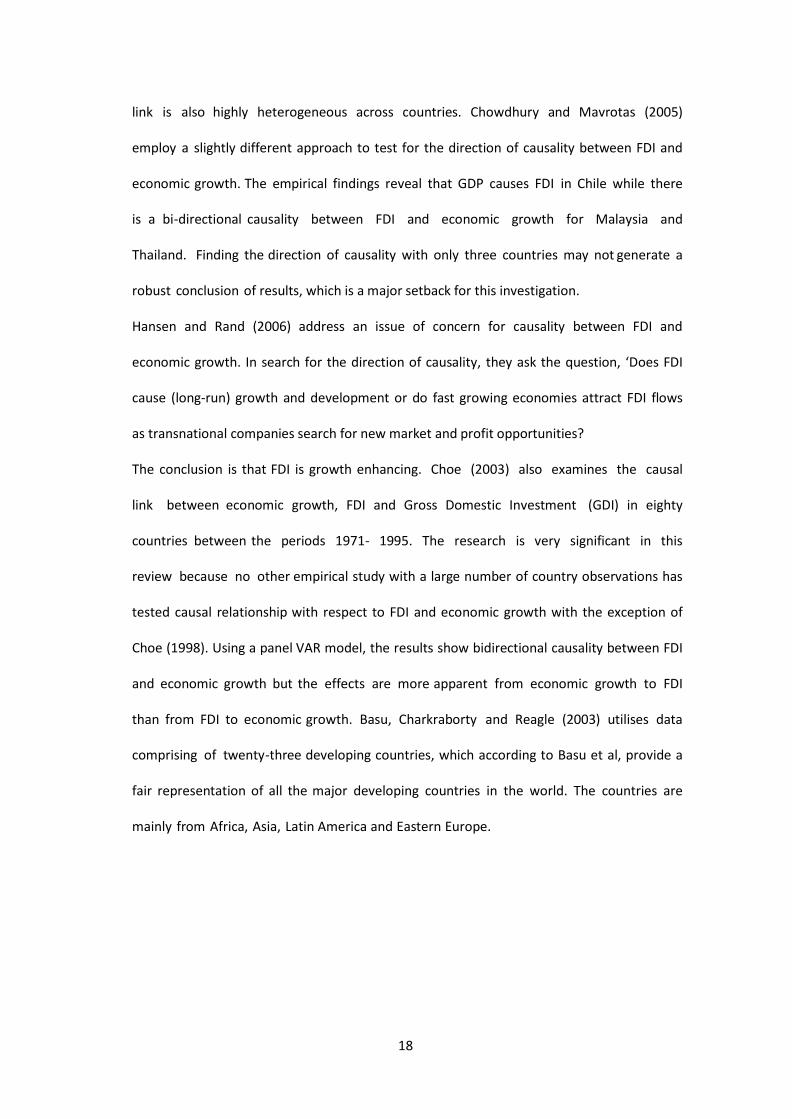
link is also highly heterogeneous across countries. Chowdhury and Mavrotas (2005)
employ a slightly different approach to test for the direction of causality between FDI and
economic growth. The empirical findings reveal that GDP causes FDI in Chile while there
is a bi-directional causality between FDI and economic growth for Malaysia and
Thailand. Finding the direction of causality with only three countries may not generate a
robust conclusion of results, which is a major setback for this investigation.
Hansen and Rand (2006) address an issue of concern for causality between FDI and
economic growth. In search for the direction of causality, they ask the question, ‘Does FDI
cause (long-run) growth and development or do fast growing economies attract FDI flows
as transnational companies search for new market and profit opportunities?
The conclusion is that FDI is growth enhancing. Choe (2003) also examines the causal
link between economic growth, FDI and Gross Domestic Investment (GDI) in eighty
countries between the periods 1971- 1995. The research is very significant in this
review because no other empirical study with a large number of country observations has
tested causal relationship with respect to FDI and economic growth with the exception of
Choe (1998). Using a panel VAR model, the results show bidirectional causality between FDI
and economic growth but the effects are more apparent from economic growth to FDI
than from FDI to economic growth. Basu, Charkraborty and Reagle (2003) utilises data
comprising of twenty-three developing countries, which according to Basu et al, provide a
fair representation of all the major developing countries in the world. The countries are
mainly from Africa, Asia, Latin America and Eastern Europe.

19
3.0: METHODOLOGY
In this part of the investigation, we cover the data and econometric methods used. We
divide it in two parts ; Section 3.1 define our data sources, levels of measurements
and descriptive statistic for the complete model. Section 3.2 describes the econometric
techniques and identification strategy. First, we analyze all Sub Sahara Africa countries
using none stationary panel data modeling methods. In the second phase of the study, we
apply country-by-country analysis using same time series econometrics techniques. This
will enable us to get a strong insight about the individual countries as well as the set of
countries together .
3.1: Data and Variable Measurements
The study covers forty- eight countries in Sub-Saharan Africa (SSA) covering from 1980 to
2010. With the exception of Sudan, the data was easily available for all the representing
countries. To make a more precise analysis, some countries, which had disarray
(disorder) the data, were dropped leaving us to work with thirty-one out of forty-eight
Sub Sahara Afirca (SSA) countries. Foreign Direct Investment (FDI) , is the dependent
variable calculated as the ration of net FDI flows to GDP . If the net growth of FDI are
negative for a specific year, it shows the whole value for disinvestment by foreign
investors was greater than the value of capital recently invested in the region.
There are two descriptive variables used in the analysis. These are economic output, which
is valued by real Gross National Product (GDP) and Gross Domestic Product (GDP) per
capita, which signifies the value of goods produced per person in the country- in other
way, individual influence of growth in the economy. GDP per capita is valued by dividing
the country’s GDP by the total population of the country. The GDP and GDP per capita dollar
calculates are derived from Purchasing Power Parity (PPP) calculations .PPP is a

20
condition between countries where a sum of money – in this case the United States dollar
has the same purchasing power in different countries. Using PPP is in the analysis allows
to takes into account the cost of living and the inflation rates of the countries whiles using
just the exchange rates can falsify the real changes in income. GDP and GDP per capita are
valued in constant 2005 international United States Dollar ($). All the data are obtained
from the World Development Indicators (World Bank), in September 2011 edition.
3.2 Empirical Strategy
As we mentioned in the introduction part of the study, this study’s aim is to investigate the
existence of Granger causal relation between Foreign Direct Investment (FDI) and economic
growth in SSA. To get clear understanding of the direction of causality, a more formal
method is used by counting lagged values of Foreign Direct Investment (FDI) in addition to
the lagged values of log of GDP per capita in the conditioned data set and vice versa.
The model of interest therefore takes the following formula:
p q
FDI j ,t i FDI j ,t i i ln GDPj ,t i j ,t , (1) i 1 i 1
P q
ln GDPj ,t i FDI j ,t i i ln GDPj ,t i e j ,t , (2) i 1 i 1
Where countries are shown with j subscript. At the country level of analysis, country
indicators are dropped from the two equations to get pure time series models. The null
hypothesis for equation (1) is that GDP (GDP per capita) does not Granger cause Foreign
Direct Investment (FDI). This decreases to test the restricted hypothesis that:
H0
: 1
2
q 0 . (3)

21
Also, the null hypothesis from equation (2) is that Foreign Direct Investment (FDI) does not
Granger cause GDP (GDP per capita). We testing this hypothesis through imposing the
following limitations on the parameters on lag effects on Foregin Direct Investment (FDI) in
equation 2. Particularly, we test the hypothesis that:
H0
: 1
2
p 0 . (4)
Simultaneous rejection of both hypotheses equation in (3) and (4) signifies bidirectional
Granger causal link between Foreign Direct Investment (FDI) and Gross Domestic
Production (GDP per capita). On the other side, simultaneous reception of both
hypotheses indicates no Granger causal relationship exists between this two variables.
When the model reject only one of the hypotheses, the indication is that there is
unidirectional (one way direction) causal relationship running from either FDI to GDP or from
GDP to FDI dependent on which hypothesis is accepted (rejected).To test the above
hypothesis reliably, Foreign Direct Investment (FDI) and GDP (GDP per capita) must be I(1)
or I(0) and have mutual stochastic tendency .
To affirm this fact, we first apply panel unit root tests on both the level (log level) and the
first changes of the related variables in our specifications in (1) and (2). In checking, we
apply the panel unit root test by Im, Pesaran and Shin (2003, hereafter IPS), which is
suitable for balanced panels as our situation is. This test is based on Augmented Dickey-
Fuller (ADF) test for an individual series in the panel. This test certifies that the ADF test
statistic is accepted to vary between different groups. The null hypothesis here is that all sets
have a unit root, under the alternative, of one or more sets do not have unit root .
Secondly, we execute panel cointegration test to ensure of stationarity between the data .
We offer the four panel cointegration tests advanced by Westerlund (2007). The main idea is
to test for the lack of cointegration by signifying whether there exists error correction for
individual panel data or for the panel as a whole. Consider following error correction
model, when all parameters in levels are expected to be I (1) or I (0):
P q
ln FDI j ,t j ,i FDI j ,t i j ,i ln GDPj ,t i j (FDI j ,t 1 j ln GDPj ,t 1 ) ej ,t
i 1 i 0
............................................................................................................................(5)
Where we have normalized the equilibrium link on FDI. Similar equation applied for GDP as dependent variable. This permits for country specific constant impacts, country time tendencies and country specific marginal impact in the long run equilibrium relationship.
j is an estimate of the speed of error-correction in the direction of the long
run equilibrium.

22
ln GDPj ,t (
j /
j )FDI
j ,t for country j. The Ga and Gt testing statistics
test
H0
: j 0 for
all j versus H
1 :
j 0 for at least one j. These statistics start from a calculated average of
the individually valued
j 's and their t-ratio's respectively. Refuses of H 0
should
Therefore be taken as evidence of cointegration of at least one of the cross-sectional units.
The Pa and Pt test statistics pool data over all the cross-sectional units to test
H
0 :
j 0 for all j versus H
1 :
j 0 for all j. Rejection of H 0 should therefore be taken as
evidence of cointegration for the whole panel .
The tests are so flexible and allow for an almost completely heterogeneous specification of
both the short- and long-run side of the error correction model, where the t’other can be
distinct from the data. The series are accepted to be of unequal length. If the cross sectional
units are questionable to be correlated, robust critical values can be received through
bootstrapping process.
In other hand to find individual country level proofs, we drop the j subscripts in (1) and (2)
and apply time series analysis on each country. We follow same process as in the instance of
the panel data method. First, we testing for unit root of the variables using the Phillips-
Peron (1988) method. The Phillips-Peron (PP) test is prior to the traditional Augmented
Dickey-Fuller (ADF) test ,since of its use of non-parametric systems to adjust for serial
correlation and endogeneity of regressors therewith preventing the loss of observations
applied by the ADF test. It also permits for the chance of heteroskedastic error terms (Hamilton,
1994). We test for cointegration using the Johansen (1988) test.

23
4 .0: RESULTS AND ANALYSIS
In this part of our thesis, we show the results of our estimations and discuss the
results. We start with the group evidence in Section 4.1. In section 4.2, we explain and
discuss the results at the separate country level.
4.1: Results of the Panel (Group) Investigation
The results of the panel study are shown in Table 4. The table is divided in to two
components. Table 4.1 summarizes the results of the IPS ( Im, Pesaran and Shin) panel
unit root test on the three variables analyzed.
Table 4: The results of panel investigation
Table 4.1: IPS Panel Unit Root test Results
Variable Level First Difference
Constant Constant&trend Constant Constant&trend
FDI -1.917*** -2.661***
LogGDP -1.493 -2.137 -2.489*** -3.102***
logPCGDP -1.512 -2.124 -3.049*** -3.281***
Table 4.2: Panel Cointegration Test Results
Model Ga statistic Gt statistic Pa Statistic Pt statistic
FDI=f(GDP) -10.591** -2.676 -18.252*** -19.616***
FDI=f(PCGDP) -11.862 -2.502 -18.213*** -18.986***
GDP=f(FDI) -8.307 -2.488 -4.856 -8.751
PCGDP=f(FDI) -7.404 -2.250 -5.121 -9.076 Note: ***, ** and * denotes the rejection of null hypothesis at 1%, 5% and 10% level of significance.

24
Table 4.2 shows the Westerlund (2007) panel co-integration test results for four
alternative specifications investigated. The outcomes of the IPS panel unit root test show
that Foreign Direct Investment (net inflows) is integrated of order zero [I (0)] for the
balanced panel of 31 countries observed from 1980 to 2010 at the level. This implies that
this variable is stationary. The economic insinuation of this is that any shock to the FDI
variable dies out in finite time. Nevertheless, the results on the other two parameters, the
log of real GDP and the log of real per capita GDP were found to be integrated of first order
[I (1)] at the log levels. This means that these parameters are none stationary at the log
levels but stationary at the first differences. The meaning of this is that while shocks to
these variables have permanent impacts and tends to persist over finite time. Thus, while
the shocks to the FDI parameter dies out in finite time, those to the real GDP and real GDP
per capita tends to continue for overly long period in time.
For testing cointegration using the Westerlund (2007) test, we tried four alternative
specifications as can be seen from Table 4.2. The results show strong proof of
cointegration when we normalized on Foreign Direct Investment (FDI). Nevertheless
there is no proof when we normalized on real GDP or real GDP per capita. Hence, the
cointegration test rejected the null hypothesis of no cointegration for our first specification
[FDI=f (GDP)] using the Ga, Pa, and Pt statistics. Ga , Gt and Pa , Pt are test statistics we
used to compare with Dickey-Fuller test to decide on whether to accept or reject null
hypothesis . This implies that there is proof of cointegration between FDI and real GDP for
the whole panel. In the second specification [FDI=f (PCGDP)], only the Pa, and Pt
statistics were significant and hence rejecting the null hypothesis of no integration for the
whole panel. In the last two specifications in Table 4.2, we could not find any proof
of cointegration as none of the four test statistics is significant. This finding suggests that
if there is any causal link between these, FDI and real GDP (or real per capita GDP) then
the causality must run from real GDP to FDI and not vice versa.

25
Vector Autoregression (VAR) is an econometric model used to obtain the linear
interdependencies among multiple time series . VAR models generalize the univariate
autoregression (AR) permitting for evoking more than one variable.
All variables in a VAR are treated symmetrically in a structural sense , also all variables has an
equation showing it’s evolution firmly fixed on it’s own lags and the lags of other variables.
Error Correction Model (VECMs) are a category of multiple time series models that estimates
the speed at which a dependent variable – Y- returns to equilibrium after a change in an
independent variable – X.
Cointergration is the existence of a stationary linear combination of nonstationary random
variables.
We therefore move next to checking this fact by running Granger causality test, first
between Foreign Direct Investment (FDI) and GDP and then Foreign Direct Investment (FDI)
and per capita GDP.
Granger causality results for pair wise case and VECM
Table 4.3: Results of the Panel Granger Causality Test for the pair wise case
Model Null hypothesis F. statistic
FDI| GDP GDP does not Granger cause FDI 5.0877***
FDI does not Granger cause GDP 0.1322
FDI|PCGDP PCGDP does not Granger cause FDI 1.2005
FDI does not Granger cause PCGDP 0.8768
Table 4.4: Results of the Panel Granger Causality Test for the VECM
Model Null hypothesis CHI SQ. statistic
FDI| GDP GDP does not Granger cause FDI 5.0222*
FDI does not Granger cause GDP 0.0379
FDI|PCGDP PCGDP does not Granger cause FDI 3.7073
FDI does not Granger cause PCGDP 0.2275 Note: ***, ** and * denotes the rejection of null hypothesis at 1%, 5% and 10% level of significance.
Table 4.3 shows the results of the Granger causality test for the panel of 31 SSA countries
for the pair- wise and, 4.4 shows the Vector Error Correction Model (VECM) outcomes. The
null hypothesis that GDP does not Granger causes Foreign Direct Investment (FDI) is
completely rejected at the 1% critical value of the restricted F- test. The VECM test however
rejects the null hypothesis that GDP does not Granger cause FDI at 10% critical value of

26
the chi-squared statistics from the Wald restriction test (see appendix, regression results 1
and 2 for the full VECM test results). The combine proof suggests a strong causal link from
GDP to FDI. However, the null hypothesis of no reverse causation from FDI to real GDP
cannot be rejected for all conventional levels of statistical significance for both test
outcomes.
Thus, the popular view that Foreign Direct Investment (FDI) augments domestic capital
stock and hence can boost growth in the recipient economy is not supported here. This can
be due to the fact that the causality test is run on the log of the first differences of real GDP
(real GDP growth rate)15 which tends to show little variability in the time dimension. Note
that neoclassical growth assume that the growth rate is constant over the long run.
However, the proposition that one of the key drivers of FDI is the size of the economy
(proxies here by the real GDP) tends to have support from the data. There is strong proof
that real GDP Granger causes FDI. Huge economies tend to received more Foreign Direct
Investment (FDI) relative to small economies. Nonetheless, neither the null hypothesis that
per capita GDP does not Granger causes FDI or the null hypothesis that FDI does not Granger
causes per capita GDP was not rejected. This implies that there is no statistical causal
relationship between these pair of parameters. This is rather surprising that income does
not matter for FDI and hence the rich and poor have equal probabilities of attracting FDI.
However, careful observations show that this group of countries are not much different
from each other in terms of income per capita hence, income per capita is therefore not an
important variable influencing FDI flows to SSA. When these countries in our sample are
compared with Latin America and Asia and the Caribbean, the results might change.

27
4.2 Results of Time Series (Individual Country) Investigation
4.2.1: Unit Root Test
We determined the time series properties of the variables individually. Before we carry on
the formal test for unit roots in the data, we also take the log of real GDP and per capita
GDP and then we also carry out a visual inspection test by plotting the series at the levels
(log levels) and first differences .
Examining the data in the levels showed none stationary of all the series as they exhibit
trends. However, when we plot the series in their first differences it showed no evidence of
trending series. (See appendix, figure 1 and 2 for sample plots of Benin and Zambia).We
use a more formal approach to determine the order of integration. Phillip Peron (PP) test is
employed for this purpose and the outcomes are presented in Table 1 (see appendix),
which shows non stationarity of all the variables at their logarithm level whether or not
there is movement. Liberia, Senegal, South Africa, Cameroon, Swaziland and Zambia are
however the only exception where the FDI parameter was stationary at the log level, thus
integrated of order zero I (0). The first differencing of the rest of the parameters, (N/B
T he first difference of the log of real GDP represents the real Growth rate) attained
stationarity which indicates that the order of integration for the variables is one (I (1)) and
hence are non- stationary.
Our main goal here is to figure out the order of integration of each variable and how many
times a variable has to be differenced for the series to attain stationarity. The outcomes in
(table 1) of the appendix shows that all the variables are integrated of order one16. This
means that a shock to whichever of the non-stationary variables would have a permanent
impact . The variables hence, illustrate the lack of mean reverting process. The order of
integration is very essential here since most time series parameters are non – Stationary and
using them in a regression can lead to spurious regressions even if the regressors’ are
exogenous (Granger, 1969).

28
4.2.2: Cointegration and Granger Causality test Results
The outcomes support the application of the Johansen Cointegration technique, which
shows long run equilibrium relationship between two or more non-stationary series.
Because the variables are non-stationary, it is therefore possible to be a linear connection
among them in the long run. We perform two cointegration tests for each country. Then, we
run FDI on both real GDP and GDP per capita. Thus, the specifications are [FDI =f (GDP)]
and [FDI=f (PCGDP)].Table 2 in the appendices shows the outcomes of the test statistics for
cointegration in the two models. The test outcomes from table 2 show that the
cointegration test are not uniform across countries. Nine out of thirty-one SSA countries
tested fail to reject the null hypothesis of no cointegration between FDI and GDP/PCGDP,
when tested at the 5% significance level. The trace test only showed cointegration for
Botswana, Nigeria, Lesotho and Seychelles .For Botswana, only the trace test showed
cointegration between the two specifications of parameter, while the maximum Eigen value
test failed to reject the null of no cointegration for both specifications. Nigeria and Lesotho
also showed equilibrium link between FDI and GDP per capita indicated by the trace test
.Seychelles is the last country to indicate the trace test only for cointegration . The only
change with Seychelles is that there was equilibrium link between both specifications but
the trace test showed cointegration between FDI and GDP. The remaining countries in the
sample show strong long run link between FDI and GDP, GDPPC for both the trace and the
maximum Eigen value test outcomes at the 5% significance level. The existence of a
cointegration link among FDI and the other parameter suggest there must be Granger
causality in at least one direction. The bivariate Granger causality test was done as a result
to find out the direction of causality and possible feedback among the parameters. The
outcomes of the Granger causality tests are reported in Table 3, in the appendices, which
shows that GDP (PCGDP) and FDI are independent for each other for eleven countries. They
29
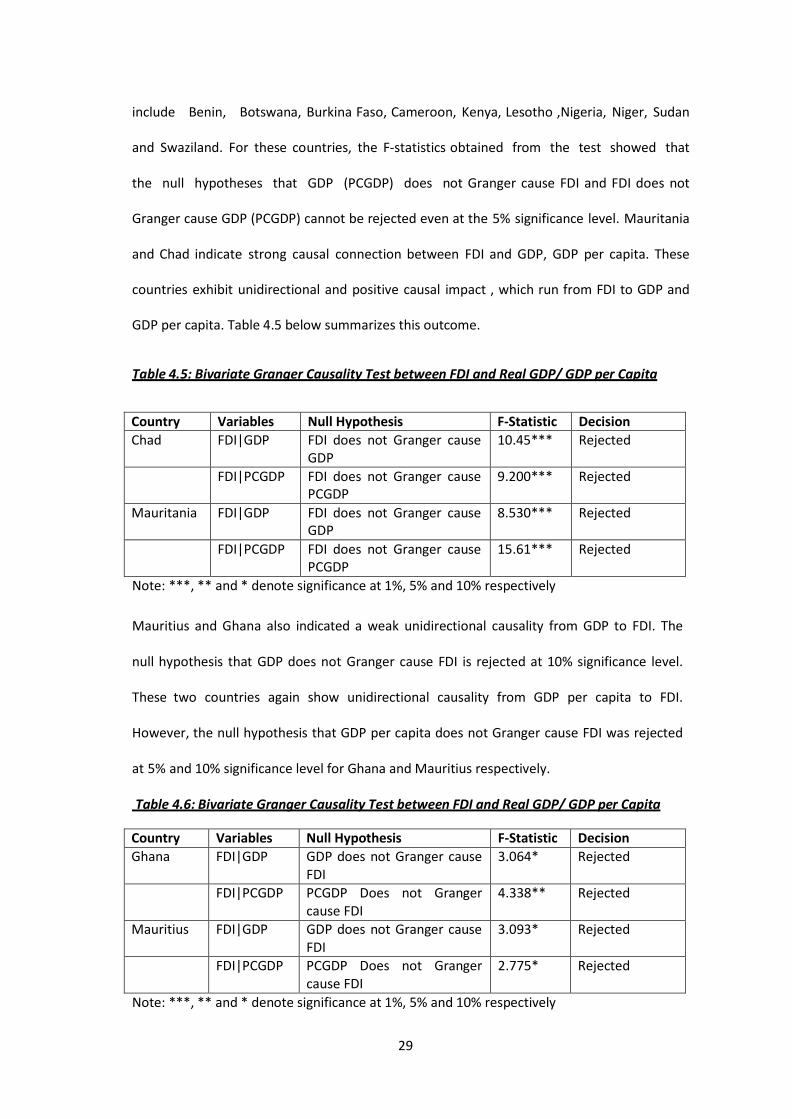
include Benin, Botswana, Burkina Faso, Cameroon, Kenya, Lesotho ,Nigeria, Niger, Sudan
and Swaziland. For these countries, the F-statistics obtained from the test showed that
the null hypotheses that GDP (PCGDP) does not Granger cause FDI and FDI does not
Granger cause GDP (PCGDP) cannot be rejected even at the 5% significance level. Mauritania
and Chad indicate strong causal connection between FDI and GDP, GDP per capita. These
countries exhibit unidirectional and positive causal impact , which run from FDI to GDP and
GDP per capita. Table 4.5 below summarizes this outcome.
Table 4.5: Bivariate Granger Causality Test between FDI and Real GDP/ GDP per Capita
Country Variables Null Hypothesis F-Statistic Decision Chad FDI|GDP FDI does not Granger cause
GDP 10.45*** Rejected
FDI|PCGDP FDI does not Granger cause PCGDP
9.200*** Rejected
Mauritania FDI|GDP FDI does not Granger cause GDP
8.530*** Rejected
FDI|PCGDP FDI does not Granger cause PCGDP
15.61*** Rejected
Note: ***, ** and * denote significance at 1%, 5% and 10% respectively
Mauritius and Ghana also indicated a weak unidirectional causality from GDP to FDI. The
null hypothesis that GDP does not Granger cause FDI is rejected at 10% significance level.
These two countries again show unidirectional causality from GDP per capita to FDI.
However, the null hypothesis that GDP per capita does not Granger cause FDI was rejected
at 5% and 10% significance level for Ghana and Mauritius respectively.
Table 4.6: Bivariate Granger Causality Test between FDI and Real GDP/ GDP per Capita
Country Variables Null Hypothesis F-Statistic Decision Ghana FDI|GDP GDP does not Granger cause
FDI 3.064* Rejected
FDI|PCGDP PCGDP Does not Granger cause FDI
4.338** Rejected
Mauritius FDI|GDP GDP does not Granger cause FDI
3.093* Rejected
FDI|PCGDP PCGDP Does not Granger cause FDI
2.775* Rejected
Note: ***, ** and * denote significance at 1%, 5% and 10% respectively

30
Table 4.6 above summarizes these outcomes. The outcomes of six countries namely
Madagascar, Senegal, Malawi, Mali , South Africa and Zambia confirmed to modern theory
that GDP can cause FDI. The outcomes show unidirectional causal effects from GDP to FDI.
Also, the F- statistics for these countries show that the null hypotheses that GDP does not
Granger cause FDI is rejected at 5% significance level with the exclusion of Senegal, which
indicated a weak relationship and rejected the null at 10% significance level. This means
that, the potential benefit of Foreign Direct Investment (FDI) have not yet been realized in
these countries. Finally, Madagascar also exhibits another unidirectional causal impact
from FDI to GDP per capita. This link is weak and the null hypothesis that FDI does not
Granger cause GDP per capita is rejected at 10 % significance level. This can be briefed in
Table 4.7 below.
Table 4.7: Bivariate Granger Causality Test between FDI and Real GDP/ GDP per Capita
Country Variables Null Hypothesis F-Statistic Decision Madagascar FDI|GDP GDP does not Granger cause
FDI 3.723** Rejected
FDI|PCGDP FDI does not Granger cause PCGDP
3.123* Rejected
Malawi FDI|GDP GDP does not Granger cause FDI
4.417** Rejected
Mali FDI|GDP GDP does not Granger cause FDI
2.619* Rejected
Senegal FDI|GDP GDP does not Granger cause FDI
2.957* Rejected
South Africa FDI|GDP GDP does not Granger cause FDI
4.098** Rejected
Zambia FDI|GDP GDP does not Granger cause FDI
3.449** Rejected
Note: ***, ** and * denote significance at 1%, 5% and 10% respectively

31
Conclusions and Recommendations
The key aim of the study was to find the direction of causality between FDI and economic
growth in terms of GDP and GDP per capita in Sub- Saharan Africa (SSA) during the periods
1980 to 2010. Our empirical results based on the Granger causality test for the group
analysis clearly show that overall, economic growth is a vital and prerequisite condition
for FDI inflows in the Sub Sahara Africa (SSA) countries. On the individual country study,
results were rather controversial . Only two countries from the analysis namely
Mauritania and Chad confirmed to the traditional assumption of FDI –led growth
hypothesis. Hence, Foreign Direct Investment (FDI) has been improving GDP and GDP per
capita growth in Chad and Mauritania. Mauritius, Zambia, South Africa, Senegal,
Madagascar, Malawi, Ghana and Mali confirmed to Growth-driven Foreign Direct
Investment (FDI). Here GDP was also shown as an improvement for FDI inflows. This
outcome implies that economic growth is not only a necessary but also a sufficient
condition to attract FDI inflows. Mauritius and Ghana again showed that per capita
income is essential in attracting Foreign Direct Investment (FDI).
There are significant policy implications from the above results. Studying the direction of
causality relationship between FDI and economic growth is vital for formulating policies
that can help private investors in their investment decisions in developing countries. For
Mauritania and Chad who identified FDI –led growth hypothesis, they ought to pay
important attention to the overall investment climate in their respective countries. As
argued by Asiedu (2006) large local markets, infrastructure , an efficient legal system,
good governance and an efficient tax system all promote FDI. The Government rule
should be geared towards the enhancement of existing institutions and policy
environment. Corruption and political instability in contrast were deterrent to Foreign
Direct Investment (FDI) inflows. Evidence of growth –led FDI hypothesis for the other

32
countries proposes economic growth a condition necessary for FDI. Applying policies
to attract the inflow of FDI depends on the objective of the policy. Foreign Direct
Investment (FDI) inflow can be seen as a bundle of composite goods, which can improve
economic growth, technology transfer, capital accumulation, and the acquisition of
managerial and labour skills in the host country. Hence, economic growth might not be the
main reason for attracting FDI. There are numerous gains of FDI to the host country as
well as positive externalities. In this regard, one may suggest that economic growth
policies, for these countries should not focus entirely on attracting FDI since the causal
effects from FDI to growth is not significant in the investigation. This is not also to say
that policies in attracting FDI inflows should stop. However, depending on the level
of development and country specific features, policies can be applied to attract foreign
investment in the form of MNCs to achieve the necessary spillover effects and profits into
the local market. De Mello (1997) mentioned that the direction of causality between FDI
and economic growth appears to depend largely on the determinants of FDI. As a result,
if the determinants have a strong relationship with economic growth, growth might be
found to cause Foreign Direct Investment (FDI). He continue by explaining that if growth
causes FDI, it implies that the determinants of FDI are existing in the recipient economy
and only after FDI takes place that output grow faster through externalities and
production spillovers which are linked with FDI- related productivity gains. Asiedu (2002)
mentioned in her investigation that implementing rules that encourage FDI to Africa
also have a direct impact on long-term economic growth. As a result, African
countries cannot go wrong implementing such rules. As De Mello mentioned above, SSA
in encouraging economic growth will also be attracting FDI inflows indirectly since
determinants of FDI have a strong relationship with economic growth.

33
REFERENCES
Asiedu E., (2003) ‘Policy Reform and Foreign Direct Investment to Africa: Absolute Progress
but Relative Decline’, (Lawrence KS, Department of Economics, University of Kansas)
Aitken, Brian J. and Harrison, Ann E., (1999), ‘Do Domestic Firms Benefit from Direct Foreign
Investment? Evidence from Venezuela’, The American Economic Review 89, 3, 605-618
Alfaro, L., Chanda A., Kalemli-Ozcan S., and Sayek S., (2004), ‘FDI and Economic Growth: The
Role of Local Financial Markets’, Journal of International Economics, 64, 1, 89-112
Asiedu E., (2002), ‘On the Determinants of Foreign Direct Investment to Developing
Countries: Is Africa Different? ’, World Development, 30, 1, 107-19
Asiedu E., (2006) ‘Foreign Direct Investment in Africa: The Role of Natural Resources,
Market Size, Government Policy, Institutions and Political Instability’, (Lawrence KS,
Department of Economics, University of Kansas)
Africa Economic Outlook, (2011), ‘FDI Destinations in Africa’, available at, www.africaeconomicoutlook.org
Blostrom M., Lipsey R. E. and Zegan M., ‘What explains Developing Country Growth?’ NBER
Working Paper No.4132 (Cambridge MA: National Bureau of Economic Research)
Balasubramanyam, V. N., Salisu M. A. and Sapsford D., (1996) ‘Foreign Direct Investment in
EP and IS Countries’, The Economic Journal, 106, 434, 92-105
Barro, L. J., and Lee, J. –W. (1993), ‘International Comparisons of Educational Attainment’,
Journal of Monetary Economics, 32, 3, 363-394
Borensztein, E., De Gregorio J., and J-W. Lee (1998), ‘How does Foreign Direct Investment
affect Economic Growth? ’, Journal of International Economics, 45, 1,115-135
Brooks C., (2008), ‘Econometrics for Finance’, (Second Edition), Cambridge University Press Basu, P., Chokraborty C., and Reagle D., (2003), ‘Liberalisation, FDI and Growth in
Developing Countries: A Panel Cointegration Approach’, Economic Inquiry, 41, 3, 510-16 Choe, J. I., (2003), ‘Do Foreign Direct Investment and Gross Domestic Investment Promote
Economic Growth? ’, Review of Development Economics, 7, 1, 44-57
Carkovic, M. and Levine R. (2002) ‘Does Foreign Direct Investment Accelerate Economic
Growth? ’, Working Paper, (Minneapolis: University of Minnesota)
Chowdhury, A and Mavrotas, G. (2006 ‘FDI and Growth: What Causes What? ’, The World
Economy, 29, 1, 1-19

34
Dunning, J., (1997) ‘Trade, Location of Economic Activity and the MNE: A search for an
Eclectic Approach,’ The International Allocation of Economic Activity Proceedings of a Nobel
Symposium held in Stockholm, Macmillan, London
De Mello Jnr. Louis R. (1997) ‘Foreign Direct Investment-Led Growth: Evidence form time
series and panel data, Oxford Economic Papers, 51: 133-151
Enders, W., (1995), ‘Applied Econometric Time Series’, (First Edition), John Wiley Sons, Inc,
New York
Gorg, H. and Greenaway D., (2004), ‘Much Ado about Nothing?’ Do Domestic Firms really
benefit from Foreign Direct Investment? ’, World Bank Research Observer, 19, 171-97
Granger C. W. J. (1986) ‘Developments in the study of Cointegrated Economic Variables’,
Oxford Bulletin of Economics and Statistics, 48, 3, 213-228
Granger C. W. J. (1969) ‘Investigating Causal Relationship by Econometric Models and Cross
Spectra Models’, Econometrica, 37, 424-458
Hamilton, J.D., (1994), ‘Time Series Analysis’, Cambridge University Press Hansen, H. And Rand J., (2006), ‘On the Causal Links between FDI and Growth in Developing
Countries’, The World Economy, 29(1),21-41
Hanson, G., Mataloni, R. J. Jnr., and Slaughter, M. J., (2004), ‘Expansion Strategy for U.S.
Multinational Firms’ NBER Working Paper No. 8433
Im, K. S., Pesaran, M. H., and Shin, Y., (2003), ‘Testing for Unit Roots in Heterogeneous
Panels’, Journal of Econometrics, 115, 1-2, 53-74
Johansen, S. (1988), ‘Statistical Analysis of Cointegration Vectors’, Journal of Economic
Dynamics and Control, 12, 2-3, 232-54
Li Xiaoying and Liu Xiaming, (2005), ‘Foreign Direct Investment and Economic Growth: An
Increasingly Endogenous Relationship’, World Development, 33, 3, 393-407
Makki, S. S., and Somwaru, A., (2004), Impact of Foreign Direct Investment and Trade on
Economic Growth: Evidence from Developing Countries’, American Journal of Agricultural
Economics, 86, 3,795-801
Nair- Reichert U. and Weinhold D., (2000), ‘Causality Test for Cross-Country panels: A new
Look at FDI and Economic Growth in Developing Countries’, Oxford Bulletin of Economics
and Statistics, 63, 2, 153-71
Romer, P., (1993), ‘Idea Gaps and Object Gaps in Economic Development’, Journal of
Monetary Economics, 32, 543-573
Sachs, J.D. and Warner, A.M. (1997), ‘Natural Resource Abundance and Economic Growth’,
NBER Working paper, No. 5398, Cambridge, Massachusetts
35
Samad A., (2009) ‘Does FDI cause Economic Growth? Evidence from South- East Asia and
Latin America’, Woodbury Business School, Working Paper 1-09
The Economic Intelligence Unit, (2011), ‘Foreign Direct Investment and the Challenge of
Political Risk’, The Economist, www.eiu.com
United Nations Centre for Trade and Development, (UNCTAD, 2011) World Investment
Report, Non-Equity Modes of International Production and Development’, New York and
Geneva, United Nations
United Nations Centre for Trade and Development, (UNCTAD, 2009), ‘FDI flows and stocks’,
Volume 1, New York and Geneva, United Nations
Westerland J., (2007), ‘Testing for Error Correction in Panel Data’, Oxford Bulletin of
Economics and Statistics, 69, 709-748 World Bank Development Indicators, (2011), GDP, PPP, (constant 2005 international $) on
CD-ROM
World Bank Development Indicators, (2011), FDI net inflow, (percentage of GDP) on CD-
ROM
World Bank Development Indicators, (2011), GDP per capita, PPP, (constant 2005
international $) on CD-ROM
Yi W. J. and Chih-Chiang H., ‘Does Foreign Direct Investment Promote Economic Growth?
Evidence from a Threshold Regression Analysis’, (2008), Economic Bulletin, 15, 12, 1-10
Zhang, K. H. (1999b), ‘How does FDI interact with Economic Growth in a Large Developing
Country? ’, The case of China’, Economic System, 21(4), 219 - 304 Zhang, K. H. (1999a), ‘Foreign Direct Investment and Economic Growth: Evidence from ten
East Asian Economies’, Economica Internazionale, 51(4), 517 – 35
36
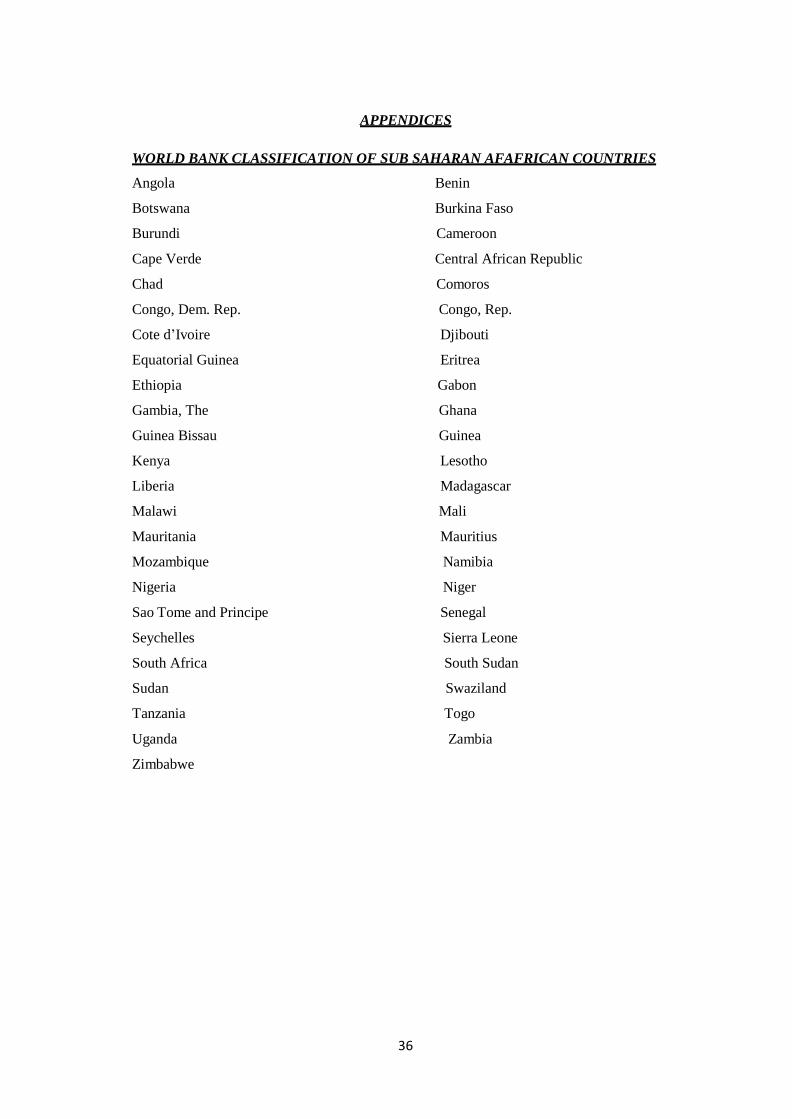
APPENDICES
WORLD BANK CLASSIFICATION OF SUB SAHARAN AFAFRICAN COUNTRIES
Angola Benin
Botswana Burkina Faso
Burundi Cameroon
Cape Verde Central African Republic
Chad Comoros
Congo, Dem. Rep. Congo, Rep.
Cote d’Ivoire Djibouti
Equatorial Guinea Eritrea
Ethiopia Gabon
Gambia, The Ghana
Guinea Bissau Guinea
Kenya Lesotho
Liberia Madagascar
Malawi Mali
Mauritania Mauritius
Mozambique Namibia
Nigeria Niger
Sao Tome and Principe Senegal
Seychelles Sierra Leone
South Africa South Sudan
Sudan Swaziland
Tanzania Togo
Uganda Zambia
Zimbabwe

37
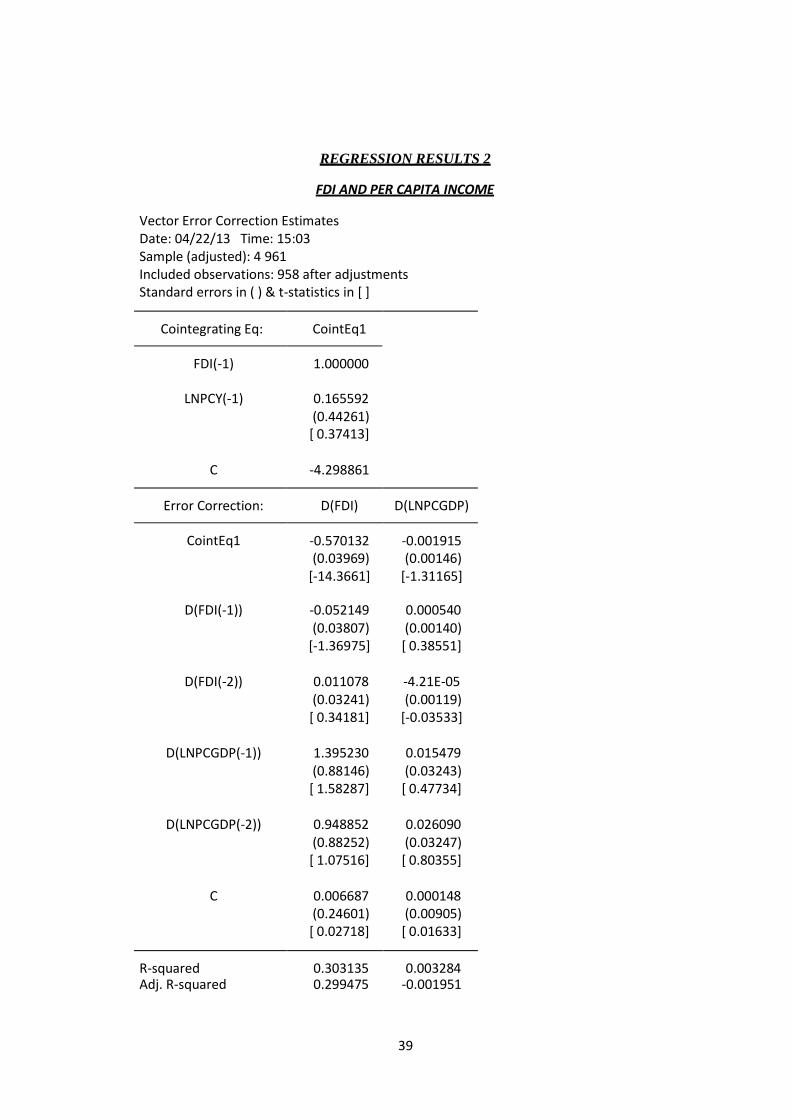
REGRESSION RESULTS 1
FDI versus log of GDP
Vector Error Correction Estimates Date: 04/22/13 Time: 14:48 Sample (adjusted): 4 961 Included observations: 958 after adjustments Standard errors in ( ) & t-statistics in [ ]
Cointegrating Eq: CointEq1
FDI(-1) 1.000000
LNGDP(-1) 1.190109
(0.32733) [ 3.63576]
C -30.41227
Error Correction: D(FDI) D(LNGDP)
CointEq1 -0.598667 -0.001191
(0.04031) (0.00194) [-14.8513] [-0.61453]
D(FDI(-1)) -0.031346 0.000318
(0.03812) (0.00183) [-0.82232] [ 0.17330]
D(FDI(-2)) 0.024084 0.000261
(0.03232) (0.00155) [ 0.74527] [ 0.16763]
D(LNGDP(-1)) 1.028495 0.000726
(0.67444) (0.03244) [ 1.52497] [ 0.02237]
D(LNGDP(-2)) 1.110914 0.004985
(0.67489) (0.03246) [ 1.64607] [ 0.15357]
C 0.003750 0.001419
(0.24478) (0.01177) [ 0.01532] [ 0.12049]
R-squared 0.310085 0.000512 Adj. R-squared 0.306462 -0.004738 Sum sq. Resids 54643.23 126.4096 S.E. equation 7.576170 0.364394 F-statistic 85.57621 0.097494

38
Log likelihood -3296.291 -389.2145 Akaike AIC 6.894136 0.825083 Schwarz SC 6.924605 0.855551 Mean dependent 0.006714 0.001430 S.D. dependent 9.097343 0.363534
Determinant resid covariance (dof adj.) 7.619254 Determinant resid covariance 7.524113 Log likelihood -3685.362 Akaike information criterion 7.723095 Schwarz criterion 7.794188
39
REGRESSION RESULTS 2
FDI AND PER CAPITA INCOME
Vector Error Correction Estimates Date: 04/22/13 Time: 15:03 Sample (adjusted): 4 961 Included observations: 958 after adjustments Standard errors in ( ) & t-statistics in [ ]
Cointegrating Eq:
CointEq1
FDI(-1)
1.000000
LNPCY(-1)
0.165592
(0.44261) [ 0.37413]
C
-4.298861
Error Correction:
D(FDI)
D(LNPCGDP)
CointEq1
-0.570132 (0.03969)
[-14.3661]
-0.001915 (0.00146)
[-1.31165]
D(FDI(-1))
-0.052149
0.000540
(0.03807) [-1.36975]
(0.00140) [ 0.38551]
D(FDI(-2))
0.011078
-4.21E-05
(0.03241) [ 0.34181]
(0.00119) [-0.03533]
D(LNPCGDP(-1))
1.395230
0.015479
(0.88146) [ 1.58287]
(0.03243) [ 0.47734]
D(LNPCGDP(-2))
0.948852
0.026090
(0.88252) [ 1.07516]
(0.03247) [ 0.80355]
C
0.006687
0.000148
(0.24601) [ 0.02718]
(0.00905) [ 0.01633]
R-squared
0.303135
0.003284 Adj. R-squared 0.299475 -0.001951

40
Sum sq. Resids 55193.74 74.70449 S.E. equation 7.614238 0.280127 F-statistic 82.82359 0.627304 Log likelihood -3301.093 -137.2668 Akaike AIC 6.904160 0.299096 Schwarz SC 6.934629 0.329564 Mean dependent 0.006714 0.000155 S.D. dependent 9.097343 0.279854
Determinant resid covariance (dof adj.) 4.540568 Determinant resid covariance 4.483871 Log likelihood -3437.419 Akaike information criterion 7.205468 Schwarz criterion 7.276562

41
Table 1: RESULTS OF THE PHILLIP PERON (PP) UNIT ROOT TEST
Country FDI FLOWS Real GDP (PPP) Per Capita GDP (PPP)
Name Constant Constant& trend
Constant Constant& trend
Constant Constant and Trend
BENIN Levels -2.992 -3.078 0.576 -1.642 -0.527 -1.613 1
st difference -7.548*** -7.488*** -5.377*** -5.817*** -5.485*** -5.876***
BOTSWANA Levels -3.340 -3.350 -3.620 -0.990 -2.475 -1.449 1
st difference -8.670*** -11.34*** -10.62*** -9.965*** -10.51*** -9.776***
BURK. FASO Levels -3.278 -4.009 1.402 -1.510 0.615 -1.679 1
st difference -19.46*** -18.29*** -5.847*** -6.227*** -5.953*** -6.198***
CAMEROON Levels -5.253*** -5.179*** -1.559 -2.089 -1.512 -1.867 1
st difference -18.90*** -21.61*** -5.766*** -5.671*** -5.712*** -5.617***
C.A.R Levels -1.512 -2.559 -0.522 -2.615 -1.693 -2.192 1
st difference -9.021*** -13.87*** -6.326*** -6.219*** -6.368*** -6.485***
CHAD Levels -1.841 -1.906 -0.358 -1.905 -1.092 -1.926 1
st difference -10.62*** -10.34*** -4.875*** -4.779*** -4.930*** -4.834***
D.R.CONGO Levels -0.530 -3.519 -1.261 -0.776 -1.169 -0.760 1
st difference -10.52*** -21.38*** -5.061*** -5.030*** -4.964*** -4.923***
R. CONGO Levels -2.126 -4.104 -1.480 -2.956 -2.315 -2.777 1
st difference -14.49*** -24.84*** -7.318*** -8.114*** -7.306*** -8.077***
C. D’IVOIRE Levels -1.999 -2.727 -0.167 -2.015 -3.094 -1.660 1
st difference -7.008*** -6.880*** -5.349*** -5.190*** -5.387*** -5.227***
GABON Levels -2.833 -2.779 -0.544 -2.790 -1.780 -2.612 1
st difference -12.28*** -13.99*** -8.679*** -8.121*** -7.682*** -10.04***
GHANA Levels 0.835 -1.250 2.651 -4.318*** 1.197 -4.288 1
st difference -4.504*** -4.838*** -6.501*** -6.789*** -6.563*** -6.876***
KENYA Levels -6.812*** -7.233*** 0.184 -1.715 -1.285 -1.360 1
st difference -31.18*** -30.49*** -6.053*** -5.908*** -6.379*** -6.216***
LESOTHO Levels -2.080 -2.031 1.015 -3.463 2.079 -5.770*** 1
st difference -4.361*** -4.304*** -9.588*** -9.455*** -7.012*** -9.442***
LIBERIA Levels -5.043*** -5.934*** -1.678 -1.347 -1.664 -1.422 1
st difference -19.27*** -19.10*** -7.048*** -6.916*** -7.348*** -7.255***
MADAGASCAR Levels -0.384 -1.520 0.870 -3.374 -3.287 -3.310 1
st difference -3.841*** -3.833** -6.657*** -10.76*** -6.870*** -10.34***
Note: ***, **, denote significance at 1% and 5% respectively

42
Table 1 cont.: RESULTS OF THE PHILLIP PERON (PP) UNIT ROOT TEST
Country Name FDI FLOWS Real GDP (PPP) Per Capita GDP (PPP)
Constant Constant& trend
Constant Constant& trend
Constant Constant and Trend
MALAWI Levels -3.409 -6.173*** 3.186 -2.374 -0.810 -1.890 1
st difference -15.30*** -15.18*** -7.312*** -7.819*** -6.725*** -7.217***
MALI Levels -3.417 -4.368*** 2.021 -3.238 0.114 -3.576 1
st difference -16.65*** -16.11*** -6.155*** -7.865*** -6.709*** -7.807***
MAURITANIA Levels -3.033 -3.404 1.582 -2.483 -2.173 -2.489 1
st difference -7.172*** -7.027*** -7.162*** -10.76*** -7.174*** -11.11***
MAURITIUS Levels -3.392 -4.489*** -2.083 -0.839 -1.529 -1.179 1
st difference -9.897*** -10.22*** -4.491*** -4.946*** -4.477*** -4.636***
MOZAMBIQUE Levels -1.214 -3.074 1.499 -4.729*** 0.521 -3.055 1
st difference -7.593*** -7.766*** -8.201*** -8.912*** -7.521*** -7.596***
NIGERIA Levels -3.921*** -4.061 1.688 -3.412 -0.142 -3.523 1
st difference -14.66*** -18.39*** -5.161*** -5.484*** -5.230*** -5.575***
NIGER Levels 2.679 1.604 1.408 -1.543 -3.793*** -1.659 1
st difference -4.298*** -4.989*** -5.111*** -7.362*** -5.311*** -7.418***
RWANDA Levels -2.236 -2.005 -0.456 -1.419 -1.920 -2.140 1
st difference
2nd
-2.931
-7.787*** -1.190
-7.811*** -5.674*** -5.921*** -7.333*** -16.47***
SENEGAL Levels -3.979*** -5.413*** 1.229 -1.214 -0.407 -1.063 1
st difference -12.90*** -12.81*** -6.304*** -6.893*** -5.983*** -6.644***
SEYCHELLES Levels 2.562 1.136 -0.160 -2.358 -0.259 -2.411 1
st difference -4.945*** -5.985*** -4.629*** -6.366*** -4.748*** -6.380***
S. LEONE Levels -4.930*** -6.751*** -0.553 -0.740 -1.464 -0.733 1
st difference -23.51*** -24.26*** -4.064*** -4.298** -4.717*** -5.047***
S. AFRICA Levels -4.325*** -5.922*** 1.452 -0.980 -0.697 -0.572 1
st difference -16.92*** -16.50*** -4.079*** -5.268*** -3.470** -5.142***
SUDAN Levels -3.670 -2.017 3.546 -1.124 2.442 -1.447 1
st difference -5.326*** -5.225*** -4.806*** -7.600*** -4.649*** -7.392***
SWAZILAND Levels -4.398*** -4.526*** -2.941 -1.008 -1.992 -1.726 1
st difference -14.11*** -13.64*** -4.298*** -4.669*** -5.275*** -5.281***
TOGO Levels -3.127** -3.800** 0.024 -2.921 -3.356** -2.960 1
st difference -13.31*** -12.90*** -4.734*** -4.723*** -4.757*** -4.853***
ZAMBIA Levels -3.426** -13.25*** 3.827 0.962 -1.603 1.181 1
st difference -21.06*** -19.27*** -4.203*** -5.913*** -3.937*** -6.016***
Note: ***, **, denote significance at 1% and 5% respectively

43
Table 2: THE JOHANSEN COINTEGATION TEST ON EVIEWS
A Bivariate Johansen Cointegration Test: FDI versus real GDP /Real GDP per Capita (GDPPC) Country Pair of
variables Trace Test Max. Eigen Value Test Cointegrated Test Statistic
5% Critical Value
Test Statistic
5% Critical Value
YES/NO
Benin FDI | GDP 22.41 12.32 15.09 11.22 YES(2) FDI | GDPPC 8.852 12.32 7.605 11.22 NO
Botswana FDI | GDP 13.19 12.32 8.100 11.22 YES(1)* FDI | GDPPC 13.59 12.32 9.012 11.22 YES(2)*
Burk. Faso FDI | GDP 23.81 12.32 19.35 11.22 YES(2) FDI | GDPPC 14.25 12.32 9.716 11.22 YES(2)
Cameroon FDI | GDP 13.36 12.32 12.90 11.22 YES(1) FDI | GDPPC 13.80 12.32 13.01 11.22 YES(1)
C.A.R FDI | GDP 5.381 12.32 4.233 11.22 NO FDI | GDPPC 5.027 12.32 5.012 11.22 NO
Chad FDI | GDP 32.71 12.32 25.95 11.22 YES(2) FDI | GDPPC 25.36 12.32 23.12 11.22 YES(1)
D. R. Congo FDI | GDP 2.133 12.32 1.771 11.22 NO FDI | GDPPC 2.889 12.32 2.814 11.22 NO
R. Congo FDI | GDP 6.543 12.32 5.100 11.22 NO FDI | GDPPC 3.898 12.32 3.462 11.22 NO
C. Divoire FDI | GDP 6.771 12.32 4.990 11.22 NO FDI | GDPPC 9.992 12.32 9.189 11.22 NO
Gabon FDI | GDP 8.093 12.32 5.228 11.22 NO FDI | GDPPC 5.748 12.32 4.866 11.22 NO
Ghana FDI | GDP 30.57 25.87 25.63 19.38 YES(1) FDI | GDPPC 27.60 25.87 22.44 19.38 YES(1)
Kenya FDI | GDP 27.07 12.32 20.73 11.22 YES(2) FDI | GDPPC 20.50 12.32 20.28 11.22 YES(1)
Lesotho FDI | GDP 22.34 12.32 16.87 11.22 YES(2) FDI | GDPPC 13.38 12.32 7.994 11.22 YES(1)*
Liberia FDI | GDP 14.02 12.32 13.90 11.22 YES(1) FDI | GDPPC 14.15 12.32 13.37 11.22 YES(1)
Madagascar FDI | GDP 14.82 12.32 9.364 11.22 YES(2) FDI | GDPPC 14.03 12.32 9.310 11.22 YES(2)
Malawi FDI | GDP 24.76 12.32 18.69 11.22 YES(2) FDI | GDPPC 10.10 12.32 9.154 11.22 NO
Mali FDI | GDP 23.62 12.32 18.02 11.22 YES(2) FDI | GDPPC 11.35 12.32 9.491 11.22 NO
Mauritania FDI | GDP 26.77 12.32 20.77 11.22 YES(2) FDI | GDPPC 13.56 12.32 13.56 11.22 YES(1)
Mauritius FDI | GDP 19.05 12.32 17.61 11.22 YES(1) FDI | GDPPC 17.26 12.32 15.63 11.22 YES(1)
Mzambique FDI | GDP 9.306 12.32 7.234 11.22 NO
FDI | GDPPC 6.643 12.32 4.998 11.22 NO Nigeria FDI | GDP 20.10 12.32 11.22 11.22 YES(2)
FDI | GDPPC 12.48 12.32 9.109 11.22 YES(1)*

44
Table 2 cont. JOHANSEN COINTEGATION TEST ON EVIEWS
A Bivariate Johansen Cointegration Test: FDI versus real GDP /Real GDP per Capita (GDPPC) Country Pair of
variables Trace Test Max. Eigen Value Test Cointegrated Test Statistic
5% Critical Value
Test Statistic
5% Critical Value
YES/NO
Niger FDI | GDP 11.31 12.32 8.792 11.22 NO FDI | GDPPC 13.45 12.32 12.18 11.22 YES(1)
Rwanda FDI | GDP 8.772 12.32 7.561 11.22 NO FDI | GDPPC 7.398 12.32 7.284 11.22 NO
Senegal FDI | GDP 25.17 12.32 21.14 11.22 YES(1) FDI | GDPPC 8.028 12.32 7.387 11.22 NO
Seychelles FDI | GDP 15.07 12.32 10.03 11.22 YES (2)* FDI | GDPPC 13.80 12.32 11.50 11.22 YES(1)
Sierra Leone FDI | GDP 11.14 12.32 10.52 11.22 NO FDI | GDPPC 11.01 12.32 10.99 11.22 NO
South Africa FDI | GDP 19.34 12.32 15.05 11.22 YES(2) FDI | GDPPC 13.69 12.32 13.64 11.22 YES(1)
Sudan FDI | GDP 14.61 12.32 13.00 11.22 YES(1) FDI | GDPPC 8.127 12.32 6.394 11.22 NO
Swaziland FDI | GDP 16.23 12.32 11.70 11.22 YES(2) FDI | GDPPC 16.12 12.32 12.59 11.22 YES(1)
Togo FDI | GDP 8.634 12.32 5.529 11.22 NO FDI | GDPPC 5.562 12.32 5.300 11.22 NO
Zambia FDI | GDP 20.38 12.32 16.97 11.22 YES(1) FDI | GDPPC 17.83 12.32 17.83 11.22 YES(1)
Note: YES* imply only Trace test indicate cointegration

45
Table 3. BIVARIATE GRANGER CAUSALITY TEST BETWEEN FDI AND REAL GDP/ PER CAPITA
Bivariate Granger Causality Test between FDI and Real GDP/Real GDP per Capita
Country Variables Null Hypothesis F-Statistic Decision Benin FDI|GDP GDP does not Granger cause
FDI 0.137 Accepted
FDI does not Granger cause GDP
0.408 Accepted
Botswana FDI|GDP GDP does not Granger cause FDI
0.443 Accepted
FDI does not Granger cause GDP
0.427 Accepted
FDI|PCGDP PCGDP Does not Granger cause FDI
0.418 Accepted
FDI does not Granger cause PCGDP
0.527 Accepted
Burk. Faso FDI|GDP GDP does not Granger cause FDI
2.052 Accepted
FDI does not Granger cause GDP
0.054 Accepted
FDI|PCGDP PCGDP Does not Granger cause FDI
2.335 Accepted
FDI does not Granger cause PCGDP
0.005 Accepted
Cameroon FDI|GDP GDP does not Granger cause FDI
1.951 Accepted
FDI does not Granger cause GDP
1.264 Accepted
FDI|PCGDP PCGDP Does not Granger cause FDI
2.291 Accepted
FDI does not Granger cause PCGDP
1.659 Accepted
Chad FDI|GDP GDP does not Granger cause FDI
0.387 Accepted
FDI does not Granger cause GDP
10.45*** Rejected
FDI|PCGDP PCGDP Does not Granger cause FDI
0.053 Accepted
FDI does not Granger cause PCGDP
9.200*** Rejected
Note: ***, ** and * denote significance at 1%, 5% and 10% respectively

46
Table 3. BIVARIATE GRANGER CAUSALITY TEST BETWEEN FDI AND REAL GDP/ PER CAPITA
Bivariate Granger Causality Test between FDI and Real GDP/Real GDP per Capita
Country Variables Null Hypothesis F-Statistic Decision Ghana FDI|GDP GDP does not Granger cause
FDI 3.064* Rejected
FDI does not Granger cause GDP
0.096 Accepted
FDI|PCGDP PCGDP Does not Granger cause FDI
4.338** Rejected
FDI does not Granger cause PCGDP
0.357 Accepted
Kenya FDI|GDP GDP does not Granger cause FDI
0.868 Accepted
FDI does not Granger cause GDP
0.634 Accepted
FDI|PCGDP PCGDP Does not Granger cause FDI
0.883 Accepted
FDI does not Granger cause PCGDP
0.147 Accepted
Lesotho FDI|GDP GDP does not Granger cause FDI
0.161 Accepted
FDI does not Granger cause GDP
0.043 Accepted
FDI|PCGDP PCGDP Does not Granger cause FDI
0.138 Accepted
FDI does not Granger cause PCGDP
0.024 Accepted
Liberia FDI|GDP GDP does not Granger cause FDI
1.295 Accepted
FDI does not Granger cause GDP
1.011 Accepted
FDI|PCGDP PCGDP Does not Granger cause FDI
1.186 Accepted
FDI does not Granger cause PCGDP
1.131 Accepted
Madagascar FDI|GDP GDP does not Granger cause FDI
3.723** Rejected
FDI does not Granger cause GDP
2.383 Accepted
FDI|PCGDP PCGDP Does not Granger cause FDI
1.808 Accepted
FDI does not Granger cause PCGDP
3.123* Rejected
Note: ***, ** and * denote significance at 1%, 5% and 10% respectively

47
Table 3. BIVARIATE GRANGER CAUSALITY TEST BETWEEN FDI AND REAL GDP/ PER CAPITA
Bivariate Granger Causality Test between FDI and Real GDP/Real GDP per Capita
Country Variables Null Hypothesis F-Statistic Decision Malawi FDI|GDP GDP does not Granger cause
FDI 4.417** Rejected
FDI does not Granger cause GDP
1.132 Accepted
FDI|PCGDP PCGDP Does not Granger cause FDI
1.187 Accepted
FDI does not Granger cause PCGDP
2.239 Accepted
Mali FDI|GDP GDP does not Granger cause FDI
2.619* Rejected
FDI does not Granger cause GDP
0.321 Accepted
Mauritania FDI|GDP GDP does not Granger cause FDI
1.230 Accepted
FDI does not Granger cause GDP
8.530*** Rejected
FDI|PCGDP PCGDP Does not Granger cause FDI
0.206 Accepted
FDI does not Granger cause PCGDP
15.61*** Rejected
Mauritius FDI|GDP GDP does not Granger cause FDI
3.093* Rejected
FDI does not Granger cause GDP
0.599 Accepted
FDI|PCGDP PCGDP Does not Granger cause FDI
2.775* Rejected
FDI does not Granger cause PCGDP
0.463 Accepted
Nigeria FDI|GDP GDP does not Granger cause FDI
0.850 Accepted
FDI does not Granger cause GDP
0.147 Accepted
FDI|PCGDP PCGDP Does not Granger cause FDI
0.879 Accepted
FDI does not Granger cause PCGDP
0.213 Accepted
Niger FDI|PCGDP PCGDP Does not Granger cause FDI
2.456
FDI does not Granger cause PCGDP
0.178
Note: ***, ** and * denote significance at 1%, 5% and 10% respectively

48
Table 3. BIVARIATE GRANGER CAUSALITY TEST BETWEEN FDI AND REAL GDP/ PER CAPITA
Bivariate Granger Causality Test between FDI and Real GDP/Real GDP per Capita
Country Variables Null Hypothesis F-Statistic Decision Senegal FDI|GDP GDP does not Granger cause
FDI 2.957* Rejected
FDI does not Granger cause GDP
0.681 Accepted
Seychelles FDI|GDP GDP does not Granger cause FDI
1.009 Accepted
FDI does not Granger cause GDP
0.164 Accepted
FDI|PCGDP PCGDP Does not Granger cause FDI
0.820 Accepted
FDI does not Granger cause PCGDP
0.524 Accepted
South Africa
FDI|GDP GDP does not Granger cause FDI
4.098** Rejected
FDI does not Granger cause GDP
0.209 Accepted
FDI|PCGDP PCGDP Does not Granger cause FDI
2.080 Accepted
FDI does not Granger cause PCGDP
0.796 Accepted
Sudan FDI|GDP GDP does not Granger cause FDI
1.315 Accepted
FDI does not Granger cause GDP
0.241 Accepted
Swaziland FDI|GDP GDP does not Granger cause FDI
0.039 Accepted
FDI does not Granger cause GDP
1.367 Accepted
FDI|PCGDP PCGDP Does not Granger cause FDI
0.338 Accepted
FDI does not Granger cause PCGDP
1.694 Accepted
Zambia FDI|GDP GDP does not Granger cause FDI
3.449** Rejected
FDI does not Granger cause GDP
0.494 Accepted
FDI|PCGDP PCGDP Does not Granger cause FDI
2.345 Accepted
FDI does not Granger cause PCGDP
0.441 Accepted
Note: ***, ** and * denote significance at 1%, 5% and 10% respectively

49
FIGURE 1: PLOT OF VARIABLES IN LEVELS AND FIRST DIFFERENCES (BENIN)
FDI
.07
.06
.05
.04
.03
.02
.01
.00
-.01 80 82 84 86 88 90 92 94 96 98 00 02 04 06 08 10
Fig 1a. Year
DFDI
.06
.04
.02
.00
-.02
-.04
-.06
80 82 84 86 88 90 92 94 96 98 00 02 04 06 08 10
Fig 1ai. Year

50
LGDP
23.4
23.2
23.0
22.8
22.6
22.4
22.2
22.0
80 82 84 86 88 90 92 94 96 98 00 02 04 06 08 10
Fig 1b. Year
DLGDP
.10
.08
.06
.04
.02
.00
-.02
-.04
-.06
80 82 84 86 88 90 92 94 96 98 00 02 04 06 08 10
Fig 1bi. Year

51
LGDPPPP
7.30
7.25
7.20
7.15
7.10
7.05
7.00
80 82 84 86 88 90 92 94 96 98 00 02 04 06 08 10
Fig 1c. Year
DLGDPPPP
.08
.06
.04
.02
.00
-.02
-.04
-.06
-.08 80 82 84 86 88 90 92 94 96 98 00 02 04 06 08 10
Fig 1ci. Year

52
FIGURE 2: PLOT OF VARIABLES IN LEVELS AND FIRST DIFFERENCES (ZAMBIA)
FDI
.12
.10
.08
.06
.04
.02
.00
-.02
80 82 84 86 88 90 92 94 96 98 00 02 04 06 08 10
Fig 2a. Year
DFDI
.100
.075
.050
.025
.000
-.025
-.050
-.075
-.100
80 82 84 86 88 90 92 94 96 98 00 02 04 06 08 10
Fig 2ai. Year

53
LGDP
23.7
23.6
23.5
23.4
23.3
23.2
23.1
23.0
22.9
22.8 80 82 84 86 88 90 92 94 96 98 00 02 04 06 08 10
Fig 2b. Year
DLGDP
.08
.04
.00
-.04
-.08
-.12 80 82 84 86 88 90 92 94 96 98 00 02 04 06 08 10
Fig 2bi. Year

54
LGDP_PPP
7.4
7.3
7.2
7.1
7.0
6.9
80 82 84 86 88 90 92 94 96 98 00 02 04 06 08 10
Fig 2c. Year
DLGDP_PPP
.08
.04
.00
-.04
-.08
-.12 80 82 84 86 88 90 92 94 96 98 00 02 04 06 08 10
Fig2ci. Year


