
EMPLOYEE WORKSPACE PROJECT
All Hands Presentation Workspace That Supports The Way We Work
September 2017

2 Employee Workspace Project: All Hands Presentation
1 CONTEXTWhat Is the Employee Workspace Project and Why Is It Important?
3 STRATEGYWhat Are We Doing With This Information?
4 NEXT STEPSWhat is coming next?
2 ASSESSMENTWhat Are We Studying?

1 CONTEXTWhat Is The Employee Workspace Project and Why Is It Important?

4 Employee Workspace Project: All Hands Presentation
EMPLOYEE WORKSPACE PROJECT: PROJECT TEAM
++
5 Employee Workspace Project: All Hands Presentation
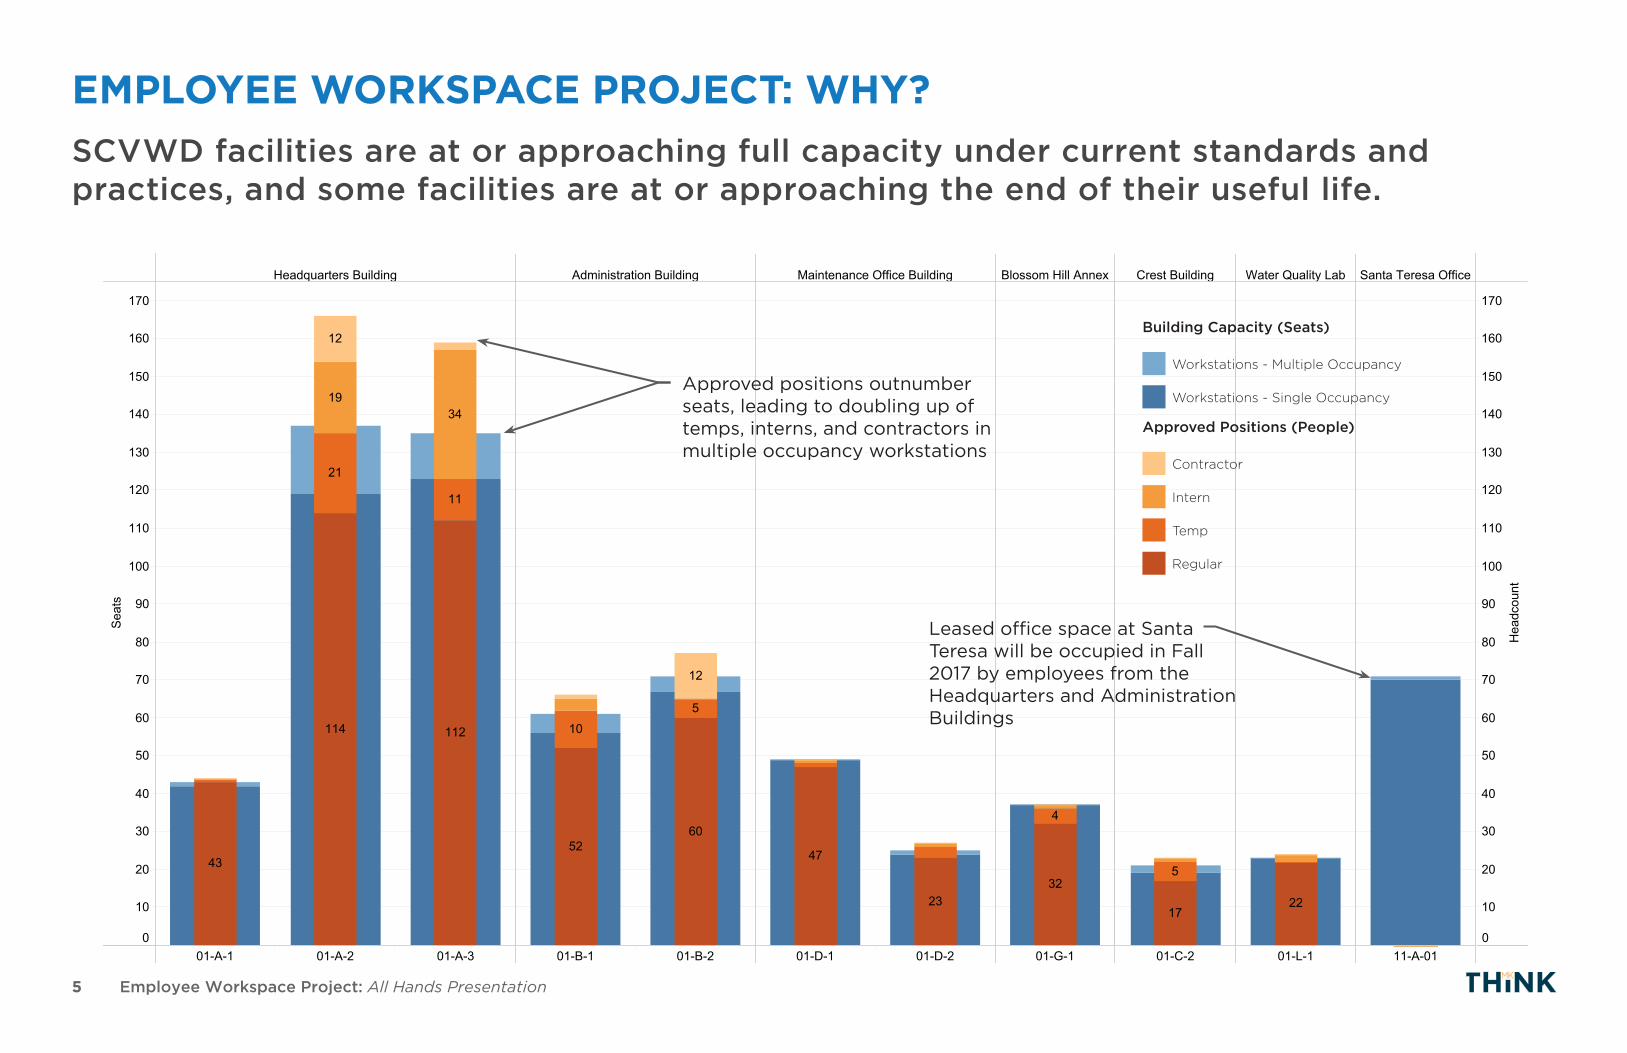
EMPLOYEE WORKSPACE PROJECT: WHY?SCVWD facilities are at or approaching full capacity under current standards and practices, and some facilities are at or approaching the end of their useful life.
Headquarters Building Administration Building Maintenance Office Building Blossom Hill Annex Crest Building Water Quality Lab Santa Teresa Office
01-A-1 01-A-2 01-A-3 01-B-1 01-B-2 01-D-1 01-D-2 01-G-1 01-C-2 01-L-1 11-A-010
10
20
30
40
50
60
70
80
90
100
110
120
130
140
150
160
170
Seat
s
0
10
20
30
40
50
60
70
80
90
100
110
120
130
140
150
160
170
Hea
dcou
nt
114 112
12
1934
21
11
43
12
10
5260
5
47
2332
4
17
5
22
Facility Capacity Versus Approved Positions (2017)
Building Capacity (Seats)
Approved Positions (People)
Workstations - Multiple Occupancy
Workstations - Single Occupancy
Contractor
Intern
Temp
Regular
Approved positions outnumber seats, leading to doubling up of temps, interns, and contractors in multiple occupancy workstations
Leased office space at Santa Teresa will be occupied in Fall 2017 by employees from the Headquarters and Administration Buildings

6 Employee Workspace Project: All Hands Presentation
Headquarters Administration Maintenance Office Building Blossom Hill Annex Crest Water Quality Lab Santa Teresa Office
2015
2020
2025
2030
Year
2015
2020
2025
2030
Year
2015
2020
2025
2030
Year
2015
2020
2025
2030
Year
2015
2020
2025
2030
Year
2015
2020
2025
2030
Year
2015
2020
2025
2030
Year
0
20
40
60
80
100
120
140
160
180
200
220
240
260
280
300
320
340
Cap
acity
0
20
40
60
80
100
120
140
160
180
200
220
240
260
280
300
320
340
Seat
Dem
and
(0%
)
203
-6 5
-1
1
0 0
-4-4 -2 -2
71 24
Capacity and Seat Deamand Projections - 0% Growth, 2017 - 2030
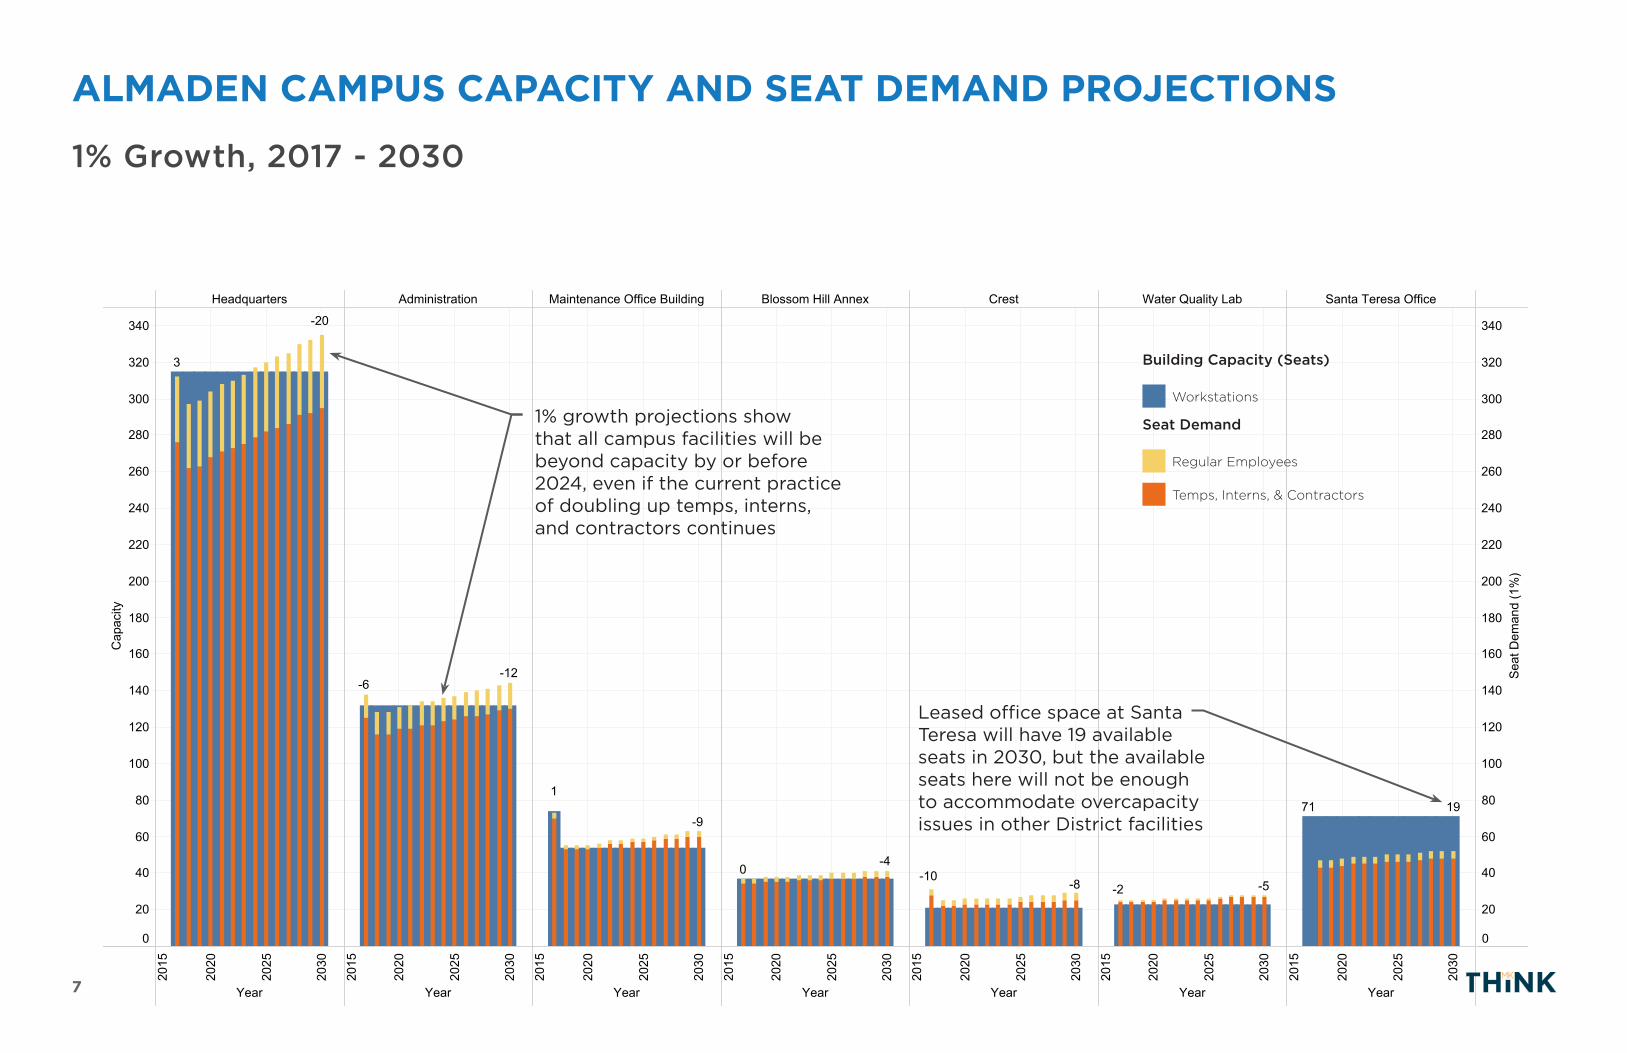
ALMADEN CAMPUS CAPACITY AND SEAT DEMAND PROJECTIONS
Building Capacity (Seats)
Seat Demand
Workstations
Regular Employees
Employees from Headquarters and Administration buildings will be moving to Santa Teresa Office Space in Fall 2017
Most office buildings on Almaden Campus are already at or beyond capacity
Temps, Interns, & Contractors
0% Growth, 2017 - 2030
7 Employee Workspace Project: All Hands Presentation
Headquarters AdministrationMaintenance Office
Building Blossom Hill Annex Crest Water Quality Lab Santa Teresa Office
2015
2020
2025
2030
Year
2015
2020
2025
2030
Year
2015
2020
2025
2030
Year
2015
2020
2025
2030
Year
2015
2020
2025
2030
Year
2015
2020
2025
2030
Year
2015
2020
2025
2030
Year
0
50
100
150
200
250
300
350
Cap
acity
0
50
100
150
200
250
300
350
Seat
Dem
and
(0%
)
203
-65
-11
0 0-4-4 -2 -2
71 24
Capacity and Seat Deamand Projections - 0% Growth, 2017 - 2030Seat Demand (Seats)
Workstations (TIC)Workstations (regular)
Building Capacity (Seats)Capacity
Headquarters Administration Maintenance Office Building Blossom Hill Annex Crest Water Quality Lab Santa Teresa Office
2015
2020
2025
2030
Year
2015
2020
2025
2030
Year
2015
2020
2025
2030
Year
2015
2020
2025
2030
Year
2015
2020
2025
2030
Year
2015
2020
2025
2030
Year
2015
2020
2025
2030
Year
0
20
40
60
80
100
120
140
160
180
200
220
240
260
280
300
320
340
Cap
acity
0
20
40
60
80
100
120
140
160
180
200
220
240
260
280
300
320
340
Seat
Dem
and
(1%
)
-20
3
-12-6
-9
1
-40-8-10
-5-2
71 19
Capacity and Seat Deamand Projections - 0% Growth, 2017 - 2030
ALMADEN CAMPUS CAPACITY AND SEAT DEMAND PROJECTIONS
Building Capacity (Seats)
Seat Demand
Workstations
Regular Employees
1% growth projections show that all campus facilities will be beyond capacity by or before 2024, even if the current practice of doubling up temps, interns, and contractors continues
Temps, Interns, & Contractors
Leased office space at Santa Teresa will have 19 available seats in 2030, but the available seats here will not be enough to accommodate overcapacity issues in other District facilities
1% Growth, 2017 - 2030
8 Employee Workspace Project: All Hands Presentation
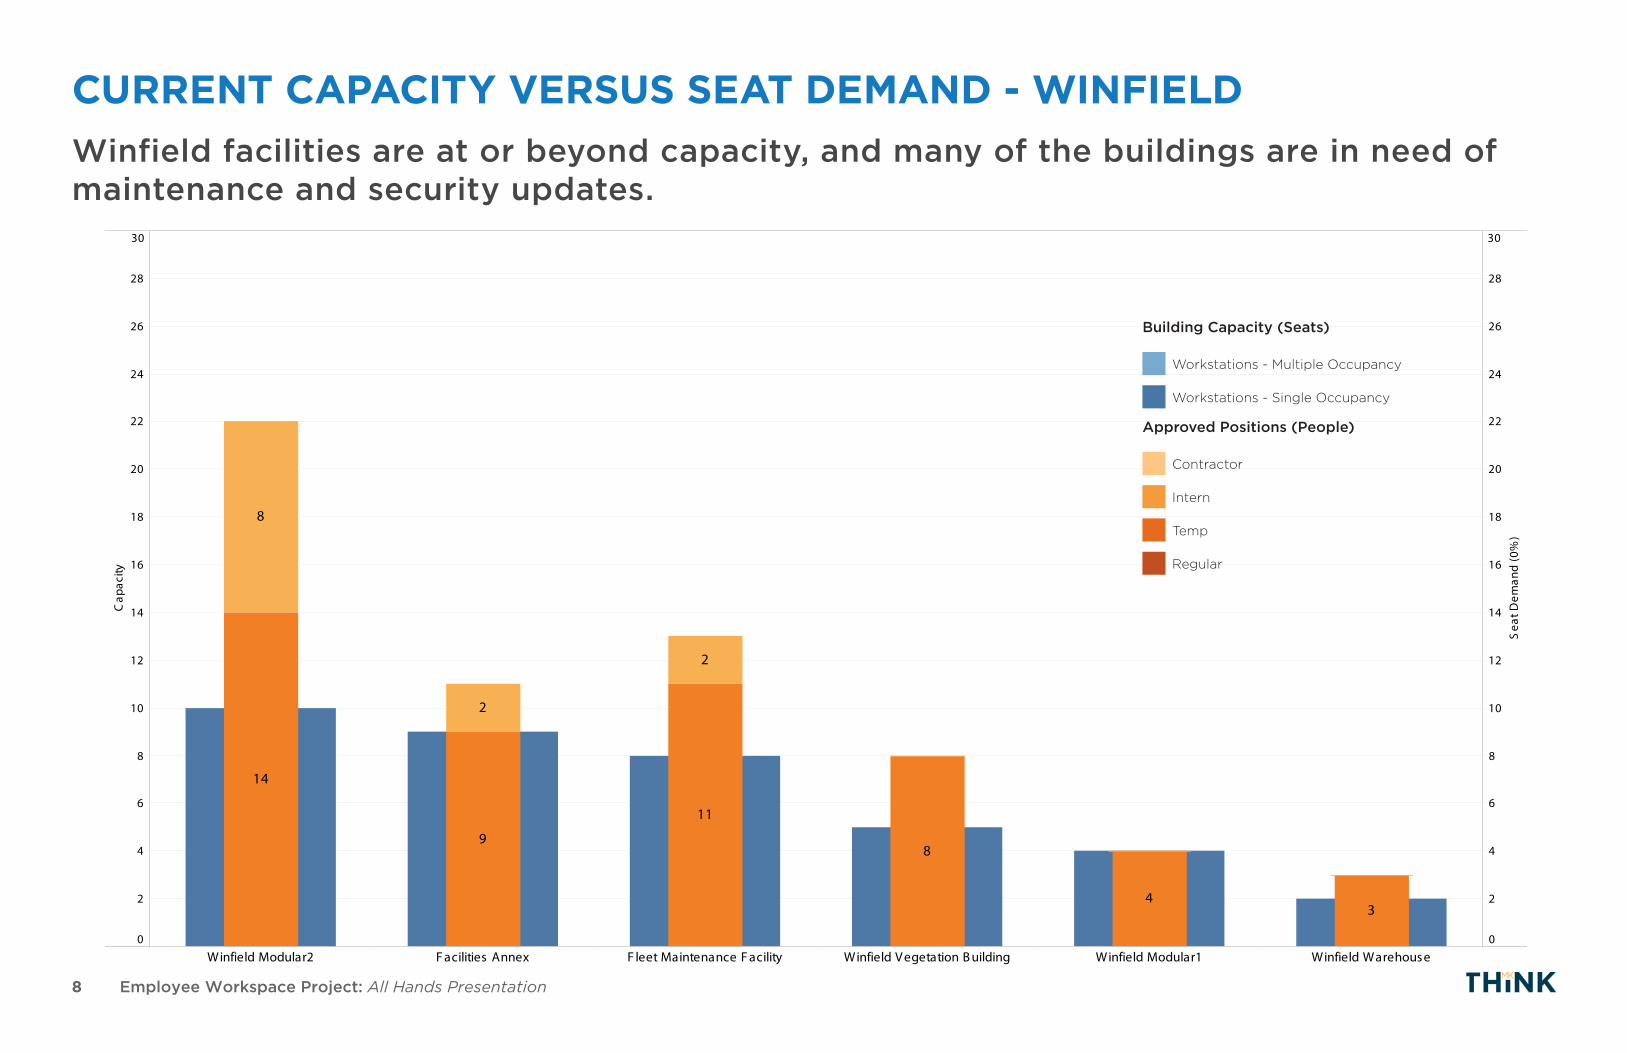
CURRENT CAPACITY VERSUS SEAT DEMAND - WINFIELD
Winfield Modular2 F acilities Annex F leet Maintenance F acility Winfield V egetation B uilding Winfield Modular1 Winfield Warehouse0
2
4
6
8
10
12
14
16
18
20
22
24
26
28
30
Cap
acity
0
2
4
6
8
10
12
14
16
18
20
22
24
26
28
30
Sea
t Dem
and
(0%
)
14
11
8
2
2
98
43
C urrent S eat Demand - Winfield
Building Capacity (Seats)
Approved Positions (People)
Workstations - Multiple Occupancy
Workstations - Single Occupancy
Contractor
Intern
Temp
Regular
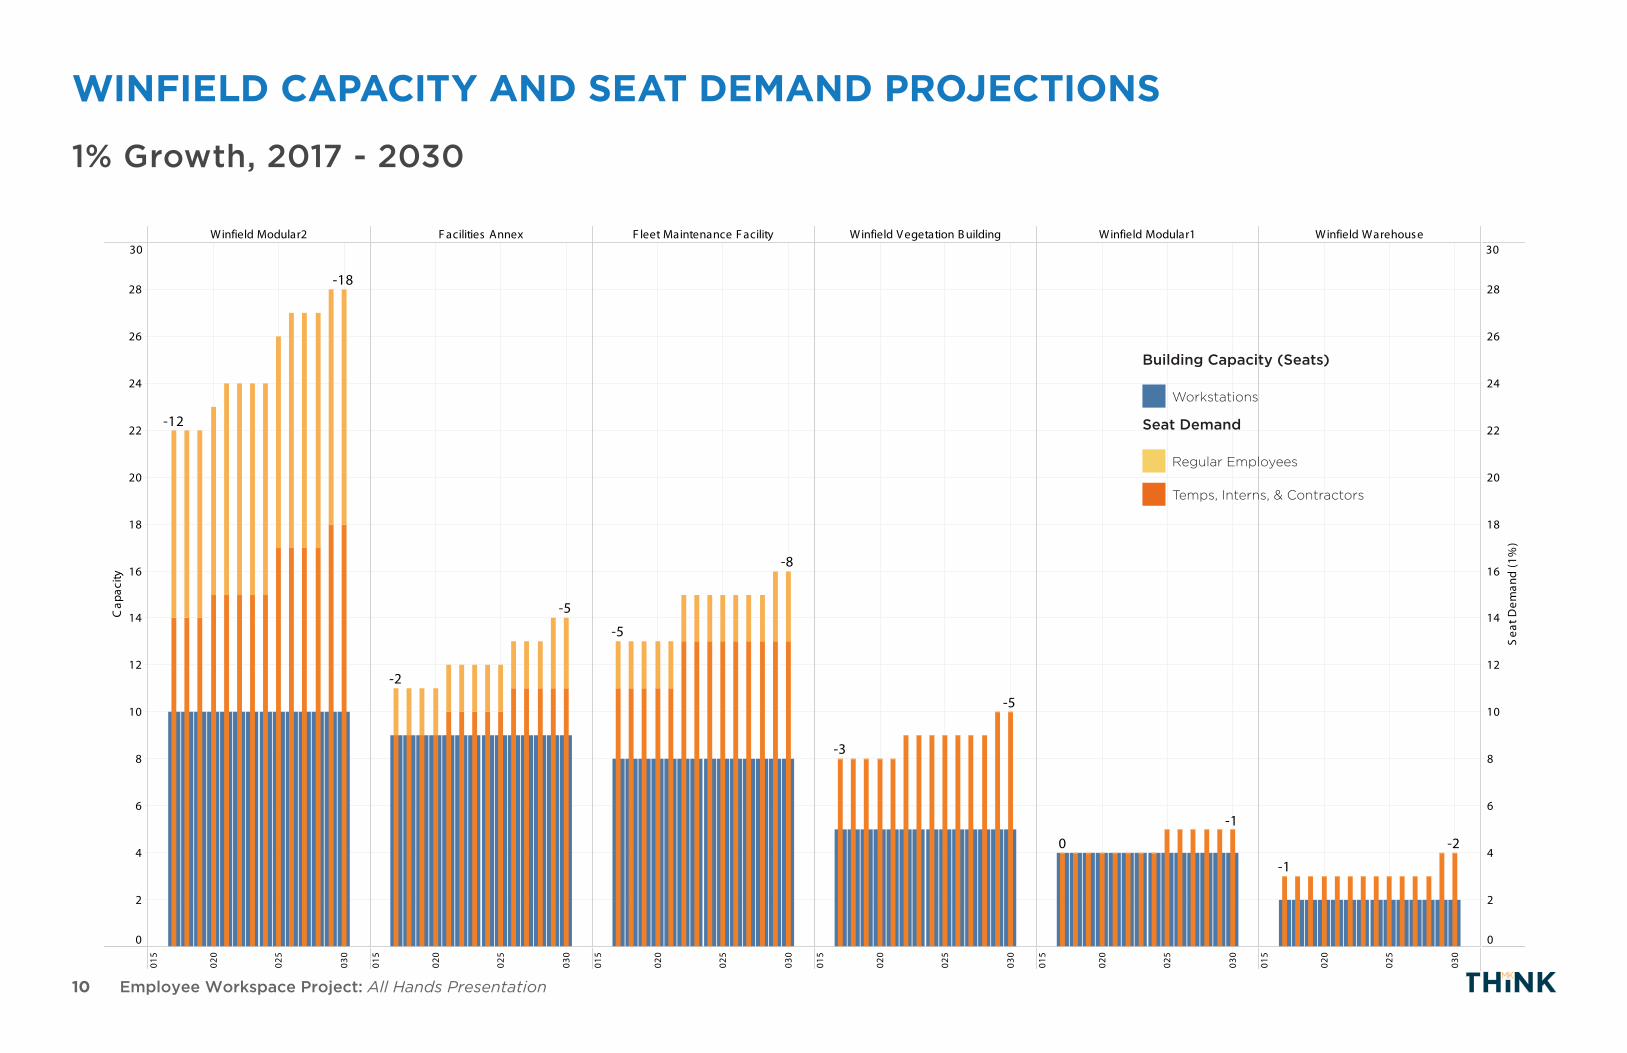
Winfield facilities are at or beyond capacity, and many of the buildings are in need of maintenance and security updates.

9 Employee Workspace Project: All Hands Presentation
Winfield Modular2 F acilities Annex F leet Maintenance F acility Winfield V egetation B uilding Winfield Modular1 Winfield Warehouse
2015
2020
2025
2030
2015
2020
2025
2030
2015
2020
2025
2030
2015
2020
2025
2030
2015
2020
2025
2030
2015
2020
2025
2030
0
2
4
6
8
10
12
14
16
18
20
22
24
26
28
30
Cap
acity
0
2
4
6
8
10
12
14
16
18
20
22
24
26
28
30
Sea
t Dem
and
(0%
)
-12 -12
-2 -2
-5 -5
-3 -3
0 0
-1 -1
C apacity and S eat Deamand P rojections - 0% G rowth, 2017 - 2030
WINFIELD CAPACITY AND SEAT DEMAND PROJECTIONS
Building Capacity (Seats)
Seat Demand
Workstations
Regular Employees
Temps, Interns, & Contractors
0% Growth, 2017 - 2030
10 Employee Workspace Project: All Hands Presentation
Winfield Modular2 F acilities Annex F leet Maintenance F acility Winfield V egetation B uilding Winfield Modular1 Winfield Warehouse
2015
2020
2025
2030
2015
2020
2025
2030
2015
2020
2025
2030
2015
2020
2025
2030
2015
2020
2025
2030
2015
2020
2025
2030
0
2
4
6
8
10
12
14
16
18
20
22
24
26
28
30
Cap
acity
0
2
4
6
8
10
12
14
16
18
20
22
24
26
28
30
Sea
t Dem
and
(1%
)
-12
-18
-2
-5
-5
-8
-3
-5
-1
0
-1
-2
C apacity and S eat Deamand P rojections - 1% G rowth, 2017 - 2030
WINFIELD CAPACITY AND SEAT DEMAND PROJECTIONS
Building Capacity (Seats)
Seat Demand
Workstations
Regular Employees
Temps, Interns, & Contractors
1% Growth, 2017 - 2030
11 Employee Workspace Project: All Hands Presentation
Rinconada Treatment Facility Coyote Modular1 Santa Teresa TreatmentFacility
PWTP Ozonification Facility Coyote Modular2 Vasona Pump Facility AWPC Trailer1 Penitencia Treatment Facility0
2
4
6
8
10
12
14
16
18
20
22
24
26
28
30
32
34
36
38
40
Cap
acity
0
2
4
6
8
10
12
14
16
18
20
22
24
26
28
30
32
34
36
38
40
Seat
Dem
and
(0%
)
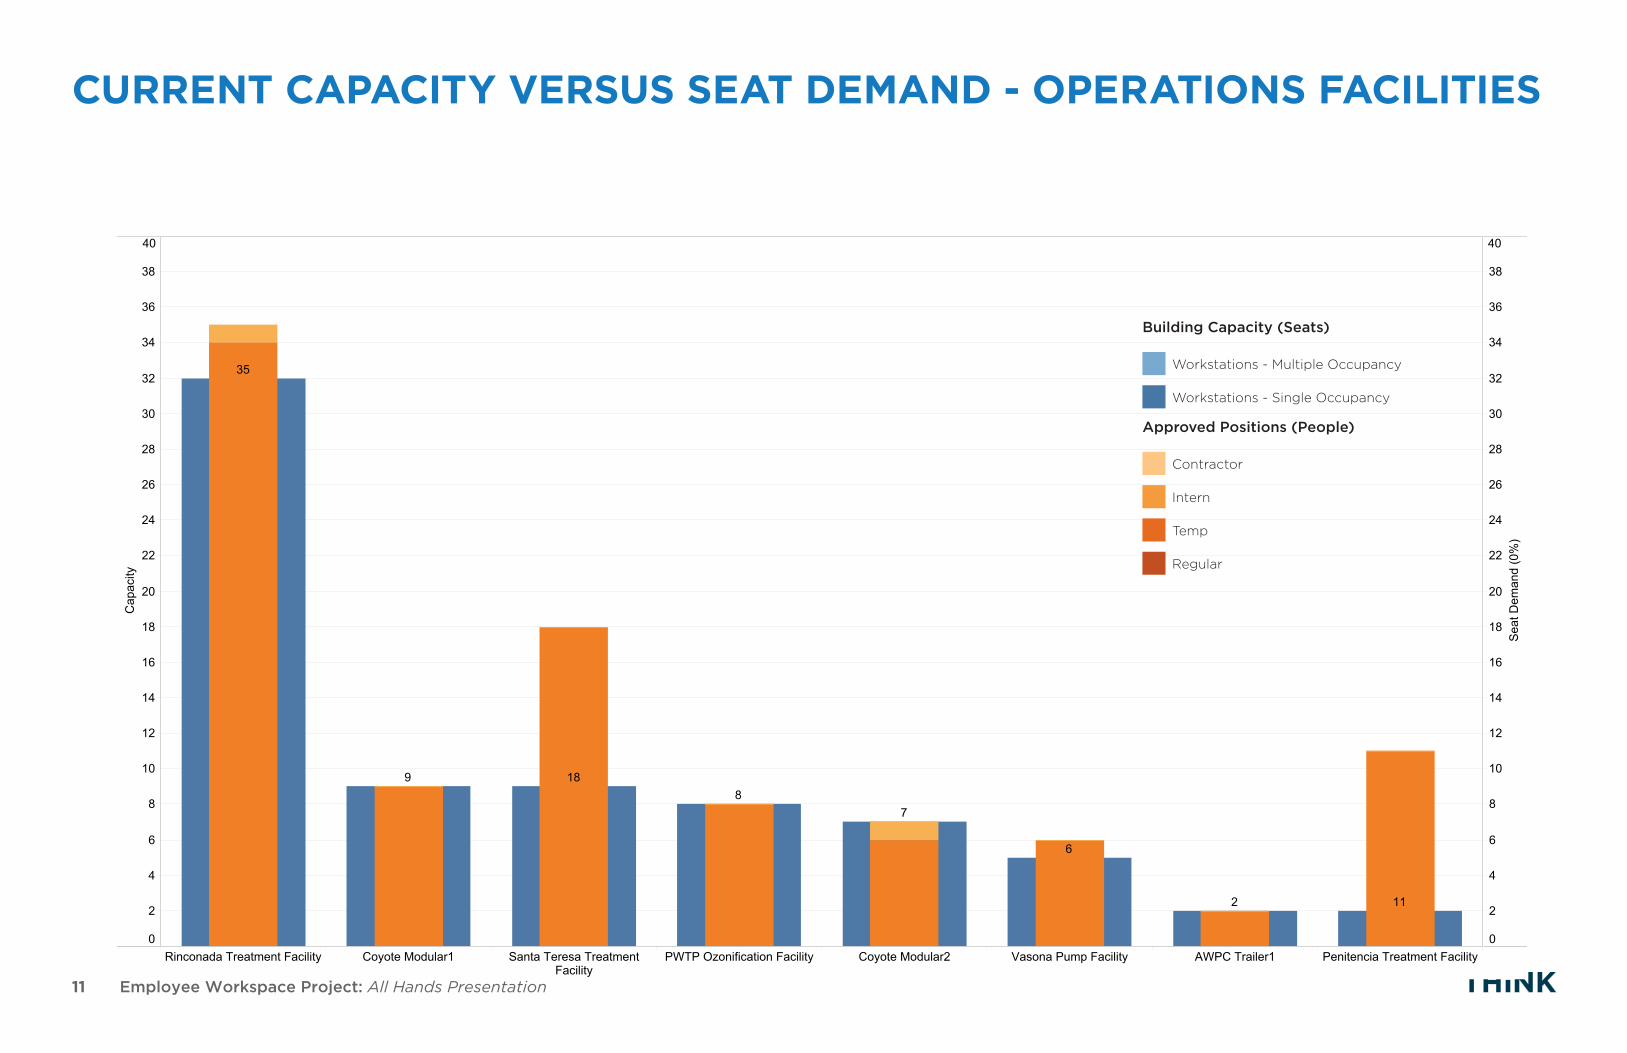
35
18
11
98
7
6
2
Current Seat Demand - Plants
Building Capacity (Seats)
Approved Positions (People)
Workstations - Multiple Occupancy
Workstations - Single Occupancy
Contractor
Intern
Temp
Regular
CURRENT CAPACITY VERSUS SEAT DEMAND - OPERATIONS FACILITIES

12 Employee Workspace Project: All Hands Presentation
PROJECTED GROWTH AND FACILITY NEED
193,104
246,888
212,976223,560
202,608
171,936172,584
183,600202,608
176,040179,064
2013 2014 2018 2019 20202015 2016 2017 2021 2025 2026 20272022 2023 20240
20K
40K
60K
80K
100K
120K
140K
160K
180K
200K
220K
240K
260K
US
F N
eed
Bas
ed O
n A
pp
rove
d P
osi
tio
ns O
n A
lmad
en C
amp
us
Existing Facility AreaOn Almaden Campus
158,682
Almaden Facility AreaPlus Santa Teresa
Leased Space176,530
The District will need to acquire additional space and/or use existing space more effectively to meet future growth.
SCVWD could need between 26,000 and 70,000 additional square feet of facility space to accommodate future growth just on the Almaden campus if current space standards are retained

13 Employee Workspace Project: All Hands Presentation
GOAL 5 RE-DESIGN EXISTING WORKSPACES AND PROVIDE ALTERNATIVES IF NECESSARY
GOAL 1 DEVELOP COMPREHENSIVE STRATEGY FOR USE/REUSE OF EXISTING DISTRICT FACILITIES AND INVESTMENT IN FACILITY UPGRADES TO ALIGN PHYSICAL ASSETS WITH WORK NEEDS
GOAL 4 CONSIDER ALTERNATIVE WORK SPACE CONCEPTS, SUCH AS HOTELING, MOBILE WORKING, SHARED AND PRIVATE SPACES, AND SATELLITE OFFICES
GOAL 3 UPGRADE AND IMPROVE WORKSPACES SO THAT THEY ARE EFFECTIVE AND ENABLE EMPLOYEES TO ACHIEVE THE DISTRICT’S CORE MISSION AND RESPONSIBILITIES
GOAL 2 INTRODUCE FLEXIBILITY AND EFFICIENCIES IN THE USE OF SPACE TO REDUCE REAL ESTATE AND BUILDING OPERATION COSTS AND TO OBTAIN LEED CERTIFICATION
EMPLOYEE WORKSPACE PROJECT: GOALSGuiding principles and boundaries.
14 Employee Workspace Project: All Hands Presentation
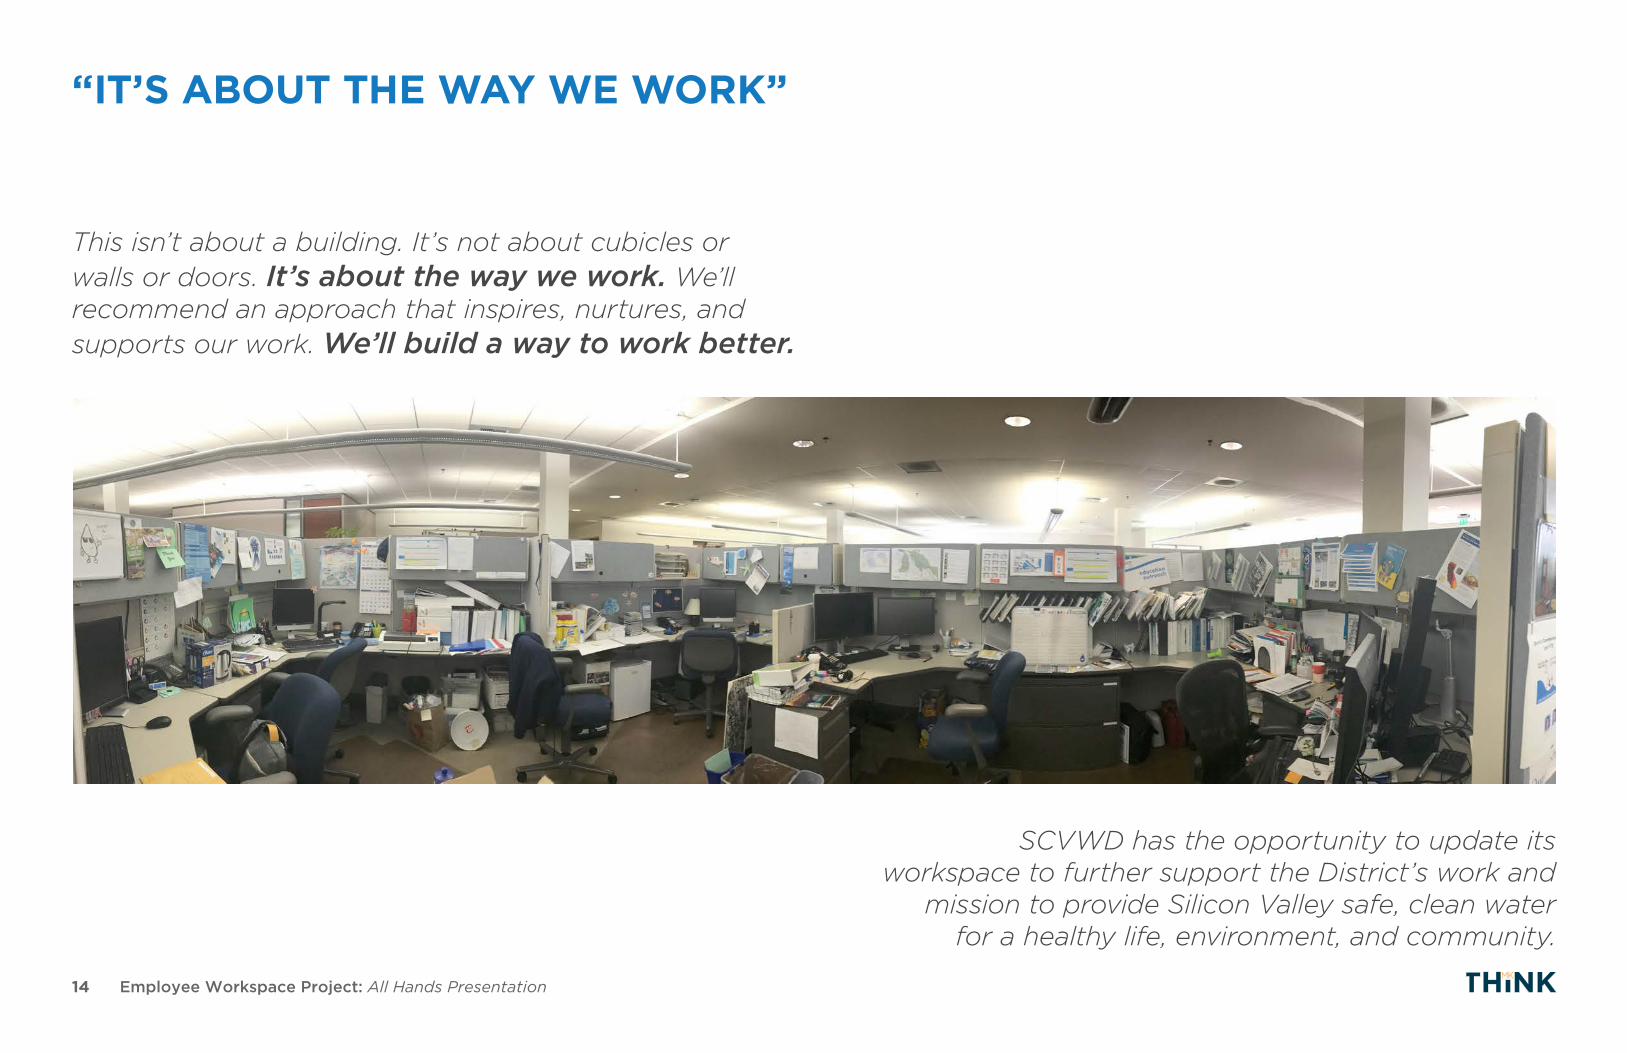
This isn’t about a building. It’s not about cubicles or walls or doors. It’s about the way we work. We’ll recommend an approach that inspires, nurtures, and supports our work. We’ll build a way to work better.
SCVWD has the opportunity to update its workspace to further support the District’s work and
mission to provide Silicon Valley safe, clean water for a healthy life, environment, and community.
“IT’S ABOUT THE WAY WE WORK”
2 ASSESSMENTWhat Are We Studying?
16 Employee Workspace Project: All Hands Presentation
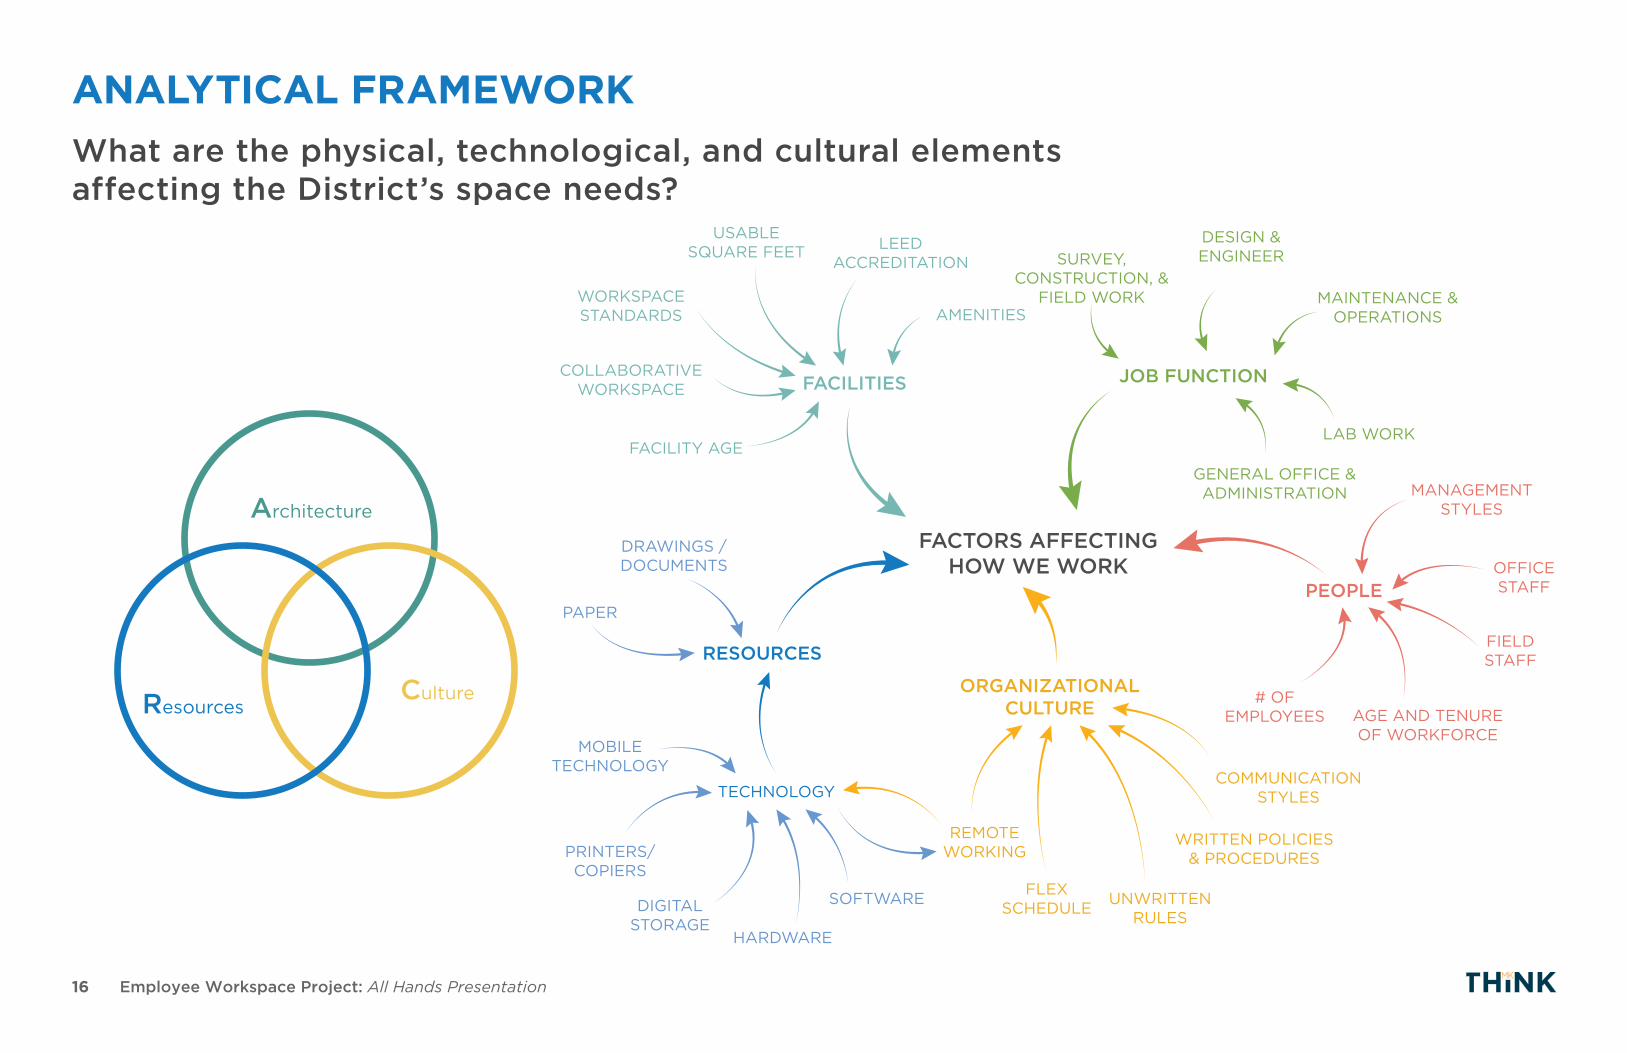
ANALYTICAL FRAMEWORK
Architecture
ResourcesCulture
What are the physical, technological, and cultural elements affecting the District’s space needs?
FACTORS AFFECTINGHOW WE WORK
ORGANIZATIONALCULTURE
FIELDSTAFF
OFFICESTAFF
MANAGEMENTSTYLES
# OFEMPLOYEES AGE AND TENURE
OF WORKFORCE
TECHNOLOGY
MOBILETECHNOLOGY
PAPER
DRAWINGS /DOCUMENTS
PRINTERS/COPIERS
DIGITALSTORAGE
HARDWARE
SOFTWARE
REMOTEWORKING
UNWRITTENRULES
WRITTEN POLICIES& PROCEDURES
FLEXSCHEDULE
COMMUNICATIONSTYLES
JOB FUNCTION
PEOPLE
FACILITIES
RESOURCES
SURVEY,CONSTRUCTION, &
FIELD WORK
LEEDACCREDITATION
FACILITY AGE
AMENITIES
USABLESQUARE FEET
WORKSPACESTANDARDS
COLLABORATIVEWORKSPACE
DESIGN &ENGINEER
MAINTENANCE &OPERATIONS
LAB WORK
GENERAL OFFICE &ADMINISTRATION
17 Employee Workspace Project: All Hands Presentation
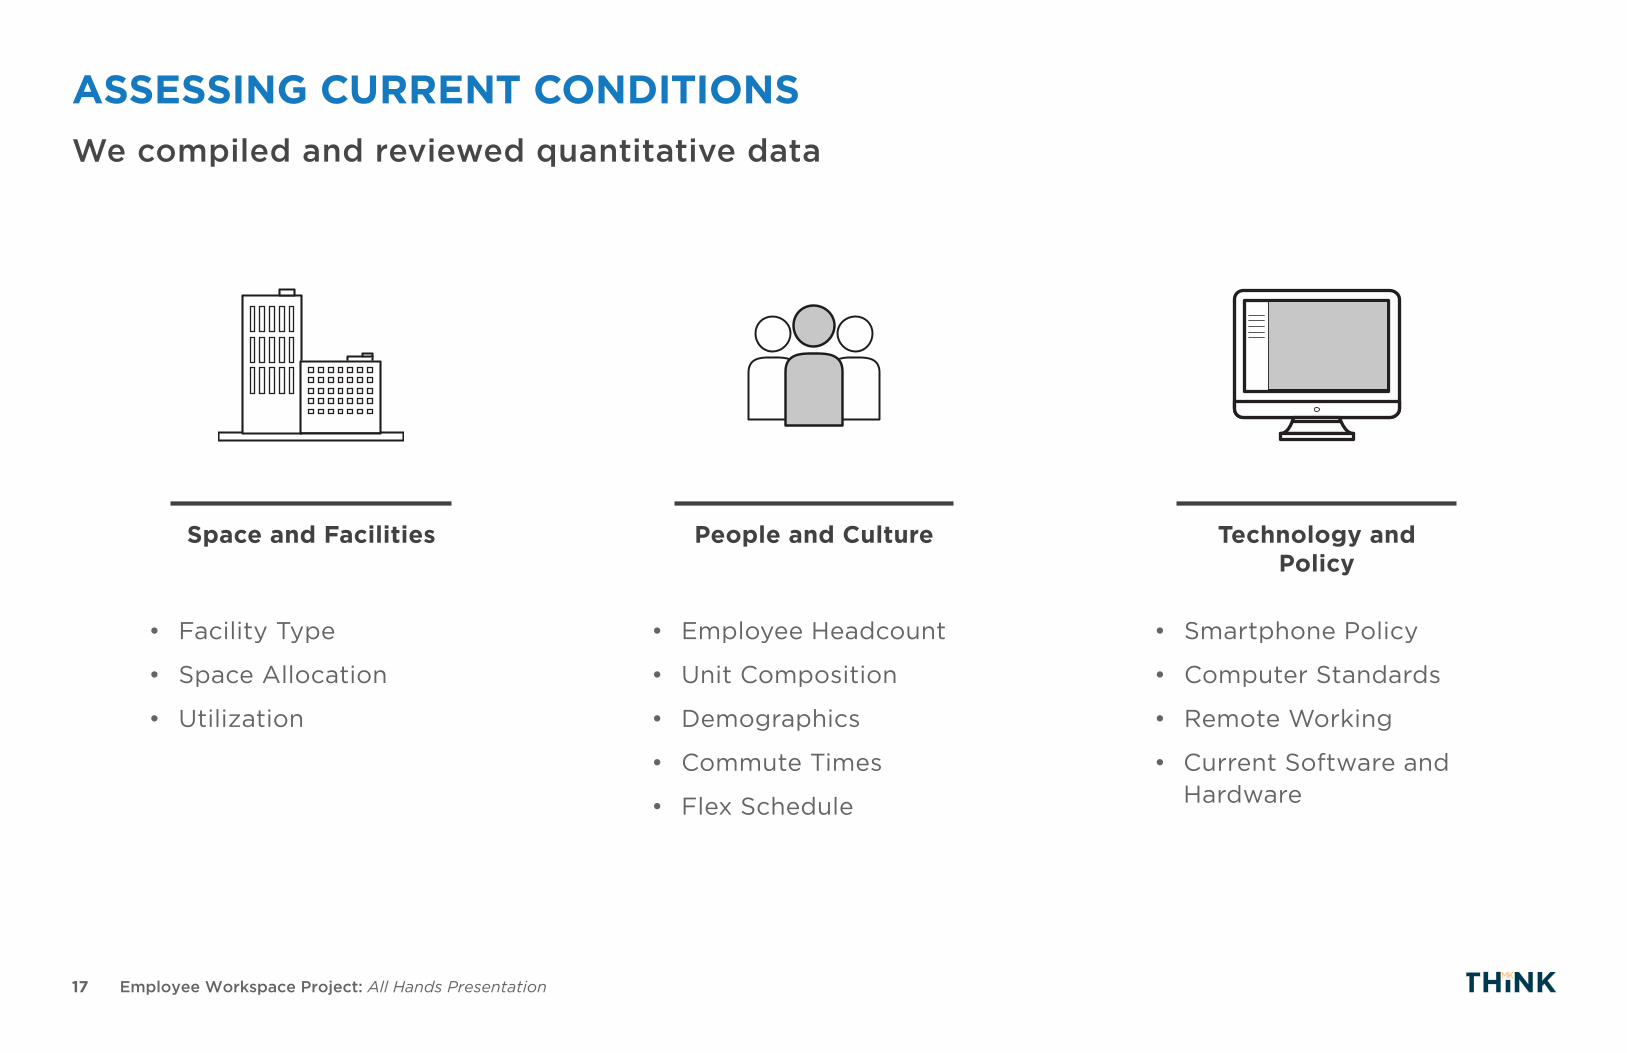
ASSESSING CURRENT CONDITIONSWe compiled and reviewed quantitative data
• Facility Type
• Space Allocation
• Utilization
Space and Facilities People and Culture Technology and Policy
• Employee Headcount
• Unit Composition
• Demographics
• Commute Times
• Flex Schedule
• Smartphone Policy
• Computer Standards
• Remote Working
• Current Software and Hardware
18 Employee Workspace Project: All Hands Presentation
0
10
20
30
40
50
60
70
80
90
100
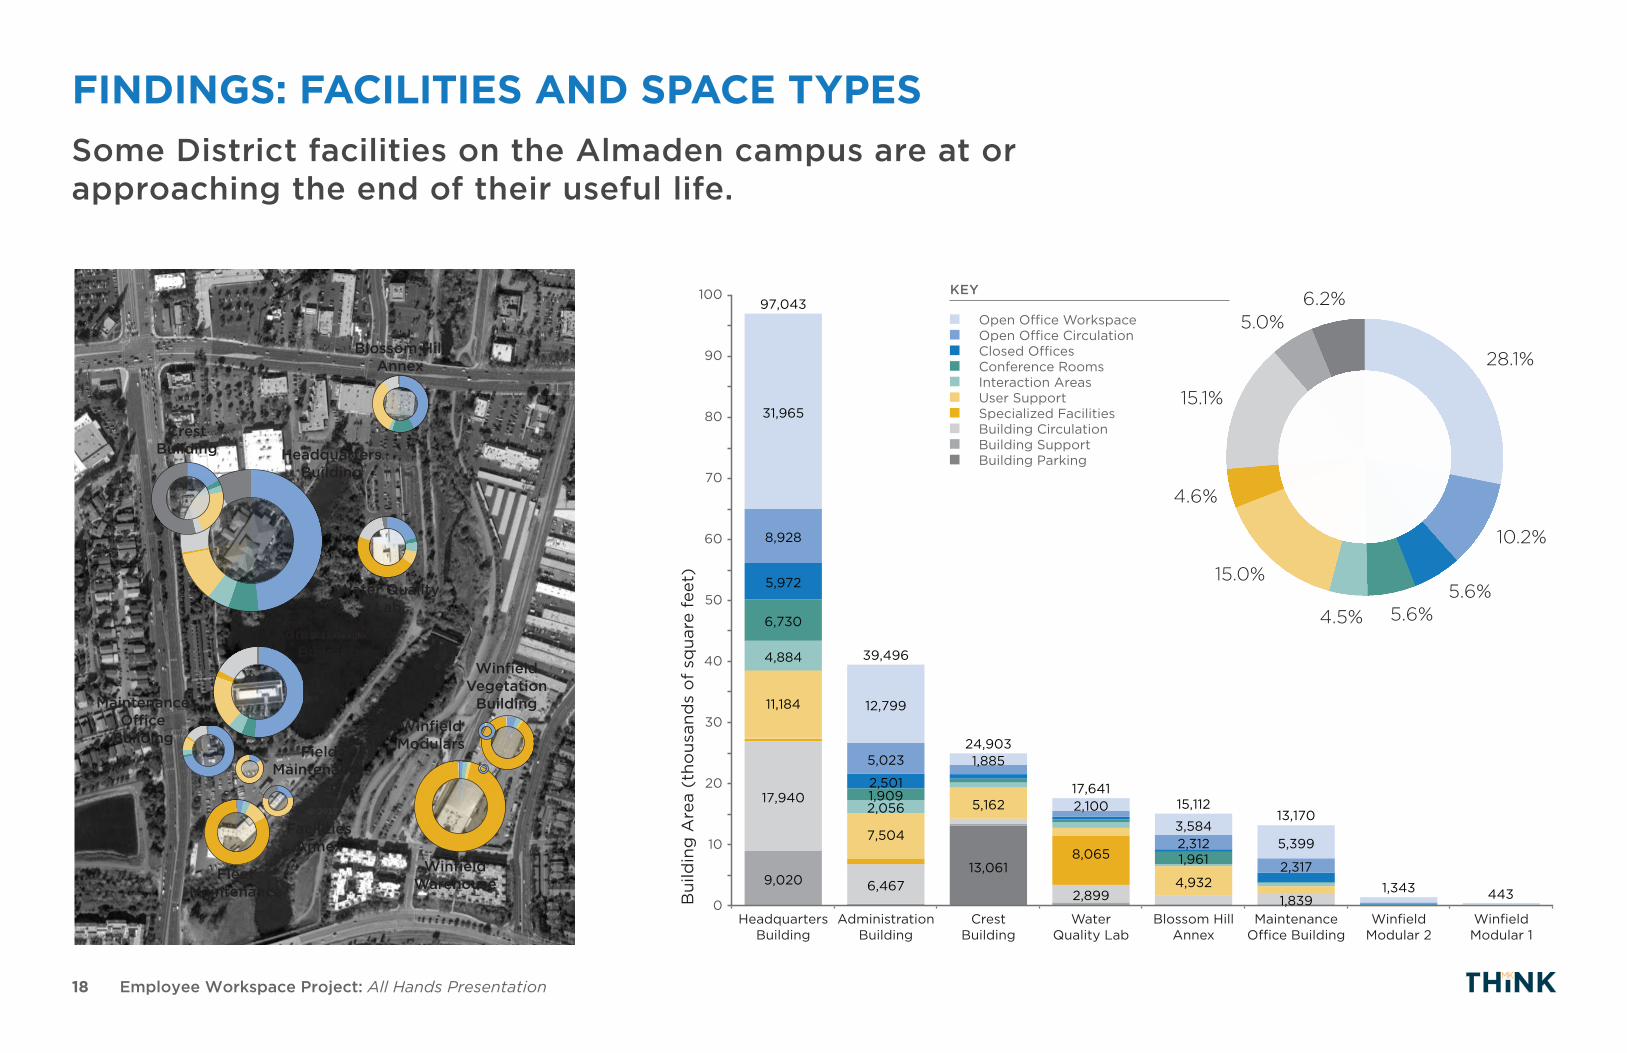
31,965
97,043
39,496
24,903
17,64115,112
13,170
1,343 443
12,799
17,940
11,184
13,061
1,885
8,0655,399
8,928
1,909
2,899 1,839
5,023
2,3176,467
2,056 2,100
6,730
9,020
3,584
4,884
7,5042,312
5,972
5,162
4,932
2,501
1,961
HeadquartersBuilding
AdministrationBuilding
CrestBuilding
WaterQuality Lab
Blossom HillAnnex
MaintenanceO�ce Building
WinfieldModular 2
WinfieldModular 1
Bui
ldin
g A
rea
(tho
usan
ds
of
squa
re f
eet)
Some District facilities on the Almaden campus are at or approaching the end of their useful life.
FINDINGS: FACILITIES AND SPACE TYPES
Blossom Hill Annex
Headquarters Building
Crest Building
Administration Building
Water Quality Lab
MaintenanceOffice
Building
Fleet Maintenance
Facilities Annex
Field Maintenance
Winfield Warehouse
Winfield Vegetation
BuildingWinfield Modulars
KEY
Open Office Workspace Open Office Circulation Closed Offices Conference Rooms Interaction Areas User SupportSpecialized Facilities Building Circulation Building Support Building Parking
28.1%
10.2%
5.6%5.6%
4.5%
15.0%
4.6%
15.1%
5.0%6.2%
19 Employee Workspace Project: All Hands Presentation
A173
C209C212
C225A12
4A226
A235A236
A345A346
B124
B207B232
D131
G1111
G112 G119A13
6A318
D102
G120
A168
B228R316
A143
G122
B108
A120
0
10
20
30
40
50
60
70
80
90
100
Co
nfer
ence
Ro
om
Cap
acit
y an
d O
ccup
ancy
Conference Room
Headquarters Building Administration BuildingCrest BuildingMaintenance Office Building Blossom Hill AnnexRinconada
KEY
room capacitymax occupancy
min occupancy
median occupancylower quartile
upper quartile
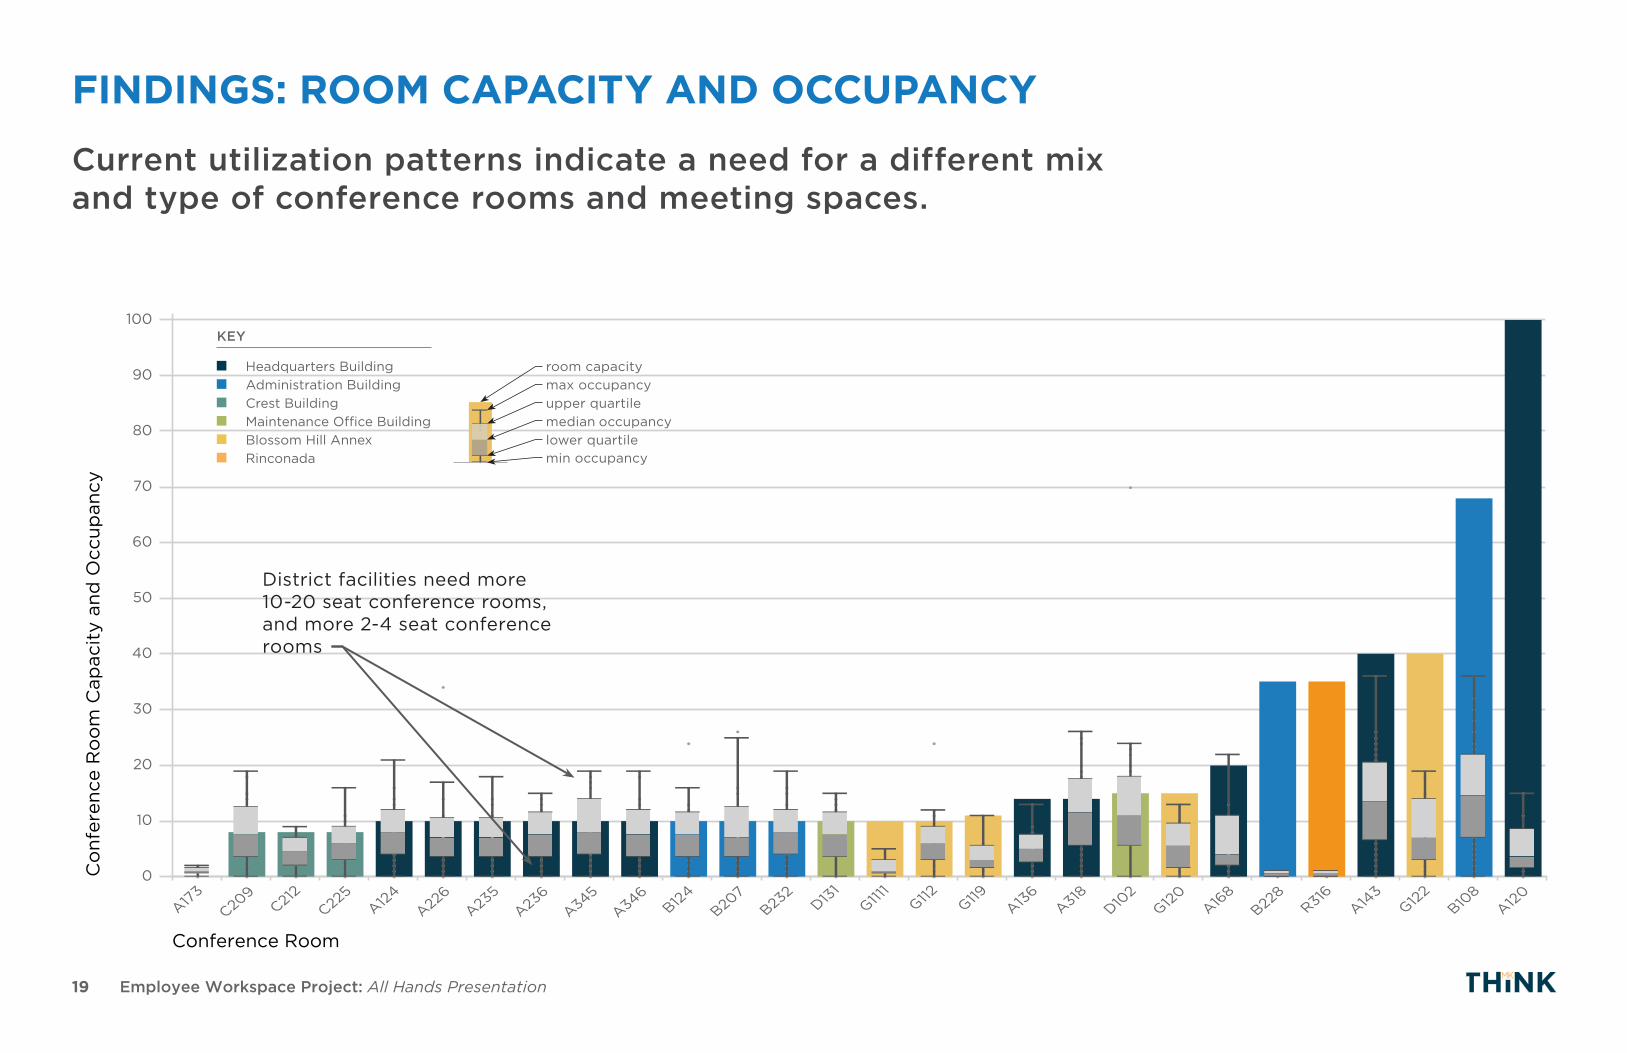
FINDINGS: ROOM CAPACITY AND OCCUPANCY
Current utilization patterns indicate a need for a different mix and type of conference rooms and meeting spaces.
District facilities need more 10-20 seat conference rooms, and more 2-4 seat conference rooms

20 Employee Workspace Project: All Hands Presentation
District offices on the Almaden Campus are in a good location relative to the home locations of District employees, but there may be opportunities for satellite offices in locations nearer to some employees.
FINDINGS: EMPLOYEE COMMUTE TIMES
7:00 AM 5:00 PM
The majority of District employees have a commute time of under 40 minutes by car in the morning.
21 Employee Workspace Project: All Hands Presentation
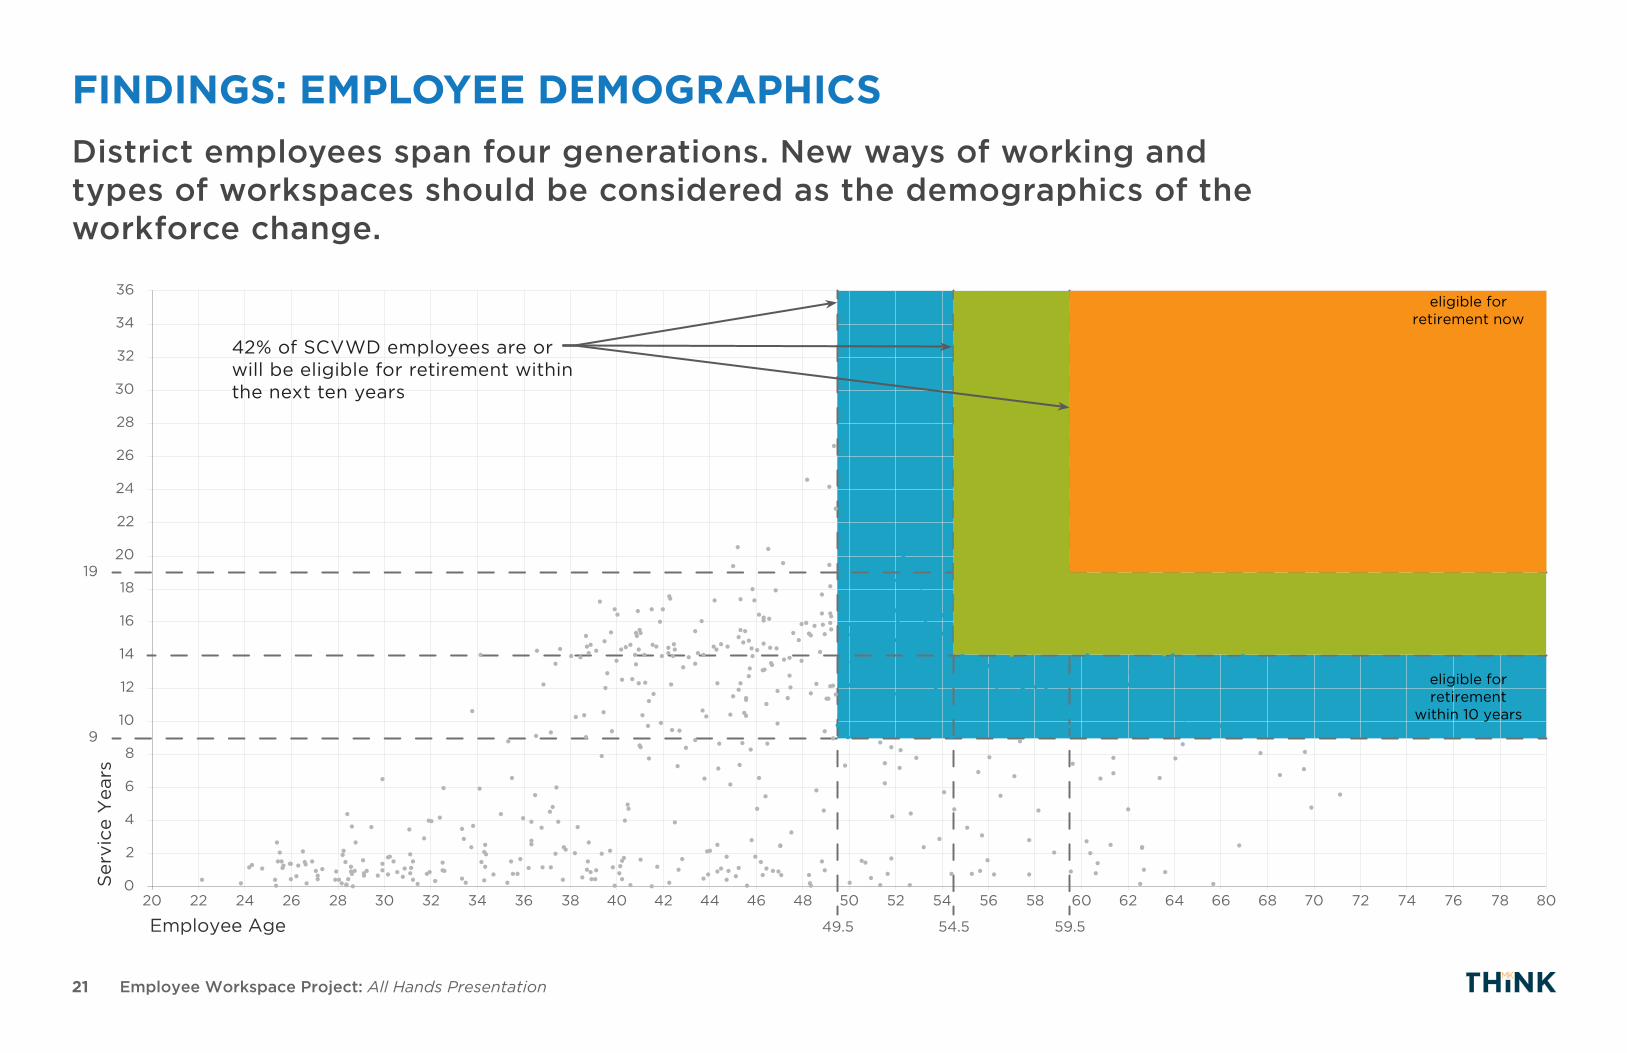
20 22 24 26 28 30 32 34 36 38 40 42 44 46 48 50 52 54 56 58 60 62 64 66 68 70 72 74 76 78 80
Employee Age
0
2
4
6
8
10
12
14
16
18
20
22
24
26
28
30
32
34
36
Ser
vice
Yea
rs
eligible forretirement now
eligible forretirement
within 5 years
eligible forretirement
within 10 years
49.5 54.5 59.5
19
9
FINDINGS: EMPLOYEE DEMOGRAPHICSDistrict employees span four generations. New ways of working and types of workspaces should be considered as the demographics of the workforce change.
42% of SCVWD employees are or will be eligible for retirement within the next ten years

22 Employee Workspace Project: All Hands Presentation
Retain, Enhance, Introduce, Discard (REID) Exercise and surveys shed light on employee satisfaction, personal workspaces, campus environment, technology, culture, and sustainability.
QUALITATIVE ASSESSMENT: DISTRICT EMPLOYEE FEEDBACK
UNITS ENGAGED
68 of 74
SITES VISITED
23POST-ITS USED
2,493
• Retain• Enhance • Introduce• Discard

23 Employee Workspace Project: All Hands Presentation
KEY # %
FEEDBACK: PERSONAL WORKSPACEMost employees wish to retain their cubicles and adjacency to their units, but need better storage, lighting, and ergonomics. This is the central challenge for this work, as the District is running out of space.
0
10
20
30
40
50
60
70
80
90
100
110
120
Num
ber
of
Res
po
nses
2027
19
1913
5121
1221
4
2710
1311
2424
11
1413
98
2085
113
53
3327
163
313
33
45
2
3214
172
52
47
229
2 2 2
1321
92
61
71 12
1
82
21
1
184
21 2
22
1
47
1
72
1
124
111
111 1
Cubicl
es
Stora
ge
Unit A
djacen
cy
Ergono
mics
Light
ing
Quiet
/ Aco
ustic
s
Natur
al Li
ght /
Win
dows
Collabora
tion
SpaceSpac
e
Furni
ture
Ther
mal
Comfo
rt
Privac
y
Décor
Privat
e O�
ce
Layo
ut
Equipm
ent
Cleanl
ines
s /
Cleani
ng S
ervic
e
Libra
ry S
pace
Confiden
tialit
y
Ventil
atio
n / A
ir
Flow
Bullp
en /
Share
d
Cubicl
es
Perso
nal
Work
spac
e
Recep
tion
Mobile
Work
stat
ions
Open W
orksp
ace
Copy Room
Lab F
acilit
ies
Work
Veh
icles
Hardwar
e
36.7%
35.8%19.3%
8.1%
Cubicles and storage together make up 24% of all Personal
Workspace responses
Retain 330 35.8%Enhance 338 36.7%Introduce 178 19.3%Discard 75 8.1%Total 921 100%

24 Employee Workspace Project: All Hands Presentation
1014
1811
96
48
63 3
223
1411
3
117
204
37
2
323
2
42
2 121
1
239
1
32
1
31
1 1
11
131
21
153
1218
71
1013
4115
211
48
51
81
32
11
21
1 10
10
5
20
15
25
30
35
40
45
50
55
Printe
rs/P
rinte
r Sec
urity
Mobile Te
chno
logy
(Tab
lets,
Smar
tpho
nes)
Softwar
e
Tech
nolo
gy
Dual M
onitors
Digita
l Sys
tem
s
Hardwar
eW
iFi
Confer
ence
Room
Tech
nolo
gy
Lapto
ps
Web
Conf
eren
cing
VPN
Serve
r
Digita
l/Clo
ud S
tora
ge
Collabora
tive E
diting
/
File S
harin
g
Network
Phone
s
Comput
er
IT S
upport
A/V
Camer
as
Upgrades
Confer
ence
Room
Sched
uling
IT Tr
aining
Digita
l Docu
men
t
Manag
emen
t
Online
Com
mun
icatio
n/
Messa
ging
Headse
ts
Intra
net P
hone
book
Scann
ing
Intra
net
Tech
nolo
gy-re
lated
Stress
Num
ber
of
Res
po
nses
KEY # %
FEEDBACK: TECHNOLOGY AND POLICYPrinters/security, mobile devices, software, WiFi, and conference room technology generated the greatest number of responses.
10% of all Technology responses ask to improve printers or printer security and 8% of responses are about enhancing or introducing
mobile technology
50.7%
25.8%18.4%
5.2%Retain 82 18.4%Enhance 226 50.7%Introduce 115 25.8%Discard 23 5.2%Total 446 100%

25 Employee Workspace Project: All Hands Presentation
164
8
45
3
331
216
51 3
21
31
111 1
6916
111
4041
91
83
1
1
511 15
32
1
121
11
Flex Schedule
Remote Worki
ng Policy
Welln
ess Pro
gram
Hierarchy
Benefits
Collaboratio
n/
Community
Prof. D
evelopment
Policies/
Proce
sses
Culture
Mindset
Board M
eetings
Meetings
Red Tape/
Paperwork Tru
st
Job Sharin
g
Work-
Life B
alance
Cubicle Etiquette
Diversi
ty
Institu
tional
Knowledge
Management
Num
ber o
f Res
pons
es
0
10
20
30
40
50
60
70
80
90
100 KEY
FEEDBACK: WORK CULTUREDistrict employees wish to work from a variety of locations both on and off the Almaden campus.
Fewer than 2% of employees currently have the necessary approval to work remotely
54.4% 45.6%cannot work remotelycould work remotely
141168
106
201
65.5% 34.5%don’t want to work remotelywant to work remotely
Could work remotely 54.5%Would want to work remotely 65.5%
Retain 121 38.9%Enhance 85 27.3%Introduce 73 23.5%Discard 32 10.3%
# %

26 Employee Workspace Project: All Hands Presentation
Working alone at desk 49.4%In informal meetings 17.4%In formal meetings 15.9%In the field 13.3%Working remotely 4%
AverageKEY
FEEDBACK: TIME SPENT WORKING%
of
Ave
rag
e W
eek
0
20%
40%
60%
80%
100%
Hum
an R
eso
urce
s Te
chni
cian
Pur
chas
ing
Tec
hnic
ian
Lib
rari
an
Acc
oun
tant
Bo
ard
Ad
min
istr
ato
r
Hyd
rog
eolo
gis
t
Eng
inee
ring
Geo
log
ist
Acc
oun
ting
Tec
hnic
ian
O�
ce A
dm
inis
trat
or
Stu
den
t In
tern
Rea
l Est
ate
Ag
ent
Wat
er C
ons
erva
tio
n S
pec
ialis
t
Sta
� A
naly
st
Leg
al A
naly
st
Sur
veyo
r (O
�ce
)
Hyd
rolo
gic
Sys
tem
s A
naly
..
Man
agem
ent
Ana
lyst
Ad
min
istr
ato
r
Env
iro
nmen
tal P
lann
er
Eng
inee
r
Ris
k M
anag
er
Pro
ject
Ass
ista
nt
IT A
naly
st
Wat
er R
eso
urce
s S
pec
ialis
t
Pro
ject
Man
ager
Cle
rk o
f th
e B
oar
d
IT A
dm
inis
trat
or
Dis
tric
t C
oun
sel
Eng
inee
ring
Tec
hnic
ian
Pro
gra
m A
dm
inis
trat
or
Hyd
rog
rap
her
Wel
der
Trea
sury
/Deb
t O
�ce
r
Uni
t M
anag
er
Pub
lic In
form
atio
n R
ep
Wel
ls In
spec
tor
Saf
ety
Sp
ecia
list
Rep
rog
rap
hics
Tec
hnic
ian
Inve
nto
ry C
ont
rol T
echn
icia
n
Eng
inee
ring
Sys
tem
s A
naly
st
Buy
er
IT T
echn
icia
n
Rec
ruit
er
Fie
ld O
per
atio
ns A
dm
inis
trat
or
Saf
ety
Tech
nici
an
Dep
uty
Op
erat
ing
O�
cer
Dep
uty
Ad
min
istr
ativ
e O
�ce
r
Mec
hani
c
Co
rro
sio
n C
ont
rol T
echn
ici..
Mai
nten
ance
Tec
h nic
ian
Bio
log
ist
IT S
pec
ialis
t
Bud
get
O�
cer
Mai
nten
ance
Wo
rker
Op
erat
or
Sur
veyo
r (F
ield
)
On average, employees spend 50% of their time working alone at their desks and over 30% of their time in meetings.

27 Employee Workspace Project: All Hands Presentation
FEEDBACK: ACOUSTIC SATISFACTION
0
20%
40%
60%
80%
100%
% o
f R
esp
ond
ents
57%
50%
50%
50%
50%
40
%
40
%
38%
33%
33%
33%
33%
33%
29%
25%
25%
25%
20%
20%
17%
17%
17%
14%
14%
14%
13%
10%
100%
Wel
der
Hyd
rog
eolo
gis
t
Bud
get
O�
cer
Tre
asu
ry/D
ebt
O�
cer
Hyd
rog
rap
her
Buy
er
Pur
chas
ing
Tec
hnic
ian
Sur
veyo
r (O
�ce
)
Hyd
rolo
gic
Sys
tem
s A
naly
st
Eng
inee
ring
Sys
tem
s A
naly
st
IT A
dm
inis
trat
or
Eng
inee
ring
Tec
hnic
ian
Pro
gra
m A
dm
inis
trat
or
Op
erat
or
Bio
log
ist
Pub
lic In
form
atio
n R
ep
Mai
nten
ance
Wo
rker
Fie
ld O
per
atio
ns A
dm
inis
trat
or
Eng
inee
r
Uni
t M
anag
er
Mec
hani
c
IT T
echn
icia
n
Ad
min
istr
ato
r
Man
agem
ent
Ana
lyst
Sta
� A
naly
st
O�
ce A
dm
inis
trat
or
IT A
naly
st
Acc
oun
tant
Dep
uty
Op
erat
ing
O�
cer
Dis
tric
t C
oun
sel
Rea
l Est
ate
Ag
ent
Mai
nten
ance
Tec
hnic
ian
Wat
er C
ons
erva
tio
n S
pec
ialis
t
Wat
er R
eso
urce
s S
pec
ialis
t
Bo
ard
Ad
min
istr
ato
r
Dep
uty
Ad
min
istr
ativ
e O
�ce
r
Env
iro
nmen
tal P
lann
er
Pro
ject
Ass
ista
nt
Pro
ject
Man
ager
Stu
den
t In
tern
Acc
oun
ting
Tec
hnic
ian
Cle
rk o
f th
e B
oar
d
Co
rro
sio
n C
ont
rol T
echn
icia
n
Eng
inee
ring
Geo
log
ist
Hum
an R
eso
urce
s T
echn
icia
n
Inve
nto
ry C
ont
rol T
echn
icia
n
IT S
pec
ialis
t
Leg
al A
naly
st
Lib
rari
an
Rec
ruit
er
Rep
rog
rap
hics
Tec
hnic
ian
Ris
k M
anag
er
Saf
ety
Sp
ecia
list
Sur
veyo
r (F
ield
)
Wel
ls In
spec
tor
100
%
100
%
100
%
100
%
100
%
100
%
67%
67%
60
%
50%
50%
50%
38%
33%
33%
30%
30%
29%
22%
19%
17%
17%
17%
17%
9%
9%
Workspaces are quiet enough for the majority of positions to work effectively.
Not quiet enough to work effectively Quiet enough to work effectively
KEY
3 STRATEGYWhat Are We Doing With This Information?

29 Employee Workspace Project: All Hands Presentation
Space Standards Technology Workspace Culture
LEVERS FOR CHANGEThese workplace factors affect facility needs and can reduce the District’s overall need for additional space.

30 Employee Workspace Project: All Hands Presentation
Planning, Engineering,& Design
Survey, Construction,& Field Work
Maintenance &Operations
Lab Work General Office
SPACE STANDARDS: BROAD JOB FUNCTIONSDistrict work can be grouped into the following categories:

31 Employee Workspace Project: All Hands Presentation
SPACE STANDARDS: EMPLOYEE LEVELSDistrict employees can be classified into the following levels.
GeneralO�ce
CEOBAOChief
6
UnclassifiedDeputy
11
UnclassifiedOther
8
TempIntern
Consultant
111
2
10
8
29
Lab Work
Maintenance& Operations
Survey,Construction,& Field Work
General Sta�Field
9
51
3
Planning,Engineering,
& Design
Manager
28
1
1
1
29
213
28
15
26
183
General Sta�Focused773
Employees on Almaden Campus
CEO / BAO / Chief 6*
Unclassified - Deputy 11*
Unclassified - Other 8
Manager 60
General Staff - Focused 465
General Staff - Field 63
Temp / Intern / Consultant 160
* Approved positions as of December 2016, since that time, 2 chiefs and 1 deputy have been approved and appointed.
32 Employee Workspace Project: All Hands Presentation
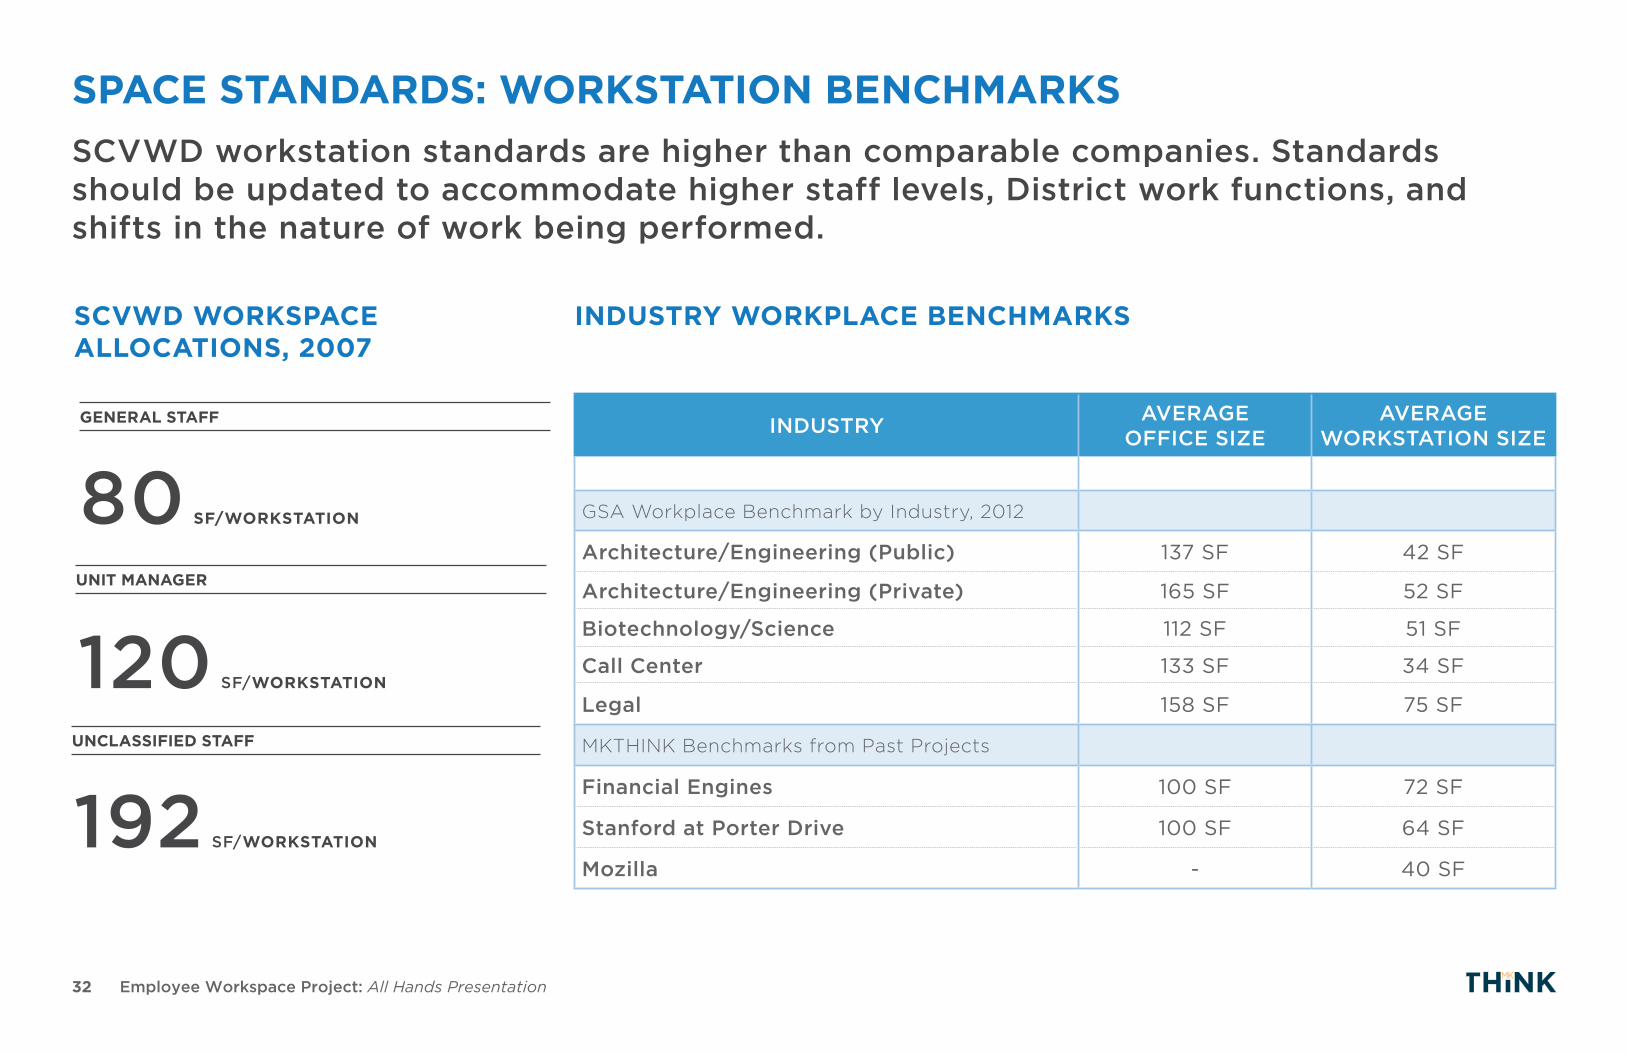
INDUSTRY AVERAGE OFFICE SIZE
AVERAGEWORKSTATION SIZE
GSA Workplace Benchmark by Industry, 2012
Architecture/Engineering (Public) 137 SF 42 SF
Architecture/Engineering (Private) 165 SF 52 SF
Biotechnology/Science 112 SF 51 SF
Call Center 133 SF 34 SF
Legal 158 SF 75 SF
MKTHINK Benchmarks from Past Projects
Financial Engines 100 SF 72 SF
Stanford at Porter Drive 100 SF 64 SF
Mozilla - 40 SF
GENERAL STAFF
80 SF/WORKSTATION
UNIT MANAGER
120 SF/WORKSTATION
UNCLASSIFIED STAFF
192 SF/WORKSTATION
SCVWD WORKSPACE ALLOCATIONS, 2007
INDUSTRY WORKPLACE BENCHMARKS
SPACE STANDARDS: WORKSTATION BENCHMARKSSCVWD workstation standards are higher than comparable companies. Standards should be updated to accommodate higher staff levels, District work functions, and shifts in the nature of work being performed.
33 Employee Workspace Project: All Hands Presentation
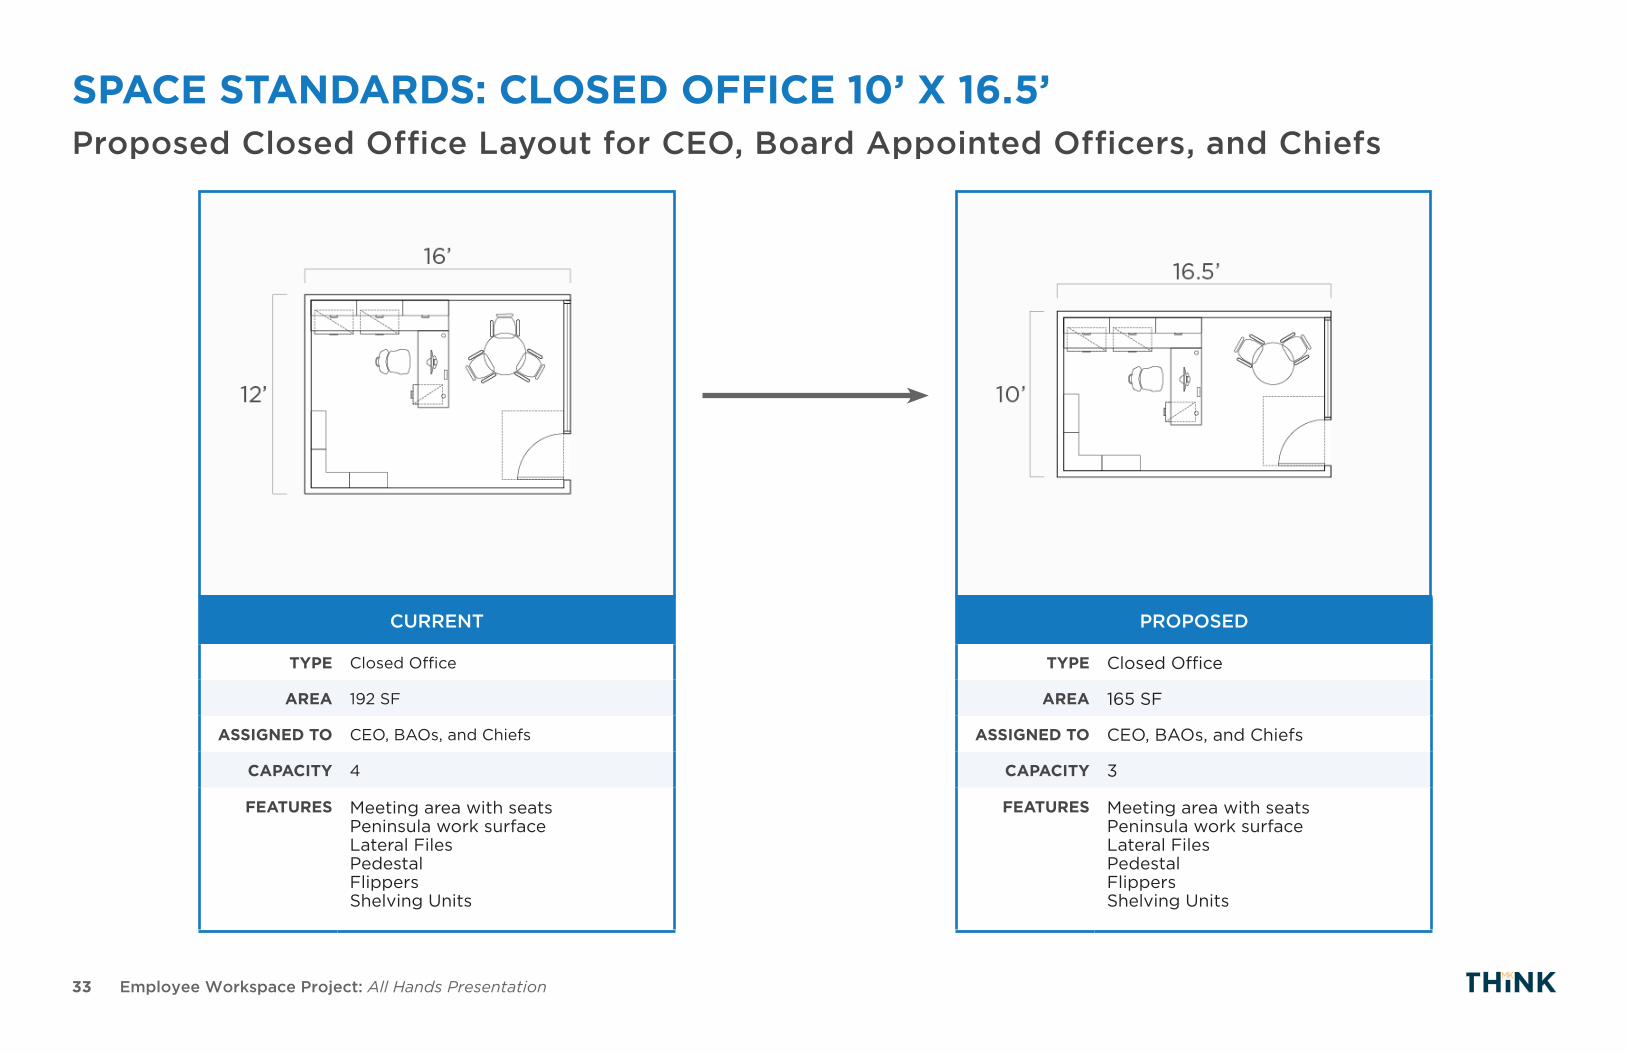
SPACE STANDARDS: CLOSED OFFICE 10’ X 16.5’Proposed Closed Office Layout for CEO, Board Appointed Officers, and Chiefs
CURRENT
TYPE Closed Office
AREA 192 SF
ASSIGNED TO CEO, BAOs, and Chiefs
CAPACITY 4
FEATURES Meeting area with seatsPeninsula work surfaceLateral FilesPedestalFlippersShelving Units
PROPOSED
TYPE Closed Office
AREA 165 SF
ASSIGNED TO CEO, BAOs, and Chiefs
CAPACITY 3
FEATURES Meeting area with seatsPeninsula work surfaceLateral FilesPedestalFlippersShelving Units

34 Employee Workspace Project: All Hands Presentation
SPACE STANDARDS: CLOSED OFFICE 10’ X 13’Proposed Closed Office Layout for Unclassified Staff - Deputies
PROPOSED
TYPE Closed Office
AREA 130 SF
ASSIGNED TO Unclassified Staff - Deputies
CAPACITY 3
FEATURES Meeting area with seatsPeninsula work surfaceLateral FilesPedestalFlippersShelving Units
CURRENT
TYPE Closed Office
AREA 192 SF
ASSIGNED TO Unclassified Staff - Deputies
CAPACITY 4
FEATURES Meeting area with seatsPeninsula work surfaceLateral FilesPedestalFlippersShelving Units
35 Employee Workspace Project: All Hands Presentation
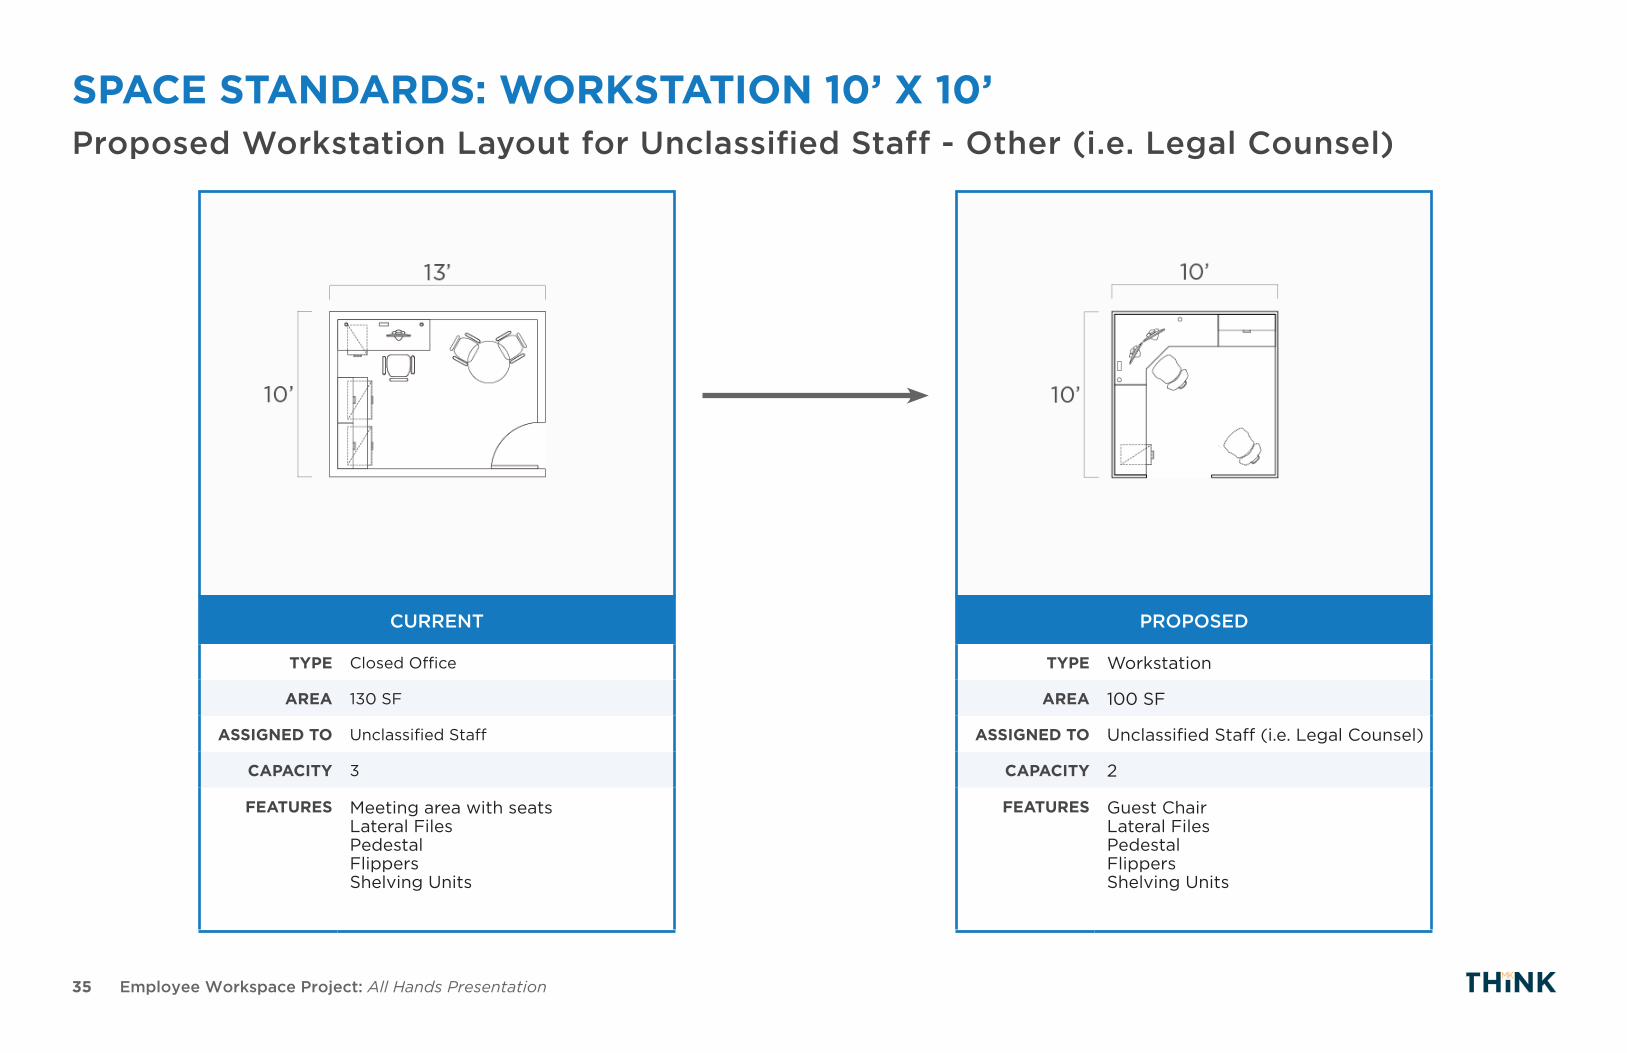
SPACE STANDARDS: WORKSTATION 10’ X 10’Proposed Workstation Layout for Unclassified Staff - Other (i.e. Legal Counsel)
PROPOSED
TYPE Workstation
AREA 100 SF
ASSIGNED TO Unclassified Staff (i.e. Legal Counsel)
CAPACITY 2
FEATURES Guest ChairLateral FilesPedestalFlippersShelving Units
CURRENT
TYPE Closed Office
AREA 130 SF
ASSIGNED TO Unclassified Staff
CAPACITY 3
FEATURES Meeting area with seatsLateral FilesPedestalFlippersShelving Units
36 Employee Workspace Project: All Hands Presentation
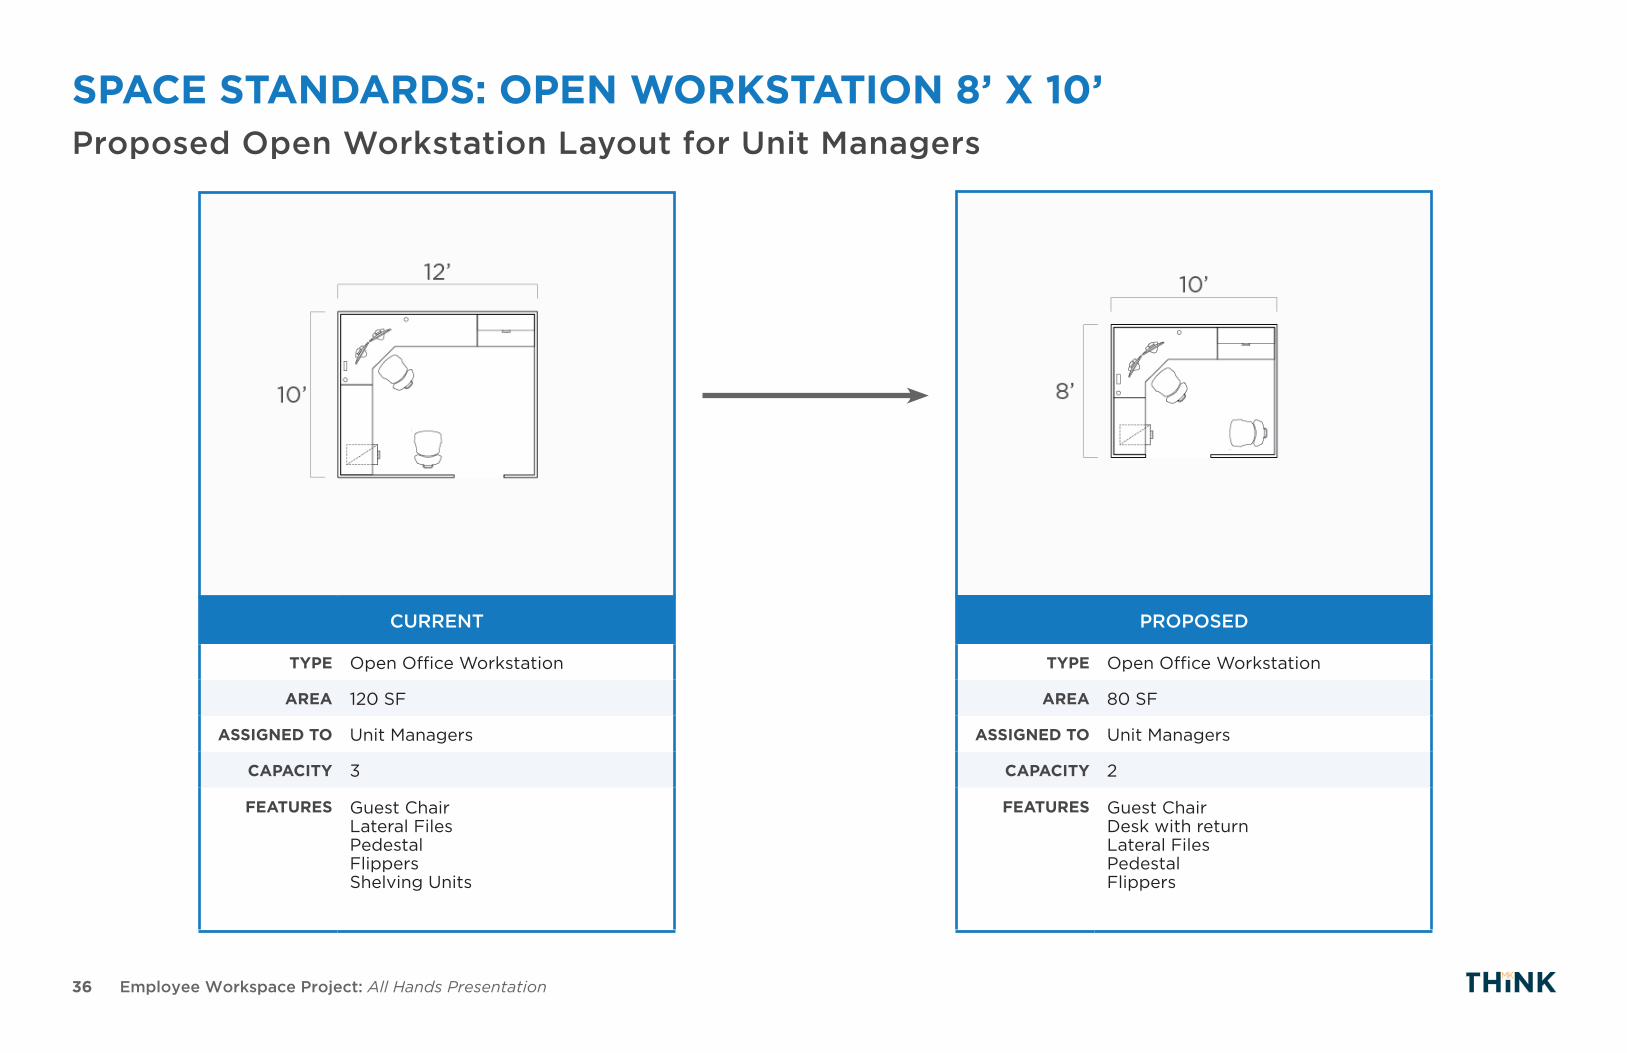
SPACE STANDARDS: OPEN WORKSTATION 8’ X 10’Proposed Open Workstation Layout for Unit Managers
CURRENT
TYPE Open Office Workstation
AREA 120 SF
ASSIGNED TO Unit Managers
CAPACITY 3
FEATURES Guest ChairLateral FilesPedestalFlippersShelving Units
PROPOSED
TYPE Open Office Workstation
AREA 80 SF
ASSIGNED TO Unit Managers
CAPACITY 2
FEATURES Guest ChairDesk with returnLateral FilesPedestalFlippers

37 Employee Workspace Project: All Hands Presentation
SPACE STANDARDS: OPEN WORKSTATION 8’ X 8’Proposed Open Workstation Layout for General Staff Focused (Design & Engineering)
CURRENT
TYPE Open Office Workstation
AREA 80 SF
ASSIGNED TO General Staff
CAPACITY 1
FEATURES Desk with returnLateral FilesPedestalFlippersDual Monitors
PROPOSED
TYPE Open Office Workstation
AREA 64 SF
ASSIGNED TO General Staff Focused Design & Engineering
CAPACITY 1
FEATURES Desk with returnLateral FilesPedestal, FlippersDual Monitors
38 Employee Workspace Project: All Hands Presentation
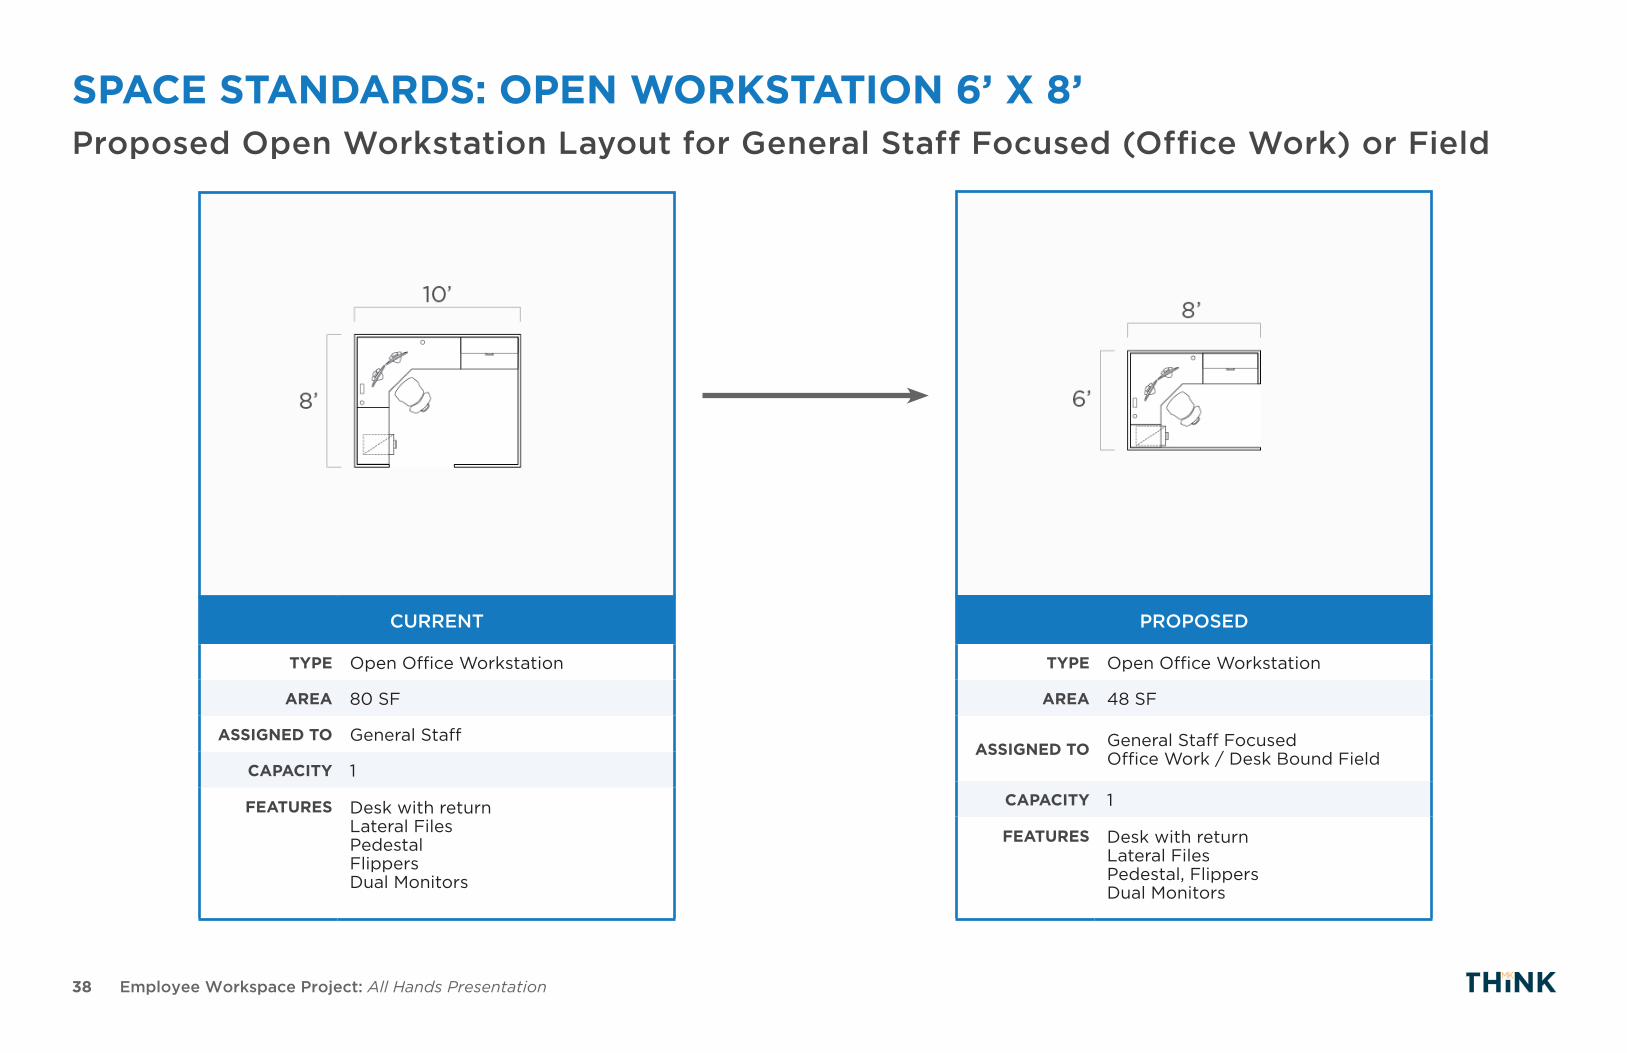
SPACE STANDARDS: OPEN WORKSTATION 6’ X 8’Proposed Open Workstation Layout for General Staff Focused (Office Work) or Field
CURRENT
TYPE Open Office Workstation
AREA 80 SF
ASSIGNED TO General Staff
CAPACITY 1
FEATURES Desk with returnLateral FilesPedestalFlippersDual Monitors
PROPOSED
TYPE Open Office Workstation
AREA 48 SF
ASSIGNED TO General Staff Focused Office Work / Desk Bound Field
CAPACITY 1
FEATURES Desk with returnLateral FilesPedestal, FlippersDual Monitors

39 Employee Workspace Project: All Hands Presentation
SPACE STANDARDS: OPEN WORKSTATION 5’ X 5’Proposed Open Workstation Layout for General Staff Field or Temp/Contract/Intern
CURRENT
TYPE Open Office Workstation
AREA 80 SF
ASSIGNED TO Temp/Contract/Intern
CAPACITY 2
FEATURES DeskPedestalFlippers2 Single Monitors
PROPOSED
TYPE Open Office Workstation
AREA 25 SF
ASSIGNED TO GS Field or Temp/Contract/Intern
CAPACITY 1
FEATURES DeskPedestalSingle Monitor

40 Employee Workspace Project: All Hands Presentation
7.5’
8’
16’
11.25’
15'
20'22.5’
16’
SPACE STANDARDS: MEETING ROOM OPTIONS
dry-erase whiteboard
paint
LCD Screen w/wall mounted PC or Microsoft
Surface Hub
LCD Screen w/wall mounted PC or Microsoft
Surface Hub
LCD Screen w/wall mounted PC or Microsoft
Surface Hub
glass frontage
dry-erase whiteboard
paint
glass frontage
glass frontage
dry-erase whiteboard
paint
glass frontage
dry-erase whiteboard
paint
sliding door
LARGE MEETING ROOM
CAPACITY 12
AREA 360 SF
RATIO 1 / 200 SEATS
MEDIUM MEETING ROOM
CAPACITY 10
AREA 300 SF
RATIO 2 / 100 SEATS
SMALL MEETING ROOM
CAPACITY 6
AREA 180 SF
RATIO 2 / 100 SEATS
PHONE BOOTH
CAPACITY 2
AREA 60 SF
RATIO 3-4 / 100 SEATS
Provide ample opportunities for job functions to convene and accommodate technology needs of different departments.

41 Employee Workspace Project: All Hands Presentation
EXAMPLE: UPDATING WORKSTATIONS IN HEADQUARTERS
2017 2018 2019 2020 2021 2022 2023 2024 2025 2026 2027 2028 2029 2030
Jan - Dec Jan - Dec Jan - Dec Jan - Jun Jul - Dec Jan - Jun Jul - Dec Jan - Jun Jul - Dec Jan - Dec Jan - Dec Jan - Dec Jan - Dec Jan - Dec Jan - Dec Jan - Dec Jan - Dec0K
5K
10K
15K
20K
25K
30K
35K
40K
45K
50K
55K
60K
65K
70K
75K
80K
Gai
ned
Area
SF
80,1
63
80,1
63
80,1
63
77,0
50
74,7
275,
436
12,1
04
71,3
69
68,0
59
8,79
4
14,8
95
15,8
26
65,2
68
64,3
37
15,8
2664
,337
15,8
2664
,337
15,8
2664
,337
15,8
2664
,337
15,8
2664
,337
15,8
2664
,337
15,8
2664
,337
15,8
2664
,337
Scenario 1 - Area Gained By Rightsizing Workstations in Headquarters Building
AREA GAINED BY UPDATING WORKSTATIONSHEADQUARTERS BUILDING, 8’ X 8’ AND 8’ X 6’ WORKSTATION MIX
Area Gained By Rightsizing
Gained Area
Area For Existing Workstations and Other Space Types
42 Employee Workspace Project: All Hands Presentation
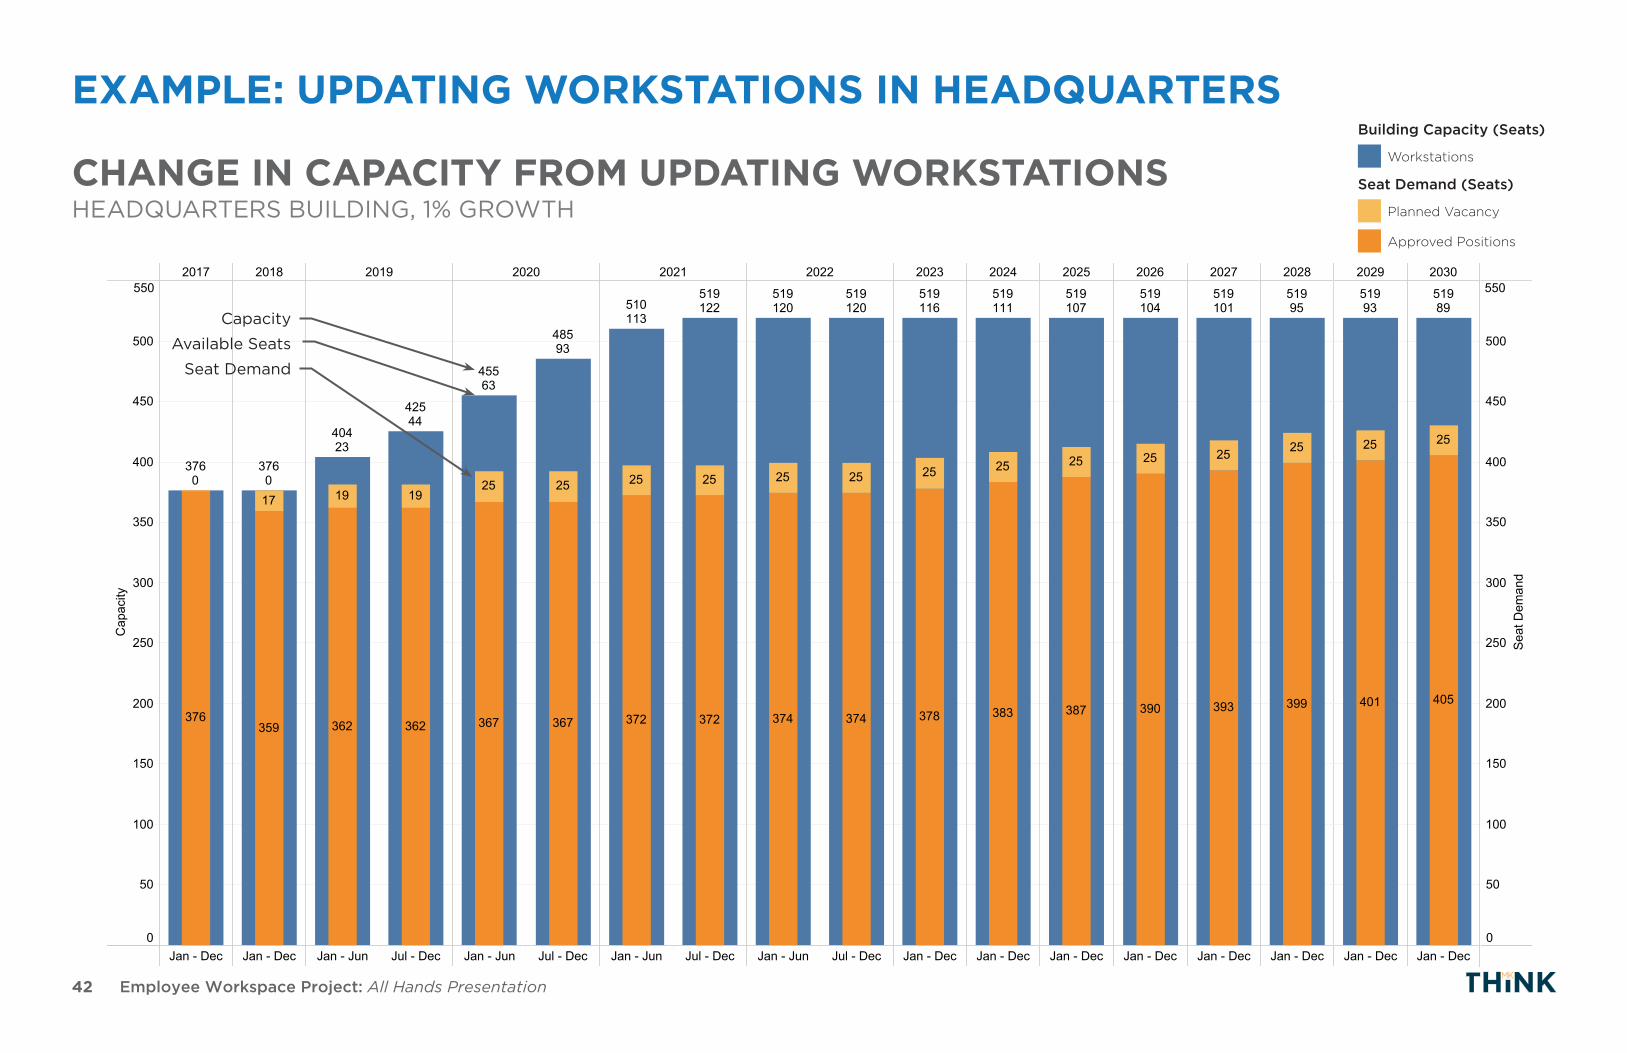
EXAMPLE: UPDATING WORKSTATIONS IN HEADQUARTERS
2017 2018 2019 2020 2021 2022 2023 2024 2025 2026 2027 2028 2029 2030
Jan - Dec Jan - Dec Jan - Jun Jul - Dec Jan - Jun Jul - Dec Jan - Jun Jul - Dec Jan - Jun Jul - Dec Jan - Dec Jan - Dec Jan - Dec Jan - Dec Jan - Dec Jan - Dec Jan - Dec Jan - Dec0
50
100
150
200
250
300
350
400
450
500
550
Cap
acity
0
50
100
150
200
250
300
350
400
450
500
550
Seat
Dem
and
3760
376
3760
359
17
40423
42544
362 362
19 19
45563
48593
367 367
25 25
510113
519122
372 372
25 25
519120
519120
374 374
25 25
519116
378
25
519111
383
25
519107
387
25
519104
390
25
519101
393
25
51995
399
25
51993
401
25
51989
405
25
Scenario 1 - Change in Capacity Due to Rightsizing Workstations in Headquarters Building
CHANGE IN CAPACITY FROM UPDATING WORKSTATIONSHEADQUARTERS BUILDING, 1% GROWTH
Building Capacity (Seats)
Seat Demand (Seats)
Workstations
Planned Vacancy
Approved Positions
Capacity
Available Seats
Seat Demand
43 Employee Workspace Project: All Hands Presentation
2030
Headquarters Administration MaintenanceOffice Building
Blossom HillAnnex
Crest Water QualityLab
Santa TeresaOffice
0
50
100
150
200
250
300
350
400
450
500
550
Cap
acity
1
0
50
100
150
200
250
300
350
400
450
500
550
Seat
Dem
and
- 0%
519199
132-2
54-1 37
0 21-4
23-2
7124
295
127
25
5537 25 25
47
Scenario 1 - Capacity and Seat Demand Projections - 0% Growth, 20302030
Headquarters Administration MaintenanceOffice Building
Blossom HillAnnex
Crest Water QualityLab
Santa TeresaOffice
0
50
100
150
200
250
300
350
400
450
500
550
Cap
acity
1
0
50
100
150
200
250
300
350
400
450
500
550
Seat
Dem
and
- 1%
132-19
51989
54-9 37
-4 21-4
23-5
7119
405
144
25
6341
25 2852
Scenario 1 - Capacity and Seat Demand Projections - 1% Growth, 2030
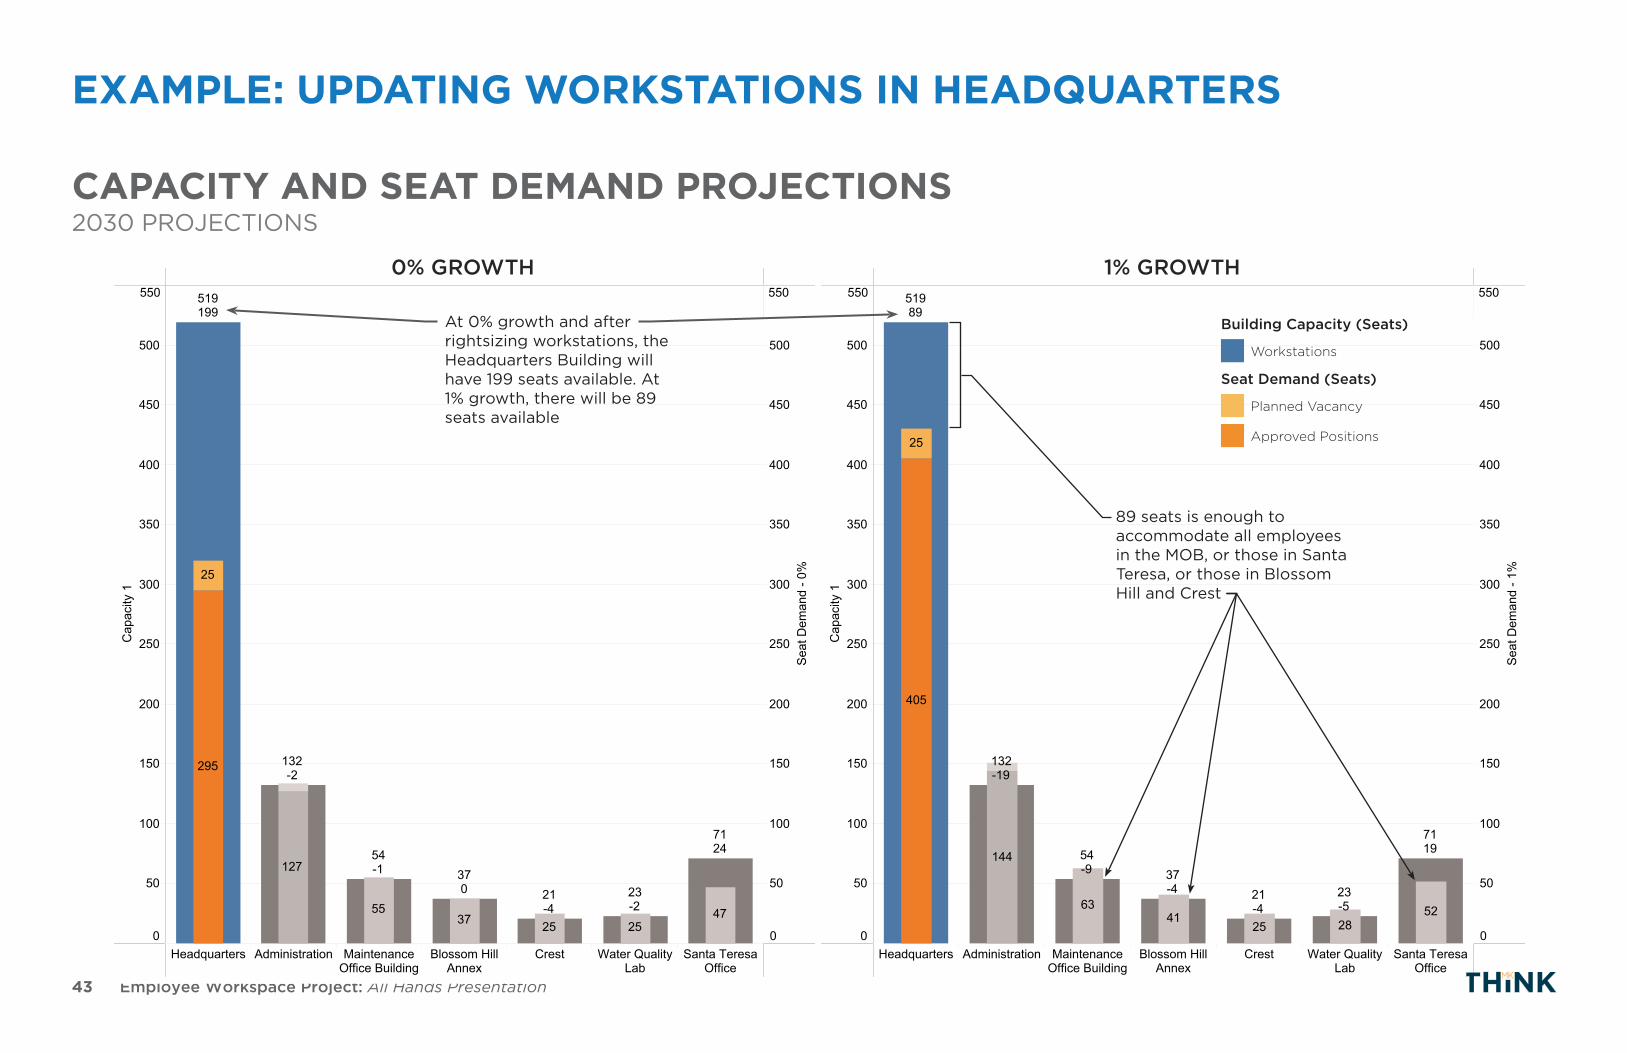
CAPACITY AND SEAT DEMAND PROJECTIONS2030 PROJECTIONS
0% GROWTH 1% GROWTH
Building Capacity (Seats)
Seat Demand (Seats)
Workstations
Planned Vacancy
Approved Positions
At 0% growth and after rightsizing workstations, the Headquarters Building will have 199 seats available. At 1% growth, there will be 89 seats available
89 seats is enough to accommodate all employees in the MOB, or those in Santa Teresa, or those in Blossom Hill and Crest
EXAMPLE: UPDATING WORKSTATIONS IN HEADQUARTERS
44 Employee Workspace Project: All Hands Presentation
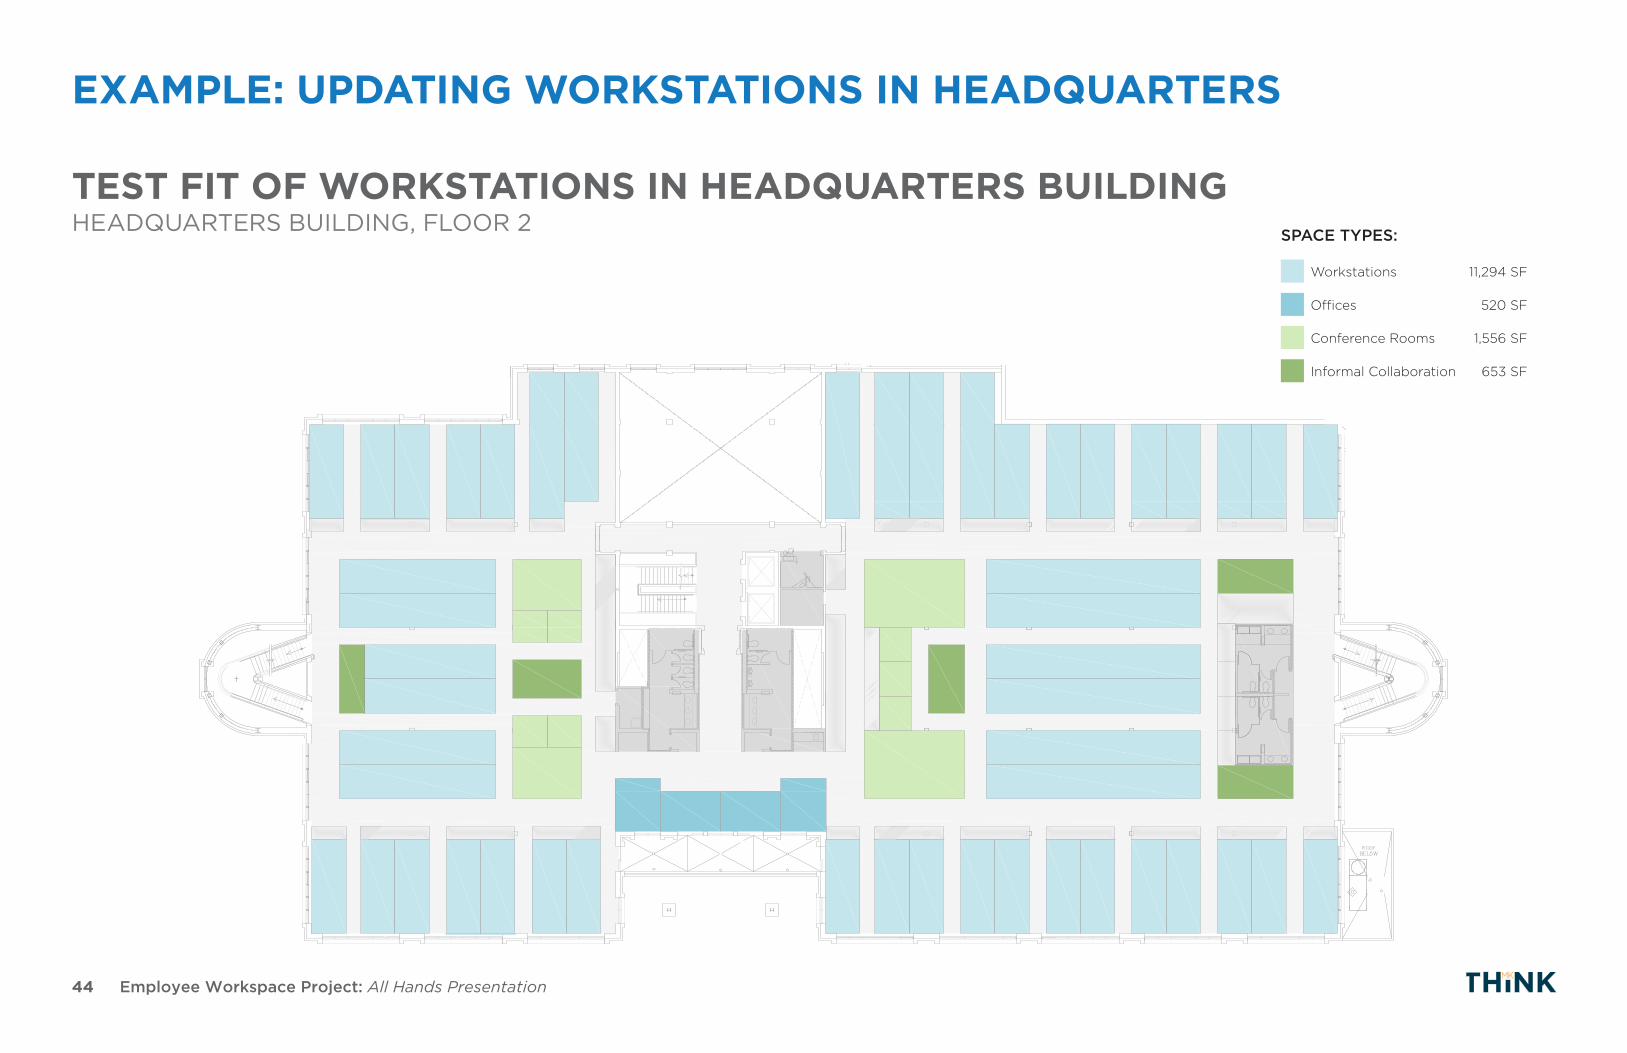
TEST FIT OF WORKSTATIONS IN HEADQUARTERS BUILDINGHEADQUARTERS BUILDING, FLOOR 2 SPACE TYPES:
Workstations 11,294 SF
Offices 520 SF
Conference Rooms 1,556 SF
Informal Collaboration 653 SF
EXAMPLE: UPDATING WORKSTATIONS IN HEADQUARTERS
45 Employee Workspace Project: All Hands Presentation
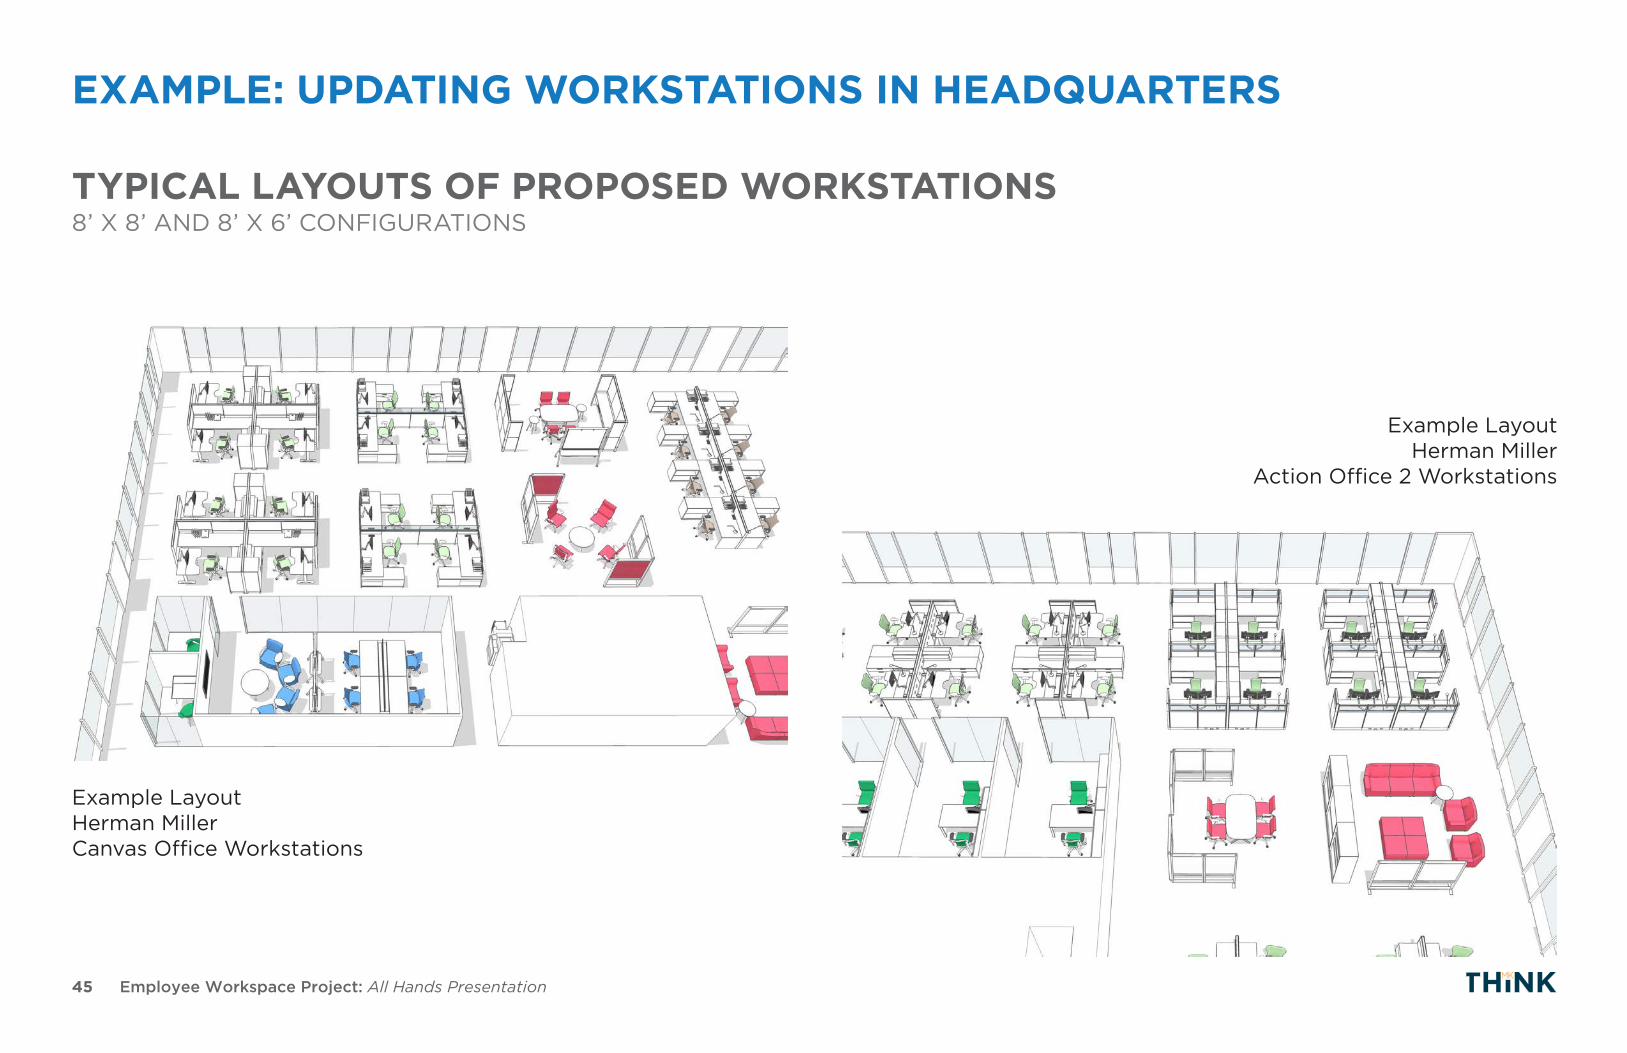
Example LayoutHerman MillerCanvas Office Workstations
Example LayoutHerman Miller
Action Office 2 Workstations
TYPICAL LAYOUTS OF PROPOSED WORKSTATIONS8’ X 8’ AND 8’ X 6’ CONFIGURATIONS
EXAMPLE: UPDATING WORKSTATIONS IN HEADQUARTERS
46 Employee Workspace Project: All Hands Presentation
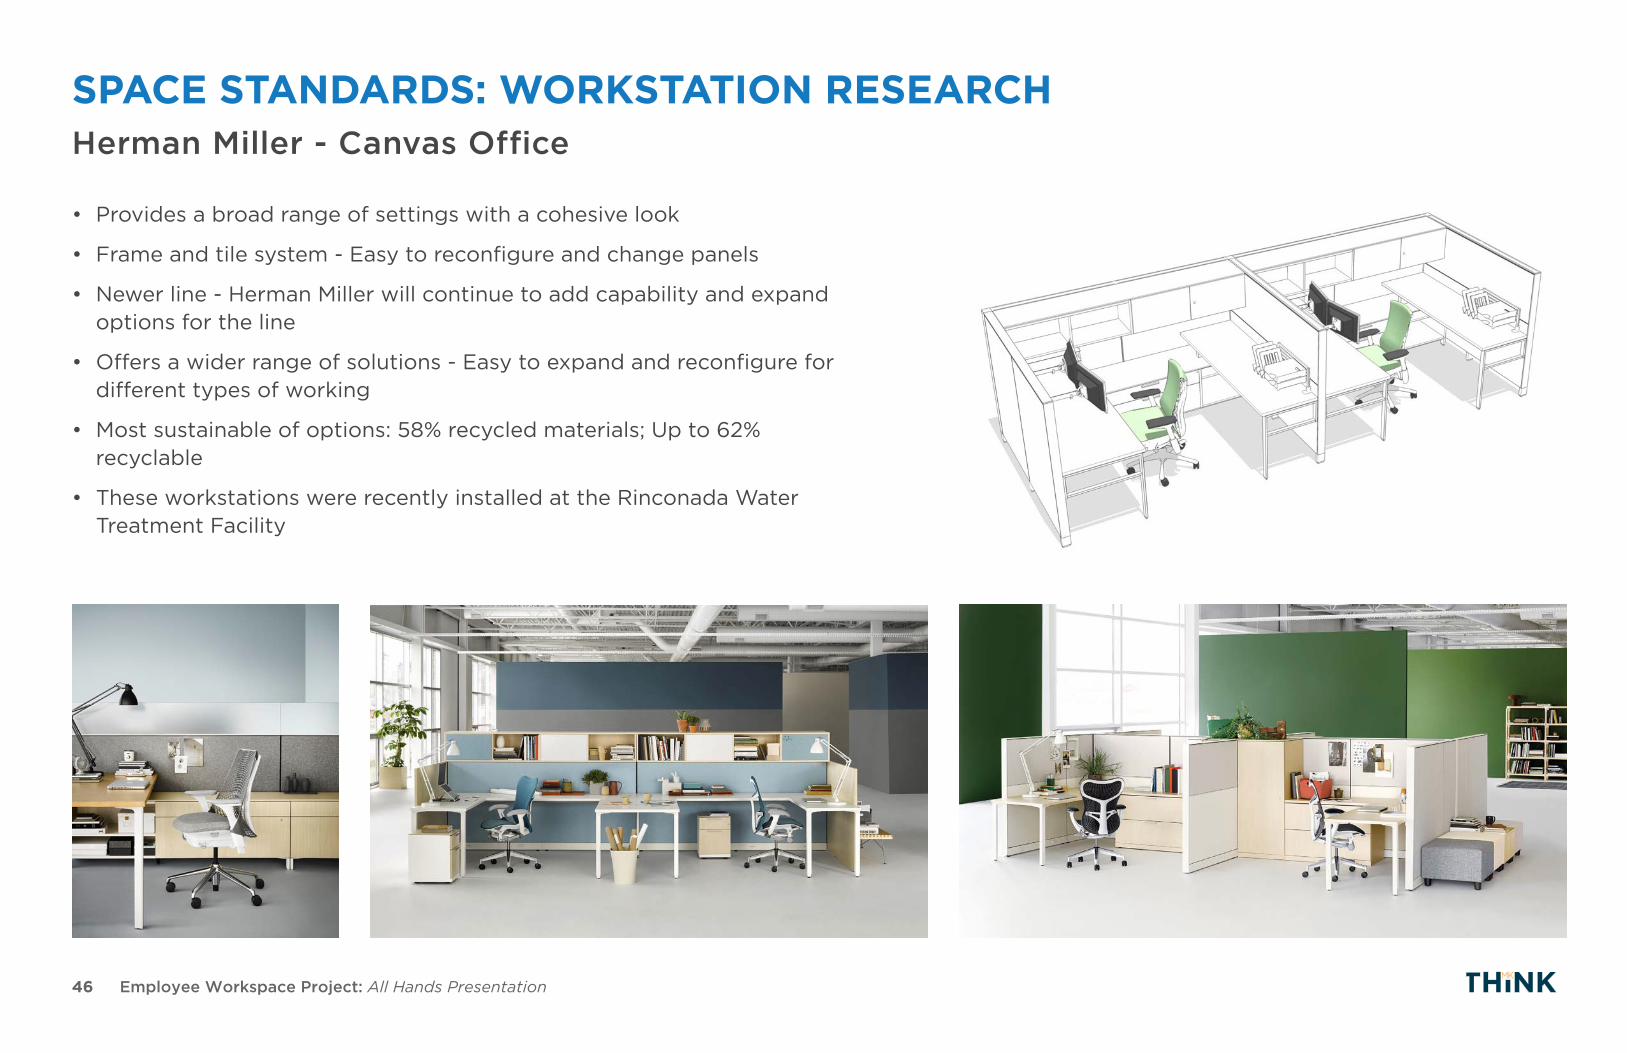
SPACE STANDARDS: WORKSTATION RESEARCH
Setting Type: Hive
Footprint: 6 x 8
Planning Type: Mid-to-High Enclosure
Product Line(s): Canvas Office Landscape®
Embody® Chairs
Flo™ Monitor Arm
HIVE 034
• Provides a broad range of settings with a cohesive look
• Frame and tile system - Easy to reconfigure and change panels
• Newer line - Herman Miller will continue to add capability and expand options for the line
• Offers a wider range of solutions - Easy to expand and reconfigure for different types of working
• Most sustainable of options: 58% recycled materials; Up to 62% recyclable
• These workstations were recently installed at the Rinconada Water Treatment Facility
Herman Miller - Canvas Office

47 Employee Workspace Project: All Hands Presentation
SPACE STANDARDS: WORKSTATION RESEARCHHerman Miller - Action Office 2
• Monolithic tile system as opposed to frame and tile system - More effort to make changes
• Marginally cheaper than Canvas Landscape
• Integrates with existing SCVWD workstation panel system (Action Office 1 (AO1))
• Least sustainable of options: 43% recycled materials; Up to 34% recyclable
Setting Type: Hive
Footprint: 6 x 8
Planning Type: Mid-to-High Enclosure
Product Line(s): Action Office® System
Tu® Storage
Embody® Chairs
Flo™ Monitor Arm
HIVE 040
48 Employee Workspace Project: All Hands Presentation
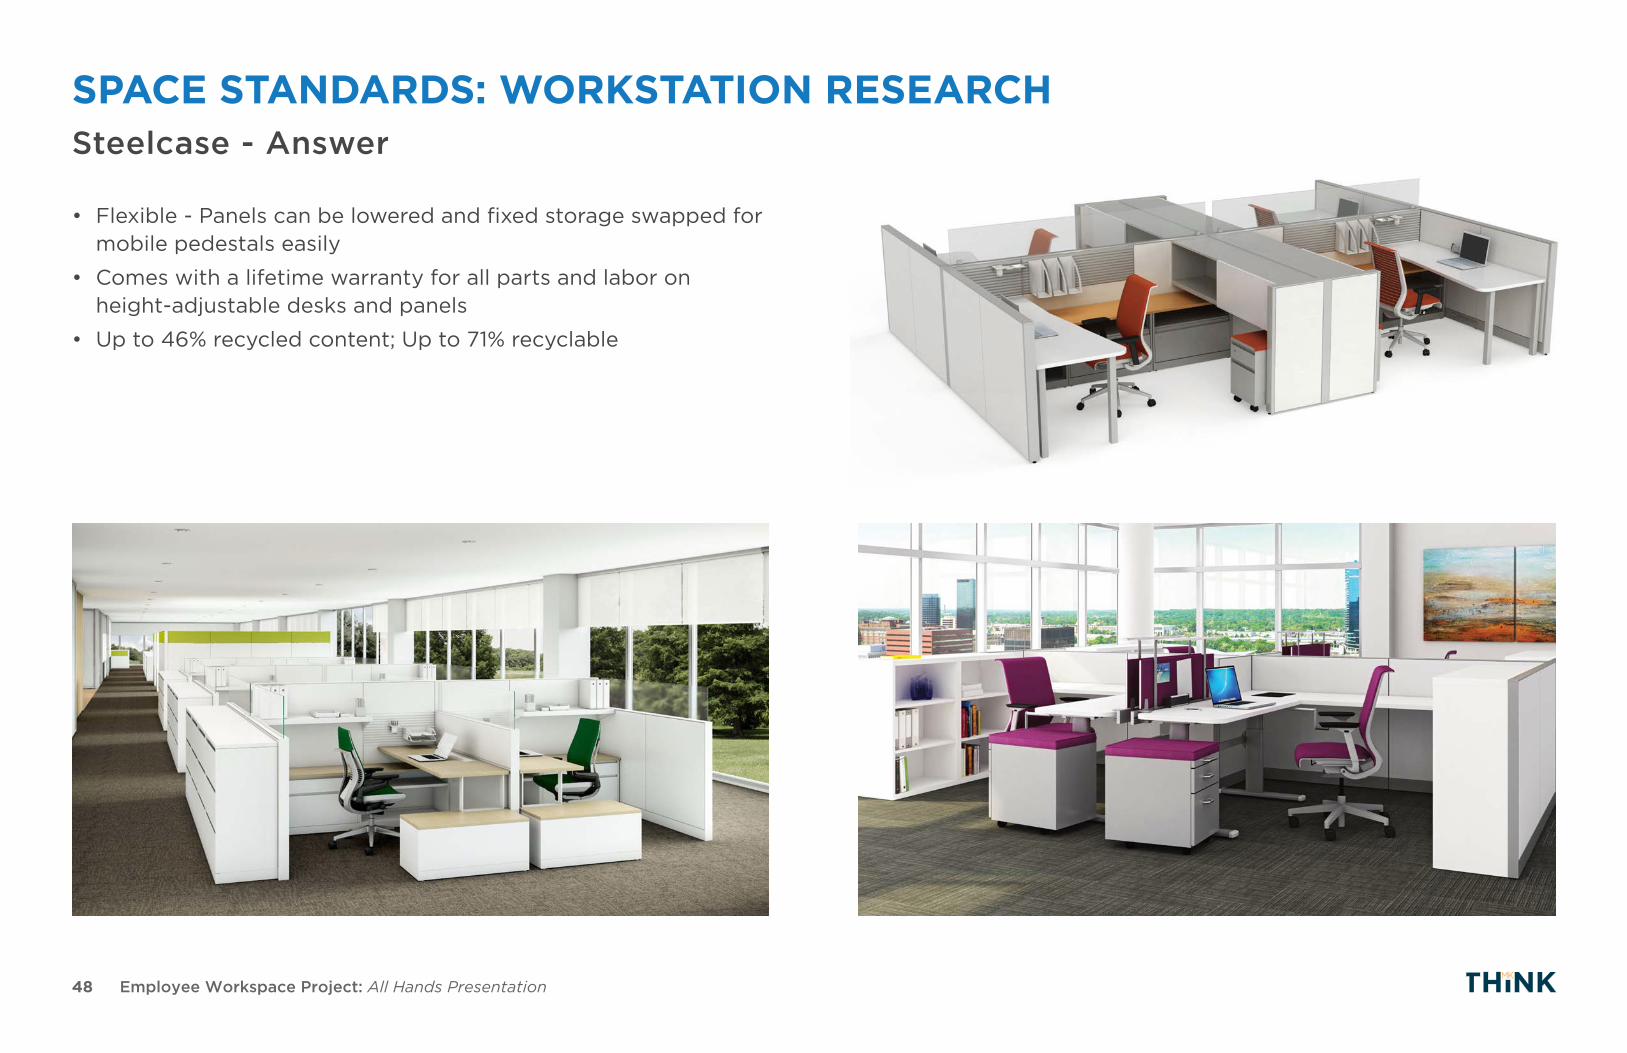
SPACE STANDARDS: WORKSTATION RESEARCHSteelcase - Answer
• Flexible - Panels can be lowered and fixed storage swapped for mobile pedestals easily
• Comes with a lifetime warranty for all parts and labor on height-adjustable desks and panels
• Up to 46% recycled content; Up to 71% recyclable
49 Employee Workspace Project: All Hands Presentation
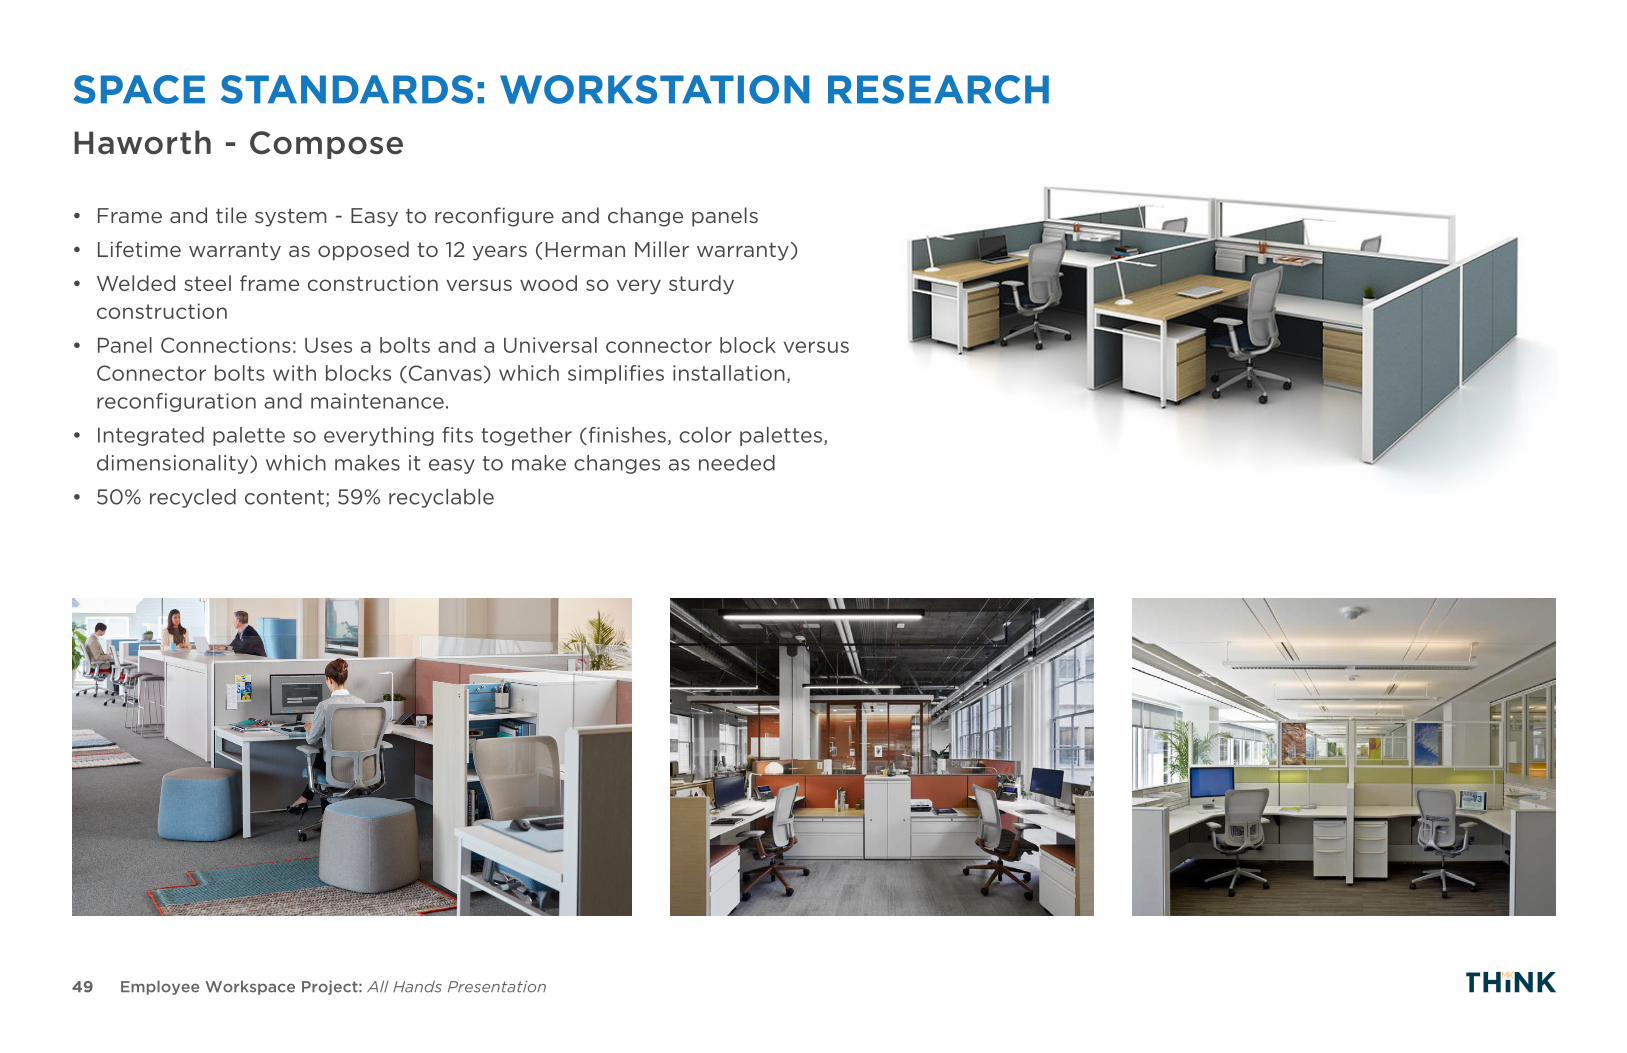
SPACE STANDARDS: WORKSTATION RESEARCHHaworth - Compose
• Frame and tile system - Easy to reconfigure and change panels
• Lifetime warranty as opposed to 12 years (Herman Miller warranty)
• Welded steel frame construction versus wood so very sturdy construction
• Panel Connections: Uses a bolts and a Universal connector block versus Connector bolts with blocks (Canvas) which simplifies installation, reconfiguration and maintenance.
• Integrated palette so everything fits together (finishes, color palettes, dimensionality) which makes it easy to make changes as needed
• 50% recycled content; 59% recyclable

50 Employee Workspace Project: All Hands Presentation
SPACE STANDARDS: WORKSPACE NOISE & EMPLOYEE SATISFACTION
Jungsoo Kim and Richard De DearCenter on the Built EnvironmentUniversity of Sydney
Sound privacy is almost equal levels of frustration between high partition cubi-cles and low partition cubicles.- University of Sydney
Adding more sound to an environment can actually make it seem quieter. Re-search suggests that noise itself isn’t distracting, but unwanted speech noise is. - Harvard Business Review
Sound level in the average office is probably quieter than it was in the crowded Paris bistro where Hemingway says he wrote his best work - Herman Miller

51 Employee Workspace Project: All Hands Presentation
WORKPLACE & TECHNOLOGY POLICYSuccess of alternative workplace strategies hinges on the SCVWD’s effort to integrate technology and policy solutions that support District work and workspaces.
• Noise
• Mobile Device
Desk Etiquette Flex Work Schedule and Location
Technology Policy
• Compressed Workweek
• Telecommute
• Remote Work
• Right Tools for the Right People
• Automate Manual Process
• Enhance Collaboration
4NEXT STEPSWhat is coming next?
53 Employee Workspace Project: All Hands Presentation
PRELIMINARY, CONFIDENTIAL and NOT FOR DISTRIBUTION October 2016
Conceptual Organizational Model (COM)A COM is a graphical representation of hierarchies, adjacencies, and relationships. We will begin by modeling existing formations and work with SCVWD to rearrange, reshape, and re-imagine new adjacencies as we work together to iterate towards a final desired model.
Utilization and Occupancy StudyUtilization is the number of hours a particular space is being used, while occupancy is the ratio of people-to-capacity for a given room during a specified time. Both occupancy and utilization play a major role in the understanding how e�ectively and e�ciently spaces are being used.
Workplace ProgrammingA Space Program is a table of all the designated spaces in a room, building, or site, which are grouped by program categories and sub-categories. The table includes room counts, capacities, and square footages of these spaces.
Design GuidelinesDesign Guidelines are spatial recommendations to guide re-design and future design of SCVWD’s workspaces. The Design Guidelines will include Design Standards, Block Space Plans, and Typical Layouts. The Guidelines will be informed by our work with SCVWD as part of the Discovery and Assessment phases and best practices.
As MKThink works with Santa Clara Valley Water District (SCVWD) to develop a Workspace Strategy from 2016 to 2017, we will utilize numerous strategic tools to help us arrive at the best possible solution, together.
2016
2017
Project Kick-o� Meeting
TO BE DECIDED
10/18
MKTHINK 6-STEP PROCESS
Measure current conditions, refine assignments, and establish baseline.
DISCOVERY
ASSESSMENT
STRATEGY
PLANNING & DESIGN
PROTOTYPE & TESTING
IMPLEMENTATION
Identify opportunities and associated benefits based on analytic frame-work.
Define programmatic and spatial initiatives required to achieve goal.
Develop content specific initiatives identified in Strategic Master Plan.
Test critical components of program/design solution and refine.
Implement project(s) according to scope, schedule and budget parameters.
1
2
3
4
5
6
STRATEGIC TOOLS IMPORTANT MEETING DATES
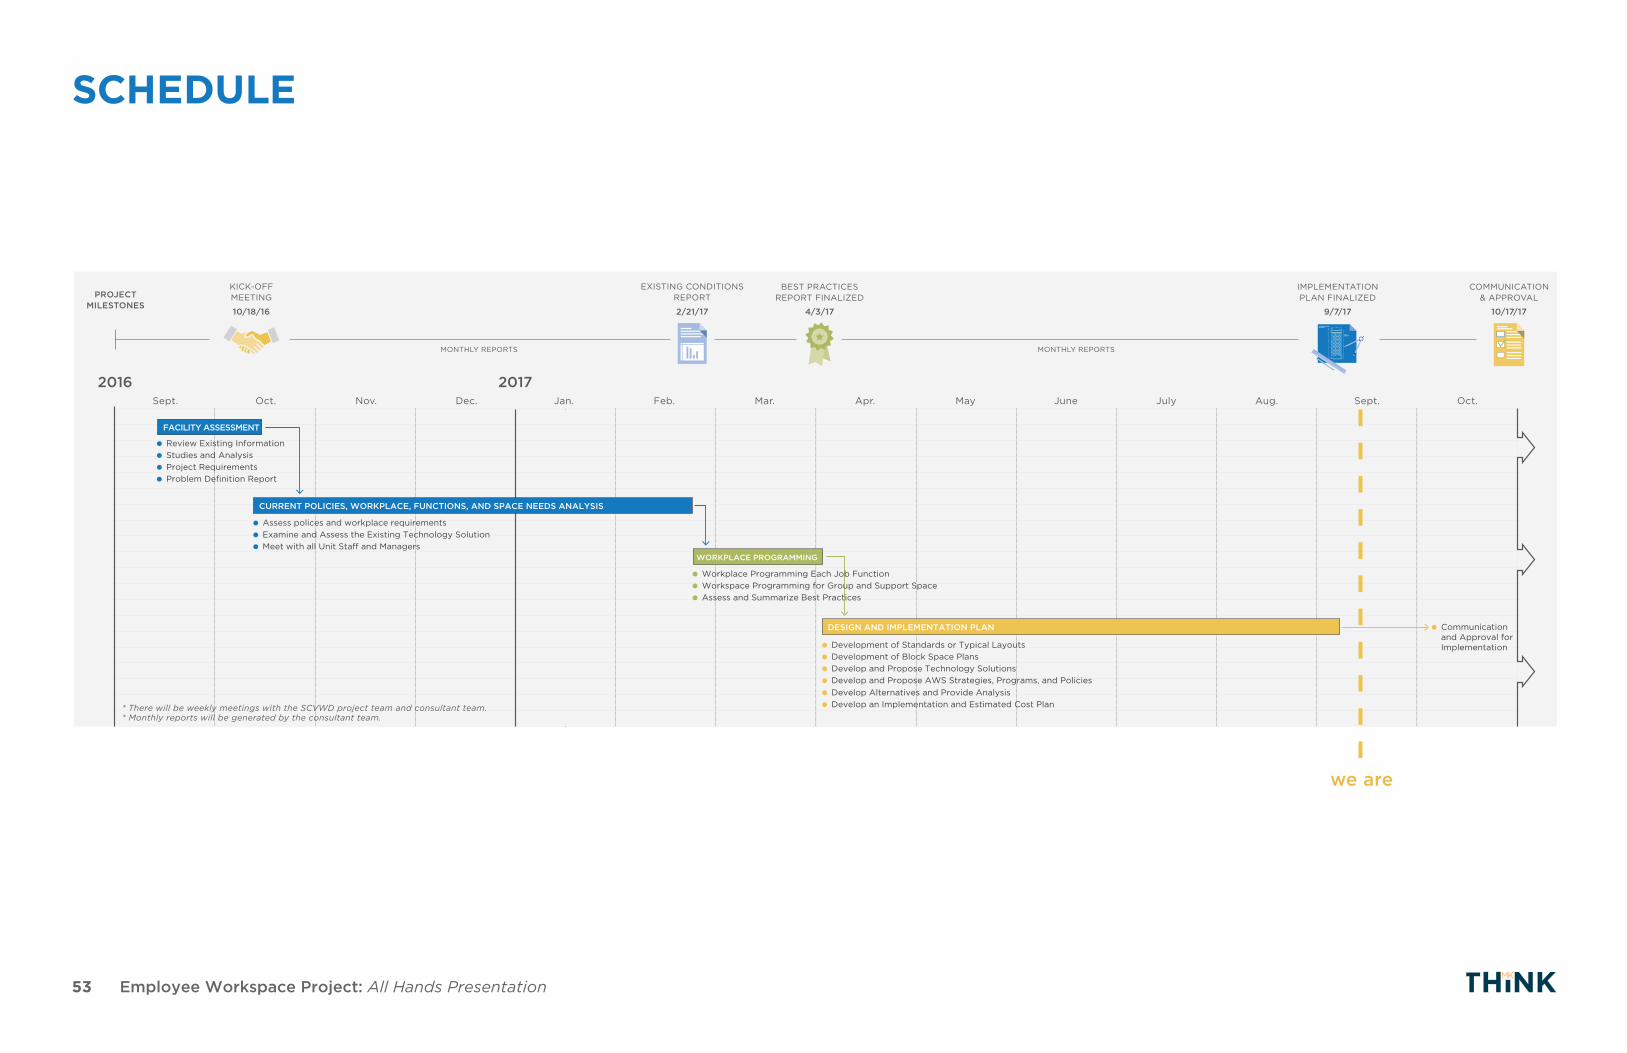
FACILITY ASSESSMENT
Review Existing InformationStudies and AnalysisProject RequirementsProblem Definition Report
Development of Standards or Typical Layouts
Communicationand Approval forImplementation
Development of Block Space PlansDevelop and Propose Technology SolutionsDevelop and Propose AWS Strategies, Programs, and PoliciesDevelop Alternatives and Provide AnalysisDevelop an Implementation and Estimated Cost Plan
Workplace Programming Each Job FunctionWorkspace Programming for Group and Support SpaceAssess and Summarize Best Practices
Assess polices and workplace requirementsExamine and Assess the Existing Technology SolutionMeet with all Unit Sta� and Managers
CURRENT POLICIES, WORKPLACE, FUNCTIONS, AND SPACE NEEDS ANALYSIS
WORKPLACE PROGRAMMING
DESIGN AND IMPLEMENTATION PLAN
2016 2017
COMMUNICATION& APPROVALPROJECT
MILESTONES10/18/16 2/21/17 4/3/17 9/7/17 10/17/17
KICK-OFFMEETING
MONTHLY REPORTS MONTHLY REPORTS
EXISTING CONDITIONS REPORT
Sept. Oct. Nov. Dec. Jan. Feb. Mar. Apr. May June July Aug. Sept. Oct.
IMPLEMENTATIONPLAN FINALIZED
BEST PRACTICES REPORT FINALIZED
SANTA CLARA VALLEY WATER DISTRICT WORKSPACE PROJECT
* There will be weekly meetings with the SCVWD project team and consultant team.* Monthly reports will be generated by the consultant team.
we are
SCHEDULE

54 Employee Workspace Project: All Hands Presentation
NEXT STEPS
Communications:
•Collect feedback from employees as related to workspace project
•Present options analysis and employee feedback to Chiefs for direction and approval
Options Analysis:
•Refine scenario models based on District feedback
•Develop quantitative District-wide program for facilities and implementation plan for updates
• Finalize report to include all analyses and recommendations
Block Space Plans:
•Develop layouts and sample block space plans for team workspace in preferred scenario model
•Develop typical layouts for workstations
• Future tasks may include detailed planning of specific floors and buildings
55 Employee Workspace Project: All Hands Presentation
QUESTIONS / COMMENTS / FEEDBACK
?
56 Employee Workspace Project: All Hands Presentation
Rinconada Treatment Facility Coyote Modular1Santa Teresa Treatment
Facility PWTP Ozonification Facility Coyote Modular2 Vasona Pump Facility AWPC Trailer1 Penitencia Treatment Facility
2015
2020
2025
2030
2015
2020
2025
2030
2015
2020
2025
2030
2015
2020
2025
2030
2015
2020
2025
2030
2015
2020
2025
2030
2015
2020
2025
2030
2015
2020
2025
2030
0
5
10
15
20
25
30
35
40
45
50
Cap
acity
0
5
10
15
20
25
30
35
40
45
50
Seat
Dem
and
(0%
)
-3 -3 -3 -3-3 -3 -3 -3
0 0 0 0 0 0 0 0 0 0 0 0 0 0 -9 -9 -9 -9-9 -9 -9 -90 0 0 0 0 0 0 0 0 0 0 0 0 0
0 0 0 0 0 0 0 0 0 0 0 0 0 0
-1 -1 -1 -1 -1 -1 -1
0 0 0 0 0 0 0 0 0 0 0 0 0 0 -9 -9 -9 -9 -9 -9 -9
Capacity and Seat Deamand Projections - 0% Growth, 2017 - 2030
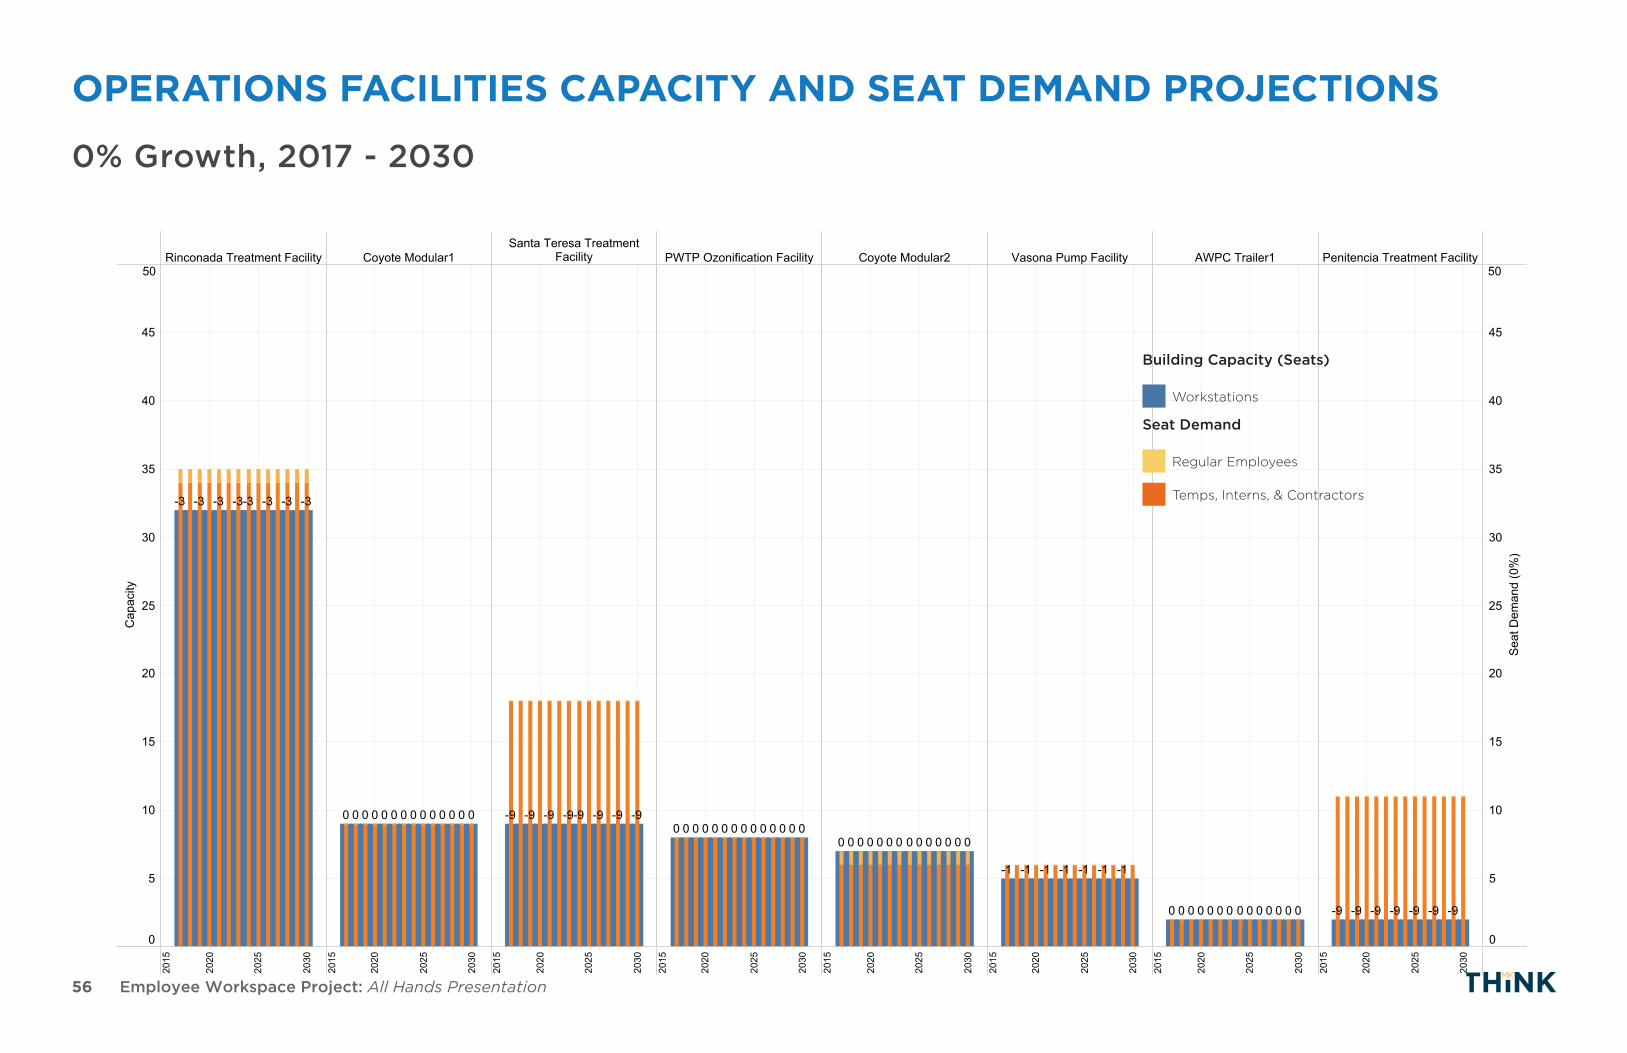
OPERATIONS FACILITIES CAPACITY AND SEAT DEMAND PROJECTIONS
Building Capacity (Seats)
Seat Demand
Workstations
Regular Employees
Temps, Interns, & Contractors
0% Growth, 2017 - 2030
57 Employee Workspace Project: All Hands Presentation
Rinconada Treatment Facility Coyote Modular1Santa Teresa Treatment
Facility PWTP Ozonification Facility Coyote Modular2 Vasona Pump Facility AWPC Trailer1 Penitencia Treatment Facility
2015
2020
2025
2030
2015
2020
2025
2030
2015
2020
2025
2030
2015
2020
2025
2030
2015
2020
2025
2030
2015
2020
2025
2030
2015
2020
2025
2030
2015
2020
2025
2030
0
5
10
15
20
25
30
35
40
45
50
Cap
acity
0
5
10
15
20
25
30
35
40
45
50
Seat
Dem
and
(1%
)
-10 -13-3 -4 -5 -7-8 -9
-1 -1 -1 -2 -2 -30 0 0 -10 -11 -12 -12 -13 -15-9-1 -1 -1 -20 0 0 0 0 0
-1 -1 -20 0 0 0 0 0 0 0
-1 -1 -1 -2 -2 -2 -3
-10 0 0 0 0 0 0 0 0 0 0 0 -10 -10 -11 -11 -12 -12-9
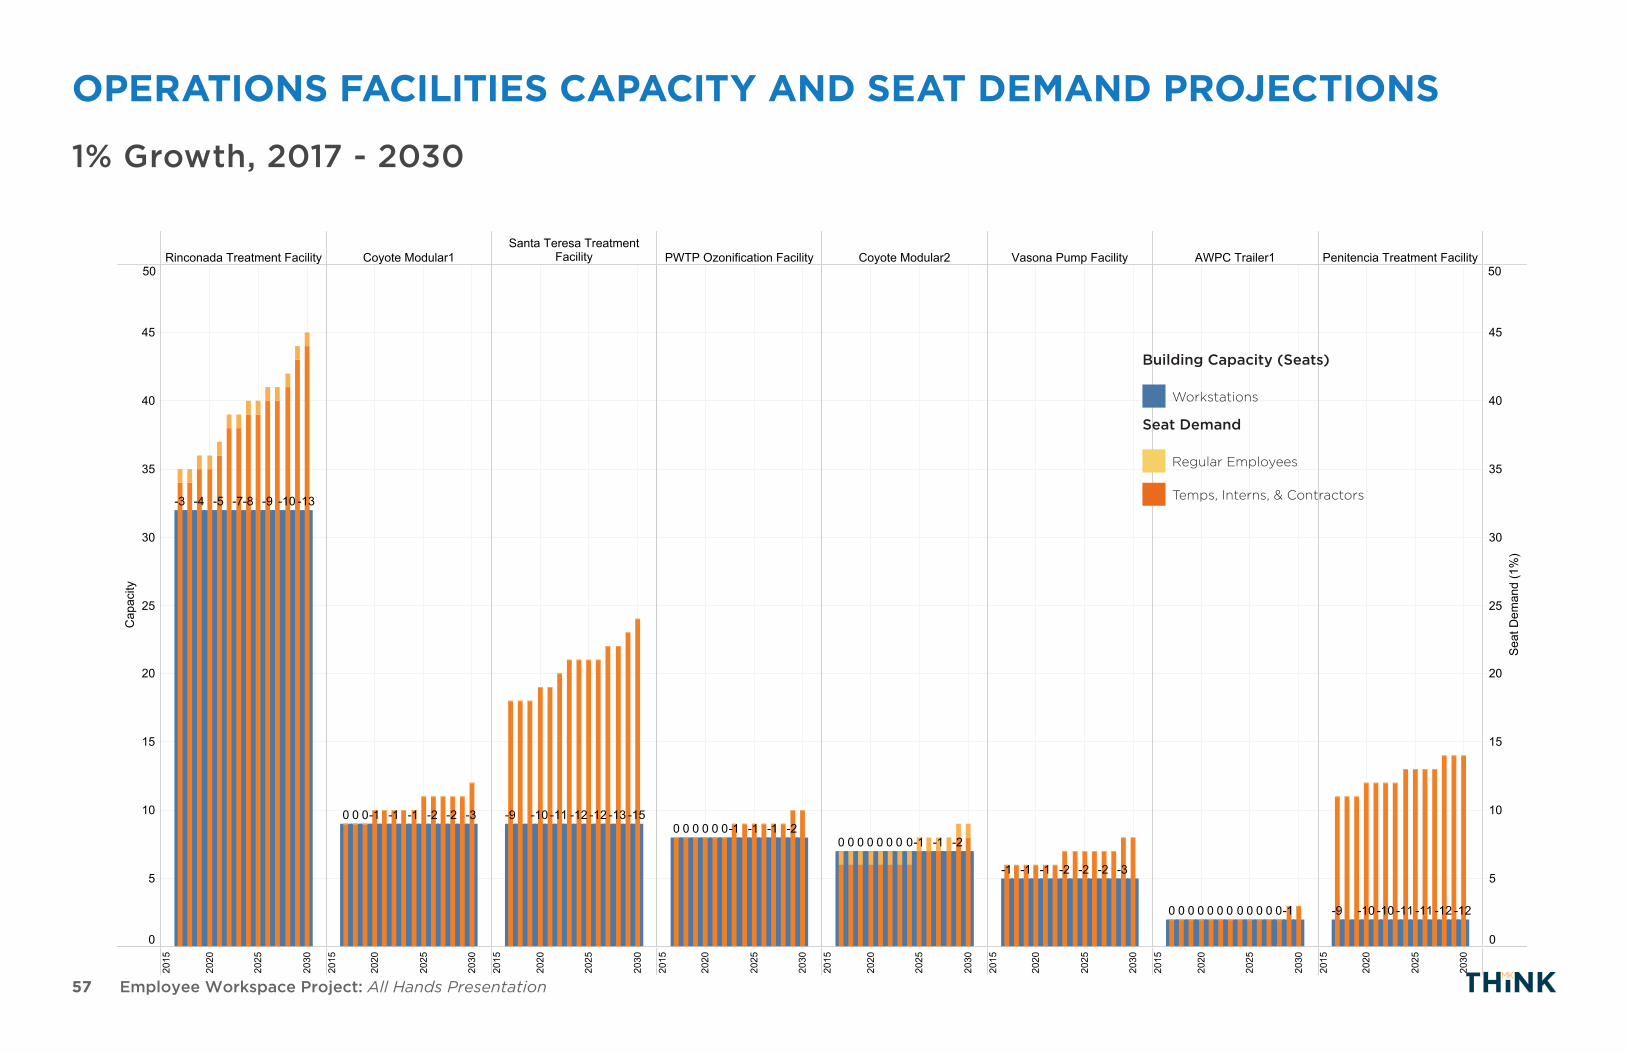
Capacity and Seat Deamand Projections - 1% Growth, 2017 - 2030
Building Capacity (Seats)
Seat Demand
Workstations
Regular Employees
Temps, Interns, & Contractors
1% Growth, 2017 - 2030
OPERATIONS FACILITIES CAPACITY AND SEAT DEMAND PROJECTIONS


