
University of Calgary
PRISM: University of Calgary's Digital Repository
Haskayne School of Business Haskayne School of Business Research & Publications
2012-06-21T19:58:23Z
Empowerment or enslavement: ICT use and work-life
balance of managers and professionals
Senarathne Tennakoon, K.L.Uthpala
http://hdl.handle.net/1880/49055
Thesis
http://creativecommons.org/licenses/by-nc-nd/3.0/
Attribution Non-Commercial No Derivatives 3.0 Unported
Downloaded from PRISM: https://prism.ucalgary.ca
UNIVERSITY OF CALGARY
Empowerment or enslavement:
ICT use and work-life balance of managers and professionals
by
K. L. Uthpala Senarathne Tennakoon
A THESIS
SUBMITTED TO THE FACULTY OF GRADUATE STUDIES
IN PARTIAL FULFILMENT OF THE REQUIREMENTS FOR THE
DEGREE OF DOCTOR OF PHILOSOPHY
HASKAYNE SCHOOL OF BUSINESS
CALGARY, ALBERTA
APRIL 2011
© K. L. Uthpala Senarathne Tennakoon 2011
ii
ABSTRACT
Information and Communication Technology (ICT) has become essential in the
global society. The Internet, e-mail, and portable communication devices, such as cellular
phones and BlackBerry®, form a technology group (referred to as the “ICT cluster”) that
has blended into everyday lives of individuals. Enabled by such technologies, the generic
slogan of “anytime, anywhere, and availability at the press of a button” captures the
current work culture trend. The boundless connectivity and access to information at all
times are expected to empower individuals by enabling them to carry out daily tasks more
efficiently. However, there is also a dark side to ICT use, involving increased hours of
work, stress, and loss of private time. While some employees enjoy compensation for the
extended work hours and their 24/7 accessibility, for most managers and professionals
who are not covered by overtime employment standards these extra hours simply increase
their daily work demands. Thus, they could feel that there is an e-leash to work, enslaving
them and adversely affect their work-life balance.
Studies have shown that the ICT cluster blurs the boundary between work and
nonwork domains. However, there is a scarcity of research addressing the implications of
ICT use on work/ nonwork interactions. Addressing this concern, this research provides
evidence on the use of the ICT cluster and its impact on work-life balance of managers
and professionals. Spanning across two countries, Canada and Sri Lanka, with substantial
differences in social, economical, and technological infrastructure landscapes, this study
also highlights country-related effects in the use and impact of the ICT cluster on work-
life balance of the target population.

iii
Anchoring on work-life border theory by Clark (2000), and work-family boundary
theory by Ashforth and colleagues (2000), the main research questions addressed in this
study are; 1) How do individuals perceive and use the ICT cluster? Are there usage
differences within the cluster? 2) How does ICT use influence individual work/nonwork
interactions? 3) How do individuals manage ICT influences on their work-life balance?
Does the technology use empower or enslave individuals in managing their work-life
balance? 4) Are we studying a universal phenomenon, or are there social, cultural, and
demographic differences that limit the generalizability of the findings on the impact of
the use of ICT cluster on individuals? Research subjects were comparable groups of
managers/ professionals from Canada and Sri Lanka who used the ICT cluster in both
work and nonwork tasks in their daily lives. The study triangulated data from a large
scale web-based survey launched in 2008 and 36 semi-structured in-depth interviews.
The study found that ICT use is related to work/ nonwork interactions which in turn
affect work-life balance of individuals. Results revealed an interesting relationship of
how a person could fall into a vicious cycle of losing one‟s work-life balance through
excessive work-related ICT use on nonwork settings, where such use can lead to an
increase in cross-domain conflict and reduction in cross-domain enrichment. Thus, the
study did support the notion that ICT could create an e-leash to work domain, enslaving
individuals. However, the study also found support for ICT to be an empowering tool for
balancing work and nonwork domains, especially considering the individual-specificity
of work-life balance equation. These findings appeared universal irrespective of the
distinctions of the two countries selected, or gender differences of respondents.

iv
ACKNOWLEDGEMENTS
This dissertation wouldn‟t have been a reality if not for the immense support of
many people. I sincerely thank each and every one of you for your invaluable help
throughout my PhD program.
I thank Dr. Daphne Taras and Dr. Giovani da Silveira, my supervisors, for their
support and guidance in this project; for the knowledge, expertise, and experience they
generously shared with me, their deep concern, and for the incredible number of hours of
their lives they have invested in me over these several years. I couldn‟t have asked for
anything better.
I thank Dr. Allen Ponak, together with Daphne, who always cared for my
wellbeing, and provided me with continuous support and guidance since the first day I
joined the doctoral program at the UofC.
I thank my parents for their unconditional love, encouragement, and support
through out my life, which made this endeavor a reality. I thank my loving husband,
Rukshan Tennakoon, who supported me and encouraged me to follow my dreams. I also
thank Rushini, my lovely daughter, who put up with her parents‟ busy schedules at her
young age.
I thank all the great individuals in the HROD area, and in the PhD office of
Haskayne, and my fellow students who made the time in the PhD program a really
pleasant one.
I thank Haskayne School of Business for the opportunity to join the program, and
financial and other support for this project and my doctoral studies overall.
I thank all the participants of my research study and staff of MARS library service
for the support in my research projects.
… to name but a few
v
DEDICATIONS
To my parents, who continue to inspire me with their unconditional love …

vi
TABLE OF CONTENTS
Abstract ............................................................................................................................... ii
Acknowledgements ............................................................................................................ iv
Dedications ..........................................................................................................................v
Table of Contents ............................................................................................................... vi
List of Tables .................................................................................................................... xii
List of Figures .................................................................................................................. xiii
List of Abbreviations .........................................................................................................xv
CHAPTER 1 - INTRODUCTION .......................................................................................1
Statement of Purpose and Relevance ...............................................................................1
Brief Outline of the Methodology ...................................................................................8
The Structure of the Thesis ..............................................................................................8
CHAPTER 2 - LITERATURE REVIEW ..........................................................................10
Work and Nonwork Interface ........................................................................................10
Distinguishing Between Work/ Family and Work/ Nonwork ..................................11
Work/ Nonwork Conflict ..........................................................................................11
Work/ Nonwork Enrichment ....................................................................................15
Work/ Nonwork Segmentation .................................................................................18
Work-Life Balance ...................................................................................................19
Work/ Nonwork Theorization ........................................................................................22
Recent Perspectives on Work/ Nonwork Interface ..................................................23

vii
Technology Use and Influence on Work/ Nonwork Domains ......................................27
CHAPTER 3 - HYPOTHESES .........................................................................................32
Factors Affecting Usage of the ICT Cluster ..................................................................32
Technology Acceptance Model (TAM) and Its Derivatives ....................................33
Four Quadrants of Work/ Nonwork Interaction ............................................................36
ICT Use and Work/ Nonwork Boundary Permeability .................................................38
Technology Use and Work/ Nonwork Conflict ........................................................39
Technology Use and Work/ Nonwork Enrichment ..................................................40
Technology Use and Work/ Nonwork Segmentation ...............................................41
Conflict, Enrichment, Segmentation, and Work-Life Balance .................................42
Moderating Variables ...............................................................................................44
Other Exploratory Analyses ...........................................................................................52
Differences in Types of Technology ........................................................................52
Individual Differences in Technology Use ...............................................................53
Comparative Analysis Between a Developing and a Developed Country ....................54
CHAPTER 4 - METHOD ..................................................................................................55
Sample ...........................................................................................................................55
Selection of Countries and Participants ....................................................................55
Data Collection Methods ...............................................................................................57
Interviews .................................................................................................................57
Survey Using a Web-Based Questionnaire ..............................................................60
Problems Associated with Multi-Cultural Data Collection ......................................62

viii
Data Cleaning ................................................................................................................64
Normality Check and Outliers ..................................................................................65
Measures in the Survey ..................................................................................................66
Measures of ICT Usage ............................................................................................66
Dependent Variable ..................................................................................................67
Work/ Nonwork Interaction Variables .....................................................................68
Measures of Work, Nonwork, and Individual Characteristics .................................72
CHAPTER 5 - DESCRIPTIVE ANALYSIS OF DATA ..................................................78
Demographic Analysis of Survey Data .........................................................................78
ICT Usage Patterns ........................................................................................................79
CHAPTER 6 - PREDICTORS OF ICT USE ....................................................................85
Understanding the Factors Predicting Individual ICT Usage ........................................85
Introduction to Analytical Techniques ..........................................................................86
Assessing Model Fit in SEM ....................................................................................87
Predictors of ICT Use ....................................................................................................90
Regression Analysis for Factors Predicting Context-Specific ICT Use ...................98
CHAPTER 7 - MEASUREMENT MODEL ...................................................................105
Exploratory Factor Analysis of Work/ Nonwork Interaction Variables ......................105
Confirmatory Factor Analysis (CFA) of Work/ Nonwork Interaction Variables ........109
Verification of Equivalency of Measures across Canada and Sri Lanka .....................117
Common Method Bias .................................................................................................119
ix
CHAPTER 8 - STRUCTURAL MODEL........................................................................121
Structural Model for the Primary Relationships in the Study ......................................121
Adjusted Structural Model .....................................................................................123
Results of Hypothesis Testing .....................................................................................125
Impact of ICT Use on Work/ Nonwork Interactions ..............................................127
Relationships between Work/ Nonwork Interactions and Work-Life Balance ......130
CHAPTER 9 - FURTHER ANALYSES .........................................................................133
Technology Differences in ICT Use and Work/ Nonwork Interaction .......................133
Gender Differences in ICT Use and Work/ Nonwork Interactions .............................136
Age Differences in ICT Use and Work/ Nonwork Interactions ..................................137
Empowerment or Enslavement: Does Perception Towards ICT Matter? ....................139
Context of ICT Use and Impact on Work/ Nonwork Interactions ...............................145
Post-hoc Analysis: Evidence for a Mediated Relationship between ICT Use and
Work-Life Balance...............................................................................................150
Country Differences in ICT use and Work/ Nonwork Interactions .............................151
Country Differences in Predicting Work-Life Balance ...............................................155
Post-hoc Analysis Related to Country Differences .....................................................157
CHAPTER 10 – MANAGING ICT AT THE WORK/ NONWORK BORDER ............159
Tactics for Managing ICT Influence at the Work/ Nonwork Border ..........................160
ICT as a Tool in Balancing Work and Life ............................................................160
Symbolic and Actual Separation of Work and Nonwork Domains .......................161
Subordinate Empowerment as a Tool for Limiting ICT Intrusions .......................162
Limiting Accessibility of External Parties via ICT ................................................163

x
Saying “No” to Use of ICT Devices .......................................................................164
Learning to Balance It All - Knowing that ICT Can be Switched Off ...................165
CHAPTER 11 – DISCUSSION AND CONCLUSION ..................................................167
Drivers of ICT Use ......................................................................................................167
Differentiated Use of ICT ............................................................................................169
ICT Use and Work/ Nonwork Interactions ..................................................................170
Work/ Nonwork Interactions and Work-Life Balance ................................................172
Work/ Nonwork Conflict and Work-Life Balance .................................................172
Work/ Nonwork Enrichment and Work-Life Balance ...........................................173
Are Managers a Different Breed? ................................................................................175
Limitations of the Study ..............................................................................................179
Research Contributions ................................................................................................182
Clarification of the Concept of Work-Life Balance ...............................................182
Incorporation of ICT into Work/ Nonwork Interaction Models .............................183
Clarifying the Implications of ICT Use on Work-Life Balance .............................185
Prediction of Technology Usage – Need for Contextual Differentiation ...............186
Integration of Border Theory, Boundary Theory, and Work-Life Balance ...........187
Importance of the Two-Country Study ...................................................................188
Practical Contributions ................................................................................................189
Importance of Removing the E-Leash ....................................................................189
Life-Friendly Organizational Policies ....................................................................191
Nonwork-Related ICT Use at Work: How Big is the Problem? ............................192
Nonwork-Related ICT Use at Work: Predicting Problematic Use .........................193

xi
Protecting Against Employer Liability ...................................................................194
Conclusion ...................................................................................................................196
The Next Step .........................................................................................................198
REFERENCES ................................................................................................................200
APPENDICES .................................................................................................................232
Appendix 1: Interview Protocol: ICT Use and Work Life Balance ............................232
Appendix 2: A Copy of the Web-Based Survey ..........................................................233
Appendix 3: Ethics Committee Approval ....................................................................247
xii
LIST OF TABLES
Table 1: Basic ICT related statistics of Canada and Sri Lanka......................................... 56
Table 2: Profile information of interview participants ..................................................... 59
Table 3: Profile information of survey participants .......................................................... 78
Table 4: Confirmatory factor analysis of predictors of ICT use ....................................... 90
Table 5: Item loadings and validity statistics for work, nonwork, and individual
characteristics ............................................................................................................ 94
Table 6: Descriptive statistics and correlation matrix of the variables included in the
research (Section 1) ................................................................................................... 95
Table 7: Regression results for the predictors of ICT use .............................................. 101
Table 8: Eigenvalues and percentage of variance extracted by the five factors ............. 107
Table 9: Factor loadings of work/ nonwork interaction variables using principal
component analysis with varimax rotation ............................................................. 108
Table 10: Path loadings, composite reliability, and average variance extracted for the
latent variables in the adjusted measurement model ............................................... 116
Table 11: Testing factorial invariance across the sample from the two countries. ......... 118
Table 12: Results summary for hypothesis testing with the structural model ................ 126
Table 13: Testing for group invariance across gender differences. ................................ 136
Table 14: Testing for group invariance across age differences. ..................................... 138
Table 15: Exploratory factor analysis of ICT perception variables ................................ 140
Table 16: Summary of results: Context-specific ICT use, work/nonwork interactions
and WLB ................................................................................................................. 147
Table 17: Regression analysis results - Testing for country differences in ICT use and
work-to-nonwork conflict ....................................................................................... 154
Table 18: Regression analysis results - Testing for country differences in the
relationship between work-life balance and work/ nonwork interactions .............. 156

xiii
LIST OF FIGURES
Figure 1 : Factors affecting the use of the ICT cluster by individuals .............................. 36
Figure 2 : Dimensions of work/ nonwork interactions ..................................................... 37
Figure 3 : Research model: Relationships between ICT use and work-life balance ........ 38
Figure 4: ICT usage pattern for work and nonwork activities on typical work days and
nonwork days ............................................................................................................ 79
Figure 5: Pattern of usage of different types of ICTs for work and nonwork purposes
in work days and nonwork days ................................................................................ 80
Figure 6: Average use of ICT in hours on work days and nonwork days for male and
female participants .................................................................................................... 81
Figure 7: Average distribution of ICT use on a work day for the total sample ................ 82
Figure 8: Average distribution of ICT use on a nonwork day for the total sample .......... 83
Figure 9: Scree plot for the EFA of work/ nonwork interaction variables ..................... 106
Figure 10: Path diagram of CFA of work/ nonwork interaction variables ..................... 110
Figure 11: CFA of the altered measurement model ........................................................ 113
Figure 12: Structural model for ICT use and work/ nonwork interactions ..................... 122
Figure 13: Adjusted structural model ............................................................................. 124
Figure 14: Hypotheses tested using the adjusted structural model ................................. 126
Figure 15: Relative importance of technology types for work-related and nonwork-
related purposes ...................................................................................................... 133
Figure 16: ICT types and work/ nonwork interactions ................................................... 135
Figure 17: Moderating effect of “perception towards ICT” ........................................... 142
Figure 18: Enslavement as a moderator in the relationship between work-to-nonwork
conflict and ICT use ................................................................................................ 143
Figure 19: Full structural model with Total ICT disintegrated into context-specific
ICT use .................................................................................................................... 146
xiv
Figure 20: Mediation effect of the relationship between work-related ICT use and
WLB ........................................................................................................................ 151

xv
LIST OF ABBREVIATIONS
Abbreviation Definition
ICT Information and Communication Technology
IT Information Technology
WNW conflict Work-to-Nonwork Conflict
NWW conflict Nonwork-to-Work Conflict
WNW enrichment Work-to-Nonwork Enrichment
NWW enrichment Nonwork-To-Work Enrichment
Wk_WD Work-Related ICT Use on Work Days
Wk_NWD Work-Related ICT Use on Nonwork Days
NWk_WD Nonwork-Related ICT Use on Work Days
NWk_NWD Nonwork-Related ICT Use on Nonwork Days
WLB Work-Life Balance
Statistical terminology
AVE Average Variance Extracted
CFA Confirmatory Factor Analysis
CFI Comparative Fit Index
CR Composite Reliability
EFA Exploratory Factor Analysis
RMSEA Root Mean Squared Error of Approximation
SEM Structural Equation Modeling
SRMR Standardized Root Mean Square Residual
TLI Tucker-Lewis Index

1
CHAPTER 1 - INTRODUCTION
Statement of Purpose and Relevance
Communication technologies foster meaningful connections within the frenetic
global society. The Internet, e-mails, and portable communication devices1 such as
mobile phones, Blackberry®, and PDAs form a technology group that is prominent both
at work and outside of work in employee lives. The devices‟ portability, small size,
power, and convenience allow them to be moved from work to home, be taken on
vacation, and all without regard to time zones and physical boundaries. Enabled by such
Information and Communication Technologies (ICT), the generic slogan of “anytime,
anywhere, and availability at the press of a button” captures the current work-culture
trend. A debate about the effects – both positive and negative – of technology has been
ongoing, without resolution, and often without much empirical basis. This study aims to
assess the impact of the use of this ICT cluster on the work-life balance of managers and
professionals in Canada and Sri Lanka.
Statistics show that information technology usage is accelerating worldwide. The
latest statistics from the International Telecommunication Union (ITU) reported that
mobile networks are available to over 90 percent of the global population and the number
of subscribers is estimated to be 5.3 billion at the end of 2010, with 3.8 billion being in
the developing world. Further, the number of Internet users worldwide has doubled in the
past five years and surpasses the two billion mark in 2010 (ITU, 2010). Data also show
1 The group of technologies (i.e., the Internet, e-mail, and portable communication devices) is referred to as
the “ICT cluster.”

2
that the scope and versatility of these devices have been increasing with the advancement
of technology (Edur, 2000; Johnson, 2005; The Economist, 2006; Yoffie, 1996). The
boundless connectivity and access to information channels at all times are expected to
empower individuals by enabling them to carry out daily tasks with more ease and higher
efficiency.
There also is concern about the possible downside of ICT use, including increased
hours of work, stress, and loss of private time. The USA, Canada, and the UK have
reported that managers worked longer hours and experienced a sense of “working high
speed” all the time (Guest, 2002; HRSDC, 2005a; Patel, 2002). This trend is observed
worldwide both in developing and developed countries (Bell & Hart, 1999; Black &
Lynch, 2001; Guest, 2002; Healy, 2000; Patel, 2002; Sturges & Guest, 2004). While
some employees enjoy compensation for their extended work hours and their 24/7
accessibility, for most managers and professionals who are not covered by overtime
legislation (HRSDC, 2006; USDL, 2005), these extra hours are just an extension of their
work demands. By enabling individuals to perform their work anytime, anywhere, the
ICT cluster appears to be adding to the hours worked.
The United States Department of Labor (2005) reported that nearly two-thirds of
the 20.7 million persons who usually did some work at home as part of their primary job
were in management, professional, and related occupations. Further, about three-fourths
of wage and salary workers who did job-related work at home on a regular basis did so
without a formal arrangement to be paid for this work. Workers doing unpaid job-related
activity at home averaged about 7 hours per week at home and about 22 percent of such
3
individuals usually worked 8 or more hours a day at the work place. About 70 percent of
all persons who usually worked at home made use of the Internet or e-mail to work at
home (United States Department of Labor, 2005).
Such technology-assisted work arrangements allow work to flow easily into the
nonwork domain of individual lives. It is argued that by blurring the boundaries between
work and nonwork2 lives of employees, these technologies are affecting their work-life
balance (Chesley, 2005; O'Driscoll, 1996). There is increased attention to work-life
balance issues among managers of organizations, policy makers, and the employees
themselves due to multifaceted implications such as poor physical health (Allen, Herst,
Bruck, & Sutton, 2000; Frone, Russell, & Cooper, 1992a), psychological effects (Frone et
al., 1992a), and behavioural effects such as heavy alcohol abuse (Frone, Russell, &
Cooper, 1997). Work-life balance of employees is recognized as an essential element of
the healthy workplace (CCOHS, 2002; HRSDC, 2005a).
Academics have been interested in the interplay between work and nonwork for
many decades (Pleck, 1977; Walker & Woods, 1976; Willmott, 1971). Although
numerous studies have addressed issues at the work/nonwork interface, there is only a
handful of studies that have focused on the implications of technology use on
work/nonwork issues (e.g., Boswell & Olson-Buchanan, 2007; Chesley, 2005; Fenner &
Renn, 2004; Mazmanian, Orlikowski, & Yates, 2006). The need to incorporate the
influence of ICT into research on work/nonwork interaction has been recognized because
2 Following the convention used in some published literature [e.g., Kabanoff (1980), Near et al. (1984),
Robert et al. (1992), and Wallace (1999)] the term non-work is represented as “nonwork” in this paper.

4
of the important role ICT may play in the lives of individual workers today (O'Driscoll,
1996).
The current study addresses this knowledge gap in four ways. First, the study
explores what factors drive the use of ICT by managerial and professional employees and
how these individuals use each of the components in the ICT cluster in their daily work
and nonwork activities. Individuals today use more than one type of ICT and it is
important to understand the distinctive patterns in the use of these technologies. Perhaps
one type of portable device puts employees at the beck and call of the employer, while
another similar device allows employees to interact with family members to solve day-to-
day issues. Previous studies that addressed the usage and impact of these technologies
usually focused on a single technology, such as Blackberry® (Mazmanian et al., 2006;
Schlosser, 2002), PDAs (Golden & Geisler, 2007), mobile phones (Facer II &
Wadsworth, 2008; Palen, Salzman, & Youngs, 2001), e-mails (Gefen & Straub, 1997), or
Internet (Adams, Weinberg, Masztal, & Surette, 2005; Anderson & Tracey, 2001). The
current study contributes to a call for a better understanding of the use of technology
(Orlikowski, 2000) by presenting an empirical analysis of usage patterns of a cluster of
communication technologies, holding open the possibility that there are trade-offs and
specialties within the cluster. This study also looks at the effect of demographic
characteristics (e.g., age, gender, household income, and marital status) towards the usage
patterns and perceptions of these devices. This contribution establishes the descriptive
foundation of the dissertation.

5
Second, it is important to explore how modern employees assess and perceive the
impact of ICT on their own work-life balance. The literature accepts the notion that ICT
is blurring the boundaries of work and nonwork domains (Arnold, 2003; Chesley, 2005;
Churchill & Munro, 2001; Golden & Geisler, 2007; Jarvenpaa & Lang, 2005; Perry,
O'Hara, Sellen, Brown, & Harper, 2001); however there are debates about the
consequences of these permeable boundaries. One camp of researchers argues that
blurred work/nonwork boundaries are bad for individuals and families because they
promote overwork (Galinsky, Kim, & James, 2001; Wei & Ven-Hwei, 2006),
individualism or isolation (Kraut et al., 1998; Nie, 2001), increase in procrastination due
to temptations via ICT means (Steel, 2010b), and an accelerated daily life with
continuous interruptions (Ventura, 1995). Others argue that technology enhances
flexibility in handling activities of work/nonwork domains and thereby reduce conflicts
between the domains (e.g., Hill, Hawkins, Ferris, & Weitzman, 2001; Mazmanian et al.,
2006). Researchers have also explored the impact of Internet use in relation to social
capital and individual wellbeing (Haythornwaite, 2001; Katz, Rice, & Aspden, 2001;
Kraut et al., 2002; Kraut et al., 1998). Adding onto this literature, this study addresses the
particular issue of impact of the ICT cluster on their work-life interactions, and the affect
on individual work-life balance.
The Technology Acceptance Model (TAM) (Davis, 1989; Davis, Bagozzi, &
Warshaw, 1989), and its later advancements such as the Unified Theory of Acceptance
and Use of Technology (UTAUT) by Venkatesh et al. (2003) proposed that the perceived
ease of use of technology and the perceived usefulness would explain initial user
adoption of new technologies. Thus, it is proposed that the users‟ attitude towards
6
technology will have a bearing on how individuals perceive ICT impact in their lives.
Therefore, this study also will address how perceptions towards technology might
moderate employees‟ view of the impact of the ICT cluster on their work-life
interactions.
Popular press has highlighted that communication technologies could “e-leash”
employees to their work (Rothberg, 2006). Addiction to these technologies is considered
comparable to drug addiction (McIntyre, 2006). However, there is a scarcity of academic
research looking into these considerations. The theory of psychological reactance
(Brehm, 1966) focuses on how individuals act when their realm of free behaviour is
limited (Brehm & Brehm, 1981). In general, the theory holds that a threat to or loss of a
freedom creates a psychological arousal that motivates the individual to restore that
freedom (Brehm & Brehm, 1981). The theory also associates the state of reactance with
emotional stress, anxiety, resistance, and struggle for the individual, and assumes people
are motivated to escape from these feelings. In a situation where ICT cluster creates e-
leashes that limit an individual‟s freedom in focusing on either the nonwork or work
domain, it is important to understand what reactive measures are adopted by individuals
to restore their work-life. Have employees developed ICT-management strategies?
Therefore, the third contribution of this study is to explore how individuals manage the
impact of the use of ICT cluster in balancing their work and nonwork lives.
Further, there may be unique issues involving managerial employees that may not
be captured solely by a larger survey. While hourly workers usually are compensated for
their actual work time, most employment standards legislation and corporate practices

7
exempt managerial employees from such direct compensation systems (HRSDC, 2006;
United States Department of Labor, 2005). There may be particularly severe issues
involving work-life balance when managerial employees are supplied with portable ICT
devices precisely so that their work responsibilities are continuous whether on-site or off-
site. Yet many of these executives also have significant discretion over the pacing and
intensity of their work (United States Department of Labor, 2005). Using face-to-face
interviews with a selected group of participants, this study provides more insights into
how such employees harness the power of these new technologies to manage their lives.
Fourth, it is important to determine whether findings on the impact of ICT use on
work/nonwork interactions are generalizable. Much information about the use of
advanced portable technologies and work/nonwork interaction issues has been gathered
in developed countries (e.g., Golden, Veiga, & Simsek, 2006; Schlosser, 2002). Further,
with a few exceptions (e.g., Aryee, Fields, & Luk, 1999; Joplin, Shaffer, Francesco, &
Lau, 2003) most research on work/nonwork interface has also been on developed
economies and Spector et al.(2008) highlighted the importance for more research to
address country differences in relation to work-family variables. Are there peculiarities
that make research findings country and context-specific or do trends transcend borders?
Comparing Canada to Sri Lanka allows an exploration of this question.
Chesley (2004) conducted a similar study for her PhD dissertation titled "Using
IT to manage work-family life.” At first glance the two studies appear similar and have
areas of overlap. However there are significant aspects which are unique to each of the
two studies and set them apart as distinct contributors towards the enhancement of
8
existing knowledgebase of work/family literature. The key distinctions of this research
compared to Chesley's (2004) work include: (i) inclusion of all aspects of nonwork
(beyond family) and focus on individuals rather than couples; (ii) inclusion of data from
two distinct countries with one country from the developing world; (iii) consideration of
Blackberry® type "smart" mobile communication devices, which have become a critical
component of work ICT use; and (iv) differentiation of ICT use based on context of use
and type of ICT, enabling more detailed analysis and understanding of ICT usage and its
implications.
Brief Outline of the Methodology
The focus of the study is the individual, more specifically, managers and
professionals in Canada and Sri Lanka who use the ICT cluster in their work and
nonwork activities. The study triangulates multiple data collection methods, including
semi-structured in depth interviews and a large-scale web-based survey. These methods
complement each other and provide both quantitative and qualitative data which pave the
way for comprehensive analysis and higher reliability than single-method studies.
The Structure of the Thesis
Chapter 2 presents a review of the literature on work/ nonwork interface as well
as ICT influence on work/ nonwork interactions. Chapter 3 outlines the study hypotheses
together with other exploratory questions to be covered in this research. Chapter 4
discusses the data collection methods, and identifies the measures used in this study
9
leading to Chapter 5, which presents the descriptive analysis of the data. Chapters 6, 7, 8,
and 9 capture the core statistical analysis and present the main findings, primarily using
structural equation modeling, supported by a qualitative study. Chapter 10 addresses how
individuals manage ICT at the work/ nonwork border, where the primary data is from
subject interviews. This is followed by Chapter 11, which discusses the study findings
and limitations. The second portion of this chapter presents the scholarly and practical
contributions of the study, and the chapter wraps up with the conclusions of the study.

10
CHAPTER 2 - LITERATURE REVIEW
Work and Nonwork Interface
How individuals manage work and nonwork domains have become more salient
as more individuals entered the paid labour force. Increases in the number of dual-
breadwinner families and single working parents raise tensions as workers seek ways of
fulfilling both work and nonwork responsibilities (Greenhaus & Allen, 2011; Mesmer-
Magnus & Viswesvaran, 2005). Several conceptual frameworks have been proposed by
researchers to explain the relationship between these two spheres of life (Greenhaus &
Allen, 2011; Greenhaus, Collins, & Shaw, 2003; Guest, 2002; Gutek, Searle, & Klepa,
1991; Zedeck & Mosier, 1990).
Most existing research focuses on understanding the interdependencies between
work and family roles. Concepts such as work/nonwork conflict (Greenhaus & Beutell,
1985) and work/nonwork enrichment (Edwards & Rothbard, 2000) explain how
experiences in one role may affect experiences in the other. Work/nonwork segmentation
(Nippert-Eng, 1996) is another concept that addresses the overlap or disconnectedness
maintained by individuals across work and nonwork domains. Work-life balance, the
dependent variable of this study, is a concept that has gained popularity both in academia
(Greenhaus & Allen, 2011; Greenhaus et al., 2003; Hill, Miller, Weiner, & Colihan,
1998; Marks & MacDermid, 1996) and in the popular press (Bird, 2006; Fuimano, 2005;
Gurchiek, 2008; Kirkpatrick, 2006; Maitland, 2004). The sections to follow will a) clarify
what constitutes work and nonwork domains; b) introduce and define each of

11
work/nonwork interaction concepts, and c) examine how work and nonwork roles interact
to enable or disturb work-life balance.
Distinguishing Between Work/ Family and Work/ Nonwork
When exploring work/nonwork interactions, most studies have focused on “the
family” as representation of the nonwork domain while only a few studies looked beyond
family. Voydanoff (2001) suggested to incorporate “community micro system” (p. 1609)
into the analysis of work and family. Edwards, Cockerton, and Guppy (2007) used the
terms nonwork and general life domains to represent the totality of nonwork aspects. The
concept of "family" is more pronounced when dealing with individuals who are married
and with/without children. The present study is not limited to married individuals and
thus must consider other nonwork demands and interests of adults. Its scope extends to
all activities and involvements in the nonwork arena beyond family including
community, care-giving responsibilities, recreation and entertainment, friendships,
hobbies, travel, and quiet time at home. Therefore, the dissertation uses the term
“nonwork” when discussing the domain beyond work activities of an individual.
However, to honour the original intent of a substantial body of research developed
specifically to examine “family” impact, the original term will remain in the dissertation
only when discussing work arising from this particular orientation.
Work/ Nonwork Conflict
The conflict perspective has dominated research on work/nonwork dynamics
over the last 25 years (Parasuraman & Greenhaus, 2002). Emanating from the role strain
12
perspective, it is based on the notion of scarcity; the basic assumption is that an
individual possesses limited amount of time and energy, and the need to fulfill multiple
roles would lead to depletion of these scarce resources (Geurts & Demerouti, 2003).
Greenhaus and Beutell (1985) were among the first to define work/family conflict
as “a form of inter-role conflict in which role pressures from work and family domains
are mutually incompatible in some respect. That is, participation in the work (family) role
is made more difficult by virtue of participation in the family (work) role” (Greenhaus &
Beutell, 1985: 77). They interpreted the nonwork component as “family,” i.e., excluding
other responsibilities and activities. They identified three major forms of work/family
conflict, namely, time-based, strain-based, and behaviour-based:
a) Time-based conflict – Time pressures from one domain make it either
physically impossible, or produce a preoccupation with one role when a person is
attempting to meet the requirements of the other role. For example, long hours at
work, or work-related phone calls at home limit one‟s ability participate in family
activities.
b) Strain-based conflict – Strain (e.g., tension, anxiety, fatigue, depression, and
irritability) created by participating in one role could make it difficult to comply
with demands of the other role. For example, fatigue of long working hours may
spill over to the family domain.
c) Behaviour-based conflict – Specific behaviour patterns associated with one role
may be incompatible with expectations in another role. For example, different

13
behaviours are expected of a decisive professional manager at work compared to
the caring and sensitive nature this person may be required to exhibit at home.
Other studies have followed Greenhaus and Beutell (1985) in defining work/
family conflict in terms of the above tripartite classification (e.g., Carlson, Kacmar, &
Williams, 2000).
Bidirectional Nature of Work/ Nonwork Conflict: Literature suggests that
conflict may arise from either work or nonwork (Greenhaus & Beutell, 1985; Gutek et
al., 1991). The conceptual underpinning is that fulfilling one responsibility may come at
the expense of the other. But research indicates that there may be differences based on
whether work intrudes on private lives, or private lives challenge work duties. Work-to-
nonwork conflict (WNWC) and nonwork-to-work conflict (NWWC) have been
identified as two distinct, moderately correlated aspects of conflict (Frone et al., 1992a;
Frone, Russell, & Cooper, 1992b; Netemeyer, Boles, & McMurrian, 1996). A meta-
analytical study on work/family conflict based on 25 independent samples revealed the
sample size mean-weighted correlation between the two conflict measures to be .38
(Mesmer-Magnus & Viswesvaran, 2005).
Both types of work/nonwork conflict have been associated with job and life
satisfaction (Kossek & Ozeki, 1998; Mesmer-Magnus & Viswesvaran, 2005), within-
domain distress (Allen et al., 2000; Frone et al., 1992a), and physical and mental health
(Judge, Boudreau, & Bretz Jr, 1994). However, research has suggested the possibility of
differential correlation patterns between the bi-directional conflict measures and

14
antecedents and consequences of conflict (Kossek & Ozeki, 1998; Mesmer-Magnus &
Viswesvaran, 2005). For example, correlations between WNWC and job satisfaction
(Kossek & Ozeki, 1998) and between WNWC and job stressors (Mesmer-Magnus &
Viswesvaran, 2005) were higher than the correlation between NWWC and these two
job-related variables separately. Family-related variables (e.g., family stressors) were
more highly correlated with NWWC than with WNWC (Frone et al., 1992a;
Mesmer-Magnus & Viswesvaran, 2005).
Studies have found the family boundary to be more permeable to work demands
than the work boundary to family demands (Frone et al., 1992b; Gutek et al., 1991; Hall
& Richter, 1988). One robust conclusion from this body of research is that work is more
likely to negatively intrude on nonwork hours, and that there seems to be a barrier that
filters nonwork pressures from affecting work.
Even though the concept of work/family conflict is several decades old, there is
still inconsistency in operationalizing both WNWC and NWWC. Some meta-
analytical studies on the subject highlighted this fact (Allen et al., 2000; Kossek & Ozeki,
1998; Mesmer-Magnus & Viswesvaran, 2005). For example, Mesmer-Magnus and
Viswesavaran (2005) stated that the 25 independent studies included in their analysis had
measures varying from 2 to 22 items with internal consistency reliabilities ranging from
.56 to .95. Researchers have consistently called for better validation of WNWC and
NWWC measures (Geurts & Demerouti, 2003; Mesmer-Magnus & Viswesvaran,
2005) and which is area addressed in this study.

15
Work/ Nonwork Enrichment
An underlying assumption in work/nonwork conflict models described above is
that individuals‟ time, energy, and attention are scarce resources with limited availability
(Geurts & Demerouti, 2003). Thus, when they are consumed by a role in one domain, the
lack of these resources is felt in the role of the other domain (Greenhaus & Powell, 2003).
However, researchers also argue that work and nonwork domains each provide
individuals with resources such as enhanced esteem, income, access to resources, and
other benefits that may help to perform better in other life domains (Carlson, Kacmar,
Wayne, & Grzywacz, 2006). Recognizing this positive interdependence, Greenhaus and
Powel (2006) proposed that work and family roles were “allies” rather than “enemies.”
They defined work/nonwork enrichment as the extent to which experiences in one role
improved quality of life in the other role, arguing that participation in multiple roles
could provide positive outcomes for individuals in three ways (Greenhaus & Powell,
2006):
First, work and nonwork experiences could have additive effects on well-being,
especially when roles are of high quality. Satisfaction with work and satisfaction
with nonwork have been found to have additive effects on individual‟s happiness,
life satisfaction, and perceived quality of life (Rice, McFarlin, Hunt, & Near,
1985). Research suggested that individuals who participated and were satisfied
with both work and nonwork roles experienced greater well-being than those who
participated in only one of the roles, or who were dissatisfied with one or more of
their roles (Greenhaus & Powell, 2006).
16
Second, participating in both work and nonwork roles could buffer individuals
from distress in one of the roles. Research has demonstrated that relationship
between family stressors and impaired well-being was weaker for individuals who
had more satisfying, high-quality work experience (Barnett, Marshall, & Sayer,
1992). Similarly, work stressors and impaired well-being were reduced for
individuals who had more satisfying, high-quality family life (Barnett, Marshall,
& Pleck, 1992).
Third, experience in one role could produce positive outcomes in the other role.
Greenhaus and Powell (2006) presented case examples from previous studies
where family-based skills such as parenting helped individuals to be better
managers, and participative skills from workplace helped individuals interact
better with teenage children.
Clarification of Terminology: Positive aspects of work/nonwork interactions
have also been called enhancement (Sieber, 1974), positive spillover (Grzywacz &
Marks, 2000), facilitation (Grzywacz, 2002), and enrichment (Greenhaus & Powell,
2006). Although these construct labels have been used almost interchangeably in the
literature, Carlson et al. (2006) distinguished among these seemingly related, but slightly
different constructs. The key distinction between enrichment and facilitation is the level
of analysis: enrichment focuses on improvement in individual role performance or quality

17
of life, whereas facilitation focuses on improvements in system functioning 3 (Carlson et
al., 2006; Grzywacz, Carlson, Kacmar, & Wayne, 2007). Since the level of analysis of
this study is “the individual,” work/nonwork enrichment is here defined as “enhanced
role performance in one domain as a function of resources gained from another,” an
adaptation from Wayne et al. (2007). Similar to conflict, enrichment is considered to be
bidirectional (Greenhaus & Powell, 2006; Rothbard, 2001). However, compared to
work/nonwork conflict, fewer studies have explored this bidirectionality (Frone, 2003).
In this study, work/nonwork enrichment is assumed to be bidirectional with distinctions
between work-to-nonwork enrichment (WNWE) and nonwork-to-work enrichment
(NWWE).
3 Enhancement represents the acquisition of resources and experiences that are beneficial for individuals in
facing life challenges and focuses on benefits gained by individuals and the possibility that these benefits
may have salient effects on activities across life domains. Enrichment focuses on enhanced role
performance in one domain as a function of resources gained from another. Positive spillover refers to
experiences in one domain such as moods, skills, values, and behaviors being transferred to another domain
in ways that make the two domains similar. In order for enrichment to occur, resources must not only be
transferred to another role but successfully applied in ways that result in improved performance or affect
for the individual. The final construct, facilitation, is defined as the situation where being engaged in a
domain yields gains that enhance functioning of another life domain (Wayne et al., 2007).

18
Work/ Nonwork Segmentation
How individuals enact their work/nonwork boundary may differ greatly; some
might allow work and nonwork to integrate, while others might keep them separate
(Ashforth et al., 2000; Edwards & Rothbard, 2000; Nippert-Eng, 1996). Research on
work/nonwork interaction refers to these approaches as integration and segmentation
(Edwards & Rothbard, 2000; Nippert-Eng, 1996). Segmentation refers to separation,
whereas integration refers to overlap between work and nonwork time, artifacts, and
activities (Nippert-Eng, 1996). Individuals could have a boundary management strategy
at any point along the continuum from total segmentation to total integration of work and
nonwork (Nippert-Eng, 1996).
For example, people who really segment the two domains could be keeping
different calendars for work and nonwork activities, use separate rings for work and
home keys, and have separate wardrobes for work and nonwork clothes (D'Abate, 2005).
Those who integrate more would allow work interactions to follow home and vice versa.
Rothbard, Phillips, and Dumas (2005) provided an example of complete segmentation in
the case of an exotic dancer who might conceal her occupation from family and friends,
compared to the complete integration of a nun both living and working in a convent.
However, such cases are the exception, and most individuals tend to enact less extreme
versions of their desires to either segment or integrate across the work and nonwork
boundary. Further, individuals‟ level of segmentation/integration of work and nonwork
domains could be affected by both individual desire and organizational policies
(Rothbard et al., 2005).
19
Work-Life Balance
Widely cited in popular press, the concept of “work-life balance” (sometimes
referred to as work/family balance or work/nonwork balance) has gained interest because
the notion of balance is actually an empowering strategy to deal with spillover between
the two domains (Greenhaus et al., 2003). Initially, balance was viewed as the absence of
conflict (Duxbury, Higgins, & Lee, 1994). Frone (2003) proposed that work/nonwork
balance was more than the mere lack of inter-role conflict or interference; it was the lack
of inter-role conflict combined with work/nonwork facilitation. As demonstrated in the
following section, recently scholars have recognized the construct of work-life balance
(WLB) to be distinct from work/nonwork conflict or work/nonwork facilitation. As it
evolved, WLB became more volitional than descriptive. Employees and employers could
engineer the conditions that might bring employees a greater sense of role harmony,
hoping for productivity and a sense of personal achievement that rose above a
preoccupation with either of the domains. Eventually WLB came to be treated as a goal
in its own right rather than a way of reconciling role differentiation.
Development of the Definition of WLB: Marks and MacDermid (1996) defined
role balance as “the tendency to become fully engaged in the performance of every role in
one’s total role system, to approach every typical role and role partner with an attitude
of attentiveness and care” (p. 421). They also highlighted that this expression of full
engagement reflects a condition of “positive role balance,” in contrast to “negative role
balance” in which individuals are fully disengaged in every role. Accordingly, an
individual could attain balance in work/nonwork domains either positively (i.e., fully

20
engaged in both domains) or negatively (i.e., lack of engagement in both domains).
According to Clark (2000), work/family balance is “the satisfaction and good function at
work and home with minimum of role conflict” (p. 349).
Identifying the lack of a consistent definition for the concept of work/family
balance, Greenhaus and colleagues defined work/family balance as “the extent to which
an individual is equally engaged in - and equally satisfied with - his or her work role and
family role” (Greenhaus et al., 2003: 513). They identified three components of
work/family balance as time, involvement, and satisfaction, of which they proposed that
individuals should have equal amount of time and effort invested in work and family
domains. However, the disregard in the above definition for individual desires and values
could disconnect the meaning of work/family balance from its most salient attributes.
According to Clark (2000), the point of balance is indeed very much individual
dependent and each individual could find satisfaction in life through differential
investments in these distinct, yet connected domains of life. Further, in addition to the
generational differences about perceptions of work-life balance, the same individual is
likely to find that the threshold of balance in work and nonwork domains vary over her
life time (Smola & Sutton, 2002; Sweet & Moen, 2006). Thus, the balancing point in
work and family domains could vary according to values, attitudes, beliefs, gender, and
even the age of individuals, and disregarding these individual differences in defining
work/family balance could be considered a serious deficiency in Greenhaus et al.'s (2003)
definition of work-family balance.

21
Addressing this deficiency in the work-life balance definition, Greenhaus and
Allen (2011) proposed a new definition for work-family balance using the person-
environment fit perspective as “the extent to which effectiveness and satisfaction in work
and family roles are compatible with an individual’s life values at a given point in time4”
(p.175). This captures the variation of the fulcrum of a balance beam with work on one
side and family on the other based on individual differences. It could be that based on the
individual‟s desires and values, balance beam itself could be already loaded to favour one
side over the other. The current study focuses on work-life balance of the individual,
where “life” encompasses all nonwork aspects of an individual‟s life such as family,
friends, voluntary work, recreational activities, etc. Therefore, for the purposes of the
study, WLB is defined as “the extent to which effectiveness and satisfaction in work and
nonwork roles are compatible with an individual’s life values at a given point in time,”
an adaptation from Greenhaus and Allen‟s (2011) definition.
4 The authors first introduced this definition of work-life balance at an academic symposium at the
Academy of Management Conference 2008 (Anaheim, CA), however, it did not appear in a publication
until 2011. For the purposes of this thesis the above definition was adopted in 2008 as it was well aligned
with the emerging views of work-life balance as well as with the initial findings from interview study of
this dissertation research.

22
Work/ Nonwork Theorization
Until recently, there were no strong theoretical frameworks addressing
work/nonwork interface issues. Zedeck and Mosier (1990) summarized previous work
that had been used to analyze the work/nonwork interface into five models. All these
models focused on the individual rather than on the family unit, and generally assumed
that work‟s impact on nonwork domain was much greater than the other way around. The
five models are the spillover model, the compensation model, the segmentation model,
the instrumental model, and the conflict model (Zedeck & Mosier, 1990).
The spillover model assumes that there is similarity between the occurrences in
work and nonwork environments. A person‟s work experiences are assumed to influence
what he or she does away from work and attitudes at work get carried over to nonwork
life affecting the basic orientation towards self, others, and children. The compensation
model proposes an inverse relationship between work and family such that work and
nonwork experience tend to be antithetical (Staines, 1980; Zedeck & Mosier, 1990).
Individuals make different investments in themselves in the two domains and look for
what is missing from one domain in the other. For example, when desires, experiences,
and psychological states are insufficiently present in work situations, these might be
pursued in family activities. Resting from fatiguing work or seeking leisure activities
after work are other examples of compensating behaviours. The segmentation model
hypothesizes that work and nonwork are distinct domains of life and individuals are able
to function in each domain without influencing the other. The separation in time, space
and function allows individuals to neatly compartmentalize their lives. The instrumental

23
model suggests that activities in one environment will facilitate success in the other.
Work outcomes would lead to good family life and life‟s pleasures. Finally, the conflict
model proposes that the two environments are incompatible with distinct norms, and
requirements of one environment entail sacrifices in the other (Zedeck & Mosier, 1990).
It could be argued that the same individual might fit into more than one model,
either at the same time or at different stages of his or her career/life. Further, since these
models are focused on individuals, Zedeck and Mosier (1990) argued that they should be
expanded to reflect the family as the unit of analysis. Clark (2000) stated that the above
five models treat individuals as passive responders simply reacting to work/nonwork
boundary issues rather than having the ability to enact or shape the environment. Further,
she identified that these models focused only on the emotional linkages (e.g., satisfaction
and expression of frustration), and gave little or no acknowledgement of spatial,
temporal, and social behavioural connections between work and family (Clark, 2000).
Recent Perspectives on Work/ Nonwork Interface
Work/ Family Border Theory: Clark (2000) proposed the “work/family border
theory,” where work and family are identified as different domains characterized by
different cultures (e.g., different purposes, languages, rules, customs, and behaviours).
According to this theory, people are “border-crossers” who make daily transitions
between the two domains, and they shape their goals, focus, language, and behaviour to
fit the unique demands of each domain. For some, if the two domains had similar
characteristics, the transition across the border might be slight, whereas for some others

24
the expectations across domains could be very different, and the transition across the
border could be substantial. Clark also identified elements that created bridges allowing
individuals to cross the work/nonwork border in an intermittent manner, such as a phone
call from home or supervisor, or family pictures at the office. This perspective recognized
that there are cues which facilitate border-crossing by emotional, physical, and even
virtual means.
One important feature of work/family border theory is the notion that individuals
are largely proactive or enactive; i.e., they can essentially shape the nature of each
domain, as well as the borders and bridges between domains (Clark, 2000). The theory
identified central participants of the domain (i.e., those who have influence in that
domain because of their competence, affiliation with central members of the domain, and
their internalization of the domain‟s culture and values) as “border keepers” (p. 761) who
could play an important role on the individual‟s ability to manage the domains and the
border. Common border keepers at work are supervisors, and in nonwork it would be
family and friends. The theory also proposes that when work and nonwork domains are
similar, weak borders will provide better work-life balance, where as when the domains
are different strong borders should lead to better balance.
Work/ Nonwork Boundary Theory: Boundary theory as defined by Ashforth et
al. (2000) addressed role transitions between “home, work, and other places” (p. 472).
Such role transitions are “a boundary-crossing activity, where one exits and enters roles
by surmounting boundaries” (Ashforth et al., 2000: 472). Boundary theory distinguished

25
between “macro” and “micro” transitions. Macro transitions are sequential, infrequent,
and often permanent changes such as promotion or retirement, whereas micro role
transitions are frequent and usually recurring transitions associated with work and
nonwork domains (Ashforth et al., 2000). Since the attention in the current study is on
intermittent transitions from work to nonwork and vice-versa with the aid of ICT, this
study focuses on micro-transitions across the work/nonwork border.
Flexibility and permeability are two key concepts affecting the process of micro-
role transition across a given role boundary (Ashforth et al., 2000). Flexibility is defined
as the degree to which spatial and temporal boundaries are pliable (Hall & Richter, 1988).
A role with flexible boundaries can be enacted in various settings and at various times
(e.g., a teleworking individual alternating roles as parent and professional during the
day). Conversely, inflexible boundaries can constrain when and where a role may be
enacted (e.g., security guard who has to be in a specific location and focus on the task at
hand) (Ashforth et al., 2000). Permeability is the degree to which a role allows one to be
physically located in the role‟s domain but psychologically and/or behaviourally involved
in another role (Ashforth et al., 2000). An employee who receives a personal phone call
while at work crosses the permeable boundary from work to nonwork at the point of
shifting the mental gears from work to nonwork. On the one hand, flexibility and
permeability at the role boundary could enable individuals to attend to simultaneous and
multiple demands of both work and nonwork domains. On the other hand, the blurred
boundary could exacerbate conflict by creating confusion among the individual and
members of his or her role sets as to which role should be more salient (Ashforth et al.,
2000; Hall & Richter, 1988).
26
From the point of view of work/family border theory (Clark, 2000), highly
flexible and permeable borders are considered weak borders. Based on the proposition of
weak borders (i.e., permeable and flexible) would facilitate work/family balance when
domains are similar (Clark, 2000). For example, a person who uses ICT excessively in
both work and nonwork lives may find it easy to seamlessly integrate the two domains
via ICT means and create a permeable work/ nonwork border for better work-life
balance.
In summary, theoretical perspectives addressing the work/nonwork interface
indicate that interactions across the work/nonwork boundary result in a multitude of
experiences for individuals. These could be a positive experience (e.g., work/nonwork
enrichment) or a negative experience (e.g., work/nonwork conflict). Further, the
individual could keep the work and nonwork domains totally segmented, or integrated, or
at a point between the two extremes (Sumer & Knight, 2001). The latest research studies
in work/nonwork interface appears to be using three constructs only (Heraty, Morley, &
Cleveland, 2008; Olson-Buchanan & Boswell, 2006; Sumer & Knight, 2001), namely
work/nonwork conflict, work/nonwork enrichment, and work/nonwork segmentation,
instead of the five-fold classification (i.e., spillover, instrumental, compensation,
segment, and conflict) presented by Zedeck & Mosier (1990).
These three parsimonious constructs can represent the components of the five-fold
model as follows: The negative component of spillover and conflict can be represented
by work/nonwork conflict, while the positive component of spillover, instrumentality,
and compensation across domains can be broadly categorized as work/nonwork
27
enrichment; segmentation stands on its own. Therefore, in this study work/nonwork
interaction will be considered as three broad categories of work/nonwork conflict,
work/nonwork enrichment, and work/nonwork segmentation. The permeability and the
flexibility of the work/nonwork border plays significant role in crafting these individual
experiences. Thus, the external factors that influence the work/nonwork border
permeability and flexibility (e.g., ICT) could be a key determinant of individual
experiences at the work/nonwork border.
Technology Use and Influence on Work/ Nonwork Domains
The increased usage of the ICT cluster has enabled location-independent work
and 24/7 connectivity to employees by enhancing flexibility and permeability across
work/nonwork borders. These technologies facilitate border crossings between work and
nonwork domains even when the individual is physically in the other domain. For
example, portable computers provided by employers bring work into the home.
Connectivity anytime and anywhere through cellular phones and Blackberrys® enable
the employer to contact employees even during family vacations. On the other hand,
communication technologies enable employees to attend to some of the nonwork tasks
during work time, such as banking, booking the family holiday online, or periodically
interacting with children during normal working hours. Thus, the ICT cluster creates
bridges across work/nonwork domains (Clark, 2000) facilitating “micro transitions”
(Ashforth et al., 2000) across the work/nonwork border. For example, an individual could
receive a call from children on her cellular phone while she is at work, with the cellular

28
phone acting as border-crossing bridge (Clark, 2000), and the individual undergoing a
psychological micro transition from work to family domain (Ashforth et al., 2000) the
moment she answers the phone and allows a permeable boundary situation.
The influence of these technologies on work/nonwork situations of employee
lives has captured the interest of researchers (Arnold, 2003; Chesley, 2005; Churchill &
Munro, 2001; Geisler & Golden, 2003; Jarvenpaa & Lang, 2005; Perry et al., 2001). The
concept that ICT is blurring the boundaries is accepted; however there are debates about
the consequences of these permeable boundaries. Researchers in one camp argue that
blurred work/nonwork boundaries are bad for individuals and families because they
promote overwork (Galinsky et al., 2001; Wei & Ven-Hwei, 2006), individualism or
isolation (Kraut et al., 1998; Nie, 2001), and an accelerated daily life with continuous
interruptions (Ventura, 1995). Others argue that technology enhances flexibility in
handling activities of work/nonwork domains and thereby reduce conflicts between work
and nonwork (e.g., Hill et al., 2001; Mazmanian et al., 2006).
Schlosser (2002) focused on the meanings assigned by employees by conducting
interviews with eleven public and private sector employees who used wireless handheld
devices. She found that individuals were able to fit technology into their work and
personal roles and at the same time adjusted these roles to suit the opportunities presented
by technology. Individuals developed innovative ways of using ICT, shaped by social
etiquette, their awareness of self-impressions, and ways of doing business (Schlosser,
2002). Further, self-regulation became a necessity as technologies created high

29
expectations of availability and the blurring of multiple work and personal roles
(Schlosser, 2002).
Jarvenpaa and Lang (2005) addressed eight paradoxes5 of mobile-device usage in
a focus group study spread across four cities in four countries. The participants were
urban-based and ranged from ten-year-old children to adults in various professional and
age groups. The findings revealed that users engaged in close and personal relationships
with mobile technologies and inevitably experienced simultaneous and contradicting
effects, called paradoxes, with the use of these devices. For example, permanent
connectivity through mobile phones empowered individuals to take charge anytime,
anywhere, but was also stressful sometimes. Jarvenpaa and Lang (2005) suggested
possible features to be included in mobile devices to help users to cope with these
paradoxes. They called for more research in understanding these paradoxes and self-
regulatory strategies adopted by users of these devices.
Chesley (2004; 2005) conducted a comprehensive study of the use of information
technology to manage work/family life using longitudinal data from the Cornel Couples
and Careers Study for the periods 1998-99 and 2000-01 in three upstate New York
communities. The results suggested that technology adoption over time varied by
technology type (e.g., e-mail/ Internet/ cell phone/ pagers), gender, work characteristics,
and family characteristics. She also found that cell phone use over time (but not computer
5 They defined paradoxes as contradictory or inconsistent positive and negative impacts of the use of
mobile devices. The eight paradoxes are i) Empowerment/Enslavement; ii) Independence/Dependence; iii)
Fulfills Needs/Creates Needs; iv) Competence/Incompetence; v) Planning/Improvisation; vi)
Engaging/Disengaging; vii) Public/Private; and viii) Illusion/Disillusion.

30
use) was associated with the negative forms of spillover, increased distress, and lower
family satisfaction.
However, the statistical analysis was based on somewhat unstable measures (with
Cronbach alpha values lower than .5) and there have been tremendous advancements and
changes in the use of portable technologies and ICT over the last few years (Gosling,
Gaddis, & Vazire, 2007; RIM, 2007) Thus, there is a need for more robust, generalizable,
and current analyses of how ICT use impacts at the border of work and nonwork domains
(Golden & Geisler, 2007).
Many previous studies on usage and impact of these technologies have focused on
a single technology, such as Blackberry® (Schlosser, 2002), PDAs (Geisler & Golden,
2003), e-mails (Boneva, Kraut, & Frohlich, 2001; Gefen & Straub, 1997) and the
Internet6 (Adams et al., 2005; Anderson & Tracey, 2001). Most of the studies that looked
at technology influence in work/nonwork life issues used qualitative analyses with small
samples (Geisler & Golden, 2003; Jarvenpaa & Lang, 2005; Perry et al., 2001; Schlosser,
2002). Some studies adopted both quantitative and qualitative approaches (Chesley,
2005; Hill et al., 1998). Further, most of the research on ICT use and work/nonwork
interface have provided descriptive findings without substantial theoretical backing
(Jarvenpaa & Lang, 2005; Schlosser, 2002).
This thesis will address these shortfalls to provide a comprehensive analysis
backed by relevant theories to expand the understanding of the use of ICT cluster, its
impact on the work/nonwork interaction, and measures adopted by individuals in
6 The American Behavioral Scientist 2001, (45) 3 was a special issue addressing Internet usage.

31
mitigating ICT cluster influence on work-life balance. It is clear that ICT may affect
boundaries, or even become the vehicle for boundary straddling, and it is time that ICT
was expressly incorporated into work-life balance research.
32
CHAPTER 3 - HYPOTHESES
The literature review suggested some inconsistencies in the work/nonwork
literature, and there is much to be explored and validated on how ICT use affects an
individual‟s work/nonwork balance. The following section presents the hypotheses to be
tested which are grounded in established literature. In addition, several exploratory
analyses are proposed. Recall that the first task of this dissertation is simply to understand
individuals' ICT use. From then, the study turns to perceptions of the impact of ICT use
on work-life balance (WLB). To achieve this second task, it is necessary to develop a
path structure that examines components of work/nonwork interactions. Then, the
dissertation examines people‟s coping strategies and finally asks whether the model
developed in the dissertation is generalizable or culture-bound. This chapter will show
the development of the full model and propose a number of hypotheses that subject the
model to rigorous examination. In addition to hypotheses development, this chapter
introduces several research ideas explored in this study.
Factors Affecting Usage of the ICT Cluster
Over the last three decades there have been several models to explain why people
adopt or resist new ICT tools. One stream of research focused on individual acceptance
of technology by using intention or usage as a dependent variable. The most established
and cited work in this area is based on the technology acceptance model (TAM) by Davis
(1989), and its extensions such as TAM2 (Venkatesh & Davis, 2000) and the unified
theory of use and acceptance of technology (UTUAT) (Venkatesh et al., 2003). Another

33
parallel stream is the idea based on technology-task fit (TTF), which addressed the
utilization of technology from a different, although not entirely orthogonal perspective
(Dishaw & Strong, 1999).
Technology Acceptance Model (TAM) and Its Derivatives
Developed with its roots in the theory of reasoned actions (TRA), TAM theorized
that an individuals‟ behavioural intention to use a system was primarily determined by
two beliefs: perceived usefulness (i.e., the extent to which a person believed that using
the system would enhance his or her performance), and perceived ease of use (i.e., the
extent to which a person believed that using the system would be free of effort)
(Venkatesh & Davis, 2000). According to TAM, perceived usefulness was also
influenced by the perceived ease of use. TAM2 extended the concepts addressed in TAM
by incorporating additional theoretical constructs dealing with social influence processes
(i.e., subjective norm, voluntariness, and image) (Venkatesh & Davis, 2000).
These models for predicting technology have primarily focused on work-related
technology adoption and use, and concentrated on rational factors such as perceived
usefulness. As the origin for such theories was based on “reasoned actions” in work
settings, there has been scant attention towards emotional factors and influence from
nonwork factors in the prediction of technology usage.
This study aims to assess the use of ICT by managerial/ professional employees in
work and nonwork activities, especially focusing on technologies that enable connectivity
and accessibility anytime anywhere. A decade ago it would have been easier to separate
34
these technologies simply between computer related (e.g., e-mail and Internet) and
communication devices (e.g., telephones and pagers). However this division is not
straightforward now due to digital convergence (Yoffie, 1996). For example, today much
improved smart phones (e.g., BlackBerry®
and iPhone®) bring together the complete
package of voice, Internet, and e-mail functions in addition to extra features such as still
camera, video camera, MP3 player, radio, and GPS unit in the same handheld device.
Similarly, computers connected via Internet enable instant messaging and Voice over
Internet Protocol (VOIP) for voice communication. With laptops, Wi-Fi hotspots7, and
plug-in units that provide Internet access anywhere it is easy to use one‟s computer even
as a voice communication device while on the move. Therefore, the use of the ICT
cluster will be captured both as a function (e.g., e-mail, voice communication) and as
device usage (e.g., cellular phone, Blackberry®). In these circumstances, the traditional
theories of technology usage might no longer provide adequate insights into
understanding the phenomena explored in this research.
7 Wi-Fi provides wireless access to digital content. This content may include applications, audio and visual
media, Internet connectivity, or other data. Hotspots are venues that offer Wi-Fi access. The public can use
a laptop, WiFi phone, or other suitable portable device to access the Internet within the coverage of a
hotspot area. Hotspots are often found at restaurants, train stations, airports, military bases, libraries, hotels,
hospitals, coffee shops, bookstores, fuel stations, department stores, supermarkets, RV parks and
campgrounds and other public places. Many universities and schools have wireless networks in their
campus.

35
Individuals‟ use of ICT could be driven by several factors. Studies suggested that
factors such as age (Morris & Venkatesh, 2000; Morris, Venkatesh, & Ackerman, 2005),
gender (Ling & Haddon, 2001; Morris et al., 2005), education (Wei & Leung, 1999),
work characteristics such as industry, hours of work (Chesley, 2006; Katz, 1997), and job
demands (Chesley, 2006; Davis, 1989) also play a role in individual decisions to use
technology. Many technologies in the ICT cluster originated as work-related
technologies, but over time users have adapted them for more and more nonwork
activities (Katz, 1997). Therefore, family characteristics such as marital status, needs of
children (Katz, 1997; Rakow & Navarro, 1993), and level of income (Chesley, 2006; Wei
& Leung, 1999) could also affect the technology adaptation and use by individuals.
Chesley (2004) used a model of individual, job, and family characteristics as
predictors of technology use in a longitudinal study. She found that computer and
communication technology users tend to be consistent over time (from first wave to the
second wave of data collection), and job context variables were often significant
predictors of the technology use, unlike family variables. Expanding from previous work
(Chesley, 2004; Venkatesh et al., 2003), this study incorporated a similar model (Figure
1) to understand what factors affect the use of technology by individuals; i.e., how the
technology use is related to individual (e.g., age, gender, education, work salience,
nonwork salience, perceptions about ICT), nonwork (e.g., number of children, age
distribution of children, spouse‟s work, household income, and nonwork demands), and
work characteristics (e.g., work autonomy, work hours, work demands, work flexibility,
managerial status, and work experience). The next chapter will define and introduce each
of these variables in more detail.

36
Figure 1 : Factors affecting the use of the ICT cluster by individuals
The above relationships were assessed in an exploratory manner to identify
whether individual, work, and nonwork characteristics predicted different contexts of
technology use (such as work-related and nonwork-related) within the ICT cluster.
Four Quadrants of Work/ Nonwork Interaction
The literature reviewed in Chapter 2 suggested that work/nonwork interactions
could be differentiated direction-wise (i.e., family-to-work or work-to-family) and
quality-wise (i.e., positive or negative) (Crouter, 1984; Demerouti, Geurts, & Kompier,
WORK
CHARACTERISTICS
-Work autonomy
-Work demands
-Work flexibility
-Total hour of work
-Manager
-Org. support (R)
-Overall experience
NONWORK
CHARACTERISTICS
-Nonwork demands
-Number of children
-Married
-Household Income
INDIVIDUAL
CHARACTERISTICS
-Age
-Gender
-Education
-Impulsivity
-Conscientiousness
-Work salience
-Nonwork salience
ICT usage
Wk_WD/ Wk_NWD/ NWk_WD/ NWk_NWD

37
2004; Frone et al., 1992a, 1992b; Frone, 2003; Greenhaus & Powell, 2003; Greenhaus &
Powell, 2006; Grzywacz & Marks, 2000; Hill, 2005), as represented in Figure 2.
Figure 2 : Dimensions of work/ nonwork interactions
However, the use of bidirectionality of the work/nonwork interactions has not
been consistently practiced in work/nonwork literature as reiterated in multiple meta
analytical studies on work/nonwork interactions (Byron, 2005; Michel, Mitchelson,
Kotrba, LeBreton, & Baltes, 2009). Therefore, this study examined the work/nonwork
interaction variables to establish construct clarity, convergent and discriminant validity of
work/nonwork interaction variables (as per the four quadrants identified in Figure 2)
together with work-life balance as a separate construct. This research strategy may
answer ongoing questions of whether this four-part framework is conceptually and
empirically valid or should be modified or abandoned.

38
ICT Use and Work/ Nonwork Boundary Permeability
Figure 3 represents the research model used in this thesis. In the following section
each of these relationships are examined and explained in detail.
Figure 3 : Research model: Relationships between ICT use and work-life balance

39
Technology Use and Work/ Nonwork Conflict
Many studies suggested that ICT use led to a conflict situation between work and
nonwork domains (Chesley, 2004, 2005; Schlosser, 2002). Ullman (1997) described how
technology made work creep into nonwork life all the time creating conflict situations.
Individuals are known to pack their laptops, Blackberrys®, and cell phones along with
flip-flops, beach hats and sunscreens when they go for vacation, making it possible for
work to interfere with the nonwork life (Rothberg, 2006). Silver (1993) found that
professional female home-workers who relied on telecommunication modes to interact
with the workplace reported greater role conflict than on-site equivalents.
Describing the use of mobile phones, Green (2002) indicated there were both
positive and negative interaction effects of mobile phones in both directions of work to
nonwork and nonwork to work. For example, parents found that mobile phones allowed
them to keep track of their children, and children could call parents anytime at work,
however, this facility also added to the pressures of managing family activities while at
work (Green, 2002). Golden and colleagues found that a high level of telecommuting was
associated with high levels of family-to-work conflict (Golden et al., 2006). Therefore,
regarding the impact of the use of ICT cluster from the point of view of work/nonwork
theories, it appears that ICT use creates bridges (Clark, 2000) facilitating easy crossing of
the work/ nonwork border and thus creates border permeability (Ashforth et al., 2000)
leading to higher transfer of negative cross domain experiences. Therefore,
Hypothesis 1a: The higher the level of ICT use, the higher the level of
work-to-nonwork conflict experienced by the individual.
40
Hypothesis 1b: The higher the level of ICT use, the higher the level of
nonwork-to-work conflict experienced by the individual.
Technology Use and Work/ Nonwork Enrichment
Positive interactions across work/nonwork domains are situations where the role
performance in one domain is enhanced as a function of resources gained from another
(Grzywacz & Marks, 2000). Many studies have recognized the role of ICT to create
positive interaction by allowing individuals to perform tasks relating to both work and
nonwork domains, regardless of their location (D'Abate, 2005; Ling & Haddon, 2001;
Schlosser, 2002). For example D‟Abate (2005) identifies convenience, time constraints,
and time demands created by home life, timing of activities, and trade-offs as reasons for
individuals to perform nonwork related activities while at work via ICT means such as e-
mail and Internet. On the other hand, by providing 24/7 connectivity with the workplace
and enabling individuals to work anytime anywhere, ICT adds flexibility to life (Green,
2002; Schlosser, 2002) and lowers the friction between work and family (Golden et al.,
2006; Mazmanian et al., 2006; Senarathne Tennakoon & Taras, 2008). Thus, higher use
of ICT could lead to higher level of cross domain transfer of positive experiences.
Therefore,
Hypothesis 2a: The higher the level of ICT use, the higher the level of
work-to-nonwork enrichment experienced by the individuals.
Hypothesis 2b: The higher the level of ICT use, the higher the level of
nonwork-to-work enrichment experienced by the individuals.
41
Hypotheses 1(a,b) and 2(a,b) at first glance appear to be contradictory. However,
the extant literature suggests that intensity of ICT use can lead to both work/nonwork
enrichment and conflict. Basically, this is because ICT greatly enables more overlap
between the two domains, which can have both positive and negative consequences. The
main point here is that ICT usage is not an inconsequential behaviour; this study fully
expects that there will be implications for WLB based on the intensity of ICT usage.
Therefore, these hypotheses will be tested with the expectation of finding H1(a,b) and H2
(a,b) to be true.
Technology Use and Work/ Nonwork Segmentation
Nippert-Eng (1996) argued that boundaries between work and nonwork were on a
continuum where work and nonwork could be fully integrated and indistinguishable, or
fully segmented and distinct from each other, or somewhere in between. People who did
segment the two domains would not allow work to come to the nonwork domain and
vice-versa. This separation may be also observed in the use of technology. People could
use two cellular phones, keep separate e-mail addresses for work and nonwork
(Senarathne Tennakoon & Taras, 2008), use certain devices (e.g. Blackberry®) only for
work purposes (Geisler & Golden, 2003; Schlosser, 2002) or switch off devices while
away from work (Schlosser, 2002). However, the more prominent observations have been
that segmentation of the two domains will happen at an intermediary position rather than
an extreme position in a continuous scale (Ashforth et al., 2000; Nippert-Eng, 1996).
42
There appears to be strong empirical support for increased integration of the
work/nonwork domain with the use of ICT (Aoki & Downes, 2003; Gant & Kiesler,
2001; Olson-Buchanan & Boswell, 2006; Rakow & Navarro, 1993; Senarathne
Tennakoon & Taras, 2008). For example, teleworkers, who are heavy uses of ICT for
work, have reported their inability to separate the work and family domains (Ellison,
1999; Hill et al., 1998). Therefore;
Hypothesis 3: The higher the level of ICT use, the lower the level of
segmentation of work and nonwork domains.
Conflict, Enrichment, Segmentation, and Work-Life Balance
An important aim of this study is to explore how the use of technology affects
employee work-life balance; i.e., does the ICT cluster help individuals to satisfactorily
manage their work-life balance?
Joplin et al. (2007), using a sample of cross national participants, found that
work interference with family and family interference with work were both
negatively related to life balance. They also concluded that life balance was more
than the lack of work/nonwork conflict, in line with previous studies that have
suggested the same (Greenblatt, 2002; Marks, Huston, Johnson, & MacDermid,
2001). Frone (2003) considered work/family balance as the absence of conflict
together with work/family enrichment. Aryee, Srinivas, and Tan (2005) in their study
of Indian parents conceptualized the positive aspect of work-life balance to be
equivalent to facilitation and the negative aspect of work-life balance to be equivalent

43
to conflict. In line with recent thinking in the work/nonwork literature (Joplin et al.,
2007), it is argued that work-life balance is a distinct but related construct to conflict
and enrichment.
Therefore it is proposed;
Hypothesis 4a: The higher the level of work-to-nonwork conflict the lower
the level of work-life balance. In other words, work-to-nonwork conflict
and work-life balance are negatively correlated.
Hypothesis 4b: The higher the level of nonwork-to-work conflict the lower
the level of work-life balance. In other words, nonwork-to-work conflict
and work-life balance are negatively correlated.
Hypothesis 5a: The higher the level of work-to-nonwork enrichment, the
higher the level of work-life balance. In other words, work-to-nonwork
enrichment and work-life balance are positively correlated.
Hypothesis 5b: The higher the level of nonwork-to-work enrichment, the
higher the level of work-life balance. In other words, nonwork-to-work
enrichment and work-life balance are positively correlated.
For some individuals, segmentation may be the way to achieve a balance between
work and nonwork because it reduces interruptions and allows people to focus more
exclusively on their salient role (Ashforth et al., 2000; Rothbard, 2001; Rothbard et al.,
2005). Some argued that technology facilitates segmentation of work and nonwork
boundaries. For example Chesley stated “after all, e-mails can be filtered, calls can go to

44
voice mail (or be unanswered), and all these devices can be turned off. In this sense, then
technology solidifies, rather than blurs, boundaries between work and home” (2005:
1238). However, Chesley is conflating individuals‟ strategies for managing technology
usage with technology itself. It is the human who activates these segmentation processes.
Segmentation requires deliberate action; the default is a lack of action and this can
enhance the blurring of boundaries. Further, individuals may want to segment work and
nonwork to cope with differing expectations or norms of behaviour in the two domains
(Hewlin, 2003). Thus, some individuals may be attaining the balance between work and
nonwork roles by keeping them as separate as possible. Thus:
Hypothesis 6: The higher the segmentation of work and nonwork roles, the
higher the work-life balance. In other words, work/nonwork segmentation
and work-life balance are positively correlated.
Moderating Variables
The literature suggests that the direct relationships hypothesized above can be
affected by several moderating variables. The following section derives additional
hypotheses considering these moderating relationships.
Gender: Studies have reported that women tend to use ICT for multitasking in
trying to manage both work and family domains at the same time (Ling & Haddon,
2001). Rakow and Navarro (1993) and Vestby (1996) spoke of “remote mothering,” i.e.,
the use of telephone to communicate with children who have come home from school and
need to check in with their parents. Portable communication devices have removed any
45
location barriers in this communication story. Further, compared to men, women tend to
use more personal and family e-mails (Boneva et al., 2001) and have reported that
cellular phones help them to make personal lives less stressful (Rakow & Navarro, 1993).
For men, there was more access to the mobile phone via work (Ling & Haddon, 2001).
Even with changes that are taking place both at work and family atmosphere, women still
tend to undertake domestic responsibilities irrespective of their employment status, and
the so called second shift (Hochschild, 1989) remains stubbornly intact (Hyman &
Summers, 2004).
Pleck (1977) has suggested that the nature of the spillover is different and
asymmetrical for men and women. He proposed that for men, work most often has
intruded into the family environment, in terms of time and energy taken away from
family, whereas for women the overlap most often has gone in the opposite direction,
from family to work (Pleck, 1977). The studies which investigated the relationship
between gender and work/nonwork issues have found mixed results. While some studies
have found that there is no significant difference between men and women in
experiencing either work/family or family/work conflict (Eagle, Miles, & Icenogle, 1997;
Frone, Russell, & Barnes, 1996; Kinnunen & Mauno, 1998), others reported significant
gender difference in work/family conflict (Burley, 1994) with women having higher
levels of overload and domain interferences than men (Duxbury et al., 1994). As
Hochschild (1989) says, although there are changes taking place in both work and family
atmosphere, still women take more of the family burden, and thus, more likely to
experience conflict from nonwork-to-work direction. Also for men, the work boundary is
the more permeable one (Ling & Haddon, 2001). Therefore,
46
Hypothesis 7a: The relationship between the use of ICT cluster and work-
to-nonwork conflict is moderated by gender such that the hypothesized
positive relationship will be stronger for men.
Hypothesis 7b: The relationship between the use of ICT cluster and
nonwork-to-work conflict is moderated by gender such that the
hypothesized positive relationship will be stronger for women.
As discussed before, Pleck (1977) has suggested that spillover of experiences
across the work/ nonwork boundary would be different for men and women, with men
having more spillover from work and women from nonwork. Grzywacz and Marks
(2000) studied the association between certain factors and work-to-family facilitation
(and family-to-work facilitation) and found partial support for this. It is plausible that this
pattern of spillover effect would be present even in the positive aspects of interactions
and gender would have a moderating effect on work-to-nonwork enrichment and
nonwork-to-work enrichment. Therefore,
Hypothesis 7c: The relationship between the use of ICT cluster and work-
to-nonwork enrichment is moderated by gender such that the hypothesized
positive relationship will be stronger for men.
Hypothesis 7d: The relationship between the use of ICT cluster and
nonwork-to-work enrichment is moderated by gender such that the
hypothesized positive relationship will be stronger for women.
Further, studies suggest that women tend to use technology for both work and
nonwork activities. Rakow and Navarro (1993) described that women used mobile

47
phones to work the “parallel shift” of taking care of family matters while doing their
paying job, perhaps in addition to the “second shift” (Hochschild, 1989) of working at a
paying job followed by work at home. Thus, it seems that women tend to use technology
to travel across the work/nonwork boundary rather than to keep the two domains
separate. Therefore,
Hypothesis 7e: The relationship between the use of ICT cluster and
work/nonwork segmentation is moderated by gender such that the
hypothesized negative relationship will be stronger for women.
Age: Studies have suggested differences in technology adaptation and use based
on age of individuals (Morris & Venkatesh, 2000; Morris et al., 2005). Wei and Leung
(1999) found that cell phone users were younger, wealthier, and better educated than non-
users, and younger users used the devices for both work and nonwork related activities.
Aoki and Downes (2003) also found that young people tend to use cell phones in a
seamless manner for a variety of purposes. Thus, younger workers are expected to use
these technologies in a more boundary-permeating manner.
Therefore, compared to an older individual who is not accustomed to using ICT
for cross-domain interactions, a younger worker would experience high-level of cross-
domain interactions at all levels of ICT use. In other words, it is argued that there will not
be a significant variation in work/nonwork conflict based on the amount of ICT use for
the younger workers, as they would generally tend to use ICT in a seamless manner
compared to their older counterparts (Aoki & Downes, 2003; Wei & Leung, 1999). This

48
argument holds for both types of interactions, negative (i.e., conflict) and positive (i.e.,
enrichment). On the other hand, among older individuals, the heavy technology users can
be expected to demonstrate high work/nonwork interactions (both positive and negative)
with the increased use of technology compared to the low users of technology. Therefore,
it is proposed;
Hypothesis 8a: The relationship between the use of ICT cluster and work-to-
nonwork conflict is moderated by age such that the hypothesized positive
relationship will be stronger for older users.
Hypothesis 8b: The relationship between the use of ICT cluster and
nonwork-to-work conflict is moderated by age such that the hypothesized
positive relationship will be stronger for older users.
Hypothesis 8c: The relationship between the use of ICT cluster and work-
to- nonwork enrichment is moderated by age such that the hypothesized
positive relationship will be stronger for older users.
Hypothesis 8d: The relationship between the use of ICT cluster and
nonwork-to-work enrichment is moderated by age such that the
hypothesized positive relationship will be stronger for older users.
The younger generation have grown up with the technology and have used it for
both work and nonwork activities all along (Aoki & Downes, 2003; Kazmer &
Haythornthwaite, 2001). Therefore, even with limited use of technology, they would tend
to use it in both work and nonwork domains resulting in low levels of segmentation

49
across the domains. On the other hand, older individuals could experience considerable
reduction in work/nonwork segmentation with the increased ICT use. Therefore it is
proposed that the intensity of the negative relationship between work/nonwork
segmentation and the use of ICT cluster and would be stronger for older people compared
to the young; i.e., the slope of relationship between segmentation and use of ICT will be
sharper for older people, since they are expected to experience a greater reduction in
work/nonwork segmentation with the increased use, whereas the younger people would
have had low levels of work/nonwork segmentation even with limited ICT use.
Hypothesis 8e: The relationship between the use of ICT cluster and
work/nonwork segmentation is moderated by age such that the
hypothesized negative relationship will be stronger for older users.
Perceptions about ICT Use: Users of the ICT cluster have diverse reasons for
using the technology. Many studies in the Management Information Systems (MIS)
literature addressed issues related to user acceptance of information technology based on
the Technology Acceptance Model (TAM) and its derivatives (Davis, 1989; Davis et al.,
1989; Taylor & Todd, 1995; Venkatesh & Davis, 2000; Venkatesh et al., 2003). The
basic premise of TAM is that perceived usefulness and ease of usage of technology
predicted current and future use of technology (Davis et al., 1989; Taylor & Todd, 1995).
From a qualitative analysis of Blackberry® users, Schlosser (2002) identified that
organizational and individual prestige also played a role in adopting these devices. She
also identified that individuals developed positions about etiquette of usage, managing
50
the issues of work overload, continuous connectivity, and work spilling over to the
nonwork domain. Adaptation of the use of technology depended upon each individual‟s
interpretation of the wireless technology and “[users had to] redraw the lines between
work and family time, sometimes more definitively; other times with a blended stroke”
(Schlosser, 2002: 418).
It appears that perceptions of usefulness, ease of use, and other individual
preference criteria shape an individual‟s adoption of ICT and these perceptions can affect
the outcomes experienced by the uses at the work/nonwork boundary. For example, if a
person believes that technology is an asset for her to attend to some of the work e-mails
during a family vacation, then she will view technology as a tool for work/nonwork
enrichment. However, for others the ability to be contacted at all times may result in
conflict. Some might believe that they could switch off the mobile phone and thus keep
their work and family time separate. Therefore, perceptions and affiliations towards
technology may affect the perceived outcomes at the work/nonwork border.
Therefore, it is proposed that the positive perception of ICT usefulness will
enhance the positive experience (i.e., enrichment) and diminish the negative experience
(i.e., conflict) of the ICT influence on work/nonwork interactions. Further, it is proposed
that individuals with positive perceptions about ICT will use technology to reduce the
segmentation between work and nonwork lives. This literature leads to the final
hypotheses:
51
Hypothesis 9a: The positive relationship between ICT use and work-to-
nonwork conflict will be less strong for individuals who have higher
perception of the usefulness of ICT.
Hypothesis 9b: The positive relationship between ICT use and nonwork-
to-work conflict will be less strong for individuals who have higher
perception of the usefulness of ICT.
Hypothesis 9c: The positive relationship between ICT use and work-to-
nonwork enrichment will be more strong for individuals who have higher
perception of the usefulness of ICT.
Hypothesis 9d: The positive relationship between ICT use and nonwork-
to-work enrichment will be more strong for individuals who have higher
perception of the usefulness of ICT.
Hypothesis 9e: The negative relationship between ICT use work/nonwork
segmentation will be more strong for individuals who have higher
perception of the usefulness of ICT.

52
Other Exploratory Analyses
In addition to the hypothesized relationships in Figure 3, some other relationships
which are not fully explored in the literature are also addressed in this research.
Differences in Types of Technology
Depending on their functionality, different ICT devices are expected to have
varied influence on both positive and negative spillover effects. Chesley (2005) suggested
that mobile phone usage created more spillover compared to computer technology usage.
The popularity of Blackberry® and other smart phones have increased tremendously
since data was collected for Chesley‟s study and these devices have become useful tools
for many managers and professionals. The number of Blackberry® subscribers have
doubled from 2.5 million in 2005 to 4.9 million in 2006 (RIM, 2007). The main
advantage of Blackberry® and other smart phones over the normal cell phone is the
ability to send and receive e-mails independent of the location. Based on past research it
is proposed that there will be more spillover effects from portable communication devices
compared to traditional computer technologies (i.e., e-mail and Internet use). However, at
this point no assumptions are made about the directionality of the variation in spillover in
relation to different technologies.
It is important simply to flag this issue and to be sensitive to the possibility of
different effects based on the type of portable device that an individual. It should be noted
that at the time my data collection was conducted, the i-Phone® was not as ubiquitous as
the Blackberry®, and there were few products other than the Blackberry® that had as
53
much convergence of different functions in one device. However, the terrain changes
very quickly and multi-purpose devices are becoming the norm. This dissertation reports
research subjects‟ speculations on differences within the ICT cluster even though these
may end up being less relevant to future research in the light of advancements in hand-
held device technology.
Individual Differences in Technology Use
One of the under-explored aspects of both ICT research and WLB research is the
role of individual-level differences in personality. Studies have looked at individual
differences in technology acceptance and adoption focusing on demographic variables
(e.g., age and education) (Agarwal & Prasad, 1999; Palen, Salzman, & Youngs, 2000).
Business magazines and the public press has covered the concept of addiction to
technologies such as Blackberry® (Craig & Zuckerman, 2007; McIntyre, 2006; Reuters,
2006). The Blackberry® is sometimes referred to as “CrackBerry” (Waters, 2005) and
Kirwan-Taylor (2006) describes the “continuous partial attention syndrome” where there
is an inherent need to check e-mails as soon as one gets a message or to secretly check
the Blackberry® while in a meeting. These public press articles suggest that there may be
personality differences such as impulsivity and addictive behaviour that affect how
individuals perceive and use technology (see also academic research by Steel (2007;
2010b)).
This dissertation held open the idea that personality might play a role in the
relationship between ICT and WLB, and therefore included a set of measures on

54
impulsivity and conscientiousness simply to explore the effects of two appropriate
personality-based constructs. It is plausible that individual differences in personality play
a role above and beyond demographic variables such as age and gender in determining
the use of ICT cluster.
Comparative Analysis Between a Developing and a Developed Country
Most work/nonwork interface and ICT research have focused on industrialized
countries from North America, Europe, and highly industrialized Asian societies such as
Japan and Singapore (e.g., Aryee, 1992) with only a handful of studies looking at
developing countries (e.g., Aryee et al., 2005; Joplin et al., 2007; Poster & Prasad, 2005;
Rajadhyaksha & Bhatnagar, 2000). There may be generalizability issues arising from
exclusive focus on highly-developed economies. The current study incorporates data
from two countries that have distinct characteristics in terms of economic development,
political stability, culture, and technology penetration. Therefore, this study will add to
the literature by providing data from both a developed and a developing country in
relation to both ICT usage and work/nonwork interactions.
55
CHAPTER 4 - METHOD
Sample
Selection of Countries and Participants
The study sample comprised managers and/or professionals8 who were not
directly compensated for overtime work (HRSDC, 2006; USDL, 2005). These managers/
professionals have high autonomy at work with more cognitive work demands, fulfilling
supervisory responsibilities, and overseeing the operations of business units or processes.
These criteria enable the performance of some of job-related duties outside regular work
locations and time, especially with the use of ICT. For the purpose of this study, the focus
was on the use of ICT devices by managers and/or professionals from two countries,
Canada and Sri Lanka, acknowledging that professionals and managers do not represent
the general population of the two countries.
According to the International Telecommunication Union (ITU), the digital divide
has been shrinking in terms of number of fixed phone lines, mobile subscribers, and
Internet users over the last decade (ITU, 2007). However, there is still at least a fourfold
difference between telephone subscribers (both cellular and fixed) and an eightfold
difference in the number of Internet users between the developed and developing world
(ITU, 2005).
8 A manager is defined as a person whose work or profession is management. A professional is defined as
“having a particular profession (i.e., a calling requiring specialized knowledge and often long and intensive
academic preparation) as a permanent career (Merriam-Webster‟s online dictionary).

56
This is the case of the two countries selected for the research as described in
Table 1. Compared to other ICT services, Sri Lanka is not too far behind Canada in the
use of cellular phones.
Table 1: Basic ICT related statistics of Canada and Sri Lanka
Indicators Canada Sri Lanka
Gross National Income per Capita in US$ (2007) 38,974 1,352 Population (2007) 32.88 Mn 19.3 Mn Telephone subscribers per 100 inhabitants (2007) 117.16 55.58 Main Telephone lines per 100 inhabitants – (2007) 56.64 7.6 Main telephone lines per 100 inhabitants – Compound Annual Growth Rate (from 2002-2007 as a %)
-3.4 26.6
Cellular mobile subscribers per 100 inhabitants in 2007 61.68 41.37 Cellular mobile subscribers - Compound Annual Growth Rate (2001-2007 as a %)
17.4 53.7
Internet users per 100 inhabitants (2007) 76.77 4.00 Broadband subscribers per 100 inhabitants (2007) 27.60 0.33
Source : International Telecommunication Union, 2008 (http://www. itu. int/ITU-
/ict/statistics/). Since the data was collected in 2008, statistics relevant to that year is
presented.
Besides the digital divide, the two countries differ in general living standards,
culture, political stability, and security levels. Sri Lanka has been engaged in sectarian
strife for over two decades which had adverse impacts on the economy and the lives of its
citizens. By contrast, Canada has had a relatively stable and safe political climate. The
researcher‟s ease of access and availability of contacts combined with the countries‟
remarkable differences made Sri Lanka and Canada the selected countries for the study.

57
Data Collection Methods
Today scholars are encouraged to conduct research that is not compartmentalized
as qualitative or quantitative (Johnson & Onwuegbuzie, 2004). Mixed method research is
put forward as a healthy and natural complement to traditional quantitative or qualitative
methods alone. Further, a combination of both methods allows the researcher to get the
best of each, to minimize individual deficiencies (Johnson & Onwuegbuzie, 2004), and to
increase the convergent validity of findings. Therefore, this study triangulates findings
from a quantitative survey and qualitative interviews across the two countries. The
following section covers the data collection methods and the profile of participants in
each data stream.
Interviews
The prior literature on ICT use and WLB was not too strong. Although some
hypotheses could be developed based on deductive techniques, there was a lack of solid
research instruments. For this dissertation, therefore, it was important to develop a deeper
appreciation of the phenomena before commencing a quantitative design. Probing
respondents in interviews could help operationalize variables and develop a vocabulary
for ICT usage, work/nonwork effects, and WLB. After gathering quantitative data,
interview responses could help interpret results and add nuances to the statistics.
Rubin and Rubin (1995) define qualitative interviewing as a research tool, an
intentional way of learning about people‟s feelings, thoughts, and experience (p. 2). The
interview process shall be guided by the researcher, and interviewees are encouraged to
58
reflect in detail on events they have experienced; this is an attempt to understand the
interviewees‟ world from their own perspective. Qualitative interviewing requires
listening carefully to capture the meaning, interpretation, and understandings that give
shape to the world of the interviewee (Rubin & Rubin, 1995). Based on these guidelines a
semi-structured approach to interviewing was followed with questions guided by a pre-
designed protocol (Annex 1) but allowing open-ended responses by interviewees. This
facilitated a rich flow of data from participants without restricting their thought
processes.
Sixteen Canadians and 20 Sri Lankans from the target population participated in
the semi-structured interviews. About two thirds of the interviews were done in the
Spring of 2006, in advance of the questionnaire design for the survey, to improve the
questionnaire content and relevance of the questions. The remaining interviews were
completed after the survey, in order to probe its findings. To improve understanding
(both before and after the survey) “critical incident method” (Flanagan, 1954) was used
to force respondents to illustrate their points with concrete examples.
Initial participants were selected based on available contacts, focusing on users of
the ICT cluster with different levels of family commitment (e.g., single, single with
children, married with no children, and married with children). A snowballing technique
(Martins, Eddleston, & Veiga, 2002) whereby earlier respondents suggested additional
names was used to recruit additional participants for interviewing. These participants
represented a wide range of industries including telecommunications, railways, legal,

59
education, banking, manufacturing, oil and gas, and software development. The profile of
interview participants is presented in Table 2.
Table 2: Profile information of interview participants
Canada Sri Lanka
Total
Sample
Total Participants 16 20 36
Gender
Men
7 14 21
Women
9 6 15
Age group
Below 35 years 7 8 15
35-45 years
4 10 14
45-55 years
3 2 5
55 and above 2 0 2
Mean age (years)/
(Std. dev)
40.6./
(13.9)
36.7/
(6.5)
38.4/
(10.4)
Married (%) 75 80 78
% with children 69 60 64
The interviews lasted between 45 minutes to 75 minutes and were recorded with
the permission of the participants. Except for one, all participants consented to voice
recording. Although brief notes were kept during the interviews, the primary source of
transcribed data was voice recordings. The data were transcribed using a two stage
process where the main text of sentences were captured in the first run, and in the second
run the transcribed text was updated while listening to the tapes for subtle nuances,
pauses and exclamations. Transcriptions were coded for common topics and themes that
emerged from the data itself, and also based on the theoretical grounds for the analysis.

60
Later these transcriptions were revisited to check the validity of the quantitative study,
and to find illustrations of key findings.
Survey Using a Web-Based Questionnaire
A questionnaire was used to reach out to a large participant pool to enable a more
comprehensive and generalizable analysis. Questionnaire design and development
followed the process outlined in Kline (2005b) and Lester and Bishop (2000).
Prior to questionnaire design, a series of interviews was conducted with
individuals from the target population to identify and clarify the meaning of major
concepts addressed in the study such as work/nonwork conflict, work-life balance, and
implications of ICT use. Constructs were then defined based on these findings and the
literature. Most of the concepts had established scales from past research. However, there
was lack of consistency in regard to work/nonwork interaction scales (i.e., conflict,
enrichment, segmentation, and balance) in the literature. Therefore, several scales from
previous studies were scrutinized and adapted to fit the current study.
The preliminary questionnaire was pilot tested with 25 individuals whose
feedback was incorporated to improve the relevance and understanding of the items by
the target population. The initial pilot tests were conducted in paper and pencil mode with
PhD students and faculty of the University of Calgary. Subsequent pilot tests used the
web-based questionnaire and participants from the target population. After several rounds
of fine tuning, the final version of the questionnaire was launched as a large-scale web-
based survey in early 2008, to capture the use of ICT devices and the influence of such

61
devices on individuals‟ work and nonwork lives. The copy of the survey is presented in
Appendix 2.
There has been concern about the validity of using web-based surveys (see
Gosling et al., (2004) for a discussion). However, in this study the target audience was
ICT users, and electronic media was considered the most appropriate channel to enhance
the response rate. The goal was to accumulate responses until there were sufficient
observations from Canada and Sri Lanka to avoid small sample problems and to increase
the power of statistical tests. GPOWER software for power analysis (Erdfelder, Faul, &
Buchner, 1996) suggested that in order to detect small effect sizes of .25 or more at .8
power levels the sample should be 398. Thus the target was to collect between 400-500
responses.
The survey was administered through professional organizational mailing lists,
university alumni mailing lists, organizational mailing lists (e.g., City of Calgary), and
personal contacts. For the mailing lists, an e-mail invitation to participate in the study was
sent with an embedded link to the online survey, and three weeks later a reminder e-mail
was also sent. A similar process was adopted for personal contacts where a reminder was
sent after the initial point of contact. The web link also provided a copy of the ethics
clearance for participants to view. The participants were offered an option to participate
in a prize draw worth 100 Canadian dollars as an incentive to complete the survey.
Due to the nature of participant selection, the sample was neither random nor
necessarily representative of the general population. Further, it was not possible to
calculate a response rate because participants were urged to pass along the survey request
to their colleagues, and because some addresses in the mailing lists were out of date. The

62
web-based survey technology yielded an estimate that 75 percent of individuals who
logged onto the online survey did complete it.
There was greater success with the Canadian effort, which produced 425 usable
responses, than with the Sri Lankan sample of 109 usable responses. Much of the
explanation of the different subsample sizes derives from the less-developed use of e-
mail group lists in Sri Lanka, necessitating greater effort and use of personal contacts and
snowball sampling techniques.
Problems Associated with Multi-Cultural Data Collection
Language: The survey was conducted in English. This was not considered an
issue in relation to the Canadian participants. For Sri Lanka whose official languages are
Sinhalese and Tamil, the requirement of a translated questionnaire was discussed at the
initial interview stage as well as at pilot testing stages. These participants unanimously
agreed that there was no requirement to offer a Sinhalese or Tamil translation of the
questionnaire for Sri Lanka since English being the business language, all participants
would be conversant in English. The survey enabled individuals to select their responses
based on the country of origin. In fact, since some of the list servers (e.g., alumni list
servers) had subscribers from around the world, the questionnaire specifically asked
about the country of residence of participants and it was possible to identify responses
based on country at the analysis stage.
Response Style and Biases: Multiple studies have confirmed a significant effect
of cultural background on response style when using Likert-type scales (Chen, Lee, &

63
Stevenson, 1995; Cheung & Rensvold, 2000; Harzing, 2006; Hui & Triandis, 1989;
Johnson, Kulesa, Llc, Cho, & Shavitt, 2005). Two types of response bias are generally
discussed: extreme response bias and acquiescence bias. The first refers to a systematic
tendency to over-express agreement or disagreement by choosing anchors of the Likert-
type scale. Its opposite is a systematic tendency to moderate responses, as expressed
through the inclination to choosing middle anchors on the scale (known as acquiescence
bias) (Bennett, 1977). Some studies suggest that survey response style is determined by
culture, that is, some cultures favour extreme responses, while others favour middle
points on the scale (Bennett, 1977; Javeline, 1999). Some studies have shown that
respondents from some cultures are more prone to agreeing with survey questions
(Bennett, 1977; Marin, Gamba, & Marin, 1992; Marin, Triandis, Betancourt, & Kashima,
1983; Smith, 2004) which makes a direct cross-cultural comparison less meaningful if it
is done strictly on a mean-comparison perspective.
Handling Response Bias Issues: Several techniques have commonly been
employed to correct for response bias. Combining positively and negatively worded items
in a single instrument is a simple method for correcting for acquiescence (Smith, 2004),
but it does not correct for extreme response bias. Event-count items or frequency scales
offer a partial solution for the response style bias. Rather than asking for an answer on a
Likert-type scale, the survey inquires about a specific number of incidents, number of
hours, or percentage of time that the respondent behaves in a certain way. Campbell and
Fiske (1959) noted that different item formats within a questionnaire could be considered
different methods.
64
This survey used different types of questions as discussed above in order to
minimize response bias. For example, technology use was measured based on actual
usage, perceived frequency of use, and by identifying most important technologies for
work and nonwork purposes. An example question for measuring actual hours was,
“Think of a typical WORKING day and a NON WORKING day during the last week.
Give the best possible estimate for the number of hours spent using each of the following
technologies – use of e-mails for work-related activities.” Respondents selected one
alternative among “none, less than 1 hour, 1-2 hours, 2-3 hours, 3-5 hours, and more than
5 hours.” For frequency of use, the question asked “how often do you use [e-mail] for
work-related activities,” and responses were on a Likert type scale ranging from “never”
to “all the time.” Respondents also ranked the most important technology in work and
nonwork situations (i.e., e-mail, Internet, cell phone, Blackberry®, and laptop). Using
multiple types of questions in the same survey, thus allowed me to reduce response biases
discussed above, and also provided the opportunity to cross-validate responses to assess
validity and reliability of data.
Data Cleaning
There were 634 fully or partly completed usable surveys. Of the 634 usable
surveys, 44 were at different levels of completion beyond the 50% mark. To maintain
consistency across all analyses, these 44 responses were also eliminated, resulting in 590
responses. Of these, 56 responses were from countries other than Canada and Sri Lanka,
resulting in 534 responses directly attributable to Canada and Sri Lanka.

65
Normality Check and Outliers
Normality Check: AMOSTM
17.0 (Arbuckle, 2008) provides the option to test for
normality of data (skewness and kurtosis) as well as to detect outliers. Most variables
included in the model showed departures from normality that could lead to problems in
the analysis and interpretation of results. The primary method of data analysis is
Structural Equation Modeling (SEM) using Maximum Likelihood (ML) estimation. The
literature suggests that measurement parameters, structural disturbances, and coefficient
estimates generated by ML are usually robust against departures from normality (Bollen,
1989). However, chi-square and standard errors for significance test statistics from ML
may not be robust to departures from normality (Bollen, 1989; Chou, Bentler, & Satorra,
1991). Therefore, correction mechanisms were used to address departure from normality
in the analysis stage.
Outlier Analysis: Outlier analysis was conducted for each variable included in the
model and also to test for multivariate outliers using PASW® 17.0 (SPSS, 2009)
Mahalanobis‟s distance criteria. There were 10 observations highlighted as multivariate
outliers. These were individually checked to see if they were true outliers or valid
observations. After careful consideration these responses were left in the analysis as they
did represent some individuals in the selected population. Further, the analyses with and
without the highlighted outliers and the results of the hypothesized models did not show
any significant change (both for parameter estimates and model fit indices).
66
Measures in the Survey
Measures of ICT Usage
This study focused on use of a cluster of IC technologies, namely e-mail, Internet,
and portable communication devices such as cell phones and Blackberry®. As discussed
earlier, the aim was to ascertain the usage of such devices/ technologies for both work
and nonwork purposes in both work and nonwork situations. Therefore respondents
reported their estimated hours of use of each of the above technologies in a typical work
day and a nonwork day for both work-related and nonwork-related activities. (See
Appendix 2, survey page 7 for the measures used). Respondents selected the hours of
usage from five intervals (i.e., none, less than 1 hour, 1-2 hours, 2-3 hours, 3-5 hours, and
more than 5 hours). These intervals were carefully selected based on the feedback from
participants in the pilot testing stage of the survey. The pilot survey also suggested that
requesting actual hours of use taxed respondents‟ minds too much and thus would have
discouraged some participants from completing the survey or answering this question at
all. Therefore, using the intervals was considered a fair trade off between obtaining the
precise hours of usage and losing responses in the survey.
Selecting an interval scale to measure a continuous construct (in this case hours of
ICT use) creates scale coarseness, which could result in a downward bias in observed
correlations (Aguinis, Pierce, & Culpepper, 2009). However, in this case the coarseness
is managed by selecting relatively small intervals (i.e., mostly one hour, and maximum of
two hour apart, rather than several hours), which in effect result in a maximum deviation
of 60 minute (mostly 30 minutes) from the actual hours of usage. Considering the type of

67
information collected, selecting an interval scale justified to the alternative of putting an
excessive burden on the respondents.
For descriptive analyses these values were converted to approximate hourly
figures using the midpoint, and the value of 6 hours was used for the range "greater than
5 hours." Thus, the hourly measure does not represent the exact number of hours, but a
very close approximation (since the range within each choice is small). Further,
participants also reported, in their opinion, the most important technology for work
purposes and nonwork purposes separately. They also reported how often each of these
technologies were used for work and nonwork on a 7-point scale ranging from "never" to
"all the time," with an option for "not applicable," or "don't use." Work-related ICT use
(in hours) correlated positively with the perceived frequency of work ICT use (r=.51,
p<.001) and nonwork-related ICT use (in hours) correlated positively with the perceived
frequency of nonwork ICT use (r=.41, p< .001), providing evidence for the reliability and
validity of the measure.
Dependent Variable
Work-Life Balance: The literature demonstrated an inconsistency with regard to
measuring work-life balance. In some cases, work-family conflict scales have been used
to measure work-life balance (e.g., Aryee et al., 2005). For the purposes of this study
recall that work-life balance was defined as, “the extent to which effectiveness and
satisfaction in work and nonwork roles are compatible with an individual‟s life values at
a given point in time,” a definition adopted from Greenhaus and Allen (2011). A close

68
examination of the literature suggested that these criteria were best captured by eight
items of integration and equilibrium dimensions of the newly-developed life balance
scale by Joplin et al. (2007) 9. Further, the scale items were developed based on data from
Eastern and Western cultures (Joplin et al., 2007). Since the current study also straddles
data from both these cultures, it was felt that this scale would fit the study purposes
better. Note that the “investment” dimension in Joplin et al. (2007) was not used as the
items in the investment dimension appeared to capture work-to-family conflict rather
than work-life balance as per the definition used in this thesis. Responses were given on a
seven point scale ranging from “strongly disagree” to “strongly agree.” The reliability
estimate based on Cronbach‟s alpha for the eight-item scale was .89. Following the
confirmatory factor analysis (See Chapter 7 – Measurement model) two items had to be
removed due to lower loading on the latent factor. The remaining six items recoded a
reliability estimate of .88. See Box 1 for the individual scale items.
Work/ Nonwork Interaction Variables
Work-to-Nonwork Conflict and Nonwork-to-Work Conflict: Work/nonwork
conflict was measured by the four-item work-family conflict scale and four-item family-
work conflict scale developed by Netmeyer et al. (1996). Since the focus of this study
stretched beyond family to all aspects of nonwork life (e.g., education, leisure, care
giving, and family responsibilities), the word “family” in the original items was replaced
9 In the current study all eight items from integration (four items) and equilibrium (four items) loaded on to
the single construct of work-life balance as seen in Table 9 and Figure 11 of Chapter 7 of this dissertation.
Therefore, work-life balance was considered as a single dimension item in this study.
69
by the word “nonwork.” Responses were based on frequency of experience using a
seven-point scale ranging from “never” to “all the time.” The scale items are stated in
Box 1. Both work-to-nonwork conflict and nonwork-to-work conflict scales
demonstrated high reliability statistics with Cronbach‟s alpha values of .92 and .82
respectively.
Work-to-Nonwork Enrichment and Nonwork-to-Work Enrichment: These two
variables were measured with the three-item scales (see Box1) adopted from Grzywacz
and Bass (2003). Similar to the conflict scales, the word “home” was replaced by
“nonwork” to reflect the broader perspective of the current study. Responses were based
on frequency of experience on a seven-point scale ranging from “never” to “all the time.”
The reliability coefficients for three-item enrichment scales were .74 (work-to-nonwork)
and .61 (nonwork-to-work). The results showed the “item if deleted” alpha value was
higher for item 2 in the case of nonwork-to-work enrichment. This item was later
removed after the confirmatory factor analysis stage and resulted in an alpha value of .65.
Please refer to Chapter 7 for details of confirmatory factor analysis of work/nonwork
interaction variables.
Segmentation (Work/nonwork Blurring) Scale: The four-item scale was
adopted from Desrochers et al.‟s work-family blurring scale (Desrochers, Hilton, &
Larwood, 2005) and Sumer and Knight‟s segmentation scale (Sumer & Knight, 2001).
See Box 1 for the scale items. Responses were on a seven-point scale ranging from
“strongly disagree” to “strongly agree” with two reverse coded items (i.e., items 1 and 3)

70
where high values represented high integration. Cronbach alpha for the scale was only
.58 with item 3 demonstrating low correlation with item 2. This could be due to the fact
that some individuals might not be working at home as indicated in item 3. Due to the
poor reliability of the Segmentation scale, this variable was altogether dropped from the
analysis as it could affect the stability of the overall model.

71
Box 1: Scale items for work/nonwork interaction variables
Work-to-nonwork conflict (adopted from Netmeryer et al, 1996)
WFC1 The demands of your work interfere with your private (non-work) life. WFC2 The amount of time your job takes up makes it difficult to fulfill non-work responsibilities.
WFC3 Due to work-related duties, you have to make changes to your plans with your non-work activities.
WFC4 Your job produces strain that makes it difficult to fulfill private (non-work) duties.
Nonwork-to-work conflict (adopted from Netmeryer et al, 1996)
FWC1 The demands of your private (non-work) life interfere with work-related activities.
FWC2 You have to put off doing things at work because of demands on your time in your private (non-work) life.
FWC3 Strain related to your private (non-work) life interferes with your ability to perform job related duties.
FWC4 Your private (non-work) life interferes with your responsibilities at work such as getting to work on time, accomplishing daily tasks, and working overtime.
Work-to-nonwork enrichment (adopted from Grzywacz and Bass, 2003)
WFE1 The things you do at work make you a more interesting person outside work.
WFE2 The skills you use on your job are useful for things you have to do outside of your work.
WFE3 The things you do at work helps you to deal with personal and practical issues outside work.
Nonwork-to-work enrichment (adopted from Grzywacz and Bass, 2003)
FWE1 The love and respect you get in your non-work life makes you feel confident about yourself at work.
FWE2 Talking to someone at outside of work helps you to deal with problems at work.*
FWE3 Your private (non-work) life helps you to relax and feel ready for the next day’s work.
Work-life Balance (adopted from Joplin et al., 2007)
WLB1 I can move easily from private (non-work) obligations to work obligations without experiencing negative feelings.
WLB2 I do what is important to me to keep balance in my life.
WLB3 I have a lot of demands on my time but I think that I handle them well.
WLB4 I have established priorities for my work and personal life.
WLB5 I am able to balance the conflicting demands of my job and personal life.
WLB6 I don’t overextend myself in one aspect of my life to the detriment of another aspect.
WLB7 I can move easily from work to private (non-work) obligations without experiencing negative feelings.
WLB8 My relationships with work associates, friends, and family are not in competition with each other.
Segmentation (adopted from Desrochers et al. , 2005 and Summer and Knight, 2001)
SEG1 It is often difficult to tell where my work life ends and my private (non-work) life begin.*
SEG2 When I leave office at the end of the day, I leave all the work issues behind me.*
SEG3 I tend to integrate my work and private (non-work) duties when I work at home.*
SEG4 I discourage my friends and family from contacting me when I am at work.*
* Items removed in subsequent analysis

72
Measures of Work, Nonwork, and Individual Characteristics
To explore the factors affecting the use of ICT by individuals, the study gathered
data relating to work, nonwork, and individual characteristics (See Chapter 3, Figure 1).
Based on the literature review, several variables were identified as important predictors
of ICT use. In particular, work autonomy, work demands, work flexibility, work hours,
managerial status, overall experience, and organizational support were identified as
relevant work characteristics, whereas number of children, nonwork demands, marital
status, and household income were captured as relevant nonwork characteristics. Further,
age, gender, education, work salience, nonwork salience, impulsivity, and
conscientiousness were identified as relevant individual characteristics. The next section
presents the scales used to measure these constructs. Scale items for work characteristics
and individual characteristics are detailed in Box 2 and Box 3 respectively.
Work Autonomy: The four-item scale was adopted from Parasuraman and Alutto
(1981) and Ayree (1992). It used a seven-point Likert scale ranging from “strongly
disagree” to “strongly agree.” Cronbach‟s alpha for the scale was .77. After the
confirmatory factor analysis WK_AUTO4 was subsequently removed from the scale still
resulting in an alpha value of .77.
Work Demands: This was measured via the four-item time pressure subscale
from Matteson and Ivancevich‟s (1987) Stress Diagnostic Survey. Responses were on a
seven-point Likert scale ranging from “strongly disagree” to “strongly agree.” The same

73
items have been used by Kinicki and Vecchio (1994). Both previous studies reported
reliability coefficients in excess of .77; the reliability for this study was .84.
Work Flexibility: The four-item scale is a reduced version of the flexibility
measures used by Chesley (2004). The items closely follow the scale used by Clark
(2001), using a seven-point Likert scale with responses ranging from “strongly disagree”
to “strongly agree.” Cronbach‟s alpha for the scale was .73. The results showed the “item
if deleted” alpha value was higher for item 3, and was subsequently removed after the
confirmatory factor analysis. The three items resulted in an alpha of .77.
Work Hours: Respondents reported hours spent for work-related purposes both at
work locations and at home.
Organizational Support: The four-item scale of non-supportive organizational
culture in Hill (2005) on a seven-point Likert scale was used. Cronbach‟s alpha for the
scale was .83.
Other Work-Related Variables: Participants indicated whether they were in a
managerial position, their number of subordinates, and their overall experience in years.

74
Box 2: Scale items for the measures of work characteristics
Work Role Salience and Nonwork Role Salience: The four-item, seven-point
Likert scale ranging from “strongly disagree” to “strongly agree” was adopted from the
role salience scale in Eddleston, Veiga & Power (2006). For the purposes of this study
the word “career” in the original scale was replaced by the word “work”. Cronbach‟s
alpha for the scale was .80. For the nonwork salience scale, the word “career” was
replaced with “nonwork.” The reliability estimate for this scale was .78. Subsequent to
Work Autonomy (adopted from Parasuraman and Alutto, 1981 and Ayree, 1992)
WK_AUTO1 I have a considerable control in determining my pace of work.
WK_AUTO2 I have a considerable control in setting my task priorities.
WK_AUTO3 I have a considerable control in setting my work goals. WK_AUTO4 I have a considerable freedom of choice in how to approach the job.*
Work Demands (adopted from Matteson and Ivancevich, 1997 – Stress Diagnostic Survey)
WK_DMND1 There is just not enough time to do my work.
WK_DMND2 I am constantly working against the pressure of time.
WK_DMND3 The time deadlines for completing my work assignments are too unreasonable.
WK_DMND4 I have to rush in order to complete my job.
Work Flexibility (adopted from Chesley, 2004)
WK_FLEX1 I have considerable choice in determining whether I work at home instead of at my usual workplace.
WK_FLEX2 I have considerable choice in determining the number of hours I work each workday or workweek.
WK_FLEX3 I have considerable choice in determining when I take vacations or a few days off.*
WK_FLEX4 I have considerable choice in determining when I begin and end each workday or workweek.
Organizational Support (adopted from Hill, 2005)
OGR_SUP2 In my organization putting family needs ahead of job is NOT viewed favorably. ORD_SUP1 My organization considers work-family problems to be workers’ problems and not the company’s.
ORG_SUP3 In my company one must choose between advancement and attention to family. ORG_SUP4 In my organization there is an unwritten rule: Can’t care for family on company time.
* Items removed in subsequent analysis
75
confirmatory factor analysis for validating the scale items, WK_SAL1 and NWK_SAL1
had to be removed from the scales due to their low loadings on the respective latent
variables, resulting in three items per scale. These subsequent reliability alpha values
were .79 and .78 for work role salience and nonwork role salience respectively.
Nonwork Demands: This was captured as the sum total of different types of
nonwork demands experienced by participants. The list included items such as elder care,
education/ training, community/ volunteering, and sports/ fitness activities.
Conscientiousness: To measure conscientiousness, an eight-item
conscientiousness scale from the NEO domain in the IPIP catalogue10
was used. After
preliminary analysis of the original set, four positively-worded items and three
negatively-worded items were retained as the scale items for this study. One item was
removed since it was very similar to an item in the impulsivity scale. The resulting
reliability was .77. The confirmatory factor analysis for scale validation revealed that four
of these items had less than .6 loadings on the latent variable and thus had to be removed
from further analysis. Cronbach‟s alpha for the remaining three items was .70.
Impulsivity: The impulsivity (IMP) scale was based on Steel‟s (2002; 2010a)
susceptibility to temptation scale. This scale dealt with tendency to be distracted or
impulsivity giving into diversions (Steel, 2010a). After careful consideration for content
10 International Personality Item Pool: A Scientific Collaboratory for the Development of Advanced
Measures of Personality Traits and Other Individual Differences (http://ipip.ori.org/).
76
validity and reliability with statistical measures (e.g., using the criteria of Cronbach‟s
alpha if the item is removed), and for parsimony reasons only five items from the original
scale were used. The Cronbach‟s alpha was .78 for the five items. Subsequent to
confirmatory factor analysis for validating the scale items two items had to be removed
due to low loadings and remaining three items had an alpha of .76.
ICT Perception: Perception towards ICT was measured using a six-item scale
adopted from Chesley (2004). Respondents selected answers based on a seven point
Likert scale ranging from “strongly disagree” to “strongly agree.” Confirmatory factor
analysis for validating the scale items revealed that items 4 and 5 had extremely low
loadings on the latent variables and was removed from the scale. The resulting four-item
scale with Cronbach alpha of .77 measured ICT perception where high values represented
a positive perception towards ICT.
Other Nonwork-Related Variables: Participants indicated their marital status
(single, married/ common law, divorced, widowed), number of children, and the annual
household income (selected from five ascending ranges). Education was measured at four
levels ranging from high school to Master/Ph.D. The survey also captured demographic
information such as year of birth, gender, and country of residence.
Results of the confirmatory factor analysis for the work and individual
characteristics are discussed in Chapter 6.The item loadings and validity statistics for the
above mentioned scales are shown in Table 5, Chapter 6. The descriptive statistics and
correlation matrix of the variables are shown in Table 6, Chapter 6.

77
Box 3: Scale items for the measures of individual characteristics
Work salience (adopted from Eddleston et al., 2006)
WK_SAL1 A major source of satisfaction in my life is in my work.*
WK_SAL2 Most of the important things that happen to me involve my work.
WK_SAL3 Most of my interests are centered around my work.
WK_SAL4 My personal identity is very much entangled with my work life.
Nonwork salience (adopted from Eddleston et al., 2006)
NWK_SAL1 My personal identity is very much entangled with my private (non-work) life.*
NWK_SAL1 A major source of satisfaction in my life is in my private life (non-work life).
NWK_SAL3 Most of the important things that happen to me involve my private life (non-work life).
NWK_SAL4 Most of my interests are centered around my private life (non-work life).
Conscientiousness (adopted from IPIP catalogue)
CONSCI1 I am someone who is a reliable worker.*
CONSCI2 I am someone who can be somewhat careless.
CONSCI3 I am someone who does things efficiently.*
CONSCI4 I am someone who tends to be disorganized.
CONSCI5 I am someone who tends to be lazy.
CONSCI6 I am someone who does a thorough job.*
CONSCI7 I am someone who makes plans and follows through with them.*
Impulsivity (adopted from Steel 2002, 2010a)
IMPULS1 When an attractive diversion comes my way, I am easily swayed. IMPULS2 I will crave a pleasurable diversion so sharply that I find it increasingly hard to stay on track.
IMPULS3 I feel irresistibly drawn to anything interesting, entertaining, or enjoyable.*
IMPULS4 I have a hard time postponing pleasurable opportunities as they gradually crop up.*
IMPULS5 I get into jams because I will get entranced by some temporarily delightful activity.
ICT Perception (adopted from Chesley 2004)
ICT_PER1 Computers and communication devices help me perform my work responsibilities more effectively.
ICT_PER2 Computers and communication devices help me perform my personal responsibilities more effectively.
ICT_PER3 Computers and communication devices help make it easier for me to balance work and personal responsibilities.
ICT_PER4 Computers and communication devices have accelerated my pace of life.*
ICT_PER5 Computers and communication devices have increased the amount of work I am expected to do.*
ICT_PER6 Computers and communication devices have improved my quality of life.
* Items removed in subsequent analysis

78
CHAPTER 5 - DESCRIPTIVE ANALYSIS OF DATA
Demographic Analysis of Survey Data
The survey provided 534 responses for the two countries, of which 425 were from
Canada. Sri Lanka represents approximately 20 percent of the total sample. Table 3
provides sample demographic.
Table 3: Profile information of survey participants
Canada Sri Lanka Total Valid
n Value Valid
n Value Valid
n Value
Gender - Male % 409 52.6 103 64.1 512 54.9 Married (or common law relationship) % 401 79.6 104 71.2 505 77.8 % with at least one child 401 61.3 104 43.3 505 57.6 Age distribution as a % 403 104 507 <35 22.1 79.8 33.9 35-45 31.5 15.4 28.2 45-55 36.0 4.8 29.6 >55 10.4 0 8.3 Education as a % 413 102 515 High School 1.2 2.0 1.4 College/Diploma 6.5 2.0 5.6 Bachelor’s Degree 47.7 52.9 48.7 Masters/PhD 44.6 43.1 44.3
Hours of work/week at work location (µ , σ) 407 42.15, 11.48 103 43.81, 9.62 510 42.49, 11.14
Hours of work/week at nonwork location (µ , σ) 407 6.47,6.86 103 6.28, 7.77 510 6.43, 7.05
Hours of work/week in total (µ , σ) 407 48.61, 11.99 103 50.07, 12.29 510 48.90, 12.05 Mean hours using ICT Work-related on working days 420 5.87 108 6.74 528 6.09 Work-related on nonworking days 416 1.91 108 1.74 524 1.88 Nonwork-related on working days 414 1.90 108 2.69 522 2.05 Nonwork-related on nonworking days 411 3.10 107 3.39 518 3.16 Mean work years 406 20.30 97 8.10 503 17.95 Mean years in current job 406 6.17 101 5.24 507 5.99
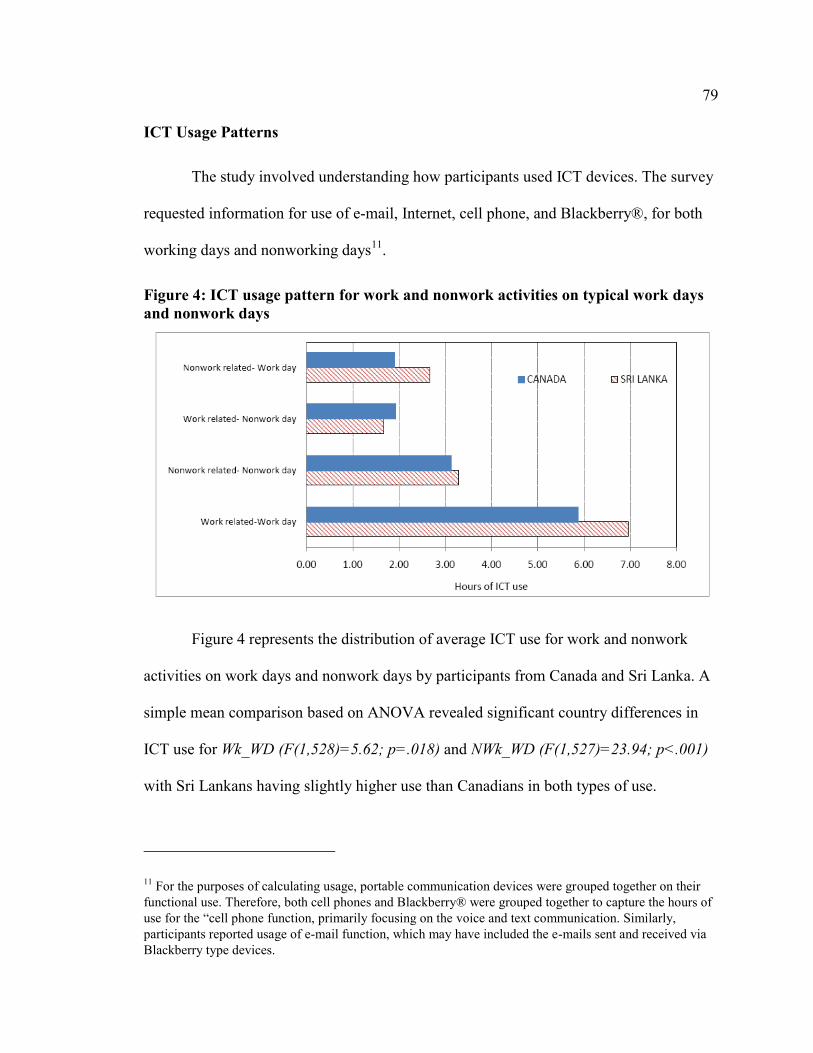
79
ICT Usage Patterns
The study involved understanding how participants used ICT devices. The survey
requested information for use of e-mail, Internet, cell phone, and Blackberry®, for both
working days and nonworking days11
.
Figure 4: ICT usage pattern for work and nonwork activities on typical work days
and nonwork days
Figure 4 represents the distribution of average ICT use for work and nonwork
activities on work days and nonwork days by participants from Canada and Sri Lanka. A
simple mean comparison based on ANOVA revealed significant country differences in
ICT use for Wk_WD (F(1,528)=5.62; p=.018) and NWk_WD (F(1,527)=23.94; p<.001)
with Sri Lankans having slightly higher use than Canadians in both types of use.
11 For the purposes of calculating usage, portable communication devices were grouped together on their
functional use. Therefore, both cell phones and Blackberry® were grouped together to capture the hours of
use for the “cell phone function, primarily focusing on the voice and text communication. Similarly,
participants reported usage of e-mail function, which may have included the e-mails sent and received via
Blackberry type devices.

80
Wk_NWD and NWk_NWD usage patterns were not significantly different between the
countries.
A detailed look at the types of ICT use, based on country, is presented in Figure 5.
On work days, e-mail ranked first for work-related use for both countries. On nonwork
days, for nonwork purposes, the emphasis shifted to Internet (for Canadians) and cell
phone (for Sri Lankans). Comparing the work-related use of ICT on nonwork days,
Canadians appeared to rely mostly on e-mail to get the work done, while for Sri Lankans,
the main mode was the cell phone.
Figure 5: Pattern of usage of different types of ICTs for work and nonwork
purposes in work days and nonwork days

81
Figure 6: Average use of ICT in hours on work days and nonwork days for male
and female participants
Figure 6 shows the average use of different types of ICT by men and women on
work days (WD) and nonworking days (NWD). ANOVA testing for mean differences
between genders for four categories of ICT use (Wk_WD, Wk_NWD, NWk_WD, and
NWk_NWD) presented no significant differences across genders. This was somewhat
different from the results of previous studies where significant gender differences were
observed in technology usage patterns (e.g., Boneva et al., 2001; Ling & Haddon, 2001;
Rakow & Navarro, 1993). Both men and women demonstrated a similar pattern of usage
on work days for work-related purposes, with e-mail being the predominant ICT type,
followed by Internet. On nonwork days, nonwork-related Internet use dominated ICT use
for both men and women, and portable communication device use (e.g., cell phones and

82
Blackberry®) came second. Figure 7 represents the distribution of ICT use on a typical
workday while Figure 8 represents the distribution of ICT use on a nonwork day. For
work days, nonwork use amounted to 38 percent of total ICT use by these individuals,
almost equally divided across e-mail, Internet, and portable communication technology
use. Similarly, 44 percent of the ICT use on nonwork days was for work-related matters
with almost equal distribution across the three groups of technologies.
Figure 7: Average distribution of ICT use on a work day for the total sample

83
Figure 8: Average distribution of ICT use on a nonwork day for the total sample
Considering nonwork-related use on a work day, one could argue that too much of
work time and resources appear to be spent on nonwork-related matters, which could
adversely affect productivity. However the amount of work-related ICT use on a
nonwork day could counter-balance the above argument as employees seem to spend
much personal time and resources in work-related tasks. Therefore, employers who were
planning to limit the use of work ICT resources for nonwork purposes should consider
the net benefits of these decisions seriously. Issues to be considered would include, a)
how detrimental is such usage to productivity; b) the net time saved (e.g., going to the
bank vs. online banking at work); and c) impact on employee morale, especially
considering they already spend their own personal time for work purposes.
In summary, this chapter primarily focused on ICT usage patterns of the
participants. Comparing overall use of ICT, Sri Lankans had a slightly higher use of ICT

84
than Canadians on work days (for both work and nonwork purposes), while Canadians
surpassed Sri Lankan in ICT use on nonwork days. E-mail appeared as the most
prominent work-related ICT type for both countries. For nonwork-related ICT, Sri
Lankans used mostly cell phones and Canadians used mostly Internet. This study did not
show a significant gender difference in the use of various types of IC devices and
technologies. Considering the total sample, individuals spent 38% of their workday ICT
use on nonwork-related activities and 44% of their nonwork day ICT use on work-related
activities, showing a considerable interaction across the work/nonwork boundary via ICT
means.
85
CHAPTER 6 - PREDICTORS OF ICT USE
Understanding the Factors Predicting Individual ICT Usage
Previous studies suggest that individual ICT usage is affected by perceptions
about ICT and by demographic factors (Venkatesh & Davis, 2000; Venkatesh et al.,
2003). Many of the existing models are focused on initial technology adoption (mostly
computer-related applications) for work-related use. Chesley‟s (2004) study suggested
that work and nonwork characteristics could play a differentiated role in continuous
usage of ICT devices, although she did not differentiate between work and nonwork
usage.
The current study, investigated ICT usage in four different contexts of use,
namely work-related on a work day (Wk_WD), work-related on a nonwork day
(Wk_NWD), nonwork-related on a work day (NWk_WD), and nonwork-related on a
nonwork day (NWk_NWD). It explored whether different factors had higher significance
in predicting ICT use based on the context of use.
As discussed in Chapter 3, and following the suggestions by Chesley (2004) who
also studied work-family interactions, three broad clusters of variables were used to
assess the factors driving individual ICT use. These are work characteristics, nonwork
characteristics, and individual characteristics. (Chapter 3, Figure 1 illustrates the
variables used in the analysis).
86
Introduction to Analytical Techniques
As presented in Chapter 3, this study attempted to explore the ICT usage by
individuals and how such use affects work/nonwork interactions leading to work-life
balance. To assess these relationships using quantitative data this study used two main
methods of data analysis, namely, Structural Equation Modeling (SEM) and Multiple
Regression Analysis. Of the two methods, SEM was predominantly used due to its
advantages and suitability for the type of analysis required in this study. These include
the ability of SEM to allow for estimation of multiple, interrelated dependence
relationships, to represent unobserved latent variables, to correct for measurement errors
in the estimation process, and to test a model to explain the entire set of relationships
(Hair, Black, Babin, Anderson, & Tatham, 2006) .
This study aimed first to understand the factors affecting the use of ICT by
individuals; second to assess the impact of ICT use on work/nonwork interactions, and
third to estimate the impact of such interactions on work-life balance. SEM allows all
these relationships to be tested in a single model. Further, SEM provides the opportunity
to assess the scale items representing the latent variables using confirmatory factor
analysis, which was an important component in the overall analysis. Therefore, SEM was
a better analytical method for the purposes of this study. In certain situations where SEM
could not be used effectively (e.g., small sample size) multiple regression methods were
used. SEM was used in several analyses, including confirmatory factor analysis,
measurement model testing, and structural model testing. The following section presents
an overview of assessing model fit when using SEM for data analysis.

87
Assessing Model Fit in SEM
When SEM is used as a confirmatory technique, a model must be specified
correctly based on the type of analysis that the researcher is attempting to confirm.
Assessment of fit is a basic task in SEM modeling, forming the basis for accepting or
rejecting models and, more usually, accepting one competing model over another. The
output of SEM programs (this study used AMOS™ 17.0 (Arbuckle, 2008)) includes
matrices of the estimated relationships between variables in the model. Assessment of fit
essentially calculates how similar the predicted data are to matrices containing the
relationships in the actual data.
Absolute fit indices address the degree to which the variances and covariances
implied by the specified model match the observed variances and covariances. The main
index is the chi square (2) statistic, which tests the null hypothesis, the postulated model
holds in the population, i.e., the implied (sample) covariance matrix = population
covariance matrix (Byrne, 2009). Therefore, ideally the null hypothesis should be
accepted. However, the 2statistic could be substantial (thus significant) when the model
does not hold, and also when sample size is large (Jöreskog & Sörbom, 1993). Yet, for
better statistical analysis scholars are expected to rely on large samples. Therefore, it is
difficult to rely only on the 2statistic to identify well fitting models.
Researchers have addressed this chi square limitations by developing an alternate
set of goodness-of-fit indices and recommended the use of multiple fit indices (Hu &
Bentler, 1999; Kline, 2005a). According to Hu and Bentler (1999), using multiple fit
indices help reject reasonable proportions of misspecified models by minimizing Type II
88
errors with acceptable costs of Type I error. To achieve this, for Maximum Likelihood
(ML) based fit indices, Hu and Bentler (1999) suggested the Tucker-Lewis Index (TLI),
the comparative fit index (CFI) together with the standardized root mean square residual
(SRMR), and the root mean squared error of approximation (RMSEA).
The Tucker-Lewis index (TLI) reflects the proportion by which the researcher's
model improves fit compared to the null model (random variables, for which chi-square
is at its maximum) while accounting for model complexity (Hu & Bentler, 1999). Marsh
et al. (1988) found TLI to be relatively independent of sample size. Hu and Bentler
(1981) stated that values close to .95 indicated good fit and values below .9 indicated a
need to re-specify the model (Schumacker & Lomax, 2004).
The comparative fit index (CFI) compares the covariance matrix predicted by the
model with the observed covariance matrix, and compares the null model with the
observed covariance matrix to gauge the percent of lack of fit that is accounted for by
going from the null model to the researcher's SEM model. Values closer to one indicate
very good fit. CFI should be equal to or greater than .90 to accept the model, indicating
that 90% of the covariation in the data can be reproduced by the given model (Hu &
Benter, 1981).
The standardized root mean square residual (SRMR) is the average difference
between the predicted and observed variances and covariances in the model, based on
standardized residuals. The smaller the SRMR, the better the model fit with SRMR = 0
indicating perfect fit. A value less than .05 is widely considered good fit and a value
below .08 is considered adequate fit (Hu & Bentler, 1999).

89
The root mean squared error of approximation (RMSEA) takes into account the
error of approximation in the population and asks the question “How well would the
model, with the unknown but optimally chosen parameter values, fit the population
covariance matrix if it were available?” (Browne & Cudeck, 1993: 137-138). For a well
fitting model, RMSEA lower than .05 is preferred (Browne & Cudeck, 1993). Hu and
Benter (1999) have suggested RMSEA values below .06 as indicative of good fit.
MacCallum et al. (1996) have suggested RMSEA values from .08 to .1 as indicative of
mediocre fit and greater than .1 to indicate poor fit. It is recommended to report the
confidence intervals of RMSEA (MacCallum & Austin, 2000; Steiger, 1990).

90
Predictors of ICT Use
One of the primary objectives of the research was to examine the predictors of
ICT use as per the details presented in Chapter 3- Figure 1. First a Confirmatory Factor
Analysis (CFA) was run using AMOS™ 17.0 (Arbuckle, 2008) to assess the validity of
the scales used to measure the latent variables in analysis. The first row of Table 4
(Model A) shows the results with all original indicators attached to their respective latent
constructs.
Table 4: Confirmatory factor analysis of predictors of ICT use
χ2 df
χ2 /df
CFI TLI RMSEA ∆CFI ∆ χ2 ∆df
Statistical significance
of change (p)
Model A Model with all original
indicator variables attached to their respective
latent variables
2213.8 783 2.827 .832 .796 .056
Model B Adjusted model
Removed variables WK_FLEX3, WK_SAL1,
NWK_SAL1, WK_AUTO4, IMPULS 3 &4, ICT_PER 4&5,
CONSC 1,3,6 &7
889.8 369 2.411 .912 .889 .050 .080 1324.0 414 .000
Model A indicates a significant chi-square statistic of χ2 (783, n=534)=2213.8
p<.05. Also, as seen from the fit indices this model did not have a very good fit. Several
variables showed standardized loadings below .6 on their respective latent variables,
which is below the acceptable cutoff (Bagozzi & Yi, 1988). These included
WORK_FLEX3 (.4), ICT_PER1 (.58), ICT_PER4 (.1), ICT_PER5 (-.1), IMPULS3 (.53),
IMPUSE4 (.58), CONSC1 (.57), CONSC3 (.54), CONSC7 (.52), WK_AUTO (.57),
NWK_SAL1(.48), and WK_SAL1 (.54).
91
Close examination of the item wordings showed why some loading were low. For
example, in the ICT perception scale ICT_PER4 and ICT_PER4 items (.1 and -.11
loading ) were more related to pace of life and amount of work than to perceived
usefulness of IT (See Table 15 for all the items). WORK_FLEX3 focused on vacation
time while the other items on the scale were related to day-to-day flexibility. A test of
reliability using Cronbach‟s alpha also supported the removal of the item with an
increased alpha value if it was removed.
NWK_SAL1 only had a .48 standardized loading on to NONWORK SALIENCE
composite variable. Similar to the above instance, the Cronbach‟s alpha with the item
removed was higher than that with the item included in the scale. A similar effect was
seen for WK_SAL1, which had a loading of .54 on its latent variable. These items were
removed one by one from the model resulting in an improvement of the model fit. On a
similar argument, subsequently IMPULS3 and 4, and WK_AUTO4 were removed, all of
which had loadings less than .6 on their respective latent variables. The only item
remaining with less than .6 loading was ICT_PER1 with .57 loading. This was kept, as it
was the only item that specifically dealt with work-related ICT use. The resulting model
showed in Table 4 (model B) has significantly better fit.
Model B had several pairs of latent variables showing relatively high correlations.
These included work autonomy and work flexibility (r=.65), work salience and nonwork
salience (r=-.68), and conscientiousness and impulsivity (r=-.84). It was important to
assess if these highly-correlated latent variables represented distinct constructs or whether
the items loaded onto a single item instead of two in each of the cases. Therefore, a single

92
latent variable was created to represent impulsivity and conscientiousness and all the 6
items (3 impulsivity and 3 conscientiousness) were loaded to the newly created latent
construct. The model fit worsened and the loadings from the new construct to the original
conscientious items were below .6 range. Therefore it is evident that impulsivity and
conscientiousness are, although highly correlated, two distinct constructs.
A similar process was used to test for the constructs, work salience and nonwork
salience, and also work autonomy and work flexibility. In both these cases model fit
deteriorated from the Model B (see Table 4) suggesting that these are indeed different
construct with high correlations between them.
Construct Validity: In order to ascertain the validity and the reliability of the
latent variables, Fornell and Larcker (1981) suggested the use of two measures:
composite reliability (CR) and average variance extracted (AVE). Composite reliability
estimates the extent to which a set of latent construct indicators share in the measurement
of a construct, and .7 or above threshold is recommended (Hair et al., 2006). AVE
measures the amount of variance that is captured by the construct in relation to the
amount of variance due to measurement error (Fornell & Larcker, 1981). If AVE is less
than .50, the variance due to measurement error is larger than the variance captured by
the construct itself, and the validity of the individual indicators as well as the construct is
questionable (Fornell & Larcker, 1981). Further, AVE is also used to evaluate
discriminant validity. To fully satisfy the requirements for discriminant validity, AVE of
each construct should be greater than the squared correlation between the construct of
interest and other constructs in the model (Fornell & Larcker, 1981).

93
A comparison of the square root of the AVE with the correlations among
constructs indicated that each construct is more highly related to its own measures than to
other constructs, establishing the discriminant validity (Fornell & Larcker, 1981;
Richardson, Simmering, & Sturman, 2009). Except for conscientiousness measure, which
falls short of the cut off value with an AVE of .43, all the other latent variables
demonstrate good discriminant validity.
Although conscientiousness measure had a slightly lower AVE value compared to
the suggested cutoff, it was still maintained in the study for several reasons. First, it was
one of the only two measures of personality dimensions used in the study (the other was
impulsivity). One reason for selecting these two measures was to see the impact of almost
opposing personality dimensions in predicting ICT use. Removing the conscientiousness
scale would have eliminated the ability to do so. Second, it still demonstrated an
acceptable reliability alpha of .70. Third, this measure would be used only in the
exploratory analysis of identifying predictors of ICT use and would not form part of the
main analysis of the study. Thus, the ability of this scale to influence overall study
findings was minimal. Therefore, the conscientiousness measure was retained to be used
in the study, recognizing it as a possible limitation.
Item loadings and validity statistics of the latent variables for work, nonwork, and
individual characteristics are presented in Table 5. Descriptive statistics and correlations
of the variables included in the analyses are presented in Table 6 in three sections. The
values in parentheses represent the Cronbach's alpha for the respective scales.

94
Table 5: Item loadings and validity statistics for work, nonwork, and individual
characteristics
Variables Valid N Min Max Mean Std. Dev. λ CR AVE
Work Autonomy 534 1.00 7.00 5.18 1.20
.78 .54
WK_AUTO1 532 1.00 7.00 5.05 1.58 .73
WK_AUTO2 534 1.00 7.00 5.43 1.32 .78
WK_AUTO3 533 1.00 7.00 5.05 1.45 .70
Work Flexibility 534 1.00 7.00 4.09 1.55
.77 .53
WK_FLEX1 531 1.00 7.00 3.52 2.00 .67
WK_FLEX2 533 1.00 7.00 4.16 1.85 .77
WK_FLEX4 534 1.00 7.00 4.58 1.78 .73
Work Demand 534 1.00 7.00 4.28 1.26
.84 .57
WK_DMND1 532 1.00 7.00 4.60 1.72 .75
WK_DMND2 532 1.00 7.00 4.99 1.49 .71
WK_DMND3 534 1.00 7.00 3.47 1.42 .74
WK_DMND4 529 1.00 7.00 4.07 1.49 .81
Work Salience 534 1.00 7.00 3.83 1.23
.81 .59
WK_SAL2 531 1.00 7.00 3.72 1.40 .76
WK_SAL3 533 1.00 7.00 3.39 1.43 .83
WK_SAL4 527 1.00 7.00 4.40 1.56 .66
Nonwork Salience 532 1.00 7.00 5.08 1.14
.80 .57
NWK_SAL2 528 1.00 7.00 5.60 1.28 .64
NWK_SAL3 528 1.00 7.00 4.88 1.39 .79
NWK_SAL4 526 1.00 7.00 4.76 1.40 .80
Impulsivity
534 1.00 6.33 3.03 1.16
.75 .51
IMPULS1 527 1.00 7.00 3.51 1.52 .68
IMPULS2 522 1.00 7.00 2.85 1.37 .72
IMPULS5 528 1.00 7.00 2.71 1.35 .73
Org. Support 533 1.00 7.00 3.27 1.24
.84 .58
ORD_SUP1 527 1.00 7.00 3.46 1.59 .71
OGR_SUP2 532 1.00 7.00 3.34 1.50 .88
ORG_SUP3 531 1.00 7.00 3.56 1.50 .70
ORG_SUP4 533 1.00 7.00 2.74 1.43 .73
ICT Perception 534 2.00 7.00 5.67 0.98
.79 .49
ICT_PER1 533 2.00 7.00 6.49 0.73 .57
ICT_PER2 534 1.00 7.00 5.80 1.25 .75
ICT_PER3 534 1.00 7.00 5.32 1.52 .76
ICT_PER6 532 1.00 7.00 5.06 1.44 .69
Conscientiousness
533 1.00 7.00 5.40 1.15
.69 .43
CONSC2 531 1.00 7.00 5.45 1.40 .72
CONSC4 532 1.00 7.00 5.18 1.53 .62
CONSC5 531 1.00 7.00 5.57 1.46 .60

95
Table 6: Descriptive statistics and correlation matrix of the variables included in the research (Section 1)
Variables Valid N Min Max Mean Std. Dev. 1 2 3 4 5 6
1 Work Autonomy 534 1.00 7.00 5.18 1.20 (.77) 2 Work Flexibility 534 1.00 7.00 4.09 1.55 .514** (.77) 3 Work Demands 534 1.00 7.00 4.28 1.26 -.264** .034 (.84) 4 Work Salience 534 1.00 7.00 3.83 1.23 .088* .114** .130** (.79) 5 Nonwork Salience 532 1.00 7.00 5.08 1.14 .026 -.004 -.051 -.533** (.78) 6 Impulsivity 534 1.00 6.33 3.03 1.16 -.087* -.011 .033 -.026 .066 (.76) 7 Org. Support (R) 533 1.00 7.00 3.27 1.24 -.262** -.239** .243** -.001 -.023 .143** 8 ICT Perception 534 2.00 7.00 5.67 0.98 .331** .171** -.216** .029 .103* .040 9 Conscientiousness 533 1.00 7.00 5.40 1.15 .097* .001 -.026 -.031 -.001 -.584**
10 Wk_WD 528 .50 16.50 6.02 3.15 .074 .031 .047 .079 .079 -.037 11 Wk_NWD 524 .00 16.50 1.87 1.96 .031 .138** .201** .217** -.091* .001 12 NWk_WD 522 .00 11.50 2.05 1.49 .063 .068 -.105* .019 .103* .247**
13 NWk_NWD 518 .50 13.50 3.16 2.24 .004 -.027 -.014 -.074 .111* .120** 14 Total ICT Use 514 .00 44.00 13.12 6.37 .062 .067 .054 .088* .079 .084
15 Work hours/week 510 18.00 95.00 48.90 12.05 -.113* -.051 .304** .207** -.213** -.136** 16 W-->NW Conflict 534 1.00 7.00 3.81 1.21 -.185** -.017 .563** .212** -.167** -.031 17 NW-->W Conflict 534 1.00 6.50 2.65 0.90 .049 .110* .120** .092* .007 .350**
18 W-->NW Enrichment 534 1.00 7.00 4.35 1.14 .327** .271** -.069 .278** -.118** -.106* 19 NW-->W Enrichment 534 1.50 7.00 5.16 1.17 .189** .080 -.136** -.129** .342** -.255** 20 Work-life balance 532 1.17 7.00 5.08 1.08 .341** .161** -.388** -.239** .313** -.136** 21 Age 507 23.00 65.00 41.62 9.58 .065 .229** .151** -.011 -.120** -.209**
22 Gender 512 1.00 2.00 1.45 .50 .025 -.048 .057 .041 .066 -.097* 23 Overall Experience 503 1.00 42.00 17.94 9.91 .040 .219** .142** -.043 -.097* -.218**
24 Children 505 .00 8.00 1.16 1.23 .081 .201** .069 -.052 .016 -.088* 25 Married 505 .00 1.00 .78 .42 .050 .102* .105* -.012 .088* -.098* 26 Education 515 1.00 4.00 3.36 .65 .052 .099* .006 .066 -.047 -.020 27 Country-D 534 .00 1.00 .20 .40 -.016 -.179** -.216** .095* -.115** .161** 28 Income 464 1.00 5.00 3.23 1.33 -.001 .153** .258** .011 -.027 -.171** 29 Nonwork Demands 515 .00 4.00 1.45 1.02 .052 .109* .046 -.021 .017 -.078 30 Manager 514 .00 1.00 .71 .46 .105* .080 .216** .097* -.098* -.104*

96
Table 6 continued (Section 2):
Variables
7 8 9 10 11 12 13 14 15 16 17
7 Org. Support(R) (.83) 8 ICT Perception -.138** (.77) 9 Conscientiousness -.072 .055 (.70)
10 Wk_WD .010 .110* -.080 11 Wk_NWD .101* .014 -.149** .474** 12 NWk_WD .026 .210** .057 .314** .270**
13 NWk_NWD .074 .167** -.083 .279** .250** .426** 14 Total ICT Use .066 .167** -.061 .815** .695** .626** .667** 15 Work hours/week .067 -.192** .078 .239** .298** -.057 .011 .196** 16 W-->NW Conflict .284** -.221** -.044 .168** .311** -.068 -.058 .140** .404** (.91) 17 NW-->W Conflict .092* .078 -.276** .050 .149** .219** .013 .131** -.047 .187** (.81)
18 W-->NW Enrichment
-.174** .303** .107* .095* .135** .099* .057 .134** .013 -.018 .144**
19 NW-->W Enrichment
-.128** .210** .231** .017 -.085 .000 .035 -.003 .011 -.104* -.163**
20 Work-life balance -.279** .415** .193** -.097* -.221** .032 .024 -.095* -.282** -.531** -.157** 21 Age -.023 -.167** .119** -.205** .066 -.254** -.146** -.187** .054 .063 -.100*
22 Gender .149** -.005 .101* .080 .053 .041 .046 .081 -.163** -.036 -.080 23 Overall
Experience -.038 -.140** .139** -.192** .071 -.245** -.095* -.161** .052 .046 -.119**
24 Children -.108* -.038 .060 -.097* -.008 -.080 -.051 -.077 .014 .009 .085 25 Married -.081 .035 .024 -.029 .007 -.119** -.113* -.078 .034 .135** .069 26 Education .011 .093* .036 -.092* -.012 .024 -.071 -.069 .071 .059 .067 27 Country-D .103* .157** -.173** .115** -.036 .221** .054 .118** .049 -.027 .153** 28 Income -.089 -.034 .133** .076 .132** -.163** -.072 .018 .018 .261** .156** 29 Nonwork
Demands -.020 .024 .034 -.029 .023 -.050 .008 -.027 -.027 .042 .005
30 Manager -.033 -.041 .051 .074 .093* -.087 -.108* .009 .009 .233** .207**
Cronbach alpha values are in bold italics on diagonal; ** significant at p<.001; * significant at p<.05
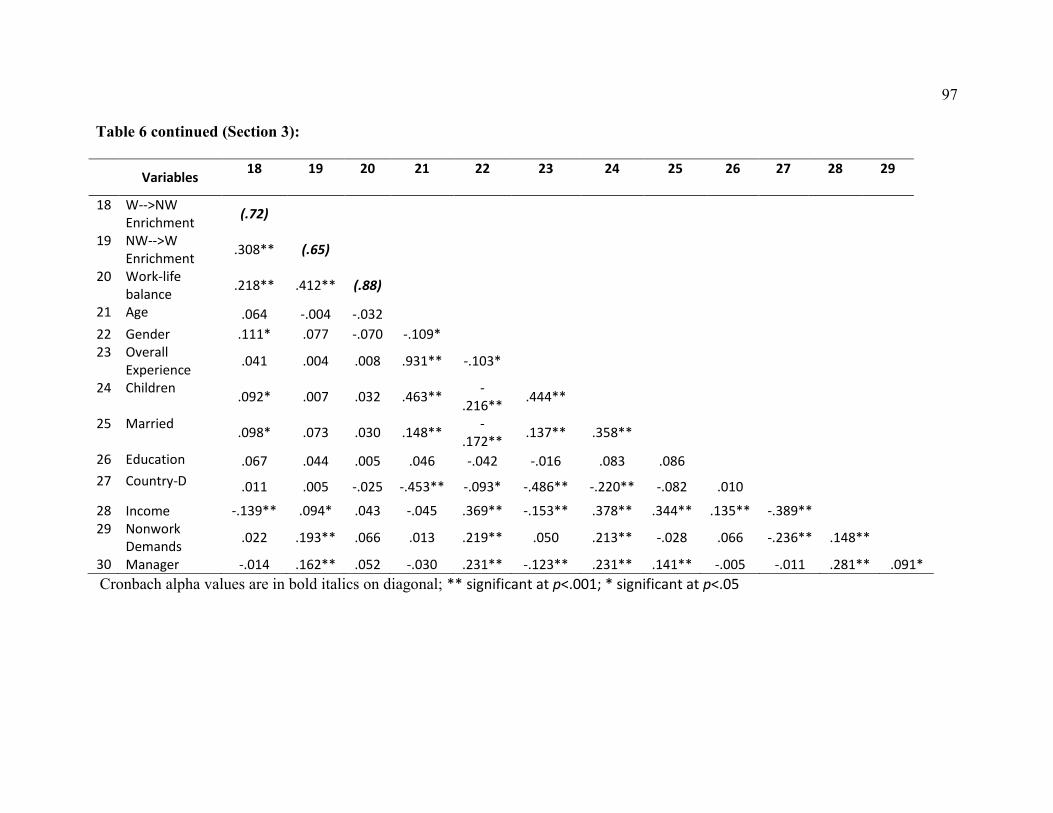
97
Table 6 continued (Section 3):
Variables 18 19 20 21 22 23 24 25 26 27 28 29
18 W-->NW Enrichment
(.72)
19 NW-->W Enrichment
.308** (.65)
20 Work-life balance
.218** .412** (.88)
21 Age .064 -.004 -.032
22 Gender .111* .077 -.070 -.109* 23 Overall
Experience .041 .004 .008 .931** -.103*
24 Children .092* .007 .032 .463**
-.216**
.444**
25 Married .098* .073 .030 .148**
-.172**
.137** .358**
26 Education .067 .044 .005 .046 -.042 -.016 .083 .086
27 Country-D .011 .005 -.025 -.453** -.093* -.486** -.220** -.082 .010
28 Income -.139** .094* .043 -.045 .369** -.153** .378** .344** .135** -.389** 29 Nonwork
Demands .022 .193** .066 .013 .219** .050 .213** -.028 .066 -.236** .148**
30 Manager -.014 .162** .052 -.030 .231** -.123** .231** .141** -.005 -.011 .281** .091*
Cronbach alpha values are in bold italics on diagonal; ** significant at p<.001; * significant at p<.05
98
Regression Analysis for Factors Predicting Context-Specific ICT Use
In order to determine the factors affecting different contexts of ICT use, four regression
analyses were run with each of the context-specific ICT use as the dependent variable. Prior to
running the regression analysis the data were checked for the underlying assumptions of
regression.
Missing Value Analysis: PASW® 17.0 (SPSS, 2009) missing value analysis module was
used to test the variables included in the regression model to test for the impact of missing
values in data. Of the 24 variables identified for the regression analysis, only the variable
“Income” had 13% missing values. All other variables had less than 6% of the values missing
with just four variables between 5%-6% of the values missing. Missing value analysis using
Little‟s test (Little, 1988) revealed a nonsignificant chi square value (χ2=483.61, d.f.= 399,
p=.193) indicating the missing data could be considered as missing completely at random
(MCAR), suggesting the possibility for listwise deletion (Hair et al., 2006). However, listwise
deletion would have removed about 100 observations from the analysis, reducing the sample size
considerably. Thus, following Roth (1994) and Tsikriktsis (2005) missing values for quantitative
variables were substituted using EM procedure in PASW® 17.0 (SPSS, 2009). The analysis was
run with and without the missing value substitutions and the results were almost identical.
Therefore, results discussed in this section are based on the imputed values through the EM
procedure.
To assess the factors affecting use of ICT in the four situations identified (i.e., Wk_WD,
Wk_NWD, NWk_WD and NWk_NWD), a two step approach to regression was followed, where
control variables were entered first, followed by other predictor variables. Control variables

99
comprised of dummy coded country (Sri Lanka =1), gender (male =1), married (married =1),
manager or not (manager=1) together with income, age, education, experience, number of
children, and the number of types of nonwork demands (e.g., elder care, education/ training,
community/ volunteering, and sports/ fitness). Education was measured by a ordinal variable (1 =
high school, 2 = college diploma, 3 = bachelor‟s degree, 4 = masters/PhD). Income was
measured by a five-point scale based on the respondent‟s annual income. In the second step the
variables, work autonomy, work flexibility, work demands, organizational support (reverse coded
as a measure of support), work hours, work salience, nonwork salience, impulsivity,
conscientiousness, and ICT perception were entered.
Multivariate Testing and Results: Examining the variance inflation factors (VIF)
revealed that age and overall experience showed values of 8.1 and 8.6 respectively, while all the
other VIF values were below 1.5. This suggested high multicollinearity between these two
variables (Hair et al., 2006) also validated by the high bi-variate correlation between these two
variables (r=.93). Therefore, overall experience was removed from the analysis allowing age to
be included as a control variable. After this adjustment condition indices relating to the variables
were all below 30 suggesting the problem with multicollinearity was no longer an issue
(Kennedy, 2003).
Histogram and normal p-p plots of standardized residuals suggested residuals were not
normally distributed. To remedy this problem the dependent variables were transformed into
their natural logarithms, which yielded error terms close to normality in all models. The results
are presented in Table 7. The models explained close to 20 percent of the variance in each of the
contexts of ICT use (i.e., Wk_WD, Wk_NWD, and NWk_WD) except for NWk_NWD (only 10

100
percent). The error terms did not show any heteroscedasticity as seen by the scatter plot between
residuals and the predicted dependent variable in each of the regression analyses (Hair et al.,
2006). Further, Durbin-Watson statistic for all four regression analyses were around two
suggesting the independence of the error terms.
Work-Related ICT Use on Work Days (Wk_WD): The results of the regression analysis
revealed an interesting pattern which showed differences based on the context of ICT use. In line
with theories of ICT usage (e.g., TAM), perceived usefulness of ICT (ICT perception) appeared
a significant predictor in each and every one of the situations in consideration. When it comes to
Wk_WD, the key work-related variables affecting the usage were total hours of work and the fact
that the individual is a manager. Considering the nonwork and individual characteristics, income
had a positive association with ICT use. This could be also due to the relationship with being a
manager, who could be earning a higher salary. Age was negatively related to all contexts of ICT
use suggesting that younger individuals have higher tendency to use more ICT than older
individuals. Interestingly, nonwork salience came up as a highly significant predictor of work-
related ICT use on workdays; perhaps the salience measure simply picks up a positive affect
towards technology, which then supports intensive use of technology at work.
Nonwork-Related ICT use on Nonwork Days (NWk_NWD): Work characteristics did
not appear to have any significant contribution towards predicting NWk_NWD. The variables of
significance were ICT perception, marital status, age, and country. For this category, the results
suggested that younger, single Canadians with positive perception of ICT would tend have
higher nonwork-related ICT use on nonwork days.
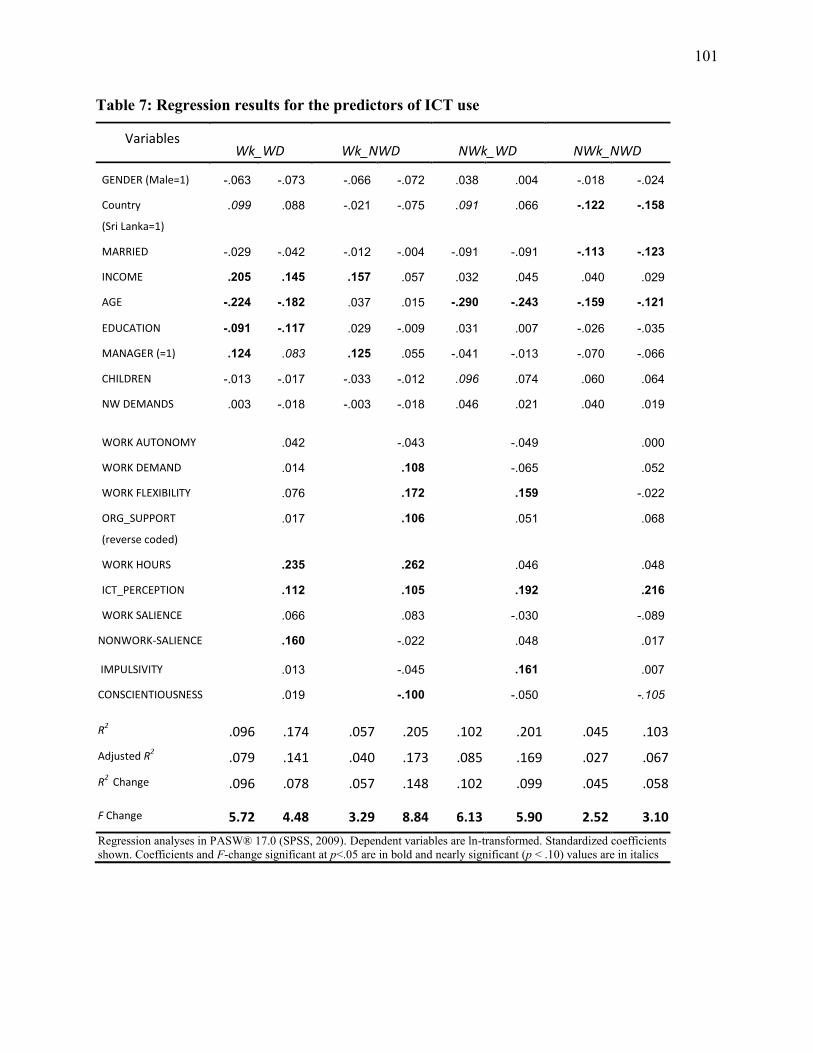
101
Table 7: Regression results for the predictors of ICT use
Variables Wk_WD Wk_NWD NWk_WD NWk_NWD
GENDER (Male=1) -.063 -.073 -.066 -.072 .038 .004 -.018 -.024
Country
(Sri Lanka=1)
.099 .088 -.021 -.075 .091 .066 -.122 -.158
MARRIED -.029 -.042 -.012 -.004 -.091 -.091 -.113 -.123
INCOME .205 .145 .157 .057 .032 .045 .040 .029
AGE -.224 -.182 .037 .015 -.290 -.243 -.159 -.121
EDUCATION -.091 -.117 .029 -.009 .031 .007 -.026 -.035
MANAGER (=1) .124 .083 .125 .055 -.041 -.013 -.070 -.066
CHILDREN -.013 -.017 -.033 -.012 .096 .074 .060 .064
NW DEMANDS .003 -.018 -.003 -.018 .046 .021 .040 .019
WORK AUTONOMY .042 -.043 -.049 .000
WORK DEMAND .014 .108 -.065 .052
WORK FLEXIBILITY .076 .172 .159 -.022
ORG_SUPPORT
(reverse coded)
.017 .106 .051 .068
WORK HOURS .235 .262 .046 .048
ICT_PERCEPTION .112 .105 .192 .216
WORK SALIENCE .066 .083 -.030 -.089
NONWORK-SALIENCE .160 -.022 .048 .017
IMPULSIVITY .013 -.045 .161 .007
CONSCIENTIOUSNESS .019 -.100 -.050 -.105
R2 .096 .174 .057 .205 .102 .201 .045 .103
Adjusted R2 .079 .141 .040 .173 .085 .169 .027 .067
R2
Change .096 .078 .057 .148 .102 .099 .045 .058
F Change 5.72 4.48 3.29 8.84 6.13 5.90 2.52 3.10
Regression analyses in PASW® 17.0 (SPSS, 2009). Dependent variables are ln-transformed. Standardized coefficients
shown. Coefficients and F-change significant at p<.05 are in bold and nearly significant (p < .10) values are in italics

102
Work-Related ICT Use on Nonwork Days (Wk_NWD): The picture of the significant
predictors of ICT use altered considerably in cross-domain ICT use. Work demands, work hours,
and work flexibility were positively associated with Wk_NWD ICT use, and so was ICT
perception. This made practical sense since if a person has a high work load and has to work
long hours her work day could extend beyond the normal work hours and to the nonwork
domain, and she would have to rely more and more on ICT to get the work done. Further, in
order for a person to attend to work-related matters at a nonwork location, she should have
flexibility in determining the location and timing of work, and also believe that ICT would help
her in attending to these work-related matters in an efficient manner. Conscientiousness appeared
as a significant determinant of ICT use in the context of Wk_NWD (the measure represented lack
of conscientiousness and the results shows a negative association). It could be that individuals
who are more conscientious about finishing up work tend to take more work home, or to the
nonwork domain. They might feel obliged to be connected to work, driving their work-related
ICT use into the nonwork setting. Interestingly Wk_NWD was positively related to lack of
organizational support suggesting that when individuals experience less support from the
organization in relation to managing nonwork activities they might have to take work home
more.
Nonwork-Related ICT Use on Work Days (NWk_WD): In relation to NWk_WD, the
key predictors were work flexibility, impulsivity, age, and ICT perception. Work flexibility and
ICT perception made intuitive sense because for a person to attend to nonwork-related activities
while at work, she should have some flexibility in terms of time allocation to different tasks.

103
Further, as described above, a person with a positive perception of ICT would tend to use ICT
with an assumption of benefiting from such usage.
Of the nonwork characteristics, number of children appeared marginally significant factor
for NWk_WD ICT use, and not in other contexts. This made intuitive sense since concern for
children could trigger individuals, for example to check on their wellbeing while at work. To
verify this further, the analysis was rerun with presence of children as a dummy coded variable,
rather than the continuous variable of number of children. Although the above argument
suggested significant differences based on the context of use, presence or absence of children did
not appear as a significant determinant of ICT use in any of the contexts.
Perhaps the more interesting finding from this analysis was the significance of
impulsivity, appearing only in nonwork-related use on a work day. NWk_WD could include some
essential tasks such as checking on children, attending to urgent family matters, and doing some
online banking. For the group of employees surveyed in this study (managers and professionals)
who appear to put a considerable amount of nonwork hours for work-related use, one could say
that such use of nonwork-related ICT on work days is compensatory for having to take work into
their homes.
However such use could also include not-so-essential tasks such as accessing social
networking sites (e.g., Facebook®, Myspace
®, and Twitter
®), sports information, or simply
surfing the net, which could be a distraction at work and eat into productive time. Impulsivity, a
measure of the individual's propensity to be lured away and distracted by such pleasures and
immediate gratification opportunities, thus appears as a predictor of nonwork use of ICT during
the work day. This finding may be of importance to employers for assessing the possibility of

104
such behaviour, and also for the employees themselves to understand and correct unproductive
behaviour at work.
Further, the results suggested that younger people tend to use ICT for nonwork-related
purposes during the work day. This could be due to their higher familiarity with ICT and the
tendency to use ICT in a more seamless manner compared to the older generation. These
findings also resonated with previous studies that found individuals who use computers in
unproductive ways at work tend to be men, younger, more impulsive, and less conscientious
(Everton, Mastrangelo, & Jolton, 2005).
In summary, the results of this analysis revealed that based on the context, different
variables assume importance in predicting individual ICT use. In line with the established
theories of technology use, perceived usefulness of ICT was positively associated with ICT use
in each of the contexts considered. Further, ICT usage was higher for younger individuals in
almost all the contexts considered (the results were not significant work Wk_NWD). While work
characteristics showed greater association with work-related use on nonwork days, impulsivity
and work flexibility stood out in predicting nonwork-related use on work days. Individual and
nonwork characteristics were associated with nonwork-related use on nonwork days while work
characteristics had no role to play in this context of use.
105
CHAPTER 7 - MEASUREMENT MODEL
The thrust of the thesis deals with the impact of ICT on work/nonwork interactions and
implications on work-life balance. To assess these relationships, a comprehensive model which
included all relevant variables was tested using SEM. Scholars have advised using a two-step
approach to structural equation modeling, namely assessing the measurement model prior to the
simultaneous estimation of measurement and structural sub models (Anderson & Gerbing, 1988).
The measurement model, which is the focus of this chapter, provides a confirmatory assessment
of convergent validity and discriminant validity (Campbell & Fiske, 1959).
To establish the construct validity, both exploratory and confirmatory factor analysis of
the work/nonwork interaction variables were performed. As discussed earlier, due to poor
reliability estimates (α < .6) of the “segmentation” construct, it was eliminated from further
analysis.
Exploratory Factor Analysis of Work/ Nonwork Interaction Variables
An exploratory factor analysis (EFA) was performed for the work/nonwork variables
using principal component analysis with varimax rotation. Based on the criteria of Eigenvalues
greater than one, results revealed a five-factor solution which accounted for 65 percent of the
variance explained. Figure 9 shows the scree plot with Table 8 detailing the Eigenvalues and
percentage variance extracted by the five factors. Factor loadings are shown in Table 9.
Except for four items (WFC4, FWE1, FWE3, and WLB1) all other nineteen items loaded
onto single distinct factors. After close examination of the items loading into two factors, the
theorized categorization for these items were retained. This decision was also supported by the
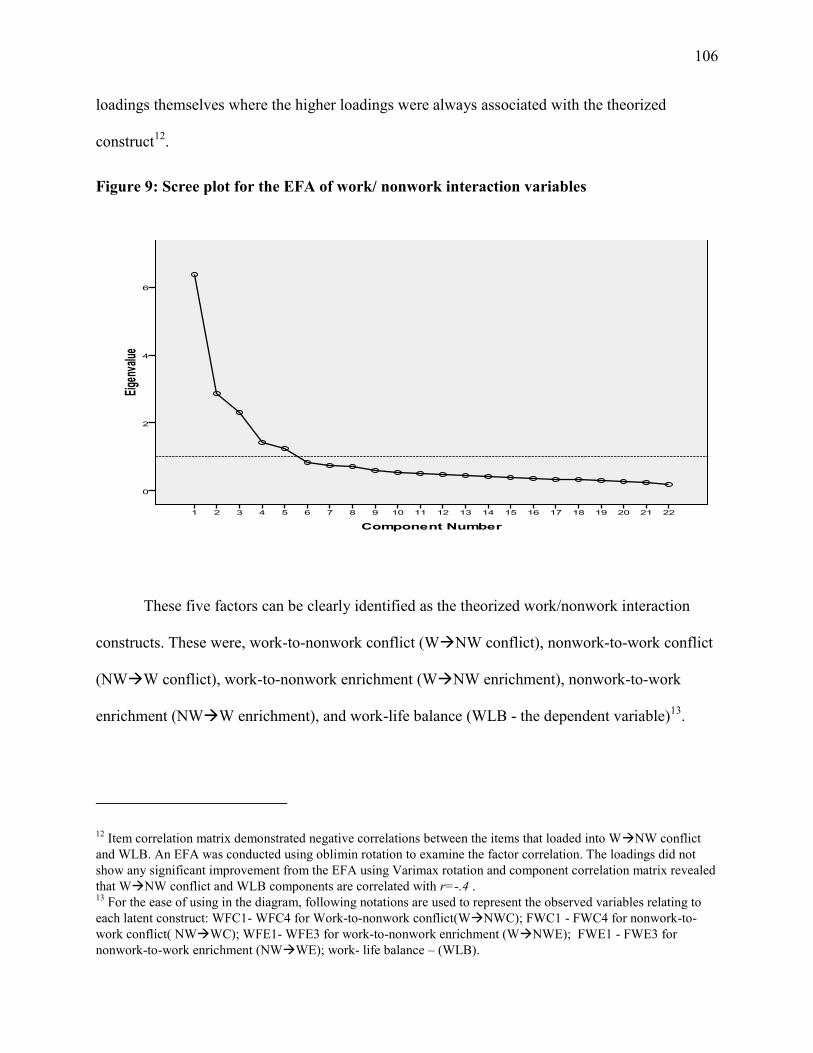
106
loadings themselves where the higher loadings were always associated with the theorized
construct12
.
Figure 9: Scree plot for the EFA of work/ nonwork interaction variables
These five factors can be clearly identified as the theorized work/nonwork interaction
constructs. These were, work-to-nonwork conflict (WNW conflict), nonwork-to-work conflict
(NWW conflict), work-to-nonwork enrichment (WNW enrichment), nonwork-to-work
enrichment (NWW enrichment), and work-life balance (WLB - the dependent variable)13
.
12 Item correlation matrix demonstrated negative correlations between the items that loaded into WNW conflict
and WLB. An EFA was conducted using oblimin rotation to examine the factor correlation. The loadings did not
show any significant improvement from the EFA using Varimax rotation and component correlation matrix revealed
that WNW conflict and WLB components are correlated with r=-.4 . 13
For the ease of using in the diagram, following notations are used to represent the observed variables relating to
each latent construct: WFC1- WFC4 for Work-to-nonwork conflict(WNWC); FWC1 - FWC4 for nonwork-to-
work conflict( NWWC); WFE1- WFE3 for work-to-nonwork enrichment (WNWE); FWE1 - FWE3 for
nonwork-to-work enrichment (NWWE); work- life balance – (WLB).

107
The work/nonwork literature has not been consistent with measurement of
work/nonwork interactions and work-life balance. There are instances where some of the scales
have been used interchangeably and without proper discrimination of the constructs (e.g., lack of
work/family conflict equated to work-life balance) which has been highlighted as a problem
(Carlson, Grzywacz, & Zivnuska, 2009; Grzywacz & Carlson, 2007). This is especially the case
for work-life balance, where theoretical understanding and new scales are still being developed
and tested (Carlson et al., 2009; Joplin et al., 2007). The results of the EFA helped to identify
distinct constructs and supported the theorized item categorization.
Table 8: Eigenvalues and percentage of variance extracted by the five factors
Extraction sum of squared loadings Rotated sum of squared loadings Component
Eigen value
Percentage of Variance
Cumulative percentage
Eigen value
Percentage of Variance
Cumulative percentage
1 6.37 28.96 28.96 4.58 20.80 20.80
2 2.86 12.98 41.94 3.22 14.65 35.45
3 2.32 10.54 52.48 2.67 12.11 47.56
4 1.44 6.535 59.02 2.17 9.88 57.44
5 1.24 5.62 64.64 1.58 7.20 64.64
6 .86

108
Table 9: Factor loadings of work/ nonwork interaction variables using principal
component analysis with varimax rotation
Component Item code
Item description 1 2 3 4 5
WFC1 The demands of your work interfere with your private (nonwork) life. -.246 .838 .035 .052 .024
WFC2 The amount of time your job takes up makes it difficult to fulfill nonwork responsibilities.
-.283 .875 .040 -.007 -.027
WFC3 Due to work-related duties, you have to make changes to your plans with your private (nonwork) activities.
-.166 .875 .117 .011 -.025
WFC4 a
Your job produces strain that makes it difficult to fulfill private (nonwork) duties.
-.358 .774 .143 -.067 .018
FWC1 The demands of your private (nonwork) life interfere with work-related activities.
-.044 .176 .767 .059 -.018
FWC2 You have to put off doing things at work because of demands on your time in your private (nonwork) life.
-.003 .062 .763 .155 -.065
FWC3 Strain related to your private (nonwork) life interferes with your ability to perform job related duties.
-.149 .033 .788 .038 -.026
FWC4 Your private (nonwork) life interferes with your responsibilities at work such as getting to work on time, accomplishing daily tasks, and working overtime
-.049 .003 .830 -.034 -.030
WFE1 The things you do at work make you a more interesting person outside work.
.079 .081 .023 .789 .074
WFE2 The skills you use on your job are useful for things you have to do outside of your work.
.047 -.016 .074 .757 .129
WFE3 The things you do at work helps you to deal with personal and practical issues outside work.
.146 -.061 .179 .770 .125
FWE1 a
The love and respect you get in your private (nonwork) life makes you feel confident about yourself at work.
.289 .091 -.136 .252 .644
FWE2 Talking to someone at outside of work helps you to deal with problems at work.
-.087 -.079 .035 .054 .771
FWE3 a
Your private (nonwork) life helps you to relax and feel ready for the next day’s work.
.415 .023 -.111 .104 .653
WLB1 a
I can move easily from private (nonwork) obligations to work obligations without experiencing negative feelings.
.537 -.047 -.229 .439 -.119
WLB2 I do what is important to me to keep balance in my life. .748 -.247 .017 .018 .097
WLB3 I have a lot of demands on my time but I think that I handle them well.
.766 -.101 -.022 .177 .095
WLB4 I have established priorities for my work and personal life. .799 -.126 -.060 .086 .189
WLB5 I am able to balance the conflicting demands of my job and personal life.
.753 -.286 -.084 .078 .090
WLB6 I don’t overextend myself in one aspect of my life to the detriment of another aspect.
.692 -.328 -.014 -.037 .027
WLB7 I can move easily from work to private (nonwork) obligations without experiencing negative feelings.
.704 -.207 -.099 .174 -.087
WLB8 My relationships with work associates, friends, and family are not in competition with each other.
.589 -.089 -.041 -.014 .130
a These items loaded onto multiple factors. The item was considered to be associated with the factor with the higher
loading, which is also supported by a priori theorization.
109
Confirmatory Factor Analysis (CFA) of Work/ Nonwork Interaction Variables
Using the same set of observed variables as in the EFA, a CFA using maximum
likelihood estimation with AMOSTM
17.0 (Arbuckle, 2008) was run. Prior to running the
analysis, the variables included in the models were tested for the impact of missing values using
Missing Value Analysis module of PASW®17. (SPSS, 2009). The Little‟s test (Little (1998)
revealed a nonsignificant chi square statistic (χ2 = 879.5, df=986, p=.993) indicating that data
could be considered missing completely at random (MCAR). However, such deletion would
have eliminated close to 100 responses. Therefore, following Roth (1994) and Tsikriktsis (2005)
missing values for the quantitative variables were imputed using EM procedure. Also, the test for
multivariate normality of the models indicated little to moderate deviations from normality, but
no severe deviations were reported. The path diagram for the standardized results is shown in
Figure 10.
Model Fit: The hypothesized factor relationship model showed a significant Chi-squared
of χ2 (199, n=534) = 601.07, p<.05 suggesting less than ideal model fit. However, this measure
of model fit is sensitive to sample size and it becomes more and more difficult to retain the null
hypothesis14
as the number of cases increases (Byrne, 2009). Therefore, a number of alternative
fit indices have been developed, each having its own advantages and disadvantages (Hu &
Bentler, 1999), as discussed in Chapter 5 earlier.
14 The null hypothesis is that, postulated model holds in the population, i.e., the implied (sample)covariance matrix =
population covariance matrix. In order to accept this, we need a nonsignificant p value with smaller Chi squared
statistic.
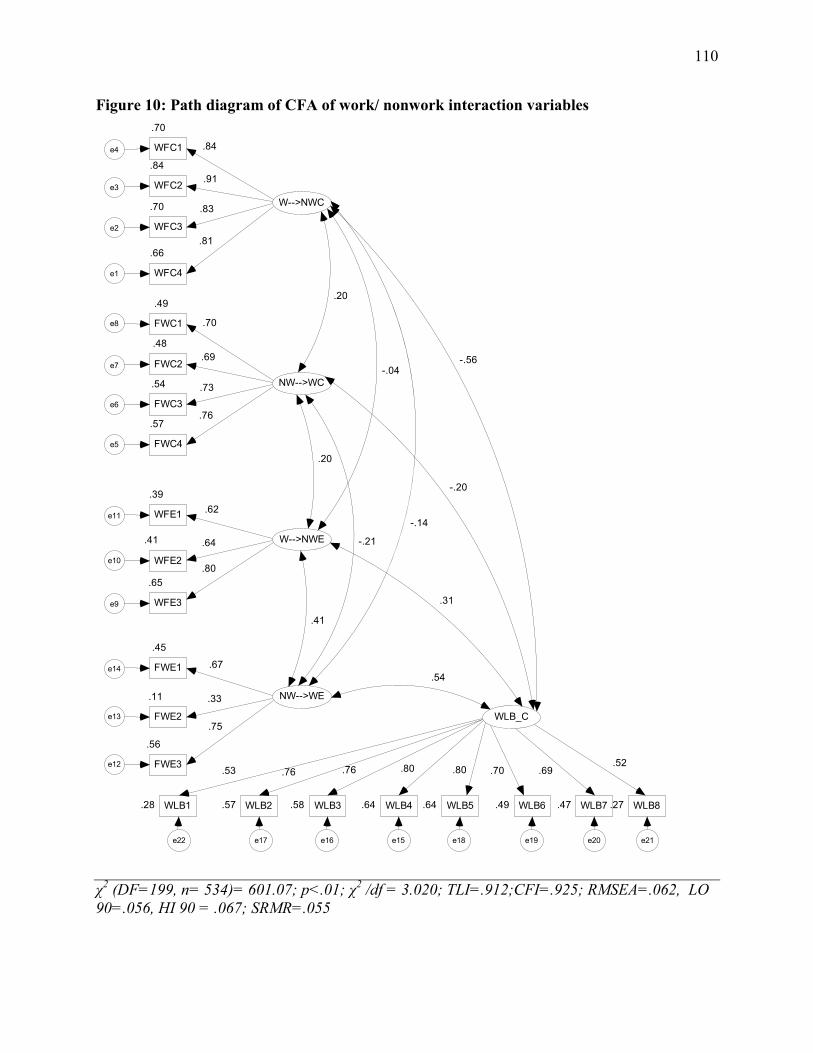
110
Figure 10: Path diagram of CFA of work/ nonwork interaction variables
χ2 (DF=199, n= 534)= 601.07; p<.01; χ
2 /df = 3.020; TLI=.912;CFI=.925; RMSEA=.062, LO
90=.056, HI 90 = .067; SRMR=.055
W-->NWC
.66
WFC4e1
.81
.70
WFC3e2
.83
.84
WFC2e3.91
.70
WFC1e4 .84
NW-->WC
.57
FWC4e5
.54
FWC3e6
.48
FWC2e7
.49
FWC1e8
.76
.73
.69
.70
W-->NWE
.65
WFE3e9
.41
WFE2e10
.39
WFE1e11.62
NW-->WE
.56
FWE3e12
.11
FWE2e13
.45
FWE1e14
.75
.67
.33
WLB_C
.64 WLB4
e15
.58 WLB3
e16
.57 WLB2
e17
.80
.64 WLB5
e18
.49 WLB6
e19
.47 WLB7
e20
.28 WLB1 .27 WLB8
e21e22
.76.76.52
.80 .69.53
.80
.70
.20
-.20
.41
-.21
-.14
.54
.31
.64
-.56-.04
.20

111
For the measurement model shown in Figure 10, TLI = .91, CFI = .93; which are not as
high as the .95, but within the .9 and .95 range. RMSEA (.06) is at the margin of the suggested
cutoff. Further, the model has a Chi-squared to degree of freedom ratio of 3.02. Although there
is no consensus about a cutoff value for this figure, Hinkin (1995) suggested that anything below
five could be acceptable with a preference for values close to two. Standardized Root Mean
Square (SRMR) value is .055, within the limit of below .080 (Hu & Bentler, 1999)
Factor Loadings: Except for three items (FWE2:.33, WLB1:.53 and WLB8:.52) the
majority of the items loaded on their respective factors with standardized factor loadings near the
rule of thumb cut off limit of .6 (Bagozzi & Yi, 1988). Five items had loadings in the range from
.61 to .69.
Improving Reliability and Validity of the Measurement Model: Factor loadings and less
than ideal model fit suggested that the hypothesized measurement model required some
alterations to maintain its stability in further analysis. Therefore, the three items with loadings
below .6 were removed. Thus, FWE2 (Talking to someone at outside of work helps you to deal
with problems at work), WLB1 (I can move easily from private (nonworking) obligations to work
obligations without experiencing negative feelings), and WLB8 (My relationship with work
associates, friends, and family are not in competition with each other) were identified for
removal. The impact of removing WLB1 and WLB8 from the work-life balance scale would not
be significant on the construct definition with six other items capturing different but related
aspects of work-life balance. On the other hand, the removal of FWE2 from a scale of three items
has a higher impact on the nonwork-to-work enrichment scale as it would be left with just two
items. However, the inter-item correlation matrix for the three items FEW1, FWE2, and FWE3
112
revealed that FWE2 has the lowest correlation with the other two, and the Cronbach‟s alpha
reliability estimate was also expected to be higher if the FWE2 is removed. Therefore, it appears
that respondents have interpreted FWE2 slightly differently from the other two constructs in the
nonwork-to-work enrichment scale. Further, with a factor loading (.33) much lower than the
acceptable norm of .6, it would lead to unstable results in the structural model if the item is
carried onto further analysis.
Examining the inter-item correlation matrix for WLB scale using PASW® 17.0 (SPSS,
2009) reliability analysis revealed that WLB1 and WLB8 items also had the lowest inter-item
correlations with other items compared to the remaining items. Further, the “reliability if the item
were deleted” score was higher for the two items of WLB1 and WLB8. Considering these factors
WLB1 and WLB8 were removed from the WLB_C scale as the remaining six items were capable
of providing a stable and valid scale to measure the construct work-life balance. Therefore, a
new CFA was conducted with FWE2, WLB1, and WLB8 removed from the previous model. The
adjusted model is shown in Figure 11.

113
Figure 11: CFA of the altered measurement model
χ2 (DF=142, n= 534)= 381.15; p<.01; χ2 /df = 2.682; TLI=.940;CFI=.950; RMSEA=.056,
LO90= .049, HI 90 =.063; SRMR =.05
Note: Removed indicators compared to the previous model: WLB1, WLB8 and FWE2
W-->NWC
.66
WFC4e1
.81
.70
WFC3e2
.84
.84
WFC2e3.92
.70
WFC1e4 .84
NW-->WC
.57
FWC4e5
.54
FWC3e6
.48
FWC2e7
.49
FWC1e8
.76
.73
.69
.70
W-->NWE
.65
WFE3e9
.41
WFE2e10
.39
WFE1e11.62
NW-->WE
.51
FWE3e12
.46
FWE1e14
.72
.68
WLB_C
.65 WLB4
e15
.59 WLB3
e16
.59 WLB2
e17
.81
.64 WLB5
e18
.50 WLB6
e19
.44 WLB7
e20
.77.77 .80 .66
.80
.70
.20
-.19
.43
-.23
-.14
.56
.29
.64
-.57-.04
.20

114
The Chi-squared statistic was much smaller (χ2(142, n=534)= 381.15; p<.01) with χ
2/df
ratio of 2.68, within the range for a well fitting model (Hinkin, 1995). Alternative fit indices
improved to TLI= .94, and CFI= .95 bringing them towards the .95 suggested cut-off values (Hu
& Bentler, 1999). RMSEA had also reduced to .056 with the 90 percent confidence interval
values being LO90= .049, HI 90 = .063. SRMR has also improved to .05. Change in fit statistics
was significant with ∆ χ2 =219.9 (∆d.f.=57, p<.001) and ∆CFI=.025, suggesting a significant
improvement in model fit (Byrne, 2009; Cheung & Rensevold, 2002). The adjusted model had
all standardized regression weights greater than .61 (Bogozzi & Yi, 1988) with all of them
significant at p<.001.
After the adjustments WLB composite variable comprised of six items resulting in a
Cronbach‟s alpha of .88. However, nonwork-to-work enrichment (NWWE) scale now had
only two items with Cronbach‟s alpha of .65. In general, using more rather than fewer indicates
to define a construct would produce more efficient representation of the construct and its
interrelationships (Little, Lindenberger, & Nesselroade, 1999). Although studies suggest “more”
is better than two items, literature also points out that number of indicators have shown little
effect of bias (Little et al., 1999), and adverse impact of fewer items is stronger with small
samples of less than 100 (Marsh, Hau, Balla, & Grayson, 1998). It is acknowledged that two-
item scale for the measuring NWWE could pose some limitation in terms of representation of
NWWE and its interrelationships to other constructs in the study. However, with a sample in
excess of 500 respondents, it is expected that such effects would be minimal.
115
Construct Validity: In order to ascertain the validity and reliability of the scales, Fornell
and Larcker (1981) suggested the use of two measures: composite reliability (CR) and average
variance extracted (AVE). The variables‟ CR and AVE in the adjusted model are shown in Table
10. Except for “Nonwork-to-work enrichment”, which had CR marginally below the .7 all other
CR estimates were above .7 and AVE estimates were close to or above .5.
A comparison of the square root of the average variance extracted with the correlations
among constructs indicates that each construct was more highly related to its own measures than
to other constructs, establishing discriminant validity (Fornell & Larcker, 1981; Richardson et
al., 2009).
The analyses suggested that the five constructs, namely, work-to-nonwork conflict
(WNWC), nonwork-to-work conflict (NWWC), work-to-nonwork enrichment (WNWE),
nonwork-to-work enrichment (NWWE), and work-life balance (WLB) could be used in further
analyses with the structural model. Most importantly, they indicated that work-life balance was a
separate construct above and beyond conflict and enrichment measures. The next chapter
examines the impact of ICT use on work/nonwork interaction variables, which is the thrust of
this study.

116
Table 10: Path loadings, composite reliability, and average variance extracted for the latent
variables in the adjusted measurement model
Variables
Valid N Min Max Mean
Std.
Dev. λ CR AVE
W-->NW CONFLICT 534 1.0 7.0 3.81 1.21 .91 .72
WFC1 534 1.0 7.0 4.22 1.35 .84
WFC2 532 1.0 7.0 3.83 1.38 .91
WFC3 534 1.0 7.0 3.74 1.30 .84
WFC4 533 1.0 7.0 3.45 1.39 .81
NW-->W CONFLICT 534 1.0 6.5 2.65 0.90
.81 .52
FWC1 534 1.0 7.0 2.96 1.08 .70
FWC2 529 1.0 7.0 2.61 1.13 .69
FWC3 531 1.0 7.0 2.48 1.10 .73
FWC4 533 1.0 7.0 2.55 1.20 .76
W-->NW ENRICHMENT 534 1.0 7.0 4.35 1.14
.73 .48
WFE1 524 1.0 7.0 4.35 1.37 .61
WFE2 530 1.0 7.0 4.64 1.42 .64
WFE3 529 1.0 7.0 4.02 1.44 .80
NW-->W ENRICHMENT 534 1.5 7.0 5.16 1.17
.65 .48
FWE1 527 1.0 7.0 5.20 1.39 .67
FWE3 533 1.0 7.0 5.13 1.32 .72
WLB 532 1.2 7.0 5.08 1.08
.89 .57
WLB2 532 1.0 7.0 5.32 1.39 .77
WLB3 531 1.0 7.0 5.30 1.23 .77
WLB4 531 1.0 7.0 5.35 1.27 .81
WLB5 531 1.0 7.0 5.05 1.32 .80
WLB6 527 1.0 7.0 4.45 1.50 .70
WLB7 531 1.0 7.0 5.03 1.44 .66
Note: Please refer to Table 6 of Chapter 6 for correlations and Cronbach’s Alpha values of
latent variables.
117
Verification of Equivalency of Measures across Canada and Sri Lanka
The above analyses were carried out for the total sample of respondents comprising of
participants from both Canada and Sri Lanka. Participants from both countries completed the
same survey administered in English, thus reducing any biases based on language of the survey
and interpretation differences caused by translation. However, in order to assess the possibility of
combining the samples in further analyses it was necessary to verify whether the same factor
structures are valid across the both sub-samples.
Several assessment methods were used to verify the equivalency of key variables across
the country sub-samples. First, to assess the factorial invariance (Drasgow & Kanfer, 1985) an
EFA was run with the data from the Canadian and Sri Lankan samples, for the key constructs of
work/nonwork relationships. Based on the eigenvalues and the scree plots, the items loaded onto
five different factors. The item categorization was in line with the results shown in Table 9,
which represents the results from the combined data set. In each case, the total variance
explained by the five factors was 66 percent.
To further validate the factorial invariance, a CFA was run for the measurement model
shown in Figure 10 as per the suggestions from the literature (Cheung & Rensvold, 1999;
Drasgow & Kanfer, 1985). The unconstrained model with multi-group testing showed that
FWE2, WLB1, and WLB8 had loadings much less than the cutoff of .6 (similar to the combined
sample). Therefore group invariance testing was conducted for the adjusted measurement model
shown in Figure 11. The unconstrained model and the fully constrained model both showed
acceptable fit indices as shown in Table 11. There were slight differences in item loadings across
the two countries, but the majority of the items had very similar loadings. ∆ CFI was only .009,
and thus the sub-samples were not significantly different, since Cheung and Rensevold (2002)

118
suggested a minimum of .01 CFI difference for noninvariance. Although the χ2 difference was
significant across the two samples this is sensitive to sample size and could be less reliable. It
should also be stressed that the Sri Lankan sample had only 109 data points suggesting that one
needs to be cautious in interpreting the CFA analysis due to small sample issues.
Table 11: Testing factorial invariance across the sample from the two countries.
χ2 df
χ2
/df
TLI CFI RMSEA ∆ CFI ∆ χ2 ∆df
Unconstrained factor model
566.5 284 2.00 .931 .942 .043
Fully constrained
factor model 635.5 308 2.26 .926 .933 .045 .009 69.0(p<.001) 24
In addition, the reliability coefficients for the key scales were calculated for the two
samples to see if there are significant deviations. All reliability coefficients assessed as
Cronbach‟s alpha values were in the acceptable range (.62 - .90) for both the samples with
minimal deviations across the two groups. Overall, these tests suggested that the two samples
from Canada and Sri Lanka can be considered invariant in terms of item loadings and item
interpretation by the respondents. This is an important factor to consider in cross-cultural
research (Drasgow & Kanfer, 1985), especially when combining samples for statistical testing.
Since the analysis suggested invariance across the samples, in future analyses the two samples
would be combined unless specific country differences are the targeted analysis.
119
Common Method Bias
There is a widely accepted view that self-report measures of participants via surveys may
lead to problems due to common method bias (CMB), resulting in a common method
variance15
(CMV). This shared variance can be due to respondent‟s consistency motifs, transient
mood states, illusory correlations, item similarity, and social desirability (Podsakoff, MacKenzie,
Lee, & Podsakoff, 2003; Williams, Hartman, & Cavazotte, 2010). Researchers are expected to be
mindful of it and to control for it (Kline, Sulsky, & Rever-Moriyama, 2000; Podsakoff et al.,
2003; Richardson et al., 2009), although some researchers question the significance of this
problem. For example Spector (2006) calls it an “urban legend,” that is “both an exaggeration
and oversimplification of the true state of affairs” (Spector, 2006: 230). More recent literature
suggests that although method variance occur frequently, monomethod correlations are generally
not as inflated as compared to their true score counterparts due to the counter-balance of
common method effects and measurement unreliability (Kammeyer-Mueller, Steel, &
Rubenstein, 2010; Lance, Dawson, Birkelbach, & Hoffman, 2010).
As discussed earlier in the section on survey development, several actions were taken to
minimize impacts of monomethod data collection. These included varying the response style in
the questionnaire (e.g., frequency based and perception based), using negatively-worded items,
and asking for objective measures such as actual hours of use in terms of technology. Further,
data from the independent interview study with 36 interviews helped to triangulate the results of
15 CMV is a systematic error variance shared among variables measured with and introduced as a function of the
same method and/or source. CMV can either inflate or attenuate relationships, but it is most commonly expected to
cause inflation when the method variance components of the individual measures are more positively related than an
underlying true relationship (Richardson, et al., 2009).
120
two methods (i.e., survey and interview) which would help identify any extreme deviation from
monomethod self-reported data.
The literature offers several methods to assess CMB. Podsakoff et al., (2003) offered a
summary of techniques to be used in specific situations. The data set used in the model was
tested for CMB using two of the methods prescribed by Podsakoff et al., (2003). First, a model
testing Harmans‟ one factor hypothesis was specified by linking all observed variables to a single
latent scale. Fit estimates were poor [χ2/DF = 13.55; CFI= .528, TLI= .469, RMSEA= .172 (90%
CI= .166 - .179)] indicating the inadequacy of a single-factor source.
The second test consisted in controlling for the CMB factor. A latent CMB factor was
added to the model with all of the 19 measured variables loaded on to both the CMB factor and
their theoretical constructs. Variances of all latent variables were set to one, and all paths from
latent scales to observed variables were set free; for identification purposes a few paths were set
to be equal to each other. The resulting path diagram showed a much better fit, (χ2/df =2.18, CFI
=.97, TLI=.96); however, all loadings relating to the original constructs remained significant and
larger than loadings to the common method factor. This suggest that there was no significant
common method factor affecting the measurement model (Podsakoff et al., 2003) and the
composite variables could be safely used in the structure model.
In summary, this chapter described the measurement model and detailed the fine tuning
of scale items to arrive at statistically sound latent variables for further analysis. The chapter also
addressed the possible problem of CMB and used rigorous statistical techniques to determine its
risk to study data. The analysis revealed there is minimal contamination due to CMB, and data
can be safely used in the analysis of the structure model to test the study hypotheses.

121
CHAPTER 8 - STRUCTURAL MODEL
Structural Model for the Primary Relationships in the Study
The main objective of this chapter is to assess the relationship between ICT usage,
work/nonwork interactions, and WLB. In this analysis, the observed variable TOTAL_ICT was
used as independent variable. TOTAL_ICT captured the total of number of hours of ICT use over
different types of technologies (i.e., e-mail, Internet, and portable communication devices) for
both work use and nonwork use. Respondents provided an estimate of the actual hours of use of
each of the above technologies on work an nonwork days based on a scale of “none, less than 1
hour, 1-2 hours, 2-3 hours, 3-5 hours, and more than 5 hours.”). In fact, the data allowed the
calculation of the use of each of these technologies for work and nonwork usage separately.
TOTAL_ICT represented the totality of work and nonwork ICT use for an individual for work
and nonwork purposes in a combination of a typical work day and a typical nonwork day.
Descriptive statistics and correlation matrix of the variables used in the analysis are presented in
Table 6 of Chapter 6.
Figure 12 shows the full structural model with the relationship of ICT use on
work/nonwork interactions. The χ2/df ratio was in the acceptable range at 3.04 (Hinkin, 1995)
with a significant chi-square goodness of fit index, χ2(163, n=534)= 495.4; p<.01. Alternative fit
indices were close to acceptable cutoffs at TLI = .92, CFI=.93, RMSEA = .062 and the 90%
confidence intervals of RMSEA between .056 and .068. SRMR was .084, slightly above the
accepted cutoff (Hu & Bentler, 1999).

122
Figure 12: Structural model for ICT use and work/ nonwork interactions
χ2 (DF=163, n= 534)=495.41; p<.01; χ
2 /df = 3.039; TLI=.919;CFI=.931;RMSEA=.062, LO90=.056, HI 90 =.069; SRMR =.084;
a Other than these two regression paths, all the others are significant at p<.001
.00
TOTAL_ICT
e1
.03
W-->NWC
.71
wfc1e5
.02
NW-->WC
.48
fwc1 e6
.03
W-->NWE
.39
wfe1 e7
.00
NW-->WE
.38
fwe1 e8.84
.51
WLB_C
e11 e12 e13 e14
e16
.84
wfc2e17 .92
.70
wfc3e18
.65
wfc4e19
.48
fwc2 e20
.54
fwc3 e21
.58
fwc4 e22
.76
.43
wfe2 e23
.62
wfe3 e24
.79
.62
.62
fwe3 e26
.57 wlb2
e30
.57 wlb3
e31
.75
.63 wlb4
e32
.62 wlb5
e33
.47 wlb6
e34
.69
.42 wlb7
e35
.66
.81
.83
.76
.73
.62
-.05
.79
.64.78
-.05.16.16
-.53
.79
.17 .45
.70
.14
.69
a
a

123
Adjusted Structural Model
Descriptive statistics revealed that the two latent variables WNWE and NWWE
shared a correlation of .31 (see Table 6, Chapter 6) and there was no direct path between them.
To accommodate the commonalities associated with the two constructs, the error terms of these
two constructs (WNWE and NWWE) were allowed to correlate with each other (Zellner &
Theil, 1962). This was also supported by the modification indices suggestions for the path
diagram. The resulting path diagram after the correlation of error terms is shown in Figure 13.
All fit indices related to the altered model showed significant improvement compared to
the previous model indicating much better model fit (χ2 (162,n=534)= 444.05; p<.01; χ
2/df
=2.74; CFI=.94; TLI= .93; and RMSEA =.057 (90% CI = .051 - .064) with a significant chi
square difference (∆χ2 (1)=51.4, p<.001) and significant difference in CFI (∆CFI=.01) from the
previous model. Therefore, this adjusted model is used to test the hypothesized relationships in
the study.
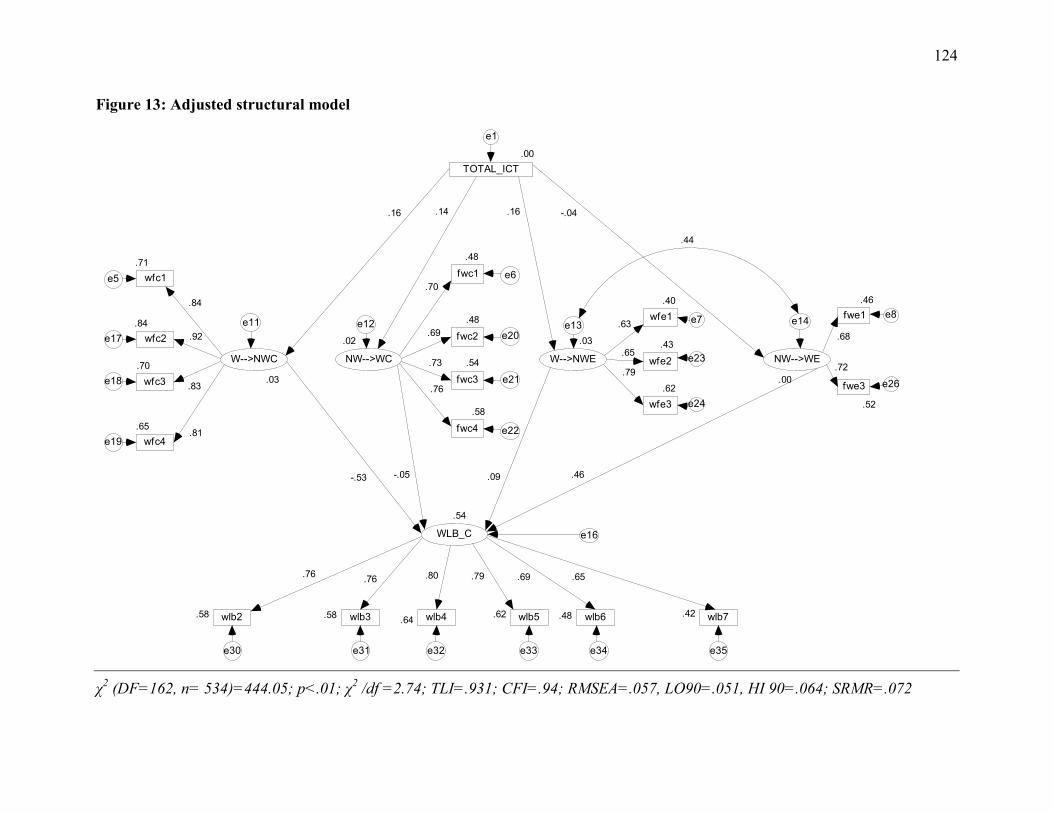
124
Figure 13: Adjusted structural model
χ2 (DF=162, n= 534)=444.05; p<.01; χ
2 /df =2.74; TLI=.931; CFI=.94; RMSEA=.057, LO90=.051, HI 90=.064; SRMR=.072
.00
TOTAL_ICT
e1
.03
W-->NWC
.71
wfc1e5
.02
NW-->WC
.48
fwc1 e6
.03
W-->NWE
.40
wfe1 e7
.00
NW-->WE
.46
fwe1 e8.84
.54
WLB_C
e11 e12 e13 e14
e16
.84
wfc2e17 .92
.70
wfc3e18
.65
wfc4e19
.48
fwc2 e20
.54
fwc3 e21
.58
fwc4 e22
.76
.43
wfe2 e23
.62
wfe3 e24
.79
.68
.52
fwe3 e26
.58 wlb2
e30
.58 wlb3
e31
.76
.64 wlb4
e32
.62 wlb5
e33
.48 wlb6
e34
.69
.42 wlb7
e35
.65
.81
.83
.76
.73
.63
-.05
.72
.65.79
-.04.16.16
-.53
.80
.09 .46
.70
.14
.69
.44
125
Results of Hypothesis Testing
Statistical data analysis provides a sense of direction and magnitude of the relationships
between variables, but underlying reasons for these are not well captured in a quantitative
survey. Therefore, the study included two additional qualitative data sources providing
underlying explanation for the relationships. The first was an independent qualitative study of 36
open-ended interviews with Sri Lankan and Canadian participants with similar selection criteria
as of the survey participants (professionals and managers). It is unlikely that all interviewees
participated in the survey. Even if they did, the survey was conducted more than 18 months after
the interviews minimizing cross-contamination between the two processes.
Second, the quantitative survey provided the opportunity for participants to explain their
ideas by answering some open-ended questions. It was a pleasant surprise to see that many
participants did use these open-ended questions to elaborate on their own ICT experiences,
especially considering the length of the survey. Therefore, both interview findings and answers
to open-ended questions were integrated into the discussion of outcomes of the statistical
analysis.
The relationships tested in the structure model are shown again in Figure 14. Since the
“Segmentation” scale did not demonstrate sufficient construct validity, it was not included in the
measurement model or the structure model. The first set of hypotheses (H1s and H2s) dealt with
the relationship of ICT use and work/nonwork interactions, while the second set (H4s and H5s)
addressed relationships between work/nonwork interaction and work-life balance. The results
from the testing of the structure model for the primary relationships are presented in Table 12.

126
The moderating effects of gender, age, and perceptions of ICT (H7s, H8s, and H9s) are tested in
the next chapter under further analysis.
Figure 14: Hypotheses tested using the adjusted structural model
Table 12: Results summary for hypothesis testing with the structural model
Hypothesis Relationship Predicted outcome direction λ Significance (p)
Critical Ratio
H1a Total_ ICT & WNWC + .16 .000 3.569
H1b Total_ ICT & NWWC + .14 .003 2.947
H2a Total_ ICT & WNWE + .16 .001 3.239
H2b Total_ ICT & NWWE + -.04 .489 -.693
H4a WNWC & WLB - -.53 .000 -11.575
H4b NWWC & WLB - -.05 .258 -1.131
H5a WNWE & WLB + .09 .102 1.634
H5b NWWE & WLB + .46 .000 6.878
Significant relationships (λ) are shown in bold.
127
Impact of ICT Use on Work/ Nonwork Interactions
ICT Use and Work-to-Nonwork Conflict: H1a predicted that the higher the individual‟s
ICT use, the higher the level of work-to-nonwork conflict. The results supported H1a with
standardized regression weight of .16 (p<.001). Therefore, as predicted, individuals seem to use
ICT devices to bring work to their nonwork lives, leading to work-to-nonwork conflict.
Work-to-nonwork conflict is manifested in the form of lack of time, attention, and energy
in nonwork activities, due to work permeating into the nonwork domain through the work/
nonwork border. The adverse effects of work-to-nonwork conflict are felt by border keepers of
the person (e.g., family members) (Clark, 2000) as much as the by individual herself. Both
interview and survey participants commented that their spouses or partners complained about
work-to-nonwork conflict initiated through ICT usage by allowing work to come into the
nonwork domain. Some complaints included, “Don‟t bring the Blackberry® to bed,” “You used
the Blackberry® in our holiday in Mexico to check office mail,” “Let it go, you have a private
life,” “You are home, stop checking e-mail on the Blackberry®,” and “On bereavement leave
you should not be accessing office e-mail.” Other border keepers such as children were also
affected by ICT-related work-to-nonwork conflict. One participant commented about a
complaint from her child, “Mommy is on the phone 24/7.”
It seems that individuals‟ experience of work-to-nonwork conflict was aggravated by
reactions by family and friends. For example,
My son was unhappy one day because I had to be on a conference call when my husband
and I dropped him off at his day home, so I couldn't get out of the car and go in with him.
I gave him hugs in the car instead of in the day home, so he was okay. This happens
maybe once a month or so, but he blurted out, "you do this all the time!" which made me
feel bad.
128
ICT Use and Nonwork-to-Work Conflict: H1b dealt with the opposite direction of
conflict, namely, nonwork-to-work conflict, and its association with ICT use. As predicted, there
was a significant positive relationship between ICT use and nonwork-to-work conflict with a
standardized regression weight of .14 (p=.003). The results suggest that the higher the ICT use,
the higher the nonwork-to-work conflict.
The statistical analysis presented a slightly smaller regression weight for the relationship
between ICT use and nonwork-to-work conflict compared to that of work-to-nonwork conflict.
Comparing the critical ratios of the two regression weights (Byrne, 2009) validated the fact that
ICT influence was smaller in nonwork-to-work conflict than in to work-to-nonwork conflict.
This was supported by qualitative data. Whereas no open ended response covered the intrusion
from nonwork-to-work life via ICT many individuals commented about work-to-nonwork
conflict. Interviewees did indicate intrusion from private life into work life via technology
means, perhaps because the interview protocol was designed to probe into this area; however
there was less negative sentiment attached with nonwork-to-work conflict.
Most interviewees noted that intrusion of nonwork into work came primarily as telephone
calls, and in many cases were children-related. Some participants who did not have separate e-
mail addresses for work and nonwork purposes commented about being distracted at work by
personal e-mails. In addition, many individuals mentioned the use of Internet for nonwork
purposes while at work (e.g., banking, researching on an interesting subject, reading news, etc16
).
Internet was ranked as the most used nonwork ICT type on work days in the survey results.
16 The majority of the survey data was collected in early 2008. Then the social networking sites such as Facebook®
had not gained the widespread popularity they enjoy in 2011.( http://www.facebook.com/press/info.php?statistics)
129
In summary, statistical analysis suggests that ICT use had a negative impact on cross-
domain intrusions from work-to-nonwork and vice versa. Results also suggest that individuals
were more tolerant towards the cross-domain intrusions from nonwork to work domain than the
reverse direction.
ICT Use and Cross-Domain Enrichment across the Work/ Nonwork Border:
Enrichment consists of enhanced role performance in one domain as a function of resources
gained from another. For enrichment to occur, resources must be not only transferred to another
role but also successfully applied in ways that result in improved performance for the individual.
H2a predicted that use of ICT was positively related to work-to-nonwork enrichment, while H2b
predicted that use of ICT was positively related to nonwork-to-work enrichment. Although these
hypotheses may appear to contradict H1a and H1b, theory suggest that both positive and
negative experiences cross over from one domain to the other via bridges such as ICT (Clark,
2000).
The significant standardized regression weight of .16 (p=.001) provided support for H2a,
that ICT use was related to work-to-nonwork enrichment. However, the results did not support
H2b (p=.489) indicating that the amount of ICT usage in a persons‟ life did not impact his/her
nonwork-to-work enrichment.
The lack of support for H2b could be due to how nonwork-to-work enrichment was
measured in this study. After the CFA, the nonwork-to-work enrichment scale was left with just
two items; “the love and respect you get in your private (nonwork) life makes you feel confident
about yourself at work” and “your private (nonwork) life helps you to relax and feel ready for the

130
next day‟s work.” Intuitively, these items appear to be independent from ICT use. However,
some interview participants mentioned that a call from a child during workday gave them a boost
of energy and a sense of purpose to continue with work or to bring a smile when they were
having a bad day at work. Therefore, while quantitative data did not support the notion that ICT
use related to nonwork-to-work enrichment, qualitative data did not offer a clear conclusion.
This could be an area for future investigation.
Survey participants provided examples of how work-to-nonwork enrichment materialized
via ICT. ICT enabled them to use work resources (such as time, IT infrastructure, and sometimes
work-related expertise) to enhance the performance of the nonwork domain. For example, some
individuals used Internet facilities at work to do research for their MBAs. Some of the more
common examples included the use of Internet to perform day to day tasks such as banking,
booking a holiday or a medical appointment, and managing family-related activities while at
work using the cell phone.
Relationships between Work/ Nonwork Interactions and Work-Life Balance
Inter-Domain Conflict and Work-Life Balance: The second set of hypotheses dealt with
the impact of work/nonwork interaction variables on work-life balance. In simple terms, H4a and
H4b predicted that conflict variables would relate negatively with work-life balance, whereas
H5a and H5b predicted enrichment variables would relate positively. The results supported H4a
(λ= -.53, p <.001), but not H4b (λ=-.06, p=.258); while work-to-family conflict had a strong
adverse effect on work-life balance, nonwork-to-work conflict did not appear to have a
significant effect on work-life balance.

131
The interviews corroborated these results. Respondents elaborated on how work-to-
nonwork conflict created problems especially in nonwork life leading to frustration and
adversely affecting work-life balance. This imbalance was noticed by both individuals and
border keepers in the nonwork domain (e.g., family and friends). For example, a project manager
in a telecommunication company commented,
My wife complains that I am married to my job. I do work long hours and tend to
work at home on the computer and over the cell phone. I know it can be annoying to
her and I agree that at this point our lives are little out of balance. But I am in the
middle of an important project that requires lot of attention. Hopefully things will
improve in the future.
Some others tried to reinstall the balance by adopting corrective mechanisms to reduce
the intrusion of work into the nonwork domains. A survey participant elaborated on how he
limited ICT driven intrusion from work by discontinuing the use of cell phone.
I deliberately discontinued my cell phone six months ago because it was interfering
with my life. I resented being 'available' to all and sundry at any time. It was also a
distraction while driving, in meetings, and at home. I am much happier now.
In addition, interview participants seemed to accept conflict from nonwork-to-work
domain with a somewhat positive stance, avoiding the perception of imbalance between work
and nonwork. Most acknowledged that receiving a call from a child or spouse in the middle of a
meeting diverted them from work and concentration. Others who were able to work from home
mentioned disruptions to work because they had to attend to family matters. However, when
probed about how these factors affect work-life balance, contrary to the response to work-to-
nonwork conflict, these individuals did not instantly connect these issues with work-life
imbalance. It almost seemed that allowing such nonwork-to-work conflict to exist was part and
132
parcel of how they managed their work-life balance. It seems that these professionals used their
discretion to allow some of the nonwork activities to flow into the work domain. Although this
could effectively create a nonwork-to-work conflict, the fact of knowing that nonwork life was
running smoothly seemed to improve their sense of work-life balance.
Inter-Domain Enrichment and Work-Life Balance: Work-to-nonwork enrichment and
nonwork-to-work enrichment were correlated at .31 (p<.01); therefore, the error terms of the
composite variables were allowed to correlate in the structure model (r=.44; p<.001) (Zellner &
Theil, 1962). H4c predicted that work-to-nonwork enrichment would be positively associated
with work-life balance and H4d predicted that nonwork-to-work enrichment would be positively
associated with work-life balance. H4c was not supported indicating that work-to-nonwork
enrichment is not a significant contributor towards work-life balance. On the other hand, H4d
was supported (λ= .46, p<.001) indicating a strong positive contribution of nonwork-to-work
enrichment towards work-life balance.
According to these results, nonwork-to-work conflict and work-to-nonwork enrichment
did not appear to contribute significantly towards work-life balance. However, work-life balance
was negatively affected by work-to-nonwork conflict and positively affected by nonwork-to-
work enrichment. This could intuitively mean, when work becomes demanding and infringing
upon the nonwork life, creating havoc in one‟s work-life balance, the antidote could be to create
a more relaxing environment in the nonwork setting, be it family, hobbies, or any other nonwork
activity. However, this might be difficult to achieve if work-life imbalance was created by work-
to-nonwork conflict, due to less time and energy to be engaged in nonwork activities, creating a
vicious cycle.
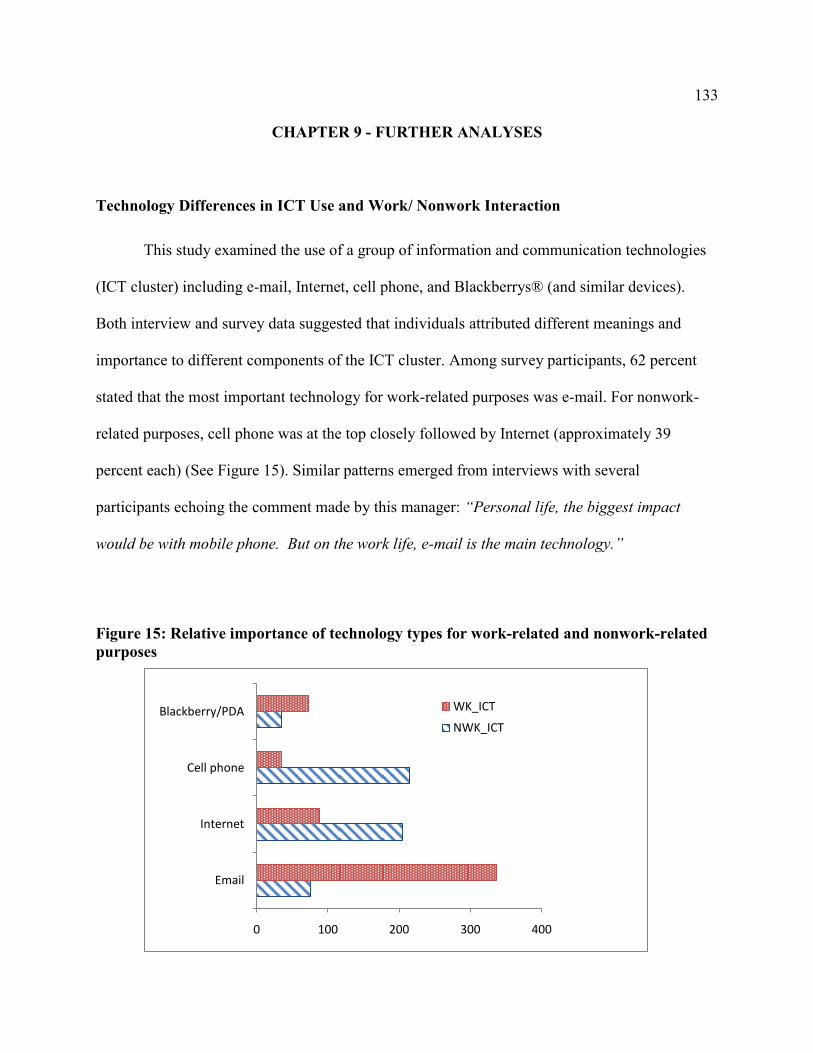
133
CHAPTER 9 - FURTHER ANALYSES
Technology Differences in ICT Use and Work/ Nonwork Interaction
This study examined the use of a group of information and communication technologies
(ICT cluster) including e-mail, Internet, cell phone, and Blackberrys® (and similar devices).
Both interview and survey data suggested that individuals attributed different meanings and
importance to different components of the ICT cluster. Among survey participants, 62 percent
stated that the most important technology for work-related purposes was e-mail. For nonwork-
related purposes, cell phone was at the top closely followed by Internet (approximately 39
percent each) (See Figure 15). Similar patterns emerged from interviews with several
participants echoing the comment made by this manager: “Personal life, the biggest impact
would be with mobile phone. But on the work life, e-mail is the main technology.”
Figure 15: Relative importance of technology types for work-related and nonwork-related
purposes
0 100 200 300 400
Internet
Cell phone
Blackberry/PDA WK_ICT
NWK_ICT
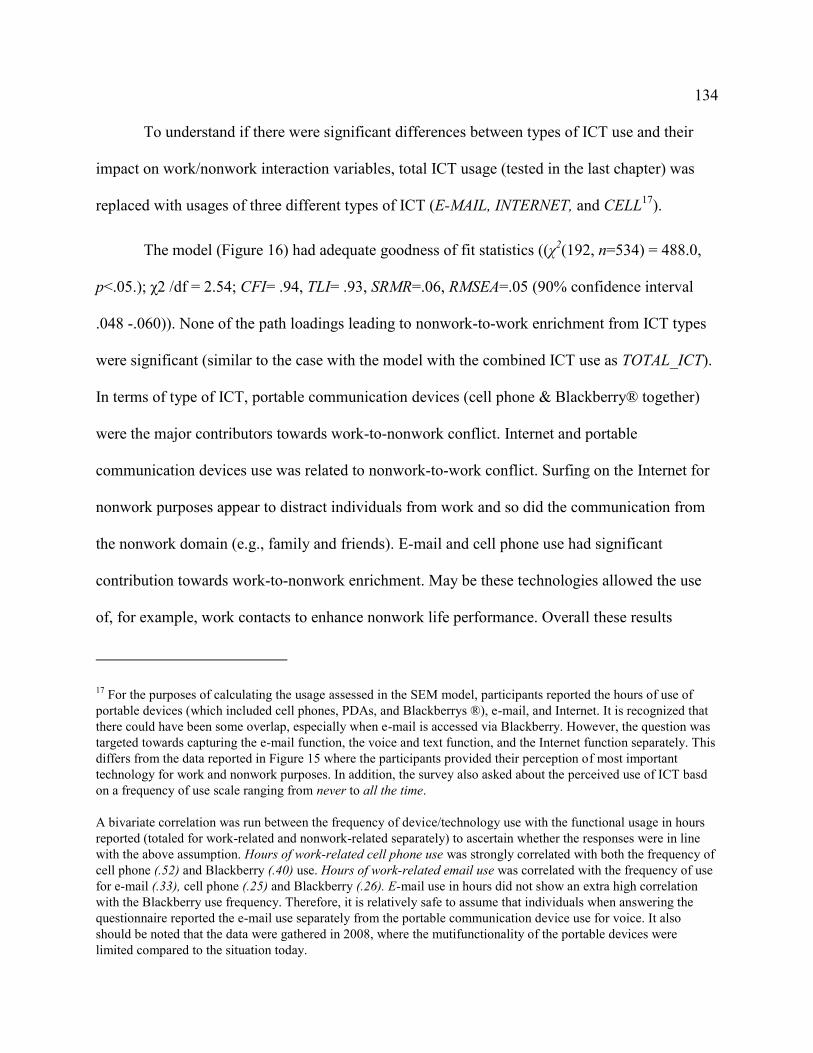
134
To understand if there were significant differences between types of ICT use and their
impact on work/nonwork interaction variables, total ICT usage (tested in the last chapter) was
replaced with usages of three different types of ICT (E-MAIL, INTERNET, and CELL17
).
The model (Figure 16) had adequate goodness of fit statistics ((χ2(192, n=534) = 488.0,
p<.05.); χ2 /df = 2.54; CFI= .94, TLI= .93, SRMR=.06, RMSEA=.05 (90% confidence interval
.048 -.060)). None of the path loadings leading to nonwork-to-work enrichment from ICT types
were significant (similar to the case with the model with the combined ICT use as TOTAL_ICT).
In terms of type of ICT, portable communication devices (cell phone & Blackberry® together)
were the major contributors towards work-to-nonwork conflict. Internet and portable
communication devices use was related to nonwork-to-work conflict. Surfing on the Internet for
nonwork purposes appear to distract individuals from work and so did the communication from
the nonwork domain (e.g., family and friends). E-mail and cell phone use had significant
contribution towards work-to-nonwork enrichment. May be these technologies allowed the use
of, for example, work contacts to enhance nonwork life performance. Overall these results
17 For the purposes of calculating the usage assessed in the SEM model, participants reported the hours of use of
portable devices (which included cell phones, PDAs, and Blackberrys ®), e-mail, and Internet. It is recognized that
there could have been some overlap, especially when e-mail is accessed via Blackberry. However, the question was
targeted towards capturing the e-mail function, the voice and text function, and the Internet function separately. This
differs from the data reported in Figure 15 where the participants provided their perception of most important
technology for work and nonwork purposes. In addition, the survey also asked about the perceived use of ICT basd
on a frequency of use scale ranging from never to all the time.
A bivariate correlation was run between the frequency of device/technology use with the functional usage in hours
reported (totaled for work-related and nonwork-related separately) to ascertain whether the responses were in line
with the above assumption. Hours of work-related cell phone use was strongly correlated with both the frequency of
cell phone (.52) and Blackberry (.40) use. Hours of work-related email use was correlated with the frequency of use
for e-mail (.33), cell phone (.25) and Blackberry (.26). E-mail use in hours did not show an extra high correlation
with the Blackberry use frequency. Therefore, it is relatively safe to assume that individuals when answering the
questionnaire reported the e-mail use separately from the portable communication device use for voice. It also
should be noted that the data were gathered in 2008, where the mutifunctionality of the portable devices were
limited compared to the situation today.
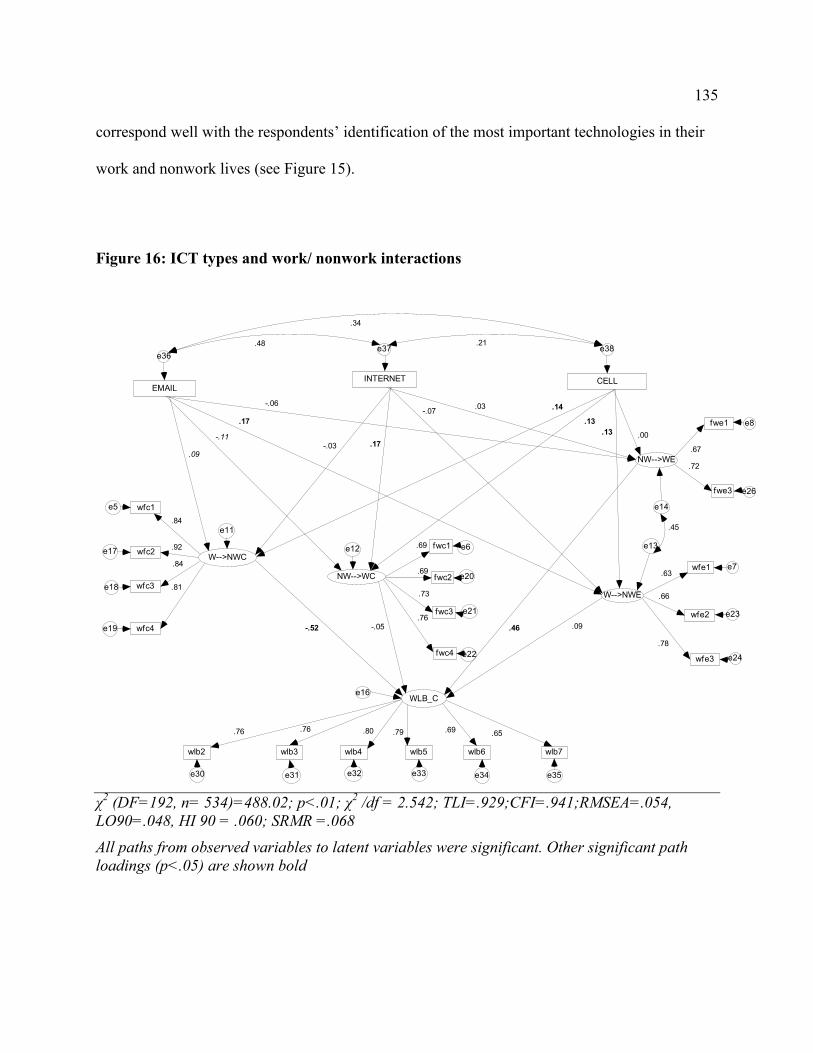
135
correspond well with the respondents‟ identification of the most important technologies in their
work and nonwork lives (see Figure 15).
Figure 16: ICT types and work/ nonwork interactions
χ
2 (DF=192, n= 534)=488.02; p<.01; χ
2 /df = 2.542; TLI=.929;CFI=.941;RMSEA=.054,
LO90=.048, HI 90 = .060; SRMR =.068
All paths from observed variables to latent variables were significant. Other significant path
loadings (p<.05) are shown bold
W-->NWC
wfc1e5
NW-->WC
fwc1 e6
W-->NWE
wfe1 e7
NW-->WE
fwe1 e8
.84
WLB_C
-.52
e11
e12 e13
e14
e16
wfc2e17.92
wfc3e18
wfc4e19
fwc2 e20
fwc3 e21
fwc4 e22
wfe2 e23
wfe3 e24
.78
.67
fwe3 e26
wlb2
e30
wlb3
e31
.76
wlb4
e32
wlb5
e33
wlb6
e34
.69
wlb7
e35
.66.81
.84
.76
.73
.69 .63
.72
.46
.65.79
EMAILINTERNET CELL
e36e37 e38
.09
.17
.13
.69
.17
-.07
.45
.03-.06
.00
.09.76
-.05
.48
.34
.21
-.03
.14
.80
.13
-.11

136
In summary, although e-mail appeared as the leader in work-related technology use, it did
not contribute significantly to work-to-nonwork conflict or nonwork-to-work conflict. Portable
communication devices (i.e., the cell phone function) appeared to create the highest interaction
across work/ nonwork border, influencing work-to-nonwork conflict, nonwork-to-work conflict,
and work-to-nonwork enrichment. Perhaps the ability of cell phones to bring voice connectivity
any time anywhere had far greater impact on shifting the mental gears of a person and creating
permeable boundaries.
Gender Differences in ICT Use and Work/ Nonwork Interactions
The hypothesized model shown in Figure 13 (i.e., the adjusted structural model with
TOTAL_ICT as the initial predictor) was tested for invariance between the two gender groups
using the method suggested by Byrne (2004). To test the invariance of the structure model, all
parameters were constrained to be equal across the two groups (by specifying unique names to
path loadings, variances, and covariances) and the analysis was rerun for this fully constrained
model. The results of the two analyses are shown in Table 13.
Table 13: Testing for group invariance across gender differences.
χ2 df
χ2 /df
TLI CFI RMSEA ∆ χ2 ∆df
Statistical significance of
change p
Unconstrained factor model for total ICT use
631.8 324 1.95 .922 .934 .043
Fully constrained factor model for total ICT use
656.2 347 1.89 .927 .934 .045 24.4 23 .38 (ns)
137
As seen by the non significant difference in chi-square statistic, the fully constrained
model did not differ significantly from the unconstrained model, indicating that the models were
invariant across the two gender groups. This was further supported by the small change in CFI
(∆CFI<.001), as Cheung and Resnsevold (2002) suggested a minimum of .01 difference in CFI
to indicate multigroup noninvariance. According to Cheung and Resnsevold (2002), ∆CFI is a
better measure of invariance since the chi square difference test is an excessively stringent test of
invariance especially considering that SEM models are, at best, only approximations of reality
(see Byrne 2010). Had these statistics met the minimum criteria of noninvariance, further tests
would be required to determine what factor loadings and paths were significantly different across
gender groups. Therefore, it can be concluded that across the two gender groups, there was no
significant difference of how ICT use impacted work/nonwork interactions or work-life balance.
In other words, the influences of use of ICT on work/nonwork interactions appeared to be gender
neutral. Therefore, no support was found for hypotheses 7a through 7d that predicted different
outcomes based on gender.
Age Differences in ICT Use and Work/ Nonwork Interactions
Survey participants‟ ages ranged from 23 to 65 years with a median age of 40 years. The
sample was divided into two groups at the median to test for differences based on age. The
division point was also supported by studies of Levinson et al. (1979) who suggested that
individuals go through four life areas; 0-20 years – pre-adulthood, 20-40 years – early adulthood,
40-60 years – mid-adulthood, and over 60- late adulthood. Although the authors described that
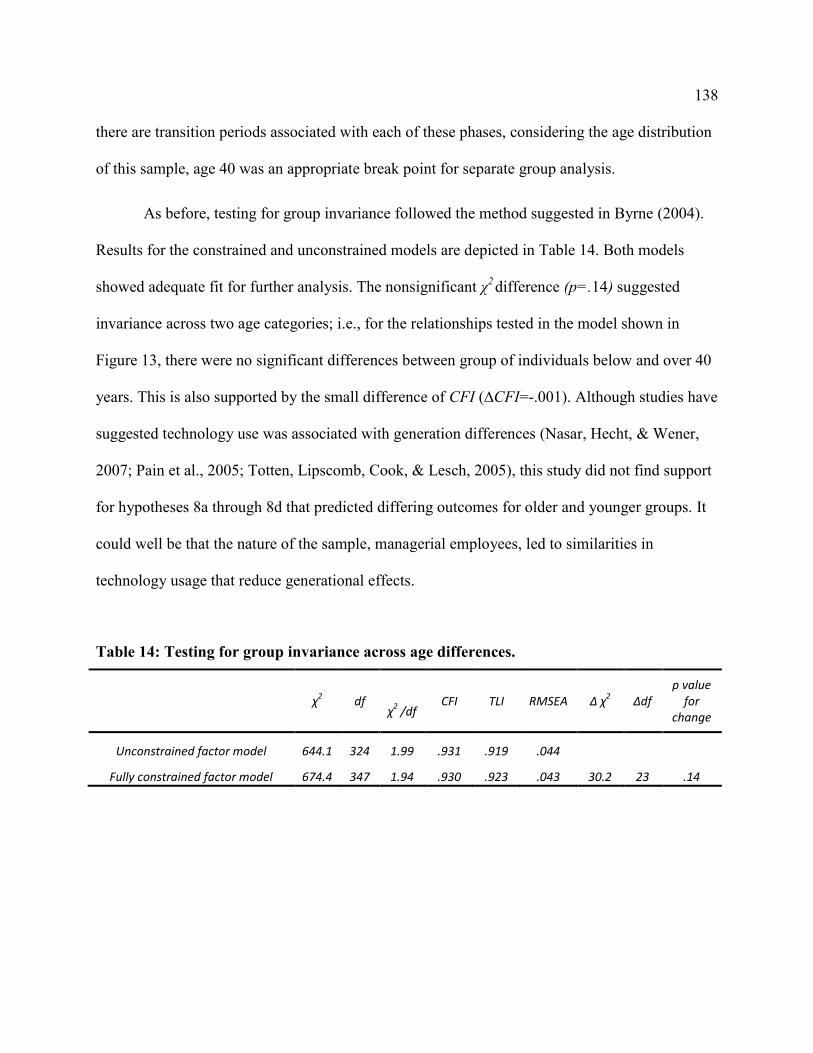
138
there are transition periods associated with each of these phases, considering the age distribution
of this sample, age 40 was an appropriate break point for separate group analysis.
As before, testing for group invariance followed the method suggested in Byrne (2004).
Results for the constrained and unconstrained models are depicted in Table 14. Both models
showed adequate fit for further analysis. The nonsignificant χ2 difference (p=.14) suggested
invariance across two age categories; i.e., for the relationships tested in the model shown in
Figure 13, there were no significant differences between group of individuals below and over 40
years. This is also supported by the small difference of CFI (∆CFI=-.001). Although studies have
suggested technology use was associated with generation differences (Nasar, Hecht, & Wener,
2007; Pain et al., 2005; Totten, Lipscomb, Cook, & Lesch, 2005), this study did not find support
for hypotheses 8a through 8d that predicted differing outcomes for older and younger groups. It
could well be that the nature of the sample, managerial employees, led to similarities in
technology usage that reduce generational effects.
Table 14: Testing for group invariance across age differences.
χ2 df
χ2 /df
CFI TLI RMSEA ∆ χ2 ∆df
p value for
change
Unconstrained factor model 644.1 324 1.99 .931 .919 .044
Fully constrained factor model 674.4 347 1.94 .930 .923 .043 30.2 23 .14
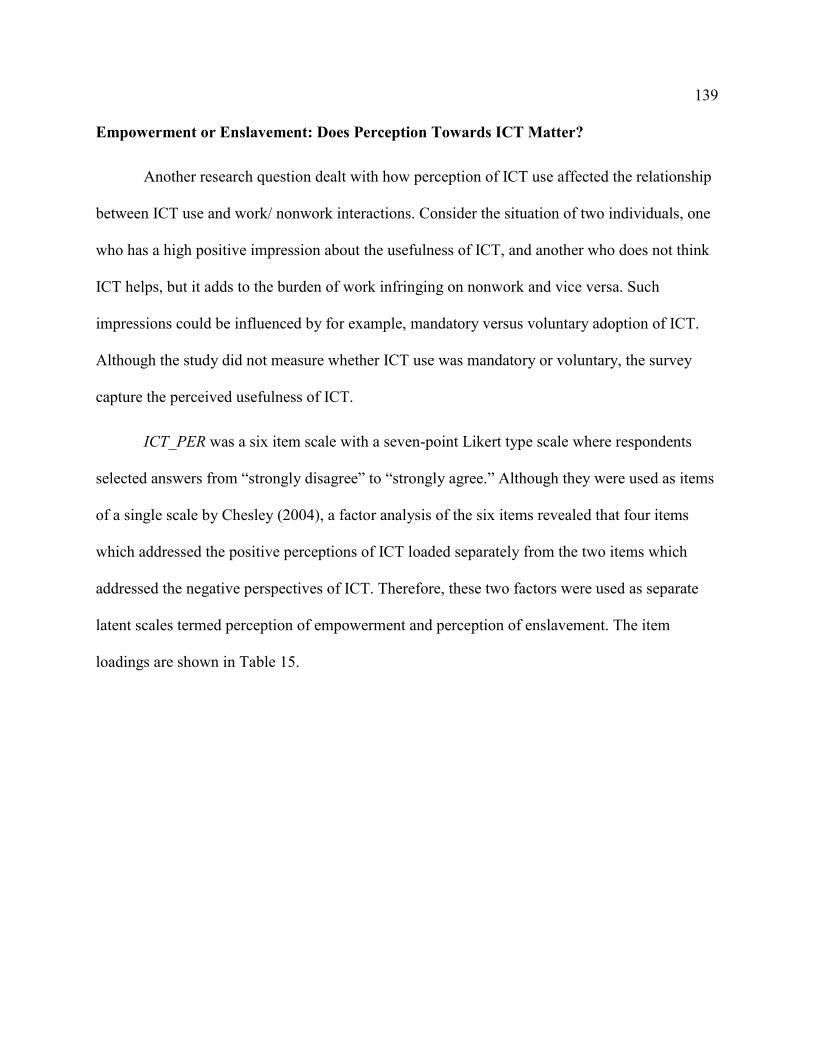
139
Empowerment or Enslavement: Does Perception Towards ICT Matter?
Another research question dealt with how perception of ICT use affected the relationship
between ICT use and work/ nonwork interactions. Consider the situation of two individuals, one
who has a high positive impression about the usefulness of ICT, and another who does not think
ICT helps, but it adds to the burden of work infringing on nonwork and vice versa. Such
impressions could be influenced by for example, mandatory versus voluntary adoption of ICT.
Although the study did not measure whether ICT use was mandatory or voluntary, the survey
capture the perceived usefulness of ICT.
ICT_PER was a six item scale with a seven-point Likert type scale where respondents
selected answers from “strongly disagree” to “strongly agree.” Although they were used as items
of a single scale by Chesley (2004), a factor analysis of the six items revealed that four items
which addressed the positive perceptions of ICT loaded separately from the two items which
addressed the negative perspectives of ICT. Therefore, these two factors were used as separate
latent scales termed perception of empowerment and perception of enslavement. The item
loadings are shown in Table 15.
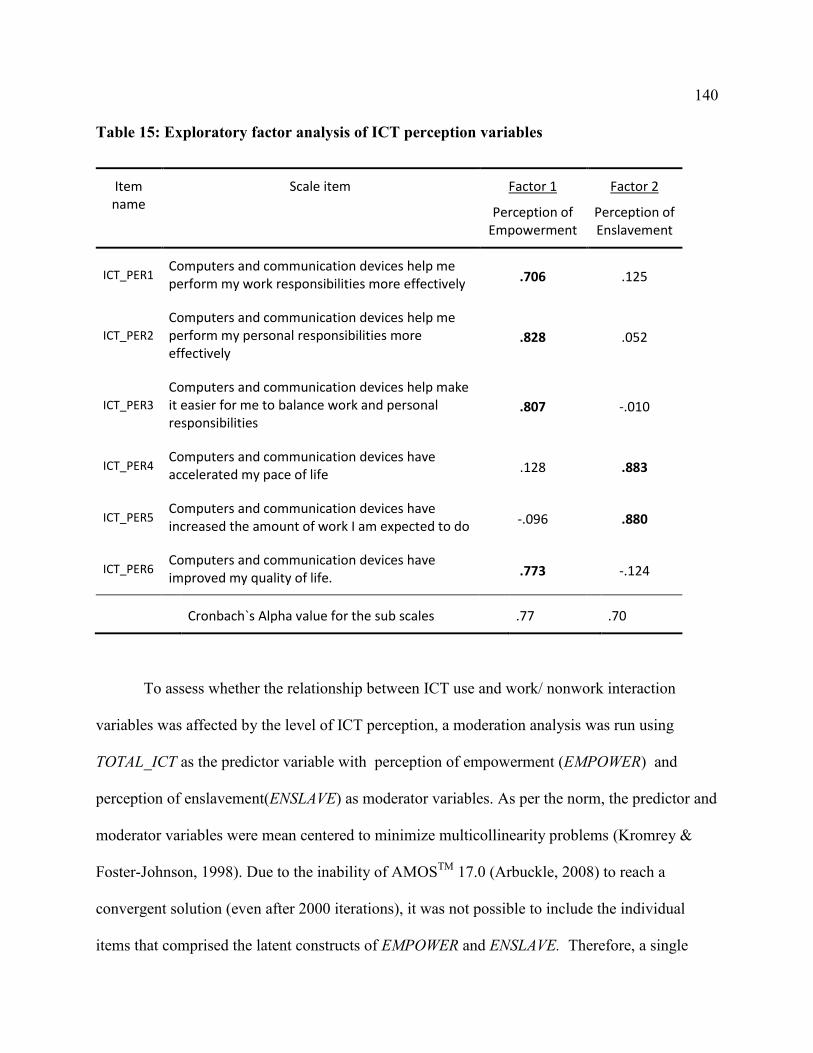
140
Table 15: Exploratory factor analysis of ICT perception variables
Item name
Scale item Factor 1
Perception of Empowerment
Factor 2
Perception of Enslavement
ICT_PER1 Computers and communication devices help me perform my work responsibilities more effectively .706 .125
ICT_PER2
Computers and communication devices help me perform my personal responsibilities more effectively
.828 .052
ICT_PER3
Computers and communication devices help make it easier for me to balance work and personal responsibilities
.807 -.010
ICT_PER4 Computers and communication devices have accelerated my pace of life .128 .883
ICT_PER5 Computers and communication devices have increased the amount of work I am expected to do -.096 .880
ICT_PER6 Computers and communication devices have improved my quality of life. .773 -.124
Cronbach`s Alpha value for the sub scales .77 .70
To assess whether the relationship between ICT use and work/ nonwork interaction
variables was affected by the level of ICT perception, a moderation analysis was run using
TOTAL_ICT as the predictor variable with perception of empowerment (EMPOWER) and
perception of enslavement(ENSLAVE) as moderator variables. As per the norm, the predictor and
moderator variables were mean centered to minimize multicollinearity problems (Kromrey &
Foster-Johnson, 1998). Due to the inability of AMOSTM
17.0 (Arbuckle, 2008) to reach a
convergent solution (even after 2000 iterations), it was not possible to include the individual
items that comprised the latent constructs of EMPOWER and ENSLAVE. Therefore, a single

141
item was created by averaging the individual items and this was mean centered and entered as
the observed variable for these two latent constructs. Such item parceling is subject to debate
(Little, Cunningham, Shahar, & Widaman, 2002). However, in cases where stable solutions
cannot be reached, item parceling, which improves the parsimony of the model, is recognized as
a possible solution to achieve model convergence (Little et al., 2002). The model with the
standardized loadings is shown in Figure 17. The significant path loadings are in bold. (All paths
from the latent constructs to their individual items were significant, but not represented in bold in
the diagram).
The model fit was acceptable with χ2(228, n=534)=588.96, p<.001. The χ
2/df statistic
was 2.58 and well within the acceptable range. TLI = .91, CFI =.93 and RMSEA=.054 (90%
confidence interval of .049 -.060) indicated that the model had adequate fit for interpretation of
results.
The main effects of ICT use on work/ nonwork interactions remained significant. The
interesting observation was in the moderator variables. The interaction between empowerment
and ICT use was not significantly related to any work/nonwork variables, suggesting ICT
perception of empowerment did not seem to affect the relationship between ICT use and work/
nonwork interactions. However, enslavement had significant direct and interaction effect (with
ICT use) on work-to-nonwork conflict and nonwork-to-work conflict (significant at p<.1 level
for the interaction effect). The interaction effect for work-to-nonwork conflict is represented in
Figure 18. The graph was drawn considering the values of ICT use at maximum and minimum
levels, and ENSLAVEMENT at the three levels of high (mean+1 standard deviation), medium
(mean), and low (mean- 1 standard deviation).

142
Figure 17: Moderating effect of “perception towards ICT”
χ2(228, n= 534)= 588.96, χ2/df= 2.58, CFI= .928 TLI= .905, RMSEA= .053 (90% CI - .049-.060)
T_ICT_cent
e1
W-->NWC
wfc1
e5
NW-->WC
fwc1
e6
W-->NWE
wfe1 e7
NW-->WE
fwe1 e8
.84
WLB_C-.48e11
e12
e13
e14
e16
wfc2
e17
.91
wfc3
e18
wfc4
e19
fwc2
e20
fwc3
e21
fwc4
e22
wfe2 e23
wfe3 e24.79
.64
fwe3 e26
wlb2 e30
wlb3 e31
.77wlb4 e32
.81
wlb5 e33
wlb6 e34.71
wlb7 e35
.64
.81.84
.77
.73
.61
.71
.66
.80
EMPOWER_C
EMP_cent
e36
ENSLAVE_C
ENS_cent
e39
EMPxICT_c
ENSxICT_c
EMPxICT_cen
e42
1.00
ENSxICT_cen
e43
-.07
.16
-.26
.07
-.06.02.13
-.02
.37
.96
.42
.16
-.04
-.11
.11.11
-.04
.82
.05
.23
.08
.70 .68 .76
.07
.50
-.01 .03
1.00
.39
.07
.36
143
Figure 18: Enslavement as a moderator in the relationship between work-to-nonwork
conflict and ICT use
This analysis relates to hypotheses 9a to 9d, and the original hypotheses were developed
considering the positive perception of ICT. However, as discussed earlier, data revealed two
distinct constructs, which were not correlated (r=-.02), focusing on the positive attributes
(empowerment) and negative attributes (enslavement) of perception on ICT. Therefore these
results present a caveat to the original hypotheses. When considering the positive perception of
ICT (perception of empowerment) there were no direct or interaction effects present and thus
there was no support for hypotheses 9a to 9d (9e was not evaluated as segmentation was
removed from the statistical analysis).
As presented by the above analysis and Figure 18, results suggest that for individuals
with higher adverse perception about the use of ICT (enslaving ICT), the positive relationship
between ICT use and cross-domain conflict is enhanced. Thus, compared a person with low
perception of ICT enslavement, such individual could experience more cross-domain conflict
144
with the same amount of ICT. However, perception of enslavement did not affect the relationship
between ICT use and work/ nonwork enrichment constructs.
It appears that the more an individual perceives ICT as enslaving (i.e., adding to work
load and pace), the more she would experience inter-domain conflict via ICT. Of course, it is
possible that the causality of these relationships could be different. For example, it could be that
an individual could have experienced cross-domain conflict with the use of ICT and therefore
felt enslaved by ICT itself, rather than the level of perception of enslavement moderating the
relationship between ICT use and cross-domain conflict.
145
Context of ICT Use and Impact on Work/ Nonwork Interactions
Hypotheses were developed and tested considering overall ICT use of an individual.
However, the data allowed more specific analysis based on the type of ICT use as well as how
and when the ICT was being used. The following section provides the results of this in-depth
analysis.
Many studies on ICT use have focused primarily on work-related use of ICT (e.g., Davis
et al., 1989; Venkatesh & Davis, 2000) with few studies examining the nonwork use of ICT
(Venkatesh & Brown, 2001). The uniqueness of this study is that it also investigates the cross-
domain use of ICT, i.e., work-related use on nonwork time and nonwork-related use during work
time plus work and nonwork-related use during work and nonwork times respectively.
In the structure model shown in Figure 19, total ICT use was segregated into four
distinct task/location settings, namely work-related use on work days (Wk_WD), nonwork related
use on work days (NWk_WD), work-related use on nonwork days (Wk_NWD), and nonwork-
related use on nonwork days (NWk_NWD). Disintegrating total ICT use into these four
components presented a clearer picture of how ICT use affects work/nonwork interaction
variables leading to work-life balance.
This model had adequate fit with CFI=.94, TLI=.93, RMSEA=.053 (with 90% confidence
interval ranging from .047-.059). χ2/df ratio was in the acceptable range of 2.48 with a
significant χ2 of 514.63 (d.f.=207, n=534). Path loadings from the four context-specific ICT use
variables to work/nonwork interaction variables provided interesting insights. A summary of the
results are shown in Table 16.
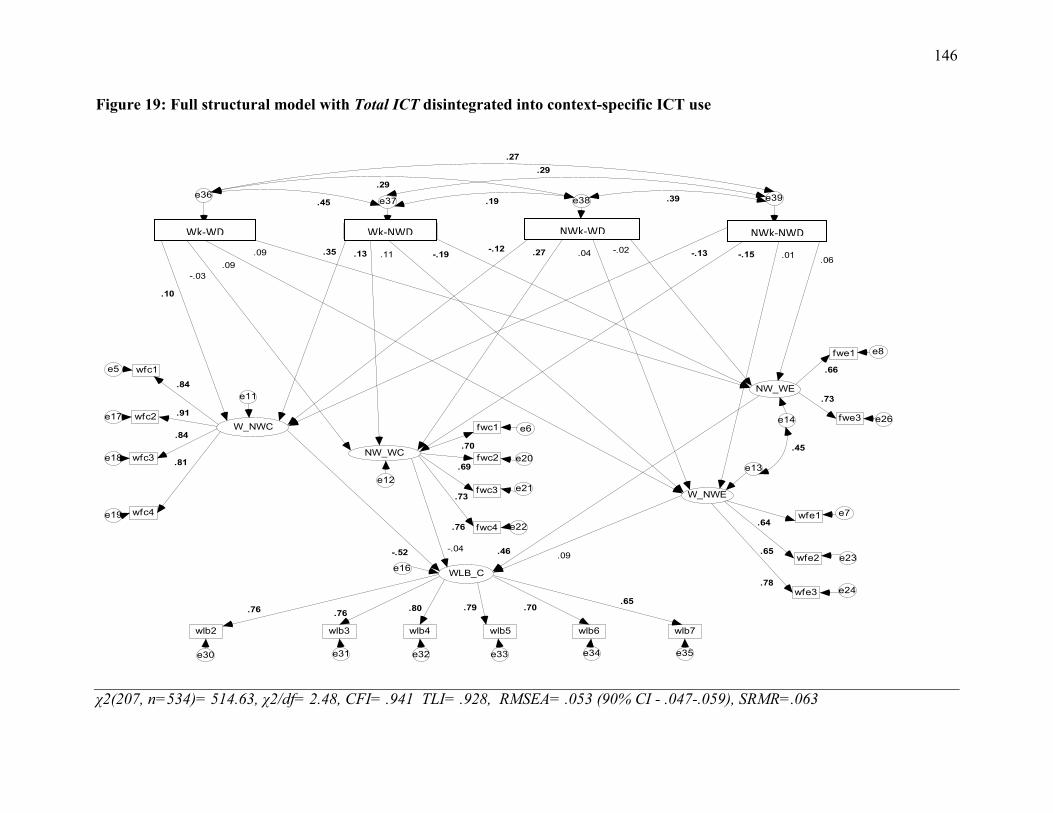
146
Figure 19: Full structural model with Total ICT disintegrated into context-specific ICT use
χ2(207, n=534)= 514.63, χ2/df= 2.48, CFI= .941 TLI= .928, RMSEA= .053 (90% CI - .047-.059), SRMR=.063
NWR_NWD_ln
W_NWC
wfc1e5
NW_WC
fwc1 e6
W_NWE
wfe1 e7
NW_WE
fwe1 e8
.84
WLB_C
e11
e12
e13
e14
e16
wfc2e17 .91
wfc3e18
wfc4e19
fwc2 e20
fwc3 e21
fwc4 e22
wfe2 e23
wfe3 e24
.66
fwe3 e26
wlb2
e30
wlb3
e31
.76
wlb4
e32
.80
wlb5
e33
wlb6
e34
.70
wlb7
e35
.81
.84
.76
.73
.69
.73
.65.79
WR_WD_ln WR_NWD_lnNWR_WD_ln
e36e37 e38 e39
.29
.09
.76
-.52
.78
.65
.64
.46
-.13-.12.35 .13 .11 -.19
.10
-.03
.09
.09.06
.45
.19.45 .39
.27
.29
.01-.02.04
-.04
.27
.70
-.15
NWk-NWD Wk-WD Wk-NWD NWk-WD
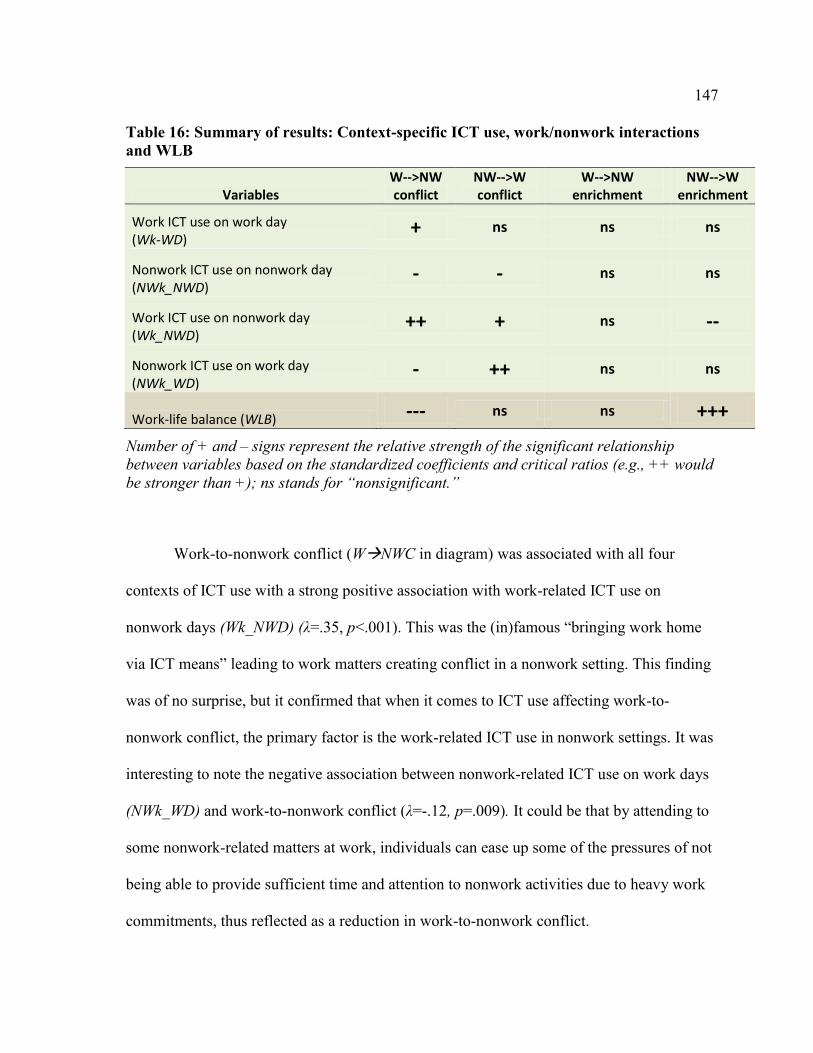
147
Table 16: Summary of results: Context-specific ICT use, work/nonwork interactions
and WLB
Variables W-->NW conflict
NW-->W conflict
W-->NW enrichment
NW-->W enrichment
Work ICT use on work day (Wk-WD)
+ ns ns ns
Nonwork ICT use on nonwork day (NWk_NWD)
- - ns ns
Work ICT use on nonwork day (Wk_NWD)
++ + ns --
Nonwork ICT use on work day (NWk_WD)
- ++ ns ns
Work-life balance (WLB) --- ns ns +++
Number of + and – signs represent the relative strength of the significant relationship
between variables based on the standardized coefficients and critical ratios (e.g., ++ would
be stronger than +); ns stands for “nonsignificant.”
Work-to-nonwork conflict (WNWC in diagram) was associated with all four
contexts of ICT use with a strong positive association with work-related ICT use on
nonwork days (Wk_NWD) (λ=.35, p<.001). This was the (in)famous “bringing work home
via ICT means” leading to work matters creating conflict in a nonwork setting. This finding
was of no surprise, but it confirmed that when it comes to ICT use affecting work-to-
nonwork conflict, the primary factor is the work-related ICT use in nonwork settings. It was
interesting to note the negative association between nonwork-related ICT use on work days
(NWk_WD) and work-to-nonwork conflict (λ=-.12, p=.009). It could be that by attending to
some nonwork-related matters at work, individuals can ease up some of the pressures of not
being able to provide sufficient time and attention to nonwork activities due to heavy work
commitments, thus reflected as a reduction in work-to-nonwork conflict.

148
One of the interviewees, an instructor in a Canadian university, who was also a
graduate student, provided a detailed account of cross-domain ICT use, which helps to
explain some of the findings above.
I work about 10 hours on average a day and two to three hours for preparation
and commute. If you sleep 7 hours, then you are left with about 4 hours for
everything nonwork which includes family, friends, sports, etc., etc. So, if you
use this time to work-related activities it is felt as a big intrusion into the
nonwork life. But on the other hand, if you use 15 minutes from the 10 long
work hours to sort out a family-related matter, it is hardly felt. I think it also
makes you more time efficient as you will anyway fulfill your work tasks for the
day irrespective of those 15 minutes. I strongly believe those would have gone
against the nick-knacks of idle timeslots during the workday.
According to this individual‟s experience and self-justification, the adverse impact
of work-to-nonwork conflict from ICT use far exceeds the adverse effects of nonwork-to-
work conflict.
Nonwork-related ICT use in a work setting (NWk_WD) showed a strong positive
association with nonwork-to-work conflict (λ=.27, p<.001) suggesting that any distraction
from nonwork domain via ICT means could in fact lead to conflict with time and energy
demanded to perform work-related activities. Nonwork-related ICT use in nonwork days
(NWk_NWD) was negatively associated with work-to-nonwork conflict (λ=-.13, p=.007)
and nonwork-to-work conflict (λ=-.15, p=.004). It could be that, the ability to deal with
nonwork matters during nonwork time eliminates the need to bring such tasks to work (thus
reducing nonwork-to-work conflict) and once such nonwork tasks are dealt with, individuals
may be relieved on nagging feeling on unfulfilled nonwork obligations (reducing work-to-
nonwork conflict). On the other hand, it could be representing the situation of individuals
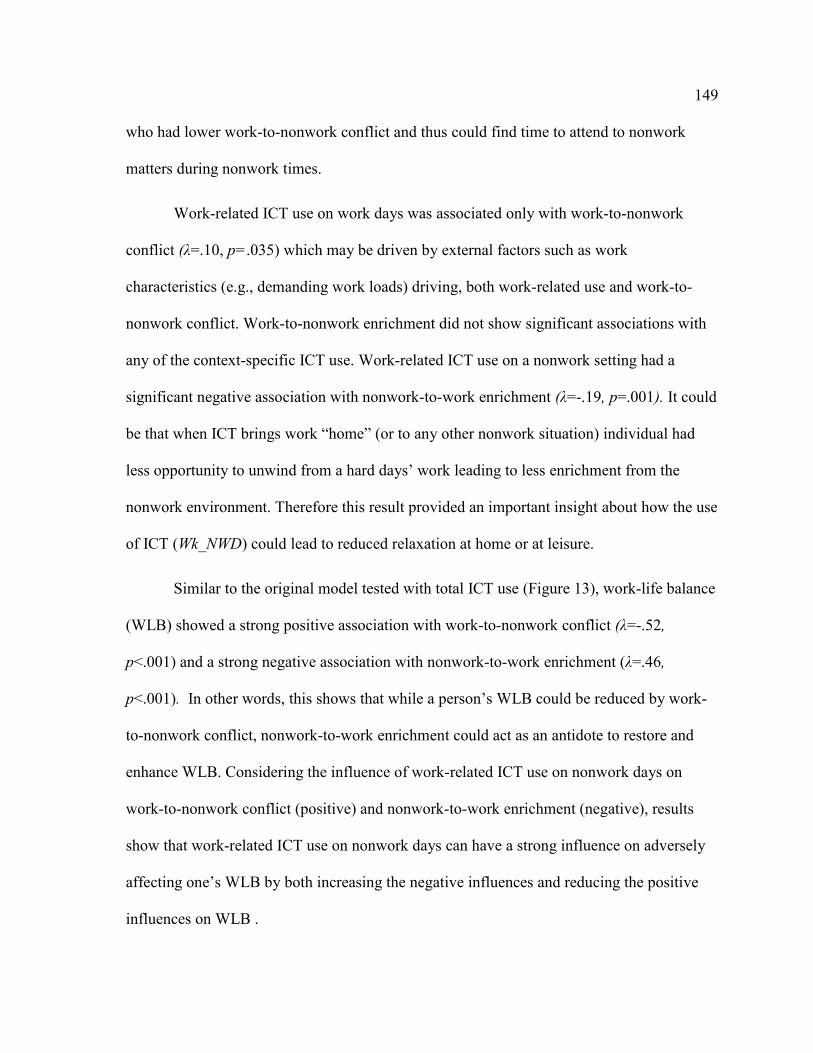
149
who had lower work-to-nonwork conflict and thus could find time to attend to nonwork
matters during nonwork times.
Work-related ICT use on work days was associated only with work-to-nonwork
conflict (λ=.10, p=.035) which may be driven by external factors such as work
characteristics (e.g., demanding work loads) driving, both work-related use and work-to-
nonwork conflict. Work-to-nonwork enrichment did not show significant associations with
any of the context-specific ICT use. Work-related ICT use on a nonwork setting had a
significant negative association with nonwork-to-work enrichment (λ=-.19, p=.001). It could
be that when ICT brings work “home” (or to any other nonwork situation) individual had
less opportunity to unwind from a hard days‟ work leading to less enrichment from the
nonwork environment. Therefore this result provided an important insight about how the use
of ICT (Wk_NWD) could lead to reduced relaxation at home or at leisure.
Similar to the original model tested with total ICT use (Figure 13), work-life balance
(WLB) showed a strong positive association with work-to-nonwork conflict (λ=-.52,
p<.001) and a strong negative association with nonwork-to-work enrichment (λ=.46,
p<.001). In other words, this shows that while a person‟s WLB could be reduced by work-
to-nonwork conflict, nonwork-to-work enrichment could act as an antidote to restore and
enhance WLB. Considering the influence of work-related ICT use on nonwork days on
work-to-nonwork conflict (positive) and nonwork-to-work enrichment (negative), results
show that work-related ICT use on nonwork days can have a strong influence on adversely
affecting one‟s WLB by both increasing the negative influences and reducing the positive
influences on WLB .
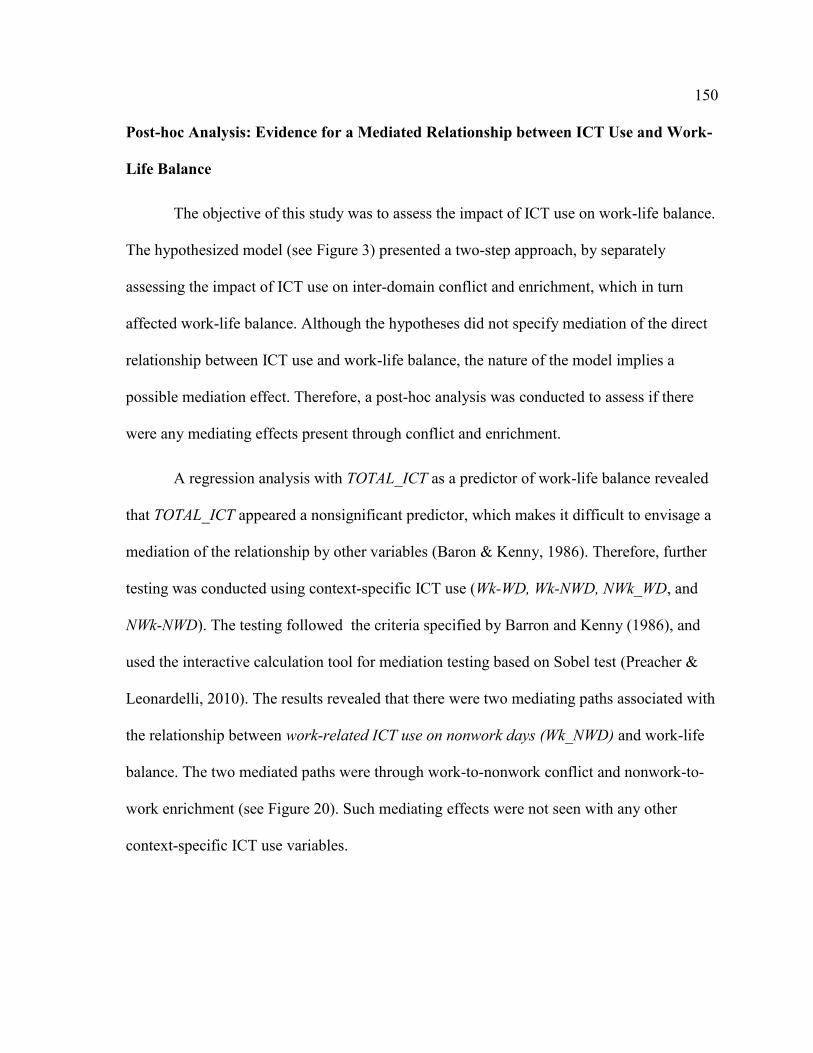
150
Post-hoc Analysis: Evidence for a Mediated Relationship between ICT Use and Work-
Life Balance
The objective of this study was to assess the impact of ICT use on work-life balance.
The hypothesized model (see Figure 3) presented a two-step approach, by separately
assessing the impact of ICT use on inter-domain conflict and enrichment, which in turn
affected work-life balance. Although the hypotheses did not specify mediation of the direct
relationship between ICT use and work-life balance, the nature of the model implies a
possible mediation effect. Therefore, a post-hoc analysis was conducted to assess if there
were any mediating effects present through conflict and enrichment.
A regression analysis with TOTAL_ICT as a predictor of work-life balance revealed
that TOTAL_ICT appeared a nonsignificant predictor, which makes it difficult to envisage a
mediation of the relationship by other variables (Baron & Kenny, 1986). Therefore, further
testing was conducted using context-specific ICT use (Wk-WD, Wk-NWD, NWk_WD, and
NWk-NWD). The testing followed the criteria specified by Barron and Kenny (1986), and
used the interactive calculation tool for mediation testing based on Sobel test (Preacher &
Leonardelli, 2010). The results revealed that there were two mediating paths associated with
the relationship between work-related ICT use on nonwork days (Wk_NWD) and work-life
balance. The two mediated paths were through work-to-nonwork conflict and nonwork-to-
work enrichment (see Figure 20). Such mediating effects were not seen with any other
context-specific ICT use variables.

151
Figure 20: Mediation effect of the relationship between work-related ICT use and
WLB
These results solidify the findings from the previous section by clearly
demonstrating the adverse impact on work-life balance by excessive use of work-related
ICT on nonwork days. In other words, excessive work-related ICT use on nonwork settings
aggravate conflict and reduce enrichment, together leading to reduced work-life balance.
Country Differences in ICT use and Work/ Nonwork Interactions
Canada and Sri Lanka were the two countries selected for the study. As mentioned
earlier, these countries showed remarkable differences in economic, technological, and
political climate18
. The study targeted managers and professionals thus in Sri Lanka, the
sample population was primarily from the capital city of Colombo where most of
18 At the time of data collection in 2008 Sri Lanka has been involved in an internal war (a sectarian strife) for
over 25 years. As of May 2009, Sri Lankan government had defeated the separatist group and has reestablished
control over the entire island.
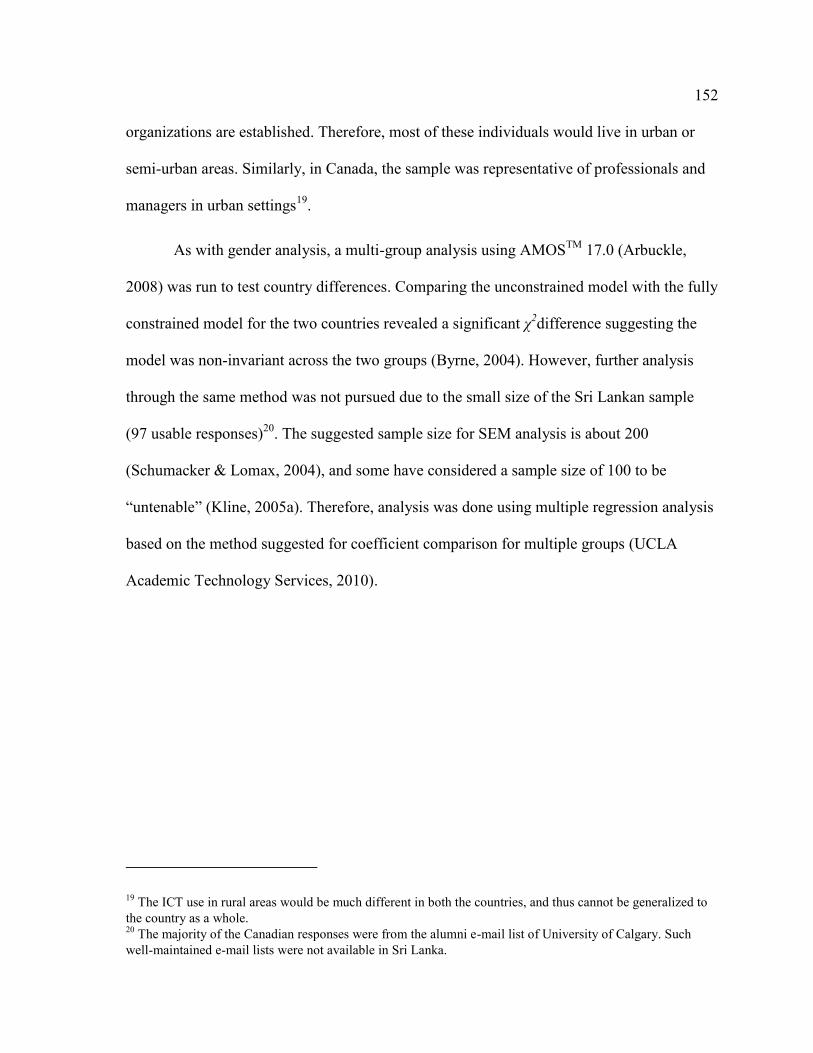
152
organizations are established. Therefore, most of these individuals would live in urban or
semi-urban areas. Similarly, in Canada, the sample was representative of professionals and
managers in urban settings19
.
As with gender analysis, a multi-group analysis using AMOSTM
17.0 (Arbuckle,
2008) was run to test country differences. Comparing the unconstrained model with the fully
constrained model for the two countries revealed a significant χ2difference suggesting the
model was non-invariant across the two groups (Byrne, 2004). However, further analysis
through the same method was not pursued due to the small size of the Sri Lankan sample
(97 usable responses)20
. The suggested sample size for SEM analysis is about 200
(Schumacker & Lomax, 2004), and some have considered a sample size of 100 to be
“untenable” (Kline, 2005a). Therefore, analysis was done using multiple regression analysis
based on the method suggested for coefficient comparison for multiple groups (UCLA
Academic Technology Services, 2010).
19 The ICT use in rural areas would be much different in both the countries, and thus cannot be generalized to
the country as a whole. 20
The majority of the Canadian responses were from the alumni e-mail list of University of Calgary. Such
well-maintained e-mail lists were not available in Sri Lanka.
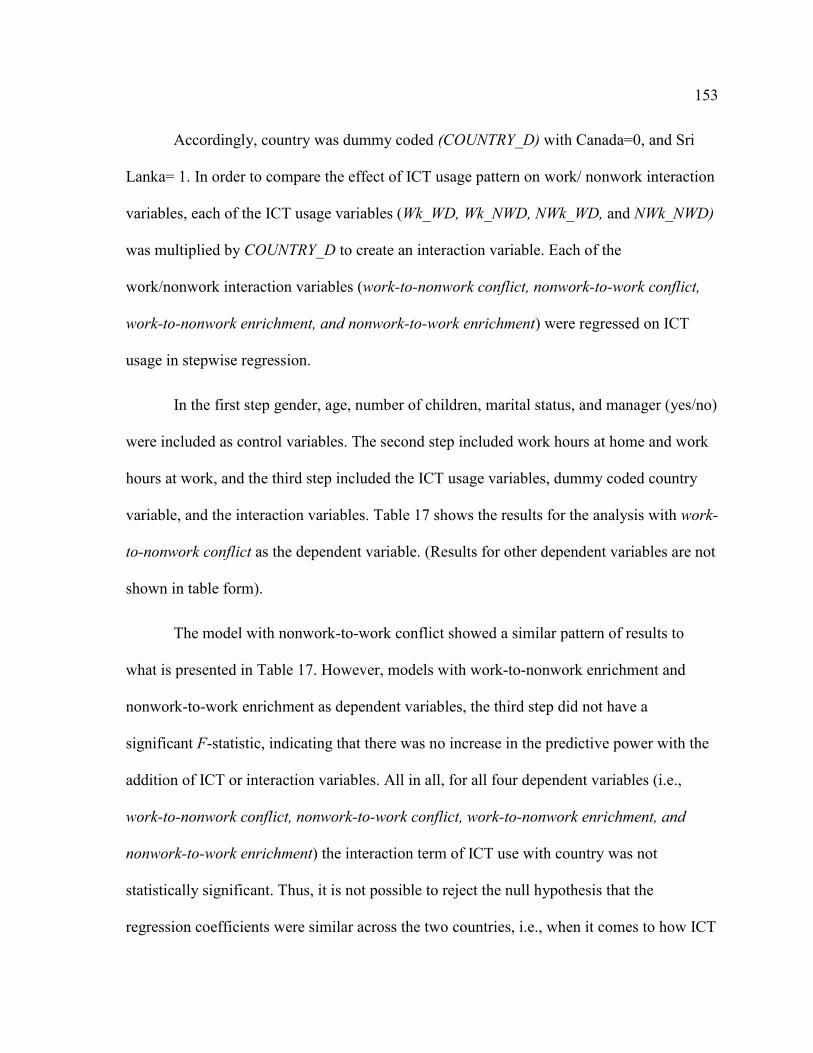
153
Accordingly, country was dummy coded (COUNTRY_D) with Canada=0, and Sri
Lanka= 1. In order to compare the effect of ICT usage pattern on work/ nonwork interaction
variables, each of the ICT usage variables (Wk_WD, Wk_NWD, NWk_WD, and NWk_NWD)
was multiplied by COUNTRY_D to create an interaction variable. Each of the
work/nonwork interaction variables (work-to-nonwork conflict, nonwork-to-work conflict,
work-to-nonwork enrichment, and nonwork-to-work enrichment) were regressed on ICT
usage in stepwise regression.
In the first step gender, age, number of children, marital status, and manager (yes/no)
were included as control variables. The second step included work hours at home and work
hours at work, and the third step included the ICT usage variables, dummy coded country
variable, and the interaction variables. Table 17 shows the results for the analysis with work-
to-nonwork conflict as the dependent variable. (Results for other dependent variables are not
shown in table form).
The model with nonwork-to-work conflict showed a similar pattern of results to
what is presented in Table 17. However, models with work-to-nonwork enrichment and
nonwork-to-work enrichment as dependent variables, the third step did not have a
significant F-statistic, indicating that there was no increase in the predictive power with the
addition of ICT or interaction variables. All in all, for all four dependent variables (i.e.,
work-to-nonwork conflict, nonwork-to-work conflict, work-to-nonwork enrichment, and
nonwork-to-work enrichment) the interaction term of ICT use with country was not
statistically significant. Thus, it is not possible to reject the null hypothesis that the
regression coefficients were similar across the two countries, i.e., when it comes to how ICT
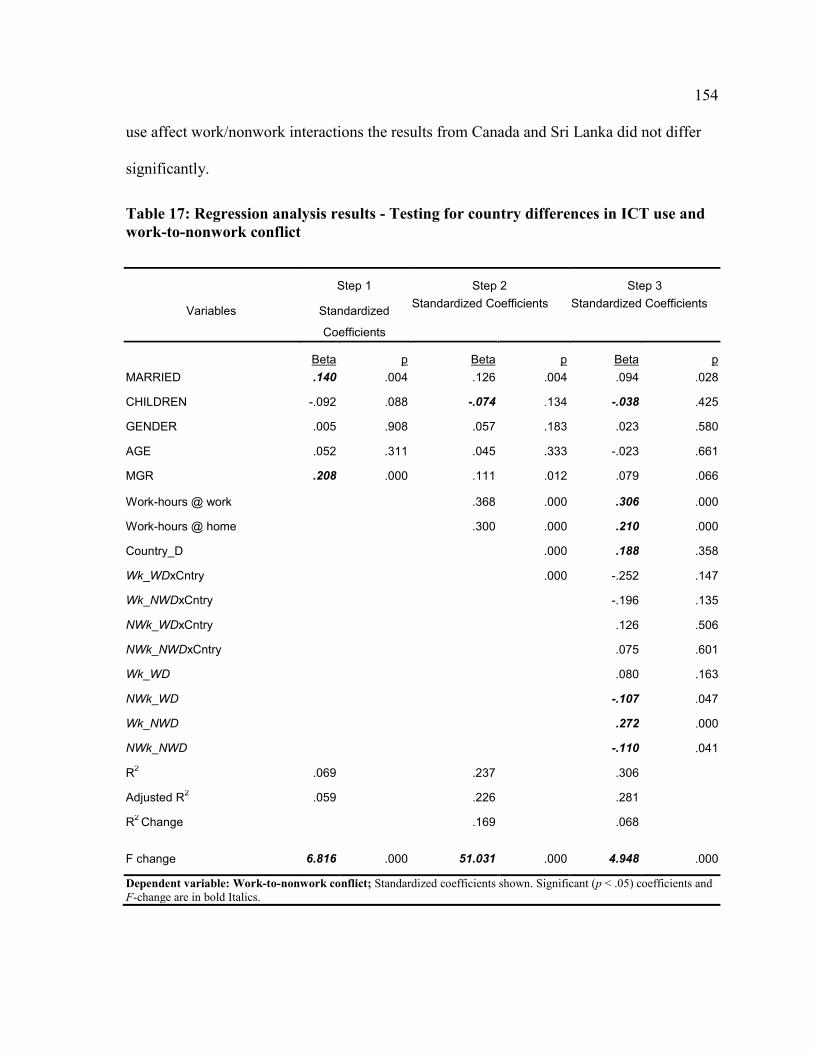
154
use affect work/nonwork interactions the results from Canada and Sri Lanka did not differ
significantly.
Table 17: Regression analysis results - Testing for country differences in ICT use and
work-to-nonwork conflict
Step 1 Step 2 Step 3
Variables Standardized
Coefficients
Standardized Coefficients Standardized Coefficients
Beta p Beta p Beta p
MARRIED .140 .004 .126 .004 .094 .028
CHILDREN -.092 .088 -.074 .134 -.038 .425
GENDER .005 .908 .057 .183 .023 .580
AGE .052 .311 .045 .333 -.023 .661
MGR .208 .000 .111 .012 .079 .066
Work-hours @ work
.368 .000 .306 .000
Work-hours @ home
.300 .000 .210 .000
Country_D
.000 .188 .358
Wk_WDxCntry
.000 -.252 .147
Wk_NWDxCntry
-.196 .135
NWk_WDxCntry
.126 .506
NWk_NWDxCntry
.075 .601
Wk_WD
.080 .163
NWk_WD
-.107 .047
Wk_NWD
.272 .000
NWk_NWD
-.110 .041
R2 .069 .237 .306
Adjusted R2 .059 .226 .281
R2
Change .169 .068
F change 6.816 .000 51.031 .000 4.948 .000
Dependent variable: Work-to-nonwork conflict; Standardized coefficients shown. Significant (p < .05) coefficients and
F-change are in bold Italics.

155
Country Differences in Predicting Work-Life Balance
The structural model examined how work/ nonwork interactions affect work-life
balance. To test whether there were any country-related differences in this regard, a similar
method was followed as described above. Thus, work-life balance was entered as the
dependent variable and the four work/nonwork interaction variables (i.e., work-to-nonwork
conflict, nonwork-to-work conflict, work-to-nonwork enrichment, and nonwork-to-work
enrichment) were entered as independent variables, together with their interaction terms
with the dummy coded country variable (COUNTRY_D). The results are shown in Table 18.
The results show that only the interaction between country and work-to-nonwork
conflict was significant, suggesting that the regression coefficient for work-to-nonwork
conflict leading to work-life balance was significantly different between Canada and Sri
Lanka. The difference in slope was .302 (the unstandardized regression coefficient of the
interaction term W→NWC xCountry). This represents the difference in slopes between the
reference group value (i.e., Canada, coded zero) of -.522 and the slope for Sri Lanka. Thus,
the results reveal that for the Canadian managers and professionals, the relationship between
work-to-nonwork conflict and work-life balance was much stronger than that for the Sri
Lankan counterparts. There was no significant country differences between other work/
nonwork interaction variables and work-life balance.

156
Table 18: Regression analysis results - Testing for country differences in the
relationship between work-life balance and work/ nonwork interactions
Variables Step 1 Step 2
B Beta p B Beta p
MARRIED .006 .002 .963 .112 .044 .233
CHILDREN .019 .022 .684 -.023 -.027 .512
GENDER -.203 -.096 .043 -.308 -.146 .000
AGE -.004 -.037 .487 -.005 -.047 .269
MGR -.161 -.071 .139 .055 .024 .509
W→NWC -.522 -.596 .000
NW→WC -.024 -.021 .626
W→NWE .078 .083 .047
NW→WE .271 .295 .000
W→NWC xCountry .302 .452 .001
NW→WC xCountry -.074 -.089 .461
W→NWE xCountry .073 .126 .387
NW→WE xCountry -.031 -.063 .709
Country_D -1.302 -.496 .034
R2 .015 .473
Adjusted R2 .004 .457
R2 Change
.458
F change 1.401 .222
44.395 .000
Regression analyses in PASW® (SPSS, 2009). Dependent variables - Work-life balance; Standardized coefficients shown. Significant (p < .05) coefficients and F-change are in bold Italics.

157
Post-hoc Analysis Related to Country Differences
Comparing the data from the two countries revealed that the sample from Sri Lanka
represented a younger age group (mean age =33.1, s.d.= 5.2) compared to that of Canada
(mean age=43.8, s.d.=9.2). The maximum age for the Sri Lankan sample was 49 years
compared to 65 years in the Canadian sample, and 30 percent of the Canadian sample was
over 49 years. Therefore, it was important to assess if there was any bias created by the age
differences, especially considering that the main analyses had revealed more similarities
than differences in the assessed relationships across the two countries21
.
To eliminate the impact of age differences in the two countries, a post-hoc analysis
was conducted by selecting participants only up to age 49 from both the countries. The
regression analyses shown in Table 17 and Table 18 were repeated for the truncated sample
with 277 from Canada and 104 from Sri Lanka.
The results were very similar to those reported for the full sample. When considering
the impact of ICT use on work/ nonwork relationships, the moderation effect of country was
still nonsignificant for all four work/nonwork relationships, namely, work-to-nonwork
conflict, nonwork-to-work conflict, work-to-nonwork enrichment, and nonwork-to-work
enrichment, similar to the results seen in Table 17. Thus the results suggest that even within
the same age group individuals, the country difference is still nonexistent in the influence of
ICT on work/nonwork relationships.
21 I thank Dr. Julie Rowney for raising this question in the dissertation defense.
158
Next, using the truncated data set, a comparable analysis was run to assess the
impact of work/nonwork relationships on work-life balance. The results followed the same
pattern seen in Table 18, where the moderation effect of COUNTRY was seen only in the
relationship between work-to-nonwork conflict and work-life balance. Therefore, it appears
that the results hold steady irrespective of the age group of the sample involved, and results
from Tables 17 and 18 are in fact indicative of (lack of) country differences.

159
CHAPTER 10 – MANAGING ICT AT THE WORK/ NONWORK BORDER
So far results have indicated that ICT use, especially cross-domain, could have a
negative impact on work-to-nonwork conflict and nonwork-to-work conflict, which in turn
could adversely affect work-life balance. One key question arising from these analyses was
how individuals managed the influence of ICT on their lives. Analyzing the interview data
for common themes and threads provided explanations and possible answers to how this
question.
Kreiner, Hollensbe, and Sheep (2009) assessed boundary management tactics of
individuals using a sample of Episcopal priests. While the authors acknowledged the
uniqueness of their sample, they argued that the findings were transferable to other settings.
They identified four categories of boundary work tactics - behavioural, temporal, physical,
and communicative - with technology leverage as a subcategory in behavioural tactics. The
current study focuses on the boundary management tactics for ICT-driven interactions at
work/ nonwork border of managers and professionals. One can clearly see some similarities
and overlapping of themes in the management tactics between this study and Kreiner et al.'s
(2009) findings. Thus, although emanating from completely different settings, the
relatedness of the findings discussed below, not only complemented each other, but also
provided support for the reliability and validity of the results.

160
Tactics for Managing ICT Influence at the Work/ Nonwork Border
ICT as a Tool in Balancing Work and Life
Many interview participants attended to work-related matters during nonwork hours
and locations, be it working on the computer, answering a cell phone, checking e-mail or
Blackberry®, thus extending work hours into the nonwork domain. Participants pointed out
that although they heard complaints about such use, especially from family, it was ICT that
allowed them to be with family, and not physically at work. Some justified the use of ICT as
a means to balance the conflicting demands from work and nonwork. A manager in a
telecommunication company commented,
Because of our work assignments, my wife and I live in different locations.
So if I start using my laptop when I am with her, then she will definitely
complain and grumble. But on the other hand, technology enables me to be
with her and work at the same time. And the fact that I have the mobile
phone and I can talk to her all the time and she can have access to me
anytime is crucial. Without that our lives would have been very difficult.
Most participants described the impact of the technologies without ascribing any
negative effects even when discussing the ICT intrusion in nonwork hours. They were rather
matter-of-fact about the technologies, describing how they used the devices to accomplish
their job duties. There was no hostility but a sense of appreciation. Also, the participants
alluded to the fact that there might be temporary shifts to the point where they allowed
intrusions at the work/ nonwork border, supporting the fit perspective of work-life balance
(Greenhaus & Allen, 2011). For example, a project manager commented;
If you are in the middle of an important project your might get a call saying
that a report has been e-mailed to you and some feedback is required
urgently. So you would just log in to your e-mails even late at night and see
161
what can be done before you start work next day. It tends to reduce the stress
for the next day. But you try not to do so everyday.
Most participants had a positive outlook about the technology and were thankful
about the flexibility offered by these devices. However, not all were in favour of
technology-enabled blurred-boundaries phenomena. Some commented about the invasion of
privacy and the tendency of the work life to creep into family life with the 24/7
accessibility:
I feel as if I am trapped sometimes and I can‟t get away and have some peace
because of the cell phone. Yes, I can switch it off, but then, there are
situations where you need to have it on.
Symbolic and Actual Separation of Work and Nonwork Domains
Given a choice, many interview participants favoured a thick border between work
and nonwork domains. However, as managers and professionals with high work demands,
they found it difficult to maintain this separation. ICT was seen as a mechanism, or a tool
allowing border permeability and flexibility. In describing the interactivity of the two
domains, participants frequently used terms such as interwoven, overlapping, and
interconnected. Describing the permeability and flexibility facilitated by the ICT cluster in
work and nonwork situations, a participant from Canada commented:
I work a lot from home and it is possible because I have access to systems
through the Internet. This helps me to attend to family matters as and when
required. I think my work and family activities are so interwoven and I am
almost like a butterfly going from flower to flower - I go from chore to chore,
and they could be either family or work- related.

162
Having said that, many individuals used ICT itself to distinguish between the two
domains. They maintained two distinct e-mail addresses for work and nonwork and some
even had separate cellular phone numbers. Some used the Blackberry® exclusively for
work-related matters so that no nonwork intrusion was possible.
Another method mentioned was the symbolic separation of work and nonwork
domains by imposing rules of adherence. Some participants developed a routine of
switching-off ICT devices at specific times (e.g., bedtime till 7 a.m.) or events (e.g., during
dinner or family vacation). Others had mental notions of closing the door behind work as
stated by a manager from the banking sector:
As a rule I don‟t like taking work home and I like to close my work life
behind me at 5.30. But we, corporate financiers cannot have definitive work
time. Work such as meeting people, contacting them through phone and also
checking e-mails, happen on a regular basis. But because of the rule I have
imposed on myself, the use of the notebook, the number crunching work is
minimized.
Subordinate Empowerment as a Tool for Limiting ICT Intrusions
Several participants from service industries such as telecommunications and railways
talked about the need to be available at all times. They also commented about the enhanced
capabilities provided by ICT to remotely attend to some work demands, thus saving the
need for physical presence. In the past, managers would have to leave their families and
return to work locations to attend to extra duties. They were thus grateful they could direct
work from home now. More importantly, it was stressed that practices such as empowering
subordinates and delegation had a substantial impact in managing the ICT influence on
individual lives. A manager who believed in delegation and empowerment highlighted that

163
such practices (which, of course, pushed work down the hierarchy) resulted in fewer work-
related calls and e-mails from subordinates when he was off work premises;
I train [the team] to make decisions and work with minimal supervision. So
they don‟t have to contact me all the time. Even if I am not there, they can
handle most of the tasks. I rarely get calls from them on my mobile phone.
Adopting such method also promoted the use of the full spectrum of the ICT cluster
based on urgency of the need. For example, if the urgency was lower, subordinates would
opt for e-mails rather than a call to the cell phone. As commented by some individuals,
society has become used to instantaneous connectivity and sometimes disregarded less
intrusive means of communication even in non-critical situations.
Limiting Accessibility of External Parties via ICT
Many individuals were indifferent to being contacted by any ICT means and listed
several contacts on their business card (e.g., general telephone number, direct telephone
number, cellular phone number, fax, e-mail, web page, etc.). However, many others were
careful in not giving out the cellular phone number suggesting it was only available to very
important contacts. The following comment by a banker speaks for many others:
I don‟t put the mobile number on my business card. I only give it to people
who I believe would need to contact me urgently and I tell them to call me
only when it is absolutely necessary.
Even when it was a work requirement to be on call during nonwork hours, some
participants indicated they have certain time slots of non-availability for work purposes. In
other words, they established rules with the external world (e.g., work colleagues) limiting
164
access to incoming communication via ICT. As indicated by some participants, this was not
an easy norm to establish, especially if the industry culture supported instantaneous
communication; however, it remained a possibility through consistent application in
practice.
Saying “No” to Use of ICT Devices
Some managers and professionals opted out certain technologies even when there was
peer pressure to be part of the user group or it was a 'privilege' available to them:
I don‟t have a Blackberry®. Although I could request one from the company
I am not doing it because I don‟t want the e-mails to follow me all over. I
have seen some of my colleagues clicking on it the whole day long. I don‟t
know how long I can postpone the decision to get one before the company
insist that I do.
It is interesting to note that some non-adopters of the Blackberry® based their decision
purely on perceptions and observations of others. There were others who had previous
experience with the device, but decided against its use in the current job. For example one
person commented, “I am the only one in my division without a Blackberry®. I think I can
work without one in this job,” and another one added, “I purposely got rid of my
Blackberry® because I was too connected and becoming obsessive about it.”
Whether based on experience or perception, this purposeful opting out of the use of
technology was mainly related to Blackberry® use and not to other ICT components.
165
Learning to Balance It All - Knowing that ICT Can be Switched Off
While some individuals had rules about restricted times for ICT use, many others
adopted a fairly flexible control strategy. The concept is well captured by the comment
made by a professor/ consultant:
I probably work more since I have an office at home. My wife takes the
laptop to bed sometimes as the home is wireless. However, in my case, I
don‟t think technology interferes too much with my life. I think we have a
pretty good handle on it. For example, if we want to go for a movie, we just
switch off the computer and cell phone and just go.
However, not all respondents had this luxury. For example if they were employed in a
service-based industry (e.g., telecommunications) or in a technical expert capacity, they
might be required to be on call for situations such as systems failures. The difference was
also evident based on the career stage of the individual; for example if they were in the early
stages of their career, they gave higher priority to work and allowed work-related ICT
intrusions, even when they found it disruptive in the nonwork domain. Thus, the individual
specificity defining their own work-life balance was evident in their tactics of managing
ICT intrusions.
To summarize, in line with previous studies (e.g., Frone et al., 1992b) participants
broadly accepted that work/ nonwork border was asymmetrically permeable with more work
to nonwork spillover than the reverse. ICT cluster assisted in these border crossings (Clark,
2000) allowing more work to seep into nonwork domain rather than the reverse direction.
While most interviewees viewed ICT as a useful tool in managing work life balance, few
preferred to stress its negative aspects. Many shared mixed feelings about the usefulness of
ICT, suggesting that ICT was empowering as well as enslaving. This group in particular

166
used creative means to manage work-related ICT intrusion as they found the technology
helpful as well as disruptive at the same time. Individuals adopted different measures
ranging from shutting down devices to being available 24/7 by choice. It would seem that
the same managerial ability to regulate pace and intensity of work also provided skills for
regulating the intrusiveness of ICT. Each of the tactics adopted by these individuals could
be identified with one of the four categories (i.e., behavioural, temporal, physical, and
communicative) by Kreiner et al. (2009), thus suggesting the reliability and validity of the
results.
167
CHAPTER 11 – DISCUSSION AND CONCLUSION
The primary objective of this study was to understand how managers and
professionals perceived the impact of use of ICT devices on their work-life balance. The
selected participants, managers and professionals, had comparatively more discretion on
how, when, and where they performed work-related activities. Thus they were good
candidates for a study of ICT use, especially when trying to fulfill demands in today's 24/7
work culture. To get to the thrust of the issue, recall that this study attempted to answer four
research questions: First, what factors drive individual ICT use and how do individuals use
the ICT cluster in their daily activities? Second, how do individuals perceive the impact of
ICT usage on their work-life balance? Third how do individuals manage the impact of ICT
cluster on their work-life balance? Fourth, are the results generalizable beyond the
developed world? This chapter summarizes the study findings in relation to the primary
research questions outlined above. This chapter also highlights the research contributions
and practical applications of this study, while addressing some of its limitations. The chapter
is wrapped up with concluding remarks and future research directions.
Drivers of ICT Use
When it comes to drivers of ICT use, the study revealed the need to consider the
context of use, i.e., work-related or nonwork-related, and whether the use occurred in a work
or nonwork setting. On a typical work day, 62 percent of an individual's ICT cluster usage
was towards work-related purposes (Wk_WD); on nonwork days, 56 percent of the ICT use
was for nonwork-related purposes (NWk_NWD). Thus, cross-domain use in each case was

168
significant, with 38 percent nonwork use on a work day (Wk_NWD) and 44 percent work
use on a nonwork day (NWk_WD). Therefore, each of these categories formed a significant
portion of the total ICT use of an individual.
The study found that drivers of ICT use changed with context. For example, while
rational factors such as perceived usefulness of ICT and work demands were important in
predicting work-related ICT use on a work setting, they lost importance to emotional factors
such as impulsivity when predicting nonwork-related use in a work setting. These findings
give rise to an important area of research on predicting the use of ICT systems and devices.
The literature presents several well established theories and models such as the technology
acceptance model (TAM) and its derivatives (Davis, 1989; Davis et al., 1989; Venkatesh &
Davis, 2000), the unified theory of acceptance and use of technology (UTAUT) (Venkatesh
et al., 2003), and technology-task fit (TTF) (Goodhue & Thompson, 1995). However, these
theories and models focus on work-related use of ICT in work settings, and little
consideration has been given to factors that could contribute to cross-domain or nonwork
use of ICT. Therefore, these theories and models need reconsideration especially in today‟s
context of boundary spanning, interconnected, and multi-functional use of ICT devices. It
could be that overarching universal models of ICT use might not be applicable in predicting
context-specific ICT use.
Based on the study findings, it is evident that we as researchers can no longer focus
only on work-related use of IT. Therefore, future research should evaluate the adequacy of
existing models of predicting ICT use, especially for nonwork use and cross-domain use.

169
Further, revised models should also incorporate emotional and personality factors such as
impulsivity, habit and conscientiousness.
Differentiated Use of ICT
Participants in the study showed differentiated uses of ICT for work and nonwork
purposes. In work-related usage, e-mail surpassed all technologies. However, for nonwork-
related matters both Internet and cell phone scored highest. It could be that voice
communication via cell phones provided a more personal touch when it comes to nonwork
matters and the Internet could be a tool in many day to day activities (e.g., news, on-line
banking, shopping, finding directions, and networking). Of course, now the Internet adds to
voice communication via video chatting options such as Skype®22
which could also add to
its preference for nonwork purposes.
The results showed similar ICT usage patterns for both males and females and across
Canada and Sri Lanka. Considering the study sample of managers and professionals, one
could assume that work role responsibilities and tasks of these individuals could be similar
irrespective of gender or country of work. The more intriguing observation was that even
nonwork usage patterns remained similar across gender and country. It could be that the
level of education, standard of living, and similar work-related uses also shaped individuals‟
nonwork ICT use. Therefore, the similarity of usage patterns might not hold across the
general population of the two countries. Thus, rather than generalizing on overall
22 These video chat media are now used in work-related matters as well.

170
population, it could be cautiously argued that managers and professionals would have
similar patterns of usage of technology across genders and geography.
Although the functional use of these types of technologies might be unchanged,
device use could have changed due to advancements in portable technology since data were
collected in 2008. For example, the popularity of smart phones (e.g., iPhone®) with
capabilities of voice, text, e-mail, Internet, and thousands of other applications have
increased tremendously over the last three years (Whitney, 2010). Devices are becoming
more user-friendly and portable (e.g., iPhone® and iPad®) and their use is more pronounced
in all areas of life: work, nonwork, and across domains. Therefore it is possible, while the
functional usage patterns (e.g., e-mail, Internet access, and voice) could continue into the
future, the devices‟ specific usage patterns (e.g., cell phone, laptop computer, and desktop
computers) could have substantial changes in the future, for example, with multiple devices
being replaced by a single handheld device. When studies focus on a rapidly evolving
industry, findings may become as obsolete as the old technologies upon which they were
based.
ICT Use and Work/ Nonwork Interactions
The study‟s second research question attempted to unveil how employees‟ ICT use
impacted their work-life interactions. As hypothesized, the total amount of ICT used by an
individual was significantly related to work-to-nonwork conflict, nonwork-to-work conflict,
and work-to-nonwork enrichment. These in turn affected one‟s work-life balance. However,
total ICT use was not significantly related to nonwork-to-work enrichment.
171
The survey results revealed the importance of the context of ICT use. Post hoc
analysis evaluated the above relationships with total ICT use subdivided into context
specific ICT use (i.e., work-related on a work day: Wk_WD, work-related on a nonwork day:
Wk_NWD, nonwork-related on a work day: NWk_WD, and nonwork-related on a nonwork
day: NWk_NWD). This revealed, perhaps not surprisingly, that the predominant contributors
of work-to-nonwork conflict and nonwork-to-work conflict were cross-domain ICT uses
(i.e., Wk_NWD and NWk_WD respectively) rather than within domain uses (i.e., Wk_WD
and NWk_NWD).
A noteworthy negative relationship was found between nonwork-related ICT use on
work day and work-to-nonwork conflict, suggesting that using ICT to attend to nonwork
matters while at work might reduce work-to-nonwork conflict. This of course makes
intuitive sense especially considering the population of managers and professionals in study.
These individuals usually work long hours and may have to attend to work-related matters
while away from work. Therefore, fulfilling nonwork tasks while at work (as widely seen
from the interview data) might compensate for the time demanded by work during nonwork
hours. Put it simply, it may be healthy for managers to tend to some personal matters during
working hours.
Some other interesting findings include a negative association between work-related
ICT use on a nonwork day, and nonwork-to-work enrichment. Nonwork to work enrichment
is where resources in the nonwork domain improve the quality of life on the work domain
(Maertz Jr. & Boyar, 2011) which also includes the ability to unwind and relax with family
and friends, or partake of leisure activities. Perhaps the constant interruption from the work

172
domain via ICT (such as phone calls, buzzing Blackberrys®, and continuous flow of e-
mails) could make it difficult for individuals to relax and unwind in the nonwork
environment.
Work/ Nonwork Interactions and Work-Life Balance
Work/ Nonwork Conflict and Work-Life Balance
An important study objective was to understand the implications of the above
findings to work-life balance. The hypothesized model explained 54 percent of the variance
in work-life balance. As predicted, results revealed that work-to-nonwork conflict led to
reduction in work-life balance. However, there was no significant association between
nonwork-to-work conflict and work-life balance. Similar effects have been reported in
previous studies in relation to the asymmetric permeability of work/ nonwork border (Frone
et al., 1992a; Kinnunen & Mauno, 1998). For example, a recent meta analysis showed that
life satisfaction was more strongly related to work to family interference compared to family
to work interference (Michel et al., 2009). Family boundaries are known to be more
permeable and work-family conflict is reported to be more common than family-work
conflict (Kinnunen & Mauno, 1998). Thus, when it comes to adversely affecting the balance
in between work and nonwork lives, work domain intrusions appears to have a strong
impact on individuals. It could be that the informal setting of the nonwork domain (e.g.,
family or leisure) makes it more vulnerable for work to intrude into nonwork domain, while
the more formal and structured setting of the work domain makes it difficult for nonwork to
intrude in to work.
173
On the other hand, individuals might be more willing to accept nonwork
infringements into work domain, treating these less like a burden than working creeping into
nonwork life. Some interviewees suggested that they didn't feel anything wrong about
having to attend to nonwork related matters while at work. Allowing a few private life
distractions was small compensation for gruelling work demands and they felt entitled to
take on such nonwork tasks during work hours. This suggests that one of the best ways to
improve one's work-life balance is to selectively allow nonwork to work intrusions, while
also taking steps to reduce unnecessary work done on private time.
Work/ Nonwork Enrichment and Work-Life Balance
On the enrichment side, it was nonwork-to-work enrichment that showed a strong
positive relationship with work life balance, whereas work-to-nonwork enrichment did not
appear as a significant contributor towards work-life balance. It seems that transfer of
positive attributes from the nonwork to work domain can improve one's work-life balance,
for example, through unwinding from a stressful workday at home, with family, or
experiencing a leisure activity.
The findings provided a seemingly simple view of how work/nonwork interactions
affect work life balance. If one has high work-to-nonwork conflict, there appears to be a
greater likelihood of poor work-life balance. However, positive spillovers from the nonwork
to work domain (nonwork-to-work enrichment) could create a greater sense of work-life
balance (or even counteract the adverse effects of work-to-nonwork conflict).

174
This simple relationship brings to light an important dilemma related to employee
work-life balance. Based on these findings, if an individual is experiencing high work-to-
nonwork conflict, she could be experiencing lower levels of work-life balance. One way of
counteracting this situation would be through nonwork-to-work enrichment, by allowing
oneself to have more relaxing time with family, friends, and leisure activities, in other
words, finding time to unwind from work and be rejuvenated. The ability to unwind and
detach from work is an important part of life balance. For example, studies have shown that
low psychological detachment from work during the evening predicted negative activation
and fatigue in the next day (Sonnentag, Binnewies, & Mojza, 2008).
However, the very definition of work-to-nonwork conflict states that the main
reason for the person to experience conflict is lack of time and energy to spend on nonwork
activities due to the time and energy spent on work-related activities (Greenhaus & Beutell,
1985). Thus, it is possible for an individual to slip into a vicious cycle of losing her work-
life balance by not having time and energy to revamp the life balance due to high levels of
work-to-nonwork conflict. In other words, the results suggest that managing one's work-to-
nonwork conflict could be the best way for a person to manage her work-life balance.
Also of importance is the fact that work-life balance can be very individual specific
and relate to an individual's values at a given point in time in one's life stage. Interview
participants alluded to this specificity many times. Some suggested that they prioritized
"work" during the early parts of their career by working long hours, and being connected to
work all the time. However, when they advanced in the corporate ladder and when family
demands expanded, the focus shifted more towards family and overall life expectations

175
beyond “just work.” Thus, the same individual found their fulcrum of the work-life balance
beam shifting through their life stages. In addition, others alluded to short-term changes in
the balance point due to temporary shifts in work demands (e.g., launch of a new project) or
nonwork demands (e.g., birth of a new baby or illness in the family). In such situations,
these individuals adjusted their point of balance allowing more intrusions across
work/nonwork border to suit the situation at hand.
Are Managers a Different Breed?
Canada and Sri Lanka can be remarkably different in consideration to climate, socio
economic development, per capita GDP, ICT penetration, culture, etc. However, when it
comes to ICT usage and its implications there were few differences between the two
countries. This could be due to the sample population used in the study, i.e., professionals
and managers from both countries.
The results suggest that the pattern of ICT usage was almost identical across the two
countries in both work and nonwork context. A fine-grain analysis of the types of
technologies also revealed that usage patterns were mostly similar except for a few cases.
For example, work-related use of Internet on work days was higher for Sri Lankans and
nonwork-related use of Internet on nonwork days was higher for Canadians. In spite of the
so called digital divide between the two countries, the study respondents appeared to be
using technology with similar frequency and intensity. Further, when the influence of ICT
use on work/ nonwork interactions was considered the results did not reveal any country-
related differences.
176
Could Similarities across Countries be Due to the Nature of the Job? As managers
and professionals, these individuals‟ jobs are characterized by autonomy, high work
demands, work flexibility, and long work hours, which are usually not compensated by
overtime payments. Flexibility, autonomy, and high work demands make them ideal
candidates to make use of the capabilities of ICT to enhance productivity. On the other
hand, because of their prominent role, they might be required by organizations or by the job
itself to be available (through e-mail, cell phone, or carry a Blackberry®). An ANOVA of
the above variables across the two countries revealed no significant mean differences for
work autonomy and work hours, while small, but significant differences were seen for work
flexibility and work demands. Therefore, it could be the similarities of the work-related role
as managers and professionals that drive their usage of ICT, irrespective of country
differences.
Comparison of the Value System: At first glance, Canada appears culturally very
different from Sri Lanka. Based on Hofstede‟s cultural dimensions, Canadians rank high on
individualism (vs. collectivism). Although Sri Lankan data is not available for comparison,
India, a close relative of Sri Lanka, ranks very low in individualism compared to other
cultural dimensions (ITIM, 2003). A study on social values reported that in the Sri Lankan
context, socio economic status, education, fluency in English, and overseas exposure are all
negatively related with collectivism, and that urban residence is positively related to
individualism (Freeman, 1997). Considering the Sri Lankan sample of managers and
professionals in the study, (who were urban or suburban residents, fluent in English with
overseas exposure, and had high socio economic status) it is possible that this group of

177
individuals did not represent the general population of Sri Lanka, but their cultural values
would be more attuned with those of a western culture such as Canada. This could be
another reason for the lack of country-related differences in the ICT usage patterns, as well
as the impact of such usage on work/ nonwork interactions.
Work/ Nonwork Interactions Leading to Work-Life Balance: The study found
significant country differences in work-life balance in relation to work/ nonwork
interactions. The negative association between work-to-nonwork conflict and work-life
balance was stronger for Canadians compared to Sri Lankan respondents. A mean
comparison of work-life balance revealed no gender differences for the total sample (i.e.,
Canadians and Sri Lankans considered together). This gender neutrality in work-life balance
was also observed with the Sri Lankan sample alone. However, Canadian men reported
higher work-life balance compared to Canadian women (5.2 vs. 5.0, p=.029). When it
comes to work-to-nonwork conflict, gender differences were observed with the Sri Lankan
sample where Sri Lankan men reported higher values than Sri Lankan women (3.9 vs. 3.3,
p=.032); while there was no significant gender difference for Canadians.
One possible explanation country differences in the relationship between work-to-
nonwork conflict on work-life balance could be the higher availability of informal support
systems in Sri Lanka. For many working parents, there is some support available through
the extended family of grandparents to take care of children, which would reduce the burden
of work-to-nonwork conflict adversely affecting an individual's work life balance. Further,
in Sri Lanka, where there is relatively inexpensive unskilled labour, it is possible to have a
domestic helper (in most instances a living-in person) who aids in household and child-care
178
activities. Managers and professionals who in general are on a higher earning bracket may
be in a position to afford such help, which could improve work-life balance even with
conflicting demands from work-to-nonwork. In some cases, Sri Lankan managers (at senior
levels) also have the luxury of a personal chauffer who attends to some of the nonwork
chores of managers such as picking up children from school, as described by this manager:
I am married with three sons, the eldest is 12, and the second is 9 years. Both of
them have tight schedule, various sports activities and music and elocution etc. I
cannot attend to them personally and most of the time they are taken by my
driver.
This support network, especially available to deal with family demands might be a
reason for the less strong impact of work-to-nonwork conflict on work-life balance among
Sri Lankan participants compared to the Canadian group.
In summary, the similarities observed across the two countries, and across genders
appear to be more attributable to the sample used in the study, managers and professionals.
The similarities of managerial and professional work are strong, and these similarities
probably reduce national context effects. Thus, it might be wrong to generalize these
findings to the general populations of either country, as non-managerial sample might yield
different results.
179
Limitations of the Study
This section addresses limitations of this research and discusses measures adopted to
minimize adverse impacts on the results of the study.
Use of Self-Reported Cross-Sectional Data: This could lead to problems such as
common method bias as well as difficulty to establish causality. However, this study had
several built-in mechanisms to combat the issue. First, the survey data were complemented
by 36 interviews spanning across the two countries of interest. The interviews acted as an
additional source of data which provided and alternative view to triangulate research
findings and better explain findings from the survey.
Second, several strategies were incorporated in the survey itself to minimize bias due
to a single respondent (this is discussed in detail in Chapter 4, “handling response bias”).
The methods adopted included a) different item formats (e.g., Likert type scales and
ranking); b) different response formats (e.g., frequency-based measures and perception-
measures); and c) reverse coding of items.
Third, statistical analysis was used to assess the impact of common method bias in
data. Comprehensive analysis revealed that no significant common method bias was present,
despite the use of single respondent.
Limitations in the Sample: The target population was managers and professionals
from Canada and Sri Lanka. The study used a convenience sampling method. Most
Canadian respondents were alumni of the University of Calgary, while Sri Lankan
180
respondents were from personal contacts and snowballing throughout the capital city of
Colombo. However, participants came from over 15 different industries and all aspects of
organizational divisions leading to a clear representation of different organizations and
divisions in the sample. Considering the target population of managers and professionals
who are users of ICT in their work and nonwork lives, this was considered a fair trade-off
for obtaining a large and valid dataset.
Poor Reliability of “Segmentation” Construct: Segmentation was a key variable
included in the hypothesized model, but later eliminated from the analyses due to poor
reliability. Since segmentation/ integration is an important status in work/nonwork
relationships, it is unfortunate that this study was not in a position to test the hypothesized
relationships. In addition, one could also argue for an alternative model (compared to the
hypothesized model in Figure 3) where segmentation could be a moderator of the
relationship between ICT use and work/nonwork conflict and enrichment constructs23
.
Since the poor reliability of the scale prevented any form of assessment using the scale, this
leaves open an area to be investigated in future research. It may be important to assess these
alternative conceptualizations (both of which could gain support from literature) to ascertain
the best model.
Technology as a Moving Target: The technologies in discussion have shown
tremendous advancements in terms of their features and usability, and new trends in overall
23 I thank Dr. Margaret Shaffer, the external examiner in the thesis defense, for the insight into this alternative
view.

181
ICT use since the time of data collection in 2008 (e.g., more advanced smart phones and the
use of social networking sites). This dissertation provided a snapshot of 2008 and
challenged prior studies, but it must be acknowledged that findings could change quickly as
the portable technologies advance. Hence, full-scale adoption of the results in today‟s
context should be done cautiously.
Inter-Domain Interactions of Nonwork Activities: This study broadly categorized
life into work and nonwork, where nonwork encompassed all aspects of life beyond work
including family, leisure, religion and spirituality, health and fitness, and hobbies. Although
this categorization provides more generalizable results, one must not forget that “family”
still forms an important component of individual lives, especially when they are in a
relationships and more so when they have children. The ubiquity of ICT devices such as
smart phones may create intrusions not only from work to nonwork (and vice-versa), but
also across nonwork activities. This is becoming an important area for discussion in light of
innumerous distractions available through portable media and the fact that individuals have
limited time, energy, and attention (as highlighted in the concepts of “attention economy”
(Davenport & Beck, 2001)) to cater to the vast diversion of distractions (Steel, 2010b).
Thus, we find that some individuals may be checking smart phones at the dinner table, not
for office e-mail, but for the latest Facebook update.
Individuals may find it difficult to resist such temptations, because there are many
enablers fueling such disruptions, such as the functionalities of smart portable devices and
access to features (for example, many service provides allow unlimited access to social
media sites via smart phones), which facilitate immediate gratification (Steel, 2010b). The

182
broad categorization of nonwork did not allow the exploration of the nitty-gritty of such
within-nonwork interactions and interruptions. However, in light of recent advancements in
portable technologies, it is becoming increasingly important to assess how such within-
nonwork interactions affect individual work-life balance. Considering the nature of such
distractions, individual characteristics such as impulsivity might be a key variable in the
final equation, and these ideas are put forward as areas for exploration in future research.
Research Contributions
Clarification of the Concept of Work-Life Balance
The discussion on work-family interface has been alive for many decades (see
Frone, 2003 for a literature review). Over the years, the field has hit several milestones, for
example, when key concepts were more clearly defined (e.g., work-family conflict by
Greenhaus and Beutell, 1985), and when theories explained interactions between the two
domains (e.g., border theory by Clark, 2000 and boundary theory by Ashforth et al., 2000).
Even with such developments, there has been much inconsistency in how key constructs
were defined and measured. For example, consider the operationalization of work-life
balance. While some scholars considered the lack of work-family conflict to be equivalent
to work-life balance (Duxbury and Higgins, 2001), others used the reduction in work-to-
family and family-to-work conflict together with the increase in work-to-family and family-
to-work facilitation as dimensions of work-family balance (Aryee et al., 2005; Frone, 2003).
The latest definition of work-life balance follows a fit perspective, and defines it as “the
extent to which effectiveness and satisfaction in work and family roles are compatible with
183
an individual’s life values at a given point in time” (Greenhaus & Allen, 2011). This
definition does not link work-family balance (more generally work-life balance) directly to
conflict or enrichment domains, but rather a distinct construct from conflict or enrichment.
The present study provides empirical support to the new definition of work-life
balance and recognize it as a unique construct distinct from work/ nonwork conflict and
work/ nonwork enrichment. First, the stable and well-fitting measurement model that
included bidirectional conflict and enrichment measures together with work-life balance
measure provided validation. Second, the structural model showed a significant relationship
between conflict and enrichment constructs and their implications to work-life balance.
Third, the interview data provided evidence for the individual-specificity of work-life
balance, supporting the fit perspective in the new definition. Based on individual
characteristics, such as life stage, individuals would negotiate work/ nonwork boundary
interactions to achieve a comfortable level of balance. The balancing point is not fixed and
would change over time. Of course, some may struggle to find this balancing point.
Considering the current inconsistencies in work-life balance literature, this clarification of
the concept with empirical evidence provides a strong contribution towards advancement of
the theoretical base of work/nonwork literature.
Incorporation of ICT into Work/ Nonwork Interaction Models
Several decades of work-family research have addressed a multitude of factors that
could affect individual work/ nonwork interactions (Aryee, 1992; Aryee et al., 2005; Burke,
1988; Frone et al., 1992a; Karatepe & Bekteshi, 2008; Kinnunen & Mauno, 1998; Li & Tse,
184
1998). Several meta analyses have amalgamated these results (Byron, 2005; Henle &
Blanchard, 2008; Kossek & Ozeki, 1998; Michel et al., 2009). These studies clearly show a
set of factors that were used over and over in predicting work/ nonwork interactions, which
can be broadly categorized into work-related, family-related, and individual-related (e.g.,
Michel et al. 2010). However, little emphasis has been given to the impact of ICT use on
work/ nonwork interactions.
The lack of interest in ICT influence appears somewhat disconnected from the
popular press, where numerous articles discuss possible ICT influences and non academic
surveys conveying opinions about the impact of technology use, especially on work-family
conflict and work-life balance (Kirkpatrick, 2006; Maitland, 2004; McIntyre, 2006;
Rothberg, 2006). It is surprising that more mainstream research has not focused on the direct
impact of ICT use on work/nonwork interaction, especially considering the ubiquitousness
of technology. This study addresses this disconnection between academic literature on
work/nonwork interactions and the “pulse” of the people (as seen by non academic articles)
by incorporating technology use directly into work/nonwork interaction equations, and there
by filling the gap in the academic literature about the direct influence of ICT use on work/
nonwork issues.
This is an important area to be researched and understood especially in work-to-
nonwork conflict, as the majority of work demands are transferred to the nonwork domain
through technology channels such as e-mails, buzzing cell phones and Blackberry®.
Further, as stressed in the study design and findings, it is also important to explore the
reverse direction (i.e., nonwork-to-work conflict), which is important in both organizational
185
and individual context. Therefore, it is recommended that future research addressing work/
nonwork interaction issues give more attention to the role technology can play, building
upon the empirical evidence from this study about the direct influence of ICT use on
work/nonwork interactions.
Clarifying the Implications of ICT Use on Work-Life Balance
The study not only introduced ICT into work/ nonwork interaction models, but also
provided empirical evidence to identify the role of ICT in managing work-life balance
(WLB). In particular, it revealed that work-related ICT use on nonwork days (Wk_NWD)
could play a critical role in adversely affecting one's WLB. The study found that Wk_NWD
ICT use could increase work-to-nonwork conflict and reduce nonwork-to-work enrichment.
Based on the results, these two types of work/nonwork interactions were the key drivers of
WLB, where WLB was negatively associated with work-to-nonwork conflict and positively
associated with nonwork-to-work enrichment. Thus, by influencing these work/nonwork
interaction variables, work-related ICT use on nonwork days could act as a major
contributor towards reducing one‟s WLB.
For ease of understanding, let‟s assume ICT use is the only variable associated with
these work/nonwork interaction variables, and these work/nonwork interaction variables are
the only ones that affect WLB. The findings suggest that if an individual is engaged in
excessive work-related ICT use on nonwork days, this would increase her work-to-nonwork
conflict (e.g., feeling of having insufficient time for nonwork activities), and reduce
nonwork-to-work enrichment (e.g., the ability to unwind and relax from hard day's work
through family engagement or leisure activity). Increasing work-to-nonwork conflict would

186
reduced individual's WLB. In addition, the reduction in nonwork-to-work enrichment would
also reduce the individual's WLB, and these two together would lead to a situation of this
individual losing grip over her WLB as it plummets down with excessive use of work-
related ICT use during nonwork times. In other words, the more a person brings work home
through ICT means, it is more likely that this individual has a low work-life balance. Of
course, in real life, there would be many other variables affecting these relationships.
However, in the light of strong empirical evidence from the study, we can no longer ignore
the adverse implications of work-related ICT use on nonwork days on individual work-life
balance. Thus, it appears that ICT use in some instances could enslave individuals and make
them lose their work-life balance.
Prediction of Technology Usage – Need for Contextual Differentiation
The results indicate the need to rethink some of the established theories and models
of predicting ICT usage. Most existing theories of ICT usage primarily focus on work-
related use and on a single type of technology (in many instances related to computer use).
However, ICT users today experience high levels of digital convergence from a multitude
of devices and functionalities amalgamated in a single hand-held device (e.g., smart phones
bringing together e-mail, Internet, voice, text, GPS, etc.). Further there is considerable ICT
usage beyond the work domain, in the nonwork domain as well as across work/nonwork
domains. Individuals are using the advance capabilities of ICT for more and more
multitasking, and these tasks could be within or across life domains. This study revealed that
different variables had differentiated significance in predicting these context-based uses. For
example, whereas work characteristics were predominant in predicting work-related use

187
during work and nonwork days, they did not have much significance in predicting nonwork-
related ICT use during work days or nonwork use during nonwork days. Further,
impulsivity turned out to be a significant variable in predicting nonwork-related use on work
days, even considering the sample population of managers and professionals.
Therefore, it is recommended that future studies addressing the issues of ICT usage
give due consideration to the context of ICT use and perhaps incorporate variables beyond
those included in the established models of ICT usage (e.g., TAM, UTTAU). These models
need to be upgraded to represent nonwork and cross-domain ICT use and also cater to the
sophistication of the portable ICT gadgets which are important in both work and nonwork
settings. New models need to study how people interact with technologies in a more holistic
way, recognizing that the work/nonwork boundary has blurred and become permeable.
Integration of Border Theory, Boundary Theory, and Work-Life Balance
This research builds on work-family border theory (Clark, 2000) and work-family
boundary theory (Ashforth et al., 2000), which address interactions at the work-family
(nonwork) border. Work-family border theory differs from some of the previous theories of
work-family interaction (e.g., Zedeck & Mosier, 1990) by treating individuals as active
players (rather than passive participants) in shaping the boundary (Clark, 2000). This
research found support for this proposition especially in the interview data where
participants elaborated their boundary-management mechanisms especially in relation to
intrusions from ICT.

188
In boundary theory, integration-segmentation is a continuum and not a dichotomy
(Ashforth et al., 2000. Nippert-Eng, 1996). Although the low reliability of the segmentation
scale used in this study made it difficult to have a direct measurement of this phenomenon,
there was plenty of evidence from qualitative data that individuals adopted different levels
of segmentation/integration across their own work/ nonwork border. This level of
integration was a crucial factor in determining individuals‟ work-life balance. A more
important observation was that individuals acting as proactive agents (Clark, 2000) could
and would change the level of integration across borders (especially via ICT means) to
manage work-life balance at any given time of their life stage.
This study highlights the need to consider work/ nonwork interaction constructs
(including work-life balance) as dynamic perceptions that can vary over time and context,
and even change in the short term based on life events (for example working 24x7 to meet a
project deadline). This ties with the fact that work-life balance is an individual-specific
construct and individuals align their work-life balance equation with their personal values.
Some may even take a long-term perspective of what work-life balance means to them, for
example, by working long hours to build a career now to have to have time for the family
later. Therefore, future research on work-life studies should explore such factors as life
stages, life events, and personality.
Importance of the Two-Country Study
Except for a few studies (e.g., Aryee et al., 2005; Joplin et al., 2007; Spector et al.,
2007) most of the work/ nonwork literature has focused on developed economies. Using
189
data from Canada and Sri Lanka, this study presents a comparative analysis of two countries
in different stages of economic development. However, results did not reveal significant
country differences for most of the key relationships explored in the study. One main reason
could be the sample population of managers and professionals. As discussed in length in the
previous section, it could be that similar work characteristics of the sample eliminated the
country differences that were expected in the analysis. Perhaps it could be the socio
economic status and exposure to the global world that shape these similarities.
The similarities across contexts were an important finding in this dissertation. It is
plausible that wireless ICT devices are agents of global homogenization, and that the
developed/developing country divide is itself becoming a blurred and permeable border,
especially in the contexts of ICT use.
Practical Contributions
As technology use becomes more prevalent in both work and nonwork, the research
related to understanding the use and implication of the use of technology has practical
implications. By examining usage patterns of a group of IC technologies in different
contexts of use, and the impact of such use on work and nonwork interactions, this study
presents insights with significant practical relevance.
Importance of Removing the E-Leash
The thrust of this research address the influence of ICT use on work/ nonwork
interactions. The findings suggest that work-related ICT on nonwork days leads not only to

190
an increase in work-to-nonwork conflict, but also to a reduction in nonwork-to-work
enrichment. Both together could lead to the deterioration of work-life balance of individuals
and thus affect their work-performance as well as general life satisfaction. The negative
relationship between excessive work-related ICT use on nonwork days and nonwork-to-
work enrichment is a factor of concern for employers. This means when individuals
continuously attend to work-related matters on nonwork days, even through ICT means,
they lose the ability to distance themselves from work. Thus, they may not be able to get the
full benefits of the nonwork environment to rejuvenate and be refreshed for another day of
hard work (Sonnentag & Zijlstra, 2006). This vicious cycle of continuous stress from work
domain might ultimately affect individual productivity (Aryee, 1992; Chesley, 2005;
Parasuraman, Greenhaus, & Granrose, 1992). Therefore, employers might in fact benefit
from reducing work-to-nonwork interactions via ICT means for their employees. The results
also showed that lack of organizational support towards nonwork domain tend to increase
individuals‟ work-related ICT use on nonwork days. Thus, it shows that organizational
policies could play a role in managing ICT intrusions from work to nonwork in employee
lives. It is encouraging that some organizations have already adopted policies such as
Blackberry® blackout times (Ottawa Citizen, 2008).
Whether ICT regulation enhances or reduces productivity is, of course an empirical
question and is beyond the scope of this dissertation. Also of importance is the relationship
between work-life balance and productivity. While there are indications, mainly in public
press, to suggest that balanced employees would be more productive (Fenton, 2007;
HRSDC, 2005b), others have found that the positive relationship between work-life balance
and productivity disappears when controlled for management practices (Bloom & Van

191
Reenen, 2006). As an issue still lacking sound empirical backing, this is an area open for
further investigation, which is of great importance to organizations, employees, and policy
makers.
Life-Friendly Organizational Policies
Study findings revealed that the balancing point of the work-life equation can be
very individual-specific and could change depending on factors such as life phases, life
events, and age. Therefore, a single package of “family friendly policies” as presented by
many organizations to cater to work-life balance issues of their employees may not be the
best strategy. It is important that employees make use of such policies and benefit from
them as organizations have an investment cost associated and need to recoup the benefits of
such investment (for example as highly motivated and more productive employees).
Therefore, study findings suggest that employers should present a basket of such benefits to
employees, who can pick and choose (within limits) the most relevant options for their
current need of work/ nonwork demands. Also, employers should recognize that family is
not the only nonwork demand for individuals, and thus should cater to the diverse needs of
individuals in order to ensure greater inclusivity. It would seem that flexibility is an
important attribute of work-life balance approaches.
192
Nonwork-Related ICT Use at Work: How Big is the Problem?
This study identified key technologies having prominent association with
individuals‟ work and nonwork lives. For example e-mails are the most important and most
used ICT for work-related purposes in a work setting while the Internet is the most used
nonwork-related technology in a nonwork setting. In the cross-domain usage, Internet led in
nonwork-related use in work setting while cell phone was prominent in work-related use in
a nonwork setting. Except for a slight deviation in the last category in the Canadian sample
(where work-related e-mail marginally surpasses work-related cell phone in a nonwork
setting), these observations were universal across genders and countries. The understanding
of such usage patterns is important, especially in the cross-domain situations for individuals
and organizations to manage the cross-domain interruptions.
The results suggest that on a typical work day individuals spend 30 percent of their
ICT usage time on nonwork-related activities. On the one hand, this could be considered
unproductive time from the employers‟ point of view and should prompt organizations to
scrutinize these usage patterns. However, these individuals also spend 44 percent of
nonwork day ICT use on work-related matters with 82 percent of the participants doing
work activities at home. More interestingly, of the 18 percent who reported zero hours of
work hours from home, more than half reported to be checking work-related e-mails,
accessing work-related Internet and taking work-related cell phone calls on a nonwork day.
It seems that these individuals did not consider these work-related activities as “work” and
simply spent a portion of the nonwork time on work-related activities, and most definitely
without any formal compensation for their effort. Therefore, before organizations scrutinize
193
the nonwork-related “unproductive” ICT usage during work hours they should seriously
consider the trade-offs of such decision, especially considering the amount of productive
work time put in by these individuals both at work and at nonwork locations. A recent
Facebook message by a friend of mine highlights the issue. She was responding to the
birthday wishes on Facebook and she posted at 9 p.m. “still at work...not so fun birthday.
Right now reading all your messages is the highlight of today.”
From an organizational point of view, unless there is a significant productivity drop,
it is recommended that no formal monitoring of nonwork ICT use is done, especially at the
level of managers and professionals. After all, based on equity theory (Adams & Leonard,
1966) these individuals would expect the organizations to treat them equitably in terms of
effort and commitment they provide. Thus, if they spend unpaid hours of work in nonwork
settings, they expect the organizations to be lenient on them spending a portion of their work
time on nonwork-related activities, in essence helping them to reduce work-to-nonwork
conflict and improve their work-life balance.
Nonwork-Related ICT Use at Work: Predicting Problematic Use
As highlighted in the previous section, organizations should be cautious about
restricting nonwork-related ICT use, especially for managerial and professional employees.
However, this is not a suggestion to turn a totally blind eye to the issue, especially when
research has reported cyberslacking (i.e., personal use of Internet at work) to be more
frequent among those with higher workplace status and work autonomy such as managers
and professionals (Garrett & Danziger, 2008). In addition to productivity losses,

194
cyberslacking could also expose companies to legal liabilities associated with inappropriate
or illegally downloaded content. This study found that different variables have varying
predictive power based on the context of ICT use. For example, while work characteristics
such as work demand and work flexibility were related to work ICT use on nonwork days,
impulsivity and work flexibility were the key predictors of nonwork ICT use on work days.
Research has found that individuals with poor impulse control had more severe problems
with excessive Internet use at the workplace (Davis, Flett, & Besser, 2002) and this study
found that Internet use was significantly associated with nonwork-to-work conflict
compared to other types of ICT. Combining the findings from this research together with the
existing knowledge from the literature suggest the possibility of problematic nonwork-
related Internet use at work for individuals with low impulsive control (Davis et al., 2002;
Steel, 2010b) adversely affect individual productivity. Organizations, in combination with
other measures, can use this knowledge of impulsivity as a predictor of nonwork-related
ICT use in understanding their employees. Assessment of impulsivity of employees could
be used as screening tool at the recruitment stage and a detection/ monitoring tool when ICT
abuse (or overuse) is suspected. The employers could suggest self-regulatory strategies to
help employees to overcome such problems (Steel, 2010b).
Protecting Against Employer Liability
The results of this study provide ample evidence that cross-domain ICT use
positively influences individuals‟ work-to-nonwork conflict. Other studies suggested that
excessive ICT use could lead to addiction (McIntyre, 2006), work overload (Turel, Serenko,
195
& Bontis, 2008), and reduced life satisfaction (Chesley, 2004). Researchers argue that
organizations should be more concerned about the implications of such technology use by
employees, not only out of concern for employee welfare, but also for the possibility of
threat of lawsuits for the liability of addiction in the future (Kakabadse, Porter, & Vance,
2009). It is advised that organizations be aware of possible work/ nonwork conflict issues of
the employees created by, for example, use of technology for work-related purposes and
take actions to provide some relief for the employees. For example, some organizations
have already attempted to ban Blackberry® use during certain times of the day (Ottawa
Citizen, 2008). Organizations, in drafting their work-life policies might have to consider
such measures to reduce the excessive overflow of work-related ICT use into the nonwork
domain to reduce work-to-nonwork conflict of their employees.

196
Conclusion
Information and communication technologies have become an essential component
of our lives. This study focused on the important issue of whether and how the use of ICT
affects work/ nonwork interactions leading to work-life balance of individuals, focusing on
managers and professionals from Canada and Sri Lanka.
This study established that ICT has a significant impact on work/ nonwork
interactions and the context of use is important in understanding such influences. It is the
cross-domain use that is crucial in this work/ nonwork interaction equation. Further,
excessive work-related use of ICT in a nonwork context could lead to increased work-to-
nonwork conflict and reduced nonwork-to-work enrichment. Together, they could adversely
affect work-life balance of individuals. However, the study also found that work-life balance
can be very individual-specific and the point of balance could change even within the same
individual based on life stages and events, and individuals could choose different strategies
to manage the impact of ICT based on their preferred point of balance.
The study straddled across two different countries in the developed and developing
world, but found almost no difference in how ICT influenced work/ nonwork interactions
leading to work-life balance. This remarkable similarity is attributed to the sample of
managers and professionals suggesting that the similarities of the work and socio-economic
characteristics could have weakened country-related differences. On the other hand, it could
be that wireless ICT devices are acting as agents of global homogenization, and these
devices not only blur the work and nonwork boundary, but also create permeable and

197
blurred borders across developed and developing country divide, especially in the context of
ICT use.
The study also found limited gender differences, in stark contrast to the expectations
of a considerable body of literature on female role overload. It could also be that managerial
and professional roles are so similar between genders that any gender differences are also
reduced. Both male and female managerial and professional workers seem to be struggling
with the same pressures, and both genders welcome technology as a means of handling
pressures.
This study advances knowledge by contributing both to the work/ nonwork and the
ICT usage literature. By incorporating ICT usage into work/ nonwork models, important
criteria in today‟s context, the study creates a bridge for future researchers to amalgamate
these two streams of research. The study also clarifies some of the key concepts used in
work/ nonwork literature, and suggests improvements to models predicting ICT usage in
management information systems (MIS) literature.
The importance question was whether ICT empowers or enslaves individuals in
managing work-life balance. Did the study provide an answer to this intriguing question?
The answer is both YES and NO. Yes, because, the study clearly demonstrated that ICT use
(especially excessive work-related use on a nonwork setting) can aggravate work-to-
nonwork conflict and diminish nonwork-to-work enrichment, which together lead to poor
work-life balance. In that sense, ICT could be enslaving individuals by allowing work
domain to overarch throughout the whole life spectrum.
198
However, the point of balance in the work-life equation is defined by individuals
themselves, and sometimes they could choose to allow more or less intrusion depending on
their preference. Most individuals experienced positive affect towards technology, and many
were developing self-regulatory strategies to lessen the negative impacts of the ICT cluster.
Putting it all together, one could argue that ICT can be a very useful tool for managing such
cross-domain intrusions, and be empowering.
The Next Step
Today‟s ICT with smarter smart phones, and thinner, lighter, faster tablet computers
is literally bringing the world to our fingertips, providing true ubiquity. The information and
entertainment flowing through these devices are competing with work demands and a
variety of nonwork demands for an individual's time, energy, and attention. Thus, it is not
only work that gets carried over to nonwork via ICT means; within the nonwork domain,
ICT could be creating spillovers and possibly conflicting situations. For example, the
buzzing cell phone at the dinner table may not be an e-mail from work, but a status update
on a social networking site. Children may be feeling orphaned (Rosman, 2006) by daddy
being constantly on the phone or computer, and he may not be checking an important work
e-mail, but a news alert or updating a Facebook® page. Steel (2010a; 2010b) suggest that
modern ICT is feeding individual impulsivity by creating proximity to temptation and easy
access to instant gratification. Thus individuals may be finding it harder and harder to
devoid themselves from the temptations and to separate themselves from these devices, even
though they have found mechanisms to reduce work-to-nonwork conflict through ICT.

199
There is no argument that ICT today is empowering individuals with ubiquitous
access to an immense information pool at their fingertips. However as identified in the
attention economy literature (Davenport & Beck, 2001), such empowerment comes at a cost
of depleting individual attention, a limited resource, both from work and other aspects of
nonwork. Thus, it could be that the technologies individuals „managed” to enhance their
work-life balance could be enslaving them from a purely nonwork perspective. This thesis
presented a comprehensive study of the impact of ICT use in individual work-life balance,
discussing the role of ICT in empowering or enslaving individuals in managing work and
nonwork interactions. The recent advancements of technology have already opened up a
related and relevant topic to be explored in future research; the true impact of nonwork ICT
use on individuals: Is it empowering or enslaving?
200
REFERENCES
Adams, J. S., & Leonard, B. 1966. Inequity In social exchange, Advances in Experimental
Social Psychology, Vol. Volume 2: 267-299: Academic Press.
Adams, S. M., Weinberg, B. D., Masztal, J. J., & Surette, D. M. 2005. This time it is
personal: Employee online shopping at work. Interactive Marketing, 6(4): 326.
Agarwal, R., & Prasad, J. 1999. Are individual differences germane to the acceptance of
new information technologies? Decision Sciences, 30(2): 361.
Aguinis, H., Pierce, C. A., & Culpepper, S. A. 2009. Scale Coarseness as a Methodological
Artifact. Organizational Research Methods, 12(4): 623-652.
Allen, T. D., Herst, D. E. L., Bruck, C. S., & Sutton, M. 2000. Consequences associated
with work-to-family conflict: A review and agenda for future research. Journal of
Occupational Health Psychology, 5(2): 278–308.
Anderson, B., & Tracey, K. 2001. Digital living: The impact (or otherwise) of the Internet
on everyday life. The American Behavioral Scientist, 45(3): 456.
Anderson, J. C., & Gerbing, D. W. 1988. Structural equation modeling in practice: A review
and recommended two-step approach. Psychological Bulletin, 103(3): 411-423.
Aoki, K., & Downes, E. J. 2003. An analysis of young people‟s use of and attitudes toward
cell phones. Telematics and Informatics 20(4): 349-364.
Arbuckle, J. L. 2008. Amos 17.0. [Computer Program] Chicago: : SPSS. .
Arnold, M. 2003. On the phenomenology of technology: The “Janus-faces” of mobile
phones. Information and Organization, 13: 231-256.
201
Aryee, S. 1992. Antecedents and outcomes of work-family conflict among married
professional women: Evidence from Singapore. Human Relations, 45(8): 813.
Aryee, S., Fields, D., & Luk, V. 1999. A cross-cultural test of a model of the work-family
interface. Journal of Management, 25(4): 491-511.
Aryee, S., Srinivas, E. S., & Tan, H. H. 2005. Rhythms of life: Antecedents and outcomes of
work-family balance in employed parents. Journal of Applied Psychology, 90(1):
132-146.
Ashforth, B. E., Kreiner, G. E., & Fugate, M. 2000. All in a day's work: Boundaries and
micro role transitions. Academy of Management Review, 25(3): 472.
Bagozzi, R. P., & Yi, Y. 1988. On the evaluation of structural equation models. Journal of
the Academy of Marketing Science, 16(1): 74-94.
Barnett, R. C., Marshall, N. L., & Pleck, J. H. 1992. Men's multiple roles and their
relationship to men's psychological distress. Journal of Marriage and the Family,
54(2): 358-367.
Barnett, R. C., Marshall, N. L., & Sayer, A. 1992. Positive-spillover effects from job to
home: A closer look. Women Health, 19(2-3): 13-41.
Baron, R. M., & Kenny, D. A. 1986. The moderator-mediator variable distinction in social
psychological research: Conceptual, strategic, and statistical considerations. Journal
of Personality and Social Psychology, 51(6): 1173-1182.
Bell, D. N. F., & Hart, R. A. 1999. Unpaid work. Economica, 66(262): 271-290.
202
Bennett, M. 1977. Response characteristics of bilingual managers to organizational
questionnaires. Personnel Psychology, 30(1): 29-36.
Bird, J. 2006. Work-life balance: Doing it right and avoiding the pitfalls. Employment
Relations Today, 33(3): 21.
Black, S. E., & Lynch, L. M. 2001. How to compete: The impact of workplace practices and
information technology on productivity. The Review of Economics and Statistics,
83(3): 434-445.
Bloom, N., & Van Reenen, J. 2006. Management practices, work-life balance, and
productivity: A review of some recent evidence. Oxford Review of Economic
Policy, 22(4): 457-482.
Bollen, K. A. 1989. Structural equations with latent variables. New York: Wiley.
Boneva, B., Kraut, R., & Frohlich, D. 2001. Using e-mail for personal relationships: The
difference gender makes. The American Behavioral Scientist, 45(3): 530.
Boswell, W. R., & Olson-Buchanan, J. B. 2007. The use of communication technologies
after hours: The role of work attitudes and work-life conflict. Journal of
Management, 33(4): 592-610.
Brehm, J. W. 1966. A Theory of Psychological Reactance New York: Academic Press.
Brehm, S. S., & Brehm, J. W. 1981. Psychological Reactance: A Theory of Freedom and
Control. New York: Academic Press.
203
Browne, M. W., & Cudeck, R. 1993. Alternative ways of assessing mosel fit. In K. A.
Bollen, & J. S. Long (Eds.), Testing structural models: 136-162. Newbury Park,
CA: Sage.
Burchielli, R., Bartram, T., & Thanacoody, R. 2008. Work-Family Balance or Greedy
Organizations? Relations Industrielles, 63(1): 108.
Burke, R. J. 1988. Some antecedents and consequences of work-family conflict. Journal of
Social Behavior and Personality, 3(4): 287-302.
Burley, K. A. 1994. Gender differences and similarities in coping responses to anticipated
work-family conflict. Psychological Reports, 74: 115-123.
Byrne, B. 2004. Testing for multigroup invariance using AMOS Graphics: A road less
traveled. Structural Equation Modeling, 11(2): 272-300.
Byrne, B. M. 2009. Structural equation modeling with AMOS; Basic concepts,
applications, and programming (2nd ed.). New York: Taylor and Francis Group.
Byron, K. 2005. A meta-analytic review of work–family conflict and its antecedents.
Journal of Vocational Behavior, 67(2): 169-198.
Campbell, D. T., & Fiske, D. W. C. 1959. Convergent and discriminant validation by the
multitrait-multimethod matrix. Psychological Bulletin, 56: 81-105.
Carlson, D. S., Grzywacz, J. G., & Zivnuska, S. 2009. Is work/family balance more than
conflict and enrichment? Human Relations, 62: 1459-1486.
204
Carlson, D. S., Kacmar, K. M., Wayne, J. H., & Grzywacz, J. G. 2006. Measuring the
positive side of the work-family interface: Development and validation of a work-
family enrichment scale. Journal of Vocational Behavior, 68(1): 131-164.
Carlson, D. S., Kacmar, K. M., & Williams, L. J. 2000. Construction and initial validation
of a multidimensional measure of work-family conflict,. Journal of Vocational
Behavior, 56(2): 249-276.
CCOHS. 2002. Work/Life Balance. Canadian Centre for Occupational Health and Safety.
Accessed on June, Retrieved from
http://www.ccohs.ca/oshanswers/psychosocial/worklife_balance.html
Chen, C., Lee, S., & Stevenson, H. W. 1995. Response style and cross-cultural comparisons
of rating scales among East Asian and North American students. Psychological
Science, 6(3): 170-175.
Chesley, N. 2004. Using information technology to manage work and family life:
Implications for life quality. Unpublished PhD Dissertation, Cornell University.
Chesley, N. 2005. Blurring boundaries? Linking technology use, spillover, individual
distress and family satisfaction. Journal of Marriage and the Family,
67(December): 1237-1248.
Chesley, N. 2006. Families in a high-tech age: Technology usage patterns, work and family
correlates, and gender. Journal of Family Issues, 27(5): 587.
Cheung, G. W., & Rensevold, R. B. 2002. Evaluating goodness-of-fit indexes for testing
measurement invariance Structural Equation Modeling, 9(2): 233
205
Cheung, G. W., & Rensvold, R. B. 1999. Testing factorial invariance across groups: A
reconceptualization and proposed new method. 25(1): 1-27.
Cheung, G. W., & Rensvold, R. B. 2000. Assessing extreme and acquiescence response sets
in cross-cultural research using structural equations modeling. Journal of Cross-
Cultural Psychology, 31(2): 187-212.
Chou, C. P., Bentler, M., & Satorra, A. 1991. Scales test statistics and robust standard error
for non-normal data in covariance structure analysis: A Monte Carlo study. British
Journal of Mathematical and Statistical Psychology, 44: 347-357.
Churchill, E. F., & Munro, A. J. 2001. Work/place: mobile technologies and arenas of
activity. ACM SIGGROUP Bulletin, 22(3): 3-9.
Clark, S. C. 2000. Work/family border theory: A new theory of work/life balance. Human
Relations, 53(6): 747-770.
Clark, S. C. 2001. Work cultures and work/family balance. Journal of Vocational
Behavior, 58(3): 348-365.
Craig, S., & Zuckerman, G. 2007. BlackBerry addicts also can't resist this little game;
Playing BrickBreaker is executives' guilty pleasure; Phoning from Mt. Everest.
Wall Street Journal. Retrieved from
http://proquest.umi.com/pqdweb?did=1217884891&Fmt=7&clientId=12303&RQT=
309&VName=PQD
Crouter, A. C. 1984. Spillover from family to work: the neglected side of the work-family
interface. Human Relations, 37: 425-442.
206
D'Abate, C. P. 2005. Working hard or hardly working: A study of individuals engaging in
personal business on the job. Human Relations, 58(8): 1009.
Davenport, T. H., & Beck, J. C. 2001. The attention economy: Understanding the new
currency of business Boston, MA: Harvard Business School Press.
Davis, F. D. 1989. Perceived usefulness, perceived ease of use, and user acceptance of
information technology. MIS Quarterly, 13(3): 319-340.
Davis, F. D., Bagozzi, R. P., & Warshaw, P. R. 1989. User acceptance of computer
technology: A comparison of two theoretical models. Management Science, 35(8):
982-1003.
Davis, R. A., Flett, G. L., & Besser, A. 2002. Validation of a new scale for measuring
problematic Internet use: Implications for pre-employment screening.
CyberPsychology & Behavior, 5(4): 331-345.
Demerouti, E., Geurts, S. A. E., & Kompier, M. 2004. Positive and negative work-home
interaction: prevalence and correlates. Equal Opportunities International, 23(1-2):
6-35.
Desrochers, S., Hilton, J., & Larwood, L. 2005. Preliminary validation of the work-family
integration-blurring scale. Journal of Family Issues, 26(4): 442.
Dishaw, M. T., & Strong, D. M. 1999. Extending the technology acceptance model with
task-technology fit constructs. Information & Management, 36(1): 9-21.
Drasgow, F., & Kanfer, R. 1985. Equivalence of psychological measurement in
heterogeneous populations. Journal of Applied Psychology, 70(4): 662-680.

207
Duxbury, L., Higgins, C., & Lee, C. 1994. Work-family conflict: A comparison by gender,
family type, and perceived control. Journal of Family Issues, 15(3): 449.
Eagle, B. W., Miles, E. W., & Icenogle, M. L. 1997. Interrole conflicts and the permeability
of work and family domains: Are there gender differences? Journal of Vocational
Behavior, 50(2): 168-184.
Eddleston, K. A., Veiga, J. F., & Powell, G. N. 2006. Explaining sex differences in
managerial career satisfier preferences: The role of gender self-schema. Journal of
Applied Psychology, 91(2): 437.
Edur, O. 2000. Converging technologies. CMA Management, 74(9): 18-22.
Edwards, J. A., Cockerton, T., & Guppy, A. 2007. A longitudinal study examining the
influence of work and non-work stressors upon well-being: A multi-group analysis.
International Journal of Stress Management, 14(3): 294-311.
Edwards, J. R., & Rothbard, N. P. 2000. Mechanisms linking work and family: Clarifying
the relationship between work and family constructs. Academy of Management
Review, 25(1): 178.
Ellison, N. B. 1999. Social impacts: New perspectives on telework. Social Science Computer
Review, 17(3): 338-356.
Erdfelder, E., Faul, F., & Buchner, A. 1996. GPOWER: A general power analysis program.
Behavior Research Methods, Instruments, & Computers, 28, : 1-11.

208
Everton, W. J., Mastrangelo, P. M., & Jolton, J. A. 2005. Personality correlates of
employees' personal use of work computers. CyberPsychology & Behavior, 8(2):
143-153.
Facer II, R. L., & Wadsworth, L. 2008. Alternative work schedules and work-family
balance: A research note. Review of Public Personnel Administration, 28(2): 166.
Fenner, G. H., & Renn, R. W. 2004. Technology-assisted supplemental work: Construct
definition and a research framework. Human Resource Management, 43(2-3): 179-
200.
Fenton, S. 2007. Firms say work-life balance boosts productivity. Reuters. Accessed on
April 2011, Retrieved from http://www.reuters.com/article/2007/06/06/us-
hongkong-employment-idUSHKG13052720070606
Flanagan, J. C. 1954. The critical incident technique. Psychological Bulletin, 51(4): 327-
358.
Fornell, C., & Larcker, D. F. 1981. Evaluating structural equation models with unobservable
variables and measurement error. Journal of Marketing Research: 39-50.
Freeman, M. A. 1997. Demographic correlates of individualism and collectivism: A study of
social values in Sri Lanka. Journal of Cross-Cultural Psychology, 28(3): 321-341.
Frone, M., Russell, M., & Cooper, M. 1992a. Antecedents and outcomes of work-family
conflicts: Testing a model of work-family interface. Journal of Applied Psychology,
77(1): 65-78.
209
Frone, M., Russell, M., & Cooper, M. 1992b. Prevalence of work-family conflict: Are work
and family boundaries asymmetrically permeable? Journal of Organizational
Behavior, 13(7): 723-729.
Frone, M., Russell, M., & Cooper, M. 1997. Relation of work-family conflict to health
outcomes: A four-year longitudinal study of employed parents. Journal of
Occupational and Organizational Psychology, 70: 325-335.
Frone, M. R. 2003. Work-Family Balance. In J. C. Quick, & L. E. Tetrick (Eds.), Handbook
of Occupational Health Psychology: 143-162. Washington, DC: American
Psychological Association.
Frone, M. R., Russell, M., & Barnes, G. M. 1996. Work-family conflict, gender, and health-
related outcomes: a study of employed parents in two community samples. Journal
of Occupational Health Psychology, 1(1): 57-69.
Fuimano, J. 2005. Balance is more than just a buzzword. Nursing Management, 36(5): 23.
Galinsky, E., Kim, S. S., & James, T. 2001. Feeling overworked: When work becomes too
much: Families and Work Institute.
Gant, D., & Kiesler, S. 2001. Blurring the boundaries: Cell phones, mobility, and the line
between work and personal life In B. Brown, N. Green, & R. Harper (Eds.), Wireless
world: social and interactional aspects of the mobile age 121- 131 New York:
Springer-Verlag New York, Inc.
Garrett, R. K., & Danziger, J. N. 2008. On cyberslacking: Workplace status and personal
internet use at work. CyberPsychology & Behavior, 11(3): 287-292.

210
Gefen, D., & Straub, D. W. 1997. Gender differences in the perception and use of e-mail:
An extension to the technology acceptance model. MIS Quarterly, 21(4): 389-400.
Geisler, C., & Golden, A. 2003. Mobile technologies at the boundary of work and Life,
National Communication Association, Human Communication and Technology
Division.
Geurts, S. A. E., & Demerouti, E. 2003. Work/non-work interface: A review of theories and
findings. In M. J. Schabracq, J. A. M. Winnubst, & C. L. Cooper (Eds.), The
Handbook of Work and Health Psychology, 2nd ed.: John Wiley & Sons, Ltd.
Golden, A., & Geisler, C. 2007. Mobile technologies at the boundary of work and Life.
Human Relations, 60(3): 519-551
Golden, T. D., Veiga, J. F., & Simsek, Z. 2006. Telecommuting's differential impact on
work-family conflict: Is there no place like home? Journal of Applied Psychology,
91(6): 1340.
Goodhue, D. L., & Thompson, R. L. 1995. Task-technology fit and individual performance.
MIS Quarterly, 19(2): 213-236.
Gosling, S. D., Gaddis, S., & Vazire, S. 2007. Personality Impressions Based on Facebook
Profiles. in Proceedings of the International Conference on Weblogs and Social
Media, Boulder, Colorado, USA.
Gosling, S. D., Vazire, S., Srivastava, S., & John, O. P. 2004. Should we trust web-based
studies? A comparative analysis of six preconceptions about Internet questionnaires.
American Psychologist, 59(2): 93–104.

211
Green, N. 2002. On the move: Technology, mobility, and the mediation of social time and
space. Information Society, 18(4): 281-292.
Greenblatt, E. 2002. Work/Life Balance: Wisdom or Whining. Organizational Dynamics,
31(2): 177-193.
Greenhaus, J. H., & Allen, T. D. 2011. Work-family balance: A review and extension of the
literature. In J. C. Quick, & L. E. Tetrick (Eds.), Handbook of occupational health
psychology, 2nd ed.: 165-183 Washington, DC: American Psychological
Association.
Greenhaus, J. H., & Beutell, N. 1985. Sources of conflict between work and family roles.
Academy of Management Review, 10(1): 76-88.
Greenhaus, J. H., Collins, K. M., & Shaw, J. D. 2003. The relation between work-family
balance and quality of life. Journal of Vocational Behavior, 63(3): 510-531.
Greenhaus, J. H., & Powell, G. N. 2003. When work and family collide: Deciding between
competing role demands. Organizational Behavior and Human Decision
Processes, 90: 291-303.
Greenhaus, J. H., & Powell, G. N. 2006. When work and family are allies: A theory of
work-family enrichment. Academy of Management Review, 31: 72-92.
Grzywacz, J. G. 2002. Toward a theory of work-family facilitation. in Proceedings of the
34th Annual Theory Construction and Research Methodology Workshop, Houston,
TX.

212
Grzywacz, J. G., & Bass, B. L. 2003. Work, family, and mental health: Testing different
models of work-family fit. Journal of Marriage & Family, 65(1): 248-261.
Grzywacz, J. G., & Carlson, D. S. 2007. Conceptualizing work-family balance: Implications
for practice and research. Advances in Developing Human Resources, 9(4): 455.
Grzywacz, J. G., Carlson, D. S., Kacmar, K. M., & Wayne, J. H. 2007. A multi-level
perspective on the synergies between work and family. Journal of Occupational
and Organizational Psychology, 80(4): 559-574.
Grzywacz, J. G., & Marks, N. F. 2000. Reconceptualizing the work-family interface: An
ecological perspective on the correlates of positive and negative spillover between
work and family. Journal of Occupational Health Psychology, 5(1): 111-126.
Guest, D. E. 2002. Perspectives on the study of work-life balance. Social Science
Information, 41(2): 255-279.
Gurchiek, K. 2008. 'Mental Health' days taken for family. HRMagazine, 53(5): 26.
Gutek, B. A., Searle, S., & Klepa, L. 1991. Rational verses gender role explanations for
work-family conflict. Journal of Applied Psychology, 76: 560-568.
Hair, J. F., Black, W. C., Babin, B. J., Anderson, R. E., & Tatham, R. L. 2006. Multivariate
data analysis (6 ed.). Upper Saddle Drive, NJ: Prentice Hall.
Hall, D. T., & Richter, J. 1988. Balancing work life and home life: What can organizations
do to help? The Academy of Management Executive, 2(3): 213.
Harzing, A. W. 2006. Response styles in cross-national survey research: A 26-country
study. International Journal of Cross Cultural Management, 6(2): 243.
213
Haythornwaite, C. 2001. The Internet in everyday life. The American Behavioral Scientist,
45(3): 363.
Healy, E. 2000. The shift to long working hours: A social and political crisis in the making.
People & Place, 8(1): 38-51.
Henle, C., & Blanchard, A. 2008. The Interaction of Work Stressors and Organizational
Sanctions on Cyberloafing*. Journal of Managerial Issues, 20(3): 383.
Heraty, N., Morley, M. J., & Cleveland, J. N. 2008. The work-family dyad: multi-level
perspectives. Journal of Managerial Psychology, 23(5).
Hewlin, P. F. 2003. And the award for best actor goes to...: Facades of conformity in
organizational settings. Academy of Management Review, 28(4): 633-642.
Hill, E. J. 2005. Work-family facilitation and conflict, working fathers and mothers, work-
family stressors and support Journal of Family Issues, 26(4): 793-819
Hill, E. J., Hawkins, A. J., Ferris, M., & Weitzman, M. 2001. Finding an extra day a week:
The positive influence of perceived job flexibility on work and family life balance.
Family Relations, 50(1): 49-58.
Hill, E. J., Miller, B. C., Weiner, S. P., & Colihan, J. 1998. Influences of the virtual office
on aspects of work and work/life balance. Personnel Psychology, 51(3): 667.
Hinkin, T. R. 1995. A review of scale development practices in the study of organizations.
Journal of Management, 21(5): 967.
Hochschild, A. 1989. The Second Shift: Inside the Two Job Marriage. Harmondsworth:
Viking Penguin.
214
HRSDC. 2005a. Addressing work life balance in Canada. Human Resources and Skills
Development Canada. Accessed on January, 2005-4-27, Retrieved from
http://www.hrsdc.gc.ca/en/lp/spila/wlb/awlbc/03changing_face_canadian_workplace
s.shtml
HRSDC. 2005b. The business case forw work-life balance. Human Resources and Skill
Development Canada. Accessed on April 2011, Retrieved from
http://www.hrsdc.gc.ca/eng/lp/spila/wlb/16benefits_costs_businesscase.shtml
HRSDC. 2006. Hours of work, overtime, meal and other breaks. Human Resources and
Skills Development Canada. Accessed on December, 2006-02-09, Retrieved from
http://www.hrsdc.gc.ca/asp/gateway.asp?hr=/en/lp/spila/clli/eslc/21Hours_Work_Ov
ertime_Meal.shtml&hs=lzl
Hu, L., & Bentler, P. M. 1999. Cutoff criteria for fit indexes in covariance structure
analysis: Conventional criteria versus new alternatives. Structural equation
modeling, 6(1): 1-55.
Hui, C. H., & Triandis, H. C. 1989. Effects of culture and response format on extreme
response style. Journal of Cross-Cultural Psychology, 20(3): 296.
Hyman, J., & Summers, J. 2004. Lacking balance? Work-life employment practices in the
modern economy. Personnel Review, 33(4): 418.
ITIM. 2003. Geert Hofstede™ Cultural Dimensions. ITIM International. Accessed on
November, Retrieved from http://www.geert-hofstede.com/hofstede_canada.shtml
215
ITU. 2005. ICT statistics. International Telecommunication Union. Accessed on September,
Last update on 2005-12-19, Retrieved from http://www.itu.int/ITU-
D/ict/statistics/ict/index.html
ITU. 2007. ITU statistics: Global maps and graphs. Accessed on December, Updated on
2008-07-15 Retrieved from http://www.itu.int/ITU-D/ict/statistics/maps.html
ITU. 2010. The world in 2010. Noveber 2010, Retrieved from http://www.itu.int/ITU-
D/ict/material/FactsFigures2010.pdf
Jarvenpaa, S. L., & Lang, K. R. 2005. Managing the paradoxes of mobile technology.
Information Systems Management, 22(4): 7- 23.
Javeline, D. 1999. Response effects in polite cultures: A test of acquiescence in Kazakhstan.
Public Opinion Quarterly, 63(1): 1-28.
Johnson, K. 2005. Europe picks up 3G, as phone hopes lift; Consumers embrace
technology converging voice, music, video; U.S. telecom sector falls behind. Wall
Street Journal, New York. Retrieved from
Johnson, R. B., & Onwuegbuzie, A. J. 2004. Mixed methods research: A research paradigm
whose time has come. Educational Researcher, , 33(7): 14-26.
Johnson, T., Kulesa, P., Llc, I., Cho, Y. I., & Shavitt, S. 2005. The relation between culture
and response styles: Evidence from 19 countries. Journal of Cross-Cultural
Psychology, 36(2): 264.
Joplin, J. R. W., Shaffer, M. A., Francesco, A. M., & Lau, T. 2003. The macro-environment
and work-family conflict: Development of a cross cultural comparative framework

216
International Journal of Cross Cultural Management, 3(3): 305-328.
Joplin, J. R. W., Shaffer, M. A., Lau, T., & Francesco, A. M. 2007. Life balance:
Developing and validating a cross-cultural measure. presented at the Academy of
International Business 2007, Indianapolis- US-IN.
Jöreskog, K. G., & Sörbom, D. 1993. Testing structural equation models. In K. A. Bollen, &
J. S. Long (Eds.), Testing structural equation models: 294-316. Newbury Park, CA:
Sage.
Judge, T. A., Boudreau, J. W., & Bretz Jr, R. D. 1994. Job and life attitudes of male
executives. Journal of Applied Psychology, 79(5): 767-782.
Kakabadse, N. K., Porter, G., & Vance, D. 2009. The unbalanced high-tech life: Are
employers liable? Strategic Change, 18(1-2): 1-13.
Kammeyer-Mueller, J., Steel, P. D. G., & Rubenstein, A. 2010. The other side of method
bias: The perils of distinct source research designs. Multivariate Behavioral
Research, 45: 294-321.
Karatepe, O. M., & Bekteshi, L. 2008. Antecedents and outcomes of work-family
facilitation and family-work facilitation among frontline hotel employees.
International Journal of Hospitality Management, 27(4): 517-528.
Katz, J. E. 1997. Social and organizational consequences of wireless communications: A
selective analysis of residential and business sectors in The United States.
Telematics and Informatics, 14(3): 233-256.

217
Katz, J. E., Rice, R. E., & Aspden, P. 2001. The Internet, 1995-2000: Access, civic
involvement, and social interaction. The American Behavioral Scientist, 45(3): 405.
Kazmer, M. M., & Haythornthwaite, C. 2001. Juggling multiple social worlds: Distance
students online and offline. The American Behavioral Scientist, 45(3): 510.
Kennedy, P. 2003. A guide to Econometrics. Canbridge, MA: MIT Press.
Kinicki, A. J., & Vecchio, R. P. 1994. Influences on the quality of supervisor-subordinate
relations: The role of time-pressure, organizational commitment, and locus of
control. Journal of Organizational Behavior, 15(1): 75-82.
Kinnunen, U., & Mauno, S. 1998. Antecedents and outcomes of work family conflict among
employed women and men in Finland. Human Relations, 51(2): 157-177.
Kirkpatrick, D. 2006. Pushing back against the stress. Fortune, 153(9): 46.
Kirwan-Taylor, H. 2006. Are you suffering from continuous partial attention. Management
Today(June): 17.
Kline, R. B. 2005a. Principles and practices of Structural Equation Modeling. New York:
The Guilford Press.
Kline, T. J., Sulsky, L. M., & Rever-Moriyama, S. D. 2000. Common method variance and
specification errors: A practical approach to detection. The Journal of Psychology
134(4): 401-421.
Kline, T. J. B. 2005b. Psychological testing: A practical approach to desing and
evaliation. Thousand Oaks, CA: Sage Publications.

218
Kossek, E. E., & Ozeki, C. 1998. Work-family conflict, policies, and the job-life satisfaction
relationship: A review and direction for organizational behaviour - human resources
research. Journal of Applied Psychology, 83(2): 139-149.
Kraut, R., Kiesler, S., Boneva, B., Cummings, J., Helgeson, V., & Crawford, A. 2002.
Internet paradox revisited. Journal of Social Issues, 58(1): 49-74.
Kraut, R., Patterson, M., Lundmark, V., Kiesler, S., Mukopadhyay, T., & Scherlis, W. 1998.
Internet paradox. A social technology that reduces social involvement and
psychological well-being? American Psychologist, 53(9): 1017-1031.
Kreiner, G. E., Hollensbe, E. C., & Sheep, M. L. 2009. Balancing borders and bridges:
Negotiating the work-home interface via boundary work tactics. Academy of
Management Journal, 52(4): 704-730.
Kromrey, J. D., & Foster-Johnson, L. 1998. Mean centering in moderated multiple
regression: Much ado about nothing. Educational and Psychological Measurement,
v58(n1): p42(26).
Lance, C. E., Dawson, B., Birkelbach, D., & Hoffman, B. J. 2010. Method effects,
measurement error, and substantive conclusions. Organizational Research Methods.
Lester, P. E., & Bishop, L. K. 2000. Handbook of Tests and Measurement in Education
and Social Sciences (2nd ed.). Lanham, Maryland, London: The Scarecrow Press
Inc.
Levinson, D. J., Darrow, C. N., Klein, E. b., Levinson, M. H., & McKee, B. 1979. The
seasons of a man's life. New York: Alfred A. Knopf.

219
Li, L., & Tse, E. 1998. Antecedents and consequences of expatriate satisfaction in the Asian
Pacific. Tourism Management, 19(2): 135-143.
Ling, R., & Haddon, L. 2001. Mobile telephony, mobility and the coordination of everyday
life. presented at the Machines that becomes us, Rutger University. April 2001
Little, R. J. A. 1988. A test of missing completely at random for multivariate data with
missing values. Journal of the American Statistical Association, 83(404): 1198-
1202.
Little, T. D., Cunningham, W. A., Shahar, G., & Widaman, K. F. 2002. To parcel or not to
parcel: Exploring the question, weighing the merits. Structural Equation Modeling,
9(2): 151–173.
Little, T. D., Lindenberger, U., & Nesselroade, J. R. 1999. On selecting indicators for
multivariate measurement and modeling with latent variables: When" good"
indicators are bad and" bad" indicators are good. Psychological Methods, 4(2): 192-
211.
MacCallum, R. C., & Austin, J. T. 2000. Applications of structural equation modeling in
psychological research. Annual Review of Psychology, 51(1): 201.
MacCallum, R. C., Browne, M. W., & Sugawara, H. M. 1996. Power analysis and
determination of sample size for covariance structure modeling. Psychological
Methods, 1(2): 130-149.
Maertz Jr., C. P., & Boyar, S. L. 2011. Work-family conflict, enrichment, and balance under
"levels" and "episodes" approaches. Journal of Management, 37(1): 68-98.

220
Maitland, A. 2004. A game of work and no play: Work-life balance: It is not only golfers
who take their work home. . Financial Times, London, UK. September 22,
Retrieved from
http://proquest.umi.com/pqdweb?did=697834721&Fmt=7&clientId=12303&RQT=3
09&VName=PQD
Marin, G., Gamba, R. J., & Marin, B. V. 1992. Extreme response style and acquiescence
among Hispanics: The role of acculturation and education. Journal of Cross-
Cultural Psychology, 23(4): 498.
Marin, G., Triandis, H. C., Betancourt, H., & Kashima, Y. 1983. Ethnic affirmation versus
social desirability: Explaining discrepancies in bilinguals' responses to a
questionnaire. Journal of Cross-Cultural Psychology, 14(2): 173.
Marks, S. R., Huston, T. L., Johnson, E. M., & MacDermid, S. M. 2001. Role balance
among white married couples. Journal of Marriage and the Family, 63(4): 1083-
1098.
Marks, S. R., & MacDermid, S. M. 1996. Multiple roles and the self: A theory of role
balance. Journal of Marriage and the Family, 58(2): 417-432.
Marsh, H. W., Balla, J. R., & McDonald, R. P. 1988. Goodness of fit indexes in
confirmatory factor analysis: The effect of sample size. Psychological Bulletin, 103:
391-410.
221
Marsh, H. W., Hau, K. T., Balla, J. R., & Grayson, D. 1998. Is more ever too much? The
number of indicators per factor in confirmatory factor analysis. Multivariate
Behavioral Research 33(2): 181.
Martins, L. L., Eddleston, K. A., & Veiga, J. F. 2002. Moderators of the relationship
between work-family conflict and career satisfaction. Academy of Management
Journal, 45(2): 399-409.
Matteson, M. T., & Ivancevich, J. M. 1987. Controlling work stress: Effective human
resource and management strategies.
Mazmanian, M., Orlikowski, W., & Yates, J. 2006. Ubiquitous email: Individual
experiences and organizational consequences of BlackBerry use. presented at the
Academy of Management Conference, Atlanta, GA.
McIntyre, S. 2006. BlackBerry addiction 'similar to drugs'. Daily Mail, UK. Accessed on
September, Retrieved from
http://www.dailymail.co.uk/pages/live/articles/news/news.html?in_article_id=40164
6&in_page_id=1770
Mesmer-Magnus, J. R., & Viswesvaran, C. 2005. Convergence between measures of work-
to-family and family-to-work conflict: A meta-analytic examination. Journal of
Vocational Behavior, 67(2): 215-232.
Michel, J. S., Mitchelson, J. K., Kotrba, L. M., LeBreton, J. M., & Baltes, B. B. 2009. A
comparative test of work-family conflict models and critical examination of work-
family linkages. Journal of Vocational Behavior, 74(2): 199-218.

222
Morris, M. G., & Venkatesh, V. 2000. Age differences in technology adoption decisions:
Implications for a changing workforce. Personnel Psychology, 53(2): 375-403.
Morris, M. G., Venkatesh, V., & Ackerman, P. L. 2005. Gender and age differences in
employee decisions about new technology: an extension to the theory of planned
behavior. IEEE Transactions on Engineering Management 52(1): 69-84.
Nasar, J., Hecht, P., & Wener, R. 2007. 'Call if You Have Trouble': Mobile Phones and
Safety among College Students. International Journal of Urban and Regional
Research, 31(4): 863-873.
Netemeyer, R. G., Boles, J. S., & McMurrian, R. 1996. Development and validation of
work-family conflict and family-work conflict scales. Journal of Applied
Psychology, 81(4): 400-410.
Nie, N. H. 2001. Sociability, interpersonal relations, and the Internet: Reconciling
conflicting findings. The American Behavioral Scientist, 45(3): 420.
Nippert-Eng, C. E. 1996. Home and work : Negotiating boundaries through everyday life.
Chicago, IL: University of Chicago Press.
O'Driscoll, M. 1996. The interface between job and off-job roles: Enhancement and conflict.
In C. Cooper, & I. Robertson (Eds.), International Review of Industrial and
Organizational Psychology, Vol. 11: 279-306. Chichester: John Wiley.
Olson-Buchanan, J. B., & Boswell, W. R. 2006. Blurring boundaries: Correlates of
integration and segmentation between work and nonwork. Journal of Vocational
Behavior.

223
Orlikowski, W. J. 2000. Using technology and constituting structures: A practice lens for
studying technology in organizations. Organization Science, 11: 404-428.
Ottawa Citizen. 2008. 'BlackBerry blackout' imposed on PS. Ottawa Citizen. February 1,
Retrieved from
http://www.canada.com/ottawacitizen/news/story.html?id=ac947d65-757a-469e-
b144-5c97794df130&k=12741
Pain, R., Grundy, S., Gill, S., Towner, E., Sparks, G., & Hughes, K. 2005. So Long as I
Take my Mobile: Mobile Phones, Urban Life and Geographies of Young People's
Safety. International Journal of Urban & Regional Research, 29(4): 814-830.
Palen, L., Salzman, M., & Youngs, E. 2000. Going wireless: Behaviour & practice of new
mobile phone users. in Proceedings of CSCW'00 Conference on Computer
Supported Cooperative Work, Proceedings of the CSCW'00 Conference on
Computer Supported Cooperative Work, New York.
Palen, L., Salzman, M., & Youngs, E. 2001. Discovery and integration of mobile
communicaiton in everyday life. Personal and Ubiquitous Computing, 5: 109-122.
Parasuraman, S., & Alutto, J. A. 1981. An Examination of the Organizational Antecedents
of Stressors at Work, Vol. 24: 48-67: JSTOR.
Parasuraman, S., & Greenhaus, J. H. 2002. Towards reducing some critical gaps in work-
family research. Human Resource Management Review, 12(3): 299-312.
224
Parasuraman, S., Greenhaus, J. H., & Granrose, C. S. 1992. Role stressors, social support,
and well being among two-career couples. Journal of Organizational Behavior, 13:
339-356.
Patel, D. 2002. Vacation? What vacation? HRMagazine, 47(8): 144.
Perry, M., O'Hara, K., Sellen, A., Brown, B., & Harper, R. 2001. Dealing with mobility:
Understanding access anytime, anywhere. ACM Transactions on Computer-Human
Interactions, 8(4): 323-347.
Pleck, J. H. 1977. The work-family role system. Social Problems, 24(4): 417-427.
Podsakoff, P. M., MacKenzie, S. B., Lee, J. Y., & Podsakoff, N. P. 2003. Common method
biases in behavioral research: A critical review of the literature and recommended
remedies. Journal of Applied Psychology, 88(5): 879-903.
Poster, W. R., & Prasad, S. 2005. Work-family relations in transnational perspective: A
view from high-tech firms in India and the United States. Social Problems, 52(1):
122-146.
Preacher, K. J., & Leonardelli, G. J. 2010. Calculation for the Sobel test: An interactive
calculation tool for mediation tests. Accessed February 2011, Retrieved from
http://people.ku.edu/~preacher/sobel/sobel.htm
Rajadhyaksha, U., & Bhatnagar, D. 2000. Life role salience: A study of dual-career couples
in the Indian context. Human Relations, 53(4): 489.
Rakow, L. F., & Navarro, V. 1993. Remote mothering and the parallel shift: Women meet
the cellular telephone. Critical Studies in Mass Communication, 10: 144-157.
225
Reuters. 2006. BlackBerry users addicted but happy. PCMAG.COM. Accessed on
September, 24 August 2006, Retrieved from
http://www.pcmag.com/article2/0,1895,2008288,00.asp
Rice, R. W., McFarlin, D. B., Hunt, R. G., & Near, J. P. 1985. Organizational Work and the
Perceived Quality of Life: Toward a Conceptual Model. Academy of Management
Review, 10(2): 296.
Richardson, H. A., Simmering, M. J., & Sturman, M. C. 2009. A tale of three perspectives:
Examining post hoc statistical techniques for detection and correction of common
method variance. Organizational Research Methods, 12(4): 762-800.
RIM. 2007. Research In Motion Limited Annual Report
Rosman, K. 2006. BlackBerry Orphans The Wall Street Journal. September 2009,
Retrieved from http://online.wsj.com/public/article/SB116553463083344032-
SzuhOlzamjgoRWAGOqtyX7h8ldM_20071208.html
Roth, P. L. 1994. Missing data: A conceptual review for applied psychologists. Personnel
Psychology, 47(3): 537-560.
Rothbard, N. P. 2001. Enriching or depleting? The dynamics of engagement in work and
family roles. Administrative Science Quarterly, 46(4): 655.
Rothbard, N. P., Phillips, K. W., & Dumas, T. L. 2005. Managing multiple roles: Work-
family policies and individuals' desires for segmentation. Organization Science,
16(3): 243.
226
Rothberg, D. 2006. BlackBerry on the beach: You call this a real vacation? eWeek.Com.
Accessed on September, Retrieved from
http://www.eweek.com/article2/0,185,1974714,00.asp
Rubin, H. J., & Rubin, I. S. 1995. Qualitative interviewing: The art of hearing data.
California: Sage Publications Inc.
Schlosser, F. K. 2002. So, how do people really use their handheld devices? An interactive
study of wireless technology use. Journal of Organizational Behavior, 23(4): 401-
423.
Schumacker, R. E., & Lomax, R. G. 2004. A Beginner's Guide to Structural Equation
Modeling (2nd ed.). New Jersey Lawrence Erlbaum Associates, Publishers, Inc.
Senarathne Tennakoon, K. L. U., & Taras, D. G. 2008. Empowerment or enslavement: The
impact of ICT use on work-life balance. in Proceedings of the 67th Academy of
Management Conference, Anaheim, California, USA.
Sieber, S. D. 1974. Toward a theory of role accumulation. American Sociological Review,
39: 567-578.
Silver, H. 1993. Homework and domestic work. Sociological Forum, 8(2): 181-204.
Smith, P. B. 2004. In search of acquiescent response bias. Journal of Cross-Cultural
Psychology, 35(1): 50-61.
Smola, K. W., & Sutton, C. D. 2002. Generational differences: revisiting generational work
values for the new millennium. Journal of Organizational Behavior, 23(4): 363-
382.
227
Sonnentag, S., Binnewies, C., & Mojza, E. J. 2008. "Did You Have A Nice Evening?" A
Day-Level Study on Recovery Experiences, Sleep, and Affect. Journal of Applied
Psychology, 93(3): 674-684.
Sonnentag, S., & Zijlstra, F. R. 2006. Job characteristics and off-job activities as predictors
of need for recovery, well-being, and fatigue. Journal of Applied Psychology, 91(2):
330-350.
Spector, P. E. 2006. Method variance in organizational research: Truth or urban legend?
Organizational Research Methods, 9(2): 221-232.
Spector, P. E., Allen, T. D., Poelmans, S. A. Y., Lapierre, L. M., Cooper, C. L., O'Driscoll,
M., Sanchez, J. I., Abarca, N., Alexandrova, M., Beham, B., Brough, P., Ferreiro, P.,
Fraile, G., Lu, C.-Q., & Lu, L. 2007. Cross-national differences in relationships of
work demands, job satisfaction, and turnover intentions with work-family conflict.
Personnel Psychology, 60(4): 805.
Staines, G. L. 1980. Spillover versus compensation: A review of the literature on the
relationship between work and non work. Human Relations, 33: 111-129.
Steel, P. 2002. The measurement and nature of procrastination: University of Minnesota,
Minneapolis.
Steel, P. 2007. The nature of procrastination. Psychological Bulletin, 133(1): 65-94.
Steel, P. 2010a. Arousal, avoidance, and decisional procrastinators: Do they exist?
Personality and Individual Differences, 48: 926-934.
228
Steel, P. 2010b. The procrastination equation: How to stop putting things off and start
getting stuff done: Random House of Canada.
Steiger, J. H. 1990. Structural model evaluation and modification: An interval estimation
approach. Multivariate Behavioral Research, 25(2): 173.
Sturges, J., & Guest, D. 2004. Working to live or living to work? Work/life balance early in
the career. Human Resource Management Journal, 14(4): 5.
Sumer, H. C., & Knight, P. A. 2001. How do people with different attachment styles
balance work and family? A personality perspective on work-family linkage.
Journal of Applied Psychology, 86(4): 653.
Sweet, S., & Moen, P. 2006. Advancing a career focus on work and family: Insights from
the life course perspective. In M. Pitt-Catsouphes, E. E. Kossek, & S. A. Sweet
(Eds.), The work and family handbook: Multi-disciplinary perspectives, methods,
and approaches: 189–208. Mahwah, NJ: Erlbaum.
Taylor, S., & Todd, P. A. 1995. Understanding information technology usage: A test of
competing models. Information Systems Research, 6(2): 144.
The Economist. 2006. A Survey of Telecoms Convergence, The Economist: 1-20.
Totten, J. W., Lipscomb, T. J., Cook, R. A., & Lesch, W. 2005. General Patterns of Cell
Phone Usage Among College Students: A Four-State Study. Services Marketing
Quarterly, 26(3): 13.
Tsikriktsis, N. 2005. A review of techniques for treating missing data in OM survey
research. Journal of Operations Management, 24(1): 53-62.

229
Turel, O., Serenko, A., & Bontis, N. 2008. Blackberry addiction: Symptons and outcomes.
AMCIS 2008 Proceedings. Retrieved from http://aisel.aisnet.org/amcis2008/73
UCLA Academic Technology Services. 2010. SPSS FAQ: How can I compare regression
coefficients between two groups? November 2010, Retrieved from
http://www.ats.ucla.edu/stat/spss/faq/compreg2.htm
Ullmann, E. 1997. Close to the Machine: Technophilia and Its Discontents. San Francisco:
City Lights Books.
United States Department of Labor. 2005. Work at home in 2004. Accessed on November
2008, September 22, 2005 Retrieved from
http://www.bls.gov/news.release/homey.nr0.htm
USDL. 2005. Computer and internet use at work summary. United States Department of
Labor. Accessed on September, August 10, 2005, Retrieved from
http://www.bls.gov/news.release/ciuaw.nr0.htm
Venkatesh, V., & Brown, S. A. 2001. A longitudinal investigation of personal computers in
homes: Adoption determinants and emerging challenges. MIS Quarterly, 25(1): 71-
102.
Venkatesh, V., & Davis, F. D. 2000. A Theoretical Extension of the Technology Acceptance
Model: Four Longitudinal Field Studies. Management Science, 46(2): 186-204.
Venkatesh, V., Morris, M. G., Davis, G. B., & Davis., F. D. 2003. User acceptance of
information technology: Toward a unified view MIS Quarterly, 27(3): 425-478. .
Ventura, M. 1995. The age of interruption. Family Therapy Networker, 19: 19–31.
230
Vestby, G. M. 1996. Technologies of autonomy?: Parenthood in contemporary Modern
times. In M. Lie, & K. H. Sørensen (Eds.), Making technologies our own:
Domesticating technology into everyday life: 65–90. Oslo: Scandinavian University
Press.
Voydanoff, P. 2001. Incorporating community into work and family research: A review of
basic relationships. Human Relations, 54(12): 1609.
Walker, K. E., & Woods, M. E. 1976. Time use: A measure of household production of
family goods and services. Washington, DC: American Home Economic
Association.
Waters, R. 2005. The cure for BlackBerry addiction is in your own hands Financial Times,
London, UK. December 3, Retrieved from
http://proquest.umi.com/pqdweb?did=936398561&Fmt=7&clientId=12303&RQT=3
09&VName=PQD
Wayne, J. H., Grzywacz, J. G., Carlson, D. S., & Kacmar, K. M. 2007. Work-family
facilitation: A theoretical explanation and model of primary antecedents and
consequences. Human Resource Management Review, 17(1): 63-76.
Wei, R., & Leung, L. 1999. Blurring public and private behaviors in public space: policy
challenges in the use and improper use of the cell phone. Telematics and
Informatics, 16(1-2): 11-26.
Wei, R., & Ven-Hwei, L. 2006. Staying connected while on the move: Cell phone use and
social connectedness. New Media & Society, 8(1): 53-72.
231
Whitney, L. 2010. Cell phone, smartphone sales surge. cnet News. October, 2010,
Retrieved from http://news.cnet.com/8301-1035_3-20005359-94.html
Williams, L. J., Hartman, N., & Cavazotte, F. 2010. Method variance and marker variables:
A review and comprehensive CFA marker technique. Organizational Research
Methods.
Willmott, P. 1971. Family, work and leisure conflicts among male employees: Some
preliminary findings. Human Relations, 24: 575-584.
Yoffie, D. B. 1996. Competing in the age of digital convergence. California Management
Review, 38(4).
Zedeck, S., & Mosier, K. 1990. Work in the family and employing organization. American
Psychologist, 45: 240-251.
Zellner, A., & Theil, H. 1962. Three-stage least squares: Simultaneous estimation of
simultaneous equations. Econometrica, 30(1): 54-78.
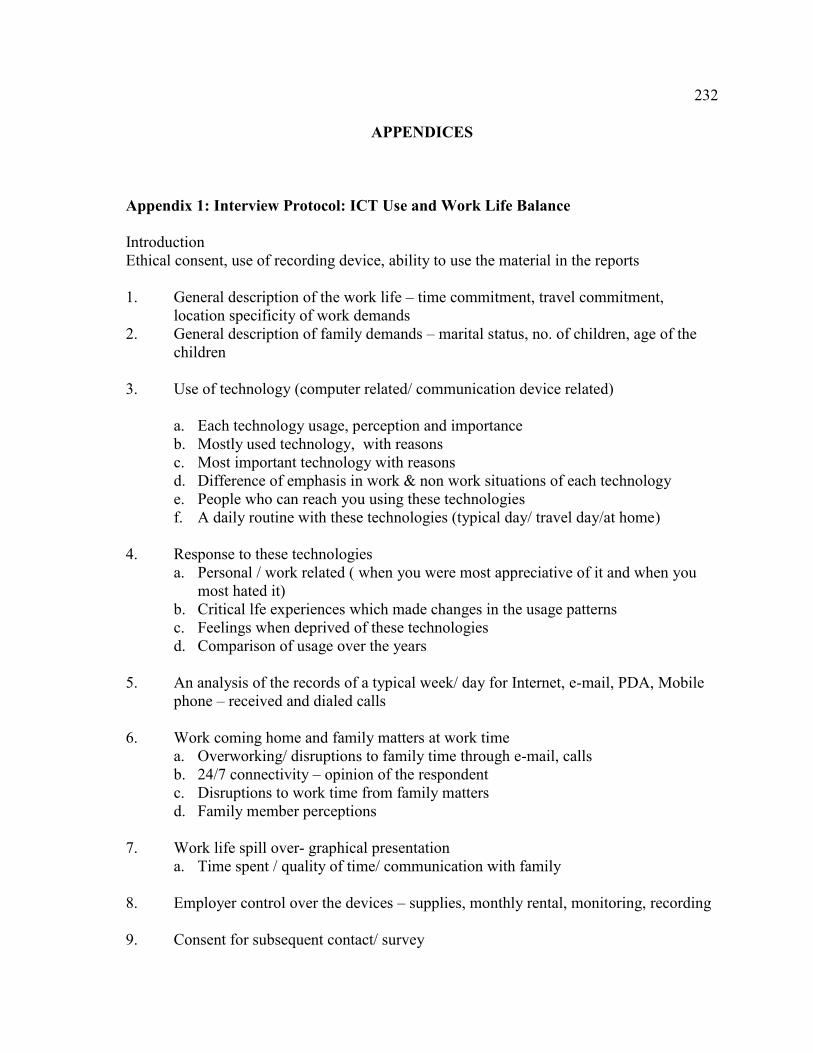
232
APPENDICES
Appendix 1: Interview Protocol: ICT Use and Work Life Balance
Introduction
Ethical consent, use of recording device, ability to use the material in the reports
1. General description of the work life – time commitment, travel commitment,
location specificity of work demands
2. General description of family demands – marital status, no. of children, age of the
children
3. Use of technology (computer related/ communication device related)
a. Each technology usage, perception and importance
b. Mostly used technology, with reasons
c. Most important technology with reasons
d. Difference of emphasis in work & non work situations of each technology
e. People who can reach you using these technologies
f. A daily routine with these technologies (typical day/ travel day/at home)
4. Response to these technologies
a. Personal / work related ( when you were most appreciative of it and when you
most hated it)
b. Critical lfe experiences which made changes in the usage patterns
c. Feelings when deprived of these technologies
d. Comparison of usage over the years
5. An analysis of the records of a typical week/ day for Internet, e-mail, PDA, Mobile
phone – received and dialed calls
6. Work coming home and family matters at work time
a. Overworking/ disruptions to family time through e-mail, calls
b. 24/7 connectivity – opinion of the respondent
c. Disruptions to work time from family matters
d. Family member perceptions
7. Work life spill over- graphical presentation
a. Time spent / quality of time/ communication with family
8. Employer control over the devices – supplies, monthly rental, monitoring, recording
9. Consent for subsequent contact/ survey

233
Appendix 2: A Copy of the Web-Based Survey

234
Survey starts on the next page.
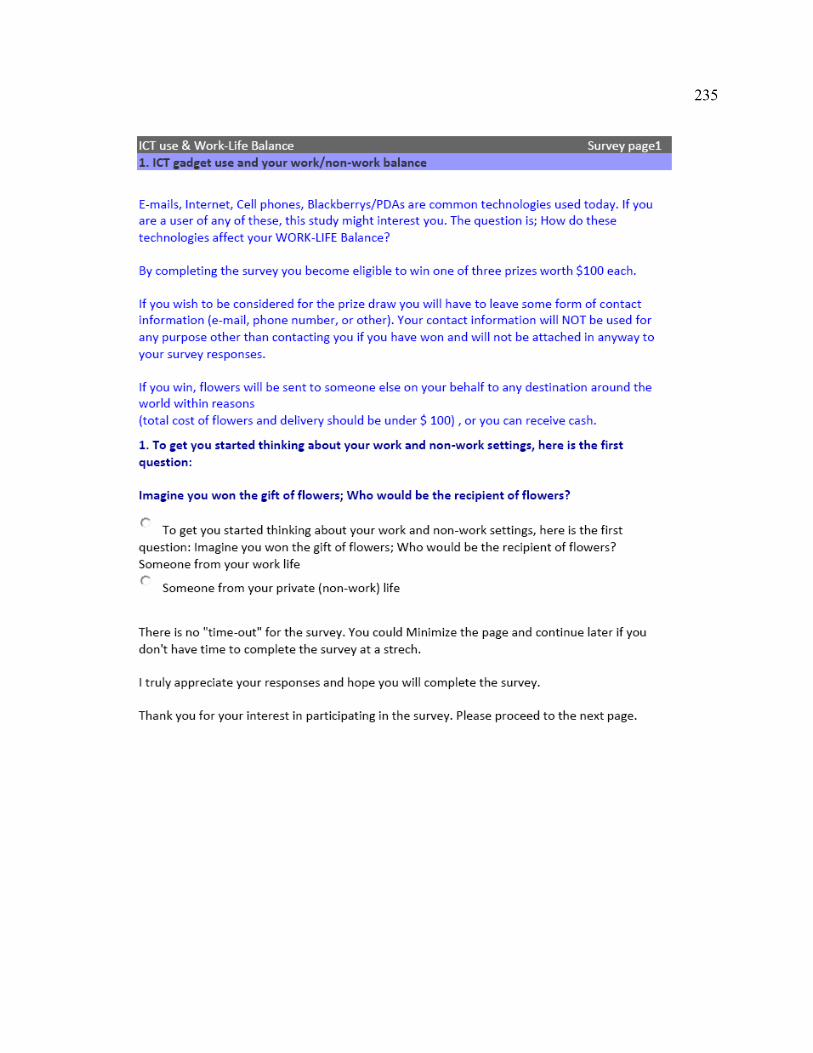
235

236

237
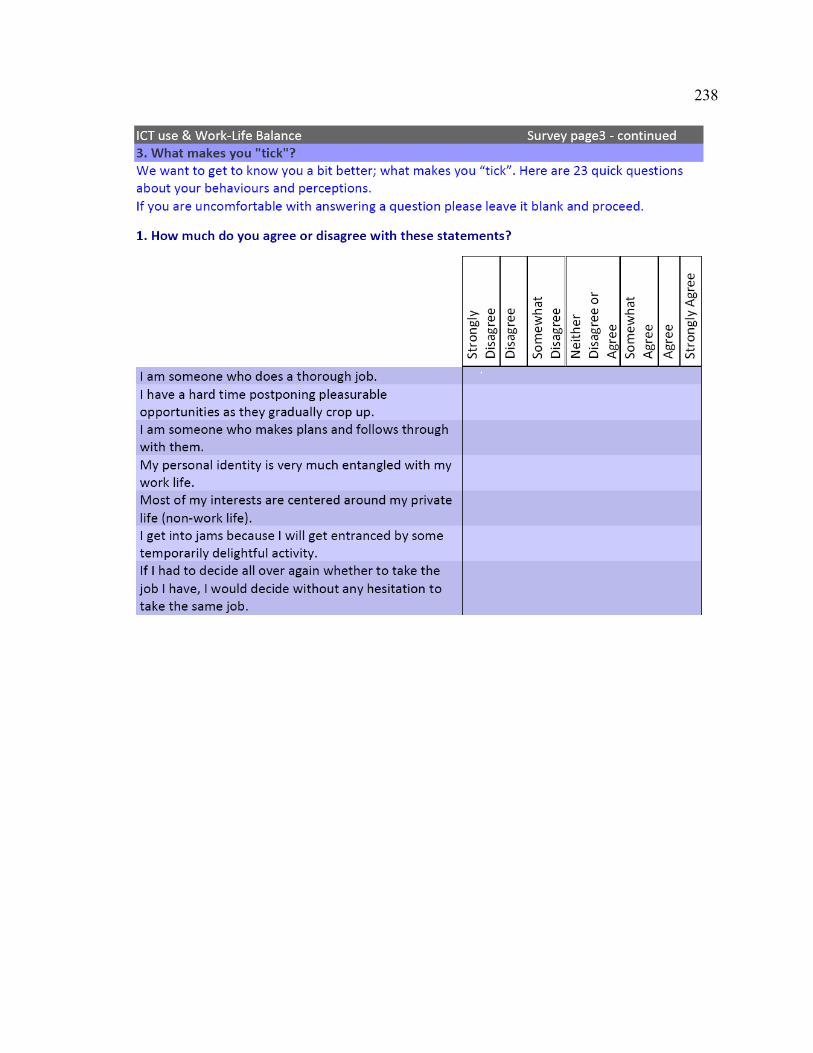
238

239

240
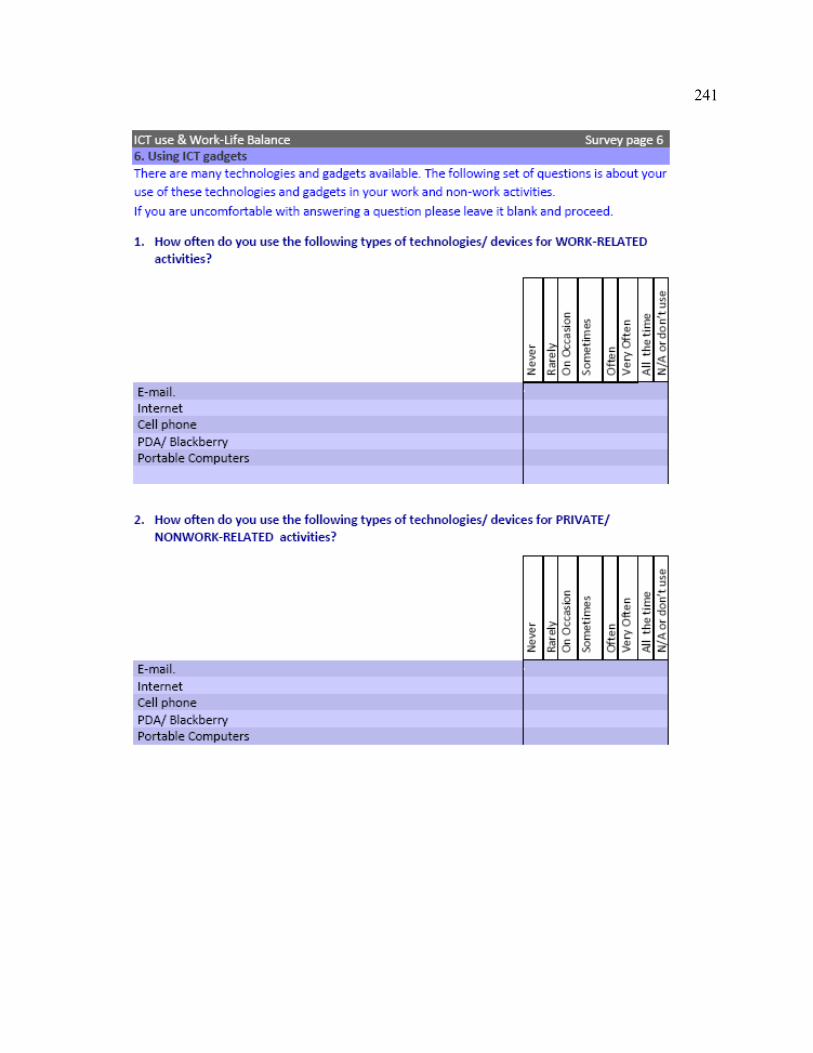
241

242

243
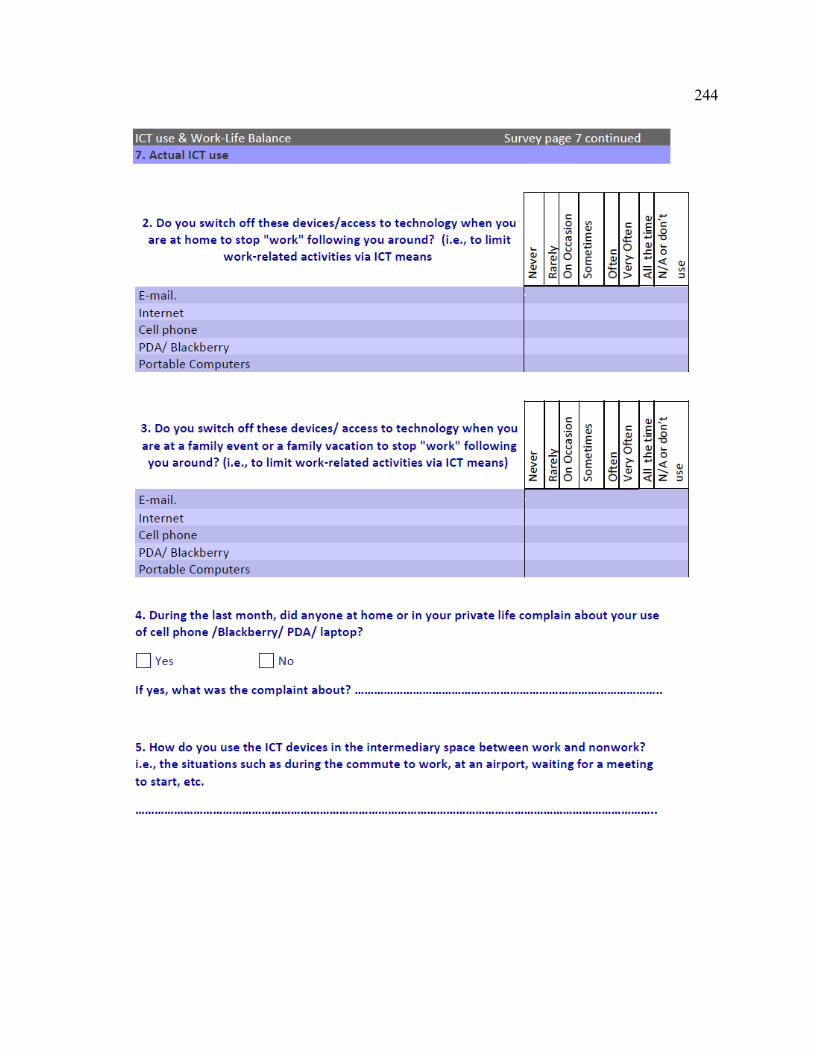
244

245

246
END OF SURVEY

247
Appendix 3: Ethics Committee Approval

248


