

BW3Session6/8/1611:30AM
End-to-EndQualityApproach:14LevelsofTesting
Presentedby:
AdrianThibodeau
Standard&PoorsRatingServices
Broughttoyouby:
350CorporateWay,Suite400,OrangePark,FL32073888---268---8770··[email protected]://www.techwell.com/

AdrianThibodeauStandard&PoorsRatingServicesVicepresidentAdrianThibodeauhasledtheQA&MetricsteamatStandard&Poor'sRatingsServicessince2011andheldnumerousotherrolessince2005.Forthepastfouryears,AdrianhasledtheRatingsQAdepartmentinanumberoftransformationalinitiatives:adoptionoftheTMMiOperationalMaturityModel,revisionofitsautomationframework,ashifttometric-drivenreporting,andtheexpansionoftheteam'squalityleadershipintostaticcodeanalysisanddata.

5/11/2016
1
End-to-End Quality Approach: 14 Levels of TestingBetter Software Conference 2016
June 8, 2016
Chintan PandyaSenior Director, QA & Metrics
Adrian ThibodeauVice President, QA & Metrics
S&P Global Ratings Services / IT
Copyright © 2016 by S&P Global. All rights reserved.
• Intro and Overview of S&P Global Ratings
• Lowering the Cost of Quality
• 14 Levels of Testing
• Wrap-Up
Agenda
2

5/11/2016
2
S&P Global Ratings: Global Reach
• In business for 150+ years
• Provides global reach and local knowledge with an office network spanning 26 countries
• Approximately 1,400 credit analysts covering 125+ countries
• More than 1 million credit ratings outstanding
• More than $4.3 trillion in new debt issuances in 2014
• S&P Global Ratings analytical teams provide high-quality analysis, data and research across government, corporate, financial sector and structured finance entities & securities.
3
• A discrete organization within S&P Global Ratings’ IT group, providing direct support to distinct portfolios of application development
• Represents ~6% of IO full-time staff & ~18% of project-based consulting resources
• Overall, Ratings IT leverages a primarily off-shore consultant contract model
• Agile/scrum model, with some waterfall on legacy projects- Sprint duration varies from 1-3 weeks
- Practice maturity varies greatly by the project and experience of the team
S&P Global Ratings: QA & Metrics
4

5/11/2016
3
Lowering the Cost of Quality
5
Early Defect Prevention
6
• Our program seeks to improve our processes around quality and the early detection of defects. It is not a guarantee that Production defects won’t sometimes occur.
All code, to all environments:
• IDE to Dev
• Dev to Sys Integration
• Sys Integration to QA
• QA to E2E/UAT
• UAT to Prod
Dev / IDE
Sys Int
QA
UAT
Prod
No defects
”
”
”

5/11/2016
4
End-to-End Quality Approach
7
Quality Requirements Creation and
Story Verification
12 Levels of ‘Build’ Testing
Code Deployment &
Production Verification
14 Levels of Quality…
• Organization-wide accountability to:
• Our standards
• Our process
• Our users
• Our peers
• End-state quality – reduce Production defects
• Embrace transparency, improve understanding, and opportunities for improving quality
• Manage the accumulation of technical and business debt, help reduce maintenance costs
• Quality early and in every step of our process, and a commitment not to pass poor quality on within our SDLC….an outcome-focused orientation
Why It Matters
8

5/11/2016
5
The Costs Add Up:• Risk to project delivery timelines from re-work or unexpected failures
• KTLO support costs increase across IT and project budgets fall short
• Velocity of teams slows down
• Creativity and innovation hampered
• IT is less agile to delivering business values
• Business users are frustrated by delivery delays, outages, and Production issues
Cost of Quality
9
Source: Boehm, Barry and Philip N. Papacco. ‘Understanding and Controlling Software Costs,’ IEEE Transactions on Software Engineering, v. 14, no.10,
October 1988, pp. 1262-1477
• An assessment based on the known relationship that defects found later in the SDLC (e.g., Prod deployment) cost an organization more than those found earlier.
• Weighting factors to the types of defect tickets raised
• Compare the ratio of tickets found in lower environments vs Production, identifying the “escaped” effort
• This helps identify the areas & cost (lost effort) of poor early quality
Illustrative Example:
Cost of Quality Calculation
10
Tickets
Environment Data TrainingCoding Enhancement
DDP – 97% DDP – 28% DDP – 5%DDP – 97% DDP – 77%
Volume – 28% Volume – 65% Volume – 22%Volume ‐ 14% Volume – 9%
86% 7% 2%81% 80%28% 65% 22%14% 9%
Effort Contained
Cost of Rework
Ticket Volume %
Defect Detection %
Defect Detection % (DDP) = [(Total # of Defects found pre-Prod) / (Total # of Defects found pre-Prod) + (Total # of Defects found in Prod)] * 100

5/11/2016
6
• Improved Quality delivered to Production: Increased confidence in Production quality, reduction of re-work
• Early Awareness of Quality Issues: Increased transparency throughout the SDLC of quality levels
• Repeatable / Transparent Quality Process: Steps towards the enablement of DevOps Processes & Tools
• Alignment with our vendors: S&P Global Ratings App Dev & Testing Standards for vendor contract and quality management
14 Levels of Testing: Target Outcomes
11
• Beyond just formal test execution, establish quality accountability
• Encourage high quality early in the SDLC, govern formal testing levels
• In the overall quality process, establish:- Governance
- Transparency
- Traceability
- Confirmation
The Role of QA Across the 14 Levels
12

5/11/2016
7
14 Levels of Testing
13
14 Levels of Testing
14
Individual Development Environment
(IDE)
Unit Testing
Peer Code Review
Static Code Review
Over the Shoulder Testing
Dev
Tech Lead Code Review
Continuous Integration
testing (including Security Testing)
System Integration
Functional Testing
Story Acceptance Testing
QA
Functional Regression
Testing
Pre-Prod / UAT
User Acceptance Testing
End 2 End (RRG) Testing
App Scan
Quality Requirements Creation & Story Verification
Quality Code Deployment & Production Verification

5/11/2016
8
14 Levels: Execution
15
Test Level
Test Target EnvironmentAccountable Owner /
Participants
1Quality Requirements Creation & Story Verification
Sprint Planning Dev / QA / BA / PO / SMEs
2 Unit Testing Individual Development Environment (IDE)
Dev
3 Peer Code Review (pre-commit) IDE Dev
4 Over the shoulder Testing IDE Dev / QA
5 Static Code Review IDE Dev
6 Tech Lead Code Review (Post commit) Development Dev
7 Continuous Code Integration Testing Development ISG / QA / Dev
8 Functional Testing System Integration QA
9 Story Acceptance Testing System Integration Product Owner (PO)
10 Functional Regression Testing QA QA
11 End-to-End Testing (RRG) End-to-End QA
12 User Acceptance Testing UAT Stakeholders / Users
13 App Scan Pre-Production DM
14 Code Deployment & Production Verification Production QA / Ops / SMEs
Levels 1-7
16
Individual Development Environment
(IDE)
Unit Testing
Peer Code Review
Static Code Review
Over the Shoulder Testing
Dev
Tech Lead Code Review
Continuous Integration
testing (including Security Testing)
System Integration
Functional Testing
Story Acceptance Testing
QA
Functional Regression
Testing
Pre-Prod / UAT
User Acceptance Testing
End 2 End (RRG) Testing
App Scan
Quality Requirements Creation & Story Verification
Quality Code Deployment & Production Verification

5/11/2016
9
Level 1: Requirements
17
Quality Requirements Creation & Story Verification
Common Understanding:
• Requirements
• Impact
• Scope
• Data
• Architecture
• Solution
• SMEs
Business-Value:
• Who has requested?
• Who will use?
• How will they use it?
• Who will accept?
• Who will take part in UAT?
Risk-Analysis:
• What are the known risks of this platform?
• What are the risks of this change?
• What do we need to test?
• How will we deliver to target quality?
Quality Requirements Development and Story Verification
18
Centralized Requirements
‐ Traceable & Verifiable
- Unambiguous
- Consistent & Complete
- Prioritized
- Scope
Impact Assessment
- Architecture
- Interdependent Apps
- Data
- RRG Criteria
Project Scope & Business Value- What is the change being made?
- What value is being delivered & for whom?
-How will we know that we succeeded?
- What are our quality criteria?
Knowledgeable SMEs & Involve the Right Teams
- Are all teams involved that need to be?
- Are the SMEs informed of impact?
- Is there agreement on the approach?
Common Understanding
• Plan before we build, and ensure everyone has a common understanding
• Plan for quality early, raise awareness of risks, estimate appropriately

5/11/2016
10
Levels 2-5: IDE
19
Individual Development Environment
(IDE)
Unit Testing
Peer Code Review
Static Code Review
Over the Shoulder Testing
• Defined standard for Unit Test code coverage and methods on new code
• Commitment towards review and coverage targets for legacy code across all apps
• Defined process for Development peer code review
• Designated peer review rosters maintained by vendors and managers
• Enablement of Static Code Unit Test Code coverage scanning and reporting
• Creation of Static Code rulesets to enforce coding best-practices
• Early engagement between Development and QA to review complex requirements and test cases
• BA engagement and sign-off as required, eliminate Dev/QA requirement assumptions
Levels 6-7: Development
20
Dev • Defined process for Development Tech Lead / SME code review and sign-off
• Designated peer review rosters maintained by vendors and managers
• Review compliance with ‘Build’ process SOPs
• Automated testing of critical integration paths
• Web Services testing
• Mandatory Static Code scanning of code repository, ‘Critical’ defects cannot pass: Security, Performance, Code-Syntax rules

5/11/2016
11
Levels 1-7 Stage Gates & Measurement
21
Test Level
Test Measurement Goal
1Quality Requirements Creation & Story Verification
Stories w/ Risk Score Assigned• Risk Score assigned for 100% of
stories
2 Unit Testing Unit Test Coverage %• New Code: 100%• Legacy Code: based on targeted
progression plan
3 Peer Code Review (pre-commit) % Peer Review Coverage• 100% of stories reviewed
4 Over the shoulder TestingConfirmation from Dev & QA of occurrence for High Risk stories
• 100% coverage of High Risk Stories• ‘0’ open ‘Requirement Gap/Missing
Requirement’ Defects
5 Static Code Review % of builds scanned under SCA• ‘0’ Critical violations: Security or
Performance
6 Tech Lead Code Review (Post commit)% Tech Lead Review Coverage • Minimum: 100% review of High &
Medium Risk Stories
7 Continuous Code Integration Testing Open Integration or SCA Defects • ‘0’ open Critical or High Defects
Levels 8-13: Formal QA
22
Individual Development Environment
(IDE)
Unit Testing
Peer Code Review
Static Code Review
Over the Shoulder Testing
Dev
Tech Lead Code Review
Continuous Integration
testing (including Security Testing)
System Integration
Functional Testing
Story Acceptance Testing
QA
Functional Regression
Testing
Pre-Prod / UAT
User Acceptance Testing
End 2 End (RRG) Testing
App Scan
Quality Requirements Creation & Story Verification
Quality Code Deployment & Production Verification

5/11/2016
12
QA Governance and Monitoring
23
QA Portal – S&P QA developed, web-based, workflow application to help govern and monitor ZDP and formal QA testing.
Project Profile
Release Management
Test Phases
Checklist
QA Artifacts
QA Go / No-Go
• Resource Management• Technology mapping• Nature of project
• Integrated app impact analysis
• Enforce standard test structure in release management tool
• Release scope• Compliance check
• Checklist for Test phase• Test planning, Design,
Execution, UAT, E2E and closing
• Entry and exist criteria verification
• Live defect summary
• Integration with central repository
• Peer review / signoff tracker• Process Audit reports
• QA recommendation• Quality gates by Env• ZDP: 8-12 monitoring• Code Build governance
• Levels 2-7Reporting & Metrics
Project Name
Sprint 1
Sprint 2
QA Governance and Monitoring
Project Profile
Release Management
Release June 5, 2016
Sprint N
Release Management
Requirement
Test Case Design
Test Execution
Bug Tracking
Project Name
Release June 5, 2016
Sprint 1
Sprint 2
Sprint N
User stories
QA Portal Test Management Tool
Release Management
Requirement
Test Case Design
Test Execution
Bug Tracking
Kanban Items
QA Artifacts management
24

5/11/2016
13
QA Governance and Monitoring
Release Management
Test phases checklist
Test PlanningTest
DesigningTest
Execution
Go TO QA
/
Conditional Go To QA
QA Recommenda-
tion
Test Execution
Go TO UAT
/
Conditional Go To UAT
UAT Testing
Go TO Prod
/
Conditional Go To Prod
E2E Testing
Test Planning
UAT Planning
Prod Verification
Signoff
Production Verification
Production verification checklist
Reporting & Metrics
25
Story Certification (Functional Testing)
Test Planning
Test Designing
Test Execution
Go TO QA
/
Conditional Go To QA
Test Planning
• Test Plan creation (Automated process)
• Peer Review• Requirement review• Impact assessment• Risk assessment• Test planning checklist
Test Designing
• Test case creation • Peer Review• Requirement traceability• Impact assessment• Test designing checklist• TDD (Over the shoulder
testing)
Test Execution
• Story certification• Requirement traceability• SI environment set up• Test data creation• Test execution checklist• ZDP check gate (QA
Recommendation)
Levels 4-5 Levels 8-9Level 1
Release Management
Test phases checklist
26
5/11/2016
14
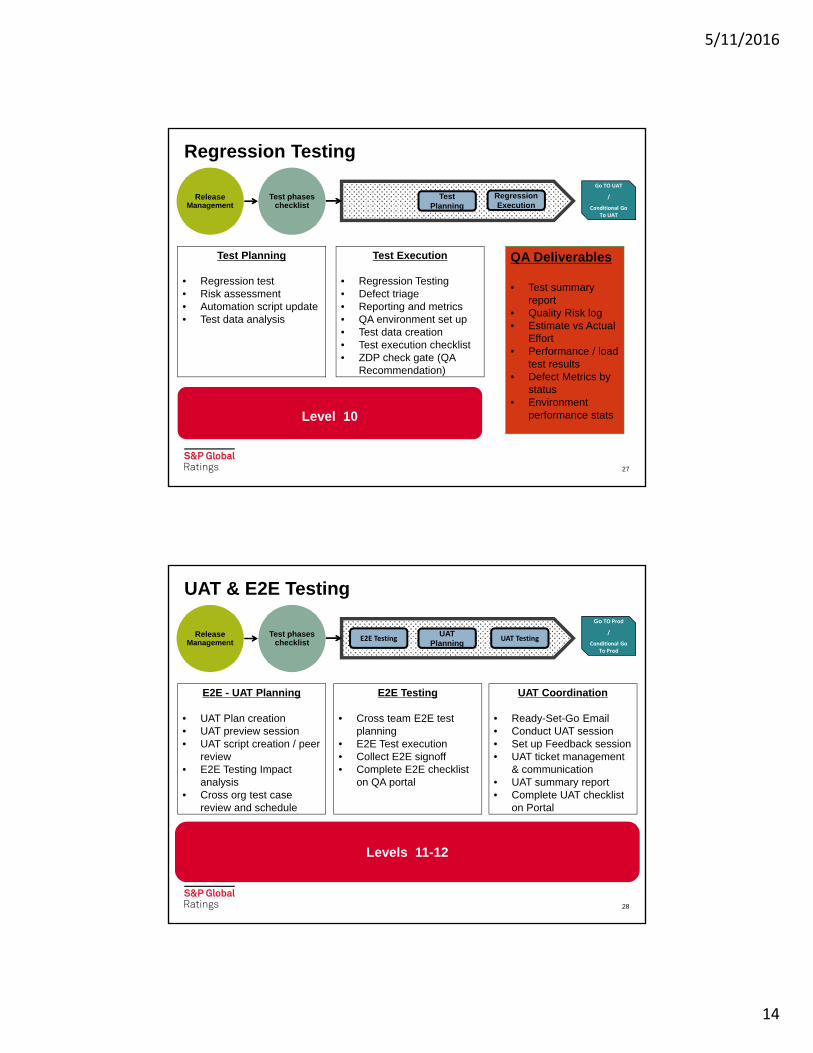
Regression Testing
Test Planning
Regression Execution
Go TO UAT
/
Conditional Go To UAT
Test Planning
• Regression test• Risk assessment• Automation script update• Test data analysis
Test Execution
• Regression Testing• Defect triage• Reporting and metrics• QA environment set up• Test data creation• Test execution checklist• ZDP check gate (QA
Recommendation)
Level 10
QA Deliverables
• Test summary report
• Quality Risk log• Estimate vs Actual
Effort• Performance / load
test results• Defect Metrics by
status• Environment
performance stats
Release Management
Test phases checklist
27
Go TO Prod
/
Conditional Go To Prod
UAT & E2E Testing
UAT Planning
E2E - UAT Planning
• UAT Plan creation• UAT preview session• UAT script creation / peer
review• E2E Testing Impact
analysis• Cross org test case
review and schedule
UAT Coordination
• Ready-Set-Go Email• Conduct UAT session• Set up Feedback session• UAT ticket management
& communication• UAT summary report• Complete UAT checklist
on Portal
Levels 11-12
E2E Testing
• Cross team E2E test planning
• E2E Test execution• Collect E2E signoff• Complete E2E checklist
on QA portal
UAT TestingE2E TestingRelease Management
Test phases checklist
28

5/11/2016
15
QA Portal
12
3 4
29
QA Portal: QA Recommendations
30

5/11/2016
16
Levels 8-13 Stage Gates & Measurement
31
Test Level
Test Measurement Goal
8 Functional Testing Functional Defect Counts• ‘0’ open defects• Rejection Rate <5%• Re-open Rate <10%
9 Story Acceptance Testing Product Owner sign-off of stories• 100% sign-off• ‘0’ Enhancements from
missed requirements
10 Functional Regression Testing Regression Defect Counts
• ‘0’ open defects• Rejection Rate <5%• Re-open Rate <10%• ‘0’ defect ‘Deferrals’
11 User Acceptance Testing UAT Defect Counts• ‘0’ open defects• ‘0’ Enhancements from
missed requirements
12 End-to-End (RRG) Testing E2E Defect Counts • ‘0’ open defects
13 App ScanApp Scan Defect Counts
• ‘0’ open defects
Level 14: Deployment Verification
32
Individual Development Environment
(IDE)
Unit Testing
Peer Code Review
Static Code Review
Over the Shoulder Testing
Dev
Tech Lead Code Review
Continuous Integration
testing (including Security Testing)
System Integration
Functional Testing
Story Acceptance Testing
QA
Functional Regression
Testing
Pre-Prod / UAT
User Acceptance Testing
End-2-End (RRG) Testing
App Scan
Quality Requirements Creation & Story Verification
Quality Code Deployment & Production Verification

5/11/2016
17
Code Deployment & Production Verification
33
Build Management
• Adherence to Build standards and processes, DevOps where enabled• Maker-Checker: confirm the build for release is the same as has been
certified• Confirmation: ZDP levels adherence, Build ID, Build Master, etc..
Change Management
• Adherence to Change Management processes: Change ID#, Build ID• Follow standard Deployment procedures and validations• Be prepared with a roll-back plan
Production Verification
• Document all planned activities in Production Control Docs• Adhere to Production environment access policies and restrictions• Engage business users for real-world scenario / ‘write’ validations• Report any deviations from lower-environment certification
• In‐alignment with mandatory Build‐QA‐Deploy procedures:
Production Verification
Go TO UAT
/
Conditional Go To UAT
Test Planning
• Create Prod verification plan
• Get approval on prod control document
• Break glass approval
Prod Verification
• Perform Prod verification• Story certification• Send notification to
project team• Complete Prod
verification checklist
Level 14
Production Verification
Verification checklist
Release Management
Test phases checklist
34

5/11/2016
18
Level 14 Stage Gates & Measurement
35
Test Level
Test Measurement Goal
14Quality Code Deployment & Production Verification
• Post deployment defects• Successful deployment
process
• ‘0’ post deployment defects• Incident free deployment
Wrap-Up
36

5/11/2016
19
• 7 levels (4, 8-12, 14) fully deployed since Q3 2015, remaining being revised and strengthened: training, tool on-boarding, and documented standards and procedures
Wrap-Up: Progress-to-Date
37
65% Aging Defect Backlog
53% Production “Bug” ticket Volume
25% Defect Discovery in all QA Test Phases
3% Existing Issue identification in Functional testing vs Regression or UAT
6% Build Configuration Defects
Early Defect Detection
11% Coding Issues found in Functional testing vs Regression or UAT
Q3 2015 – Q1 2016
‘14 Levels of Testing’:
• Quality focus needs to be owned by all IT disciplines and a collaborative conversation with your business
• Testing for quality begins from requirements and Development efforts and collaborative test planning
• Understand your risks, plan for quality early
• How many “Levels” is dependent on your organization
Wrap-Up: Reducing Cost of Quality
38

5/11/2016
20
Process & Engagement: • Defined and repeatable operational policies and procedures (SOPs),
across IT disciplines
• Strive for standardization, but allow for exceptions when appropriate
• Automate where possible, and when ready
• Communicate your expectations: Document and communicate your Development and Testing standards to your vendors
• Process metrics and reporting to facilitate the identification, assignment, and remediation of process gaps; KPIs that inform of opportunity, not assign blame
Wrap-Up: Reducing Cost of Quality
39
Accountability and Empowerment:• Understand your ‘Cost of Quality’ equation
• All IT staff need to be trained on policies and procedures, and empowered to say ‘no-go’ to poor quality
• Foster transparency into the state of quality and progress within the testing process;
• Continuous Improvement mindset: Can we value or improve what we don’t measure?
Wrap-Up: Reducing Cost of Quality
40

5/11/2016
21
Permission to reprint or distribute any content from this presentation requires the prior written approval ofS&P Global Ratings. Copyright © 2016 by Standard & Poor’s Financial Services LLC. All rights reserved.
Thank You
Chintan PandyaSr. Director – QA & [email protected]
Adrian ThibodeauVP – QA & [email protected]
Copyright © 2016 by Standard & Poor’s Financial Services LLC. All rights reserved.
No content (including ratings, credit-related analyses and data, valuations, model, software or other application or output therefrom) or any part thereof (Content) may be modified, reverse engineered, reproduced or distributed in any form by any means, or stored in a database or retrieval system, without the prior written permission of Standard & Poor’s Financial Services LLC or its affiliates (collectively, S&P). The Content shall not be used for any unlawful or unauthorized purposes. S&P and any third-party providers, as well as their directors, officers, shareholders, employees or agents (collectively S&P Parties) do not guarantee the accuracy, completeness, timeliness or availability of the Content. S&P Parties are not responsible for any errors or omissions (negligent or otherwise), regardless of the cause, for the results obtained from the use of the Content, or for the security or maintenance of any data input by the user. The Content is provided on an “as is” basis. S&P PARTIES DISCLAIM ANY AND ALL EXPRESS OR IMPLIED WARRANTIES, INCLUDING, BUT NOT LIMITED TO, ANY WARRANTIES OF MERCHANTABILITY OR FITNESS FOR A PARTICULAR PURPOSE OR USE, FREEDOM FROM BUGS, SOFTWARE ERRORS OR DEFECTS, THAT THE CONTENT’S FUNCTIONING WILL BE UNINTERRUPTED OR THAT THE CONTENT WILL OPERATE WITH ANY SOFTWARE OR HARDWARE CONFIGURATION. In no event shall S&P Parties be liable to any party for any direct, indirect, incidental, exemplary, compensatory, punitive, special or consequential damages, costs, expenses, legal fees, or losses (including, without limitation, lost income or lost profits and opportunity costs or losses caused by negligence) in connection with any use of the Content even if advised of the possibility of such damages.
Credit-related and other analyses, including ratings, and statements in the Content are statements of opinion as of the date they are expressed and not statements of fact. S&P’s opinions, analyses and rating acknowledgment decisions (described below) are not recommendations to purchase, hold, or sell any securities or to make any investment decisions, and do not address the suitability of any security. S&P assumes no obligation to update the Content following publication in any form or format. The Content should not be relied on and is not a substitute for the skill, judgment and experience of the user, its management, employees, advisors and/or clients when making investment and other business decisions. S&P does not act as a fiduciary or an investment advisor except where registered as such. While S&P has obtained information from sources it believes to be reliable, S&P does not perform an audit and undertakes no duty of due diligence or independent verification of any information it receives.
To the extent that regulatory authorities allow a rating agency to acknowledge in one jurisdiction a rating issued in another jurisdiction for certain regulatory purposes, S&P reserves the right to assign, withdraw or suspend such acknowledgement at any time and in its sole discretion. S&P Parties disclaim any duty whatsoever arising out of the assignment, withdrawal or suspension of an acknowledgment as well as any liability for any damage alleged to have been suffered on account thereof.
S&P keeps certain activities of its business units separate from each other in order to preserve the independence and objectivity of their respective activities. As a result, certain business units of S&P may have information that is not available to other S&P business units. S&P has established policies and procedures to maintain the confidentiality of certain non-public information received in connection with each analytical process.
S&P may receive compensation for its ratings and certain analyses, normally from issuers or underwriters of securities or from obligors. S&P reserves the right to disseminate its opinions and analyses. S&P's public ratings and analyses are made available on its Web sites, www.standardandpoors.com (free of charge), and www.ratingsdirect.com and www.globalcreditportal.com (subscription), and may be distributed through other means, including via S&P publications and third-party redistributors. Additional information about our ratings fees is available at www.standardandpoors.com/usratingsfees.
AustraliaStandard & Poor's (Australia) Pty. Ltd. holds Australian financial services license number 337565 under the Corporations Act 2001. Standard & Poor’s credit ratings and related research are not intended for and must not be distributed to any person in Australia other than a wholesale client (as defined in Chapter 7 of the Corporations Act).
STANDARD & POOR’S, S&P and RATINGSDIRECT are registered trademarks of Standard & Poor’s Financial Services LLC.


