

ENERGY EFFICIENT RETROFIT MEASURESState-of-the-art and the renovation potential of Million program multi-storey buildings in Sweden
Anna Lindahl & Francesco Sacco
Master Thesis in Energy-efficient and Environmental BuildingsFaculty of Engineering | Lund University

Lund UniversityLund University, with eight faculties and a number of research centers and specialized in-stitutes, is the largest establishment for research and higher education in Scandinavia. The main part of the University is situated in the small city of Lund which has about 112 000 inhabitants. A number of departments for research and education are, however, located in Malmö and Helsingborg. Lund University was founded in 1666 and has today a total staff of 6 000 employees and 47 000 students attending 280 degree programs and 2 300 subject courses offered by 63 departments.
Master Program in Energy-efficient and Environmental Building DesignThis international program provides knowledge, skills and competencies within the area of energy-efficient and environmental building design in cold climates. The goal is to train highly skilled professionals, who will significantly contribute to and influence the design, building or renovation of energy-efficient buildings, taking into consideration the architec-ture and environment, the inhabitants’ behavior and needs, their health and comfort as well as the overall economy.
The degree project is the final part of the master program leading to a Master of Science (120 credits) in Energy-efficient and Environmental Buildings.
Examiner: Jouri Kanters (Energy and Building Design)Supervisor: Susanne Gosztonyi (Energy and Building Design), Linus Malmgren (Sveriges tekniska forskningsinstitut)
Keywords: Miljonprogram multi-family home, Energy efficient, Refurbishment, 2050 energy target, Renovation strategies, Building codes
Thesis: EEBD–16/03

3
Abstract
Households and services together account for 40% of the final energy consumption in
Europe. The goals set by the European Union are on the short run to reduce the greenhouse
gas emissions levels by 20% by 2020. The building sector has a largely untapped potential
for energy saving and a consistent percentage of the building stock has been built during the
post-war economic boom years is now in need of renovation. The goal of this thesis is to
demonstrate that it is possible to obtain energy savings far beyond the 2020 levels, namely
50% of the final energy consumption, when renovating a Miljonprogram multi-storey
residential building by using technologies available on the market. This study investigates
the current state-of-the-art measures for energy saving used during renovation of multi-
family buildings in Europe by analysing several refurbishment projects. Drivers for
renovating and barriers connected to the refurbishment process are also investigated. The
renovation measures are grouped in packages (such as the replacement of windows in
connection with the roof insulation), to be tested in the framework of different scenarios
(business as usual, upgrading of the envelope elements to the minimum BBR 22
requirements, major renovation) with a growing level of energy savings to reach the goal. A
reference building is presented and modelled to assess the impact of the proposed solution
packages from the different scenarios. It is demonstrated that it is possible to reach the
desired 50% reduction in energy consumption by upgrading the building envelope to the
minimum requirements provided by the BBR 22 and at the same time installing a supply
and exhaust mechanical ventilation system with an heat recovery efficiency of 85%.

4
Preface
This master thesis was carried out in cooperation with SP, Sveriges Tekniska
Forksningsinsitut, and represents the final project of the master degree in Energy-efficient
and Environmental Building Design at Lund University.
The work aims to get an insight into the renovation process and the current refurbishment
measures on the European market, to apply it to the renovation of a Miljonprogram
multifamily house in Lund to get a reduction in the final energy consumption of at least
50%.
We would like to give a special thanks to Linus Malmgren from SP, who has been our
external supervisor, for his participation in this project, with his enthusiastic discussions,
guidelines and advices.
Thanks to Lunds Kommunala Fastigheter AB, LKF, for providing us with the reference
building, drawings and input data, and their kindness and interest in our project.
We would also like to thank Niklas Uddenäs at Strusoft AB for providing us with VIP-
Energy licenses, giving us training in the programme, expert knowledge and great support
during the set-up of the case study.
We would also like to thank our Supervisor at Lund University, Susanne Gosztonyi, for all
the support and good guidance during this project. Thanks to the other professors at the
Lund University and the Division of Energy and Building design, for the knowledge and
inputs you have given us during those two years. A special thanks to Henrik Davidsson who
always has time to dedicate to us students.
A special thanks to our families, for supporting us throughout the years. Thank also to
Studentlund for providing us with the best time of our lives.
Lund, June 2016
/A&F
5
Table of content
Abstract ............................................................................................................. 3 Preface ............................................................................................................... 4 Table of content ................................................................................................. 5 1 Introduction ............................................................................................... 7
1.1 Background 7 1.2 Problem statement 7 1.3 Goal and scope 8
Research questions 8 Limitations 9
1.4 Methodology 9 Software used 10
1.5 Thesis outline 10 2 The European building stock vs. the Swedish building stock ................. 11
2.1 The European building stock 11 Age 11 Ownership 12 Type 14
2.2 The Swedish building stock 14 Age 15 Ownership 15 Building typology 16
2.3 The Swedish Miljonprogram and the present housing market 16 The Miljonprogram multi-storey buildings 17
2.4 Building requirements and characteristics from 1950 to 1970 19 Houses built during the 1950s 19 Houses built during the 1960s 19 Houses built during 1970-1975 20
2.5 Conclusions 20 3 Building regulations ................................................................................ 22
3.1 Types of regulations 22 Prescriptive regulations 22 Performance regulations 23
3.2 State of regulations in Europe 24 3.3 Building regulations in Sweden 24 3.4 Barriers 26 3.5 Future of building regulations 26 3.6 Conclusions 27
4 Renovation projects in Europe ................................................................ 29 4.1 Methodology 29 4.2 Project analysis 29 4.3 Why renovation? 32 4.4 Insights on renovation experience 34 4.5 The Swedish market 36 4.6 Conclusion 36
5 Renovation objects in Europe – State of the art ...................................... 38

6
5.1 Methodology 38 5.2 Classification of solutions 39
6 Case study ............................................................................................... 65 6.1 Method 65
Simulation software 65 The reference building 66
6.2 Results 71 6.3 Renovation scenarios result 71
7 Discussion ............................................................................................... 76 8 Conclusion ............................................................................................... 78 9 References ............................................................................................... 81
List of figures 93 List of tables 93
10 Appendix ................................................................................................. 95 10.1 Appendix A – VIP-Energy input data for references building 95
Appendix B1 - Section from East .................................................................. 102 Appendix B2 – Element structure ................................................................. 102 Appendix B3 – Inner walls ............................................................................ 103 Summary........................................................................................................ 104

7
1 Introduction
1.1 Background
As the effects of climate change become more tangible every year, the efforts towards a
low-carbon and energy efficient society demand intervention in every sector. Households
and services together account for 40% of the final energy consumption in the EU-28
(Eurostat, 2015). The building sector plays therefore a key role in cutting the carbon
emissions and win the challenges of the next decades. The goals set by the European Union
are on the short run to reduce the greenhouse gas emissions levels by 20% by 2020
(European Commission, 2015) and on the long run by 80-95% (European Commission,
2015), both compared to 1990 levels.
The building sector is the biggest energy consumer in the EU and has also the largest
potential for energy efficiency compared to the other sectors as industry and transport, yet it
is still “the largest untapped source of cost effective energy saving and CO2 reduction
potential within Europe” (BPIE, 2014). It is only in relatively recent times that this potential
has been recognized by the policymakers: In 2002 the European Parliament has issued the
Energy Performance Building Directive (EPBD) (European Parliament, 2002), which
required the member states to implement their building regulations and introduce an energy
certification system.
The European building stock expands slowly, at a rate of about 1% (BPIE, 2011) which is
also the current major renovation rate at the moment (IEA, 2013), with the aim of raising it
to at least 3% by 2020. Most of the building stock is in need of renovation: About 40% of
the residential buildings were built before 1960 and almost 84% are more than 20 years old
(IEA, 2012). This means that most of the buildings were built with no consideration to
energy efficiency and sustainability, and show also poor indoor comfort conditions and
decay of the building envelope and services. Many buildings built in the economic boom
years after WWII are now in need of a deep and comprehensive renovation: Since buildings
have typically long renovation cycles, of about 30 years for the envelope and 20 years for
the HVAC systems, it is therefore likely that there will be only one complete renovation
cycle of the building stock before 2050 (Ecofys, 2012). This means that there is probably
just one chance to do it right, or to fail.
1.2 Problem statement
While there is plenty regulations concerning the energy performance of buildings, which set
values and benchmarks to be attained by new and existing ones, there is a lack of specific
instructions on how to renovate to reach the desired conditions. Every project, due to its
characteristics, can be considered as a unicum but there is need for guidelines for each
category of building, classified according to age, climate zone and building type. The
renovation process is complex and gathers different actors and stakeholders. There is no
shortage of well-established renovation technologies on the market, but when it comes to
select the best fitting there is lack of a broad knowledge to guide the choice. Due to this
reason, the European Union is financing some research projects that aim at closing this

8
knowledge gap, such as UMBRELLA, E-RETROFIT-KIT, EASEE, RePublic_ZEB to cite
some. According to a survey conducted by Femenias (Femenias, et al., 2015), when it
comes to renovation in Sweden it is often more important to provide support during the
decision process in form of technical consultancy and tools rather than sole financial
support.
The knowledge and experience created by implementing innovative renovation processes
and solutions are not collected by authority to spread the good practice, creating confusion
and a need for clear guidelines to be followed during renovation. There is no shortage of
decision making tools but they are mostly intended for new buildings and have not been
widely accepted yet in renovation (Thuvander, et al., 2012).
1.3 Goal and scope
The goal of the thesis is to demonstrate that it is possible to obtain energy savings far
beyond the 2020 levels (20%), namely 50% of the final energy consumption, when
renovating a Miljoprogram multi-storey residential building by using well-established
refurbishment technologies available on today’s market (it should be noted though that the
20% is about the greenhouse gases emission, while the 50% considered in this thesis is
about the final energy consumption of the building) . The 50% is indicated by ASHRAE as
the first step to reach the net-zero building goal (ASHRAE, 2016).
The renovation technologies in this thesis are available for the European context, and special
focus is set on the northern climate. Since the goal is to renovate a building in Sweden: In
the state-of-the-art, nonetheless, technologies for warmer climates are also described. This
work is focused on the energy-saving measures, which means those that when implemented
will reduce the annual energy consumption of the building. When going through the case-
study buildings investigation, only those built in the post-war until the oil crisis years (1945-
1975) are considered. They still represent a relevant part of the European building stock, and
most of the retrofit solutions can be used anyway to renovate older buildings and newer
ones. As for the reference building used in the simulation part, the most common type built
during the Miljonprogram is chosen, but similar considerations can be applied also to other
buildings of the same period.
This thesis wants to provide support for the renovation of multi-family buildings of the
Miljonprogram era, by advising in the renovation process through suggesting several
packages of retrofit solutions that could suit different stakeholders’ requests.
Research questions
What are the present energy-saving measures used in renovation of buildings from the post-
war period in Europe, and which are the motives that lead to renovation and the barriers
connected to the renovation process?
Is it possible to reach a 50% reduction in the user energy consumption of a multi-family
residential building from the Miljonprogram by applying existing energy efficient measures
available on today’s market?

9
Limitations
The renovation of the building stock is a complex subject, therefore some boundaries
conditions had to be set. Only the phase concerning the renovation measures selection was
considered, so no issues concerning commission and project management were addressed.
Also, no Life Cycle Analysis (LCA) or Life Cycle Cost Analysis (LCCA) were performed
under the framework of this thesis, and it is suggested to do so for further research to get a
more comprehensive picture of the renovation process. The way the implemented solutions
affect the tenants from a social perspective was also not taken into account.
Since this thesis does not focus only on the assessment of the energy consumption of the
case study building but also on the information gathering on the renovation projects in
Europe and their analysis, comfort issues were not taken into account when simulating the
case study.
1.4 Methodology
To address the problem and reach the goal, both a qualitative and qualitative approach was
applied, divided in the following steps:
Qualitative:
Case study of current renovation projects, both at the Swedish and European level.
Completed and ongoing projects, concerning renovation of post-war multi-storey
buildings were analysed to identify and list the renovation measures, to understand
the current practice
Literature review on renovation state of the art (methods and technologies). The
most used technologies, found studying the renovation projects, were listed and
described by identifying the climatic area where they are used, their pros and cons
and their future developments.
Definition of the renovation scenarios, by setting up packages of the renovation
measures described in the state-of-the-art.
Quantitative:
Selection and modelling of a building from the Miljonprogram housing stock. The
European and Swedish building stock are analysed and compared in terms of age,
ownership and type, then a Swedish reference building from the Miljonprogram is
chosen as the reference to perform the simulations on, by a statistic analysis to see
which is the most common.
Simulation of the energy performance of the building for the different scenarios and
ranking according to the final user energy in terms of kWh/(m2year).

10
Software used
The software tool used in this project is VIP-Energy, developed by Strusoft AB (Strusoft
AB, 2016). A simulation model was built to calculate and analyse the energy performance
of the chosen reference building. Further description of the software is presented under
chapter 6.
1.5 Thesis outline
The outline of the thesis, to show how the research was conducted, is shown in Figure 1.1.
Every chapter comes with a short introduction and a short conclusion to make it easier for
the reader to recap the information presented in the chapter, or as a quick overview.
Figure 1.1. Conceptual scheme of the thesis

11
2 The European building stock vs. the Swedish building
stock
Before collecting data concerning the renovation projects, it is relevant to understand how
the subject of the study, the post-war residential building sector, is related to the existing
building stock. This is analysed in this chapter in terms of age, ownership and type of
buildings to see how patterns change across the European continent and to make a
comparison between Sweden and Europe. The Miljonprogram building stock of Sweden is
then further investigated to find the most common building typology, which will be the
object of the simulation part.
An overview of the building regulations on energy consumption in both, Sweden and a few
counties in Europe, is also made to compare different approaches and to see how they
influence renovation strategies.
2.1 The European building stock
The more recent statistics about the European building stock are provided by Eurostat
(Eurostat, 2015): The following data, except that concerning age, is retrieved from the
Housing statistics page, which makes a summary of the complex bundle of data available on
the website.
It is interesting to note that the majority of the residential floor area in the EU-27,
approximately 72 %, is concentrated in six countries: Spain, Italy, France, Germany, UK
and Poland (iNSPiRe project, 2014).
Age
The investigated literature concerning the age of the building stock is not homogeneous
about the time intervals in which age is classified. The Building Performance Institute of
Europe (BPIE), in its 2011 report (BPIE, 2011), subdivides age into three periods: Before
1960, between 1960 and 1991 and after 1991, due to the boom in construction of the 1960-
1991 period. Data is classified in three categories: South, North & West and Central & East
Europe. The buildings erected in the 1960-1991 period are between 39% and 49% of total,
depending on the location. The new buildings (after 1991) are only a smaller fraction of
total, between 14% and 19%, which underlines the existence of a large part of the stock in
need of renovation.
A similar study was carried out within the framework of the iNSPiRe project (iNSPiRe
project, 2014): Since the rate of new buildings has slowed down progressively after the
1970s, data was divided as in Table 2.1. The statistics show that more than half of the EU-
27 building stock was built before 1970, meaning that there is a great retrofit potential still
untapped. It can also be noticed how the building rate has decreased steadily after the boom
years.

12
Table 2.1. Percentage of built stock in Europe according to age
Year Before 1970 1971-1980 1981-1990 1991-2000 After 2000
% of built stock 53% 15-18% 12-13% 11-12% 6-7%
Meijer et al., 2009 carried out a research with an age subdivision that suits the purpose of
this thesis. They considered eight countries and classified the buildings according to the
following age intervals: Before 1919, 1919-1945, 1946-1970, 1971-1990 and after 1990.
The age distribution varies throughout the different countries, but the buildings erected in
the post-war period 1946-1970 represent a consistent percentage, from just below 20% in
France up to almost 45% in Germany. Given the figures, the renovation of post-war
buildings is therefore relevant through Europe.
Ownership
Statistically, building ownership can be divided in three main categories: Owner occupied,
private rented and social rented (Itard, et al., 2008). The building ownership is a factor that
influences the renovation process, due to the landlord/tenant dilemma: Both landlords and
tenants are interested in how much energy is consumed by the building and about the living
standard. When it comes to renovating, someone has to pay for the necessary works. If the
dweller owns the house, the owner will pay to retrofit it and will see the benefits, so this
might be encouraged to do it. The problem is due to the fact that the landlord might be
reluctant to pay for the renovation works that will protect his long-term investment in the
property, while the tenant might also be unenthusiastic about incurring in short-term costs
but will be the one benefitting directly from renovation and the consequent lower energy
bills. The problem is starting to be addressed in some countries such as France and Germany
with targeted “split incentives” in order to encourage landlords to implement renovation
projects (CEPI - UIPI, 2010). This problem is even more accentuated in the case of social
housing, where the rent are kept low by the municipalities and therefore it is usually hard to
increase the rent to repay the renovations undergone on the building due to the limited
financial means of the tenants (RESHAPE, 2009).

13
Figure 2.1 shows the figures collected by Eurostat (Eurostat, 2015), which differentiates
between owner occupied with an ongoing mortgage or not. Once again, the figures vary
between countries: Those who have a large part of the building stock for rent, amongst
which Austria (40% rental), France (42%), Germany (54%), Netherlands (48%) and Sweden
(37%) (iNSPiRe project, 2014), will be more affected by the landlord/tenant dilemma. The
EU-28 average is about 70% of owner occupied dwellings.
In Sweden the situation is particular since heat is included in the rent, and most of the social
housing is owned by so-called allmännyttiga bostadsföretag, which translated means
companies that work for the “public benefit”. Those enterprises have the goal of just
managing their stock for the community, without making profits. It is therefore easier to
renovate when the dwellings are owned by the same actor, but at the same time the rents
cannot be raised excessively to repay for the renovation works, which is one of the biggest
challenges that the Swedish government will have to face in the coming years (Berglund,
2009).
Figure 2.1. Distribution of population by tenure status, 2014 (% of population) (Eurostat, 2015)

14
Type
The type of dwelling affects the renovation process from an economical point of view: Since
multi-family buildings are more compact (more inhabitants per square meter) and bigger
than single-family ones, their renovation is more cost-effective and therefore more attractive
(iNSPiRe project, 2014).
Eurostat makes the subdivision in flats, detached and semi-detached houses, while the
survey conducted by the iNSPiRe project simplifies and classifies the dwellings in single-
and multi-family buildings. Figure 2.2 shows the statistics provided by Eurostat: Once
again, the figures vary greatly across the different countries. In 2014, 40% of the people in
the EU-28 lived in flats, about 25% in semi-detached houses and 33% in detached houses.
2.2 The Swedish building stock
Sweden’s building stock is characterized by the so called Record Years, where a million
dwellings (both in multi-family and single-family buildings) were built within ten years
between the 1960s and 1970s. After 1990, the construction activity collapsed and has lain
low due to the 2007 financial crisis. After 2010 it has recovered and it is now increasing
again, spurred by the lack of dwellings, a problem now endemic in Sweden (Olofsson, et al.,
2015).
Figure 2.2. Distribution of population by dwelling type, 2014 (% of population) (Eurostat, 2015)

15
Age
The data retrieved from the Statistiska Centralbyrån for the age of dwellings (Statistiska
Centralbyrån, 2016), updated for 2014, is summarized in Table 2.2.
Table 2.2. Number of single- and multi-family buildings in Sweden
Year of
construction
Number of
Single-family
Number of
Multi-family
% of total single-
family
% of total
multi-family
-1930 406 659 201 137 20.3 8.6
1931-1940 140 623 152 529 7.0 6.5
1941-1950 137 415 239 254 6.9 10.2
1951-1960 163 531 393 579 8.2 16.8
1961-1970 288 531 579 053 14.4 24.7
1971-1980 426 581 296 765 21.3 12.7
1981-1990 212 262 193 788 10.6 8.3
1991-2000 97 326 125 508 4.9 5.4
2001-2010 107 299 109 411 5.4 4.7
2011- 21 288 52 114 1.1 2.2
It can be noticed that the buildings erected in the period 1950-1970 represent 22.6% of the
single-family and 41.5% of the multi-family stock, reflecting the huge building activity of
the Record Years.
Ownership
As for the type of ownership, data from Statistics Sweden is subdivided in three categories:
Hyresrätt, bostadsrätt and äganderätt. Hyresrätt means that the resident is the tenant, for
the second one bostadsrätt the tenants are partly owners while the last one äganderätt is the
residents the owner of the house. The Statistics Sweden considers also “special houses” for
this classification along with the single- and multi-family houses, which are residences for
the elderly persons and student accommodations. In order to make a similar classification to
the Eurostat one, the bostadsrätt and äganderätt categories are considered as one, namely
owner occupied, and hyresrätt as tenant occupied. Data is shown in, updated as 2015
(Statistiska Centralbyrån, 2016).
Table 2.3. Distribution of dwellings in Sweden according to ownership
All kinds of dwellings Number of
dwellings
Multi-family houses Number of
dwellings
Hyresrätt 1 801 248 Hyresrätt 1 419 730
Bostadsrätt 1 064 629 Bostadsrätt 967 938
Äganderätt 1 849 287 Äganderätt 803
No data 1 404 No data 100

16
The table shows that 38.2 % of the dwellings in total are occupied by tenants, while 61.7 %
are owner occupied (data does not add up to 100 since there are some dwellings for whose
ownership is unknown). When looking only at multi-family houses, percentages become
respectively 59.4 % and 40.5%. It should be noted that the Eurostat statistics consider the
percentage of the population, while the Swedish Statistics consider percentage for the
dwellings. The percentage of owner occupied buildings is lower than the EU-28 average
(61.7% vs. about 70%).
Building typology
There are 2 018 064 single-family (småhus) and 2 388 571 multi-family buildings
(flerbostadshus) in Sweden as of 2015 (Statistiska Centralbyrån, 2016), which represent
46% and 54% respectively of the residential sector. For single-family, detached and semi-
detached one- and two- family houses, plus terraced houses, are considered. As for multi-
family houses, they are buildings with three or more apartments. This is different in
comparison with the EU-28 average (about 40% of the population living in flats), but once
again the Swedish figures are calculated on the number of dwellings while the European
ones on the share of population living there.
2.3 The Swedish Miljonprogram and the present housing market
Between 1965 and 1974, 1 005 578 dwellings were built in Sweden: This is commonly
referred as the Miljonprogram, even though there was no real “program” to increase the
construction rate, since it had been rising steadily since WWII. The term is used to refer to
the goal of further increasing the production of buildings, by taking advantage of the new
industrial techniques to build and produce buildings in a more rational way (Boverket,
2014).
The peak was reached in 1970: after this date, the production rate dropped as the waiting
queues for apartments did not exist anymore at that time, given the exceptional availability
of new-built houses. It is quite ironical that, when the administrative machine was finally
capable to take care of such a large scale building construction (around 1970), the demand
decreased drastically. Such an abrupt decrease in construction set a well-defined mark to the
Record Years period. It might be thought that such great volumes were recklessly built, but
there were actually architectural competitions and the subject was broadly discussed in
journals and forums, especially on industrializing and rationalizing. Even though the
buildings are not particularly attractive (simple geometrical figures with undecorated
facades) and often the outside area is poorly planned and not functional, the buildings itself
represented a dramatic increase in the housing standard (Hall & Vidén, 2005).
The problems of overcrowding and lack of bathrooms were solved almost completely: The
Swedes benefited from the usually well-designed and equipped houses, with good materials
and lots of daylight thanks to the big windows. Today those buildings are in the phase of
their age when some parts and systems have reached the end of their lifetime, such as water
and sewer piping. It is time to either renovate or replace those building components,
exploiting at the same time the chance to improve the energy performance and indoor
comfort. There is not a common state in which the buildings are today, since it depends on

17
the renovation they have undergone through the years and the way they were built. (Vidén,
2012).
The Miljonprogram multi-storey buildings
The thought of a Miljonprogram buildings often evokes an idea of a grey, anonymous,
prefabricated-concrete like multi-storey building. Actually, buildings came with a great
variety of forms and concepts, both for the detached houses and flats (Hall & Vidén, 2005).
This thesis focuses on the multi-storey buildings, therefore the single-family and terrace
houses will not be described. There are mainly four types of multi-storey buildings that were
built under the Miljonprogram (Vidén, 2012):
Lamellhus/skivhus: This is the most common type, with a great variety of storey
numbers, up to seventeen. 85% of the dwellings built in multi-storey buildings
during the Miljonprogram are lamellhus, and about 65% of those houses possess
between two and four storeys. The most common type is with three storeys
(Boverket, 2014). If it has four storeys or more, a lamellhus is usually referred as a
skivhus (Wikipedia, 2016). The typical features are band windows and low-pitch
gable roof for lamellhus, flat roofs with internal drainage and room-wide balconies
that divide the façade for skivhus. Figure 2.3 shows a typical lamellhus in Lund.
Figure 2.3. Typical lamellhus in Linero, Lund, reference building for this thesis, built 1972
Punkthus: This type of house has from three to sixteen stories and represent 10% of
the total number of dwellings built under the Miljonprogram. A single staircase
centrally situated in the building, with the apartments grouped around, usually
characterizes them. No eaves and sheltered balconies are also common features.
Figure 2.4 shows a typical punkthus in Farsta.

18
Figure 2.4. Typical punkthus in, Farsta (Johan Rådberg, 2012)
Loftgångshus: It is a two to eight storeys, built mainly in the 1970s (Bernjaro &
Pedram, 2012). They are the least common type, representing about 5% of the
dwellings built as multi-family houses during the Miljonprogram. As the Swedish
name suggests, the characterizing feature is that the apartments are reached through
external corridors on the long side of the building. The corridors itself are connected
to an external staircase, representing a block outside the building. The idea behind
this concept was to promote the socialization between neighbours, but the external
corridors has the side effect of minimizing the amount of daylight and reduced
privacy. Figure 2.5 shows a typical loftgångshus built in the early 1970s.
Figure 2.5. Typical loftgångshus in Möllevång, Lund, built 1964

19
2.4 Building requirements and characteristics from 1950 to 1970
Having a colder climate than most of the other European states, Sweden started earlier to
implement a building code system, which set requirements about ventilations, hygiene and
insulation. An interesting analysis was performed by VVS Företagen (2009) where the
evolution of the building codes and architectural solutions from 1950 to 1975 is described.
A brief recap is reported in the following subchapter to understand how the requirements of
that time influence the present building performance and how the building solutions affect
the necessary renovation process.
Houses built during the 1950s
The first regulation came out in 1946, with the so called BABS (Byggnadsstyrelsens
anvisningar till byggnadsstadgan) (Boverket, 2014), followed by a new version four years
later, the so-called BABS 1950 (Boverket, 2014). Sweden was divided in four climate
zones, and for each there were requirements concerning the maximum U-value of walls,
roofs and basement floors, as well as the ventilation flow in rooms, toilets, kitchen and
bathrooms, in terms of cubic meters per hour and extraction area.
During these times, the traditional, construction methods were applied: Windows were
small, double-glazed with good quality wooden frames, and the facades were either
plastered or with tiles. Roofs are pitched and the covering is made of tiles, often with
roofing felt or asbestos. It is usually the external walls, made of light concrete blocks that
have the load-bearing function. After the war years, there was greater awareness concerning
thermal insulation: During the 1950s started the production of self-sustaining mineral wool
panels.
The heating was provided mostly through central heating or, more rarely, district heating;
oil heating started to spread from the 1940s. The water culverts in the cellars were poorly
insulated. Copper, already used for domestic hot water piping, starts to be used also for cold
water piping. During those years, progress was made in the building systems, as thermostat
valves made their debut. Ventilation is natural, with the intake under the windows and the
outtake in toilets and kitchens. Taller buildings have fans in central ducts to extract the
exhaust air.
Houses built during the 1960s
BABS 1960 set the minimum requirements for U-values of the envelope and ventilation
(Boverket, 2014). It can be observed that the maximum U-values are lower (about 10%)
than those in BABS 1950, while the ventilation rate is the same. The envelope had to be
made in a way to avoid condensation problems and draughts.
Prefabricated elements started to be used: The technological innovations that started in the
former decennium were now established. There was a transition from load-bearing to non-
load-bearing external walls, which meant that prefabricated façade modules could be
produced in series, transported and mounted on the building structure. Typical prefabricated
facade panels are either 25 cm plastered light concrete blocks, sandwich panels with

20
(outside to inside) 5 cm concrete, 10 cm mineral wool and 10 cm concrete, or also panels
with wooden studs, 10 cm of mineral wool and external cladding.
The more industrialized construction method caused a worse air tightness and accentuated
thermal bridges, and the insulation was poor.
Heating was usually provided by centralized oil boilers, with a water radiators distribution
system. Exhaust ventilation became more popular, and towards the end of the decade,
supply and exhaust systems started to be installed. Copper was still used for hot and cold
water piping.
Houses built during 1970-1975
In 1967, the SBN 67 (Svensk byggnorm), also called BABS 67, was published, whose
requirements became mandatory from June 1968 (Boverket, 2014). The requirements about
the U-values are the same as for BABS 60 (the breakthrough will come later with SBN 75
after the 1973-1974 oil crisis).
The building typology and materials are more or less similar as from the last years of the
previous decade: Buildings became wider and some rooms were left without daylight
access.
District heating became more common: The heating centrals were replaced by connections
to the local district heating network. Supply and exhaust ventilation systems became also
increasingly more popular, though without heat recovery.
2.5 Conclusions
The Swedish building stock is in line with the European building stock (single- vs multi-
family), even though data for the Swedish stock is collected as building numbers and for the
European as percentage of population. Sweden has a lower share of dwellings owned by
those who are living in than Europe (data collected as for typology). The buildings erected
in Sweden in the period 1950-1970 represent 22.6% of the single-family and 41.5% of the
multi-family stock. Data for Europe shows that more than half of the buildings were built
before 1970: The number of aging buildings is high and the potential for energy saving
through major renovation remarkable.
The Swedish housing market is going through a crisis due to a lack of dwellings in the
bigger cities area, a combination of higher wages, rapidly growing mortgages and low
interest rates keeping the prices unreasonably high, and a taxing system that makes it very
costly for people to move, creating a matching problem and greatly reducing the offer. This
stalemate can be solved by addressing those economic and market structure issues at the
same time, but it requires a deep system change.
The Miljonprogram houses are now in great need of renovation, since many of their
components and materials reached the end of their lifetime. They were built in an era when
there were already regulations in Sweden setting value limits for the thermal transmittance
of the envelope, even though they cannot be compared with today’s requirements. As a

21
result, buildings are very poorly insulated or not insulated at all in comparison to the current
standards. Since renovation would need to be performed anyway, it is a unique chance to
apply some energy efficient retrofit measures as well, which is cheaper than doing it in a
separate intervention.
As shown the three-storey lamellhus stands for 85% of all the dwellings that was built
during the Miljonprogram. According to the statistics, this is the most common multi-family
building and there for this is chosen as reference building, to apply and analyse simulations
for energy efficient solutions. The same study could be performed to find the most common
type of multi-family house in every European country.

22
3 Building regulations
When constructing or renovating a building, it is mandatory to follow the building codes.
They are devised and implemented to regulate the construction/renovation process by
providing guidelines and advice on the minimum requirements for the construction of new
buildings or retrofitting of existing ones. Their aim is not only to set goals but also to
provide a way on how to reach them.
Building codes has been evolving for a long time, concerning mostly construction rules to
guarantee fire safety and avoiding collapse of buildings. It is in recent times, especially after
the 1973 oil crisis, that engineers and architects have started focusing on energy
consumption issues, by introducing minimum requirements on the building envelope
elements. Those issues were already known in the Scandinavian countries, where
governments set standards for thermal insulation (although not as stringent as today) already
in the 1950s and 1960s, not out of environmental consciousness but rather to tackle the
health problems caused by the poor housing conditions and also to increase the indoor
comfort in the economic boom period. As today, the building codes and regulations exist in
almost all the OECD countries, even though there are consistent differences between the
states, both in terms of requirements and calculation methodologies (IEA, 2008).
Building codes are usually made of different parts: The requirements on energy efficiency
can be a chapter in the building code, usually giving concise instructions and referring to the
specific standard, which is more comprehensive and detailed. It depends from country to
country how much information from the standard, as well as methods to calculate a certain
value, are included in the building code.
Along to the building codes, there are certifications and there are different labels, assess the
amount of energy that the building needs, to provide standard comfort conditions to the
occupants. To compare the performances of different buildings and to know at a glance
whether the level of energy efficiency is high or not.
3.1 Types of regulations
Setting up regulations to limit the energy consumption of a building can be done in different
ways, each with its pros and cons. Regulations can be divided in two main groups:
Prescriptive and performative. (IEA, 2013).
Prescriptive regulations
The idea behind the prescriptive regulations is that every component of the building,
especially the envelope, has to satisfy minimum requirements. For instance, a certain kind of
wall cannot have a thermal transmittance greater than a fixed set point. In simpler versions,
there is a list of the most important components of the building, such as the thermal
transmittance of envelope parts and efficiency of heating and cooling system. In more
complicated building codes, the list of requirements can be long since it applies to every
component, including the minor ones such as fans and lights. This approach is very simple
and easy to follow, but leaves little room to the designer to experiment new solutions.

23
A greater degree of freedom is provided by the trade-off system: Some components can be
below the set standard as long as some others exceed it. A simple calculation method is
provided along with the regulation, so that it is possible to calculate the overall value and
compare it with the limit. By doing so, the designer has more flexibility in planning: The
trade-off is usually made between the HVAC system and the building envelope, allowing,
for instance, a building with a very efficient heating system to have a below-optimal
envelope.
Performance regulations
Those regulations are more complex than the prescriptive ones and require a greater level of
expertise. There are three different categories, in order of complexity (IEA, 2008):
Model building: It is based on the simulation of two buildings, one with the
maximum allowable values for the building components (envelope and systems)
and one with the actual ones. The energy consumption is then calculated according
to a precise method: If the actual building performs better than the reference, it
satisfies the regulations. It is a more advanced version of the trade-off method, since
a performance calculation is made. Greater flexibility is allowed, especially to make
cost-effective changes that result in the same efficiency of more expensive ones.
Energy frame: A very similar method to the previous one, it considers the overall
thermal transmittance per unit area or volume of the building (such as square meter
of heated floor area). By doing so, a maximum value of energy loss for the building
is set.
Energy performance: The building is simulated by taking into account all the factors
that influence the performance of the building in reality, such as solar gains and
losses. This method establishes the energy consumption of the building calculated in
terms of primary energy or environmental indicators (such as carbon dioxide
emissions) and considers the relation between produced and consumed energy. It is
the most complex method, but also the one that allows the designer the utmost
freedom in implementing the best solutions for the case. This method is the most
complicated of all, since it has to consider many different factors.
Mixed or hybrid approaches are also possible. They usually set some maximum
requirements on the U-values of the envelope components along with a limit for the energy
consumption of the building. Sometimes alternatives are provided, so that the constructor
can choose which regulation he considers easier to achieve with the least effort (IEA, 2008).
Today the building codes are in a transition phase from prescriptive to performative: The
new challenge posed by the Nearly Zero Energy Buildings (EU Commission, 2016) require
a deeper understanding of the energy behaviour of the building and therefore requires
sophisticated simulation programs. The prescriptive regulations usually offer short-term
economic benefits, but they might over-optimize some components, increasing the costs for
energy efficiency on the long run. Their strength lies in their simplicity, while the

24
performance based regulations support the use of complicated software that only a trained
professional can master.
3.2 State of regulations in Europe
The European Union developes with directives that have to be subsequently accepted and
implemented by the member states, within a certain amount of time. The directive
concerning buildings is called “Energy performance in Buildings” (EU Commission, 2010),
issued for the first time in 2002 and constantly updated. It gives the member states
guidelines to implement it and therefore freedom to choose how far to go with the energy
efficiency, but also the obligation to revise the regulations every five years to keep updated
with the technological improvements. The member states can also choose how to calculate
the different parts concerning energy performance, as long as existing European standards
are taken into account. However, procedures can be different from one country to another,
so standards are being developed to unify the procedure. Trying to compare the
requirements across different EU member states would be difficult, since the calculation
methods used to set the minimum requirements or thresholds usually vary in the various
countries (ENTRANZE , 2014). There is also no common basis concerning the definition of
values such as final energy, heated floor area etc., which tips further the comparison scale,
making a common assessment impossible.
The countries where the requirements are the most stringent are the Scandinavian ones, due
to the severe winter weather conditions. When considering the overall envelope thermal
transmittance value, the strictest building code is the Swedish one, followed closely by the
Danish and Norwegian (IEA, 2008).
It is worth noting that the EU building directive, EPBD (EU Commission, 2010) addresses
mainly the new constructions; at first, for refurbishment, standards were set only for major
renovations of buildings with a floor area greater than 1000 square meter, a threshold that
was later lowered to 250 m2 (ECEEE, u.d.). The recast of the 2010 EPBD clearly states that
“Member States shall in addition take the necessary measures to ensure that when a
building element that forms part of the building envelope and has a significant impact on
the energy performance of the building envelope, is retrofitted or replaced, the energy
performance of the building element meets minimum energy performance requirements in so
far as this is technically, functionally and economically feasible” (EU Commission, 2010).
The EU set also goals for a 3% annual renovation of public buildings, owned by the central
government, as a measure to set benchmark examples for a more comprehensive renovation
of all types of buildings at a national level (BPIE, 2016).
3.3 Building regulations in Sweden
A brief history of the building regulations development in Sweden can be found in Chapter
2.5. In the following paragraph, the current regulation is recapped by highlighting the most
relevant points relevant to energy retrofitting.
BBR 22 has 9 chapters (Boverket, 2015). It contains prescriptions and advice for
constructing or renovating a building, concerning room height, accessibility, noise, fire

25
protection, safety etc. BBR´s Chapter 9 concerns the energy consumption. The previous
regulations considered three different climate zones, which have become now four to
account for the climate of southern Sweden, with a tightening of the maximum energy
consumption due to the milder weather conditions there. The different zones are shown in
Figure 3.1, while Table 3.1 reports the maximum energy consumption.
Table 3.1. Maximum energy consumption for the different climate zones
according to BBR
With energy consumption, it is defined as the sum of energy used for space heating, cooling,
DHW and to run the building service systems (electricity for pumps, fans and other
components): this is the final energy considered in the simulations. The plug load, namely
that for lighting and house appliances, is not taken in consideration. The Swedish building
code is an representative example of a performative regulation, which sets values for the
maximum energy consumption, combined with a prescriptive, trade-off regulation: There is
a maximum value for the average thermal transmittance for the building envelope, 0.4
W/m²K, calculated by taking into account the different envelope components plus the
thermal bridges. It should be noted that there are two categories, namely electric heated and
non-electric heated buildings: The former have more stringent requirements concerning the
maximum yearly energy consumption. Those values are for both new and refurbished
buildings: If the building is only partly refurbished and therefore not reasonable to reach the
values imposed by the building code, the maximum thermal transmittance values for single
envelope elements shown in Table 3.2 have to be followed (Boverket, 2014). Either this
values is used but it can also be used as an alternative to the energy consumption limits or
overall U-value shown in the previous table. The building must also achieve an airtightness
of maximum 0.6 l/s per square meter of envelope area. (Boverket, 2015)
Climate
zone
Energy consumption multi-family
buildings (kWh/m²,ATemp annually)
BBR
Not electric heated Electric heated
I 115 (0.40) 85 (0.40)
II 100 (0.40) 65 (0.40)
III 80 (0.40) 50 (0.40)
IV 75 (0.40) 45 (0.40)
The values in brackets are the max average U-Value
of the total building envelope, Uw (W/m²K)
Figure 3.1. Climate zones in Sweden

26
Table 3.2. Maximum envelope transmittance values according to BBR
U-value
(W/m²K)
Non electrical
heated building
Electrical heated buildings
with Atemp 51-100m²
Uroof 0.13 0.08
Uwall 0.18 0.1
Ufloor 0.15 0.1
Uwindows 1.3 1.1
Wdoor 1.3 1.1
3.4 Barriers
The implementation of energy efficient measures in buildings in the EU is hindered by
many factors, especially in the construction of new ones. A brief list describing the main
barriers to the implementation of effective building codes is described below, as reported by
IEA (2013):
Fragmentation of the building sector: There are many stakeholders involved in the
process, who have different interests, often conflicting, and different knowledge in
the energy efficiency issues. A lack of leadership completes the picture.
Absence of baseline information: Without solid data basis to establish the baseline,
policy makers have a hard time developing a strategy to promote energy efficiency.
Disjointed governance structure: Implementation and enforcement of the building
codes are usually the responsibility of different authorities. Few countries have a
coordination level that allows the reciprocal to be understood from both sides, at
national and regional level.
Lack of technical expertise: One of the most limiting barriers, for the design and
successful implementation of building codes is a deep knowledge of building
sciences. This is necessary, but there is a lack of professionals and adequate training
programs.
Lack of financial resources.
Building codes are weak without a proper enforcement. Governments and
authorities shall make sure that regulations are followed, by implementing a system
that provides incentives but also penalties for not complying with the latest
requirements set by the building codes.
3.5 Future of building regulations
As indicated in the previous paragraphs, building codes are dynamic matters that keep
progressing, taking into account new technologies and objectives that get more stringent

27
with time. The IEA (2013) has identified three ways to which the current traditional
approach is heading, briefly described below:
Increase the factors that determine the energy consumption of buildings: New
building codes will provide guidelines towards low energy buildings, by
implementing energy sufficiency measures (to decrease the need for heating,
cooling and lighting), energy efficiency measures (to reduce the amount of energy
needed for heating, cooling and lighting) and finally, the use of renewable energy
sources.
Creating more policy instruments complementary to building codes: The building
will not be seen anymore by the building code as an isolated system, but rather
integrated in the socio-economic context and local environment. The aim is to reach
objectives of economic development, energy security and environmental protection.
Addressing the challenges and opportunities that originate from the long lifespans of
buildings: Building codes will have to provide specific guidelines on how to
renovate buildings, given their long lifetime. Implementing energy efficient
measures on the perspective of maintenance works is very cost-effective and
therefore a unique chance to be exploited.
The regulations will become more stringent with time, aiming eventually to the higher
efficiency levels set by certifications and standards such as Low Energy Buildings, Passive
House, Zero Energy / Zero Carbon Buildings and Plus Energy Buildings.
3.6 Conclusions
Building codes, at least in Europe, comprise nowadays various sets of regulations,
guidelines and recommendation to reach energy efficiency in buildings. Their effectiveness
is guaranteed provided that, (a) they are properly implemented, (b) there is a strict
enforcement system that ensures their application and (c) that they are well aligned with the
other policies that do not address directly the building but concern its energy consumption,
in order to avoid contrasting directives. (IEA, 2013)
The easiest to use regulations are the prescriptive ones, by providing a list of minimum
requirements for the envelope and systems. Performance regulations involve the use of a
simulation software to calculate the energy consumption of the building and are therefore
more holistic but also more difficult to handle.
The European Union issues and updates the Energy Efficiency Directive, a law that has to
be implemented by the member states. The EU member states have some freedom to choose
the methods and calculation strategies, as long as they refer to accepted international
standards. This results in some differences between the building codes, since every member
state develops its own methodology. When renovating buildings in different countries, it is
necessary to follow the specific national building code, which means to learn a new set of
specific rules, even though the core concepts are the same from the EPBD. Sweden is the

28
country with the strictest regulations concerning the envelope, followed by Denmark and
Norway.
Building codes get stricter as new technologies are introduced and as the awareness for
environmental issues and energy security gets more widespread. The final aim is to reach
higher energy efficiency standard, such as the Passive House or (Nearly) Zero Energy
Buildings. Building codes are mostly addressed to new buildings, but in the most recent
versions, renovation has gained importance with dedicated regulations specifically intended
for the refurbishment process.
When renovating the case study building, the guidelines imposed by BBR will be followed,
especially concerning the envelope thermal transmittance values when replacing
components such as windows.

29
4 Renovation projects in Europe
In order to understand which renovations measures are applied as best practice in current
projects, a search was performed on completed or ongoing projects in Europe concerning
the renovation of multi-family post-war buildings. For every project, the energy efficient
retrofit measures were listed in a table. This does not suppose any statistical relevance, due
to the small number of cases considered, but rather to help identify a list of possible
solutions. This will be used for the definition of renovation packages in Chapter 6, whose
efficiency is to be assessed when applied to the reference building.
The project research was also meant to get some insight into the driving forces behind the
renovation, which is presented in Chapter 4.4. To understand why it has been decided to
renovate and which stakeholder took the initiative, since those are factors that directly
influence renovation. The aim was also intended to get some “lessons learned” from the
studies, to enrich the knowledge about the potential difficulties and hindrances that might
affect the renovation of the considered buildings.
4.1 Methodology
The renovation projects were all found on the internet, in form of publications, reports and
articles. The search engine was Google, and the keywords “renovation projects”,
“refurbishment projects”, “building renovation”, etc. Only the projects reporting a satisfying
amount of information concerning the solutions that were implemented during the
refurbishment were considered. Only renovation projects of buildings erected between 1950
and 1975 were taken into account, since the purpose of this thesis is to apply the renovation
measures to a Miljonprogram house. The collected material was mostly in English but due
to the relatively low amount of information found, projects of which the material was in
other languages were also investigated in order to find as many solutions as possible. The
countries from which the projects come are following: Sweden (SE), Germany (GER),
France (FRA), The Netherlands (NL), Italy (ITA), Spain (SPA), Switzerland (SZ), Austria
(AU), United kingdom (UK) and Slovenia (SLO).
For every project, the implemented solutions were written down in a list: to get an overall
overview, the projects were afterwards collected in a table, with each row corresponding to
a project and each column to a renovation measure. The cell in the sheet corresponding to a
certain solution is ticked if that measure was used in the project, as shown in appendix A. It
should be noted that only the solutions having an impact on the energy consumption of the
building were considered. A more simplified list is reported in the following paragraph. The
projects are categorised according building type, age, renovation solutions and country (an
analysis of the building typology and age across Europe was performed in Chapter 2).
4.2 Project analysis
The renovation solutions are listed in Table 4.1, each one was assigned a letter to make an
overview of which were used in the projects in Table 4.2. Each project is classified
according to the country of origin, type and year of built.

30
Table 4.1. Renovation solutions
Solution ID Renovation solution
A Envelope insulation
B Windows/door replacement or modification
C External shadings (blinds/overhang)
D Cool/green roof
E Elimination/reduction of thermal bridges
F Air tightness improvement
G Mechanical ventilation (supply + extract)
H Heat recovery on ventilation
I Night ventilation
J Heat pump (air/air, air/water, geothermal)
K Solar thermal
L PV
M Condensing boiler
N Small additional decentralized heating units
O Centralisation of heating
P District heating
Q Thermal storage
R Building Energy Management System
S Radiators system upgrade
T Lighting
Table 4.2. Overview of the projects studied
Project
ID
Country Type Built Renovation
solutions ID
Reference
1 SPA Multi-family 1960 A, B, C, F, J,
K, O, Q, S
(Dipasquale, et al., 2015)
2 GER Multi-family 1954 A, B, K, M
(Power & Zulauf, 2011)
3 GER Multi-family 1974 A, B, P, S
4 GER Multi-family 1950 A, B, G, H, J,
O
5 GER Multi-family 1950 A, B, G, H, S
6 GER Multi-family 1960 A, B, G, N, O,
S 7 ITA Multi-family 1978 A, K, L,Q (Gagliano, et al., 2013)
8 ITA School 1962 A, B, C, D, J,
K, L, N, R, T
(Cumo, et al., 2014)
9 SPA Multi-family 1960s A, B, C, F, I (Suárez & Fernández-Agüera,
2015)

31
10 ITA Multi-family 1964 A, B, G, H, J,
S
(Veronese, 2011)
11 ITA School 1960s A, B, I, K, L,
M, S (Esposito & De Sensi, 2007)
12 UK Semi-detached 1960s A, B, E, F, G,
H, K, L
(Low energy buildings
database, 2010)
13 ITA Multi-family 1953 A, B, O, S (Studio Tecnico Vettori, 2006)
14 ITA Multi-family 1960 A, B (Evangelisti, et al., 2015)
15 ITA Detached 1950s A, B, J, K, L,
M
(Miceli, 2009)
16 ITA Detached 1960s A, B, G, H, K,
L, N, R
(Rossetto, 2010)
17 SE Multi-family 1955 A, B, G, H (Levin, et al., 2011)
18 ITA Detached 1960 A, K, L, M (Casaretto, 2013)
19 GER Detached 1959 A, B, G, H, K,
M, Q
(EuroPHit, 2014)
20 UK Multi-family 1968 A, B, G, H, N,
Q
(EuroPHit , 2014)
21 SPA Multi-family 1968 A, B, G, H, M (Passivhaus-Datenbank, 2015)
22 FRA Multi-family 1956 A, B, G, H, K,
L, M, P
(EuroPHit, 2014)
23 NL Multi-family 1959 A, B, E, G, H,
K, L, M, S, T
(LEHR, 2009)
24 GER Multi-family 1968 A, B, E, F, G,
H, I, K, Q, S,
T
(LEHR, 2009)
25 SZ Multi-family 1946 A, B, G, H, J,
K, L, Q
(IEA, 2011)
26 SZ Multi-family 1954 A, B F, G, J,
K, L
27 NL Terrace house 1965 A, B, G, H, K,
M, N, A
28 AU Multi-family 1952 A, B, C, G, H,
K, N, Q
29 GER Multi-family 1960 A, B,D, E, G,
H, K, L, M
(Konstantinous & Knaack,
2011)
30 GER Multi-family 1960 A, B, E, G, L,
O
31 SLO Multi-family 1965 A, B, C, E, F,
H
(Spegelj, et al., 2016)
32 SE
Multi-family 1973 A, B, E, F, H,
L, P, T
(Beem-Up, 2013) 33 NL Multi-family 1950 A, B, E, F, G,
K, L, M
34 FRA Multi-family 1959 A, B, E, F, G,
M

32
35 SE Multi-Family 1972 A, F, G, O, P (Magnusson & Löfberg, 2015)
36 SE Multi-Family 1972 A, B, E, F, G,
K, P, Q, T
(Nilsson, et al., 2011) 37 SE Multi-Family 1973 A, B, E, G, H
38 SE Multi-Family 1972 A, B, E, F
39 SE Multi-Family 1966 A, B, G, H, K (Sjödin, 2014)
40 SE Multi-family 1968 A, G, L, P, T (Andersson, 2015)
41
SE Multi-family 1972 A, B, G, H, P,
S, T
(Olsson, 2015)
42
UK Office 1965 A, B, E, G, H,
L, P, T
(Duran, et al., 2015)
43 SE Multi-family 1974 A, B, E, G, H,
P, T
(Stockholms stad, 2014)
44 SE Multi-family 1971 A, B, G, H, K,
L, P, T
45 SE Multi-family 1972 A, B, G, H, K,
L, T
46 SE Multi-family 1975 A, B, E, F, G,
H, T
4.3 Why renovation?
One of the most interesting features when analysing the projects is to understand the reasons
why the renovation process has been carried out. If the needs of the stakeholders are
understood, it is easier to develop renovation strategies and policies that address them,
making the whole process more effective and therefore increasing the renovation rate in the
building stock.
The following list summarizes the motives behind the renovations that were encountered
when analysing the gathered projects. They are not in order of relevance due to frequency,
since there is no statistical relevance.
The building had to undergo some other kind of works. This is one of the most
common reasons. If some intervention, has to be carried out, why not take the
chance to improve the energy performance of the building? It often happens that
some renovation measures, which would not be economically feasible if performed
alone, become profitable if carried out within the framework of maintenance works
that would be performed anyway. Maintenance is needed when there are some
structural defects (such as old balconies), material/components degradation
(external plastering, roof tiles or screed, etc.) or some systems have reached the end
of their lifetime (ventilation, heating, plumbing etc.). Many buildings are in need of
such maintenance work, and pairing the implementation of energy efficient
33
measures is a unique chance to improve the energy rating of the building with a
significant lower cost. This was found for instance in Project 1, 5, 13, 15, 20, 24.
Planned building expansion. When a change in the building shape or structure is
planned, such as creating new volumes, major construction works are needed and
thus the energy performance can be improved by considering an energy retrofit.
This option is interesting since the higher rents deriving from the bigger apartments
can pay for the refurbishment. This was found for instance in Project 26 and 2.
Need to improve the indoor comfort. The decay of the building envelope and of
the building systems often create comfort problems for the dwellers, such as
condensation, mould growth, cold draughts and an unsatisfactory operating
temperature, too cold in winter and too hot in summer. The implementation of
energy efficient solutions has not only the aim to reduce the energy consumption of
the building, but also to improve the indoor comfort conditions. This was found for
instance in Project 23, 28, 7.
Desire of the owner to have an environmental friendly house. This applies
especially to detached houses, where a renovation of the building systems is also
possible. Living in a certified house is a personal asset for the owner, as well as a
personal gratification for actively contributing to the reduction of global emissions.
This was found for instance in Project 16.
Deep refurbishment is considered more cost-effective than demolition. When
the building is in such poor conditions that a demolition is taken into account, a
careful economic/life cycle analysis has to be performed. Deep refurbishment can
be the best choice since in a scenario where only the structural part of the building is
conserved, a high degree of freedom to implement renovation measures most
suitable for the building can be achieved. This was found for instance in Project 5.
Demonstration to prove the efficiency of energy refurbishment. Many buildings
undergo energy refurbishment as a way to demonstrate that it is possible to reduce
the energy consumption by a certain percentage, or that the process itself is feasible
without major hindrances. This was found for instance in Project 17.
Energy bills too high and growing. A building in poor conditions with a leaky,
bad-insulated envelope and inefficient heating system has usually a very high
energy consumption, which increases as its conditions become worse by the years.
The need for an energy retrofit is therefore driven by economic necessity of savings
in the heating/electricity expenses. The higher the consumption, the more
convenient the refurbishment. This was found for instance in Project 25, 28.
Desire to create a pilot case for refurbishment reference. Some projects are
carefully crafted to create a precedent in retrofit that can work as a benchmark to be
followed by other stakeholders with similar interests. The project is usually destined
to the retrofit of buildings in a certain geographic area, where there is a specific

34
climate, there is a certain building code and tax incentives or reduction. It is usually
run by public authorities. This was found for instance in Project 8.
Tenants showing interest in energy efficient renovation. When the tenants are
aware of the worsening conditions of their dwellings and of the benefits that an
energy retrofit can bring, they may get involved with the owners to define a
common renovation strategy. It is very important to have the tenants on one’s side
when renovating, since the process (depending on the depth of the renovation) could
be quite bothersome for them, due to possible temporary relocation. This was found
for instance in Project 27
4.4 Insights on renovation experience
Every project can be considered as a unique case due to its particular conditions and
background, but the lessons learned and insights obtained can be generalized and applied to
several other different projects. A list is made with some considerations about aspects to be
aware of when planning a renovation intervention on a building. Having a clear picture of
mistakes to avoid and of potential problems to address from the early planning stages can
save money and time in the later phases and streamline the whole process.
It is challenging to work with a great number of tenants. This is a challenge
especially in huge social housing buildings, where the number of families involved
can easily be greater than 50. The renovation process can start only if an agreement
is reached with all the tenants involved, so it is necessary to start early with a good
education/dissemination program about the project, to prepare the ground for further
negotiation. This is stated in Project 21.
It is not easy to find affordable financial tools. The success of the project often
depends on finding the necessary financing, which could be very hard especially if
there is no big housing association backing the project. It is also difficult in certain
countries to apply to a subsidy program, since the procedure is not clear. Project 10
shows how the absence of liquidity prevents people from retrofitting their
dwellings.
The project should be backed by a good financial solution for the tenants. The
whole renovation process implicates disturbances and annoyances for the tenants,
depending on how disruptive the works are. Having a good financial program to
make up for the interferences and to keep the rents reasonably priced is
recommended. Sometimes the tenants do not believe that the higher rent will be
followed by lower energy costs. A good financial solution was found for instance in
Project 28.
The project should create added value. When undergoing renovation, the building
has the potential to become a completely new one, both aesthetically and
functionally. The ‘’added value’’ is the improved comfort conditions, additional
living space, achieved energy efficiency or the adaptation of the building to any

35
future need. It is the added value that increases the worth of the building and
therefore pays back (or helps to) the investment made for the retrofit. In Project 2
the living space gets a new layout and a new terrace is built. In Project 26 the
apartments are enlarged to get higher rents.
Communication is the key. Before starting with the renovation, it is very important
to make sure that the tenants agree with the project, so that the works will be
accepted more easily. The communication strategy can be through questionnaires
about the conditions of the dwelling, interviews, explanatory letters, meetings and
workshops on energy consumption commitment. It is a good idea to have a
dedicated person to take care of the interaction with tenants. In Project 27 the
tenants themselves expressed interest in participating in the renovation process.
The interventions should be as least intrusive as possible. When considering
which renovation measure to apply, precedence should be given to those who do not
involve a relocation of tenants, if possible. Some non-invasive techniques which act
mostly on the integration of building systems in the façade are getting popular but
require a more careful planning. Projects with low distress for the tenants: 22, 24,
27.
Choice of the most cost-effective renovation measures. The project has to
undergo a careful life cycle cost analysis to identify the most appropriate renovation
measures from an economical point of view. Local incentives and tax deductions
must also be taken into account, since some kinds of intervention are subsidized.
This is stressed for instance in Project 24 and 20.
Money, time and skills are necessary for successful planning. The only way to
reach high building standards and perform an outstanding job is to have the
experience, the time and the money to put it into practice. This will also result in a
better prediction of the actual energy consumption of the building after renovation.
The use of prefabricate elements itself does not guarantee the quality necessary, if it
is not backed by skilled work and a careful planning phase. Some projects cannot
even start since there are no experienced professionals that know what to do. In
Project 25, the importance of those elements is stressed as crucial for a good quality
job.
When adding insulation in warm countries, other measures should be
implemented to counter the increased cooling need in summer. When insulating
in cold countries, the more insulation is usually the better: If the building is in a
Mediterranean country, on the other hand, more care is required. Some projects
have shown that the thicker the insulation, the higher the cooling summer need,
therefore it is necessary to use at the same time solar shading and low-gain glazing.
This issue was pointed out in Project 14.

36
4.5 The Swedish market
The main issues and insights described in the previous chapter also apply as well to the
Swedish market when it comes to renovation, as the cited studies point out. The most
frequent cause that leads to renovation is urgent technical need and end of lifetime for
systems/components, followed by high operation costs, high maintenance and energy costs.
Elevating the standard and problems with the indoor climate score are the least frequent
causes. The most prioritized factor is the economic feasibility, followed closely by energy
efficiency (Thuvander, et al., 2015). The role of the project leader is crucial for the success
of the project in terms of sustainability: His engagement will determine whether an
ambitious plan is set to achieve high energy efficiency or if a traditional renovation is
preferred. The project leader and the others deciding are usually alone and do not get help
from external experts (Olsson, et al., 2014). Property managers are very reactive on fixing
urgent technical problems and user complaints but they are not very proactive about
renovation: The planned maintenance plans are in place but there is little or no plans for a
long-term renovation strategy (Thuvander, et al., 2012). When renovating, it is usually
aimed at the BBR requirements, even though some companies aim at even a better energy
performance. The number of measures that can be implemented depends on the financial
means of the company: The room for energy efficient measures is usually limited to what
remains of the budget after the necessary maintenance interventions (Hastig & Tapper
Jansson, 2014).
4.6 Conclusion
In this chapter, some projects were analysed not only to gather a list of the energy efficient
renovation measures that are used in Europe, but also to get some insight on the motives that
lead to a renovation process and on the barriers that are encountered. Understanding how
owners and professionals think when it comes to renovation and listening to their wishes
and points of view is fundamental to implement a more effective renovation process, with
the final aim of making refurbishment simpler and widespread.
As for the reasons behind refurbishment, buildings are generally renovated if other kind of
work has to be performed anyway, such as maintenance or a building expansion. Another
reason for intervening is to improve the indoor comfort, which might be not adequate due to
poor envelope conditions. The tenants might be the driver behind renovation if they show
interest in environmental issues or complain about the bad conditions: Deep renovation is
also usually more convenient than demolition. The economic factors are important as well:
Usually renovation is done to address high energy bills that become bigger every year.
Renovation projects might also become a pilot case to test energy measures or to prove the
efficacy of the refurbishment concept. Having an environmentally friendly house is a matter
of prestige and commitment for certain owners.
By analysing how the renovation processes occurred, it is possible to get some useful insight
on the most common barriers and issues that are usually encountered. Once again, economic
issues in form of the lack of affordable financial tools are decisive to make a project start. A
good financial solution is needed not only for the owner but also to make the tenants get
through the renovation process, both in form of compensation and to keep the rents on an

37
acceptable rise: This is why the project has to create added value, to help pay off for the
renovation process. When choosing which measures to implement, it is always the economic
calculation that will assess the most cost-effective ones, which should also be as least
intrusive as possible to minimize the nuisances to the tenants. The renovation process is
especially cumbersome in huge buildings, where many tenants live: It is of the utmost
importance to hold a good communication from the early phases, to have a dialogue with the
tenants. In short, for a successful project it is necessary to have enough time to do it
carefully, good knowledge of the renovation process for good planning and the adequate
financial support to complete the project.

38
5 Renovation objects in Europe – State of the art
In this chapter, the most important renovation solutions that were encountered during the
analysis of the projects (Chapter 4) are presented in this State-of-the-art review. Only the
energy-related measures are considered due to the relevance with this thesis, which has the
aim of developing solutions packages to effectively renovate a building from the
Miljonprogram.
5.1 Methodology
The energy efficient solutions found in the renovation project analysis, described in the
previous chapter, are now analysed to determine their state-of-the-art, intended as the
assessment of the current best practice when renovating. Information was searched on the
internet, especially on commercial websites, to find the current practice rather than the soon-
to-be-implemented cutting edge solutions that are still in the testing phase or are hard to find
on the market due to their novelty.
For every solution, a brief description is provided, as well as the state of the art, to illustrate
what is the current best practice and the near future improvements. Untested technologies or
those that are still in an early development phase were not considered: The renovation
solutions must be ready to implement in a realistic refurbishment scenario. It was also noted
in the previous chapter that there is a certain diffidence in using very innovative
technologies when renovating due to the degree of uncertainty about their performance,
maintenance and effectiveness. The pros and cons are then briefly listed to identify at a
glance the strengths and weaknesses of the various solutions: There is no one-size-fits-all
renovation measure that can be implemented in every case, but it is rather the building
conditions and the desired level of improvement that calls for a specific solution.
The renovation solutions are then analysed according to different indicators, which are of
interest for the renovation process; Too often, when considering the refurbishment from a
theoretical point of view, only the energy performance is taken into account without
checking its feasibility in real life. The parameters considered are therefore advantages and
disadvantages, the impact on tenants (whether they need to relocate or if the implementation
of the solutions will change their lifestyle) and the climate that suits their application.
To compile the tables, a classification similar to the one displayed in the framework of the
NeZeR Project (Promotion of smart and integrated NZEB renovation measures in the
European renovation market) was used (TECNALIA, 2014).

39
5.2 Classification of solutions
External insulation
Description
Externally insulating a building means that one or more layers of insulation are applied
to the external surface. The extent to which the existing surface is demolished depends
on its state of conservation and on which kind of insulation is applied. Sometimes a
complete removal of the rendering/external covering up to the masonry is done, while in
other cases the new layers are just applied on the existing surface. The insulation
material is usually in form of rigid panels with different thicknesses, or softer. There are
several kinds of insulation materials, but the common feature is that the insulating
material has to be anchored to the masonry by means of an adhesive or mechanical joints
(or both), then another layer to provide reinforcement is needed, and finally the external
render for weather protection can be applied. (Schiavoni, et al., 2016)
State of the art
The most used insulation materials are EPS (extruded polystyrene foam), XPS (expanded
polystyrene foam), which come in rigid panels, mineral wool and organic materials such
as cork and cellulose: All those have been on the market for a long time which means
that the product is well established. Innovation in external insulation is both in form of
materials, with vacuum insulated panels and phase change materials, and prefabricated
panels: The latter are just added to the existing surface and therefore must be customized
to the building that has to be renovated. (TheGreenAge, 2016)
Advantages Disadvantages
Possibility of giving the building
a facelift, making it looking better
Enhanced weather protection,
noise reduction and wall moisture
conditions
Possibility of fixing thermal
bridges and air tightness
Prefabricated options
Increase the thermal quality of the
building envelope (Everwarm,
2014)
Not possible if building is listed or
in a conservation area
Volume of the building is increased
Need extra fixing at the top if there
is not enough roof overhang
Increases the cooling need in warm
climates (Everwarm, 2014)
Impact on tenants Climate
The only nuisance is due to the
scaffolding necessary for the installation
and to the noise due to the work process.
Since the process concerns the external
surface of the wall, the tenants can live in
their apartment during the works.
Suitable for all climates but with different
thicknesses. When installing external
insulation in warm climates, the cooling
need increases since the insulation slows
down the night cooling of the building,
trapping heat inside: Other measures such
as night ventilation and solar shading
should be improved to mitigate the negative
effects.

40
Internal insulation
Description
Internally insulating a building means adding a layer of insulation on the internal side of
the external walls. The insulating material comes either in panels or in blanket rolls, and
has to be fastened to the wall by means of some kind of mechanical system, making sure
that a vapour barrier is also installed in order to prevent dangerous condensation in the
external wall, which gets colder due to the added insulation. The process is usually not
disruptive, usually some studs or battens are added to the existing surface and the
insulation is fastened to those. The reinstallation of plug sockets, windowsills, light
switches etc. should be done with particular care to avoid the penetration of the vapour
barrier, given the increased sensibility of the wall to moisture: Accurate sealing is
needed. (Homebuilding & Renovation, 2016)
State of the art
There are three common options for internal insulation. The first is rigid panels that are
directly plastered to the wall: The most expensive solution but also the most energy-
efficient and fastest, since some have pre-attached plasterboard and vapour barrier.
Panels are glued to the wall but screws can also be used. The second is wall battening,
either over or under the insulation: Fixing the battens directly to the wall helps when the
surface is uneven, creating a good substrate for the insulation, which has to be rigid to be
screwed to it. The opposite method, on the other hand, ensures no vapour barrier
perforation and more ease to hang things on the wall. The third option is to build a stud
wall inside the existing one, with a cavity (usually ventilate) between the two to carry
away the moisture: This is used for the cases more at risk of condensation. New materials
are being researched to reduce the thickness of the material used, usually mineral wool,
rigid foam boards or natural ones as cork or wood fibre, along with fastening techniques
that give less thermal bridging. (Homebuilding & Renovation, 2016)
Advantages Disadvantages
No alteration of the external
surface, can be used in listed
buildings
Cheaper and faster than external
insulation
Easy to install (Everwarm, 2016)
Loss of internal space
Intensification of thermal bridges
Walls lose their heat storage
capacity, inner thermal comfort
might get worse
Condensation problems if
insulation is not performed
accurately (Everwarm, 2016)
Impact on tenants Climate
The tenants cannot live in the
room/apartment where the insulation is
getting installed.
The colder the climate, the greater the risk
of condensation if the vapour barrier has
leakages. Suitable for all climates.

41
Cavity wall insulation
Description
If the external wall has a cavity wide enough (at least 50 mm), it can be filled with some
insulating material to increase the heat transfer properties of the wall. In case of new
buildings the insulating materials, usually panels or boards, are installed directly in the
cavity while in case of retrofitting the cavity is filled with loose materials by making
holes in the wall. The insulation will block any convection heat transfer that happens
inside the cavity due to air movement. It is important to make sure that the insulation is
uniform, to avoid the formation of thermal bridges. This solution is not suited in case of
walls in bad conditions with moisture problems. (Olympic Construction, 2015)
State of the art
There are two common ways of insulating a cavity. The first is to use a foam, usually
polyurethane, and the second is to blow a fibrous material such as glass wool or cellulose
(some interesting solutions are derived from old minced and treated newspapers). Holes
are usually drilled in the external side of the wall, and the material is blown inside by
means of a special gun. This technology is well-established, and the present materials
have already replaced the old ones that gave rise to mould or allergy problems. (USwitch,
2016)
Advantages Disadvantages
Almost no aesthetic impact
Fast installation
No impact for tenants (Olympic
Construction, 2015)
Possible irregular insulation
density (no way to check)
Possible creation of thermal
bridges
If there are irregularities in the
wall, the material can leak on the
inside (Olympic Construction,
2015)
Impact on tenants Climate
Holes are drilled from the outside, there
might be need to drill them from the inside
in case of high-rise buildings. (Superglass,
2016)
Suitable for all climates.

42
Roof insulation
Description
The strategy for insulating roofs depends on whether the roof is sloped or flat. Insulating
a roof is of the utmost importance in a building, given the fact that warm air is less dense
than cool air and therefore tends to rise up to the ceiling, creating a stratification in the
room. If the roof is poorly insulated, the room ceiling will be cold and transfer the heat
outside, creating downward draughts and making difficult and expensive to heat the
room. This happens in reverse during the warm season. (EcoWho, 2010)
State of the art
If the roof is sloped, it is usually best to apply external insulation, in form of replacing the
existing roof: The covering tiles are removed and insulation is placed above the existing
structure (plus a weatherproof membrane), then new tiles or the old ones are placed back.
When doing so, the possibility of making the structure ventilated can be considered
(called ventilated roof or cold roof). The insulation is in form of rigid panels: A mix of
insulation on the external and internal side can be used to attain the desired U-value if
there is access from the internal side. If the roof is flat, there are two options. The first is
called inverted warm roof and consists of adding a layer of rigid insulation on top of the
existing weather membrane, and then some material to protect the insulation. By doing
so, the insulation protects both the membrane and the deck, prolonging their lifespan. The
second is called warm roof and is the addition of the rigid insulation on top of the timber
structure of the roof: The weather membrane is placed on top of the insulation. This roof,
in contrast to the cold roof, is not ventilated. To do so it is necessary to remove the roof
covering so it is advised when it should be removed anyway. (Energyquarter, 2015)
Advantages Disadvantages
External interventions, minimum
impact on tenants
Can either improve the aesthetics of
the building or not alter its
appearance. Adding a roof structure
makes the roof gain volume though
High energy savings (TECNALIA,
2014)
Load is added to the structure
Original roof might be removed
Need to fix the accommodation
for vents, skylights etc. (flat roof)
Scaffolding needed (pitched roof)
(TECNALIA, 2014)
Impact on tenants Climate
Minimal. Suitable for all climates.

43
Attic insulation
Description
There are two types of attic: Cold and warm. The former means that insulation is placed
on the attic floor, keeping the loft cold, while the latter implies insulating immediately
below the roof, which keeps the loft warm. (TheGreenAge, 2014)
State of the art
In cold attics, loose insulation is usually added on the floor, until either it is level with the
joists (if there are) and then some rigid panels are added to cover it up, or to a higher
level and it is left uncovered. Blanket insulation can also be used; the most common
materials are mineral and glass wool. This solution is cheaper than the warm attic and
easier to perform, but it leaves the attic more sensible to extreme temperatures in winter
and summer. In warm attics, insulation is placed immediately below the roof structure,
between the wooden joists. If mineral or glass wool is used, it gets crammed between the
joists and then kept in place with wooden battens. Polystyrene slabs can be also used, cut
and fitted to the joist space; another option is EPS “squeeze” products that are pre-
compressed and expand like springs once they are installed. (USwitch, 2016)
Advantages Disadvantages
With the warm attic, the loft can be
inhabited and there is no huge loss
of internal space
Very cost-effective measure for
energy saving
Cold attic is very easy to insulate
The original roof is untouched
(TECNALIA, 2014)
Condensation risk in the roof
Load is added to the structure
Creation of thermal bridges when
insulating
Necessity to relocate cables,
lights, vents etc.
A cold attic can experience
extreme temperatures in winter
and summer (TECNALIA, 2014)
Impact on tenants Climate
Minimal but there might some nuisances
due to noise and systems relocation.
Suitable for all climates.
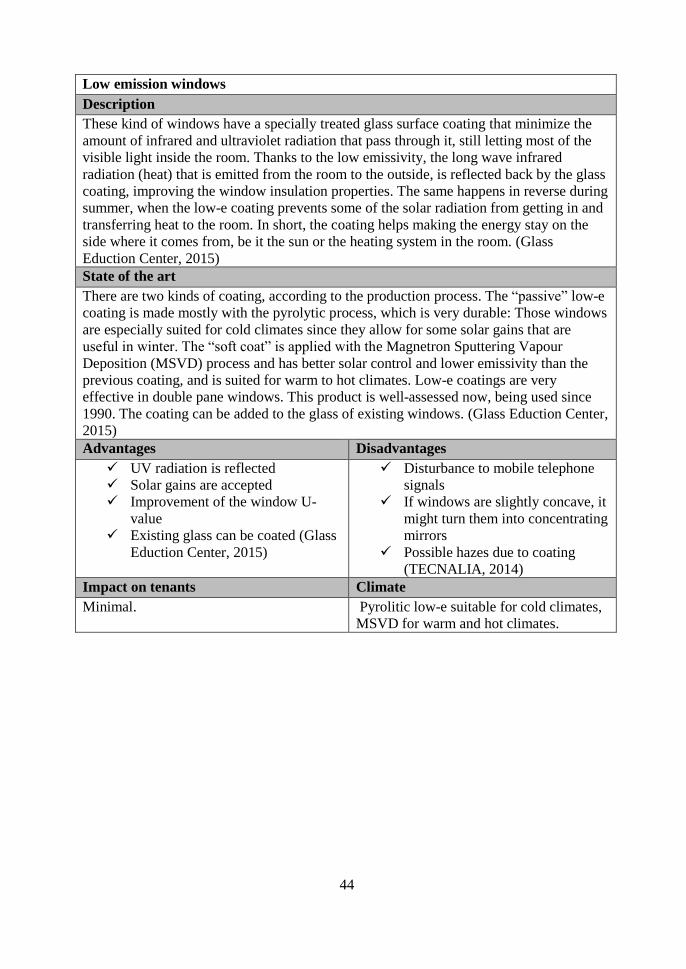
44
Low emission windows
Description
These kind of windows have a specially treated glass surface coating that minimize the
amount of infrared and ultraviolet radiation that pass through it, still letting most of the
visible light inside the room. Thanks to the low emissivity, the long wave infrared
radiation (heat) that is emitted from the room to the outside, is reflected back by the glass
coating, improving the window insulation properties. The same happens in reverse during
summer, when the low-e coating prevents some of the solar radiation from getting in and
transferring heat to the room. In short, the coating helps making the energy stay on the
side where it comes from, be it the sun or the heating system in the room. (Glass
Eduction Center, 2015)
State of the art
There are two kinds of coating, according to the production process. The “passive” low-e
coating is made mostly with the pyrolytic process, which is very durable: Those windows
are especially suited for cold climates since they allow for some solar gains that are
useful in winter. The “soft coat” is applied with the Magnetron Sputtering Vapour
Deposition (MSVD) process and has better solar control and lower emissivity than the
previous coating, and is suited for warm to hot climates. Low-e coatings are very
effective in double pane windows. This product is well-assessed now, being used since
1990. The coating can be added to the glass of existing windows. (Glass Eduction Center,
2015)
Advantages Disadvantages
UV radiation is reflected
Solar gains are accepted
Improvement of the window U-
value
Existing glass can be coated (Glass
Eduction Center, 2015)
Disturbance to mobile telephone
signals
If windows are slightly concave, it
might turn them into concentrating
mirrors
Possible hazes due to coating
(TECNALIA, 2014)
Impact on tenants Climate
Minimal. Pyrolitic low-e suitable for cold climates,
MSVD for warm and hot climates.

45
Double glazed windows
Description
These windows feature two panes separated by an air-filled layer, with a usual thickness
of 12-18 cm or a noble gas-filled layer. The fenestration system is airtight. A spacer is in
place to separate the panes and seal the gas inside, which due to its very low thermal
conductivity acts as an insulant. When talking about the thermal transmittance of
windows, it is usually considered the overall window transmittance, which is calculated
by taking into account the U-values of glass and frame (Inoutic, 2016). Even though the
window has a good air tightness, it is crucial to install it correctly not to create leaks and
draughts around the frame that will compromise its performance. Those windows can
reach overall thermal transmittance values Uw as low as 1.1 W/(m2K) (Pilkington, 2015).
State of the art
This technology as well as low-e, is well established. Continuous progress is made to
develop better frames, as now the materials that show the best insulating properties are
PVC and wood in combination with the assembly techniques to get the window sealed.
Except from air and in newer products, the most common noble gas used in double
glazing is argon, due to its low cost; krypton has a lower thermal conductivity but is more
expensive and is therefore used only in high performance applications or where the gap
between the panes has to be very thin. (Elitfönster, 2010)
Advantages Disadvantages
Improvement of air tightness
Great improvement in U-value
compared to single glazing
Possibility to use low emission
coatings
Noise reduction (Energy Saving
Trust, 2014)
If the sealing is compromised, the
window has to be replaced most
times
When retrofitting, the existing
window has to be replaced
If replacement is not made
correctly, air tightness will be lost
(TECNALIA, 2014)
Impact on tenants Climate
Minimal. Suitable for all climates.

46
Triple glazed windows
Description
The technology is the same as the double glazing, but with three glass panes and
therefore two layer of gas (either air or noble gases). Triple glazing can reach Uw lower
than the 0.8 W/(m2K) limit set by passive house standards are needed, especially in very
cold countries. The main benefits are not just in terms of energy consumption but rather
of comfort: If the rest of the house is insulated very well but the windows cannot match
it, it will end up with cold spots creating draughts and condensation. (Passive House
Institute, 2006)
State of the art
Improvements are going in the same direction as double glazing, especially better frames
and spacers.
Advantages Disadvantages
The same as for double glazing,
presented above plus better Uw
values (QualiGlass Windows &
Doors , 2016)
The same as for from double
glazing presented above
One more pane means slightly less
transmitted solar radiation
Heavier than double glazing, up to
50% more (TECNALIA, 2014)
Impact on tenants Climate
Minimal. Especially in Nordic and central European
countries. (QualiGlass Windows & Doors ,
2016)

47
Secondary glazing
Description
It is the addition of another window to the inside of the existing window, which remains
intact in place. This can be done only if there is enough space to install a second window,
which can be either fixed and removed during the summer months to provide additional
insulation during the colder period, or one that can be opened (hinged, sliding, etc). The
aim is to obtain further insulation and sound proofing. (Duration Windows, 2016)
State of the art
Since this is basically the addition of a window in parallel to the existing one, it is as
advanced as the window technology that is to be installed. When mounting the new
window, it has to be made with care not to create cold bridges or decrease air tightness.
This solution does not alter the external appearance of the window so it is particularly
suited for historical buildings. (Duration Windows, 2016)
Advantages Disadvantages
No alteration of external
appearance of the building
Improved airtightness
Noise reduction and improved
insulation
Makes house safer against intrusion
Condensation might occur
Less visibility
Cleaning of the existing window
becomes more difficult
Impact on tenants Climate
Minimal. Suitable for all climates.

48
External shading
Description
The concept is to give the building solar protection by limiting the amount of solar
radiation that reaches the openings. External shadings can be fixed or mobile, and there
are several technologies available according to the surface orientation and latitude.
External shading is more efficient than internal shading because the radiation is
prevented from reaching the inside of the window, where it heats the internal shading
device, which in turn radiates heat to the room. This solution alters the external surface of
the building so it cannot be used in conservation areas. (CWCT, 2011)
State of the art
There are several solutions that have been developed during the years, mostly passive
ones. Overhang shelves (either movable or fixed) are placed above the window with the
aim of shading in summer when the sun is higher in the sky and letting the precious heat
gains of the low winter sun into the room. The overhang depends on the latitude. Side
fins are the same concept of the overhangs, but they are placed vertically and their aim is
to shade the room from the sun coming from the east or west: A side effect is having the
fin that is not shading diffuse daylight into the building. They can be also fixed or
adjustable. Window blinds are more efficient than curtains due to their external position.
They come in a variety of shapes and materials: External venetian blinds give a good
shading and daylight regulation. The improvements in the field of external shading are
the mechanization of the systems and connection to an automated control system so that
they can have the maximum efficiency all year long. Another interesting technology,
especially indicated for sunny climates, that is getting increasingly popular, is the light
shelf. It is usually a flat reflective surface, very similar to an overhang that is placed
above high level on the external side of an opening to reflect the daylight further into the
room, towards the ceiling, reducing the need for artificial lighting. (CWCT, 2011)
Advantages Disadvantages
Reduction of undesired solar gains
Easy to install
Daylight factor and visual comfort
increase (TECNALIA, 2014)
Structural problems with wind-
and snow load
Difficult cleaning
Outside view may be considerably
reduced
Necessity of proper installation to
avoid thermal bridging
(TECNALIA, 2014)
Impact on tenants Climate
Minimal, it is an external component. Suitable for all climates, especially sunny.

49
Green roof
Description
A green roof is the installation of a layer of vegetation on top of the roof: This has several
beneficial effects such as providing effective insulation to the roof, retaining, collection
and use of storm water, and increasing the air quality. Both roofs help reducing the urban
heat island effect. (Green Roof Technology, 2016)
State of the art
There are mainly two types of green roofs, classified accordingly to the amount and
height of vegetation: Extensive and intensive. The former has a thicker layer of earth
because it should allow small trees and thickets to grow, while the second consists only
of grass and small plants so a thinner earth layer is needed. Extensive roofs can retain
more water than intensive roofs, but require a greater maintenance. When installing a
green roof, it must be ensured that the underlying structure is well waterproofed and can
support the higher load, otherwise the organic layer will damage the roof instead of
protecting it against the weather. (Green Roof Technology, 2016)
Advantages Disadvantages
Retention of rainwater
Improvement of air quality
Increased biodiversity
Insulation
Green roofs need maintenance,
especially the extensive
Green roofs add a consistent load
to the structure
Might be expensive, the building
appearance is altered
Impact of tenants Climate
Minimal for cool roofs, tenants might be
involved in the maintenance of green roofs.
Warm climates for cool roofs, all climates
for green roof.

50
Door replacement
Description
Simply replacing the existing external doors with low-U, for the building envelope to get
better airtightness.
State of the art
To achieve high levels of insulation, doors feature improved core materials such as
fiberglass, wood cladding and steel with polyurethane foam core. The frames are also
designed to create tighter seals to reduce leakages. (Energy Star, 2016)
Advantages Disadvantages
Improved insulation
Usually safer than old doors
The cost, it might be expensive
Impact on tenants Climate
Minimal. Suitable for all climates.
Elimination / Reduction of thermal bridges
Description
The better a house is insulated, the greater the percentage of heat loss through thermal
bridges. When installing insulation or other components, special care should be taken to
avoid the creation or accentuation of thermal bridges, which could compromise the
performance of the energy efficient solution. (Low Carbon Housing, 2016)
State of the art
The best way to spot thermal bridges is to use a thermographic camera. The building is
viewed from the outside through the camera lenses; any localized temperature difference
will reveal a thermal bridge in the envelope. They can be geometrical, as a result of the
shape of the thermal envelope, such as at the corner of an external wall, repeating
(following a regular pattern) or non-repeating (due to discontinuities, they do not show
patterns). Fixing thermal bridges that are the result of the construction process, such as
those created by balconies, is a hard task and requires major structural interventions, so it
should be considered only when other major works are planned. It is easier to fix minor
bridges that occur at windows and door frames, vents outlets etc. (Low Carbon Housing,
2016)
Advantages Disadvantages
Improved comfort conditions
Reduced draughts and condensation
(Low Carbon Housing, 2016)
Hard to fix bridging that resulted
from a wrong design (absence of
thermal breaks) (Low Carbon
Housing, 2016)
Impact on tenants Climate
Depending on the intervention, from
minimal to huge.
Suitable for all climates.

51
Air tightness improvement
Description
It is useless to retrofit a house with a state-of-the-art thermal insulation, if the air
tightness (and the ventilation system) is not improved as well. Leakages will make the
heated/cooled air flow through the envelope, losing energy used to condition it.
Improving the airtightness of a building means fixing the leakages resulting from design
mistakes, poor installation of components or degradation of envelope materials. The
typical spots where leakages occur are at junctions, which can be between walls and
floors (or other walls), opening frames and walls or at the intersection of a component,
such as a duct, with the envelope. (Passipedia, 2015)
State of the art
To check the air tightness level of the building, the blower door test is performed; this
method is used mostly for buildings with high performance targets, as passive house. An
anemometer can be used as well to identify the specific spots where the leakages occur. If
the building does not have an airtight membrane or if it is old and in poor conditions, a
new one is installed: The idea is to have an uninterrupted airtight membrane along the
building envelope. Special sealing tape is used to fix membrane junctions and
intersections with service penetrations and openings. (Passipedia, 2015)
Advantages Disadvantages
Improved performance of
ventilation system
Reduced condensation problems
Fewer drafts (ISOCELL, 2016)
An airtight building requires
mechanical ventilation not to
compromise the internal air
quality (ISOCELL, 2016)
Impact on tenants Climate
Tenants cannot live in the room that gets
retrofitted.
Suitable for all climates.

52
Mechanical ventilation
Description
If a building has a good airtightness, the most energy-effective way to provide the
necessary air exchanges to maintain a good air quality is through mechanical ventilation.
The system consists of air ducts to bring the airflow to the rooms and a fan to provide the
necessary pressure difference. (Builing Performance Institute, 2016)
State of the art
The simplest system consists in exhaust ventilation: Air is drained through exhaust vents,
making the building under pressurized. The lower pressure sucks the outside air into the
building through intended openings in the building envelope, providing fresh air; this
system has the advantage that usually the exhaust vents are already in place in the
building (kitchen hoods and toilet vents). Supply ventilation works the opposite way:
There is only one fan that supplies air to the different zones, making the building
pressurized. The exhaust air will therefore flow towards the outside through the spot
extractors in toilets and kitchens. The most complete system, putting together the benefits
of the previous ones, is called exhaust-and-supply or simply balanced ventilation. It is
more complicated, with two ducting systems and two fans, but provides a better control
of the indoor air and greater efficiency. When choosing a mechanical ventilation system,
the air terminals (supply and exhaust) must be chosen carefully to guarantee the best air
distribution in the rooms, minimize noise and have a small pressure drop. Heating and
cooling can be supplied through the ventilation system, in that case the system is called
HVAC (Heating, Ventilation and Air Conditioning). Heat recovery can used only in
combination with exhaust and supply mechanical ventilation (Builing Performance
Institute, 2016)
Advantages Disadvantages
Improvement of air quality due to
filtering
Efficient, controlled ventilation
Improvement of internal comfort
conditions (Builing Performance
Institute, 2016)
Accurate planning needed
Noise related problems may occur
Active system, runs on electricity
Maintenance needed
Might not be easy to install in an
old building (Builing Performance
Institute, 2016)
Impact on tenants Climate
Moderate, workers need access to the
apartments to install the ducts and some
minor works might be needed to install the
units/connect the ducting to the main unit.
Suitable for all climates.

53
Heat recovery
Description
The efficiency of a supply and extract ventilation system can be dramatically increased
by using heat recovery. The exhaust air is used to preheat or precool the supply air
(depending on the season), decreasing the amount of heating or cooling needed by the
HVAC. In order to exchange heat, the two airflows meet in the heat exchanger, a
component that adds complexity to the system but guarantees high energy savings.
(Popular Mechanics, 2016)
State of the art
There are several kinds of heat exchangers applied to mechanical ventilation but they can
be grouped in two categories: Regenerative and recuperative. In regenerative heat
exchangers, the two fluids exchange heat by coming alternatively in contact with the
same surface, where the heat is stored before being transferred to the cold fluid. Rotary
heat exchangers are the most common choice due to their high efficiency: The two
streams flow in a counterflow pattern through a wheel with the rotating heat exchanger
medium, a honeycomb structure with high heat conductivity. Recuperative heat
exchangers have the heat exchanging medium interposed between the two fluids, which
flow on the opposite sides of the heat transferring surface without coming in contact.
They are further subdivided in direct, where the fluids share the heat transfer surface, and
indirect, if there is an intermediate circulating liquid that transfers the heat from the
fluids, that can be very distant from each other. The technologies in order of decreasing
efficiency are: Regenerative, direct recuperative, indirect recuperative. There is always a
little carryover in recuperative heat exchangers, which means that some odours and
pollutants can be transferred to the supply air. No matter the type of heat exchanger, the
extract air should always be filtered to avoid contamination. (Popular Mechanics, 2016)
Advantages Disadvantages
Very high efficiency can be
reached
Can also recover moisture
(Lawrence Berkeley National
Laboratory, 2016)
Space and maintenance needed of
the system, especially with
moving parts involved and thermal
stress on the heat transferring
medium
Some contamination of the supply
air by the exhaust may occur
(Lawrence Berkeley National
Laboratory, 2016)
Impact on tenants Climate
Minimal, the heat exchanger is in the AHU
room.
Suitable for all climates, especially those
heating dominated.

54
Night ventilation
Description
When the outdoor air temperature during the day is so hot that opening the windows or
not cooling the outdoor air before it enters the building would raise the indoor
temperature, and night temperatures are cool, night ventilation can be used. The
principle, also called night flushing, is about taking advantage of the free cooling
provided by the night air, to cool the thermal mass of the building for the following day.
(Designing Buildings Wiki, 2015)
State of the art
There are three types of night ventilation: Passive, active and hybrid. Passive means that
only natural ventilation is used, driven by air pressure difference which is especially
effective in tall buildings who can provide a good stack effect at the end of the day. If the
ventilation process is fan driven, then it is called active; when a mix of passive and active
systems are used, the system is hybrid. (Designing Buildings Wiki, 2015)
Advantages Disadvantages
Use of free night cooling, reduction
in cooling loads
No energy is needed for cooling
Applied well in climate regions
with high daily temperature
difference (hot days and cool
nights) (Designing Buildings Wiki,
2015)
Best suited for buildings
unoccupied at night, but not
necessarily
Careful planning of thermal mass
positioning and air pathways
Suited only if there is enough
thermal difference between day
and night (Designing Buildings
Wiki, 2015)
Impact on tenants Climate
Minimal. Warm climates with enough thermal
excursion between day and night.
(Designing Buildings Wiki, 2015)

55
Heat pump
Description
There are different types of heat pumps, air to air, air to water, water to water, geothermal
heat pump. Heat pumps are devices that use external work (electricity) to transfer heat
from a cold source to a warm source, in the opposite sense of the spontaneous heat flow
driven by temperature difference. A fluid is used as carrier to transfer the heat: It can
either undergo a compression and expansion process or just stay in its liquid phase, such
as in the geothermal heat pumps. They are very effective, since for every unit of
electricity used as input they give out usually at least more than two units of heat. When
talking about their performance, the Coefficient Of Performance (COP) is used, which is
the ratio between the heat power given by the pump and the electric power absorbed by
the pump to work. If the pumps work in the right range of temperatures, very high
Coefficient of Performance (COP) can be reached. The other indicator is the Seasonal
Performance Factor, which describes how the pump works throughout the whole year,
i.e. in a wide range of temperatures, and gives therefore a better picture than the COP
values (The Green Age, 2014). Heat pumps can be used either to provide heat or cold,
according to the direction of heat transfer. (HPA , 2014)
State of the art
When considering heat pumps, they are classified according to the heat source they get
the heat from. The following list describes the most used in residential applications.
Air source heat pumps: Those pumps have a compression-expansion cycle where
the fluid extracts heat from the outside air and either transfers it to the supply air
to warm the building, or to a tank of water (either for DHW or heating). The
former type is called air-air, the second one air-water heat pump.
Exhaust air source heat pumps: The functioning principle is the same as
described above but the source is the exhaust air coming out from the building.
By doing so, most of the heat contained in the exhaust air is recuperated: Since
the airflows are usually limited, an electric resistance helps the pump when the
need of heat is greater.
Geothermal heat pumps: The heat source is the ground, exploiting the fact that
the temperature of the ground under 10 m is relatively constant. To extract the
heat, boreholes are drilled and the heat exchangers inserted in it (usually water
pipes). Such a system has the possibility of being used as thermal storage, with
heat being absorbed in winter and pumped in during summer. (HPA , 2014) Advantages Disadvantages
Cheap green energy, high COPs
(especially ground source pumps)
Low maintenance required
Heat pumps are environmental
friendly (TECNALIA, 2014)
Trained personnel needed to
design, install and perform
maintenance or repairs
Space is needed to install
The air source (plus exhaust)
pumps might not be able to supply
the required heat during extreme
cold weather conditions (ibid.)
Impact on tenants Climate
Minimal, it is an external component. Suitable for all climates, due to their
reversible nature (heating and cooling).

56
Solar thermal collectors (ST)
Description
The solar radiation heats an absorber surface under which a medium (either a liquid or
air) flows and gets warmed up. The fluid is either used directly in the desired application
or directed to a heat exchanger (also called storage), where heat is accumulated. A solar
thermal collector can have different layouts, but the common feature is the presence of a
selective, adsorbing surface that should have the highest absorptance as possible and low
emission not to disperse heat, and an insulation system to prevent it from cooling down.
There are several applications according to the temperature reached inside the collectors,
in the state of the art only those of interest for residential use are described. (Warmec
Scandinavia, 2016)
State of the art
There are two main types of solar thermal collectors, namely flat plate collectors and
vacuum tubes. The flat plate solar collector is a panel with a dark absorbing plate upon
insulation for reducing the heat losses, which absorbs solar radiation. Fluid tubes are
placed over the absorbing plate were the fluid medium (water, a mixture of water and
glycol or air are the most common) converts the radiation into heat and transports it by
circulation pumps to the storage tank. The heat in the tank goes through a heat exchanger
and then is delivered in the building where it is needed. The covering material can be
glass or plastic, one or double and with or without anti-reflex; choice is made upon
application. The vacuum tubes (or evacuated tubes) consist of glass tubes which are
evacuated, to eliminate the thermal convection losses. It contains a smaller finned copper
tube, with a selective surface, in which the heat carrier flows. The tubes are connected to
a manifold: When the sun shines and heats the collector, the fluid inside the copper tubes
gets hot and vaporizes, rising up to the manifold at the top of the collector. It exchanges
heat there with another fluid circulating in the main circuit, with the collector tank as
final destination. The hot vapour then condensates and falls back into the bottom of the
tubes where it starts the process again. (The Renewable Energy Hub, 2016)
Advantages Disadvantages
Well established system for most of
the European countries for
renewable and free green energy
Self-contained energy use
Feed-in into the existing district
heating system
Flat plate: Easy, robust, can be
integrated in the roof, cost efficient
Vacuum tubes: Easy to replace,
fitted for industrial applications,
while manly applied for solar
cooling (Warmec Scandinavia,
2016)
Flat plate: Large area needed
Vacuum tubes: Expensive, limited
lifetime
Surplus of hot water in summer,
need careful dimensioning
Not competitive against district
heating (Ibid.)
Impact on tenants Climate
Minimal, it is an external component. All climates

57
Photovoltaic cells (PV)
Description
A photovoltaic cell (PV) is a system that generates electricity from the solar radiation.
The PV cell is designed as a thin plate of semiconductors, mostly silicon with p-n doping.
When the PV cell is exposed to light, energy is transferred from the photons to the
electrons in the p-n transition: the free electrons generate a current when the system is
closed on a resistance. The PV cells are placed in arrays and mounted in lager units, the
PV panels. The PV system can either be a stand-alone system or a grid connected system.
The PV panels generates direct current, therefore the system needs an inverter to convert
it to direct current. (Electrotec Energy, 2016)
State of the art
The PV cells can be divided into three groups: mono- and multicrystalline, thin-film and
new dye-sensitised cells. Monocrystalline has a well-defined regular structure, while in
polycrystalline the pattern is random. Film types are also getting on the market now: they
are second-generation solar cells made by layers of thin photovoltaic materials on a
substrate. Dye-sensitised cells are similar to the film ones and are also called Grätzel
cells: they feature semi-transparency and represent the third generation of PV cells, with
still limited commercial availability (Wikipedia, 2016). The crystalline PV cells are more
expensive than the other ones due to a more complicated production process, but the
result is a higher efficiency (a greater fraction of the solar radiation is converted into
electricity). The PV panels are usually installed on the roof: a careful planning is needed
to decide not only the row configuration and inverter choice but also the panel tilt, which
varies according to latitude and weather conditions. PV is a well-established technology,
nowadays improvements are made in innovative, low efficiency but cheap and
environmental friendly materials. (Electrotec Energy, 2016)
Advantages Disadvantages
Renewable and free energy
Energy production: It is possible to
sell it to the grid
Provide additional protection to the
roof or façade (Energy
Informative, 2014)
Lower performance at higher
temperatures
Require space on the roof or
facade
Energy has to be consumed as it is
produced, otherwise it has to be
sold to the grid or accumulated in
batteries
Performance decreases with time,
recycling issues (Energy
Informative, 2014)
Impact of tenants Climate
Minimal, it is an external component. Mostly in sunny climates.

58
Condensation boiler
Description
During a combustion process in a traditional boiler, the exhaust gases are just expelled
from the chimney. By doing so, the heat still contained in the fumes is lost: Condensing
boilers make the steam condense, recuperating the latent vaporisation heat of the exhaust
fumes. The water is then drained away. (National Energy Foundation, 2016)
State of the art
The efficiency of traditional boilers is around 70-80%, while condensing boilers are over
90%. The most important feature of such boilers is the heat exchanger, which has to
withstand the elevated temperatures of the fumes as well as its acid content: Aluminium
alloys and stainless steel are preferred for higher temperatures, while plastics are
normally used at lower ones due to cost reasons. Since the fumes have to go through a
heat exchanger that is as compact as possible due to costs, a fan is used to facilitate the
process. (Green Match, 2016)
Advantages Disadvantages
Higher efficiency than a traditional
boiler
Space saving, does not need a hot
water tank and are available in
different sizes
Can be fitted into both new and old
systems (Green Match, 2016)
Corrosion issues
Complex system and expensive
maintenance
Freezing in the drainage pipe shuts
down the boiler (Green Match,
2016)
Impact of tenants Climate
No impact. Suited for all climates. Care must be taken
for very cold climates since the drainage
pipe could freeze. (National Energy
Foundation, 2016)

59
District heating
Description
District heating is the distribution of heat that is generated in a centralized location, such
a power plant, to far located end users, through a network. It is in form of hot water
delivered through underground pipes to the desired locations. It has the advantage of the
scale efficiency, since the bigger the plant the higher the efficiency in the process, and
also due to the fact that heat at around 100 °C is useless for industrial applications. Heat
is often a by-product of power plants or other industrial processes, and recuperating this
heat has a great environmental meaning, increasing the overall efficiency of the whole
process. District heating stands for heating, space heating and hot water in half of
buildings in Sweden. (Svensk Fjärrvärme , 2016)
State of the art
Hot water is pumped into the building from the central heating plant. The water is
transported under high pressure in insulated pipes and has a temperature of between 70-
120 ° Celsius. In the heating central of the building, there is a heat exchanger which uses
the hot water for heating the tap water and radiators in the house. The cooled water is
transported back to the central heating plant, preheated and pushed into the system again.
(Svensk Fjärrvärme, 2016)
Advantages Disadvantages
Recuperation of waste or by-
process heat
Different type of fuels can be used
Economy of scale and greater
efficiency than small boilers
(Wikipedia, 2016)
Less found in districts with low
population density and small
buildings
Needs long term financial
commitment and planning
The longer the distance between
the plant and the user, the more
the lost energy (Wikipedia, 2016)
Impact on tenants Climate
No impact. Suitable for all climates, especially heat
dominated climates.

60
Active Thermal storage
Description
Active thermal storage is an alternative method to store the primary energy over time.
The idea is to store somewhere the produced energy that cannot be directly used and
would therefore be wasted: This is a broad concept that applies also to the strategy of
producing energy when it is cheaper and retrieving it in a second time when it is more
expensive. Thermal storage is both for heating and cooling. Energy can be stored on a
daily or seasonal basis: For instance, a form of storage is provided by exposing some
internal building surfaces to solar radiation during the day in winter so that they will
slowly release their heat at night. (Heier, 2013)
State of the art
There are different methods to store energy in buildings. The most used is sensible heat
storage, like hot water tanks, used especially for DHW: Research is being made to
improve the insulation levels of the tank with evacuated super-insulation. The
underground can also be used as a thermal storage medium, either with boreholes, aquifer
or caverns, the first being preferred: It is a very effective for seasonal storage. Phase
change materials (PCM) exploit the high melting latent energy, providing thus a greater
energy density than the sensible storage and a more controlled temperature. PCM are
being integrated in the building walls to increase their thermal mass, with benefits for
both heating and cooling (passive strategy). The last strategy is to store heat by chemical
reactions such as adsorption. (International Renewable Energy Agency, 2013)
Advantages Disadvantages
Higher access for primary energy
and reduced peak loads
Increase of the thermal mass of the
building (PCM)
Intelligent use of resources (Heier,
2013)
Hard to implement, require
advanced knowledge
Some technologies are still not
established, such as PCM
Need for materials improvement
for PCM, limited knowledge about
long-term usage (many charge-
discharge cycles) (TECNALIA,
2014)
Impact on tenants Climate
When thermal storage is used to increase
thermal mass, due to its nature, it affects the
indoor climate: The most highlighted
problem is complaints of cold mornings and
warm evenings.
There are different types of system for
both warm and cold climates, which can
provide both heating and cooling to the
building. (Heier, 2013)

61
Building energy Management system (BEMS)
Description
A building energy management system (BEMS) is a method to control and manage the
energy needs of a building. BEMS is a broad concept, it integrates and coordinates the
different building systems with the aim of providing a pleasant indoor climate, safety and
economical running of the building, without wasting energy. The heart of the system is a
computer and sensors that controls not only the HVAC and lighting systems, but fire and
security systems as well. (ClimateTechWiki, 2016)
State of the art
A BEMS consists in a hardware part, which is the processing unit, the various sensors
and actuators (if they are not already integrated in the controlled systems) and a software
that continuously registers the inputs from the sensors and decides whether to modify the
outputs. The level of complexity can vary greatly according to the desired system:
Nowadays remote monitoring is possible, as well as communication between different
buildings to further optimize the energy savings. (Jones Mei, 2011)
Advantages Disadvantages
Efficient use of energy
Increased comfort conditions
Increased building security
(ClimateTechWiki, 2016)
Need of specialized personnel to
install and do maintenance
High initial cost, a major part is
the sensors
BEMS can be implemented only if
the installed systems allow to be
controlled by it
(ClimateTechWiki, 2016)
Impact on tenants Climate
No impact during the installation. Tenants
must be informed on how a BEMS works in
order not to override its measures.
(ClimateTechWiki, 2016)
Suitable for all climates.

62
Efficient radiators (With thermostatic valves)
Description
Once that the heating system is upgraded, it is necessary to adequate the heating emitter
system. If the envelope has also been improved, the heating need of the building will be
lower, which will in turn require smaller or fewer radiators. The new generation of
radiators can support low temperature heating systems due to their efficiency that makes
them work with water colder than the traditional temperatures. Electric radiators are also
gaining popularity (in the UK for instance) thanks to their great flexibility and possibility
to be accurately regulated. The working principle of a water radiator is simple: Hot water
flows through the radiator, which works as a heat exchanger, yielding heat to the room by
both convection and irradiation. Electric radiators are basically resistances that irradiate
heat when current flows through them. Radiators are designed to maximize the heat
exchange coefficient (both convective and radiative) between air and the surface, which
is obtained by choosing materials with high thermal conductivity and large surfaces.
(Lawless, 2015)
State of the art
The main types of radiators for residential applications are water radiators and electric
radiators. The former used to be made in cast iron, a material which is today replaced by
aluminium, stainless steel or polypropylene, which are lighter and therefore can be easily
transported and installed, plus can be shaped in various forms to benefit the design
freedom. All water radiators are nowadays equipped with thermostatic valves, which can
also be used for retrofitting old ones. They work mechanically, consisting of a valve head
that contains a fluid which expands or contracts as the room temperature becomes
warmer or colder; the fluid pushes a pin into the valve body, regulating the hot water
flow into the radiator. (TheGreenAge, 2016) Electric radiators can be classified into
radiating, convecting or both. The infrared heating is interesting since it makes the room
warm in a more uniform way, being the irradiated surfaces warmer than the indoor air,
increasing the comfort. (Guida Prodotti, 2016)
Advantages Disadvantages
Electric radiators are slim, light and
portable, have high efficiencies and
require little maintenance. They
allow also for an accurate
programming, personalizing the
comfort conditions room by room.
(Guida Prodotti, 2016)
Water systems are present in almost
every house so it is easy to retrofit.
Aluminium and stainless steel have
fast response. (Termosifoni, 2016)
Electric radiators are expensive
and cannot provide heat for a
whole building, and they work
better when the envelope is good
Water radiators need maintenance
and their placement is limited due
to the hot water piping system.
Aluminium has a little thermal
mass so it does not release much
heat after the boiler is turned off.
(Termosifoni, 2016)
Impact on tenants Climate
No impact. Suitable for all climates, especially cold.

63
Efficient lighting LED
Description
This kind of artificial lighting consists of light emitting diodes (LEDs), assembled into
lamps. LEDs are far more efficient than fluorescent or halogen lights, providing also a
longer lifetime: The luminous efficacy, measured in lumen per Watts, keeps increasing as
the technology evolves and has reached more than 200 lm/W in laboratory tests. (U.S
Departement of Energy, 2013) The estimated useful life of LEDs is between 35000 and
50000 hours. (U.S Departement of Energy, 2009)
State of the art
The issue with LEDs is that they emit light in a limited wavelength band, which is
characteristic of the energy bandgap of the semiconductor that is used to make the light.
There are two main ways to overcome this issue and produce white light with LEDs:
Either using three LEDs emitting red, blue and yellow (the primary colours) so that the
combined light is seen as white, or to use phosphor in a way similar to the fluorescent
lightbulbs, to convert blue or ultraviolet radiation to white light. (AlltOmLED, 2015)
Advantages Disadvantages
High luminous efficacy, long
lifetime
No warm-up time
Very little waste heat production
(AlltOmLED, 2105)
LEDs are current and temperature
sensitive: Problems for outdoor
applications
The quality of the light is different
according to the Spectrum of the
LED. (AlltOmLED, 2105)
Impact on tenants Climate
No impact. Suitable for all climates.
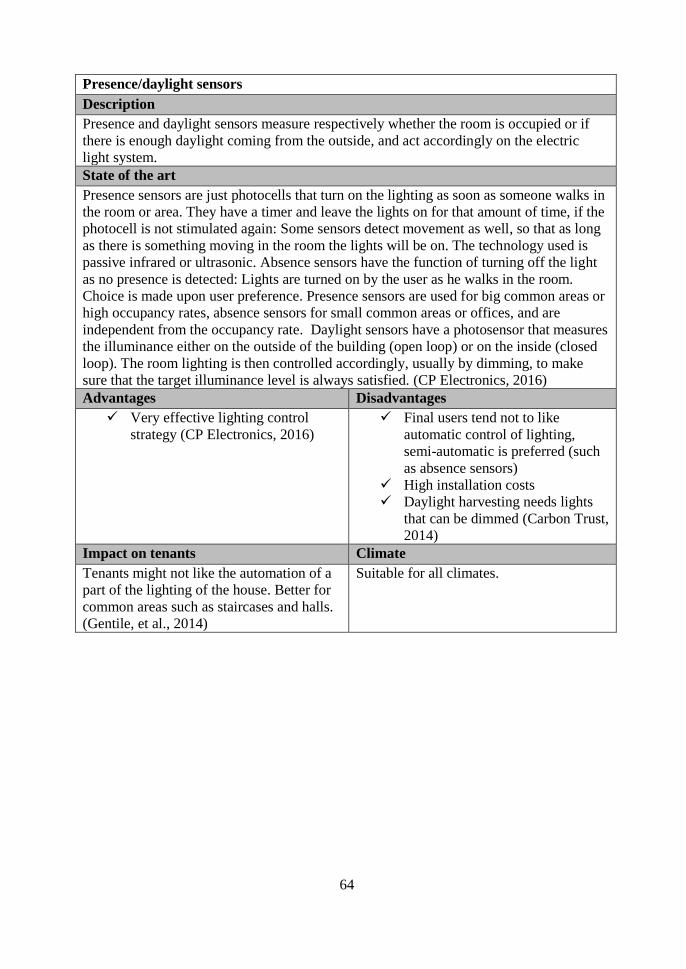
64
Presence/daylight sensors
Description
Presence and daylight sensors measure respectively whether the room is occupied or if
there is enough daylight coming from the outside, and act accordingly on the electric
light system.
State of the art
Presence sensors are just photocells that turn on the lighting as soon as someone walks in
the room or area. They have a timer and leave the lights on for that amount of time, if the
photocell is not stimulated again: Some sensors detect movement as well, so that as long
as there is something moving in the room the lights will be on. The technology used is
passive infrared or ultrasonic. Absence sensors have the function of turning off the light
as no presence is detected: Lights are turned on by the user as he walks in the room.
Choice is made upon user preference. Presence sensors are used for big common areas or
high occupancy rates, absence sensors for small common areas or offices, and are
independent from the occupancy rate. Daylight sensors have a photosensor that measures
the illuminance either on the outside of the building (open loop) or on the inside (closed
loop). The room lighting is then controlled accordingly, usually by dimming, to make
sure that the target illuminance level is always satisfied. (CP Electronics, 2016)
Advantages Disadvantages
Very effective lighting control
strategy (CP Electronics, 2016)
Final users tend not to like
automatic control of lighting,
semi-automatic is preferred (such
as absence sensors)
High installation costs
Daylight harvesting needs lights
that can be dimmed (Carbon Trust,
2014)
Impact on tenants Climate
Tenants might not like the automation of a
part of the lighting of the house. Better for
common areas such as staircases and halls.
(Gentile, et al., 2014)
Suitable for all climates.

65
6 Case study
In this chapter, different renovation packages obtained by combining some of the energy
efficient solutions listed in chapter 5 are applied to a reference building to test their energy
saving potential, in the framework of three scenarios: minor renovation, upgrade of the
building envelope to the BBR 22 recommended values and major renovation.
6.1 Method
In order to assess the impact of the different renovation packages contained in the three
scenarios, a reference building is chosen and modelled in VIP-Energy, a software that
allows specifically to simulate the energy consumption of a building, along with the
calculation of the overall thermal transmittance value of the building according to the BBR
22 standard. The energy efficient measures from the state-of-the-art are combined in
packages, in the framework of three scenarios. When choosing the renovation solution,
literature refers to as choosing out of a list of renovation solutions applied one by one
(Wanga, et al., 2015); the measures are either added to the previous one or they are grouped
in different packages in order to increase the energy saving potential (Lohse, et al., 2016).
Only the annual specific energy consumption of the building is simulated: the base case (the
building in its present conditions) is simulated and compared with the energy consumption
of the different scenarios and sub-scenarios to identify which combination of solutions
decrease the annual consumption below the BBR threshold or the 50% compared to the base
case.
Simulation software
VIP-Energy is a software developed by Strusoft AB. VIP-Energy is optimized for
calculating the building’s total energy performance by a dynamical structured model. The
energy need for the building is calculated for heating and cooling with factors that are
measurable or known. VIP-Energy is validated according to IEA-DESTEST, CEM-15265
and ASHRAE-BESTEST (Strusoft AB, 2016).
The program calculates the energy consumption according to BBR. It is subdivided into
heating demand and electricity (no cooling is considered in this case): Heating is further
split into DHW and zone heating, while electricity is split into electric energy for fans,
pumps and other electricity-consuming appliances that ensure the functioning of the
building services (such as lighting). The household electricity (used to run the household
appliances and lighting) is not taken into account by BBR and therefore is not considered.
VIP-Energy also gives the total U-value of the building, calculated according the BBR 22
standard. Only final energy (as defined by BBR in chapter 3.3) is taken into account, but it
is possible to turn it into total source energy with conversion factors.
Contrary to most of the other simulation programs, VIP-Energy does not require the
drawing of the building geometry in 2D or 3D CAD files: the user just inserts the building
geometry in a program extension (as well as the floor area), called VIP-Area, by stating the
surface of the various building components, both internal and envelope elements. The
components are then imported into the program and their properties are assigned. There is a

66
small database of default envelope elements but it is possible to customize the various
components according to the specific case, as well as to import materials that are not present
in the material database. The program generates automatically the indoor zones according to
the floor area. The user enters the internal gains in terms of Watts per square meter;
therefore, the program is not used to perform thermal comfort analysis.
It is possible to define schedules for the occupancy, electricity/DHW use, ventilation and so
on. Building systems for heating and cooling can be simulated, and different alternatives can
be chosen. The user chooses also how the results should be presented, i.e. in accordance to
which standard.
The reference building
The reference building is a typical lamellhus (see Chapter 3), built during the later years of
the Miljonprogram (1969-1972), and is now in need for a major refurbishment. It is located
in Lund, southern Sweden, in an area called Eddan where several other identical buildings
were erected at the same time. The whole area contains 14 three-storey buildings with
basements and green areas. The building contains three stairwells and 27 apartments of
various sizes: it is shaped as a long, narrow box (about 61 m x 10 m): the long sides face
north and south, with an orientation of 26 degrees to the west. The internal floor height is
2.4 m, and the floor slabs are 230 mm thick. Each floor has a heated floor area Atemp of 648
m2. The plan of the ground floor is shown in Figure 6.1. The other floors are identical.
Figure 6.1. Plan view of the ground floor
There is also a basement, whose plan is shown in Figure 6.2.
Figure 6.2. Plan view of the basement

67
6.1.2.1 Input data for the energy simulations
The input data used to simulate the building is shown in Appendix A and B. Some data was
assumed, some calculated and some provided by LKF (2016), the housing company which
kindly made drawings and energy reports of the building in question available.
6.1.2.2 Building envelope
The windows towards South are still the original ones (with a thermal transmittance of 2.7
W/(m²K)), while on the north side the wooden frame was replaced by aluminium in 2005
which lowered the U-value to 1.7 W/m²K. Some of the balconies have been covered by
glazing, as it can be seen in the Figure 6.3 below. The south and north façade have a
wooden studs structure, while the east and west façade are made of concrete sandwich walls.
Figure 6.3 shows the south side of the building.
Figure 6.3. Reference building south facade with balconies
The load bearing structure is made of concrete. The East and West façade elements have a
sandwich structure which consists of 80 mm concrete, 100 mm mineral wool and 100 mm
concrete. The loadbearing inner walls are made of concrete and the thickness differs
between 150 and 180 mm. The South and North façade have 95 mm insulated wooden
studs: The northern façade has 80 mm of concrete on the outer side, while the southern only
has 8 mm painted Eternit board. The basement floor and walls are made of concrete and are
insulated on the inside. The roof is an unventilated warm roof construction with an 11
degrees inclination and a maximum height of 1.2 m in the middle. It is constructed of
wooden rafters with a concrete structure. The balcony floors are concrete prefabricated
elements with a thickness of 160 mm, with no thermal separation which means thermal
bridging. All the floors are made of concrete and all windows are double-glazed or have
additional glazing. Table 6.1 presents the U-values for the building envelope elements,
calculated with the software.

68
Table 6.1. Heat transfer coefficients (U value) for building elements
Elements U-Value (W/m² K) External wall (South and north) 0.5 External wall (East and West) 0.38 Roof 0.64 Ground floor to the basement 0.85 Double glazed window towards south 2.7 Double glazed window towards north 1.7
The building’s ventilation system is an exhaust mechanical ventilation system. An exhaust
air fan was installed in 2006 with an efficiency of 70 % at a pressure of 400 Pa. The heat
source is district heating.
The airtightness of the building is assumed according to the age of the building and a mean
value of three apartments, which have been pressure tested. The air permeability (q50) is
estimated to be 0.7 l/(s·m²) at 50 Pa air pressure (Strusoft AB, 2014). For the ventilation, the
minimum value recommended by BBR, namely 0.35 l/(s·m²) is used (Boverket, 2015).
The actual hot water use is provided by LKF and is measured 3.4 W/m² for the whole
building. The total annual energy use per square meter, referred to the heated floor area
Atemp in compliance with BBR, is 138 kWh/(m²ATempa), including the building’s system
electricity (for pumps, fans, lighting in common areas etc.).
The input data for the VIP model is presented in appendix A and the drawings of the
reference building is presented in appendix B.
Renovation scenarios
The intention is to investigate three scenarios, described in the list below:
1) Minor renovation, “business as usual” retrofit: Replacing the components that
have reached, or are very close to, the end of their lifetime by new ones that comply
with the minimum requirements of the national building code (in this case BBR).
2) Renovation of the entire building envelope to achieve the minimum thermal
transmittance values stated by BBR. This scenario is different than the previous
since the whole building envelope is updated to BBR-class.
3) Major renovation/renovation intervention: achieve at least 50% reduction of the
base case energy consumption. This is proposed to analyse how far energy savings
can be pushed to achieve voluntary building certifications, such as the Swedish
Miljöbyggnad (SGBC, 2016)
The intention is to apply passive measures (i.e. constructive measures on the envelope) for
the first two scenarios, and to implement active measures for the ambitious goals of the last
scenario, such as installing a heat recovery system for the ventilation. The heat recovery is
also tested in all scenarios to see how it affects the final energy consumption of the building.
The Miljöbyggnad certification had different criteria, here only the final energy
consumption is taken into account: the Gold and Silver levels mean that the final energy

69
consumption of the building is respectively 50% and 75% of the BBR value for that climate
zone.
6.1.3.1 Minor renovation scenario
The building has a huge glazed area due to the high number of windows, especially on the
southern side: The window-to-wall ratio is about 60%. One of the measures of this package
is to change the windows on the South side, from the old double-glazed or two panes to
modern windows with U-value lower than 1.3, as the BBR proposes. The windows are old
and would need to be changed anyway, since they have reached the end of their lifetime.
Those on the North side have an U-value of 1.7 W/(m2K) and are in better conditions, so
they are left in place. In addition to that, a simple adjustment of the internal temperature (by
adjusting the thermostat) from the present measured 22.8 degrees to 21 degrees will
contribute to save energy at no cost. BBR states that the operative room temperature cannot
be lower than 18 °C (20 °C in bathrooms) (Boveket, 2015).
Two different types of windows were investigated: Double and triple glazed. The former has
an U-value of 1.3 W/(m2 K) and a total g-value of 77%, while the latter has 1.2 W/(m2 K)
and 68%. Both have been simulated to see how the energy consumption of the building is
influenced, and it was decided to present the double glazed in the results since the energy
consumption differ little.
As an additional measure, the roof is insulated to achieve the minimum BBR requirements,
given its present high thermal transmittance (0.6 W/(m2 K)). The roof has been insulated
externally with 200 mm extruded polystyrene, XPS (as described in the state of the art), to
take the chance to renovate the old waterproofing layer. It was also covered with 20
additional mm of weather protection (asphalt). XPS has a very low density (35 kg/m3) and
will not add significant weight to the building structure.
In this scenario it is considered the application of a supply and exhaust mechanical
ventilation with heat recovery was also considered, given the high amount of energy loss
due to the ventilation. The heat recovery efficiency is supposed to be 85%.
There are four different sub-scenarios:
“Windows”: substitution of all windows on the southern side with double-glazed
ones
“Windows+roof”: same as before but with an addition of 200mm XPS on the roof
“Windows+HR”: same as “Windows” but with installation of a supply and exhaust
ventilation system with heat recovery with an efficiency of 85%
“Windows+roof+HR”: same as “Windows+roof” but with installation of a supply
and exhaust ventilation system with heat recovery with an efficiency of 85%

70
6.1.3.2 BBR renovation scenario
In this scenario, the building envelope elements are provided with enough external
insulation to reach the minimum thermal transmittance values recommended by BBR (see
Chapter 3.4). There are several insulation materials that would be suitable: XPS is chosen
again, since it is one the most used insulation materials in such projects. The envelope
elements are insulated as shown in Table 6.2.
Table 6.2. Insulation of envelope elements to meet BBR requirements
XPS thickness (mm) U-value according to BBR (W/m2K)
North wall 120 0.18
South wall 121 0.18
East/West wall 91 0.18
Ground floor 185 0.15
Roof 200 0.13
It was also assumed that the air tightness of the envelope elements improves when adding
insulation, reducing from 0.7 to 0.6 l/(s m2), calculated at 50 Pa pressure difference (q50).
The building has also the improvements from the previous scenario (new double glazed
windows on both south and north sides and 21 °C set point).
In this scenario, it is also considered the application of a supply and exhaust mechanical
ventilation with heat recovery, given the high amount of energy loss due to ventilation. The
heat recovery efficiency is supposed to be 85%.
There are two different sub-scenarios:
“BBR”: insulation of the opaque elements as above, windows as in the minor
renovation scenario
“BBR+HR”: same as above but with installation of a supply and exhaust ventilation
system with heat recovery with an efficiency of 85%
6.1.3.3 Major renovation scenario
The intention in this renovation scenario is to reach a 50% reduction in the final energy
consumption of the building compared to the base case. A parametric study was performed
to see how the energy performance is influenced by different insulation thicknesses and
window types. The three considered window types are the double glazed from the first
scenario with U = 1.3 W/(m2 K), and a triple glazed with U = 1 W/(m2 K) and U = 0.7
W/(m2 K). For every window type, three insulation thicknesses were taken into account, as
shown in Table 6.3. Insulation thicknesses greater than 250 mm were not considered
because they provide little benefit, as shown in the next chapter.

71
Table 6.3. Insulation thicknesses and corresponding U-values for the parametric study
Case/Orientation Base Below U=0.15 200 mm XPS 250 mm XPS
U
(W/m2K)
XPS (mm)/U
(W/m2K)
XPS (mm)/U
(W/m2K)
XPS (mm)/U
(W/m2K)
North/South wall 0.5 160 / 0.149 200 / 0.127 250 / 0.107
East/West wall 0.38 130/ 0.149 200 / 0.114 250 / 0.098
Ground floor 0.85 200 / 0.141 200 / 0.41 250 / 0.117
Roof 0.64 180 / 0.144 200 / 0.131 250 / 0.111
Insulation on the ground floor is added by insulating the basement ceiling. The intention of
having all the opaque components with a U-value below 0.15 was taken from the Passive
House (Passive House Institute, 2006). Again, the air tightness of the opaque elements is
assumed to be 0.6 l/(s m2). It is shown in Chapter 7 that it is not possible to attain a 50%
energy reduction only by improving the envelope, so it is also necessary to install the heat
recovery on the mechanical ventilation, which becomes then a supply and exhaust system
(the original system is just extract ventilation) to support it. The installed heat recovery
system is supposed to have an efficiency of 85%. There are two sub-scenarios that are
reported in the results:
“Major”: triple-glazed windows with an overall thermal transmittance of 0.7 W/(m2
K), insulation of the opaque elements as shown in Table 6.3, “Below U=0.15”
“Major+HR”: same as above but with installation of a supply and exhaust
ventilation system with heat recovery with an efficiency of 85%
In regards to the measures to be applied for the major renovation scenario, the parameters
considered for the envelope are the insulation thickness (which determines the thermal
transmittance) and the thermal transmittance of windows. A parametric study was
performed to see how those parameters influence the energy consumption of the building.
Three windows were tested: Double glazed with U=1.3 W/m2 K and triple glazed with U=1
and U=0.7 W/m2 K. The total solar transmittance is respectively 77%, 62% and 57%. The
analysed insulation levels are as in Table 6.3. The final energy consumption is tested with
and without the installation of a supply and exhaust ventilation system with heat recovery
with an efficiency of 85%.
6.2 Results
In this paragraph, the results from the simulations of the scenarios are presented. VIP-
Energy has the possibility to provide results according to the BBR 22 standard: The final
energy consumption is in terms of kWh/(m²ATempa).
6.3 Renovation scenarios result
The total final energy consumption of the building in the different sub-scenarios is shown in
Figure 6.4.

72
Figure 6.4. Annual final energy consumption for the building in the different scenarios
The dashed line represents the limit set by the BBR 22 for the zone IV, the south of Sweden,
which corresponds of a total yearly energy consumption of 75 kWh/( m²ATempa), for non-
electrical heated buildings, as shown in chapter 3.4.
Figure 6.5 shows the overall U-value of the building for the different scenarios. Once again,
the dashed line is the limit imposed by BBR. Upgrading the envelope components to the
threshold thermal transmittance values results in an overall U-value of 0.39 W/(m2K) right
below the 0.4 W/(m2K) limit.

73
Figure 6.5. Overall envelope U-value for the different scenarios
The energy consumption can be subdivided into heating energy to produce DHW, zone
heating and building electricity, Figure 6.6 shows how energy is split in the aforementioned
categories. The base case is compared with the ”windows + roof” scenario where the south
facing windows are replaced with new double glazed with U=1.3 W/(m2K) and the roof is
insulated according to BBR, then the “BBR” scenario where the envelope complies with the
minimum BBR values and finally the “major” scenario, with the opaque elements insulated
to reach U < 0.15 W/(m2 K) and triple glazed, passive house level windows (see chapter 6).
Figure 6.6. Annual energy consumption for the building in the different scenarios, split in electricity, zone
heating and DHW

74
The dashed line is again the limit of an annual consumption of 75 kWh/(m²ATempa): The
major renovation scenario is just above this value by 1 kWh/(m²ATempa).
The same scenarios with heat recovery are represented in Figure 6.7.
Figure 6.7. Annual energy consumption for the building in the different scenarios with heat recovery on
ventilation
The dashed line is still the BBR 75 kWh/(m²ATempa) threshold.
Figure 6.8. Annual final energy consumption of the building for different windows and insulation thicknesses

75
The different insulation thicknesses make the energy consumption differ, for every window
scenario, of just 1 kWh/( m²ATempa). Decreasing the thermal transmittance of the windows
by 0.3 W/m2K results in an energy saving of 4 kWh/( m²ATempa). The same considerations
can be made when introducing the heat recovery, as shown in Figure 6.9.
Figure 6.9. Annual final energy consumption of the building for different windows and insulation thicknesses,
with heat recovery
The insulation thickness affects the U-value as shown in Figure 6.10. The curves are not
linear, which means that the same increase in insulation thickness does not correspond to the
same decrease in heat transmittance.
Figure 6.10. U-value as a function of insulation thickness, opaque envelope elements

76
7 Discussion
Different scenarios were analysed to see how the energy consumption of the building is
affected by the proposed renovation solutions.
The scenarios windows+roof+HR and major have about the same annual final energy
consumption that satisfies the BBR limit for zone 4 in Sweden. It means that using double
glazed windows with an U-value of 1.3 W/(m2 K) combined with roof insulation and heat
recovery on a supply and exhaust ventilation system is equivalent to having all the opaque
elements with an U-value just below 0.15 W/(m2 K) and triple pane windows with U = 0.7
W/(m2 K) and no heat recovery. Replacing the windows on the South side is the first step to
reduce the final energy consumption, due to the present high thermal transmittance and the
high window to wall ratio (WWR). Just installing the above mentioned double-glazed
windows and installing the heat recovery on the ventilation system makes the final energy
consumption decrease 38% .
The building in its present conditions has an overall U-value of 0.74 W/(m2K): the windows
scenario is enough to take it down to 0.61 W/(m2K), while the BBR scenario is just below
the 0.4 W/(m2K) limit, namely with 0.39 W/(m2K). The major scenario goes as far as 0.3
W/(m2K).
In this study it is impossible to reach a 50% reduction in final energy consumption
compared to the present one without installing a mechanical ventilation system with heat
recovery, as shown in Figure 6.6. By upgrading the envelope in the major scenario, it is only
possible to achieve the BBR threshold of 75 kWh/(m²ATempa).
The application of a heat exchanger is necessary to reach optimal energy consumption
performances. When running the various simulations with heat exchanger, a decrease in the
zone heating and a slight increase in fan electricity compared to the sub-scenarios without
heat recovery is observed, due to the air pressure loss induced by the heat exchanger. The
maximum overall decrease in final energy consumption is 26 kWh/(m²ATempa) when
applying the heat recovery to the base case (an almost 20% decrease) and the minimum is
20 kWh/(m²ATempa) in the windows+roof+HR scenario. It can be therefore inferred that the
heat recovery provides at least a saving of 20 kWh/(m²ATempa) of total used energy. The
installation of heat recovery brings three scenarios under the BBR threshold, of which two
(BBR+HR, major+HR) under the 50% mark and one (major+HR) under the 56.25
kWh/(m²ATempa) Miljöbyggnad Silver requirement concerning energy consumption, with a
60% reduction. From the figures it can be seen how the heating demand for space heating
goes down dramatically, making it therefore necessary to evaluate measures for electricity
saving and production and also DHW production, such as with solar collectors.
When it comes to insulating the building envelope, a XPS insulation thickness over 200 mm
does not bring sensible benefits, since the thermal transmittance of the opaque elements
does not decrease linearly with the insulation thickness. For the same window types, with or
without heat recovery, the difference in the three insulation thickness cases in terms of final

77
energy consumption of the building is just of 1 kWh/(m²ATempa): it is therefore not worth to
exceed the insulation thicknesses described in the “Below U=0.15” case. Between the
installation in all the building of windows with an overall U-value of 1.3 W/(m2K) and 0.7
W/(m2K) there is a difference in the annual final energy consumption of the building of
about 8 kWh/(m²ATempa).

78
8 Conclusion
The aim of this thesis was to investigate the reasons driving renovation of multi-family post-
war buildings in Europe, the barriers and to identify a list of renovation solutions, whose
state-of-the-art was presented. The solutions found were applied to the refurbishment of a
lamellhus in Lund, Sweden, to see whether it is possible to reduce by 50% the energy
consumption of a Miljonprogram multi-family house by using technologies present on the
market
As for the first part, the limited number of projects analysed cannot give the considerations a
statistic dimension, but since some of the insights are common to many projects, it can be
inferred that they might have a more general value.
The main encountered motivations for renovation are usually the need for the building to
undergo some kind of refurbishment when some components reach the end of their lifetime,
the indoor climate that does not satisfy the minimum requirements anymore, energy bills
keep increasing as the building systems and envelope deteriorate, or a planned building
expansion. A study with more projects would be recommended to identify the frequency of
these reasons and therefore the most relevant. The present study might have identified the
most important ones but a more comprehensive study would also lead to the identification of
other reasons.
The most common barriers and issues encountered were: the lack of affordable financial
support to realize refurbishments, work processes where a great number of tenants are
involved, and the lack of guidelines for integrating the environmental questions from the
start of renovation processes. The same considerations as for the reasons for renovating can
be made: a more comprehensive study is required to assess the barriers with statistical
accuracy. Most of the 46 analysed projects are located in three countries, namely Italy,
Sweden and Germany. It would be more accurate to have almost the same number of
renovation projects from every European country, but the search for projects was
cumbersome.
The state-of-the-art was compiled according to the renovation solutions encountered in the
renovation projects: It was decided to include only those contributing directly to the energy
consumption reduction of the building, which means that measures such as water saving
devices were not considered in the state-of-the-art. Very innovative measures, i.e. still in the
research/test phase are not presented in this thesis, since it was intended to apply some of
the described solutions to the renovation of a Miljonprogram building in a way that could be
applied today according to the building codes and local requirements..
The most common barriers and issues encountered are the lack of affordable financial tools
to perform the project, working in situations where a great number of tenants is involved,
and the lack of guidelines for integrating the environmental questions from the beginning of
the renovation process.
As for the second part, it is possible to reach the target of a 50% reduction in energy
consumption, according to the performed simulations on a reference building: To do so, the

79
installation of a supply and exhaust ventilation system with heat recovery is crucial. It was
demonstrated that it is not possible to reach this goal by just improving the building
envelope: Heat recovery in this sense is necessary. When installing it, both the BBR+HR
and the major+HR scenarios can reach an energy consumption below both the BBR Zone
IV requirement (75 kWh/(m²ATempa)) and the 50% one (69 kWh/(m²ATempa)), having a total
yearly energy use of respectively 63 and 55 kWh/(m²ATempa)).
To reach the 50% reduction in energy consumption, it is therefore enough to replace all
windows with double glazed ones with a thermal total transmittance of U=1.3 W/(m2K),
install a supply and exhaust ventilation system with heat recovery and insulate the opaque
envelope elements to ensure that their U-values do not exceed the ones recommended by
BBR. This was achieved by insulating (with external XPS) the north and south facing walls
with 120 mm, the east and west walls with 90 mm, roof with 205 mm and the ground floor
with 185 mm. It is also possible to reach the Miljöbyggnad Silver level concerning energy
consumption, (75% of the BBR threshold) by having triple glazed windows with a thermal
transmittance of 0.7 W/(m2K), heat recovery and all the opaque elements with a U-value
below 0.15 W/(m2K). This level of insulation can for instance be reached with additional
external XPS insulation: 160 mm on the north/south facing walls, 130 mm on the east/west
facing walls, 180 mm on the roof and 200 mm on the ground floor.
Only XPS was analyzed as insulation material, since it was beyond the scope of this thesis
to make an accurate assessment of which insulation material would be the best suited for
renovation. It was chosen due to its low thermal conductivity and due to the fact that it was
frequently encountered in the reviewed renovation projects.
The building has a huge glazed area, with a WWR of almost 40% on the north side and very
close to 60% on the south side, which means that the glazing plays a very important role in
defining the measures for the energy consumption targets of the building.
Other parameters, such as a life cycle assessment or a life cycle cost analysis, were not taken
in consideration since the aim of this thesis is to prove that it is possible to achieve a 50%
reduction in the energy use of a building by implementing existing renovation measures.
Another aspect that was neglected was the internal comfort conditions: Before renovating,
an accurate analysis of the impact of the measures to the indoor comfort has to be assessed
to make sure that it becomes better instead of worsening. The building was not equipped
with a cooling system, therefore the cooling need was neglected, which has an impact on the
indoor comfort. Simulations were performed by using the built-in templates of VIP-Energy
concerning the temperature range, which was set to 27 degrees for the Feby template. By
simulating with an indoor temperature limit of 27 °C gives in the worst case a cooling need
of 1% of the total annual energy consumption of the building, and cooling that occurs in a
period of six weeks. If a limit of 25 °C is set, the cooling need becomes 2% in the worst
case, with the cooling period spanning through a period of 11 weeks. The more the building
gets insulated and airtight, the greater the risk of reaching higher temperatures on the inside.
To reduce the electricity consumption of the building, some measures are recommended but
were not investigated in detail and therefore not added in the results section. The pumps
present in the building now have a total power of 3050 W. Some of them are old but still in

80
working conditions, so it was decided not to replace them at the moment, also since the
common practice encountered in the analysis of the Swedish renovation market is to change
components only when their lifetime is ended. Replacing them with more efficient ones
would reduce the total power by 600 W, 20% of the original installed power. It should also
be considered to replace the current halogen/fluorescent lighting in common areas with LED
to further decrease the electricity consumption of the building. A more detailed analysis
should be made in this direction.
In this work, the thermal bridging coefficient has not been changed throughout the
simulations, since it was supposed that no measures were taken to directly address the issue
while renovating, due to its complexity. Thermal bridges, though, are more relevant when
the building gets more insulated and airtight, so it is recommended to consider them for
further improvements of the energy performance.
It would also be interesting to investigate whether the proposed solution packages could be
implemented with success for the other Miljonprogram building typologies or other climate
zones in Sweden. Further studies should also consider the installation of PV panels to
address the electricity demand and solar collectors to produce DHW.

81
9 References
AlltOmLED, 2015. Vad är LED?. [Online]
Available at: http://www.alltomled.se/guider/vad-ar-led/
[Accessed 2016].
AlltOmLED, 2105. Fördelar & Nackdelar med LED. [Online]
Available at: http://www.alltomled.se/guider/fordelar-nackdelar-med-led/
[Accessed 2016].
Andersson, O., 2015. Miljonprogrammet - Riva eller renovera?, Umeå: Tekniska högskolan
Umeå.
ASHRAE, 2016. Standards, Research & Technology. [Online]
Available at: https://www.ashrae.org/standards-research--technology/advanced-energy-
design-guides/50-percent-aedg-free-download
Beem-Up, 2013. Building Energy Efficiency for Massive Market Uptake. [Online]
Available at: http://www.beem-up.eu/
[Accessed 2016].
Berglund, T., 2009. Miljardkrav för renovering av miljonprogrammet. [Online]
Available at: http://www.svd.se/miljardkrav-for-renovering-av-miljonprogrammet
Bernjaro, M. & Pedram, A., 2012. Renovering av Miljonprogrammet - Ur ett
ägarsperspektiv, Stockholm: KTH.
Boveket, 2015. BBR Avsnitt 6. [Online]
Available at: http://www.boverket.se/globalassets/vagledningar/kunskapsbanken/bbr/bbr-
22/bbr-avsnitt-6
[Accessed 2016].
Boverket, 2014. BABS från 1947 till 1968. [Online]
Available at: http://www.boverket.se/sv/lag--ratt/aldre-lagar-regler--handbocker/aldre-
regler-om-byggande/babs-fran-1947-till-1968/
[Accessed 26 May 2016].
Boverket, 2014. Bygg och renovera energieffektivt. [Online]
Available at: http://www.boverket.se/sv/byggande/bygg-och-renovera-energieffektivt/
[Accessed May 2016].
Boverket, 2014. Under miljonprogrammet byggdes en miljon bostäder. [Online]
Available at:
http://www.boverket.se/sv/samhallsplanering/stadsutveckling/miljonprogrammet
Boverket, 2015. BBR – Boverkets byggregler. [Online]
Available at: http://www.boverket.se/sv/lag--ratt/forfattningssamling/gallande/bbr---bfs-

82
20116/
[Accessed May 2016].
Boverket, 2015. Regelsamling för byggande BBR 2015. [Online]
Available at: http://www.boverket.se/sv/om-boverket/publicerat-av-
boverket/publikationer/2015/regelsamling-for-byggande-bbr-2015/
[Accessed 2016].
BPIE, 2011. Europe´s buildings under the microscope, s.l.: BPIE.
BPIE, 2014. A guide to develop strategies for building energy renovation, s.l.: BPIE.
BPIE, 2016. Renovating the EU building stock. [Online]
Available at: http://bpie.eu/focus-areas/renovating-the-eu-building-stock/
[Accessed May 2016].
Builing Performance Institute, 2016. Technically speaking: Whole-House Mechanical
Ventilation. [Online]
Available at: http://www.bpihomeowner.org/blog/technically-speaking-whole-house-
mechanical-ventilation#sthash.wq2qh74h.dpuf
[Accessed 2016].
Carbon Trust, 2014. How to implement lighting controls, s.l.: s.n.
Casaretto, A., 2013. Geopower. [Online]
Available at:
http://www.geopower.it/Progetto_e_direzione_lavori_Diagnosi_energetica_certificazione_e
nergetica_efficienza_energetica_detrazioni_fiscali_65_riqualificazione_energetica/
[Accessed May 2016].
CEPI - UIPI, 2010. Landlord/Tenant Dilemma , s.l.: s.n.
ClimateTechWiki, 2016. Building Energy Mangement Systems (BEMS). [Online]
Available at: http://www.climatetechwiki.org/technology/jiqweb-bems
[Accessed 2016].
CP Electronics, 2016. Presence and Absence Detection Explained. [Online]
Available at: http://www.cpelectronics.co.uk/energy-saving-products/presence-detectors-
pir-sensors-and-microwave-sensors
[Accessed 2016].
Cumo, F. et al., 2014. Intervento dimostrativo di riqualificazione energetica in un edificio
pubblico con destinazione d'uso scolastico, s.l.: ENEA.
CWCT, 2011. External shading devices - Technical Note No 72, s.l.: s.n.

83
Designing Buildings Wiki, 2015. NIght-time Purging. [Online]
Available at: http://www.designingbuildings.co.uk/wiki/Night-time_purging
[Accessed 2016].
Dipasquale, C., Fedrizzi, R., Bertesina, D. & Bellini, A., 2015. Energy building retrofitting
of a multifamily house: a case study, proceedings of BSA 2015. Bolzano, s.n.
Duran, Ö., Taylor, S. & Lomas, K., 2015. The impact of refurbishment on thermal comfort.
Energy Procedia, Volume 78, pp. 877-882.
Duration Windows, 2016. Aluminium Secondary Glazing. [Online]
Available at: http://www.duration.co.uk/Secondary-Glazing.asp
[Accessed 2016].
ECEEE, n.d. EPBD FAQs: Existing buildings. [Online]
Available at: http://www.eceee.org/policy-areas/Buildings/FAQ-recast-of-EPBD/FAQ-
existing-buildings
[Accessed May 2016].
Ecofys, 2012. Renovation tracks for Europe up to 2050 , s.l.: s.n.
EcoWho, 2010. The importance of roof insulation. [Online]
Available at: http://www.ecowho.com/articles/9/The_importance_of_roof_insulation.html
[Accessed March 2016].
Eicker, U., Demir, E. & Gürlich, D., 2015. Stategied for cost efficient refurbishment and
solar energy integration in European Case Study buildings. Energy and Buildings, Volume
102, pp. 237-249.
Electrotec Energy, 2016. Olika typer av solceller. [Online]
Available at: http://electrotecenergy.se/typer-av-solceller/
[Accessed 2016].
Elitfönster, 2010. Double glazing combines old and new. [Online]
Available at: http://www.elitfonster.se/en/Window-knowledge/Different-windows/Double-
glazed-windows/
[Accessed 2016].
Energy Informative, 2014. Solar Energy Pros and Cons. [Online]
Available at: http://energyinformative.org/solar-energy-pros-and-cons/
[Accessed May 2016].
Energy Saving Trust, 2014. Energy efficient windows. [Online]
Available at: http://www.energysavingtrust.org.uk/domestic/energy-efficient-windows
[Accessed May 2016].
Energy Star, 2016. Building products. [Online]
Available at:

84
https://www.energystar.gov/products/building_products/residential_windows_doors_and_sk
ylights/key_product_criteria
[Accessed 2016].
Energyquarter, 2015. Tips for Roof Insulation. [Online]
Available at: http://www.energyquarter.com/energy-saving/insulation/tips-for-roof-
insulation/
[Accessed 2016].
ENTRANZE , 2014. Overview of the EU-27 building policies and programmes, s.l.: s.n.
Esposito, F. & De Sensi, G., 2007. Progetto di riqualificazione energetica della scuola
media “Pitagora” viale I maggio – Lamezia Terme. Relazione tecnico illustrativa, s.l.: s.n.
EU Commission, 2010. EUR- Lex. [Online]
Available at: http://eur-lex.europa.eu/legal-
content/EN/ALL/;ELX_SESSIONID=FZMjThLLzfxmmMCQGp2Y1s2d3TjwtD8QS3pqdk
hXZbwqGwlgY9KN!2064651424?uri=CELEX:32010L0031
[Accessed May 2016].
EU Commission, 2016. European Commission - Energy. [Online]
Available at: https://ec.europa.eu/energy/en/topics/energy-efficiency/buildings/nearly-zero-
energy-buildings
[Accessed 26 May 2016].
European Commission, 2015. 2050 Energy strategies. [Online]
Available at: https://ec.europa.eu/energy/en/topics/energy-strategy/2050-energy-strategy
[Accessed April 2016].
European Commission, 2015. Europe 2020 targets. [Online]
Available at: http://ec.europa.eu/europe2020/europe-2020-in-a-
nutshell/targets/index_en.htm
[Accessed 2016].
European Parliament, 2002. [Online]
Available at: http://eur-
lex.europa.eu/LexUriServ/LexUriServ.do?uri=OJ:L:2003:001:0065:0071:EN:PDF
EuroPHit , 2014. CS14 Wilmcote Multifamily House In Portsmouth. [Online]
Available at: http://europhit.eu/cs14-wilmcote-multifamily-house-portsmouth
[Accessed May 2016].
EuroPHit, 2014. OP04 Student House, Maison Des Industries Agricoles Et Alimentaires,
Paris. [Online]
Available at: http://europhit.eu/op04-student-house-maison-des-industries-agricoles-et-
alimentaires-paris
[Accessed May 2016].

85
EuroPHit, 2014. OP17 Sonnenstrasse 39, Zellingen Am Main. [Online]
Available at: http://europhit.eu/op17-sonnenstrasse-39-zellingen-am-main
[Accessed May 2016].
Eurostat, 2015. Consumption of energy. [Online]
Available at: http://ec.europa.eu/eurostat/statistics-
explained/index.php/Consumption_of_energy
[Accessed April 2016].
Eurostat, 2015. Distribution of population by dwelling type. [Online]
Available at: http://ec.europa.eu/eurostat/statistics-
explained/index.php/File:Distribution_of_population_by_dwelling_type,_2014_(%25_of_p
opulation)_YB16.png
[Accessed May 2016].
Eurostat, 2015. Distribution of population by tenure status. [Online]
Available at: http://ec.europa.eu/eurostat/statistics-
explained/index.php/File:Distribution_of_population_by_tenure_status,_2014_(%25_of_po
pulation)_YB16.png
[Accessed April 2016].
Eurostat, 2015. Housing statistics. [Online]
Available at: http://ec.europa.eu/eurostat/statistics-explained/index.php/Housing_statistics
[Accessed April 2016].
Evangelisti, L., Guattari, C. & Gori, P., 2015. Energy Retrofit Strategies for Residential
Building Envelopes: An Italian Case Study of an Early-50s Building. Sustainability,
Volume 7, pp. 10445-10460.
Everwarm, 2014. External Wall Insulation. [Online]
Available at: http://www.everwarmgroup.com/external-wall-insulation.php
[Accessed 2016].
Everwarm, 2016. Internal Wall Insulation. [Online]
Available at: http://www.everwarmgroup.com/internal-wall-insulation.php
[Accessed 2016].
Evola, G. & Marletta, L., 2014. The Effectiveness of PCM Wallboards for the Energy
Refurbishment of Lightweight Buildings. Energy pRocedia, Volume 62, pp. 13-21.
Femenias, P., Thuvander, L., Mjörnell, K. & Lane, A.-L., 2015. Koll på hållbar renovering.
Bygg & Teknik, February.
Gagliano, A., Nocera, F., Patania, F. & Capizzi, G., 2013. A case study of Energy
Efficiency Retrofit in social housing units. Energy Procedia, Volume 42, pp. 289-298.

86
Gentile, N., Thorbjörn, L. & Dubois, M.-C., 2014. Lighting Control Systems in Peripheral
Offices Rooms at High Latitude: Measurements of Electricity Savings and Users
Preferences. Energy Procedia, Volume 57, p. 1987–1996.
Glass Eduction Center, 2015. What is Low-E Glass?. [Online]
Available at: http://educationcenter.ppg.com/glasstopics/how_lowe_works.aspx
[Accessed 2016].
Green Match, 2016. Condensating Boilers. [Online]
Available at: http://www.greenmatch.co.uk/boilers/condensing-boilers
[Accessed 2016].
Green Match, 2016. Condesing vs non condensing boilers. [Online]
Available at: http://www.greenmatch.co.uk/blog/2015/10/condensing-vs-non-condensing-
boilers
[Accessed 2016].
Green Roof Technology, 2016. Green Roof Types. [Online]
Available at: http://www.greenrooftechnology.com/green-roof-types
[Accessed 2016].
Guida Prodotti, 2016. Radiatori elettrici. [Online]
Available at: http://www.guidaprodotti.com/casa/radiatori-elettrici.html
[Accessed 2016].
Hall, T. & Vidén, S., 2005. The Million Homes Programme: a review of the great Swedish
planning project. Planning Perspectives, 20(3), pp. 301-328.
Hastig, S. & Tapper Jansson, S., 2014. Val av energieffektiviserande åtgärder - En studie av
fastighetsägarnas investeringsbedömning vid renovering, Lund: LTH.
Heier, J., 2013. Energy Efficiency through Thermal Energy Storage - Possibilities for the
Swedish Building Stock, Stockholm: KTH.
Homebuilding & Renovation, 2016. Internal Wall Insulation. [Online]
Available at: https://www.homebuilding.co.uk/internal-wall-insulation/
[Accessed 2016].
HPA , 2014. Types of Heat Pump. [Online]
Available at: http://www.heatpumps.org.uk/TypesOfHeatPump.html
[Accessed May 2016].
IEA, 2008. Energy efficiency requirements in building codes, energy efficiency policies for
new buildings, s.l.: OECD/IEA.
IEA, 2011. Building Renovation Case studies - IEA ECBCS Annex 50, s.l.: IEA.
87
IEA, 2012. Energy Technology Perspectives 2012: Pathways to a Clean Energy System, s.l.:
s.n.
IEA, 2013. Modernising Building Energy Codes, s.l.: IEA.
IEA, 2013. Transition to sustainable buildings – Strategies and opportunities to 2050, s.l.:
s.n.
Inoutic, 2016. U-value calculation for windows. [Online]
Available at: http://www.inoutic.de/en/tips-on-window-purchase/saving-energy/u-value-for-
windows/
[Accessed March 2016].
iNSPiRe project, 2014. Survey on the energy needs and architectural features of the EU
building stock, s.l.: s.n.
International Renewable Energy Agency, 2013. Thermal Energy Storage. [Online]
Available at: https://www.irena.org/DocumentDownloads/Publications/IRENA-
ETSAP%20Tech%20Brief%20E17%20Thermal%20Energy%20Storage.pdf
[Accessed 2016].
ISOCELL, 2016. Airtight- Why Build Airtight. [Online]
Available at: http://isocell.ie/why-airtight/
[Accessed May 2016].
Itard, L., Meijer, F., Vrins, E. & Hoiting, H., 2008. Building renovation and modernisation
in Europe: state of the art review, s.l.: ERABUILD project.
Johan Rådberg, 2012. Längre inåt landet. [Online]
Available at: http://langreinatlandet.blogspot.se/2012/02/tradgardsstad-trevaningssystemet-
och.html
[Accessed 2016].
Jones Mei, P., 2011. Building Energy Management Systems (BEMS). Energy in Buildings
& Industry, October.
Konstantinous, T. & Knaack, U., 2011. Refurbishment of Residential Buildings: A Design
Approach to Energy-Efficiency Upgrades. Procedia Erngineering, Volume 21, pp. 666-675.
Lawless, J., 2015. The COMPLETE (Revised) Radiator Buying Guide – 2015. [Online]
Available at: http://www.bestheating.com/info/blog/the-complete-revised-radiator-buying-
guide-2015/
[Accessed May 2016].
Lawrence Berkeley National Laboratory, 2016. Whole-building Ventilation System Pros and
Cons. [Online]
Available at: https://resaveguide.lbl.gov/system-pros-and-cons
[Accessed May 2016].
88
LEHR, 2009. Apartment building - Ludwigshafen. [Online]
Available at: http://www.lehr.be/EN-P-Ludwigshafen.htm
[Accessed May 2016].
LEHR, 2009. Apartment building, Wezembeek-Oppem. [Online]
Available at: http://www.lehr.be/EN-P-Sterrenveld.htm
[Accessed May 2016].
Levin, P., Jidinger, A. & Jakobsson, N., 2011. Projektet Rekorderlig renovering,
Objektrapport för Gröna gatan 2 – Uppsalahem Etapp 1 & 2, s.l.: BeBo.
LKF, 2016. Eddan 2 - Vikingavägen Lund, Lund: Lunds kommunala fastigheter AB.
Lohse, R., Staller, H. & Riel, M., 2016. The Economic Challenges of Deep Energy
Renovation—Differences, Similarities, and Possible Solutions in Central Europe: Austria
and Germany,. Orlando, ASHRAE.
Low Carbon Housing, 2016. Types of thermal bridges. [Online]
Available at:
http://www.leedsbeckett.ac.uk/teaching/vsite/low_carbon_housing/thermal_bridging/types/i
ndex.htm
[Accessed 2016].
Low energy buildings database, 2010. Refurbishment of Social Housing Stock. [Online]
Available at: http://www.lowenergybuildings.org.uk/viewproject.php?id=124
[Accessed May 2016].
Magnusson, T. & Löfberg, A., 2015. Energieffektivisering av ett flerbostadshus inom
miljonprogrammet, Karlstad: Fakulteten för hälsa-, natur- och teknikvetenskap.
Meijer, F., Itard, L. & Sunikka-Blank, M., 2009. Comparing European residential building
stocks: performance, renovation and policy opportunities. Building Research & Information,
37:5-6, pp. 533-551.
Miceli, E., 2009. Ristrutturazione edilizia di un edificio residenziale con applicazione di
tecnologie per il risparmio energetico e la produzione di energie alternative, s.l.: s.n.
National Energy Foundation, 2016. Condensing Boilers. [Online]
Available at: http://www.nef.org.uk/knowledge-hub/view/condensing-boilers
[Accessed 2016].
Nilsson, R., Jönsson, M. & Lätth, A., 2011. Energirenovering av miljonprogramshus,
Jönköping: Tekniska högskolan Jönköping.
Olofsson, C., Holmberg, J. & Bjurenvall, T., 2015. Bostadsbyggandet ökar kraftigt. [Online]
Available at: http://www.scb.se/sv_/Hitta-statistik/Artiklar/Bostadsbyggandet-okar-kraftigt/

89
Olsson, E., 2015. Energieffektivisering av flerbostadshusen på Granbergshöjden - En studie
om solenergi och enerieffektivisering, Gävle: Akademin för Teknik och miljö.
Olsson, S., Liljenström, C. & Malmqvist, T., 2014. Miljöstyrning av renoveringsprocessen:
intervjustudie samt litteratur- och projektsammanställning, Stockholm: KTH.
Olympic Construction, 2015. Cavity wall insulation. [Online]
Available at: http://olympic-construction.co.uk/free-cavity-wall-insulation/
[Accessed March 2016].
Passipedia, 2015. General principles for improving airtightness. [Online]
Available at:
http://passipedia.passiv.de/ppediaen/planning/airtight_construction/general_principles/princi
ples_for_improving_airtightness
[Accessed 2016].
Passive House Institute, 2006. Windows for Passive Houses – Superior Quality of
Transparent Components. [Online]
Available at:
http://www.passivhaustagung.de/Passive_House_E/windows_passive_houses_06.html
[Accessed May 2016].
Passive House Institute, 2015. Passive House requirements. [Online]
Available at: http://www.passiv.de/en/02_informations/02_passive-house-
requirements/02_passive-house-requirements.htm
[Accessed May 2016].
Passivhaus-Datenbank, 2015. Passivhaus-Datenbank. [Online]
Available at: http://passivhausprojekte.de/index.php#d_4549
[Accessed May 2016].
Pilkington, 2015. Vetro e risparmio energetico. Isolamento termico - Bollettino Tecnico.
[Online]
Available at: https://www.pilkington.com/resources/isotermico.pdf
[Accessed March 2016].
Popular Mechanics, 2016. How it Works: Heat Recovery Ventilator. [Online]
Available at: http://www.popularmechanics.com/home/interior-projects/how-
to/a149/1275121/
[Accessed 2016].
Power, A. & Zulauf, M., 2011. Cutting Carbon Costs: Learning from Germany’s Energy
Saving Program, s.l.: Whatworks Collaborative.
Qual Energia, 2007. Erba e piante sul tetto: costi e vantaggi dei tetti verdi. [Online]
Available at: http://www.qualenergia.it/articoli/20150520-erba-e-piante-sul-tetto-costi-e-
vantaggi-dei-tetti-verdi
[Accessed 2016].

90
QualEnergia, 2016. Solare termico e caldaia a gas: costi e risparmi. [Online]
Available at: http://www.qualenergia.it/articoli/20141116-solare-termico-e-caldaia-gas-
costi-e-risparmi
[Accessed 2016].
QualiGlass Windows & Doors , 2016. Window Glass. [Online]
Available at: http://qualiglasswindows.com/windows/window-glass/
[Accessed 2016].
RESHAPE, 2009. Energy performance certification and the development of renovation
strategies in social housing, s.l.: s.n.
Rockwool, n.d. Rockwool. [Online]
Available at: http://www.rockwool.se/v%C3%A4gledning/bbr+-
+boverkets+byggregler/fyra+klimatzoner
Rossetto, G., 2010. Progetto casa clima - relazione tecnica, s.l.: Pozzebon Home.
Schiavoni, S., D'Alessandro, F., Bianchi, F. & Asdrubali, F., 2016. Insulation materials for
the building sector: A review and comparative analysis.. Renewable and Sustainable Energy
Reviews, Issue 62, pp. 988-1011.
SGBC, 2016. Miljöbyggnad. [Online]
Available at: https://www.sgbc.se/var-verksamhet/miljoebyggnad
[Accessed June 2016].
Sjödin, E., 2014. Renovering av miljonprogrammet tillUmeå kommuns nybyggnadskrav för
energianvändning, Umeå: Umeå tekniska högskola.
Spegelj, T., Zegarac Leskovar, V. & Premrov, M., 2016. Application of the timber-glass
upgrade module for energy refurbishment of the existing energy-inefficient multi-family
buildings. Energy and Buildings, Volume 116, pp. 362-375.
Statistiska Centralbyrån, 2016. Statistikdatabasen. [Online]
Available at: http://www.statistikdatabasen.scb.se/pxweb/sv/ssd/START__BO__BO0104
[Accessed March 2016].
Stockholms stad, 2014. Hållbara Järva, Stockholm: Stockholms stad.
Strusoft AB, 2014. VIP-Energy Manual. [Online]
Available at: http://www.vipenergy.net/Manual.htm
[Accessed 2016].
Strusoft AB, 2016. VIP-Energy. [Online]
Available at: http://strusoft.com/products/vip-energy
[Accessed 2016].

91
Studio Tecnico Vettori, 2006. Riqualificazione energetica di edificio per civile abitazione
anni ´50, s.l.: s.n.
Suárez, R. & Fernández-Agüera, J., 2015. Passive energy strategies in the retrofitting of the
residential sector: A practical case study in dry hot climate. Building simulations, Volume 8,
p. 593–602.
Superglass, 2016. Cavity Blown Wool Insulation. [Online]
Available at: http://www.superglass.co.uk/products/superwhite-40/
[Accessed 2016].
Svensk Fjärrvärme , 2016. District heating. [Online]
Available at: http://www.svenskfjarrvarme.se/In-English/District-Heating-in-
Sweden/District-Heating/
[Accessed 2016].
Svensk Fjärrvärme, 2016. Så funkar fjärrvätme. [Online]
Available at: http://www.svenskfjarrvarme.se/Fjarrvarme/Sa-funkar-fjarrvarme/
[Accessed 2016].
TECNALIA, 2014. Technical solutions for energy reduced and renewable energy sources
for optimal energy efficient renovation, s.l.: s.n.
Termosifoni, 2016. Termosifoni, radiatori e caloriferi. [Online]
Available at: http://www.termosifoni.org/
[Accessed April 2016].
The Green Age, 2014. Coefficient of Performance and Seasonal Performance Factor.
[Online]
Available at: http://www.thegreenage.co.uk/coefficient-of-performance-seasonal-
performance-factor/
[Accessed May 2016].
The Renewable Energy Hub, 2016. The different types of solar thermal panel collectors.
[Online]
Available at: https://www.renewableenergyhub.co.uk/the-different-types-of-solar-thermal-
panel-collectors.html
[Accessed 2016].
TheGreenAge, 2014. Insulating Roof. [Online]
Available at: http://www.thegreenage.co.uk/tech/insulating-roof/
[Accessed 2016].
TheGreenAge, 2016. External Solid Wall Insulation. [Online]
Available at: http://www.thegreenage.co.uk/tech/external-solid-wall-insulation/
[Accessed May 2016].

92
TheGreenAge, 2016. Thermostatic Radiator Valves (TRVs). [Online]
Available at: http://www.thegreenage.co.uk/tech/thermostatic-radiator-valves-trv/
[Accessed 2016].
Thuvander, L., Femenías, P., Mjörnell, K. & Pär, M., 2012. Unveiling the Process of
Sustainable Renovation. Sustainability, Volume 4, pp. 1188-1213.
Thuvander, L., Femenias, P., Xykogianni, M. & Brunklaus, B., 2015.
Renoveringsbarometern: Omfattning och karaktär av renoveringar i bostadshus. Bygg &
Teknik, February.
U.S Departement of Energy, 2009. Energy Efficiency and Renewable Energy. [Online]
Available at:
http://apps1.eere.energy.gov/buildings/publications/pdfs/ssl/lifetime_white_leds.pdf
[Accessed 2016].
U.S Departement of Energy, 2013. Energy Efficiency & Renewable Energy. [Online]
Available at:
http://apps1.eere.energy.gov/buildings/publications/pdfs/ssl/led_energy_efficiency.pdf
[Accessed 2016].
USwitch, 2016. Cavity wall insulation and solid wall insulation. [Online]
Available at: https://www.uswitch.com/insulation/guides/wall-insulation-types/
[Accessed 2016].
USwitch, 2016. Loft or roof insulation. [Online]
Available at: http://www.uswitch.com/insulation/guides/how-to-insulate-a-loft/
[Accessed 2016].
Wanga, Q., Laurenti, R. & Holmberg, S., 2015. A novel hybrid methodology to evaluate
sustainable retrofitting in existing Swedish residential buildings,, 2015. Sustainables cities
and society, Volume 16, pp. 24-38.
Warmec Scandinavia, 2016. Olika typer av solpaneler. [Online]
Available at: http://www.warmec.se/index.php?page=olika-
solpaneler&phpMyAdmin=5af186e89598d381b64becfce8668146
[Accessed 2016].
Veronese, F., 2011. Riqualificazione energetica, relazione tecnica, s.l.: s.n.
Vidén, S., 2012. Rekordårens bostäder – en viktig resurs för hållbar utveckling. In:
Miljonprogrammet-utveckla eller avveckla?. Stockholm: Formas fokuserar, pp. 21-40.
Wikipedia, 2016. District heating - Pros and Cons. [Online]
Available at: https://en.wikipedia.org/wiki/District_heating#Pros_and_cons
[Accessed 2016].

93
Wikipedia, 2016. Flerbostadshus. [Online]
Available at: https://sv.wikipedia.org/wiki/Flerbostadshus
[Accessed March 2016].
Wikipedia, 2016. Thin-film solar cell. [Online]
Available at: https://en.wikipedia.org/wiki/Thin-film_solar_cell
[Accessed June 2016].
VVS Företag, 2009. Renoveringshandboken för hus byggda 1950-75. s.l.:VVS Företag.
Zhenjun Ma, P. C. D. D. L. L., 2012. Existing building retrofits: Methodology and state-of-
the-art. Energy and Buildings 55, pp. 889-902.
List of figures
Figure 1.1. Conceptual scheme of the thesis
Error! Reference source not found.Figure 2.1. Distribution of population by tenure status,
2014 (% of population)
Figure 2.2. Distribution of population by dwelling type, 2014 (% of population)
Figure 2.3. Typical lamellhus in Linero, Lund, reference building for this thesis, built 1972
Figure 2.4. Typical punkthus in, Farsta
Figure 2.5. Typical loftgångshus in Möllevång, Lund, built 1964
Figure 3.1. Climate zones in Sweden
Figure 6.3. Reference building south facade with balconies
Figure 6.4. Annual final energy consumption for the building in the different scenarios
Figure 6.5. Overall envelope U-value for the different scenarios
Figure 6.6. Annual energy consumption for the building in the different scenarios, split in
electricity, zone heating and DHW
Figure 6.7. Annual energy consumption for the building in the different scenarios with heat
recovery on ventilation
Figure 6.8. Annual final energy consumption of the building for different windows and
insulation thicknesses
Figure 6.9. Annual final energy consumption of the building for different windows and
insulation thicknesses, with heat recovery
Figure 6.10. U-value as a function of insulation thickness, opaque envelope elements
List of tables
Table 2.1. Percentage of built stock in Europe according to age
Table 2.2. Number of single- and multi-family buildings in Sweden
Table 3.1. Maximum energy consumption for the different climate zones according to BBR
Table 3.2. Maximum envelope transmittance values according to BBR
Table 4.2. Overview of the projects studied
Table 6.1. Heat transfer coefficients (U value) for building elements

94
Table 6.2. Insulation of envelope elements to meet BBR requirements
Table 6.3. Insulation thicknesses and corresponding U-values for the
Table 10.1. General inputs for reference building
Table 10.2. Climate data for reference building
Table 10.3. Building elements 1-Dimmensional
Table 10.4. Building elements 2-Dimensional
Table 10.5. Building elements 3-Dsimensional
Table 10.6. Description of the reference building
Table 10.7. Shading device
Table 10.8. Description of building parts
Table 10.9. Operating data for the reference building
Table 10.10. Operating scheme
Table 10.11. Input for ventilation
Table 10.12. Operating scheme for mechanical ventilation fan
Table 10.13. Heat supply input for the reference building
Table 10.14. Other input data for the reference building
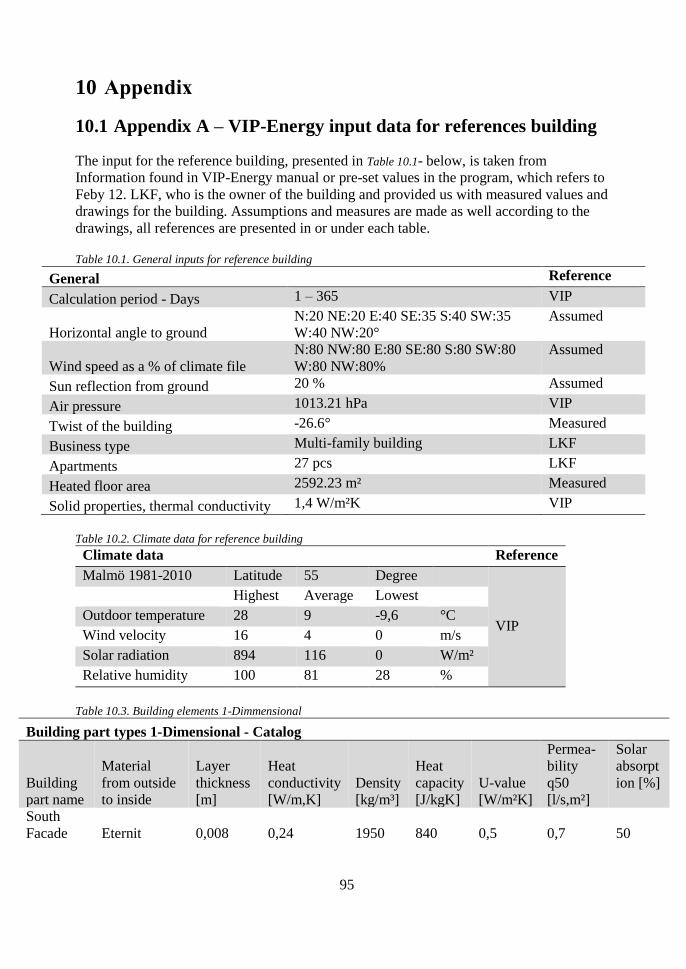
95
10 Appendix
10.1 Appendix A – VIP-Energy input data for references building
The input for the reference building, presented in Table 10.1- below, is taken from
Information found in VIP-Energy manual or pre-set values in the program, which refers to
Feby 12. LKF, who is the owner of the building and provided us with measured values and
drawings for the building. Assumptions and measures are made as well according to the
drawings, all references are presented in or under each table.
Table 10.1. General inputs for reference building
General Reference
Calculation period - Days 1 – 365 VIP
Horizontal angle to ground
N:20 NE:20 E:40 SE:35 S:40 SW:35
W:40 NW:20°
Assumed
Wind speed as a % of climate file
N:80 NW:80 E:80 SE:80 S:80 SW:80
W:80 NW:80%
Assumed
Sun reflection from ground 20 % Assumed
Air pressure 1013.21 hPa VIP
Twist of the building -26.6° Measured
Business type Multi-family building LKF
Apartments 27 pcs LKF
Heated floor area 2592.23 m² Measured
Solid properties, thermal conductivity 1,4 W/m²K VIP
Table 10.2. Climate data for reference building
Climate data Reference
Malmö 1981-2010 Latitude 55 Degree
VIP
Highest Average Lowest
Outdoor temperature 28 9 -9,6 °C
Wind velocity 16 4 0 m/s
Solar radiation 894 116 0 W/m²
Relative humidity 100 81 28 %
Table 10.3. Building elements 1-Dimmensional
Building part types 1-Dimensional - Catalog
Building
part name
Material
from outside
to inside
Layer
thickness
[m]
Heat
conductivity
[W/m,K]
Density
[kg/m³]
Heat
capacity
[J/kgK]
U-value
[W/m²K]
Permea-
bility
q50
[l/s,m²]
Solar
absorpt
ion [%]
South
Facade Eternit 0,008 0,24 1950 840 0,5 0,7
50

96
Wooden
studs +
mineral wool 0,095 0,058 87 961
Chipboard 0,015 0,14 600 2300
Gypsum 0,013 0,22 900 1100
North
Facade Concrete 0,08 1,7 2300 800 0,5 0,7
50
Wooden
studs +
mineral wool 0,094 0,058 87 961
Chipboard 0,014 0,14 600 2300
Gypsum 0,013 0,22 900 1100
Roof Asfaboard 0,002 0,18 1300 920 0,647 0,7 70
Cast concrete 0,1 0,14 550 1050
Mineral wool 0,105 0,036 50 840
East &
West
Facade Concrete 0,08 1,7 2300 800 0,35 0,7
50
Cellular
plastic
Insulation 0,93 0,036 25 1400
Concrete 0,08 1,7 2300 800
Heavy
inner wall Concrete 0,18 1,7 2300 800 3,476 0,1
0
Light
inner wall Gypsum 0,013 0,022 900 1100 0,751 0,1
0
Wooden
studs 0,05 0,045 87 961
Gypsum 0,013 0,22 900 1100
Ground
floor
Wood wool
plate 0,07 0,075 200 1510 0,855 0,1
0
Concrete 0,21 1,7 2300 800
Internal
floor Concrete 0,21 1,7 2300 800 2,628 0,1
0
Wood wool
plate 0,013 0,75 200 1510
Attic
floor Concrete 0,14 1,7 2300 800 0,279 0,1
0
Mineral wool 0,12 0,036 50 840
Basement
floor
(ground
floor)
Draining
gravel 0,2 1,4 1800 1000 0,163 0,5
0
Light
concrete 0,14 0,106 400 1050

97
Basement
walls
(south,
west,
north,
east)
Draining
gravel 0,3 1,4 1800 1000 0,165 0,5
0
Light
concrete 0,23 0,106 400 1050
Insulation
Mineral wool 0,07 0,036 50 840
Measured VIP VIP VIP LKF Assumed
Assum
ed
Table 10.4. Building elements 2-Dimensional
Building part types 2-Dimensional - Catalog
Build part name Psi-Value [W/mK] Width [m]
Permeability q50
[l/s,m²] Solar absorption [%]
Window stealth 0,127 0,2 0 0
Outside corner 0,2163 0,4 0,5 50
VIP Assumed Assumed Assumed
Table 10.5. Building elements 3-Dsimensional
Building part type 3-Dimensional - Catalog
Build part name Chi-Value [W/K] Area [m²] Permeability q50 [l/s,m²] Solar absorption [%]
Balcony 0,459 0,2 0,05 70
VIP Assumed Assumed Assumed
Table 10.6. Description of the reference building
Building
Build part
name Orientation
Amount, Area
[m²], Lenght
[m], Number
[pcs]
Tilt
[degree]
Lowest
level [m]
Highest
level [m]
U-Value [W/m²K],
Psi-Value
[W/m,K], Chi-
Value [W/K], incl
soil delta-U
South
facade South 207,9 m² 0 2,49
0,5 W/m²K
North
Facade North 354,8 m² 0 2,49
0,5 W/m²K
Roof South South 332 m² 11 degree 2,49 2,49 0,647 W/m²K
Roof North North 332 m² 11 degree 2,49 2,49 0,647 W/m²K
East Facade East 86,3 m² 0 2,49 0,35 W/m²K
West
Facade West 86,3 m² 0 2,49
0,35 W/m²K

98
heavy inner
wall Inner 1240 m²
3,665 W/m²K
Light inner
wall Inner 168,1 m²
0,751 W/m²K
Ground
floor Inner 640,5 m²
0,855 W/m²K
Internal
floor Inner 1281 m²
2,628 W/m²K
Attic floor Inner 640,5 m² 0,179 W/m²K
Basement
floor
(ground
floor) BF > 6 m 655 m² -2,4 0
0,163 W/m²K
Basement
walls
(south,
west, north,
east) BW 0-1 m 144,3 m² -2,4 0
0,199 W/m²K
Basement
walls
(south,
west, north,
east) BW 1-2 m 144,3 m² -2,4 0
0,160 W/m²K
Basement
walls
(south,
west, north,
east) BW > 2 m 75 m² -2,4 0
0,124 W/m²K
Basement
walls
Heavy
inner Inner 319,2 m² 0 0
3,872 W/m²K
Window
stealth
South South 813,3 m 0 0
0,127 W/m,K
Window
stealth
North North 430,5 m 0 0
0,127 W/m,K
Outside
corner
South South 8,1 m 0 0
0,216 W/m,K
Outside
corner
North North 8,1 m 0 0
0,216 W/m,K
Outside
corner East East 8,1 m 0 0
0,216 W/m,K

99
Outside
corner
West West 8,1 m 0 0
0,216 W/m,K
Balcony South 123 pcs 0 0 0,459 W/K
Measured Measured Measured Measured VIP
Table 10.7. Shading device
Sun shading
Designation Function Value Activates at room temperature over
Balcony Shading upper edge 85,0 // 43,0 0 °C
Measured
Table 10.8. Description of building parts
Building part - Window, Door
Description
Orien
tation Area [m²]
Amount
of glass
[%]
Solar
trans
mittance
[%]
Total (g)
Solar trans
mittance
[%] Direct
(ST)
U-value
[W/m²K]
q50
leakages
[l/s,m²]
Sun
shading
Big N
Window North 110,9 m² 70 76 60,8
1,7
W/m²K 0,7
Small N
Window North 16,2 m² 70 76 60,8
1,7
W/m²K 0,7
Stair N
Window North 7,6 m² 70 76 60,8
1,7
W/m²K 0,7
Balcony
door
Window South 73,7 m² 70 76 60,8
2,6
W/m²K 0,7 Balcony
Big S
Window South 77,8 m² 70 76 60,8
2,6
W/m²K 0,7 Balcony
Small S
Window South 113,4 m² 70 76 60,8
2,6
W/m²K 0,7 Balcony
Medium S
Window South 14,6 m² 70 76 60,8
2,6
W/m²K 0,7 Balcony
Medium sm
S Window South 10,8 m² 70 76 60,8
2,6
W/m²K 0,7 Balcony
External
door North 8,6 m² 0 0 0
1,5
W/m²K 0,5
Measured Assumed VIP VIP LKF Assumed Measured

100
Table 10.9. Operating data for the reference building
Operating data
Operating
casae
name
Activity
energy
[W/m²]
Activity
energy
external
[W/m²]
Building
energy
to room
[W/m²]
Building
energy
extern
[W/m²]
Hot tap
water
[W/m²]
Moisture
added
[mg/s,m²]
Highest
room
temperature
[°C]
Lowest
room
temperature
[°C]
Multi-
family
buildings
22 5 0,7 1 0,4 3,4 0,8
27 22,8
Basement 0 0 5 0 0 0 27 18
Assumed VIP VIP VIP LKF VIP VIP LKF
Table 10.10. Operating scheme
Operating times Reference
Operating case name Weekdays Week number Time
Multi-family buildings 22 Monday 1-53 00:00-24:00 Assumed
Tuesday --- Monday
Wednesday --- Monday
Thursday --- Monday
Friday --- Monday
Saturday --- Monday
Sunday --- Monday
Table 10.11. Input for ventilation
Ventilation unit
Unit designation
Supply air fan
pressure [Pa]
Supply air
efficiency [%]
Exhaust air fan
pressure [Pa]
Exhaust air
efficiency [%] Control state
Exhaust air 0 0 400 70 Exhaust air
Airing 0 0 0 0 Airing
Assumed Assumed
Table 10.12. Operating scheme for mechanical ventilation fan
Ventilation units - Operating time, Flow References
Operating
designation Weekdays
Supply air
[l/s,m²]
Exhaust
air
[l/s,m²]
week
number
Start
time-End
time
Exhaust air
Monday 0 0,35 1-53
00:00-
24:00
Assumed
Tuesday --- Monday
Wednesday --- Monday
Thursday --- Monday

101
Friday --- Monday
Saturday --- Monday
Sunday --- Monday
Airing
(Building, not
basement zone)
Monday 0,025 0,025 1-53
00:00-
24:00
Assumed
Tuesday --- Monday
Wednesday --- Monday
Thursday --- Monday
Friday --- Monday
Saturday --- Monday
Sunday --- Monday
Table 10.13. Heat supply input for the reference building
Heat supply Reference
Heating system
Operating
point 1
Operation
point 2
outdoor temperature -20 °C 20 °C VIP
Supply pipe temperature 55 °C 20 °C VIP
Drain pipe temperature 45 °C 20 °C VIP
Hot tap water (DHW)
Cold water temperature 8 [°C] VIP
Hot tap water temperature 65 [°C] VIP
Internal heat losses 0,285 W/m,K LKF
Internal pipe length 196 m Measured from drawings
External heat losses 0,97 W/m,K LKF
External pipe length 30 m Measured from drawings
Table 10.14. Other input data for the reference building
Other References
Electricity for circulation pumps 3050 W LKF
Lowest Dimension outdoor temperature for heating -9,6 °C VIP
Highest Dimension outdoor temperature for comfort cooling
100 °C
Assumed
Passive cooling LKF

102
Appendix B1 - Section from East
Appendix B2 – Element structure

103
Appendix B3 – Inner walls

104
Summary
About 40 % of the residential European building stoke was built before 1960 and is now in
need of renovation; when the buildings were erected, no consideration to energy efficient
and sustainability was taken. Since different components of the buildings have reached the
end of their lifetime, there will likely be only one complete renovation cycle of the building
stock before 2050. This means that there is one chance to do it right or to fail. Since
renovation would need to be performed anyway, it is a unique chance to apply some energy
efficient retrofit measures as well, which is cheaper than doing it in a separate intervention.
This thesis wants to provide support for the renovation of multi-family buildings of the
Miljonprogram era, by advising in the renovation process through suggesting several
packages of retrofit solutions that could suit different stakeholders’ requests.
The Swedish building stock is in line with the European one (as distribution of single- vs
multi-family houses). The buildings erected in Sweden in the period 1950-1970 represent
22.6% of the single-family and 41.5% of the multi-family stock. Data for Europe shows that
more than half of the buildings were built before 1970: The number of aging buildings is
high and the potential for energy saving through major renovation remarkable.
Whenever a building is being erected or renovated, there are sets of rules that must be
followed concerning both which materials and components to use and the construction
process itself. Building codes are made of different parts: The requirements on energy
efficiency can be a chapter in the building code, usually giving concise instructions and
referring to the specific standard, which is more comprehensive and detailed. It depends
from country to country how much information from the standard, as well as methods to
calculate a certain value, are included in the building code. This work will follow the
recommendations prescribed by the BBR 22, the Swedish building code.
In order to understand which renovations measures are applied as best practice in current
projects, a research was performed on completed or ongoing projects in Europe concerning
the renovation of multi-family post-war buildings. For every project, the energy efficient
retrofit measures was listed. table. This does not suppose any statistical relevance, due to the
small number of cases considered, but rather to help identify a list of possible solutions and
define the state-of-the-art.
One of the most interesting features when analysing the projects is to understand the reasons
why the renovation process has been carried out. If the needs of the stakeholders are
understood, it is easier to develop renovation strategies and policies that address them,
making the whole process more effective and therefore increasing the renovation rate in the
building stock. Motives behind the renovations were encountered when analysing the
Project.
The building had to undergo some other kind of works anyway
Planned building expansion
Need to improve the indoor comfort

105
Demonstration to prove the energy efficient refurbishment, and get lower energy
bills
Desire of the owner and or tenants, to have an environmental friendly house
The most prioritized factor is the economic feasibility, followed closely by energy
efficiency. When renovating, it is usually aimed at the BBR 22 requirements, even though
some companies aim at even a better energy performance. The number of measures that can
be implemented depends on the financial means of the company: The room for energy
efficient measures is usually limited to what remains of the budget after the necessary
maintenance interventions. Renovation projects might also become a pilot case to test
energy measures or to prove the efficacy of the refurbishment concept. Having an
environmentally friendly house is a matter of prestige and commitment for certain owners.
The most important renovation solutions that were encountered during the analysis of the
projects has been listed, described and analysed according to different indicators which are
of interest for the renovation process. The indicators are; advantages, disadvantages, impact
of tenants and in which climate the application is suitable. Only the energy-related measures
are considered due to the relevance with this thesis, which has the aim of developing
solutions packages to effectively renovate a building from the Miljonprogram.
According to the renovation solutions, three different scenarios were simulated, to
investigatre their impact on the energy consumption reduction of the reference building.
Minor renovation, “business as usual” retrofit: Replacing the components that have
reached or are very close to the end of their lifetime with new ones that comply with
the minimum requirements of the national building code
Renovation of the building envelope to achieve the minimum thermal transmittance
values stated by BBR
Major renovation, intervention to achieve a 50% reduction of the baseline energy
consumption, “Dream renovation”, to see how far the energy savings can be pushed
to reach some certifications such as Miljöbyggnad
The reference building is a typical lamellhus in Lund, built 1969-1972, and the used
software is VIP-Energy. The building has a huge glazed area due to the high number of
windows, especially on the southern side: The window-to-wall ratio is about 60%.
The first one of the measures of the packages will be to change the windows on the south
side, from the old double-glazed or two panes ones to modern windows with U-value lower
than 1.3, as the BBR prescribes. The windows are old and would need to be changed
anyway. As an additional measure, for every scenario the roof has been insulated to reach
the minimum BBR requirements, given its present high thermal transmittance. For the
second renovation scenario the building envelope elements are provided with additional
external insulation, to avoid moisture risks: There are several insulation materials that would
be suited for the task, it was decided to use XPS since it was the most used in the projects.
It was also supposed that the air tightness of the envelope elements improves when
insulating, going down to 0.6 l/(s m2), calculated at 50 Pa pressure difference (q50).
According to the major renovation scenario, to reduce 50 % in energy consumption a

106
parametric study was performed to see how the energy performance is influenced by
different insulation thicknesses and window types. It is shown that it is not possible to attain
a 50% energy reduction only by acting on the envelope, but it is also necessary to install the
heat recovery on the mechanical ventilation, which becomes then a supply and exhaust
system. The dream scenario is therefore the previous with the installation of heat recovery
on a supply and extract mechanical ventilation system to see how far low it is possible to go
in the energy savings.
Both the BBR and Dream scenarios are well below the BBR requirements, and the Dream
one also fulfils the Miljöbyggnad Silver requirement concerning energy consumption, it
being only 55 kWh/m2.
The application of a heat exchanger is necessary to reach high performances. When running
the various simulations with and without heat exchanger, it was observed a decrease in the
zone heating and a slight increase in fan electricity due to the pressure loss introduced by the
heat exchanger. The maximum overall decrease was 26 kWh/m2 when applying the heat
recovery to the base case and the minimum was 20 kWh/m2 in the south windows scenario
with roof insulation. It can be therefore inferred that the heat recovery provides at least a
saving of 20 kWh/m2 of total used energy.
Different scenarios were tested to see how the energy consumption of the building was
affected by the combination of renovation solutions. Other parameters, such as a life cycle
assessment or a life cycle cost analysis, were not taken in consideration since the aim of this
thesis is to prove that it is possible to achieve a 50% reduction in the energy use of a
building by implementing existing renovation measures, with no regards to issues such as
thermal comfort.


Dept of Architecture and Built Environment: Division of Energy and Building Design Dept of Building and Environmental Technology: Divisions of Building Physics and Building Services


