
Engineering Fracture Mechanics 77 (2010) 479–491
Contents lists available at ScienceDirect
Engineering Fracture Mechanics
journal homepage: www.elsevier .com/locate /engfracmech
Quasi-static and dynamic fracture initiation toughness of Ti/TiBlayered functionally graded material under thermo-mechanical loading
Addis Kidane a, Arun Shukla b,*
a Graduate Aeronautical Laboratories, Division of Engineering and Applied Science, California Institute of Technology, Pasadena, CA 91125, United Statesb Dynamic Photo-Mechanics Laboratory, Department of Mechanical Engineering and Applied Mechanics, The University of Rhode Island,Kingston, RI 02881, United States
a r t i c l e i n f o
Article history:Received 8 May 2009Received in revised form 17 October 2009Accepted 27 October 2009Available online 1 November 2009
Keywords:Fracture initiation toughnessFGMThermo-mechanical loadingDynamic fracture
0013-7944/$ - see front matter � 2009 Elsevier Ltddoi:10.1016/j.engfracmech.2009.10.006
* Corresponding author. Tel.: +1 401 874 2283; faE-mail address: [email protected] (A. Shukla).
a b s t r a c t
Quasi-static and dynamic fracture initiation toughness of Ti/TiB layered functionallygraded material (FGM) is investigated using a three point bend specimen. The modifiedsplit Hopkinson pressure bar (SHPB) apparatus in conjunction with induction coil heatingsystem is used during elevated temperature dynamic loading experiments. A simple andaccurate technique has been developed to identify the time corresponding to the load atwhich the fracture initiates. A series of experiments are conducted at different tempera-tures ranging from room temperature to 800 �C, and the effect of temperature and loadingrate on the fracture initiation toughness is investigated. The material fracture toughness isfound to be sensitive to temperature and the fracture initiation toughness increases as thetemperature increases. Furthermore, the fracture initiation toughness is strain rate sensi-tive and is higher for dynamic loading as compared to quasi-static loading.
� 2009 Elsevier Ltd. All rights reserved.
1. Introduction
An experimental investigation is conducted to study the quasi-static and dynamic fracture initiation toughness of Ti/TiBFGM under thermo-mechanical loading. FGMs are potential candidates to be used as integrated hot structure in space accessvehicles as the material combination and the composition gradation in these materials can be tailored to optimize their perfor-mance to meet multiple functions like thermal resistance, structural integrity, etc. Typically, FGMs are made of a metal and aceramic as opposite faces with the intermediate zones consisting of varying volume fractions of constituents. The basic ideabehind the design of metal/ceramic FGMs is to reduce the problem associated with the low toughness of ceramics. Hencethe fracture toughness is the primary and limiting parameter to design structures using metal/ceramic FGMs. Due to this fact,number of researchers have studied theoretically the fracture behavior of FGMs. For example, Delale and Erdogan [1], Eischen[2] and Jin and Noda [3] solved crack problems for non-homogeneous materials under quasi-static mechanical loading. All theseinvestigations concluded that the inverse-square root singularity at the crack is not affected by non-homogeneity.
For propagating cracks in FGMs, the theoretical studies concluded that the crack tip fields are similar to that of homog-enous material provided that the FGMs are continuous and piece-wise continuously differentiable [4–6]. Nakagaki et al. [7]developed a finite element simulation of fracture occurring in a ceramic–metal FGM under a dynamic load. They observedthat the crack opening displacement (COD) was higher in the FGM when crack propagated from the ceramic rich side to themetal rich side as compared to the reverse direction of propagation. Rousseau and Tippur [8] have investigated the dynamicfracture of continuously graded particulate (glass–epoxy) FGMs for cracks aligned along the gradient using interferometry.
. All rights reserved.
x: +1 401 874 2355.

480 A. Kidane, A. Shukla / Engineering Fracture Mechanics 77 (2010) 479–491
Jin and Batra [9] further studied the effects of quasi-static loading conditions, specimen size and metal particle size on thecrack growth resistance curve (R-curve) and the residual strength of a ceramic–metal FGM using crack-bridging concept.
Kalthoff [10] presents a review work on the measurement of dynamic fracture toughness of materials. He concluded thatduring the dynamic loading experiments the quasi-static relation approximation is acceptable in the case of low impactvelocity and/or ductile material response. Paulino et al. [11] present a fracture testing and finite element modeling of puretitanium using a single edge notched bend specimen. Due to the ductile nature of titanium they focus on J–R response ratherthan the K–R behavior. They reported that the 3D FEM model for crack initiation and the 2D FEM model for crack propagationagree well with the experimental results.
On the other hand, there are very limited experimental studies on the fracture behavior of metal/ceramic FGMs. Kawasakiand Watanabe [12], conducted a well controlled burner-heating-test in order to study the thermal fracture behavior, the cyc-lic thermal fracture behavior and spallation life of different metal/ceramic functionally graded thermal barrier coatings(TBC). In PSZ/IN100 FGM, the fracture toughness improved with an increase in the metal phase content. In PSZ/Inco718FGM the fracture toughness was lower than that of PSZ/In100 FGM, owing to roughly dispersed metal particles. They ob-served that functionally graded TBC possess the desirable effect for improvement of spallation life under cyclic thermalloads. In addition, they observed that the spallation life in functionally graded coatings depends on the composition profile.Hill et al. [13] have studied the fracture behavior of Ti/TiB FGM using single-edged-notched bend specimens and reportedthat the pre-cracking method and residual stress have a significant effect on the measured fracture toughness. The studyis limited to room temperature and quasi-static loading. The study by Kidane and Shukla [14] on the constitutive behaviorof Ti/TiB FGM confirmed that the material showed thermal softening at higher temperatures and this resulted in a decreasein failure stress and an increase in failure strain. But the fracture behavior of Ti/TiB under dynamic loading and at elevatedtemperatures has not been investigated yet.
The purpose of this experimental study is to fill that gap and investigate the effect of temperature and loading rate on thefracture initiation toughness of this material. An experimental investigation on the fracture initiation toughness of Ti/TiB un-der quasi-static and dynamic loading is conducted at different temperatures ranging from room temperature to 800 �C. Thefracture initiation toughness is found to be temperature dependant, increases with raise in temperature, and also loadingrate dependant, higher at dynamic loading compared with quasi-static loading.
2. Material and specimen geometry
The material used in this experimental study is a Ti/TiB FGM layered plate supplied by BAE systems. It is a 6.35 mm thickpate with seven layers, no clear or distinct interface between them, ranging from pure Ti on one side to 85% TiB on the other.The details of the fabrication technique and material properties can be found in the literatures [13,14]. The thickness and theproperties of each layer are listed in Table 1.
Two different batches of three point bend specimens are machined, from the FGM plate discussed above, using an elec-trical discharge machining (EDM) technique. The first batch of specimens is machined in such a way that the gradation is inthe thickness direction, i.e. the crack is perpendicular to the gradation (Fig. 1a). The second batch of specimens is machinedin such a way that the crack is along the gradation direction (Fig. 1b). The thickness of the specimen is selected from theavailable FGM plate thicknesses, where as the other dimensions are determined based on ASTM test methods for measure-ment of fracture toughness (E1820-96).
Due to the brittle nature of this material no fatigue pre-crack was made. However, the crack was made using EDM wire of0.0508 mm, resulting in a very small notch root radius.
3. Experimental procedure
3.1. Quasi-static fracture initiation toughness
The quasi-static fracture initiation toughness is investigated using a three-point bending experiment. The three pointbend specimen is placed between the loading bar and supporting block as shown in Fig. 2. The experiment is conductedat different temperatures ranging from 25 �C to 800 �C. A tungsten carbide loading tip is used to eliminate the deformationof the loading bar at higher temperature. The specimen is heated to the desired temperature using an induction heating sys-
Table 1Composition and elastic properties of Ti/TiB FGM.
Layer no. Ti (vol.%) TiB (vol.%) Thickness (mm) E (GPa) v
1 100 0 0.4064 106 0.3402 85 15 0.7620 170 0.2783 70 30 0.7620 227 0.2384 55 45 0.7620 262 –5 40 60 0.7620 289 –6 25 75 0.7620 303 0.1527 15 85 2.1336 316 0.140

Ti side W= 10.16
S= 40.64
B= 6.35a= 4.06
Ti side
TiB side
W =6.35
S= 40.64
B= 3.18a= 2.54
a
b
Fig. 1. Three point bend specimen: (a) FGM graded in the thickness direction and (b) FGM graded in the crack direction (all dimensions are in mm).
Fig. 2. Quasi-static three point bed experimental setup.
A. Kidane, A. Shukla / Engineering Fracture Mechanics 77 (2010) 479–491 481
tem. The induction heater has a precise controller that enables us to control the temperature to the desired value. The exper-iment is conducted under a fixed loading rate of 1 mm/min at room temperature. To avoid the creep effect during elevatedtemperature, a loading rate of 5 mm/min is used.
3.2. Dynamic fracture initiation toughness
A modified split Hopkinson pressure bar (SHPB) apparatus with induction heating system is used to investigate the dy-namic fracture initiation toughness of Ti/TiB FGM. The modified SHPB is a well-developed method to study the dynamic frac-ture initiation toughness of engineering materials. The principle of modified SHPB is presented in brief and the detailed theorycan be found in the literatures [15,16]. The schematic of the modified SHPB apparatus is shown in Fig. 3. As displayed in thefigure, the apparatus mainly consists of an incident bar, striker bar and pressure gun. To reduce the impedance mismatch be-tween the specimen and the incident bar, a T6061 aluminum material is used for the incident bar. To generate a well-definedloading pulse, the same material that is used for the incident bar is used for the striker bar. Two semiconductor strain gagesare attached in the middle of the incident bar diametrically opposite to one another. The backed semiconductor strain gages(type, SS-090-060-1150 PB-S1; resistance, 1125 ± 75 X; gage factor 155 ± 10; manufactured by Micro Instruments) are about75 times more sensitive than the foil type strain gages and are preferred to capture very small strain signals.
During loading, the specimen is sandwiched between the incident bar and the rigid frame. For an elevated temperatureexperiment, the bar is first kept apart and the specimen is heated to the desired temperature (usually about 20–50 �C higherthan the test temperature) and later the bar is brought manually into contact with the specimen. The temperature of the

Projectile Incident bar
Specimen
Strain gage
Rigid frame
Induction coil
Fig. 3. Schematic representation of modified SHPB apparatus with induction heater.
482 A. Kidane, A. Shukla / Engineering Fracture Mechanics 77 (2010) 479–491
specimen is monitored by 0.127 mm chromel–alumel thermocouple, which is spot welded onto the specimen. Once thespecimen is in contact with the incident bar, the striker bar is propelled towards the incident bar using an air-operatedgun. The impact generates a compressive stress wave in the bar which propagates toward the bar/specimen interface. Whenthe wave reaches the specimen, some of the wave is reflected back and part of the wave is transmitted into the specimen.The incident and reflected strain signals are recorded using a Vishay 2301A signal-conditioning amplifier that is connectedwith an oscilloscope. The load history at the specimen/bar interface is obtained from the recorded strain data using a onedimensional elastic wave theory [15] given by the following equation:
FðtÞ ¼ eiðtÞ þ erðtÞ½ �EA ð1Þ
where F is the force, ei and er are the incident and reflected strain pulses, E is the Young’s modulus, and A is the cross sectionalarea of the bar.
In order to avoid the transient effects all dynamic experiments are conducted at a striker speed of 1.0 m/s. When the timeof fracture is sufficiently long, the dynamic stress intensity factor can be calculated from the input load as
KIðtÞ ¼FðtÞ
BffiffiffiffiffiffiWp f
aW
� �ð2Þ
where KI is the stress intensity factor, B the specimen thickness, W the specimen width, a the initial crack length and f(a/W) isthe geometric factor.
The dynamic fracture initiation toughness (KID) corresponds to the stress intensity factor at the time of crack initiation, i.e.KID = KI(tinitiation).
One of the challenges in the dynamic fracture initiation toughness experiment is to find a method to accurately determinethe crack initiation time. Researchers [17–19] used a strain gage to detect the fracture-initiation time at high loading rate.Usually the gage is placed on the specimen near the crack tip, and when the fracture initiates, the sudden decrease of strainas a function of time corresponds to the crack initiation point. However, the time that the stress wave travels from the cracktip to the strain gage has to be deducted to obtain the correct crack initiation time. This is difficult in the case of materialswith unknown stress wave speed. On the other end, Stalder and Kausch [20] and Kinloch and Kodokian [21] utilized a graph-ite gauge to detect the fracture initiation point. Essentially, the graphite gauge is sprayed on the side of the specimen and thiscrack gauge is connected to a balance bridge which gives a constant voltage during fracture. The technique allows detectingthe initiation time, at which the fracture initiates, especially for electrically non-conductive materials. However, in the caseof metals, the graphite has to be completely isolated from the specimen and this is difficult unless the whole sample iscoated. In the present study, a simple and accurate technique is developed to identify the time corresponding to the loadrequired to initiate the crack. Furthermore, the circuit is synchronized with the strain gages on the bar in such a way thatthe total time from the beginning of the load to the fracture initiation could be recorded. This enables us to determinethe total time history from the beginning of the load to the fracture initiation and guarantee that several reverberationsof the stress wave in the specimen have occurred before crack initiation. This is important to justify the use of quasi-staticequation for fracture toughness evaluation.
A conductive silver paint is placed ahead of the crack tip on a non-conductive substrate, in the direction of expected crackpath. The paint is connected to a strain gage which is attached to the loading bar at the same position where the two semi-conductor strain gages are located. When the fracture initiates, the sudden jump in the strain signal indicates the crack ini-tiation time, and this is used later to determine the load associated with the fracture-initiation time.
A schematic of strain signals from the semiconductor strain gages and the foil type strain gage connected with the silverpaint are shown in Fig. 4. In the figure, t1 is the duration of the incident wave, t2 is the duration of the reflected wave, t3 is thetime required by the wave to travel from the location of the strain gages to the bar–specimen interface and to return back tothe location of the strain gages and t is the total time duration starting from the wave passing the location of the strain gagesuntil the fracture occurs (silver paint broken). Hence, t3/2 is the time required by the wave to travel from the location of thestrain gages to the bar–specimen interface. Therefore, ti = t � t3/2 is the time required to initiate the fracture. Also the loca-tion of this time (ti) in the incident and reflected signal is shown by the dotted line.
Using the above configuration a series of experiments are conducted at different temperatures. For all experiments a2 mm think clay pulse shaper is placed on the impact face of the incident bar. The pulse shaper smoothes the relative sharp

t1
t
t3
t2
Time O
utpu
t vo
lts
ti
ti
Reflected
Incident
Signal from silver paint
Fig. 4. A schematic of strain signals from the semiconductor strain gages and the foil type strain gage connected with silver paint.
A. Kidane, A. Shukla / Engineering Fracture Mechanics 77 (2010) 479–491 483
front of the incident stress wave, thus allowing high strain-rate experiments to be conducted at near constant strain rates[14]. This also helps the premature failure of the relatively brittle Ti/TiB FGM, especially during the early part of stress waveloading [14].
4. Results and discussion
4.1. Quasi-static fracture initiation toughness of FGM graded in the thickness direction
Fig. 5 shows, a typical load history curve for a quasi-static three point bend experiment of FGM graded in the thicknessdirection. From the plot, it can be seen that there is a clear and well defined peak load at which the crack initiates. The loadhistory shown above represents the integrated structure resistance, not the load in each separate layer. The fracture resis-tance across the thickness in each layer may vary, as observed by Wadgaonkar and Parameswaran [22]. This phenomenon isalso observed from the failed specimen subjected to quasi-static loading shown in Fig. 6. As shown in the figure, the fracturetopography of the surface is different from one end to the other. The fracture surface near the TiB rich layer is smooth and thesurface near the Ti rich layer is rough. This indicates that, the energy required to fracture the surface is different for the twoextreme ends, and the fracture may first start from the TiB rich end and later propagate towards Ti rich side.
However, the intention of the present study is to determine the fracture initiation toughness of the integrated structure,and not the fracture resistance of each layer. Hence, the single load history obtained from the integrated structure is used tocalculate the fracture initiation toughness. By following a similar procedure, a series of experiments are conducted, and thefracture initiation toughness at different temperatures is obtained.
Fig. 7 shows the quasi-static fracture initiation toughness of FGM graded in the thickness direction as a function of tem-perature. A total of three experiments are conducted at each temperature and the bars indicate the range of values obtained.
0 5 10 15 200
50
100
150
200
250
300
350
400Failure load
Lo
ad (
N)
Time (sec)
Fig. 5. Typical load–time plot for FGM graded in the thickness direction under quasi-static loading (25 �C).

Fig. 6. Typical failed specimen of FGM graded in thickness direction under quasi-static loading (25 �C).
0 200 400 600 800 10004
6
8
10
12
KIC
(M
Pa
m1/
2 )
Temperature (oC)
Fig. 7. Effect of temperature on the fracture initiation toughness of FGM graded in the thickness direction under quasi-static loading.
484 A. Kidane, A. Shukla / Engineering Fracture Mechanics 77 (2010) 479–491
The room temperature quasi-static fracture initiation toughness is about 4.75 ± 0.07 MPa m1/2 and the value increase to10.43 ± 0.52 MPa m1/2 at 800 �C. The quasi-static fracture initiation toughness increases linearly as the test temperatureraises. It can be argued that at elevated temperature the material is thermally softened and this results in an increase in frac-ture toughness.
4.2. Quasi-static fracture initiation toughness of FGM graded in the crack direction
In this experiment the specimen is first pre-cracked to 2.54 mm from TiB rich side, which means up to the middle of 75%TiB and 25% Ti layer, and the crack is allowed to run towards Ti rich end as shown in Fig. 8. The crack is chosen to start fromthe TiB side, as the fracture resistance of TiB is much lower than that of Ti. Fig. 9 shows a typical load history curve for aquasi-static fracture experiment at 25 �C. The figure displays a definite and clear peak load followed by yet another peak loadthat occurred after the decline of the first. The first peak load corresponds to the load required to initiate the crack, in 75% TiBand 25% Ti layer, and the second peak load corresponds to the load required to crack the next layer, i.e. 60% TiB and 40% Ti,which is 0.35 mm away from the initial position of crack tip. Fig. 10 shows a typical fracture surface, investigated at roomtemperature. From the figure it is clear where the second peak load occurred. Furthermore, it is observed the fracture surfacenear to the TiB rich layer is smooth and is rough towards the Ti rich side. Even though the crack has already started at thefirst peak load, still more energy is required for the crack to propagate to the next layer.
Fig. 11 shows a typical load time curve for a quasi-static fracture experiment at elevated temperatures. Unlike the roomtemperature experiment, there is no repeated peak load, the load decreased slowly after it reached the critical value. Fromthe load history it can be clearly seen that the temperature reduces the brittleness of the material. For all the cases consid-ered, the first peak load is used to calculate the fracture initiation toughness.

Fig. 10. Typical failed specimen of FGM graded in the crack direction under quasi-static loading (25 �C).
15 25 40 55 75 85% % % % % % Ti
85 75 60 45 25 15 0 % % % % % % %TiB
Fig. 8. A schematic representation of crack on FGM specimen graded in the crack direction.
0 10 20 30 40 500
10
20
30
40
50
60
70
80
Lo
ad (
N)
Time (Sec)
Fig. 9. Typical load–time plot for FGM graded in the crack direction under quasi-static and room temperature loading (25 �C).
A. Kidane, A. Shukla / Engineering Fracture Mechanics 77 (2010) 479–491 485
Fig. 12 shows the fracture initiation toughness as a function of temperature for FGM graded in the crack direction. A totalof three experiments are conducted at each temperature and the bars indicate the range of values obtained. The quasi-staticfracture initiation toughness at room temperature (25 �C) is about 3.75 ± 0.05 MPa m1/2 and increases to about

0 4 8 12 160
25
50
75
100
125
150 T=400 oC
T=600 oC
Load
(N)
Time (Sec)
Fig. 11. Typical load–time plot for FGM graded in the crack direction under quasi-static elevated temperature loading.
0 200 400 600 800 1000
4
6
8
10
12
KIC
(MP
a m
1/2 )
Temperature (oC)
Fig. 12. Effect of temperature on the fracture initiation toughness of FGM graded in the crack direction under quasi-static loading.
0 200 400 600
-2
-1
0
1
2
Crack initiated
Signal from conductive silver paint
Incident
Reflected
Ou
tpu
t (V
olt
s)
Time(µ sec)
Fig. 13. Typical incident and reflected strain plot of FGM graded in the thickness direction subject to room temperature dynamic loading.
486 A. Kidane, A. Shukla / Engineering Fracture Mechanics 77 (2010) 479–491
9.55 ± 0.44 MPa m1/2 at 800 �C. The trend on the quasi-static fracture initiation toughness of FGM graded in the crack direc-tion is same as that of FGM graded in the thickness direction. With both, the fracture initiation toughness increases consis-tently with an increase in temperature.

A. Kidane, A. Shukla / Engineering Fracture Mechanics 77 (2010) 479–491 487
4.3. Dynamic fracture initiation toughness of FGM graded in the thickness direction
A typical strain record from one of the dynamic experiments of FGM graded in the thickness direction is shown in Fig. 13.The sudden jump in strain signal from the strain gage, which was attached to the conductive silver paint, indicates the crackinitiation time. As shown in the figure, the crack initiates 140 ls after the stress wave enters the specimen and this allowsthe wave to reverberate sufficiently to create an equilibrium loading condition before the crack initiates.
Fig. 14 shows the dynamic fracture initiation toughness of FGM graded in the thickness direction as a function oftemperature. A total of three experiments are conducted at each temperature and the bars indicate the range of values ob-tained. At room temperature the dynamic fracture initiation toughness is about 5.2 ± 0.20 MPa m1/2 and about 11.96 ±0.77 MPa m1/2 at 800 �C. It is also observed that the fracture initiation toughness increases linearly with increase in temper-
0 200 400 600 800 10004
6
8
10
12K
ID (
MP
a m
1/2 )
Temperature (oC)
Fig. 14. Effect of temperature on the fracture initiation toughness of FGM graded in the thickness direction under dynamic loading.
Fig. 15. SEM images of typical fracture surface of FGM graded in the thickness direction subjected to dynamic loading at different temperatures.

488 A. Kidane, A. Shukla / Engineering Fracture Mechanics 77 (2010) 479–491
ature. This can be attributed to the fact that, at higher temperature the material is softened and results in increased fracturetoughness. This phenomenon agrees with the one observed by the authors in their previous study during the investigation ofthe dynamic constitutive behavior of this material [14]. Fig. 15 shows the SEM images of typical fracture surface of FGMgraded in the thickness direction subjected to dynamic loading at different temperatures. The images are taken near thecrack tip at the Ti rich end. It can be seen that the fracture surface becomes more ductile as the temperature increases.
4.4. Dynamic fracture initiation toughness of FGM graded in the crack direction
A typical strain signal obtained from the dynamic fracture experiment for FGM graded in the crack direction is shown inFig. 16. As discussed in the previous section, the conductive silver paint is used to identify the load which corresponds to thefracture-initiation time. The fracture initiates after 60 ls and this allowed the wave to reverberate about 20 times in thespecimen before crack initiates. This is sufficient to create an equilibrium loading condition before the crack initiates. Highspeed digital imaging is also used to study the contact history of the bar and specimen and the fracture process. Fig. 17 showsthe typical high speed images taken during a dynamic fracture experiment of FGM graded in the crack direction at a tem-perature of 800 �C. It can be clearly seen that the bar is always in contact with the specimen during the failure process.Hence, the use of load corresponding to the crack initiation time is justified in the calculation of calculate the dynamic frac-ture initiation toughness.
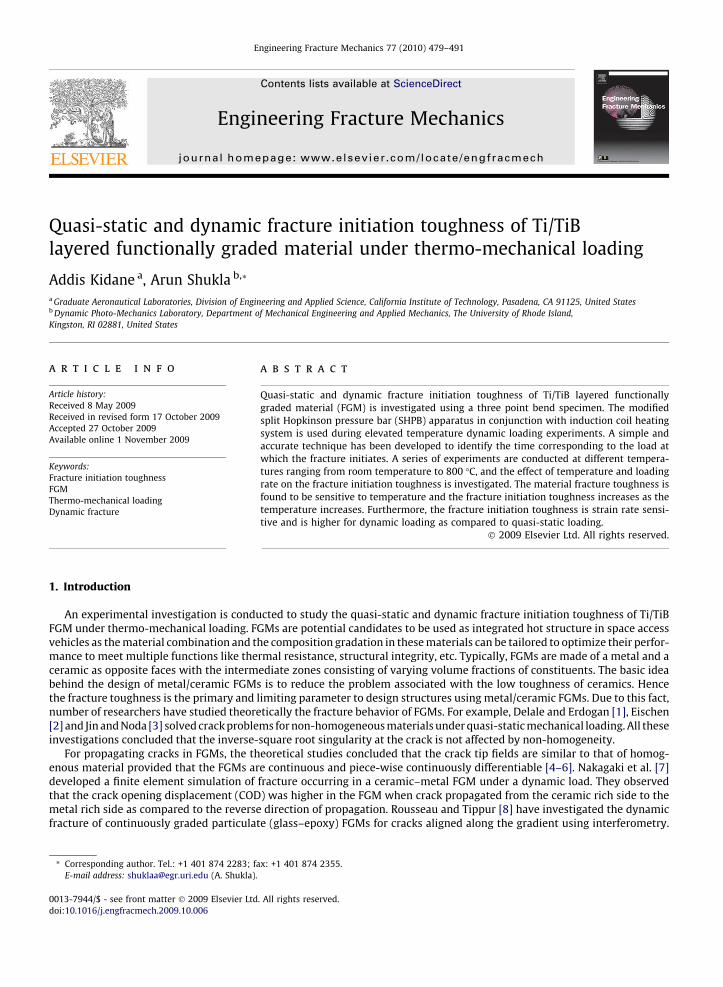
Fig. 18 shows the dynamic fracture initiation toughness as a function of temperature for FGM along the crack direction. Atotal of three experiments are conducted at each temperature and the bars indicate the range of values obtained. A similar
0 200 400 600 800-3
-2
-1
0
1
2
3
Crack initiated
signal from conductive silver paint
Refelected
Incident
Ou
tpu
t (v
olt
)
Time (µ sec)
Fig. 16. Typical strain signal obtained from the dynamic fracture experiments of FGM graded in the crack direction subjected to dynamic loading.
Fig. 17. Typical high speed digital images of FGM graded in the crack direction subjected to dynamic loading at 800 �C.
0 200 400 600 800 10004
6
8
10
12
KID
(Mp
a m
1/2 )
Temperature (oC)
Fig. 18. Effect of temperature on the fracture initiation toughness of FGM graded in the crack direction under dynamic loading.
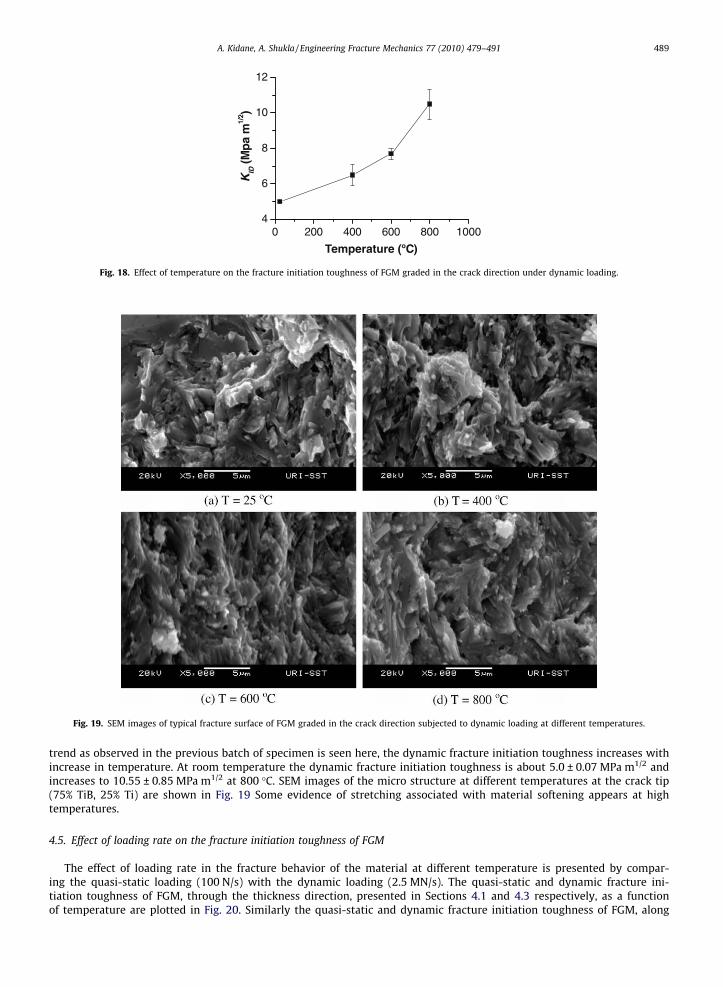
Fig. 19. SEM images of typical fracture surface of FGM graded in the crack direction subjected to dynamic loading at different temperatures.
A. Kidane, A. Shukla / Engineering Fracture Mechanics 77 (2010) 479–491 489
trend as observed in the previous batch of specimen is seen here, the dynamic fracture initiation toughness increases withincrease in temperature. At room temperature the dynamic fracture initiation toughness is about 5.0 ± 0.07 MPa m1/2 andincreases to 10.55 ± 0.85 MPa m1/2 at 800 �C. SEM images of the micro structure at different temperatures at the crack tip(75% TiB, 25% Ti) are shown in Fig. 19 Some evidence of stretching associated with material softening appears at hightemperatures.
4.5. Effect of loading rate on the fracture initiation toughness of FGM
The effect of loading rate in the fracture behavior of the material at different temperature is presented by compar-ing the quasi-static loading (100 N/s) with the dynamic loading (2.5 MN/s). The quasi-static and dynamic fracture ini-tiation toughness of FGM, through the thickness direction, presented in Sections 4.1 and 4.3 respectively, as a functionof temperature are plotted in Fig. 20. Similarly the quasi-static and dynamic fracture initiation toughness of FGM, along

0 200 400 600 800 10004
6
8
10
12 Dynamic Quasi-static
KID (
MP
a m
1/2 )
Temperature (oC)
Fig. 20. Effect of temperature on the fracture initiation toughness of FGM graded in the thickness direction under quasi-static and dynamic loading.
0 200 400 600 800 1000
4
6
8
10
12
KID (
MP
a m
1/2 )
Temperature (oC)
Dynamic Quasi-static
Fig. 21. Effect of temperature on the fracture initiation toughness of FGM graded in the crack direction under quasi-static and dynamic loading.
490 A. Kidane, A. Shukla / Engineering Fracture Mechanics 77 (2010) 479–491
the crack direction, presented in Sections 4.2 and 4.4 respectively, as a function of temperature are plotted in Fig. 21.In the figure, it is clear the fracture initiation toughness is load rate dependant. The fracture initiation toughness atall temperatures is higher in dynamic loading (2.5 MN/s) as compared with the corresponding quasi-static loading(100 N/s).
5. Conclusions
The quasi-static and dynamic fracture initiation toughness of Ti/TiB FGM is investigated under thermo-mechanical load-ing. A simple and accurate technique has been developed to identify the time corresponding to the load at which the crackinitiates. The findings are summarized below:
� The fracture initiation toughness is temperature dependent, and it increases as the temperature increases. For FGM gradedin the thickness direction, as the temperature increase from room temperature to 800 �C, the quasi-static fracture initia-tion toughness increased by 160% and the dynamic fracture initiation toughness increased by 130%. For FGM graded in thecrack direction, as the temperature increased from room temperature to 800 �C, the quasi-static fracture initiation tough-ness increased by 154% and the dynamic fracture initiation toughness increased by 110%.
� The fracture initiation toughness is rate dependent; it is higher at dynamic loading as compared with quasi-static loading.For FGM graded in the thickness direction, the room temperature fracture initiation toughness increased by 30% and thefracture initiation toughness at 800 �C increased by 15% as the loading rate increased from 100 N/s to 2.5 MN/s. For FGMgraded in the crack direction, the room temperature fracture initiation toughness increased by 33% and the fracture ini-tiation toughness at 800 �C increased by 10% for the same increasing in the loading rate.
Acknowledgments
The financial support of the Air Force Office of Scientific Research under Grant # FA9550-06-1-0162 and Grant # FA9550-09-1-0639 are gratefully acknowledged.

A. Kidane, A. Shukla / Engineering Fracture Mechanics 77 (2010) 479–491 491
References
[1] Delale F, Erdogan F. The crack problem for a nonhomogeneous plane. J Appl Mech 1983;50:67–80.[2] Eischen JW. Fracture of nonhomogeneous materials. Int J Fract 1987;34(3):3–22.[3] Jin ZH, Noda N. Crack-tip singular field in nonhomogeneous materials. J Appl Mech, Trans ASME 1994;61:738–9.[4] Parameswaran V, Shukla A. Crack-tip stress fields for dynamic fracture in functionally gradient materials. Mech Mater 1999;31:579–96.[5] Shukla A, Jain N. Dynamic damage growth in particle reinforced graded materials. Int J Impact Engng 2004;30:777–803.[6] Chalivendra VB. Mode-I crack-tip stress fields for inhomogeneous orthotropic medium. Mech Mater 2008;40:293–301.[7] Nakagaki M, Sasaki H, Hagihara S. A study of crack in functionally graded material under dynamic loading. ASME, Pressure Vessels and Piping Division
(Publication) PVP, dynamic fracture, failure and deformation 1995;300:1–6.[8] Rousseau C, Tippur H. Dynamic fracture of compositionally graded materials with cracks along the elastic gradient: experiments and analysis. Mech
Mater 2001;33:403–21.[9] Jin Z-H, Batra RC. R-curve and strength behavior of a functionally graded material. Mater Sci Engng A 1998;242(1–2):70–6.
[10] Kalthoff JF. On the measurement of dynamic fracture toughness – a review of recent work. Int J Fract 1985;27:277–98.[11] Paulino G, Carpenter R, Liang W, Munir Z, Gibeling J. Fracture testing and finite element modeling of pure Titanium. Engng Fract Mech
2001;68:1417–32.[12] Kawasaki A, Watanabe R. Thermal fracture behavior of metal/ceramic functionally graded materials. Engng Fract Mech 2000;69:1713–28.[13] Hill M, Carprnter R, Paulino G, Munir Z, Gibeling J. Fracture resistance testing of monolithic and composite brittle materials. ASTM STP 1409; 2002.[14] Kidane A, Shukla A. Dynamic constitutive behavior of Ti/TiB FGM under thermo-mechanical loading. J Mater Sci 2008;43:2771–7.[15] Rubio L, Fernandez-Saez J, Navarro C. Determination of dynamic fracture-initiation toughness using three-point bending tests in a modified Hopkinson
pressure bar. Exp Mech 2003;43(4):379–86.[16] Shazly M, Prakash V, Draper S. Mechanical behavior of Gamma-Met PX under uniaxial loading at elevated temperatures and high strain rates. Int J
Solids Struct 2004;41:6485–503.[17] Jiang F, Liu R, Zhang X, Vecchio Kenneth S, Aashish R. Evaluation of dynamic fracture toughness KId by Hopkinson pressure bar loaded instrumented
Charpy impact test. Engng Fract Mech 2004(71):279–87.[18] Dally JW, Barker DB. Dynamic measurements of initiation toughness at high loading rates. Exp Mech 1988;28:298–303.[19] Yokoyama T. Determination of dynamic fracture-initiation toughness using a novel impact bend test procedure. ASME J Press Vessel Technol
1993;115:389–96.[20] Stalder B, Kausch H. The use of a velocity gauge in impact testing of polymers. J Mater Sci 1985;20:2873–81.[21] Kinloch A, Kodokian G. Impact behaviour of structural adhesive joints. J Mater Sci Lett 1987;6:653–5.[22] Wadgaonkar SC, Parameswaran V. Structure of near-tip stress fields and variation of stress intensity factor for a crack in a transversely graded material.
J Appl Mech, Trans ASME 2009:76.


