

ENGINEERING MULTI-STEP ELECTRON
TUNNELING SYSTEMS IN PROTEINS
Thesis by
Heather R Williamson
In Partial Fulfillment of the Requirements for the Degree
of
Doctor of Philosophy
CALIFORNIA INSTITUTE OF TECHNOLOGY
Pasadena, California
2013
(Defended September 7, 2012)

ii
2013
Heather R Williamson
All Rights Reserved

iii ACKNOWLEDGEMENTS
Any thesis is a just a small story compared to the work and time that goes into creating a
scientific work. Likewise, I am only a small part of any work that I attempt and much of the credit
for my success goes to a large group of supportive bystanders. So here is my feeble attempt to
express my appreciation.
At the foremost of all scientific work I accomplish, I must thank and give high credit to the
many teachers who prepared me. I got my love of chemistry, electron transfer, and biology from my
high school science teachers, Mrs. Yancy and Mrs. Marinelli. With Dr. Jackie Nickel’s support and
advice, I went from being a well meaning pre-med to a hard core chemistry lover. Along with
providing opportunities for me to teach, she encouraged me to pursue an even “higher” level of
education. To the four mentors I had in undergrad, Dr. James Broome, Dr.’s Andrei Stanishevsky,
Ashish Pathak, and Robert Reynolds, I will never be more grateful for teaching me the ins and outs
of lab. I learned everything from how to synthesize metal nanoparticles or new cancer drugs to who
was the best personality to work under for mental health and for work efficiency. I can never thank
enough particularly Dr. Stanishevsky for that first surprising opportunity for lab work, my first taste
of the thrill, and Dr. Reynolds for taking a undergrad who was someone else’s responsibility and
giving me the opportunity to spread my wings in the lab with the full trust of an unexpected
superior.
I have half a million things for which to thank my thesis advisor, Harry Gray. First, I need
to thank him for giving a bio-organic student an opportunity in his lab but mostly for being the
driving force for my unique love of bio-inorganic chemistry. I have to thank him for allowing me
my independence, but always providing a necessary ear, mind, and smile. I never thought I would
want to stay in academia, but by watching Harry mentor others and exploring the field he opened up

iv for me, I do not think I would have loved any other area of the science community even half as
much.
I also want to thank my other science advisors and collaborators. Jay Winkler has an
amazing critical mind, but has always been available to answer all my crazy questions (and the
probably foolish ones as well). Tony Vlcek has been a fantastic advisor and collaborator; he has
always had an open mind, an interesting theory, and a helpful thought. He has been a great driving
force (with Harry by his side) in helping me obtain a complete picture for my systems and
providing me with collaborations for the things I did not have access to. Lucie Sokolova, Yuling
Sheng, and Tatiana Prytkova have provided data, insight, and materials. I particularly want to thank
Yuling, since she not only helped me with proteins and problem solving; she gave me a wonderful
lab/deskmate that I doubt anyone can beat. She always lent an ear, provided a good laugh, and gave
excellent advice (in science and in life).
I would have to challenge any other student at Caltech that I have the craziest, funniest, and
wackiest lab, and really all around the best group I could have found. As group dynamics go, we do
know how to party no matter the changing landscape. From all the “newbies” I have appreciated the
fresh look that the new generation has brought. Here is to my crazy benchmates, our current “bio-
subgroup:” Oliver Shafaat, Jeff Warren, Gretchen Keller, Kana Takamatsu, Maraia Ener, Peter
Agbo, and Nicole Bouley Ford to the original “red light district”: Matt Hartings, Tetsu Kimura,
Kyle Lancaster, Melanie Yen, Bert Lai (and Gretchen) and to our bridging members, Keiko
Yokoyama, Lionel Cheruzel, Charlotte Whited, Crystal Shih, Alec Durrell, and Jillian Dempsey. I
really also give a personal shout out to my fellow year-mates: Alec Durrell, Paul Oblad, Josh
Palmer, and Charlotte Whited. WE MADE IT…. Or rather I am finishing up the caboose on a crazy
ride full of mutual project failure and eventual great success.
v I would also like to give an extra special thanks to my group mentors. Crystal Shih started
me on the hopping project, but not until she had inspired me with her joy. She supported me in and
out of lab in my troubles, headaches, as well as my need for fun and laughter. Melanie Yen is a
friend “in the same boat” who taught me about perseverance and internal strength as much as about
safety and science. She will always be an inspiration, as well as a moral cheerleader. To Bert Lai,
my utmost teacher in the ways and means of the Gray group, I have appreciated his advice, his
direction, his support, and most of all his friendship. I will always admire his efficiency and hard
work in lab despite all circumstances and hope to one day be able to “keep up with his pace.”
More special thanks go to my current (sometimes younger) compatriots. Astrid Mueller has
been a kind and thoughtful labmate, sometimes collaborator, but always supportive friend. Kana
Takamatsu may be a new addition, but has provided me with great scientific help, advice, and
support. I wish I had met her earlier as I have enjoyed the great personal interaction as well. Maraia
Ener has always provided a smile, a listening ear, and some great scientific discussion. I appreciate
that she has always taken me seriously, especially when I have felt lost somewhere in the woods.
Peter Agbo, a much younger, but very wise scientist, has always been a solid support for me. I
appreciate you letting me “think out loud” at you and have appreciated even more the sound advice
you have provided. I expect that someday shortly down the road you will make an amazing
professor and researcher. Keiko Yokoyama has been with me longer than anyone else in the group
and has been a fun collaborator in the lab, in the kitchen, and most definitely in life. I cannot
express simply how much of a rock she has been for me in the group, so I will merely say this:
Keiko is a wonderful friend. And last, but most certainly not least, Nicole Ford has been my closest
friend in the lab. I will miss her science discussions, advice, and creative thinking. Most importantly
she has been my constant moral support in lab and outside of it and for that I am eternally grateful. I
survived with her help.
vi Besides my year-mates in the group, I had a great class with which to suffer through the
first year and blossom over the many years. I have so many names to mention, but I have
appreciated the support and fun times that all have provided: Justin Chartron, Chris Daeffler, Greg
Kimball, Chithra Krishnamurthy, Chethana Kulkarni, Natalie Murren, Narae Park, Young In Oh,
Ian Tonks, Arif Wibowo, and Ted Wientrob. Two other names are not mentioned in the long list,
but I must give expressed appreciation for all the help, guidance, support, laughter, and life that
Beverly Lu and Pam Sontz have brought me. Beverly has been a constant loving support since the
minute I met her. She has brought me peace of mind, provided joyous fun, and been a close
confidant. Without her friendship, Caltech would have been missing one of the greatest harbors in
the storm of graduate school and I will be eternally grateful for her presence here. Pam met me on
the first day of TAing and it has been a blast ever since. She has been a great source of
encouragement and fun. She was my advice therapist when I needed it, even when the advice was
just to cut loose and have fun. Especially outside of my lab, she was one of the few to whom I could
sit down and ask crazy science questions. I appreciate her outlook on life, her constant mental and
emotional support, and most of all her ability to make me roll on the floor laughing. I have been
blessed with two great and unbeatable friends out of my class.
The final group to which I need to express my appreciation is my family, and I will begin
with the ones I chose. Liz Sellers and Joey Greene have been with me since high school and
through it all, thick and thin, they still remain my family. Liz was truly the first best friend I ever
made, and has always taught me how to open up my heart to the world. Joey came into my life later,
but has stayed just as close as the beginning. The two of them have seen me at my worst, and taught
me how to laugh at myself and be comfortable with whatever life throws at me. Marci Smith and
Sandrine Niyongere were my college roommates, but the better description for the both of them is
the first sisters with whom I got to live. The two of them have constantly supported the scientist in
me; they have always inspired me no matter how different our fields. Marci has often been my

vii emotional anchor and taught me how to accept the bad in me as well as the good. Sandrine has
taught me to never stop thinking and caring about everything the world has to offer. She is my
philosophy buddy; she taught me how to think about my faith and that thinking does not mean a
lack of belief. Lastly, the most recent addition to my handful of siblings is my graduate school
roommate Nyssa Puskar Clark and my new “brother-in-law” Cory Clark. Nyssa has been my rock
for the past six years and taught me so much about how to look at life with innocent wisdom. She
has been a crying shoulder, and sounding board, and the last (and best) of my anchors out here. She
and Cory have given me a family unit out here that I miss but am eternally blessed to always have. I
have to thank Cory for letting me have Nyssa as much as I needed, and providing for both her and
me the missing sanity in our time of need. Liz, Joey, Marci, Sandrine, Nyssa, and Cory have been
the greatest miracles in my life.
Finally, the driving forces of my life that have kept me sane (and driven me a little crazy)
are the family that was not mine to choose. My cat, Noir, has been my greatest emotional support. I
most certainly did not choose him; instead he chose me. My Aunt Sally and cousins Ashley, Tim,
Brannon, and Krista have always made me feel that relatives were amazing things to have. My aunt
has been one of my biggest fans, and she and the rest of the Chapman clan are one of the most
inspirational support networks. My brother Matthew is truly my best friend and one of the most
amazing people I know. He has always been there for me, even 22,000 miles away. He listens to
me when I am happy, sad, angry, tired, or just bored; no matter what happens between us, he will
always stand by my side and support me. I am eternally grateful for that. My mother has always
been the warmest, kindest, most generous person I know. She has been supportive in my work any
way she can find, and frankly has been the greatest source of my own understanding of my project.
After all, as a nonscientist, but a faithful listener, when I could finally explain my work for her to
understand, I felt like I understood everything I have accomplished a little better. She has prayed for
me, cried for me, laughed with me, worried over me, and supported me through these six long

viii years. My father has been the single greatest inspiration in my desire to become a chemist. I may
not have wanted to follow in his footsteps per say, but I will say he made it a lot easier to get where
I am today. He has been my teacher, editor, and all around glue that stuck my world together. Dad
has always listened to me and given me advice; no matter how old I get, his advice on life, faith,
work, science, and family always keeps me grounded. Finally, God has provided me with a brain, a
body, a family, and friends that no matter how flawed are truly perfect because of it. I survive
because of his blessings, and succeed because of his given inspiration.

ix
This Thesis is dedicated to my Abba, my Mother,
my Father, and my Brother, Matthew
Through blood, sweat, and tears, You have always been my support with the heavy loads
x ABSTRACT
Multi-step electron tunneling, or “hopping,” has become a fast-developing research field
with studies ranging from theoretical modeling systems, inorganic complexes, to biological
systems. In particular, the field is exploring hopping mechanisms in new proteins and protein
complexes, as well as further understanding the classical biological hopping systems such as
ribonuclease reductase, DNA photolyases, and photosystem II. Despite the plethora of natural
systems, only a few biologically engineered systems exist. Engineered hopping systems can provide
valuable information on key structural and electronic features, just like other kinds of biological
model systems. Also, engineered systems can harness common biologic processes and utilize them
for alternative reactions. In this thesis, two new hopping systems are engineered and characterized.
The protein Pseudomonas aeruginosa azurin is used as a building block to create the two
new hopping systems. Besides being well studied and amenable to mutation, azurin already has
been used to successfully engineer a hopping system. The two hopping systems presented in this
thesis have a histidine-attached high potential rhenium 4,7-dimethyl-1,10-phenanthroline
tricarbonyl [Re(dmp)(CO)3] +
label which, when excited, acts as the initial electron acceptor. The
metal donor is the type I copper of the azurin protein. The hopping intermediates are all tryptophan,
an amino acid mutated into the azurin at select sites between the photoactive metal label and the
protein metal site. One system exhibits an inter-molecular hopping through a protein dimer
interface; the other system undergoes intra-molecular multi-hopping utilizing a tryptophan “wire.”
The electron transfer reactions are triggered by excitation of the rhenium label and monitored by
UV-Visible transient absorption, luminescence decays measurements, and time-resolved Infrared
spectroscopy (TRIR). Both systems were structurally characterized by protein X-ray
crystallography.

xi

xii TABLE OF CONTENTS
Acknowledgements ........................................................................................................ iii
Abstract ............................................................................................................................ x
Table of Contents ........................................................................................................... xi
List of Figures and Tables ............................................................................................ xiii
Chapter I: Introduction ................................................................................................ 1
1.1 Statement of Intent ............................................................................................. 1
1.2 Semiclassical Electron Transfer Theory ............................................................ 1
1.3 Metal Modified Metalloproteins and Electron Transfer .................................... 5
1.4 Multi-Step Tunneling ......................................................................................... 7
References ................................................................................................................. 9
Chapter II: Materials and Methods .......................................................................... 14
2.1 Photochemistry with Metalloproteins .............................................................. 14
2.2 Appendix of Terms ........................................................................................... 17
2.3 Protein Preparation ........................................................................................... 18
2.4 Wavelength-Dependent Nanosecond Laser System (NS-1) ........................... 22
2.5 Time-resolved Infrared Spectroscopy (TRIR) ................................................. 24
References ............................................................................................................... 25
Chapter III: Inter-molecular Hopping through Dimers ........................................ 28
3.1 Abstract ............................................................................................................. 28
3.2 Designing a Hopping System ........................................................................... 28
3.3 Experimental Results ........................................................................................ 30
3.4 Discussion ......................................................................................................... 43
3.5 Conclusions....................................................................................................... 48
References ............................................................................................................... 50
Chapter IV: Intra-molecular Hopping with Two Intermediates .......................... 51
4.1 Abstract ............................................................................................................. 51
4.2 Improving Intra-molecular Hopping with Tryptophan Wires ......................... 51
4.3 Experimental Results ........................................................................................ 53
4.4 Discussion ......................................................................................................... 62
4.5 Conclusions....................................................................................................... 66
References ............................................................................................................... 67
Chapter V: Double Tryptophan Mutants in a Hydrophobic Environment ........ 69
5.1 Abstract ............................................................................................................. 69
5.2 Attempting a Hydrophobic Hopping System with Tryptophan ...................... 69
5.3 Experimental Results ........................................................................................ 71
5.4 Discussion ......................................................................................................... 77
5.5 Conclusions....................................................................................................... 80
References ............................................................................................................... 81

xiii Chapter VI: Tunneling through Structurally Modified Proteins ......................... 83
6.1 Abstract ............................................................................................................. 83
6.2 Modifying Tunneling Pathways by Altering Protein Structural Features ...... 83
6.3 Materials and Methods ..................................................................................... 86
6.4 Experimental Results ........................................................................................ 91
6.5 Discussion ......................................................................................................... 96
6.6 Conclusions....................................................................................................... 99
References ............................................................................................................. 101

xiv LIST OF ILLUSTRATIONS AND TABLES
Equation 1.1: Marcus Equation: Rate of Electron Transfer ......................................... 2
Figure 1.1: Potential Energy Curves .............................................................................. 3
Equation 1.2: Marcus Equation: Electronic Coupling .................................................. 4
Figure 1.2: Electron Transfer Rate vs. Driving Force ................................................... 4
Equation 1.3: Tunneling Pathway: HAB proportionality ............................................... 5
Figure 1.3: Tunneling Time Table ................................................................................. 6
Figure 2.1: Photoreaction of Ru-pentaamine Cytochrome c....................................... 15
Figure 2.2: Flash Quench Schemes for Metal Modified Proteins ............................... 16
Table 2.1: Abbreviation for Amino Acids ................................................................... 17
Table 2.2: Common Abbreviations Used .................................................................... 18
Figure 3.1: Re(124)W122 Protein Structure ............................................................... 29
Figure 3.2: Scheme for Single Hop ............................................................................. 30
Figure 3.3: Transient Absorption for Re(H126)W122, with Reductant ..................... 31
Figure 3.4: Luminescence Decay for Re(H126)W122, with Reductant ..................... 32
Figure 3.5: Transient Absorption for Re(H126)W122, Low Concentration .............. 33
Figure 3.6: Luminescence Decay for Re(H126)W122, Low Concentration .............. 33
Figure 3.7: NS-1 Transient Absorption and Emission Decay for Re(H126)W122
At 100 Micromolar ....................................................................................................... 34
Figure 3.8: NS-1 Transient Absorption and Emission Decay for Re(H126)W122
At 200 Micromolar ........................................................................................................ 35
Figure 3.9: Steady State Fluorescence for Re(H126)W122 ........................................ 36
Figure 3.10: Structure of Re(H126)W122 ................................................................... 38
Figure 3.11: Monomer Distances between Redox Sites in Re(H126)W122 .............. 38
Figure 3.12: Dimer Distances between Redox Sites in Re(H126)W122 ................... 39
Table 3.1: Crystal Parameters for Re(H126)W122 ..................................................... 39
Figure 3.13: LILBID-MS for H126W122 ................................................................... 41
Figure 3.14: LILBID-MS for Re(H126)W122 ............................................................ 41
Figure 3.15: Time-resolved Infrared Spectra Re(H126)W122 ................................... 42
Table 3.2: Summary of TRIR ...................................................................................... 43
Figure 4.1: Scheme for Two Hops ............................................................................... 52

xv Figure 4.2: Image of Photolyase .................................................................................. 53
Figure 4.3: Luminescence Decay for Re(H126)W124W122 ..................................... 54
Figure 4.4: Transient Absorption of Re(H126)W124W122 for Cu2+
......................... 55
Figure 4.5: Transient Absorption of Re(H126)W124W122 for “Re0” ....................... 55
Figure 4.6: Temperature Dependent Steady State Fluorescence for
Re(H124)W122 ............................................................................................................. 56
Figure 4.7: Temperature Dependent Steady State Fluorescence for
Re(H126)W124W122 ................................................................................................... 57
Figure 4.8: Tryptophan Fluorescence for H124W122 ................................................ 58
Figure 4.9: Tryptophan Fluorescence for H126W122 ................................................ 58
Figure 4.10: Tryptophan Fluorescence for H126W124W122 .................................... 59
Figure 4.11: Crystal Structure of Re(H126)W124W122 ............................................ 60
Figure 4.12: Structure of the Redox Sites for Re(H126)W124W122 ........................ 60
Table 4.1: Crystal Parameters Re(H126)W124W122 ................................................. 61
Figure 4.13: Time-resolved Infrared Spectra Re(H126)W124W122 ......................... 62
Table 4.2: Summary of TRIR ...................................................................................... 62
Figure 5.1: Luminescence Decay for Re(H83)W48W110 ......................................... 71
Figure 5.2: Luminescence Decay for Re(H83)W48, Wild Type Azurin.................... 72
Figure 5.3: Transient Absorption for Re(H83)W48W110 .......................................... 73
Figure 5.4: Transient Absorption for Re(H83)W48, Wild Type Azurin .................... 73
Figure 5.5: Luminescence Decay for Re(H107)W108W110 ..................................... 74
Figure 5.6: Transient Absorption for Re(H107)W108W110 ...................................... 75
Figure 5.7: Crystal Structure of Re(H107)W108W110 .............................................. 76
Figure 5.8: Two Forms in Crystal Packing ................................................................. 76
Table 5.1: Crystal Parameters ...................................................................................... 77
Figure 5.9: Hopping Map for Re(H83)W48, Wild Type Azurin ................................ 78
Figure 6.1: Tunneling Time Table for α-Helix............................................................ 84
Figure 6.2: Crystal Overlap for Cytochrome b562 and Cytochrome cb562 ................... 85
Figure 6.3: UV-Visible Absorption Spectra for Cytochrome cb562 ............................ 92
Figure 6.4: Difference Spectra for Cytochrome cb562 ................................................. 92
Figure 6.5: Transient Absorption for Ru(H63) Cytochrome cb562, Fe3+
Bleach ........ 93
Figure 6.6: Transient Absorption for Ru(H63) Cytochrome cb562, Fe2+
Growth ....... 94
Figure 6.7: Transient Absorption for Ru(D12H) Cytochrome cb562, Fe3+
Bleach ..... 94

xvi Figure 6.8: Transient Absorption for Ru(D12H) Cytochrome cb562, Fe
2+ Growth .... 95
Table 6.1: Rate Comparison for Cytochrome b562 and Cytochrome cb562 .................. 95
Figure 6.9: Transient Absorption for Ru(H63) Cytochrome cb562, Ruthenium ......... 96
Figure 6.10: Transient Absorption for Ru(D12H) Cytochrome cb562, Ruthenium .... 96
Table 6.2: Theoretical Rates and Distances ................................................................. 98

1
Chapter 1
Introduction
1.1 Statement of Intent
For almost two decades, the Gray group has been engineering multi-step electron transfer,
“hopping,” reactions in the protein Pseudomonas aeruginosa azurin. The hopping schemes developed
have used the azurin’s type I copper and a photoactive metal label as the two metal sites. As the
intermediate site, the group has used tyrosine, nitro-tyrosine, or tryptophan. The forward “hole”
transfer occurs rapidly as it proceeds through the aromatic residue; however, the back electron
transfer can only occur through a single electron transfer step.
The intent of this thesis is to utilize the collective knowledge of the group to create a viable
hopping system with tryptophan. As the group has had success with a rhenium 4,7-dimethyl-1,10-
phenathroline tricarbonyl histidine modified azurin with a single reactive tryptophan. In this thesis,
the rhenium label will be placed at a further distance to the copper. Therefore, if a viable hopping
system is engineered, the desired back electron transfer should be larger than the previously reported
100 fold electron transfer rate increase. This thesis first outlines the basic theory behind the electron
transfer in proteins. Next, it examines the use of photoactive metal labeled proteins within the Gray
group and describes the basic experimentally techniques. The remaining chapters will present two
new hopping systems, each with its own unique features.
1.2 Semiclassical Electron Transfer Theory
In biology the movement of electrons within cells is essential for everything from anabolic
and catabolic processes to the ability of the cell store energy. Scientists have been researching many

2
decades how the electrons move over small distances within proteins and also long distances across
connecting protein interactions. The basis of all electron transfer models is derived from the platform
of Marcus’s semiclassical electron transfer theory. Marcus's model describes the basic premises and
necessary parameters involved in electrons moving from one atom or molecule to another.1–4
Marcus theory takes into account the Franck-Condon principle, which dictates that electrons
move faster than the nuclei of atoms, and utilizes a one-dimensional energy profile of the reactant and
product versus the nuclear coordinates. The transition state of the reaction must be located where the
reactant (or donor D) and product (or acceptor A) energy profiles overlap. These conditions for the
transition state allowed Marcus to compute kinetic parameters for the electron transfer event. Thus
electron transfer is described in semiclassical electron transfer theory through equation 1.1. The
kinetic parameters are the temperature of the reaction, the reaction driving force (–ΔG°), the
reorganization energy (λ), and the electronic coupling matrix element (HAB). The reaction driving
force is approximated as the difference in the reduction potentials of the donor and the acceptor.1
Reorganization energy is composed of the energy involved in the movement of the ligands (inner
sphere) and of the solvent molecules (outer sphere).4 The electronic coupling matrix element is
determined by the electronic coupling of the intervening medium to the donor and the acceptor.
Equation (1.1)
The visual image of the energy profile for the electron transfer reaction is displayed as two
intersecting parabolas (see figure 1.1).5 The intersection of the two parabolas is the transition state,
the intermediate orientation between the donor and the acceptor. The parameters that dictate the
height or rather activation barrier of the transition state are the reaction driving force and the
reorganization energy. In figure 1.1, the first image demonstrates an activationless barrier (when -
ΔG° = λ), a situation where the rate of electron transfer is optimized and is dependent only upon

3
electronic parameters. The second image (-ΔG°<λ) indicates a reaction containing an activation
barrier; as that barrier is lowered the rate of electron transfer increases. The final image (-ΔG°>λ)
illustrates the intriguing principle of the inverted effect. The inverted effect precipitously decreases
the rate of electron transfer despite the fact that the driving force is greater than the necessary energy
needed to reorganize the system. In each of the cases presented in figure 1.1 the system is adiabatic as
the product and the reactants are located in the same nuclear coordinates.
Within proteins, several of the parameters in equation 1.1, including the reorganization
energy and the electronic coupling matrix are altered from a solvent or the gas phase. Reorganization
energy, particularly the outer shell portions, is minimized within the protein matrix.6,7
For
metalloproteins, “the rack” or the primary and secondary structural elements surrounding the metal
support minimal distortions as the metal (D or A) gains or loses electrons. This rack lowers the net
contribution of λ to the system. As for the electronic coupling matrix, HAB, the coupling between the
donor and the acceptor is reliant on how effective the protein structure couples with the transferring
electron.
Equation (1.2)
-ΔG
λ
λ
-ΔG -ΔG λ=
Figure 1.1: Potential energy curves. Representation of reactant curve (left) and product curve
(right) with the reorganization energy (λ) and driving force (-ΔG ).

4
Two theories are utilized to understand and predict HAB in proteins: the uniform barrier
model and the superexchange model. When examining HAB as a simple square barrier, the electron
coupling decays exponentially over distance, thus a new parameter β is defined as the distance decay
factor (see equation 1.2). For the uniform barrier model,8–10
the distance between the donor and
acceptor is seen in the simple barrier composed of atoms and space gaps. As the intervening media,
or protein, is reduced to a percentage of vacuum (β = 3.5 Å-1) and atoms (β = 0.9 Å
-1) the model
dictates that the β of the system is a universal percentage between vacuum and atom thus equal to 1.4
Å-1. On the other hand, the superexchange model
11–15 considers the matrix between acceptor and
donor as a bridge not an uniform barrier. Thus when evaluating the electronic coupling matrix, the
coupling between the donor and the bridge components as well as the coupling between acceptor and
the bridge components will both be taken into account. Simply, in the superexchange model, the
wave functions of the acceptor and the donor mix with the wave functions of the bridge that is the
protein.
An adaptation of the super exchange model specific for proteins, termed the tunneling
pathway model, was formulated by Beratan and Onuchic.11–13,15
The model takes into account the
specific components the electron travels through from the donor to the acceptor. In this case β is
Figure 1.2: Electron transfer rate dependence on
driving force in Ru-modified His33 cytochrome c.
Fit provides λ and HAB for cytochrome c.20-23

5
broken down into a series of decay components (see equation 1.3). Each component corresponds to
one of three features present in a protein: covalent bonds, hydrogen bonds, and through space gaps.
With the tunneling pathway model, the primary amino acids and the secondary structural elements of
the protein dictate the effect of β on the rate electron transfer. For instance, for an electron traveling
through a β-sheet the model has predicted β of 1.1 Å-1
,16
while the same electron traveling through an
α-helix would have a predicted β of 2.0 Å-1
, if the hydrogen bonding network was not utilized.17–19
Equation (1.3)
1.3 Metal-Modified Metalloproteins and Electron Transfer
In the early 1980s, the Gray group began experimentally demonstrating the theoretical
models of the semiclassical electron transfer theory within proteins. In order to test the theory, the
Gray group took metalloproteins with native or mutated histidines and attached photoactive metal
complex, in particular ruthenium bipyridines. The initial experiments began with ruthenium-modified
cytochrome c.20–23
By varying the diimine ligands, the reduction potential of the label was varied as
much as 1.0 V. As the ruthenium’s reduction potential increased, the rate of electron transfer from the
ruthenium (D) to the heme (A) gradually maximized and finally the rate began to decrease (see figure
1.2). With these experimental results, the inverted effect was demonstrated within proteins.23,24
Also,
utilizing the same ruthenium complexes, the Gray group was able to predict reorganization energy for
proteins.

6
Once the initial parameters of equation 1.1 were experimentally probed, the Gray group
proceeded to utilize activationless systems to chart out the effects of distance on electron transfer
rates. With the -ΔG° = λ systems,23,25
the electron transfer rates are dependent on HAB and therefore
the distance decay factor, β, as well (see figure 1.3). Several features are present in the tunneling
timetable.19
For instance, the mutants of the beta-barrel protein azurin display a clear trend for β = 1.1
Å-1. This result agrees nicely with the theoretical predictions of the tunneling pathway model. Also
significant to the tunneling pathway model is the broad distribution of electron transfer rates within
Figure 1.3: Tunneling timetable for intra-protein electron
transfer in Ru-modified proteins and for interprotein
electron transfer within protein crystals.19
7
the various metal-modified proteins.26,27
Experimentally, this result would indicate that the pathway
the electron tunnels through determines the distance decay factor for that particular protein mutant.
1.4 Multi-Step Tunneling
In biological systems, electrons often travel across large proteins and extended protein
constructs. These biological constructs, such as both photosystems, can span from 20 to 60 Å. If the
electrons traveled by tunneling alone, the rate of electron transfer would occur anywhere from
seconds to years according to figure 1.3. These predicted rates do not include possible proton transfer
or hole transfer. Since HAB is also affected by particle size, proton transfer rates decrease substantially
faster than electron transfer rates. As biological systems are far more efficient than years for a single
turnover, proteins must have devised an alternative to tunneling.
Biological systems compensate for the exponential decrease in rate by utilizing multi-step
tunneling, or “hopping.” In the case of hopping, the bridge between acceptor and the donor not only
participates in forming the final coupled A and D wave functions, but also generates an independent
intermediate.28
This intermediate can be detected containing either an added electron or a new hole.
For proteins this intermediate is typically an amino acid radical. Since the distances between donor
and intermediate and between intermediate and acceptor are each less than the total distance, the
kinetics of the reaction are substantially enhanced, often by orders of magnitude.
Three of the most studied biological examples of hopping are photosystem II, ribonuclease
reductase and the photolyase protein family. In the case of photosystem II (PS II),29
the reaction
begins at the P680 site (excited by photon absorption) and progresses in two directions: a hole
traveling to the manganese center30–32
and electron traveling to redox partner cytochrome b559.33–36
In
the case of the hole transfer, the electron does not move directly from the manganese center to the
P680 site, but instead utilizes a tyrosine radical intermediate. This tyrosine radical has been identified

8
and labeled tyrosine Z (YZ) .30,31
Another system that uses tyrosine radicals is ribonuclease reductase,
or RNR. RNR is a case of a single protein which transfers a hole from a di-metal site (Fe or Mn) to a
cysteine residue on the neighboring domain.37,38
Along the extended tunneling pathway are five
tyrosine residues. Each of these aromatic residues can form a radical intermediate in electron transfer
pathway.38
Unlike the previous two systems, the photolyases and cryptochrome family utilize an
excited flavin, FAD, to oxidize a sequence of three tryptophans.39–49
While each member of the
family retains both high sequence and fold homology and the same activation method, the functions
vary substantially: DNA repair by the photolyases,44,47,49
versus elongation, germination, and
photoperiodism of plants40,42
and entrainment of circadian clocks39,41
by cryptochromes. These three
hopping systems display two of the common radical intermediates present in protein systems:
tryptophan and tyrosine.
The Gray group has been working for the past decade on generating engineered model
system for hopping. The protein Pseudomonas aeruginosa azurin was selected as the protein matrix
because of the previous extensive tunneling experiments performed by the group. The first published
engineered hopping system50
contained a rhenium 4,7-dimethyl-1,10-phenanthroline tri-carbonyl
label, a single tryptophan residue, and the native copper. The system was designated Re(H124)W122
referencing the histidine 124 as the attachment site for the rhenium and the tryptophan mutant at
residue 122. While the two metals were 19.8 Å apart, the initial electron transfer event took place in
30 ns, a lifetime of approximately 2 orders of magnitude shorter than the back electron transfer
reaction at 3 μs. These rates indicated that the initial electron transfer had to take place in a hopping
mechanism utilizing the tryptophan radical cation intermediate. The group continues to engineer
more hopping systems utilizing tryptophan, tyrosine, and 3-nitrotyrosine as intermediates.

9
REFERENCES
(1) Marcus, R. Discuss. Faraday Soc. 1960, 29, 21–31.
(2) Marcus, R. A. J. Chem. Phys. 1956, 24, 966.
(3) Marcus, R. Anal Chem 1963, 67, 853–857.
(4) Marcus, R. A. J. Chem. Phys. 1965, 43, 679.
(5) Marcus, R. Annu. Rev. Phys. Chem. 1964, 15, 155–196.
(6) Larsson, S. J. Chem. Soc. Faraday Trans., 2 1983, 79, 1375.
(7) Langen, R. Electron Transfer in Proteins: Theory and Experiment, Thesis,
California Institute of Technology, 1995.
(8) Moser, C.; Keske, J.; Warncke, K.; Farid, R.; Dutton, P. Nature 1992, 355, 796–
802.
(9) Farid, R. S.; Moser, C. C.; Dutton, P. L. Curr. Opin. Struct. Biol. 1993, 3, 225–
233.
(10) Page, C. C.; Moser, C. C.; Chen, X.; Dutton, P. L. Nature 1999, 402, 47–52.
(11) Beratan, D. N.; Betts, J. N.; Onuchic, J. N. Science 1991, 252, 1285–1288.
(12) Betts, J.; Beratan, D.; Onuchic, J. J. Am. Chem. Soc. 1992, 114, 4043–4046.
(13) Beratan, D.; Betts, J.; Onuchic, J. J. Phys. Chem. 1992, 96, 2852–2855.

10
(14) Skourtis, S. S.; Regan, J. J.; Onuchic, J. N. J. Phys. Chem. 1994, 98, 3379–3388.
(15) Onuchic, J. N.; Beratan, D. N. J. Chem. Phys. 1990, 92, 722.
(16) Regan, J. J.; Bilio, A. J. D.; Langen, R.; Skov, L. K.; Winkler, J. R.; Gray, H. B.;
Onuchic, J. N. Chem. Biol. 1995, 2, 489–496.
(17) Farrow, N. Investigation of Electron Transfer in the alpha-Helical Protein
Cytochrome b562, Thesis, Californina Institute of Technology, 1999.
(18) Gray, H. B.; Winkler, J. R. Q. Rev. Biophys. 2003, 36, 341–372.
(19) Gray, H. B.; Winkler, J. R. Proc. Natl. Acad. Sci. USA 2005, 102, 3534–3539.
(20) Wuttke, D.; Bjerrum, M.; Chang, I.; Winkler, J. R.; Gray, H. B. Biochim. Biophys.
Acta 1992, 101, 168–170.
(21) Casimiro, D. R.; Richards, J. H.; Winkler, J. R.; Gray, H. B. J. Phys. Chem. 1993,
97, 13073–13077.
(22) Nocera, D. G.; Winkler, J. R.; Yocom, K. M.; Bordignon, E.; Gray, H. B. J. Am.
Chem. Soc. 1984, 106, 5145–5150.
(23) Therien, M. J.; Selman, M.; Gray, H. B. J. Am. Chem. Soc. 1990, 112, 2420–
2422.
(24) Wuttke, D. S.; Bjerrum, M. J.; Winkler, J. R.; Gray, H. B. Science 1992, 256,
1007–1009.

11
(25) Winkler, J.; Gray, H. Chem. Rev. 1992, 92, 369–379.
(26) Prytkova, T. R.; Kurnikov, I. V.; Beratan, D. N. J. Phys. Chem., B 2005, 109,
1618–25.
(27) Prytkova, T. R.; Kurnikov, I. V.; Beratan, D. N. Science 2007, 315, 622–5.
(28) Shih, C. Electron Tunneling and Hopping Through Proteins, Thesis, California
Institute of Technology, 2008.
(29) Ferreira, K. N.; Iverson, T. M.; Maghlaoui, K.; Barber, J.; Iwata, S. Science 2004,
303, 1831–8.
(30) Diner, B. A.; Force, D. A.; Randall, D. W.; Britt, R. D. Biochemistry 1998, 37,
17931–43.
(31) Ahlbrink, R.; Haumann, M.; Cherepanov, D.; Bögershausen, O.; Mulkidjanian, a;
Junge, W. Biochemistry 1998, 37, 1131–42.
(32) Hoganson, C. W. Science 1997, 277, 1953–1956.
(33) Tommos, C.; Babcock, G. T. Acc.Chem. Res. 1998, 31, 18–25.
(34) Lancaster, C. R.; Michel, H.; Honig, B.; Gunner, M. R. Biophys. J. 1996, 70,
2469–92.
(35) Okamura, M. Y.; Paddock, M. L.; Graige, M. S.; Feher, G. Biochim. Biophys.
Acta 2000, 1458, 148–63.

12
(36) Nabedryk, E. Biochim. Biophys. Acta 1999, 1411, 206–13.
(37) Stubbe, J.; Nocera, D. G.; Yee, C. S.; Chang, M. C. Y. Chem. Rev. 2003, 103,
2167–201.
(38) Chang, M. C. Y.; Yee, C. S.; Nocera, D. G.; Stubbe, J. J. Am. Chem. Soc. 2004,
126, 16702–3.
(39) Brazard, J.; Usman, A.; Lacombat, F.; Ley, C.; Martin, M. M.; Plaza, P.; Mony,
L.; Heijde, M.; Zabulon, G.; Bowler, C. J. Am. Chem. Soc. 2010, 132, 4935–45.
(40) Lin, C.; Todo, T. Genome Bology 2005, 6, 220.
(41) Weber, S.; Biskup, T.; Okafuji, A.; Marino, A. R.; Berthold, T.; Link, G.; Hitomi,
K.; Getzoff, E. D.; Schleicher, E.; Norris, J. R. J. Phys. Chem., B 2010, 114,
14745–54.
(42) Shalitin, D.; Yu, X.; Maymon, M.; Mockler, T.; Lin, C. 2003, 15, 2421–2429.
(43) Kavakli, I. H.; Sancar, A.; Hill, C.; Carolina, N. Biochemistry 2004, 43, 15103–
15109.
(44) Essen, L. O.; Klar, T. CMLS 2006, 63, 1266–77.
(45) Byrdin, M.; Sartor, V.; Eker, A. P. M.; Vos, M. H.; Aubert, C.; Brettel, K.;
Mathis, P. Biochim. Biophys. Acta 2004, 1655, 64–70.

13
(46) Lukacs, A.; Eker, A. P. M.; Byrdin, M.; Brettel, K.; Vos, M. H. J. Am. Chem. Soc.
2008, 130, 14394–5.
(47) Weber, S. Biochim. Biophys. Acta 2005, 1707, 1–23.
(48) Woiczikowski, P. B.; Steinbrecher, T.; Kubař, T.; Elstner, M. J. Phys. Chem., B
2011, 115, 9846–63.
(49) Sancar, A. J. Biol. Chem. 2008, 283, 32153–7.
(50) Shih, C.; Museth, A. K.; Abrahamsson, M.; Blanco-Rodriguez, A. M.; Di Bilio,
A. J.; Sudhamsu, J.; Crane, B. R.; Ronayne, K. L.; Towrie, M.; Vlcek, A.;
Richards, J. H.; Winkler, J. R.; Gray, H. B. Science 2008, 320, 1760–1762.

14
Chapter 2
Materials and Methods
2.1 Photochemistry with Metalloproteins
Since the early 1980’s the Gray group has been using metal-modified metalloproteins to
examine electron transfer parameters experimentally.1–8
With the attachment of a second metal,
particularly one with low inner-sphere reorganization energy like ruthenium or rhenium, the Gray
group has been able to investigate several theoretical models such as the inverted effect and pathway-
dependent tunneling.2,3,5,8,9
In order to activate the transfer of electrons, the Gray group had utilized
either photoactive metal labels or photoactive external quenchers. Using a photochemical event as the
trigger for the electron transfer it is possible to determine its kinetic parameters.
The first system, mentioned in the previous section, used a ruthenium pentaammine complex,
Ru(NH3)53+
, attached to a histidine on horse heart cytochrome c.5,10
In this system, the Ru-label had a
significant amount of reorganization energy contributed by the outershell reorganization around the
NH3 ligands. This effect meant that for the ruthenium pentaammine intra-molecular electron transfer
to the heme, -ΔG° < λ (equation 1.1); thus, electron transfer rates were not optimized. The electron
transfer was initiated with photo-excitation of ruthenium tris-2,2-bipyridine (tris-bpy). The Ru-label
quenched the *Ru(bpy)32+
more effectively than the iron heme of the cytochrome c. The formed
Ru(bpy)33+
was scavenged by EDTA to prevent inter-molecular electron transfer. The intra-molecular
back electron transfer in the metal-modified protein was monitored by following the reduction of the
protein cofactor by the reduced Ru(NH3)52+
.
15
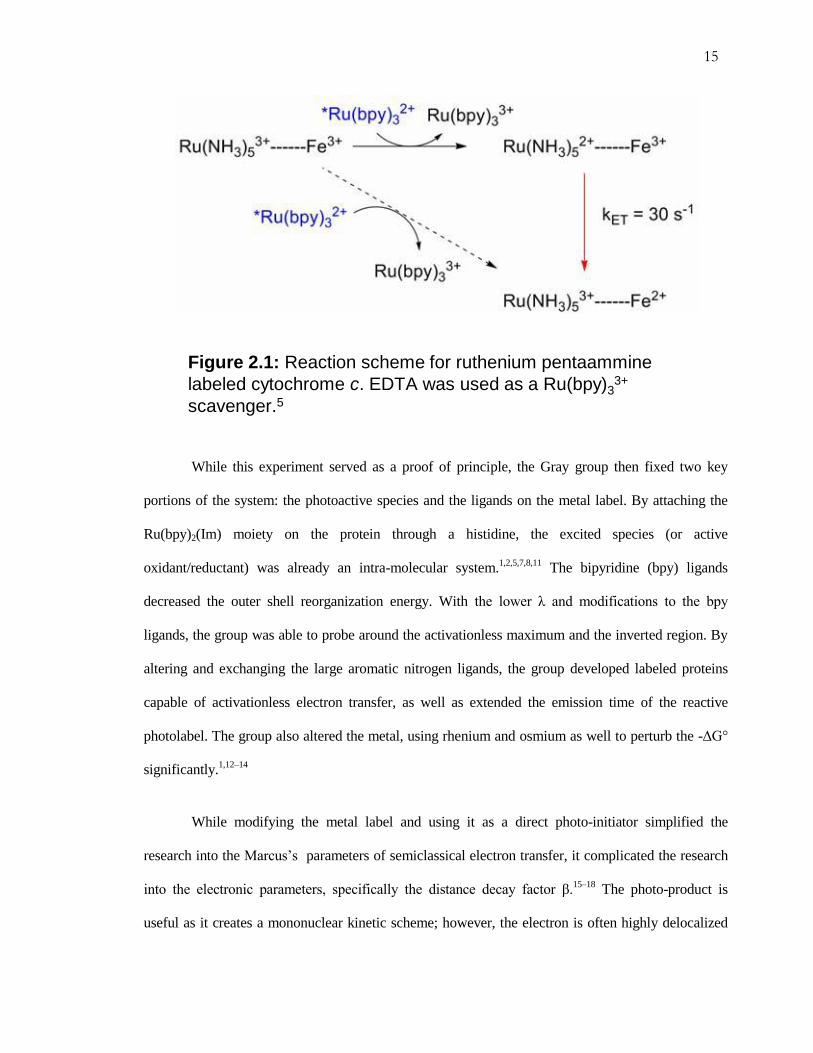
While this experiment served as a proof of principle, the Gray group then fixed two key
portions of the system: the photoactive species and the ligands on the metal label. By attaching the
Ru(bpy)2(Im) moiety on the protein through a histidine, the excited species (or active
oxidant/reductant) was already an intra-molecular system.1,2,5,7,8,11
The bipyridine (bpy) ligands
decreased the outer shell reorganization energy. With the lower λ and modifications to the bpy
ligands, the group was able to probe around the activationless maximum and the inverted region. By
altering and exchanging the large aromatic nitrogen ligands, the group developed labeled proteins
capable of activationless electron transfer, as well as extended the emission time of the reactive
photolabel. The group also altered the metal, using rhenium and osmium as well to perturb the -ΔG°
significantly.1,12–14
While modifying the metal label and using it as a direct photo-initiator simplified the
research into the Marcus’s parameters of semiclassical electron transfer, it complicated the research
into the electronic parameters, specifically the distance decay factor β.15–18
The photo-product is
useful as it creates a mononuclear kinetic scheme; however, the electron is often highly delocalized
Figure 2.1: Reaction scheme for ruthenium pentaammine
labeled cytochrome c. EDTA was used as a Ru(bpy)33+
scavenger.5

16
across the metal and ligands in its excited state. To solve the issue of electronic delocalization so the
distance the electron travels is clearly defined, the Gray group utilized a technique of flash-quench.19
With this technique, the *Ru
2+ is quenched with an oxidant or a reductant in order to access the
ground state of Ru3+
or Ru1+
. As these states allow the electron moving from the Ru or to the Ru to be
centered on the metal itself, distance- dependent rates can be monitored. The other advantages of the
flash-quench reaction are that the photolabel can access more potent oxidative and reductive states
and that the intra-molecular donor or acceptor persists long enough for electron transfer instead of
decaying at a faster rate by excited emission.
Figure 2.2: Illustration of reductive quenching (1→2 →5
→6) and oxidative quenching (6 →4 →3 →1). The protein
is designated as a blue bubble, while the photo-label is
magenta.19

17
2.2 Appendix: List of Terms
Table 2.1 Amino Acid Names and Abbreviations
Amino Acid Three-Letter Abbreviation One-Letter Abbreviation
Alanine Ala A
Arginine Arg R
Asparagine Asn N
Aspartate Asp D
Cysteine Cys C
Glutamate Glu E
Glutamine Gln Q
Glycine Gly G
Histidine His H
Isoleucine Ile I
Leucine Leu L
Lysine Lys K
Methionine Met M
Phenylalanine Phe F
Proline Pro P
Serine Ser S
Threonine Thr T
Tryptophan Trp W
Tyrosine Tyr Y
Valine Val V

18
Table 2.2 Metal Complexes or Molecules and Abbreviations
Complex/Molecule Name Abbreviation
Rhenium Re
Ruthenium Ru
Copper Cu
Zinc Zn
4,7-dimethyl-1,10-phenanthroline dmp
Bipyridine bpy
Imidazole Imid
Rhenium 4,7-dimethyl-1,10-phenanthroline tricarbonyl imidazole Re model complex
Rhenium 4,7-dimethyl-1,10-phenanthroline tricarbonyl histidine# Re(H#)
Ruthenium bis-bipyridine di-aquo Ru(bpy)2(H2O)2+2
Ruthenium bis-bipyridine di-imidazole Ru(bpy)2(imid)2+2
Ruthenium bis-bipyridine imidazole histidine# Ru(H#) or Ru(X#H)
Sodium Acetate Buffer NaOAc buffer
Phosphate Buffer Pi buffer
Potassium Bicarbonate Buffer KHCO3 buffer
2.3 Protein Preparation12,20,21
Site-Directed Mutagenesis
The wild type Pseudomonas aeruginosa azurin protein contains one free native histidine, two
native tyrosines, and one native tryptophan. All mutants utilized in the hopping studies contain the
mutations where the native histidine is replaced with a glutamate and the three redox active amino
acids become phenylalanines. This is termed the all Phe mutant and is achieved through site-directed

19
mutagenesis. The corresponding plasmid has been used as the base sequence for all hopping mutants.
Yuling Sheng mutated in one histidine for labeling and one or two tryptophans as hopping
intermediates. Established protocols for site-directed mutagenesis were used. All mutagenesis to the
original all Phe protein was performed using a Quickchange mutagenesis kit (Stratagene). All primers
were obtained from Invitrogen.
Protein Expression
The azurin plasmid was expressed in the BL21 (DE3) E. coli cell line. The plasmid (1 μL
portions) was combined with 50 μL portions of the BL21 (DE3) cells in 200 μL of +NZY media. The
mixture was chilled on ice for 5 min to equilibrate. The plasmids were inserted using 80 sec of heat
shock at 42 oC. Following the heat shock, the cells were incubated for 1 hr at 37
oC. The cells were
then plated on LB media plates containing 100 μg/mL of ampicillin. On one plate, 100 μL of cells
were plated and the remaining cells were plated on a second plate. The plates were incubated for 12 -
16 h. Colonies were selected and inserted into four mLs of TB broth containing 60 μg/mL of
ampicillin as a starter culture and incubated for 7 – 8 hrs at 37 oC. The starter culture was inoculated
into 6 x 1L TB broth containing 70 μg/mL of ampicillin. The large-scale reaction was incubated at 37
oC for 20 hrs.
The cells were isolated by centrifugation into 6 x 250 mL sealed containers. They were
isolated at 5000 rpm for 10 min. The cells were collected into one sealed container and resuspended
into a 100 mL of cold sucrose solution swirling gently for 30 min in 0 oC. The cells were reisolated at
5000 rpm for 10 min and once more resuspended in 100 mL of a cold MgSO4 solution. The solution
was gently swirled for 1 hr in 0 o
C in order to lyse bloated cells through osmotic shock. The cell
particles were isolated by centrifugation at 10,000 rpm for 30 min. The remaining supernatant was
poured into a clean 250 mL sealed container and acidified by adding 4 mL of 1 M NaOAc buffer pH
4.5. The final solution should be 25 mM NaOAc buffer pH 4.5 and contained 10 mM of either CuSO4
20
or Zn(OAc)2 depending on the desired metal; the solution was left at 0 o
C for a week in order to
precipitate unnecessary proteins. Finally, the protein solution was isolated from the precipitate at
5000 rpm for 10 min and decanted into a 500 mL Amicon. The solution was washed with 25 mM
NaOAc buffer until the flow-through was clear and the solution was concentrated to 10 – 20 mL.
Protein Purification
The protein was purified utilizing a Mono S column (Pharmacia) on a FPLC machine. The
Mono S column contains a surface thiolate resin which binds to positive species. The pI of azurin is
approximately 5.4 thus to propagate positive charge around the azurin molecules the 25 mM NaOAc
buffer pH 4.5 was used. The Mono S column was equilibrated using a binding buffer (buffer A) of 25
mM NaOAc pH 4.5 for 5 column volumes (CV) followed by 5 CV of the eluting buffer (buffer B) of
300 mM NaOAc pH 4.5 and finished with 5 CV of the binding buffer, buffer A. The protein was
loaded onto the column 4 – 5 mLs segments. The protein typically binds very tightly to the Mono S
column. The protein slowly eluted off the column with a gradual increase of buffer B to
approximately 20% B. The protein was collected in glass tubes as it eluted off the column. The final
purified protein was examined with ESI mass spectrometry and concentrated to approximately 1 – 2
mM protein solution.
Protein Labeling
The mutant at 1 – 2 mM concentration was desalted into 75 mM NaPi pH 7.4 buffer. In turn
the rhenium tricarbonyl 4,7-dimethyl-1,10-dimethylphenanthroline was dissolved in 6.5 mL of water
to approximately 100 mM concentration. In five 1.7 mL Eppendorf tubes, 200 μL of the protein and
1.2 mL of the Re solution were combined. Using heating blocks, the Eppendorf tubes were heated to
40 oC for 5 days. The reaction was collected and concentrated in an Amicon-Ultra 10,000 MWCO
(Millipore) at 3000 rpm for 10 min. Once collected, the labeled protein was rinsed with 25 mM NaPi

21
pH 7.2 for five rinses each time spun down at 3000 rpm for 10 min. Lastly, the labeled protein
solution was desalted into 25 mM NaOAc pH 4.5 using a PD-10 column and left in the dark in 0 oC
for 4 days.
To isolate the labeled protein, the labeled solution was purified first on a 5 mL HiTrap
chelating column. The chelating column is loaded with 100 mM CuSO4 solution after equilibrating
with loading buffer A, 25 mM NaPi pH 7.2 + 750 mM NaCl. Once the copper has been loaded onto
the column, the column was rinsed with the eluting buffer B, 25 mM NaPi pH 7.2 + 750 mM NH4Cl
and reequilibrated with buffer A. The labeled protein was desalted into buffer A and loaded onto the
column. The labeled protein did not stick on the column and was collected immediately. The
unlabeled protein was eluted using buffer B. The collected labeled protein was concentrated and
desalted into the loading buffer (buffer A) for a Mono Q column or a Mono S column (Pharmacia).
While most azurin mutants dealt with in this thesis were purified at the last step with the
Mono S column, the Re126W122 mutant (Chapter 3) was isolated on the Mono Q column. The
Mono Q contains a surface quaternary amine resin making it an anion exchange column. The high pH
of buffer A, 25 mM DEA pH 9.0, allowed the labeled azurin to bind loosely to the column. Similar to
the Mono S column, the labeled protein was loaded onto the Mono Q column and rinsed with 1 CV
of loading buffer A. Following the loading buffer, the eluting buffer B, 25 mM DEA pH 9.0 + 200
mM NaCl, was gradually increased until approximately 10% B (32% B for Mono S). The eluting
protein was collected and concentrated. Purity of the labeled protein was confirmed with ESI- mass
spectrometry.

22
2.4 Wavelength-Dependent Nanosecond Laser System (NS-I)
Instrument Setup for 355 nm
The wavelength-dependent nanosecond laser system is composed of a pump/probe setup (see
figure 2.b). The pump is the Spectra-Physics Nd:YAG laser coupled with a OPO. The Nd:YAG
utilized in the nanosecond system pulses at 1064 nm for approximately 10 ns. The frequency is
tripled to generate 355 nm pulses at 10 Hz. This pulse can either be sent through the OPO in order to
vary the wavelength from 400 – 600 nm. Alternatively, the original pulse beam can be directed
around the OPO in order to access 355 nm. The pulses is around 300 – 400 mJ/pulse leaving the
Nd:YAG box, which is reduced to around 40 – 50 mJ/pulse after leaving the OPO box. In both cases,
the pump beam is directed through a polarizer to modulate the beam and reduce the power of the
pulse. The pump is also directed through a half wave plate in the case of 355 nm to further reduce the
power the pulse. As the pump is angled onto the table containing the probe alignment, the power has
been reduced to around 1 – 3 mJ/pulse in order to protect the protein samples.
The probe setup is aligned through the sample overlapping the pump beam in order to
examine the change in absorption once the sample is excited. The broadband probe is a Xe arc lamp.
The Xe lamp is aligned through the sample utilizing two concave mirrors that also focus the probe
beam into a monochromator. In the case of rhenium modified azurins, a continuous coherent HeNe
laser is used. The much smaller beam size of the laser allows irises to cut down on the size of the
reflective mirrors, thus minimizing the overlapping emission wavelengths. Since the concave mirrors
also focus the sample's emission into the monochromator, a series of broadband filters and a neutral
density filter are used to block out unnecessary light and prevent excess signal. The monochromator
is attached to a photomultiplier tube (PMT) which converts the signal into a current. One of two
amplifiers is utilized to process the signal: a fast amplifier with instrument response time of 5 ns and a
more sensitive slow amplifier which can detect signals as long as 100 ms.

23
Sample Preparation: Azurin
The sample was contained in a quartz cuvette with clear windows on all four sides. The
cuvette was modified to have an extended arm which attached to a port on a Schlenk line and a
double Teflon seal. A sample size of 0.75 – 1.5 mL of labeled protein was inserted into the cuvette.
For azurin samples, the protein was at concentrations from 10 – 35 μM in 25 mM KPi pH 7.2 buffer.
The sample was degassed using a pump/purge method. The cuvette was attached to the Schlenk line
and the Teflon seal was rotated to the first seal (isolates the system from external air). The
pump/purge began with a quick pull on the air in the head space of the cuvette. Once the gas mixture
has been removed, the line was sealed on a closed system to allow the gas in the solution to displace
into the head space. Before the solution begins to bubble violently, the cuvette is purged with Argon
gas. This setup was repeated for 15 cycles. Before the cuvette is removed from the line, the Teflon
seal was closed to the second seal in order to isolate the sample from the line attachment. Following
the final seal, the cuvette was removed from the line. For the described preparation, the metal site was
cupric azurin.
In order to prepare a fully active hopping system, the azurin must be in the cuprous state. The
protein was prepared within the same concentrations, volumes, and buffer. However, before inserting
the sample into the cuvette, the azurin was reduced using a reducing agent, usually sodium dithionite.
The reducing agent was added until the sample changed from a blue color to clear. Once the sample
was reduced, one of two protocols was used. The first left the sodium dithionite in the solution during
the experiment and the cuvette with the reduced protein solution was pump/purged. The second
protocol removed the reductant by desalting the labeled protein in a PD10 column equilibrated with
25 mM KPi pH 7.2 buffer. The protein was collected into the cuvette and diluted to the necessary
concentration before the sample was pump/purged.

24
2.5 Time-Resolved Infrared Spectroscopy (TRIR)
The fast (ps-ns) electronic reactions within the system, specifically of the rhenium 4,7-
dimethyl-1,10-phenanthroline tricarbonyl, were examined by time-resolved infra-red spectroscopy by
a collaboration with Antonin Vlcek and Ana María Blanco-Rodríguez. The experimental setup was
the ULTRA instrument at the STFC Rutherford Appleton Laboratory. For the ps measurements, a
titanium sapphire laser-based regenerative amplifier (Thales) was used. The pump produces 50 fs
pulses of 800 nm at a 10 kHz repetition rate. The laser output is split into two parts: one for the pump
beam and one for the probe pulse. The pump is frequency doubled to produce 400 nm or produces a
pump beam utilizing an OPA (Light Conversion, TOPAS) equipped with SHG and SFG units to
achieve 355 nm. To obtain the probe beam, the second portion of the output of the Ti:Saph pumps a
TOPAS OPA which provides a signal and idler beam which are difference frequency mixed to
generate ~400 cm-1
broad mid IR pulses. An optical delay line is used to provide the time-resolved
delay between the pump and the probe beams. The detector detectors used to record the mid IR probe
spectrum are two 128 element HgCdTe detectors (Infrared Associates). The ns-s measurements
utilized different setup. The sample was pumped with 355 nm at 0.7 ns FWHM pulses (AOT, AOT-
YVO-20QSP/MOPO) and probed with an electronically synchronized 50 fs IR pulse.
Samples were provided around 0.7 – 1.4 mM concentrations in a 50 mM alkaline Pi pD/pH
7.2 buffer and were diluted by approximately half in order to make working with the sample easier.
The sample preparation was similar to the first protocol reported in section 2.4. The sample was
placed in a round dip approximately 0.15 mm deep, drilled into a CaF2 plate and tightly sealed with a
polished CaF2 window. In order to prevent excess heating or decomposition of the sample the cell
was scanned across the area of the dip in two dimensions. In order to assess the sample’s durability
during the experimentation, FTIR spectra were measured before and after the experiment.

25
REFERENCES
(1) Di Bilio, A. J.; Hill, M. G.; Bonander, N.; Villahermosa, R. M.; Malmstro, B. G.;
Winkler, J. R.; Gray, H. B. J. Am. Chem. Soc. 1997, 119, 9921–9922.
(2) Wuttke, D.; Bjerrum, M.; Chang, I.; Winkler, J. R.; Gray, H. B. Biochim. Biophys.
Acta 1992, 101, 168–170.
(3) Casimiro, D. R.; Richards, J. H.; Winkler, J. R.; Gray, H. B. J. Phys. Chem. 1993,
97, 13073–13077.
(4) Willie, A.; Mclean, M.; Liu, R.; Hilgen-willis, S.; Saunders, A. J.; Pielak, G. J.;
Sligar, S. G.; Durham, J. B.; J, F. M. Biochemistry 1993, 32, 7519–7525.
(5) Nocera, D. G.; Winkler, J. R.; Yocom, K. M.; Bordignon, E.; Gray, H. B. J. Am.
Chem. Soc. 1984, 106, 5145–5150.
(6) Winkler, J.; Gray, H. Chem. Rev. 1992, 92, 369–379.
(7) Babini, E.; Bertini, I.; Borsari, M.; Capozzi, F.; Luchinat, C.; Zhang, X.; Moura,
G. L. C.; Kurnikov, I. V.; Beratan, D. N.; Ponce, A.; Di Bilio, A. J.; Winkler, J.
R.; Gray, H. B.; Capponi, V. G. J. Am. Chem. Soc. 2000, 122, 4532–4533.
(8) Therien, M. J.; Selman, M.; Gray, H. B. J. Am. Chem. Soc. 1990, 112, 2420–
2422.

26
(9) Margalit, R.; Kostić, N. M.; Che, C. M.; Blair, D. F.; Chiang, H. J.; Pecht, I.;
Shelton, J. B.; Shelton, J. R.; Schroeder, W. a; Gray, H. B. Proc. Natl. Acad. Sci.
USA 1984, 81, 6554–8.
(10) Yocom, K.; Shelton, J. Proc. Natl. Acad. Sci. USA 1982, 79, 7052–7055.
(11) Casimiro, D. R.; Wong, L.; Con, J. L.; Zewert, T. E.; Richards, J. H.; Chang, I.;
Jay, R. W.; Gray, H. B. J. Am. Chem. Soc. 1993, 115, 1485–1489.
(12) Wehbi, W. A. Amino Acid Radicals in Rhenium-Modified Copper Proteins,
Thesis, California Institute of Technology, 2003.
(13) Connick, W. B.; Di Bilio, A. J.; Hill, M. G.; Winner, J. R.; Gray, H. B. Inorg.
Chim. Acta 1995, 240, 169–173.
(14) Miller, J. E.; Di Bilio, A. J.; Wehbi, W. A; Green, M. T.; Museth, A K.; Richards,
J. R.; Winkler, J. R.; Gray, H. B. Biochim. Biophys. Acta 2004, 1655, 59–63.
(15) Wuttke, D. S.; Bjerrum, M. J.; Winkler, J. R.; Gray, H. B. Science 1992, 256,
1007–1009.
(16) Gray, H. B.; Winkler, J. R. Q. Rev. Biophys. 2003, 36, 341–372.
(17) Gray, H. B.; Winkler, J. R. J. Electroanal. Chem. 1997, 438, 43–47.
(18) Gray, H. B.; Winkler, J. R. Proc. Natl. Acad. Sci. USA 2005, 102, 3534–9.
(19) Dempsey, J. L.; Winkler, J. R.; Gray, H. B. Chem. Rev. 2010, 110, 7024–7039.

27
(20) Miller, J. Radical formation and electron transfer in biological molecules, Thesis,
California Institute of Technology, 2004.
(21) Shih, C. Electron Tunneling and Hopping Through Proteins, Thesis, California
Institute of Technology, 2008.
28
Chapter 3
Inter-molecular Hopping through Dimers
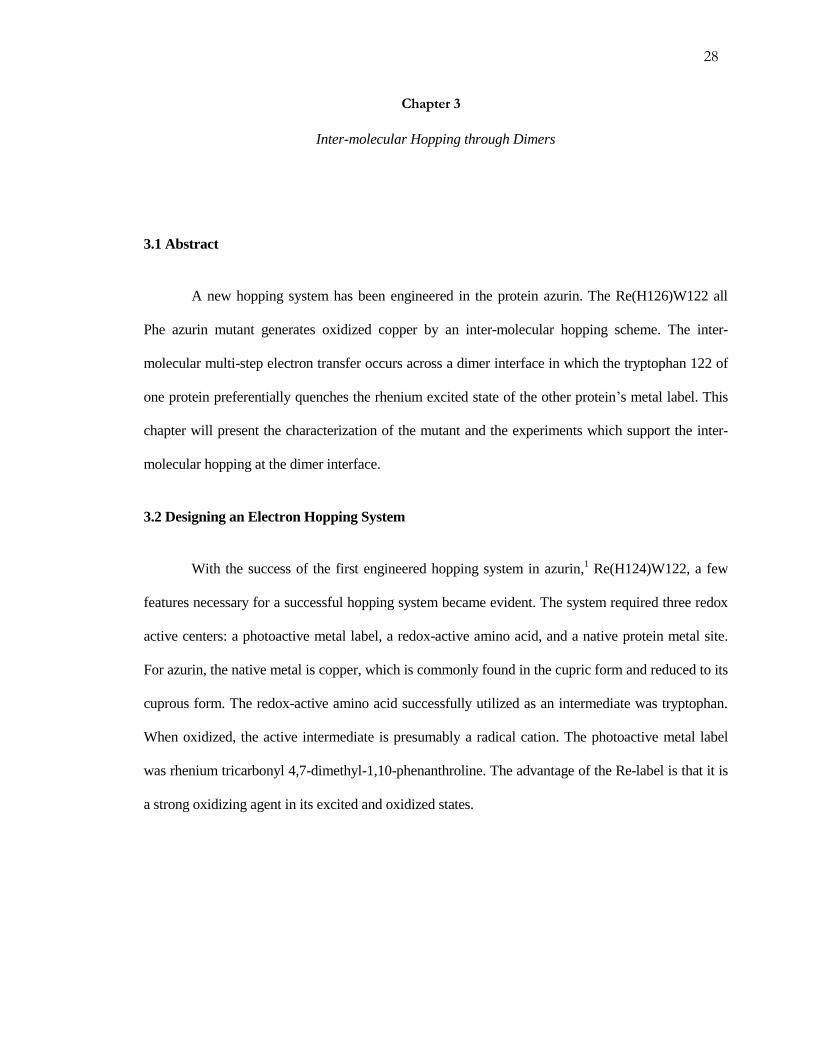
3.1 Abstract
A new hopping system has been engineered in the protein azurin. The Re(H126)W122 all
Phe azurin mutant generates oxidized copper by an inter-molecular hopping scheme. The inter-
molecular multi-step electron transfer occurs across a dimer interface in which the tryptophan 122 of
one protein preferentially quenches the rhenium excited state of the other protein’s metal label. This
chapter will present the characterization of the mutant and the experiments which support the inter-
molecular hopping at the dimer interface.
3.2 Designing an Electron Hopping System
With the success of the first engineered hopping system in azurin,1 Re(H124)W122, a few
features necessary for a successful hopping system became evident. The system required three redox
active centers: a photoactive metal label, a redox-active amino acid, and a native protein metal site.
For azurin, the native metal is copper, which is commonly found in the cupric form and reduced to its
cuprous form. The redox-active amino acid successfully utilized as an intermediate was tryptophan.
When oxidized, the active intermediate is presumably a radical cation. The photoactive metal label
was rhenium tricarbonyl 4,7-dimethyl-1,10-phenanthroline. The advantage of the Re-label is that it is
a strong oxidizing agent in its excited and oxidized states.

29
The first published system was an all Phe (see Section 2.3) mutant of Pseudomonas
aeruginosa azurin with a Re-label (at H124) and tryptophan mutation (122) on the copper ligating
methionine 121 arm. The system demonstrated a formation of cupric azurin at 30 ns, while the return
to the ground state by the back electron transfer occurred with a 3 μs lifetime. This hundred fold rate
difference was a strong indication of a forward hop and return tunneling mechanism (see figure 3.1).
The Gray group probed many other elements of the reaction to back up the claim of an engineered
hopping system. With a non redox-active mutant containing phenylalanine, Re(H124)F122, the
copper was not oxidized and the Re excited state was not quenched. Time-resolved infrared
spectroscopy on the CO ligands resolved a species where the “hole” was on a separate molecule than
the Re but in close vicinity. This species in the TRIR was distinct from the simply reduced Re-label.
The strongest support for the excellent communication between the Re-label and the tryptophan was
determined from the crystal structure (see figure 3.1). With the tryptophan aromatic rings π-stacked
with the dimethyl phenanthroline’s aromatic rings, the acceptor and the intermediate have a strong
electronic interaction. This π-stacking helps couple the system.
19.4 Å
3.4 Å
Figure 3.1: Crystal structure of Re(H124)W122. The M121 ligating beta strand of Re(H124)W122
and Re(H124) illustrating the difference in Re-label orientation and intramolecular distances.
30
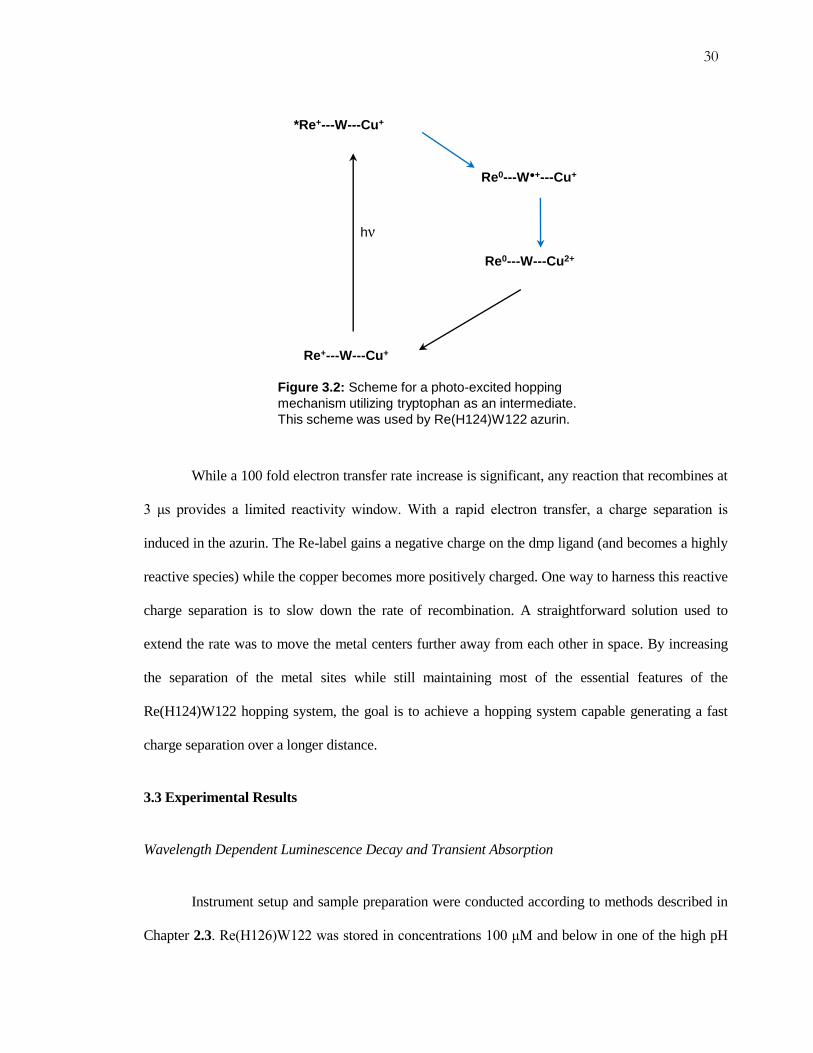
While a 100 fold electron transfer rate increase is significant, any reaction that recombines at
3 μs provides a limited reactivity window. With a rapid electron transfer, a charge separation is
induced in the azurin. The Re-label gains a negative charge on the dmp ligand (and becomes a highly
reactive species) while the copper becomes more positively charged. One way to harness this reactive
charge separation is to slow down the rate of recombination. A straightforward solution used to
extend the rate was to move the metal centers further away from each other in space. By increasing
the separation of the metal sites while still maintaining most of the essential features of the
Re(H124)W122 hopping system, the goal is to achieve a hopping system capable generating a fast
charge separation over a longer distance.
3.3 Experimental Results
Wavelength Dependent Luminescence Decay and Transient Absorption
Instrument setup and sample preparation were conducted according to methods described in
Chapter 2.3. Re(H126)W122 was stored in concentrations 100 μM and below in one of the high pH
Figure 3.2: Scheme for a photo-excited hopping
mechanism utilizing tryptophan as an intermediate.
This scheme was used by Re(H124)W122 azurin.
*Re+---W---Cu+
Re+---W---Cu+
Re0---W +---Cu+
Re0---W---Cu2+
hν

31
buffers, preferably 20 mM NaPi pH 7.2. The protein was known to both aggregate in low pH (4.5) at
medium concentrations (>100 μM) and undergoes a phase transition in low temperatures at high
concentrations (>500 μM). These interesting features were reversible, particularly upon dilution and
agitation, and indicated a mutant with unique concentration-dependent properties. As such, the
protein samples prepared for laser studies were often pairs of concentrations varying from 10 μM to
35 μM. Initial studies were performed in the presence of dithionite, while later studies were
performed without the presence of reductant.
15
10
5
0
m
OD
86420
Time (µs)
Figure 3.3: Transient absorption for Re(H126)W122 azurin(Cu1+) at 633 nm with the
presence of sodium dithionite in 25 mM KPi pH 7.2 buffer.

32
As seen in the luminescence decays (figure 3.4) of the first series of laser experiments, the
external reductant, sodium dithionite, perturbs the system. The transient absorption for the Cu2+
species, observed in the LMCT band at 633 nm, demonstrates a small percentage of copper oxidation
due to the system (refer back to figure 3.1). The Cu2+
absorption appears within a time frame of 100
ns but underneath the overlapping decay of the *Re absorption. The oxidation product decay rate
varies with the sample concentration; however, for the low concentrations used in the initial laser
studies the lifetime is approximately 2 – 10 μs. The luminescence decay lifetime of the system with
dithionite is approximately 300 ns and shows no concentration dependence. However, samples of the
oxidized protein (preparation using Cu2+
instead of Cu+) did show a concentration dependence of the
emission lifetime (not shown).
100
80
60
40
20
0
No
rmalized
In
ten
sit
y
86420
Time (µs)
Figure 3.4: Luminescence decay for Re(H126)W122 azurin(Cu1+) at 560 nm with the
presence of sodium dithionite in 25 mM KPi pH 7.2 buffer.

33
30
20
10
0
-10
-20
m
OD
86420
Time (µs)
Figure 3.5: Transient absorption for Re(H126)W122 azurin(Cu+1) at 633 nm without
the presence of sodium dithionite in 25 mM KPi pH 7.2 buffer.
100
80
60
40
20
0
No
rmalized
In
ten
sit
y
86420
Time (µs)
Figure 3.6: Luminescence decay for Re(H126)W122 azurin(Cu1+) at 560 nm without
the presence of sodium dithionite in 25 mM KPi pH 7.2 buffer.

34
To remove any interference by sodium dithionite, the labeled protein was desalted before
laser studies. The results demonstrated distinct differences. For the transient absorption (figure 3.5),
the copper oxidation signal diminished so that no definitive copper oxidation can be determined from
the data. As for the luminescence decay, without the presence of sodium dithionite the rhenium
excited state displays significantly less quenching. For the samples without sodium dithionite the
investigated concentration range was very small, approximately 20 to 28 μM. As the concentration
range is very narrow, it cannot be determined if the luminescence decays are concentration-
dependent. For the signal without dithionite, the luminescence decay was 600 ns (see figure 3.6).
-15
-10
-5
0
5
10
m
OD
3020100
Time (µs)
100
80
60
40
20
0
No
rma
lize
d I
nte
ns
ity
86420
Time (µs)
Figure 3.7: Transient absorption at 633 nm for 100 μM Re(H126)W122 azurin(Cu1+).
Inset: Luminescence decay of Re(H126)W122 azurin(Cu1+).

35
To probe the presence of dimers much higher concentrations were investigated. Using both a
1 cm and 1 mm cuvette, a series of very high concentration (100 – 220 μM) transient absorption and
luminescence experiments were performed; the experiments were desalted to remove any residual
reductant. The results (shown below) demonstrate two distinct patterns: the luminescence is bi-
exponential and the transient absorption demonstrates copper oxidation.
Steady State Fluorescence
For the steady state fluorescence experiments, the samples were prepared by the same
method used for laser studies. The spectro-fluorometer setup used for the experiments was a
Fluorolog®-3. All excitation wavelengths were set for 355 nm in order to excite the Re-label. The
emission spectra were recorded in the range of 400 – 750 nm. A 350 nm broad band filter was placed
in the sample cavity before the emission optics to block second harmonics from the excitation beam.
For the experiments with Re-labeled azurin the monochromator slits were both set to 2 nm. The
15
10
5
0
m
OD
3020100
Time (µs)
100
80
60
40
20
0No
rma
lize
d I
nte
ns
ity
86420
Time (µs)
Figure 3.8: Transient absorption at 633 nm for 200 μM Re(H126)W122 azurin(Cu1+).
Inset: Luminescence decay Re(H126)W122 azurin(Cu1+).
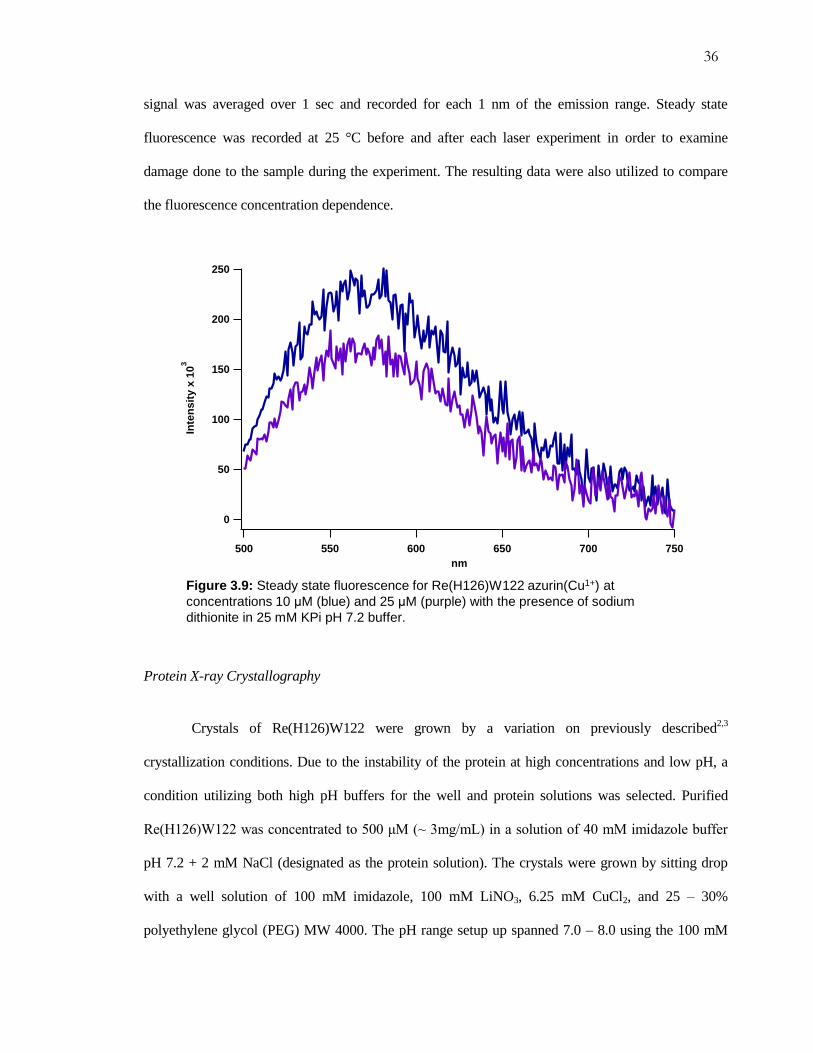
36
signal was averaged over 1 sec and recorded for each 1 nm of the emission range. Steady state
fluorescence was recorded at 25 °C before and after each laser experiment in order to examine
damage done to the sample during the experiment. The resulting data were also utilized to compare
the fluorescence concentration dependence.
Protein X-ray Crystallography
Crystals of Re(H126)W122 were grown by a variation on previously described2,3
crystallization conditions. Due to the instability of the protein at high concentrations and low pH, a
condition utilizing both high pH buffers for the well and protein solutions was selected. Purified
Re(H126)W122 was concentrated to 500 μM (~ 3mg/mL) in a solution of 40 mM imidazole buffer
pH 7.2 + 2 mM NaCl (designated as the protein solution). The crystals were grown by sitting drop
with a well solution of 100 mM imidazole, 100 mM LiNO3, 6.25 mM CuCl2, and 25 – 30%
polyethylene glycol (PEG) MW 4000. The pH range setup up spanned 7.0 – 8.0 using the 100 mM
250
200
150
100
50
0
Inte
nsit
y x
10
3
750700650600550500
nm
Figure 3.9: Steady state fluorescence for Re(H126)W122 azurin(Cu1+) at
concentrations 10 μM (blue) and 25 μM (purple) with the presence of sodium
dithionite in 25 mM KPi pH 7.2 buffer.

37
imidazole buffer adjusted using HCl. The sitting drops were prepared with 2 μL of protein solution
and 2 μL of well solution while the well was filled with 250 μL of well solution in a matrix of 4 x 6
(7.0 – 8.0 pH x 25 – 30% PEG). The crystals initially grew in large leafed branch shapes within 6
months. Two crystal conditions were selected for seeding, pH 7.4, PEG 27% and pH 7.6, PEG 27%;
the larger crystals were utilized as seed crystals. The seeds were crushed in the respective well
solution and added after one week to a second tray containing both pH conditions with the initial
parameters. After 4 months small prism shaped crystals were isolated and cryogenically treated with
the original well solution.
Diffraction data for the Re(H126)W122 crystals were collected at Stanford Synchrotron
Radiation Laboratory on the beam line 12-2 with a SPEAR image plate. Diffraction data were
processed with Scala to determine the dimensions, units, reflections, and viable data set range. The
data were input into Phaser for molecular replacement derived from isolate monomer in the wild type
azurin crystal structure [PDB: 4AZU_A]. Rigid body refinement and molecular refinement were
performed with Refmac5; COOT was used to mutate and insert missing atoms into the structural
coordinates. Further refinement was performed utilizing both Refmac5 and COOT.

38
Figure 3.10: Crystal structure of the mutant All Phe
Re(dmp)(CO)3(H126)W122 Pseudomonas
aeruginosa azurin.
Figure 3.11: Crystal structure of Re(H126)W122 azurin. The Met121 ligating beta
strand containing the rhenium metal-label at His126, the Trp122, and the copper site.
The intra-molecular distances between each redox sites are indicated.
15.9 Å
12.8 Å
25.6 Å

39
12.8 Å
7.9 Å
14.0 Å
Figure 3.12: Structure of the dimer interface for Re(H126)W122 with inter-molecular
distances indicated between the A unit (cyan) rhenium and the B unit (green)
tryptophan and copper.
Table 3.1: Data collection statistics
Space group F 2 2 2
Unit-cell parameters
a (Å) 42.39
b (Å) 93.22
c (Å) 109.38
Wavelength (Å) 0.97950
Resolution Range 35 -1.70 (1.74-1.70)
No. of Unique Reflections 11493
Free R value 0.26524
Completeness (%) 99.21
40
Laser-Induced Liquid Bead Ion Desorption Mass Spectrometry (LILBID-MS)4,5
A collaboration with Lucie Sokolova and Bernhard Brutschy at J.W. Goethe University
allowed us to study the presence of dimers in solution. The Brutschy lab has developed a mass
spectrometer that utilizes a soft ionization method for proteins and also allows for a less damaging
aerosolizing method. By irradiating the injected protein solution in the mid-infrared, the water
molecules are excited and rapidly disperse, leaving any protein-protein interactions intact. The
remaining complexes proceed through a regular time of flight (TOF) mass spectrometer to monitor
mass to charge ratios.
Samples were prepared in California to 0.8 – 2 mM of protein in 20 mM NaPi pH 7.2 before
being shipped to Germany. Both Re-labeled and unlabeled H126W122 were prepared along with
samples of H124W122 and wild type azurin (H83) with their respective Re-labeled partners. The
LILBID-MS was performed at decreasing concentrations and with a variety of buffers and conditions
(see paper5). The relevant data to the mutant H126W122 and Re(H126)W122 are presented below.

41
0k 20k 40k 60k 80k 100k 120k 140k 160k 180k 200k
0k 20k 40k 60k 80k 100k 120k 140k 160k 180k 200k
0k 20k 40k 60k 80k 100k 120k 140k 160k 180k 200k
0k 20k 40k 60k 80k 100k 120k 140k 160k 180k 200k
0k 20k 40k 60k 80k 100k 120k 140k 160k 180k 200k
a8
a7
a6
a5
a4
a3
a2
a1 1.45 mM H126
a5
a4
a3
a2
a1
0.73 mM H126
a3
a2
a1 0.29 mM H126
a2
a1
0.15 mM H126
a1
m/z
Inte
nsi
ty (
a.u
.)
0.07 mM H126
Figure 3.13: Concentration dependence of anion LILBID spectra of unlabeled
H126W122 azurin in 20 mM NaPi buffer at soft conditions.5
0k 20k 40k 60k 80k 100k 120k 140k 160k 180k 200k
0k 20k 40k 60k 80k 100k 120k 140k 160k 180k 200k
0k 20k 40k 60k 80k 100k 120k 140k 160k 180k 200k
a1
a3
a2
a1
m/z
0.29 mM Re126
a2
Inte
nsi
ty (
a.u
.)
0.15 mM Re126
a2
a1
0.07 mM Re126
Figure 3.14: Concentration dependence of anion LILBID spectra of labeled
Re(H126)W122 azurin in 20 mM NaPi buffer at soft conditions.5

42
Time-Resolved Infrared Spectroscopy
Samples were provided at 910 μM concentration in 50 mM NaKPi pD 7.2 buffer and were
diluted by approximately half in order to make working with the sample easier. The Cu+2
samples
were prepared with a dilution of the original provided sample. The Cu+1
samples were reduced in the
presence of sodium dithionite. Once the reductant was added, the experiment was performed with the
reductant still present. In order to assess the sample’s durability during the experiments, FTIR spectra
were measured before and after the experiments.
The kinetics are determined by the timescales of the formation and decay of CO bands due to
excited and reduced states of the Re-label. The species observed in the positives Δ absorbance range
are species which are generated by rhenium excitation. The negative Δ absorbances or bleaches
mirror the absorbance of the ground state, thus the return of the bleach to baseline corresponds to the
return of rhenium to the ground state. The three species generated, designated in figure 3.15, are the
charge transfer state or also known as the MLCT state (CT), the charge separated state also
considered the tryptophan radical cation and reduced rhenium (CS), and lastly the redox product also
1900 1950 2000 2050 2100
-0.004
-0.003
-0.002
-0.001
0.000
0.001
0.002CS(2)
CS(1)CT(2)
CT(3)
A
bsorb
ance
Wavenumber / cm-1
CT(1)
1900 1950 2000 2050 2100
-0.004
-0.003
-0.002
-0.001
0.000
0.001
0.002
0.003
0.004 CT(2)
CS/RP(2)
CS/RP(2) CT(3)
A
bso
rba
nce
Wavenumber / cm-1
CT(1)
Figure 3.15: Nanosecond TRIR spectra of ~1.1 mM Re(H126)W122-Cu2+ (left) and
Re(H126)W122-Cu1+ (right) measured in 50 mM KPi buffer in D2O (pD = 7.1) at selected time
delays between 1 ns and 50 s after ~0.7 ns, 355 nm laser pulse excitation. The spectra evolve in
the direction of the arrows.

43
considered as the reduced rhenium and the oxidized copper (RP). As some of these bands overlap and
shift depending on time, the time-dependences of the band areas (obtained from Gaussian analysis of
the spectra) were used for the kinetic fitting. The results are summarized in table 6.2.
3.4 Discussion
The initial idea in the development of this mutant was to obtain a hopping scheme where the
tryptophan to rhenium and the rhenium to copper distances were increased to check two factors: the
importance of the 4,7-dimethyl-1,10-phenanthroline and tryptophan interaction and to obtain a
hopping system with more than 100 fold difference between copper oxidation and decay rate. With
the first experiments performed by Crystal Shih in the presence of the reductant sodium dithionite,
copper oxidation was seen under 100 ns and decayed around 10 µs. This result was quite promising
as a potential hopping system. My role in working with the system was to verify rapid copper
Table 3.2: Summary of Time Resolved Infrared Spectroscopy
Species Rise Decay Max. Peak
Re(H126)W122 Cu2+
Charge Transfer (CT) instant 10 ns
115 ns, 900 ns (25%)
< fs
Charge Separated (CS) 5-6 ns 100 ns
> μs
20 ns
Bleach instant 10 ns
115 ns, 900 ns
100 ns, ~800 ns
< fs
Re(H126)W122 Cu1+
Charge Transfer (CT) instant 10 ns
> 500 ns (~30%)
< fs
Charge Separated (CS)
and
Redox Product (RP)
5-6 ns ~ 230 ns
~ 6 μs
60 ns
Bleach instant 10 ns
>500 ns
~ 230 ns, ~ 6 μs
< fs

44
oxidation and to determine to determine the mechanism in which the system generated oxidized
copper.
The initial experiments under the presence of sodium dithionite demonstrated what appeared
to be a hopping system in which the recombination, or back electron transfer step, was faster than
predicted based on the distance between copper and rhenium (see figure 3.3). The microsecond decay
was closer to the decay rate (back electron transfer) seen with Re(H124)W122. However, the
transient absorption signal generated for Cu2+
had two unique features that differed from the previous
hopping system: a bi-exponential decay also containing a very short lifetime and significantly lower
Cu2+
signals for comparative concentrations. The luminescence decay seen in figure 3.4 provided
little support for a fast copper oxidation, as the decay rate was dominated by quenching from
dithionite. With the data on hand, a general hypothesis was formed; the hopping scheme was between
two units in the dimer instead of a simple intra-molecular electron hopping scheme.
In order to probe the hypothesis that the hopping mechanism was inter-molecular due to a
dimer interface several experiments were performed. The first set of experiments was based on
concentration effects, as a dimer should display some equilibrium with the suspected monomer.
Using the protein under the presence of sodium dithionite, several concentrations were examined
using the NS-1 setup as well as steady-state fluorescence. While the NS-1 data are not shown, minor
differences in copper signal strength were noted, however, no significant concentration effects were
observed. However, the steady-state fluorescence seen in figure 3.9 indicated reduced rhenium
emission for the higher concentration of azurin. With this limited support for reduced copper, as well
as concentration dependence seen with the oxidized copper sample, further experiments were
performed by collaborators Lucie Sokolova and Antonin Vlcek. Also, a protein crystal structure was
determined to analyze protein-protein interactions and structural features that would support or
disprove the ability of a dimer interface to participate in a hopping system.

45
The crystal structure of Re(H126)W122 illustrates a unique interface between one unit cell
(in this case a single protein) and its neighboring cell at the rhenium label face. Unlike most Re-
labeled azurin crystals, the rhenium and its ligands do not interact with the rhenium label of the
neighboring protein. Instead, in order to bury the hydrophobic 4,7-dimethyl-1,10-phenanthroline
(dmp), Re(H126)W122 stacks the dmp ligand in a T-shaped π-interaction with the neighboring
tryptophan 122. Since the units mirror each other, the dimer interface (between two unit cells) stacks
dmpA--TrpB--TrpA--dmpB (see figure 3.12). Each of the dmp ligands has a weak aromatic interaction
with the neighboring tryptophan, similar to the stronger staggered π-stacking seen in the
Re(H124)W122 crystal. Also the two tryptophans are in a weak van der Waals interaction, indicated
by their distance from each other at 4 Å. The two tryptophans orient their faces in a coplanar fashion.
This orientation should be lining two positive quadrupole moments next to each other, a repulsive
interaction; however, the large aromatic system could be aligned in order to allow minimal π-overlap
thus providing the close distance. Between the T-shaped π-interaction, and the close van der Waals
distance, the dmp ligands and the tryptophans of the dimer should be strong enough to minimize
solvent within the joined interface.
The interface itself supports the preference for inter-molecular over intra-molecular electron
transfer. With the monomeric tryptophans separated from their own Re-label by the neighboring
tryptophan, the *Re is more likely to be quenched by the tryptophan with a strong interaction to the
dmp ligand. Also, the distance between monomeric Re(H126) and W122 is closer to 16 Å, a large
distance for a directed internal quenching scheme. Besides the luminescence quenching and TRIR
fast time scale data, the transient absorption data support a 6 μs time scale for the back electron
transfer. Unlike the intra-molecular distance between the Re and the copper of 25.6 Å, the inter-
molecular distance in the crystal structure between the Re of one unit and the copper of the other unit
in the dimer is around 14 Å. This distance, while closer than the intra-molecular metal to metal

46
distance in the Re(H124)W122 structure, would still theoretically predict a similar rate for the inter-
molecular back electron transfer across the interface.
It is also important to note that the crystal is in a thermodynamically stable conformation for
a low solvent content; in solution, the 14 Å distance between metals is more likely to vary over the
protein ensemble. Within the crystal, a second hydrophobic interaction is likely holding the rhenium
in a tighter orientation to the copper; this interaction is between the leucine at site 120 and the dmp.
Since leucine 120 is on the loop that wraps around the copper site, any movement or shift in its
position would lead to a shift in the copper position. Likewise if the dmp biases the hydrophobic
interaction in the crystal, the interaction will bend (or orient) the rhenium’s position more towards the
copper in the crystal structure. While many of the interactions in the crystal structure enlighten us
about the stability of the dimer and preference for inter-molecular electron transfer, the system is
dynamic in solution thus distances for cross interfaces will be within the range indicated by the
structure and not rigidly conformed to them.
Using a unique method of mass spectrometry, Lucy Sokolova was able to establish the
presence of “multi-mers” at various concentrations of protein. Utilizing Laser Induced Liquid Ion
Bead Desorption Mass Spectrometry (LILIBD-MS) she was able to qualitatively probe protein
interactions as they would be present in solution. In order to determine if Re(H126)W122 shows a
unique dimer formation particularly at lower protein concentrations, she obtained results for
unlabeled H126W122 mutants. She also studied rhenium labeled and unlabeled wild type azurin and
rhenium labeled and unlabeled H124W122 as a comparison to Re(H126)W122. Each protein sample
was analyzed at several concentrations in a variety of buffers and salts, beginning at millimolar levels
and diluting systematically to lower concentrations. While experiments on every protein other than
Re(H126)W122 began with millimolar levels, Re(H126)W122 aggregated to a insoluble mass at
extremely high concentrations (mM) and thus was analyzed at lower concentrations (see figure 3.14).

47
While comparing unlabeled and rhenium labeled protein in figures 3.13 and 3.14, the
technique demonstrates clear dimer presence at lower concentrations only for the rhenium labeled
protein. In another observation noted in the thorough azurin study5 is that the dimer present for
Re(H126)W122 had a lower mass to charge ratio than dimers of each of the other proteins. This
lower mass to charge ratio indicates a unique and large interface that expels or prohibits solvation.
This conclusion also is supported by the interface illustrated by protein X-ray crystallography.
With the support of mass spectrometry and protein crystallography for the presence of the
dimer with a unique interface, the time-resolved infrared spectroscopy, TRIR, provides kinetic data
on the (ultra)fast behavior of the excited rhenium species. Based on the data obtained by Antonin
Vlcek and Ana María Blanco-Rodríguez, strong support is present for an ultrafast electron transfer
reaction that happens around the order of ≤ 10 ns (see table 6.2). The TRIR examines the carbonyl
stretches of the rhenium 4,7-dimethyl-1,10-phenanthroline tricarbonyl. As the carbonyl group is
bonded to the rhenium through both σ and π-back bonding, the carbonyl stretches in the IR region are
very sensitive to the electronic character of the rhenium. Therefore the change in IR stretches can
identify species such as the CT state (or MLCT state), where the dmp ligand carries an extra electron
and the rhenium carries an extra positive charge, or the CS and RP states, where the dmp ligand still
carries an extra electron but the rhenium returns to its original charge.
According to the TRIR data located in table 6.2, the rhenium electronic states present also
indicate a rapid electron transfer most likely to a tryptophan and a microsecond back electron transfer
corresponding to a short rhenium to copper distance. When comparing the oxidized copper to the
reduced copper data, the biggest difference is that there is an increase of signal for the CS species,
due to its overlap with the RP signal (as both TRIR signals are generated only by the reduced
rhenium). Also, the CS species for the reduced copper is completely generated around 60 ns and
decays bi-exponentially with a shorter ~200 ns decay and a longer ~6 µs decay. While our NS-1
instrument cannot resolve the copper generation, bi-exponential decay from the TRIR data
48
corresponds well with the data obtained from both the copper 632 nm trace as well as the rhenium
500 nm trace (not shown). With the μs back electron transfer decay rates from both the TRIR data
and the early transient absorption data, the distances extrapolated from the crystal structure indicate
that the inter-molecular back electron transfer across the dimer interface is the most likely candidate
to account for the kinetic data.
Although the early NS-1 data with the reduced copper in the presence of sodium dithionite
demonstrate the kinetic principles affiliated with the dimer mechanism, at such low concentrations it
is clear that sodium dithionite is affecting the monomer/dimer equilibrium. Thus further transient
absorption and luminescence experiments were performed at low and high concentrations without the
presence of sodium dithionite. At low concentrations around 30 μM (see figures 3.5 and 3.6), there is
no significant luminescence quenching and no significant Cu2+
generation. This result supports the
dominance of a monomer which is incapable of direct photoinduced electron transfer or of a hopping
mechanism. At higher concentrations, 100 and 200 µM (see inset in figures 3.7 and 3.8), a
biexponential luminescence decay indicates a small population of fast rhenium excited state
undergoing quenching with an approximately 50 ns lifetime. Also at both of the higher
concentrations, a clear Cu2+
signal is present with decay lifetimes around 4 - 6 µs (see figures 3.7-
3.8). With the 50 ns luminescence quenching and the 4 – 6 µs copper signal decay, the NS-1 data
without sodium dithionite mirror the results seen for the CS state and the TRIR data.
3.5 Conclusions
Re(H126)W122 undergoes fast initial electron transfer resembling multi-step kinetics with
back electron transfer with a rate disproportionately faster than a predicted rate based on intra-
molecular metal-metal distance. A basic model is proposed, which contains a tight dimer interface
with reduced metal-metal distance. Within this model, the initial electron transfer occurs through
inter-molecular hopping and the back electron transfer occurs through inter-molecular single step

49
tunneling. With the evidence presented by the kinetic traces (NS-1 and TRIR data), the protein
structure, and solution MS data, a dimer is a viable model for inter-molecular electron transfer
hopping. As it is, Re(H126)W122 represents one of the first engineered dimer “hopping” systems.

50
REFERENCES
(1) Shih, C.; Museth, A. K.; Abrahamsson, M.; Blanco-Rodriguez, A. M.; Di Bilio, A. J.;
Sudhamsu, J.; Crane, B. R.; Ronayne, K. L.; Towrie, M.; Vlcek, A.; Richards, J. H.;
Winkler, J. R.; Gray, H. B. Science 2008, 320, 1760–1762.
(2) Crane, B. R.; Di Bilio, A. J.; Winkler, J. R.; Gray, H. B. J. Am. Chem. Soc. 2001, 123,
11623–31.
(3) Tezcan, F. A.; Crane, B. R.; Winkler, J. R.; Gray, H. B. Proc. Natl. Acad. Sci. USA 2001,
98, 5002–5006.
(4) Morgner, N.; Barth, H.-D.; Brutschy, B. Aust. J. Chem. 2006, 59, 109.
(5) Sokolová, L.; Williamson, H.; Sýkora, J.; Hof, M.; Gray, H. B.; Brutschy, B.; Vlcek, A.
J. Phys. Chem., B 2011, 115, 4790–800.
51
Chapter 4
Intra-molecular Hopping with Two Intermediates
4.1 Abstract
By developing a simulated tryptophan wire, a new intra-molecular hopping system has been
engineered. The mutant Re(H126)W124W122 utilizes three electron transfer steps to oxidize copper
from the rhenium excited state. This chapter presents the experimental data used to analyze the
kinetics of electron transfer. Also provided are experiments that probe the environment of the
tryptophans and the structure of the metal-modified protein.
4.2 Improving Intra-molecular Hopping with Tryptophan Wires
With the success of engineering both a short distance intra-molecular hopping system,
Re(H124)W122, and a short distance inter-molecular hopping system, Re(H126)W122, the next step
was to engineer a long range intra-molecular hopping system. Each successful model system provides
critical information on how to develop hopping mechanisms. Re(H124)W122 demonstrated that a
solvent exposed tryptophan was capable of creating a tryptophan radical cation in a kinetically driven
hopping system. Re(H126)W122 solidified the importance of the communication between the Re-
label and the tryptophan intermediate for direct photo-oxidation. The next step for generating a long
range hopping system was to combine the two previous designs and modifying them to optimize the
protein model.

52
In order to separate the dimer interface and to provide a close communication between the
rhenium label and tryptophan, an additional tryptophan was inserted into the beta sheet. The new
mutant was designated Re(H126)W124W122. By placing a tryptophan (W124) adjacent to the Re,
we were more likely to see efficient quenching of the Re excited state. This hypothesis was supported
by the original hopping system Re(H124)W122, the dimer mentioned in chapter 3, and model
complexes tested by Antonin Vlcek1 of 1,10-phenanthroline tricarbonyl rhenium with a coordinated
pyridine or imidazole attached to a redox-active amino acid (such as tryptophan). Even if placing a
tryptophan at position 124 alone assured an increase of efficient *Re quenching, we had only seen
effective copper oxidation in any of the engineered hopping models when a tryptophan had been
placed at position 122. In order to keep the strong coupling to copper, maintain the efficiency of *Re
quenching, and still achieve a slow charge recombination, two tryptophan residues were combined as
Figure 4.1: Scheme for a Re(H126)W124W122
photo-excited hopping mechanism utilizing two
tryptophans as intermediates.
Re+---W---W---Cu+
*Re+---W---W---Cu+
Re0---W +---W---Cu+
Re0---W---W +---Cu+
Re0---W---W---Cu2+
hν

53
a hopping “wire.” This engineered protein would then be similar to biological systems such as DNA
photolyases2–5
(Figure 4.2).
4.3 Experimental Results
Transient Absorption and Luminescence
Instrument setup and sample preparation were conducted according to methods described in
Chapter 2.3. Re(H126)W124W122 was stored in concentrations 100-200 μM in 20 mM NaPi pH 7.2
or 25 mM NaOAc pH 4.5. The mutant was easy to manage and was capable of being stored stably
under various conditions. The concentrations of protein samples prepared for laser studies were
varied from 20 μM to 35 μM. Initial studies were performed in the presence of dithionite due to initial
difficulty in oxygen removal, though later studies were performed without the presence of dithionite.
The samples gave strong Cu+2
transient absorption signals, indicating high quantum yields for the
reaction.
Figure 4.2: Escherichia coli CPD photolyase protein structure. The image
shows the electrons hopping through the three tryptophans in the protein.2
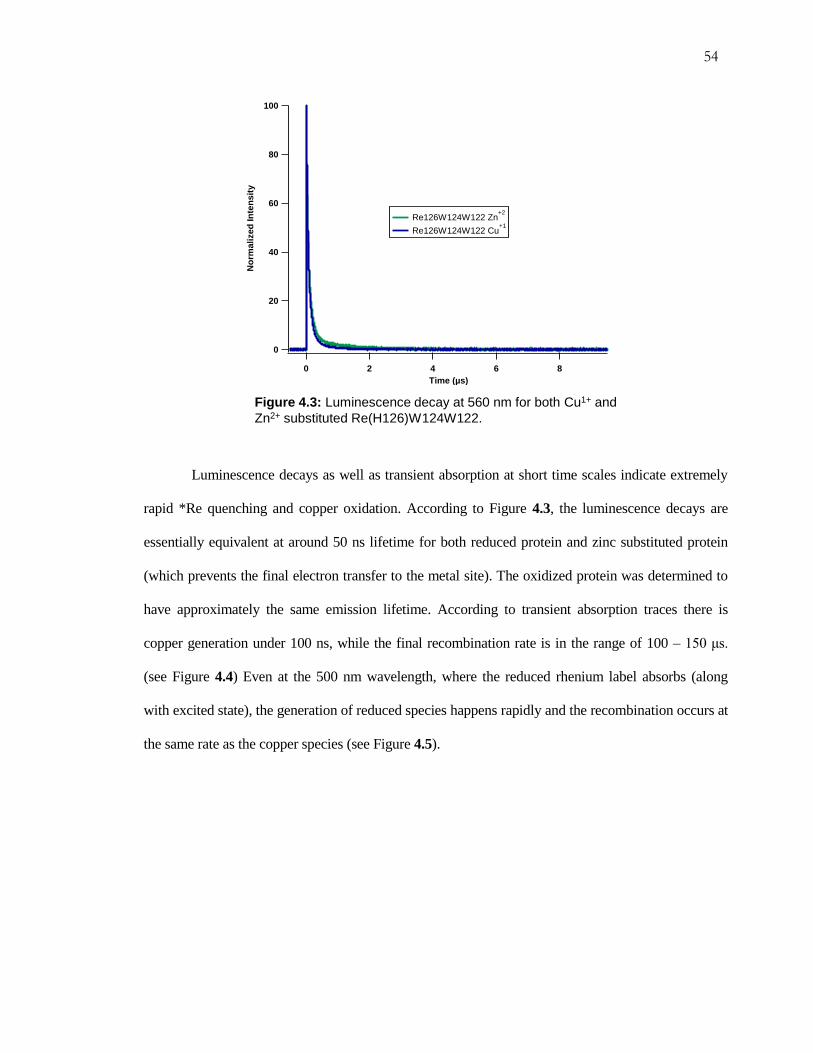
54
Luminescence decays as well as transient absorption at short time scales indicate extremely
rapid *Re quenching and copper oxidation. According to Figure 4.3, the luminescence decays are
essentially equivalent at around 50 ns lifetime for both reduced protein and zinc substituted protein
(which prevents the final electron transfer to the metal site). The oxidized protein was determined to
have approximately the same emission lifetime. According to transient absorption traces there is
copper generation under 100 ns, while the final recombination rate is in the range of 100 – 150 μs.
(see Figure 4.4) Even at the 500 nm wavelength, where the reduced rhenium label absorbs (along
with excited state), the generation of reduced species happens rapidly and the recombination occurs at
the same rate as the copper species (see Figure 4.5).
100
80
60
40
20
0
No
rma
lize
d I
nte
ns
ity
86420
Time (µs)
Re126W124W122 Zn+2
Re126W124W122 Cu+1
Figure 4.3: Luminescence decay at 560 nm for both Cu1+ and
Zn2+ substituted Re(H126)W124W122.

55
5
4
3
2
1
0
m
OD
1.51.00.50.0
Time (ms)
15
10
5
0
-5
m
OD
1.51.00.50.0
Time (µs)
Re126W124W122 Cu+1
@ 633 nm
(decay)= 120 µs
Figure 4.4: Transient absorption decay at 633 nm for
Re(H126)W124W122 azurin(Cu1+) (contains sodium
dithionite). Inset contains the trace for earlier time scales.
6
5
4
3
2
1
0
m
OD
1.51.00.50.0
Time (ms)
15
10
5
0
m
OD
1.51.00.50.0
Time (µs)
Re126W124W122 Cu+1
@ 500 nm
(decay)=120 µs
Figure 4.5: Transient absorption decay at 500 nm for
Re(H126)W124W122 azurin(Cu1+) (contains sodium
dithionite). Inset contains the trace for earlier time scales.

56
Temperature-Dependent Steady State Fluorescence
Steady state fluorescence measurements were performed as described in Chapter 3.3, except
with the addition of a temperature controlled system. The buffer was also changed from 25 mM KPi
pH 7.2 buffer to 25 mM KPi pH 7.2 in 30% glycerol as a cryoprotectant. The cuvette was warmed or
cooled by a 50:50 water:glycol mixture flowed through the cuvette holder of the Fluorolog®-3. The
temperature was reduced from an initial 25 °C to a final -15 °C. This experiment was first performed
on the initial hopping system, Re(H124)W122, as reported by Shih.6 Since the reduction potential of
the tryptophan is reported to be close to the excited state reduction potential of the rhenium label and
both species likely have similar reorganization energies, the emission quenching reaction, if
dominated by electron transfer, should be temperature dependent. The experiment performed on the
Re(H124)W122 system was duplicated and also performed using the new double tryptophan mutant,
Re(H126)W124W122.
0.7
0.6
0.5
0.4
0.3
0.2
0.1
Inte
sit
y (
x10
6)
700650600550500450
nm
Re124W122 -15oC
566.9 nm
Re124W122 25oC
568.3 nm
Figure 4.6: Steady state rhenium emission at room and
reduced temperature for Re(H124)W122 azurin(Cu1+).

57
Steady State Fluorescence: Tryptophan
For the steady state fluorescence experiments, the samples were prepared by the same
method used for the temperature-dependent steady state experiments as well as in a buffer without the
cryoprotectant. The spectro-fluorometer setup used for the experiments was a Fluorolog®-3. For
tryptophan emission, the excitation wavelength was set to 280 nm. The emission spectra were
recorded in the range of 290 – 450 nm. A 280 nm broad band filter was placed in the sample cavity
before the emission optics to block any second harmonics from the excitation beam. For the
experiments with unlabeled azurin the monochromator slits were both set to 2 nm. The signal was
averaged over 1 sec and recorded for each 1 nm of the emission range. Steady state fluorescence was
recorded at 25 °C for both glycerol and regular buffer and at -19 °C in glycerol buffer. The single
tryptophan protein samples were approximately 20 µM and the double tryptophan protein sample was
approximately 10 µM.
1.6
1.4
1.2
1.0
0.8
0.6
0.4
0.2
Inte
sit
y (
x10
6)
700650600550500450
nm
Re126W124W122 -15oC
556.4 nm
Re126W124W122 25oC
557.8 nm
Figure 4.7: Steady state rhenium emission at room and
reduced temperature for Re(H124)W124W122 azurin(Cu1+) .

58
Figure 4.8: Steady state tryptophan emission at room in 25 mM KPi
pH 7.2 with and without 30% glycerol and reduced temperature for
H124W122 azurin(Cu2+).
Figure 4.9: Steady state tryptophan emission at room in 25 mM KPi
pH 7.2 with and without 30% glycerol and reduced temperature for
H126W122 azurin(Cu2+).

59
Protein X-ray Crystallography
Crystals of Re(H126)W124W122 were grown by a variation of previously described7,8
crystallization conditions. Purified Re(H126)W124W122 was concentrated to 1.2 mM (~ 8 mg/mL)
in a solution of 40 mM imidazole buffer pH 7.2 + 2 mM NaCl (designated as the protein solution).
The crystals were grown by sitting drop with a well solution of 100 mM imidazole, 100 mM LiNO3,
6.25 mM CuCl2, and 25 – 30% polyethylene glycol (PEG) MW 4000. The pH range setup up
spanned 7.0 – 8.0 using a 100 mM imidazole buffer adjusted using HCl. The sitting drops were
prepared with 2 μL of protein solution and 2 μL of well solution while the well was filled with 250
μL of well solution in a matrix of 4 x 6 (7.0 – 8.0 pH x 25 – 30% PEG). After 2 weeks a large
branched prism shaped crystal was isolated and cryogenically treated with the original well solution
(28% PEG, pH 7.6) with 35% glycerol. Diffraction collection and data workup were identical to the
description in Chapter 3.3.
Figure 4.10: Steady state tryptophan emission at room in 25 mM KPi
pH 7.2 with and without 30% glycerol and reduced temperature for
H126W124W122 azurin(Cu2+).

60
Figure 4.11: Crystal structure of the mutant
All Phe Re(dmp)(CO)3(H126)W124W122
Pseudomonas aeruginosa azurin
22.9 Å
4.0 Å
4.0 Å
12.7 Å
Figure 4.12: Crystal structure of Re(H126)W124W122. The
Met121 ligating beta strand with the Re metal-label at His126,
Trp124 and 122, and the Cu site with the distances indicated.

61
Time-Resolved Infrared Spectroscopy
Samples were provided at 1.4 mM concentration in both 50 mM NaPi pD 7.2 and pH 7.2,
then were diluted by approximately half in order to make working with the sample easier. Just as
described in chapter 3, the Cu+2
was prepared with the diluted concentration and the Cu+1
was
reduced by dithionite. The reductant is still in the protein mixture for the Cu+1
. In order to assess the
sample’s durability during the experiments, FTIR spectra were measured before and after the
experiment.
Table 4.1: Data collection statistics
Space group C 2 2 21
Unit-cell parameters
a (Å) 53.07
b (Å) 221.58
c (Å) 89.99
Proteins in unit cell 4
Resolution Range 35 -1.90 (1.95-1.90)
No. of Unique Reflections 38368
Free R value 0.23316
Completeness (%) 95.23

62
4.4 Discussion
The mutant Re(H126)W124W122 was developed in order to engineer a dominant intra-
molecular electron transfer hopping pathway while increasing the distance from the rhenium to the
Figure 4.13: Nanosecond TRIR spectra of ~1.46 mM Re(H126)W124W122-Cu2+ (left) and
Re(H126)W124W122-Cu1+ (right) measured in 50 mM NaPi buffer in D2O (pD = 7.1) at selected
time delays between 2 ns and 50 s after ~0.8 ns, 355 nm laser pulse excitation. The spectra
evolve in the direction of the arrows. The experimental points are separated by ~ 2.2 cm–1.
1850 1900 1950 2000 2050 2100-0.0015
-0.0010
-0.0005
0.0000
0.0005
0.0010
0.0015
A
bso
rba
nce
Wavenumber / cm-1
CS
CS
CTCT
1850 1900 1950 2000 2050 2100
-0.0012
-0.0008
-0.0004
0.0000
0.0004
0.0008
A
bso
rba
nce
Wavenumber / cm-1
CS
CS
CT
CTCT
Table 4.2: Summary of Time Resolved Infrared Spectroscopy
Species Rise Decay
Re(H126)W122 Cu2+
Charge Transfer (CT) Pulse length <10 ns
250 ns
Charge Separated (CS) Pulse length
< 10 ns
250 ns
Persistent (20%)
Re(H126)W122 Cu1+
Charge Transfer (CT) Pulse length <10 ns
> 500 ns (~30%)
Charge Separated (CS)
and
Redox Product (RP)
Pulse length
< 10 ns
< 10 ns
~ 5 μs (50%)
63
copper as far as 23 Å. The goal of the hopping system is to rapidly create a large charge separation
that recombines at a significantly longer time. In order to test experimentally if the mutant is an
efficient hopping system, the same initial test methods were used as reported in chapter 3 and
previously for Re(H124)W122.9
According to luminescence decays, Re(H126)W124W122 undergoes fast electron transfer to
generate oxidized copper followed by intra-molecular recombination (back electron transfer). The
luminescence decay for the reduced copper, the oxidize copper, and the substituted zinc mutants all
displayed exponential decays of approximately 50 ns (see figure 4.3). The zinc substituted mutant is
used as a control because it is inert to electron transfer. With the zinc Re(H126)W124W122, any
quenching of the rhenium luminescence would only be due to efficient quenching by the neighboring
tryptophan 124. Thus, with both the zinc and oxidized copper samples being quenched to 50 ns, the
electron transfer to tryptophan 124 is likely the dominant mechanism of emission quenching. Indeed,
this assumption was supported by the TRIR spectra, which shows ultrafast formation of the reduced
rhenium label.
With the luminescence supporting rapid electron transfer, examining the transient absorption
decays for the Cu+1
species allows us to determine if there is copper oxidation along with tryptophan
oxidation. With the traces at 632 nm seen in figure 4.4, the data indicate copper oxidation faster than
100 ns and extraordinarily slow Cu2+
decay at approximately 120 µs. The Cu2+
decay kinetics were
averaged over multiple repeats and data reproduced by postdoctoral fellow, Kana Takametsu, always
ranged between 100 – 250 µs. When examining transient absorption due to reduced rhenium at 500
nm, the same two kinetic features observed in the Cu2+
signal at 632 nm were observed as well. In
figure 4.5, the inset shows rapid signal rise under 100 ns and the trace shows the rhenium reduced
state decaying with a 120 µs lifetime. The data for figure 4.5 were taken with the same sample that
produced figure 4.4. Both of these transient absorption traces support the scheme of multistep
electron transfer as seen in figure 4.1 where a multi-step hole transfer to the reduced copper goes

64
through both tryptophans and has a slow back electron transfer from the oxidized copper to the
reduced rhenium.
Since tryptophan has a similar redox potential to the excited state rhenium, but both are
substantially different than the reorganization energy, the reaction should be temperature dependent.
Just as the temperature dependent steady-state fluorescence was recorded for the Re(H124)W1226,
the same parameters were used for Re(H126)W124W122. Figure 4.6 shows the rhenium-based
temperature dependence for the repeated experiment of the Re(H124)W122 while figure 4.7 is the
same experiment performed on the double tryptophan mutant. The results demonstrate that both
reactions show temperature dependent rhenium emission quenching, indicating that tryptophan 124
has a similar redox potential to tryptophan 122 as well as the rhenium excited state. As both
tryptophans have similar potentials, the environment of the tryptophans was of interest and was
probed by tryptophan emission as well as structural characterization.
Within proteins, tryptophan has the strongest fluorescence of any amino acid and its emission
spectrum is highly environmentally dependent. Since the excited state of tryptophan has a large
dipole moment, polar environments such as water or hydrogen bond donors can stabilize the excited
state. The stabilization will red shift the emission maximum of tryptophan and often broadens the
peak. The environment around the native tryptophan 48 in azurin is one of the most hydrophobic in
any protein and thus the W48 emission maximum at 309 nm serves as a benchmark.10–13
On the other
hand, a small molecule containing a tryptophan with a simulated small peptide bond (referred to as
NATA) is considered the benchmark for a completely hydrophilic tryptophan with a broad emission
spectrum peaking at 454 nm. By examining unlabeled mutants, we avoid any interference from the
Re-label. The experiments probed not only the tryptophan emission for the double tryptophan mutant
but also the mutants H126W122 and the original hopping mutant H124W122. The spectra obtained at
room temperature in a completely hydrophilic buffer, partially hydrophilic buffer, and at low
temperature in partially hydrophilic buffer generally produce nearly the same emission maxima for

65
the three mutants. Since the intensity for the double tryptophan was approximately equivalent to the
intensity for either of the other two single tryptophan mutants at half the concentration, it can be
assumed that W124 and W122 share similar emission features, thus indicating that they are
positioned in similar electronic environments.
The crystal structure of Re(H126)W124W122 shows several interesting features concerning
the relative positioning of the aromatic rings. As noted in the first successful hopping system,
Re(H124)W122, the tryptophan has a staggered π stacked interaction with the dimethyl
phenanthroline ligand. With the dimer, Re(H126)W122, the inter-molecular interaction between the
tryptophan and dimethyl phenanthroline is a T-shaped π-interaction that, while weaker than the
stacked interaction, is still stronger than typical van der Waals forces and even stronger than loose
hydrogen bonds. In the case of the double mutant not only is the dimethyl phenanthroline T-shaped π-
bonding with tryptophan 124, but the two tryptophans share the same T-shaped π-interaction. Indeed
even the nearest edge distance between the three aromatic ring molecules is virtually the same,
approximately 4 Å. Structurally, this level of interaction indicates an electronically well-coupled
system. Thus the structure supports the presence of an intra-molecular multistep electron transfer
pathway through two tryptophans.
The other notable feature of the crystal structure is the distance between the rhenium and the
copper atoms. The distance, 23 Å, is shorter than the copper to rhenium distance in the
Re(H126)W122 mutant (chapter 3) which contains threonine at position 124. This effect is likely due
to a strong interaction of the dimethyl phenanthroline with the internal tryptophan 124 versus a
neighboring tryptophan at an interface. The interaction shifts the rhenium closer to the copper instead
of stabilizing the rhenium at a different, larger angle for the Re(H126)W122. Despite any
discrepancies in distance, the 23 Å copper to rhenium distance predicts that any intra-molecular
electron transfer should be on the order of hundreds of microseconds. This estimate corresponds well
with the transient absorption data collected on the double tryptophan mutant.
66
4.5 Conclusions
By utilizing two tryptophans, Re(H126)W124W122 contains a multi-“hop” electron transfer
pathway. This unique hopping mutant has nearly 10,000 fold rate difference between the forward
copper oxidation and the back electron recombination. Through kinetic rates (NS-1 and TRIR data)
the system resembles other well characterized intra-molecular hopping systems. The protein structure
of the mutant Re(H126)W124W122 demonstrates how important the interaction between the
photolabel and amino acid intermediate is on the ability to hop directly from a photo-excited state. As
a result, Re(H126)W124W122 is the first engineered photo-triggered hopping system with a
tryptophan wire.
67
REFERENCES
(1) El Nahhas, A.; Consani, C.; Blanco-Rodríguez, A. M.; Lancaster, K. M.; Braem, O.;
Cannizzo, A.; Towrie, M.; Clark, I. P.; Zális, S.; Chergui, M.; Vlcek, A. Inorg. Chem.
2011, 50, 2932–43.
(2) Woiczikowski, P. B.; Steinbrecher, T.; Kubař, T.; Elstner, M. J. Phys. Chem., B 2011,
115, 9846–63.
(3) Brazard, J.; Usman, A.; Lacombat, F.; Ley, C.; Martin, M. M.; Plaza, P.; Mony, L.;
Heijde, M.; Zabulon, G.; Bowler, C. J. Am. Chem. Soc. 2010, 132, 4935–45.
(4) Byrdin, M.; Sartor, V.; Eker, A. P. M.; Vos, M. H.; Aubert, C.; Brettel, K.; Mathis, P.
Biochim. Biophys. Acta 2004, 1655, 64–70.
(5) Kavakli, I. H.; Sancar, A.; Hill, C.; Carolina, N. Biochemistry 2004, 43, 15103–15109.
(6) Shih, C. Electron Tunneling and Hopping Through Proteins, Thesis, California Institute
of Technology, 2008.
(7) Crane, B. R.; Di Bilio, A. J.; Winkler, J. R.; Gray, H. B. J. Am. Chem. Soc. 2001, 123,
11623–31.
(8) Tezcan, F. A.; Crane, B. R.; Winkler, J. R.; Gray, H. B. Proc. Natl. Acad. Sci. USA 2001,
98, 5002–5006.
(9) Shih, C.; Museth, A. K.; Abrahamsson, M.; Blanco-Rodriguez, A. M.; Di Bilio, A. J.;
Sudhamsu, J.; Crane, B. R.; Ronayne, K. L.; Towrie, M.; Vlcek, A.; Richards, J. H.;
Winkler, J. R.; Gray, H. B. Science 2008, 320, 1760–1762.

68
(10) Callis, P. Understanding the Variable Quenching of Tryptophan Fluorescence in
Proteins : Modulation of Electron Transfer rates by electrostatics; 2005; p. 51.
(11) Dashnau, J. L.; Zelent, B.; Vanderkooi, J. M. Biophys. J. 2005, 114, 71–83.
(12) Vivian, J. T.; Callis, P. R. Biophys. J. 2001, 80, 2093–109.
(13) Alston, R. W.; Lasagna, M.; Grimsley, G. R.; Scholtz, J. M.; Reinhart, G. D.; Pace, C. N.
Biophys. J. 2008, 94, 2280–2287.

69
Chapter 5
Double Tryptophan Mutants in a Hydrophobic Environment
5.1 Abstract
In this chapter, two double tryptophan mutants are engineered. Both mutants contained
hydrophobic tryptophans within the center of azurin’s beta barrel. The desired goal was to use
multiple electron steps to increase the rate of electron transfer before the loss of the proton present in
the initial oxidized tryptophan intermediate. Since this proton loss rate can be increased due to
hydrophobic environments, only a well-coupled, rapid electron transfer could prevent a proton loss.
5.2 Attempting a Hydrophobic Hopping System with Tryptophan
With the success of multiple engineered hopping systems using tryptophan, the next
experimental attempts were to access a hydrophobic tryptophan hop. With exposure to solvent
dipoles and protein charged residues, a radical cation (formed by a single electron oxidation) can be
stabilized long enough for an electron from the donor metal to quench the intermediate species and
generate a more stable state. However, when a charged radical is exposed to a very hydrophobic
environment, the environment provides a strong driving force to remove the charge and stabilize a
neutral radical. The method in which both tryptophan and tyrosine residues remove the positive
charge is to deprotonate a strongly polarized bond (for tryptophan N-H and tyrosine O-H). While the
neutral radical is still capable of accepting an electron, the lower redox potentials and the resulting
negative charge following the reduction make using an aromatic residue in strongly hydrophobic
environments difficult when engineering a hopping system.

70
The three successful hopping systems1 had tryptophans essentially exposed on the surface of
the protein and each acceptor/donor pair was well coupled. These factors allowed an intermediate
such as a tryptophan radical cation to persist for the very short time before the Cu+1
quenched the
charged intermediate. In these cases, the kinetics strongly favored a rapid electron transfer more than
the slower deprotonation step. Biological systems often favor kinetically driven hops or a proton
coupled electron transfer (PCET)2–4
in order to prevent a deprotonation step acting as a
thermodynamic sink. In order to engineer a hydrophobic tryptophan hopping system in azurin, two
different double tryptophan mutants were employed in hopes of favoring faster electron transfer and
increase the inherent coupling within the system.
This chapter outlines two attempts at using two tryptophan residues in the hydrophobic core
of azurin’s beta barrel. The first described mutant, Re(H83)W48W110, is a variation on the wild type
azurin made by replacing the native tyrosines with phenylalanine and phenylalanine 110 with a
tryptophan. The second investigated mutant, Re(H107)W108W110, is a combination of two single
tryptophan mutants by Jeremiah Miller previously studied in the Gray group,5,6
who was able to
detect tryptophan neutral radicals. For the first mutant, Re(H83)W48W110, previous studies on a
F110S substituted azurin indicated that the native tryptophan 48 was exposed to a more hydrophilic
environment according to red shifts of the tryptophan fluorescence.7,8
The results could be due to one
of two factors: a hydrogen bond between serine 110 and tryptophan 48 or a widening in the
hydrophobic pocket exposing W48 to external solvent. Either of these results would lead to an
increase of stability of a tryptophan 48 radical cation. For the second mutant, Re(H107)W108W110,
the desired results would be that the tryptophan at 108 would be able to bridge the distance between
the Re(H107) and tryptophan 110. Increased coupling between each redox site (metal or Trp) would
allow a multi-step electron transfer that would be more rapid than the proton loss at either site. A fast
multi-step electron transfer would then be capable of oxidizing copper.

71
5.3 Experimental Results
Transient Absorption and Luminescence
Instrument setup and sample preparation were conducted according to methods described in
Chapter 2.3. Re(H83)W48W110, Re(H83)W48 (wild type azurin), and Re(H107)W108W110 were
stored in concentrations 100 – 200 μM in 20 mM NaPi pH 7.2 or 25 mM NaOAc pH 4.5. The
mutants and wild type were easy to manage and were capable of being stored stably under various
conditions. The concentrations of protein samples prepared for laser studies were varied from 20 to
35 μM. Re(H83)W48W110 was studied as both the oxidized and reduced protein (with sodium
dithionite), while the labeled wild type protein was also tested as a reduced protein with 10 mM
oxidative quencher, ruthenium (III) hexaammine. The results of the wild type protein can be directly
compared to previous experimental results done by the Gray group.9,10
Re(H107)W108W110 was
tested as oxidized protein, reduced protein (with and without sodium dithionite), and reduced protein
with 10 mM oxidative quencher, ruthenium hexaammine. The results with sodium dithionite were
inconsistent, thus the data reported in this thesis were for experiments with no sodium dithionite.
100
80
60
40
20
0
No
rma
lize
d I
nte
ns
ity
86420
Time (µs)
Re83W48W110 Cu+1
tau = 500 ns
Re83W48W110 Cu+2
tau1 = 50 ns
tau2 = 500 ns
Figure 5.1: Luminescence decay at 560 nm for both Cu2+ and
Cu1+ Re(H83)W48W110.
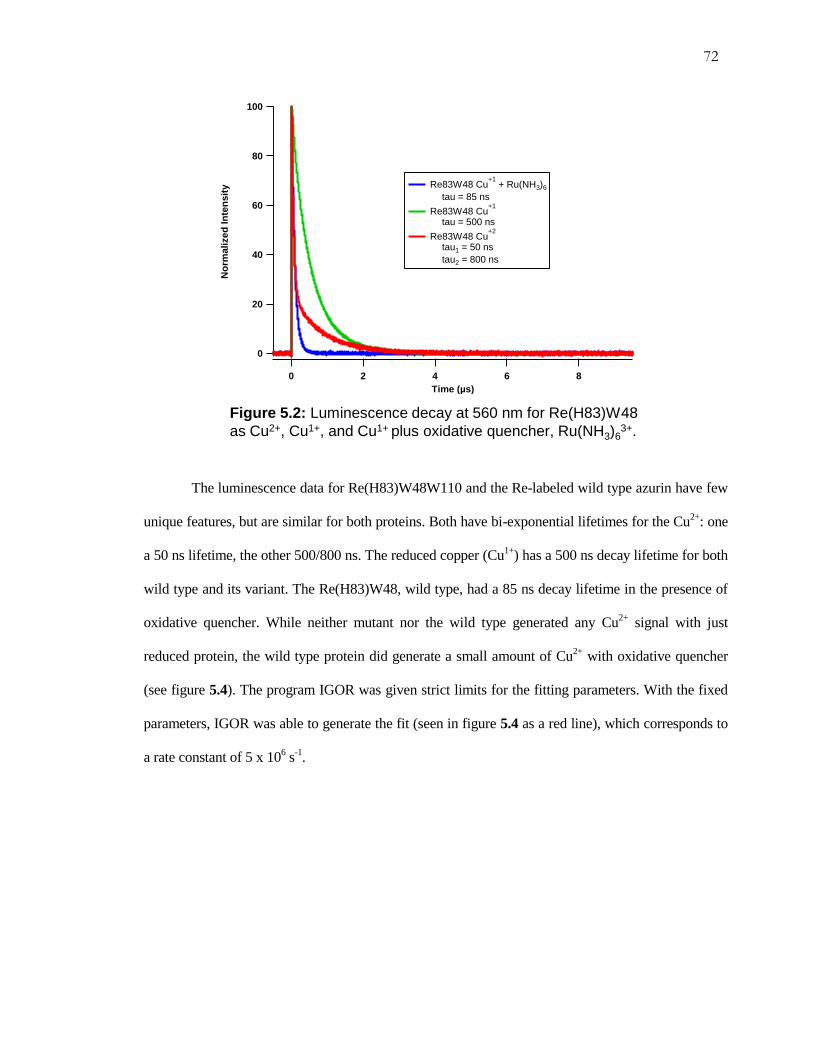
72
The luminescence data for Re(H83)W48W110 and the Re-labeled wild type azurin have few
unique features, but are similar for both proteins. Both have bi-exponential lifetimes for the Cu2+
: one
a 50 ns lifetime, the other 500/800 ns. The reduced copper (Cu1+
) has a 500 ns decay lifetime for both
wild type and its variant. The Re(H83)W48, wild type, had a 85 ns decay lifetime in the presence of
oxidative quencher. While neither mutant nor the wild type generated any Cu2+
signal with just
reduced protein, the wild type protein did generate a small amount of Cu2+
with oxidative quencher
(see figure 5.4). The program IGOR was given strict limits for the fitting parameters. With the fixed
parameters, IGOR was able to generate the fit (seen in figure 5.4 as a red line), which corresponds to
a rate constant of 5 x 10⁶ s
-1.
100
80
60
40
20
0
No
rma
lize
d I
nte
ns
ity
86420
Time (µs)
Re83W48 Cu+1
+ Ru(NH3)6
tau = 85 ns
Re83W48 Cu+1
tau = 500 ns
Re83W48 Cu+2
tau1 = 50 ns
tau2 = 800 ns
Figure 5.2: Luminescence decay at 560 nm for Re(H83)W48
as Cu2+, Cu1+, and Cu1+ plus oxidative quencher, Ru(NH3)63+.

73
The luminescence decay for Re(H107)W108W110 is bi-exponential for both oxidized and
reduced proteins and mono-exponential for the reduced protein in the presence of the oxidative
quencher. The lifetimes with percentage amplitudes for the oxidized species are 340 ns (37%) and
2.5
2.0
1.5
1.0
0.5
0.0
m
OD
86420
Time (ms)
Re83W48W110 Cu+1
at 633nm
Re83W48W110 Cu+2
at 633nm
Figure 5.3: Transient absorption trace at 633 nm for both
Cu2+ and Cu1+ Re(H83)W48W110.
-6
-4
-2
0
2
4
6
m
OD
86420
Time (µs)
Figure 5.4: Transient absorption trace at 633 nm for
Re(H83)W48 Cu1+ with oxidative quencher, Ru(NH3)63+.

74
130 ns (63%), while 460 ns (60%) and 160 ns (40%) for the reduced species. Finally, the exponential
decay lifetime of the reduced protein in the presence of 10 mM ruthenium (III) hexaammine
oxidative quencher is 80 ns. Since no significant transient absorption signal was recorded for the
reduced species on its own, the oxidative quencher was added and the transient absorption analyzed
(see figure 5.6). The signal indicates formation of a persistent species, but not any significant Cu2+
growth.
100
80
60
40
20
0
No
rma
lize
d I
nte
ns
ity
86420
Time (µs)
Re107W108W110 Cu+1
Ru(NH3)6
Re107W108W110 Cu+1
Re107W108W110 Cu+2
Figure 5.5: Luminescence decay at 560 nm for
Re(H107)W108W110 as Cu2+, Cu1+, and Cu1+ plus oxidative
quencher, Ru(NH3)63+.

75
Protein X-ray Crystallography: Re(H107)W108W110
Crystals of Re(H07)W108W110 were grown by a variation on previously described
crystallization conditions.9,11
Purified Re(H107)W108W110 was concentrated to 750 μM (~
5mg/mL) in a solution of 40 mM imidazole buffer pH 7.2 + 2 mM NaCl (designated as the protein
solution). The crystals were grown by sitting drop with a well solution of 100 mM imidazole, 100
mM LiNO3, 6.25 mM CuCl2, and 28 – 31.5% polyethylene glycol (PEG) MW 4000. The pH range
setup up spanned 7.0 – 8.0 using the 100 mM imidazole buffer adjusted using HCl. The sitting drops
were prepared with 2 μL of protein solution and 2 μL of well solution while the well was filled with
250 μL of well solution in a matrix of 4 x 6 (7.0 – 8.0 pH x 28 – 31.5% PEG). After 2 days a large
prism shaped crystal was isolated and cryogenically treated with the original well solution (31%
PEG, pH 7.4) with 35% glycerol. Diffraction collection and data workup were identical to the
description in Chapter 3.3.
1.5
1.0
0.5
0.0
-0.5
-1.0
m
OD
86420
Time (ms)
Re107W108W110 Cu+1
+ Ru(NH3)6 at 480 nm
Re107W108W110 Cu+1
+ Ru(NH3)6 at 510 nm
Re107W108W110 Cu+1
+ Ru(NH3)6 at 633 nm
Re107W108W110 Cu+1
+ Ru(NH3)6 at 660 nm
Figure 5.6: Transient absorption trace at several wavelengths
for Re(H107)W108W110 Cu1+ with oxidative quencher,
Ru(NH3)63+.
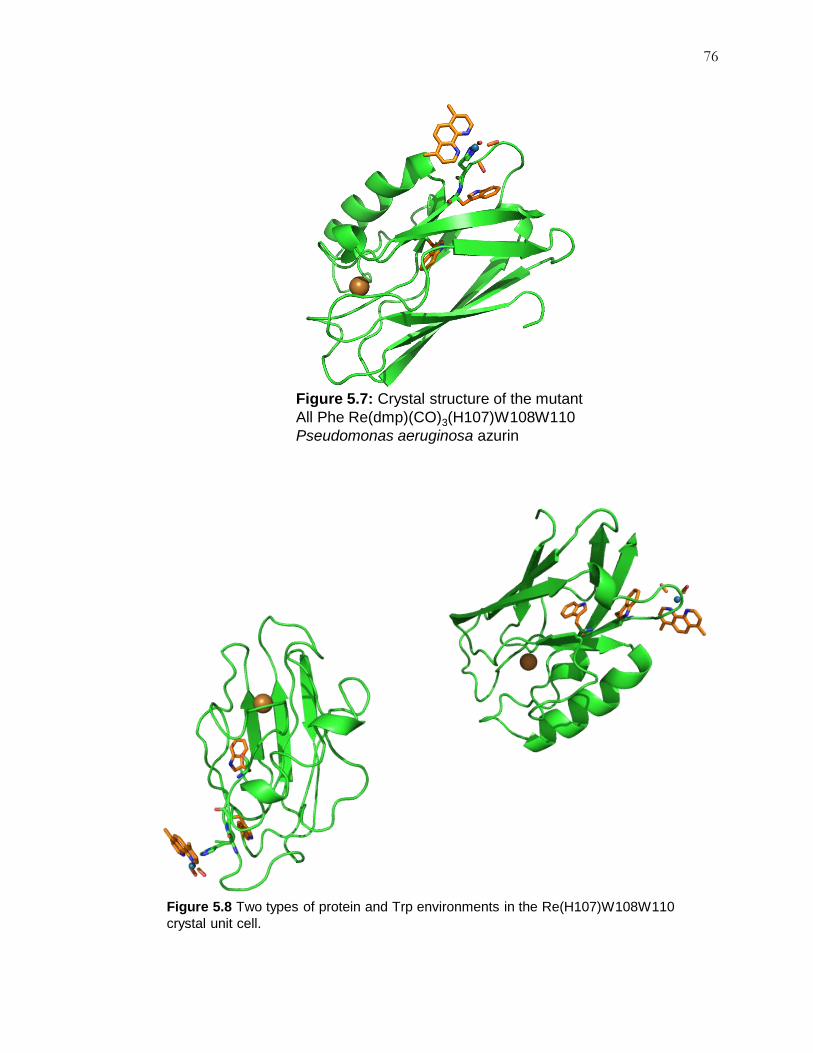
76
Figure 5.7: Crystal structure of the mutant
All Phe Re(dmp)(CO)3(H107)W108W110
Pseudomonas aeruginosa azurin
Figure 5.8 Two types of protein and Trp environments in the Re(H107)W108W110
crystal unit cell.

77
5.4 Discussion
According to the results of the luminescence and transient absorption of the reduced
Re(H83)W48W110, there was no Cu2+
generation. To compare the unusual bi-exponential emission
decay observed for the oxidized sample (see figure 5.1), the same experiments were performed with
the wild type protein. Both the wild type and the mutant show bi-exponential decay with the faster
lifetime being 50 ns and the longer one being around 500/800 ns (see figures 5.1 and 5.3). While the
population of one of the decay lifetimes is due to intra-molecular energy transfer between the
luminescence of the rhenium and the absorption of the cupric LMCT band, the other decay
population is unclear. One possibility could be the generation of tryptophan (48) radical from a
unique rhenium orientation. The distinct lack of the fast decay in the reduced species (thus mono-
exponential decay) would indicate that radical formation is an unlikely scenario. Another possibility
is that the faster decay corresponds to some oligomer which quenches far more effectively in the
cupric form of azurin; this hypothesis is also unlikely due to the fact that extremely low
Table 5.1: Data collection statistics
Space group P 1
Unit-cell parameters
a (Å) 33.35
b (Å) 58.73
c (Å) 65.56
Proteins in Unit Cell 4
Resolution Range 33 -1.62 (1.66-1.62)
No. of Unique Reflections 47046
Free R value 0.320
Completeness (%) 80.8

78
concentrations were used. Regardless, the two decay lifetimes present in the oxidized samples are
similar for both the mutant and the wild type, so no new features (such as hopping) occur selectively
in the mutant.
Though the oxidative quencher was not added to the Re(H83)W48W110 mutant, the wild
type was tested with the quencher in order to compare its behavior at current experimental conditions
to previously recorded data. The signal was not great for Cu2+
generation, however with forced fitting
(see figure 5.4) the rate was established to be around 5 x 10⁶ s
-1. This rate is comparable to the rates
recorded in a crystalline form (4.4 x 10⁶ s
-1)
9 and in solution (1.3 x 10
6 s
-1) .
10 The agreement suggests
that the current experiments performed on the wild type protein and the mutant were viable. The data
also indicates that hopping through the native tryptophan may not be able to be monitored with the
available Gray group instruments or even favored over single step tunneling. Using a hopping map
(see figure 5.9),1,12,13
the prediction of electron transfer through tryptophan is unlikely given the
distances of the redox centers and the ΔG° of each possible step. This conclusion would also indicate
that hopping would not be any more favorable in the mutant, despite any change in environment to
W48 by F110W.
X= -1.1055
Y= -0.029648
Level= 0
dGt (Re*->Cu)
dG
t (R
e*-
>W
)
-2 -1.5 -1 -0.5 0-0.4
-0.3
-0.2
-0.1
0
0.1
0.2
1
2
3
4
5
6
7
8
Figure 5.9: Hopping map for wild type azurin with W48 as the
redox intermediate. Cursor is located at the ΔG for the
system. Electron tunneling favored in white area.

79
The second mutant, Re(H107)W108W110, is a combination of two mutants a previous Gray
group member, Jeremiah Miller, worked on when he was studying tryptophan radicals.5 What he
found was that at the site 108, a tryptophan radical was generated quite rapidly, in ~300 ns, and
persisted for hours unless in the presence of a reversible oxidative quencher. Despite the neutral
radical decaying, cuprous azurin demonstrates no Cu2+
transient absorption signal. The second single
tryptophan mutant, at site 110, actually oxidized copper, however at the same rate as mutants without
any tryptophan. The rate of copper oxidation was around 35 μs, while the rate of formation for the
tryptophan radical at 110 for Zn azurin is around 1 – 10 μs. The motivation behind studying the
Re(H107)W108W110 mutant was the hypothesis that if tryptophan 108 is generated within 300 ns,
hopefully the tryptophan at 110 would be able to reduce the W108 radical (or radical cation) faster
than the 1 – 10 μs W110 takes to reduce the oxidized rhenium. If W110 is generated at a faster rate,
the more likely copper oxidation would prefer going through multistep electron transfer instead of a
single step reaction.
The results on Re(H107)W108W110 indicate that no substantial Cu2+
is formed upon
irradiation. According to the bi-exponential luminescence decay (see figure 5.5), two similar lifetimes
are present in both the oxidized and the reduced azurin experiments. The presence of two populations
would indicate two orientations of the rhenium label. The crystal structure (see figure 5.7 and 5.8)
indicates two different orientations of tryptophan and rhenium label which may or may not support an
argument of two distinct populations. The discrepancy in the short decay amplitudes between the
oxidized and reduced species would indicate that either the short decay rate does not correspond to a
faster quenching species (such as the initial W108 radical or second W110 radical) or that the relative
populations of rhenium orientation are altered based on the copper charge. Since the rhenium is
substantially far away from the copper, the charge on the copper atom should not affect the
orientation of the label. Therefore, the short decay rate is most likely due to a different process,
depending on the oxidation of the copper.

80
As for the transient absorption observed in the presence of oxidative quencher (see figure
5.7), no Cu+2
formation is present. However, some other persistent species, likely a radical, is
generated and persists longer than can be recorded with the instrumentation. Since the oxidized Re(II)
has no UV-Vis absorption, the signal at 480 and 510 nm would not correspond to any rhenium
species or any normal cupric or cuprous azurin. However, both wavelengths can correspond to a
neutral tryptophan radical or a ruthenium (the quencher) species. According to Miller’s data, a long-
lived radical is more likely a W108 radical, especially since he saw the W110 radical decaying with a
rate of around 2.0 x 10² s
-1. If the same principle applies for the double tryptophan mutant, W110 is
not generated due to the fact that W108 neutral radical has a lower reduction potential than W110.
Also, once more copper is not oxidized as the bimolecular rate for ruthenium quenching the neutral
radical is the dominant reaction.
5.5 Conclusion
The results for mutants Re(H83)W48W110 and Re(H107)W108W110 were disappointing
when it comes to copper oxidation through a hopping mechanism. However, both mutants provided a
little more information on how to generate a hydrophobic hopping tryptophan. The
Re(H83)W48W110 mutant essentially demonstrated that with the orientation of the sites 83, 48, and
the copper, no amount of perturbation to the W48 environment will favor hopping. Other labs have
witnessed W48 participating in electron transfer as a radical, indicating it is a feasible intermediate in
hopping.14
As for the Gray group’s photolabels, with the rhenium label at a different site, the addition
of W110 might create a difference to stabilize W48 as an intermediate in copper oxidation. As for
Re(H107)W108W110, the data indicate that even with a closer internal reductant (W110), W108●
still prefers a bimolecular reaction with the oxidative quencher.

81
REFERENCES
(1) Shih, C.; Museth, A. K.; Abrahamsson, M.; Blanco-Rodriguez, A. M.; Di Bilio, A. J.;
Sudhamsu, J.; Crane, B. R.; Ronayne, K. L.; Towrie, M.; Vlcek, A.; Richards, J. H.;
Winkler, J. R.; Gray, H. B. Science 2008, 320, 1760–1762.
(2) Weinberg, D. R.; Gagliardi, C. J.; Hull, J. F.; Murphy, C. F.; Kent, C. a; Westlake, B. C.;
Paul, A.; Ess, D. H.; McCafferty, D. G.; Meyer, T. J. Chem. Rev. 2012, 112, 4016–4093.
(3) Dempsey, J. L.; Winkler, J. R.; Gray, H. B. Chem. Rev. 2010, 110, 7024–7039.
(4) Brunschwig, B.; Creutz, C. Faraday Discuss. Chem. Soc. 1982, 74, 113–127.
(5) Miller, J. Radical formation and electron transfer in biological molecules, Thesis,
California Institute of Technology, 2004.
(6) Wehbi, W. A Amino Acid Radicals in Rhenium-Modified Copper Proteins, California
Institute of Technology, 2003.
(7) Lakowicz, J. R. Principles of Fluorescence Spectroscopy; 3rd ed.; Springer, 2006; p. 980.
(8) Farver, O.; Bonander, N.; Skov, L. K.; Pecht, I. Inorg. Chim. Acta 1996, 243, 127–133.
(9) Crane, B. R.; Di Bilio, A. J.; Winkler, J. R.; Gray, H. B. J. Am. Chem. Soc. 2001, 123,
11623–31.
(10) Miller, J. E.; Di Bilio, A. J.; Wehbi, W. a; Green, M. T.; Museth, a K.; Richards, J. R.;
Winkler, J. R.; Gray, H. B. Biochim. Biophys. Acta 2004, 1655, 59–63.
(11) Tezcan, F. A.; Crane, B. R.; Winkler, J. R.; Gray, H. B. Proc. Natl. Acad. Sci. USA 2001,
98, 5002–5006.

82
(12) Warren, J. J.; Ener, M. E.; Vlček, A.; Winkler, J. R.; Gray, H. B. Coord. Chem. Rev. In
Press.
(13) Shih, C. Electron Tunneling and Hopping Through Proteins, Thesis, California Institute
of Technology, 2008.
(14) Shafaat, H. S.; Leigh, B. S.; Tauber, M. J.; Kim, J. E. J. Am. Chem. Soc. 2010, 132,
9030–9039.

83
Chapter 6
Tunneling through Structurally Modified Proteins
6.1 Abstract
The electron transfer back electron rate was determined for two ruthenium-modified
cytochrome cb562 proteins. The metal-modified proteins were a variant on previously studied
ruthenium-modified cytochrome b562 mutants. By comparing the rates of identical histidine sites
between cytochrome b562 and cytochrome cb562, the role of a small structural modification to a protein
on the tunneling rates can be probed. In the case of the two similar proteins examined in this study,
the structural modification is a covalent thioether link from the porphyrin to the peptide backbone.
Since the heme is the electron acceptor for the electron transfer, the small structural difference should
be more relevant than most small structural changes to the protein.
6.2 Modifying Tunneling Pathways by Altering Protein Structural Features
While protein secondary structure includes loops and random coils, the most common
structural features studied for their effect on ET rates have been β-sheets and α-helices. Using the
tunneling pathway model,1–5
the β coupling decay constant for β-sheets was predicted to be 1.1 Å-1
,
lower than the 1.4 Å-1
that Dutton proposed for proteins.5–8
Experimentally, azurin, a β-barrel protein,
was analyzed for distance dependence electron transfer1,6,7,9,10
and was discovered to have a β
coupling decay constant of about 1.1 Å-1
, as predicted by the tunneling pathway model. For α-helices,
smaller couplings were found, corresponding to the prediction of the β coupling decay constant of
about 1.26 Å-1
. However, through experimental study on a four α-helical bundle protein cytochrome
b562, the β of an α-helix was found to be dependent on the directional path of the electron.11–14
If an

84
electron follows a path perpendicular to the α-helix, then the distance decay constant resembles that
of a β-sheet instead of the higher theoretical value for α-helices.
The Gray lab has been studying electron transfer rates in proteins for the past three decades.
The experiments performed to determine the β values of an α-helix used a second generation Ru
metal label; one that was photoactive and capable of transferring an electron to a protein acceptor. In
the experiments on cytochrome b562, bis(bipyridine)imidazoleruthenium [Ru(bpy)2(imid)(HisX)2+
]
was covalently attached to a surface-exposed histidine residue.11
The distance between this donor and
the acceptor (heme) can be controlled by substituting the covalently-bound tag at various distances
through mutations of the protein structure. The Ru(bpy)2(imid)22+
species with its high reduction
potential and its relatively long luminescent lifetime (~70 ns)15
is an excellent probe allowing
observation of both the electron transfer from the excited ruthenium tag (kfET) to the Fe
3+ heme and
the corresponding back reaction (kbET).
Figure 6.1: Tunneling time table for Ru-modified
cytochrome b562. The lines are the tunneling
pathway predictions for β strand (upper) and α helix
(lower).12

85
In recent studies16,17
of experimental rate constants of azurin, cytochrome c, myoglobin, and
cytochrome b562, Beratan evaluated how the effects of the electron pathway impacted the rate. He
observed that certain mutants of cytochrome b562 displayed single dominant pathways with smaller
couplings. He also observed multi-pathway mutants with larger coupling factors; for these mutants,
he considered the structure as having less of an impact on the rate of the reaction. A new “coherence”
coupling factor was introduced to help distinguish single vs. multiple pathway effects. Interest lies in
whether some structural element governs this effect. Do possible alterations in the protein structure
exist that can generate a new dominant pathway or destroy an original one? This matter will be
addressed by determining ET rates in cytochrome cb562 mutants where the heme has been covalently
linked to the α-helix backbone. With the covalent attachment of the heme to the protein backbone, the
tunneling pathway for each mutant may narrow to a single well coupled pathway, or access a multi-
pathway by providing more access to the heme, the electron acceptor.
Figure 6.2: Overlapping ribbon structure of cytochrome b562 and
cb562. The heme groups are shown in gray (b562) and red (cb562)
showing a ~17 angle shift in the ligating His102.18
86
6.3 Materials and Methods
Preparation of Plasmid DNA for Cytochrome cb562 Mutants
Cytochrome cb562 was expressed from a pETcb562 plasmid engineered by Faraone-Mennella
et al,18
The wild type strand was expressed using the obtained plasmid. In order to accommodate
future histidine mutations, the native histidine residue at position 63 was mutated into glutamic acid.
The selection of the primers is based on the restrictions designated by the QuikChange site directed
mutagenesis kit.
The PCR reaction protocol was adopted from the QuikChange manual. The PCR reaction
consisted of 20 ng of the pETcb562 plasmid, 125 ng of both forward and reverse primers, 1 μL of
deoxyribonucleotide triphosphate (dNTP) mixture, 5 μL of reaction buffer, and 1 μL of PufTurbo
DNA polymerase at a total volume of 50 μL. Using a thermal cycler, the PCR reaction alternated for
16 cycles to replicate the mutation in the plasmid. After the PCR reaction, 1 μL of Dnp I restriction
enzyme was added and incubated at 37 oC for 1 h.
A portion of the PCR mixture (1 μL) was then transformed into XL1 Blue E. coli. The
mixture of DNA was inserted into the cells using 45 s of heat shock at 42 oC. Following the heat
shock, the cells were incubated within NZY+ broth for 45 min. The cells were then inoculated onto
LB plates containing 100 μg/mL of ampicillin and incubated for 16 h. Four to six colonies were
inoculated in 4 mL LB media starter cultures containing 100 μg/mL Amp and incubated for 12 h. The
cells were spun down, and the DNA was extracted using the method designated by the MiniPrep kit.
The DNA was sequenced and confirmed as H63E. This procedure was repeated using H63E as the
base plasmid for later mutants.
87
Transformation and Glycerol Stocks
To obtain pseudo wild type cytochrome cb562, the pETcb562 plasmid was co-expressed with
the heme cassette pEC86 in the BL21* (DE3) E. coli cell line. The two plasmids (1 μL portions) were
combined with 50 μL portions of the BL21* (DE3) cells in 200 μL of NZY+ media. The mixture was
chilled on ice for 5 min to equilibrate. The plasmids were inserted using 45 s of heat shock at 42 oC.
Following the heat shock, the cells were incubated for 45 min at 37 oC. The cells were then plated on
LB media plates containing 100 μg/mL of carbenicilline disodium salt (carb) for the protein and 34
μg/mL of chloramphenicol (chlora) for the heme cassette. On one plate, 100 μL of cells were plated
and the remaining cells were plated on a second plate. The plates were incubated for 12 – 16 h. Later
a modification to the cell line generated a competent cell out of a pretransformed BL21 (DE3) cell
with the heme cassette. The new competent cell allowed for a single plasmid transformation of the
pETcb562 plasmid or the various mutants while still following the same protocol as before.
Colonies from the incubated plates were selected for their uncompromised circular shape and
their positions in relation to the center of the plate. The number of colonies chosen varied from one
colony to eight or ten. Each colony selected was inoculated in 4 mL LB media containing 100 μg/mL
carb and 34 μg/mL chlora. These starter cultures were incubated for 6 h. After that time, 750 μL of
the culture was added to 300 μL of 80% glycerol and flash frozen in liquid nitrogen. The remaining
cultures were allowed to incubate for another 16 h before being spun down. The cell pellets were
evaluated for color, and only the darkest red pellets were selected as suitable glycerol stocks. The red
color of the cell pellets indicated a large amount of the cb562, as the protein has a bright red color.
Expression
The glycerol stock was selected to express on a large scale. The glycerol stock was
inoculated on to LB media plates containing 100 μg/mL carb and 34 μg/mL chlora and incubated for

88
12 – 15 h. Colonies were yet again selected by size, shape, and position on the plate. One colony was
placed in 25 mL of LB media containing antibiotics and incubated at 37 oC in a shaker for 12 h. At
the end of this incubation period, the culture was spun down and resuspended in fresh media
containing the appropriate antibiotics. This cell stock was then used to inoculate a larger scale of 9 L
of LB media containing 100 μg/mL of ampicillin. The large scale expression was incubated for 12 h
in the shaker; no induction was needed.
After growth, the large cell cultures were spun down and the pellets were collected. The cells
were lysed through sonication using a lysis buffer of 10 mM Tris HCl pH 8.0 containing 2mM of
EDTA, phenylmethylsulfonyl fluoride (PMSF), dithiothreitol (DTT), lysozyme, and DNase.
Following sonication, the lysed cells were spun down to separate the cell particulates from the
periplasmic supernatant containing the protein. The periplasmic cb562-containing solution was kept in
a reducing environment using DTT and limited exposure to air. The reduced protein was easier to
isolate during purification.
Purification
After lysis, the periplasmic cb562-containing solution was immediately purified. The initial
periplasmic cb562-containing solution was loaded onto a S Sepharose cationic exchange column in 10
mM Tris HCl buffer pH 8.0 containing 2 mM DTT. The column was flushed with a stepwise gradient
of NaCl until cb562 was collected at a gradient of 150 mM NaCl in 10 mM Tris HCl pH 8.0 + 2 mM
DTT buffer. The collected protein was concentrated to a volume of 10 mL (for 9 L of cell cultures) in
an Amicon unit using a 10 kDa molecular weight cutoff filter (YM-10). The buffer in the protein
sample was exchanged using a HiPrep 26/10 Desalting Column into 10 mM NaOAc pH 4.5.
Following the desalting column, the protein was purified in an HR 10/10 Mono S column, using 10
mM NaOAc buffer pH 4.5. The protein was eluted off the column in 10 mM NaOAc buffer pH 4.5 +

89
1M NaCl at 35% buffer B. The protein fractions were collected and concentrated using an Amicon
Ultra-15 filtration unit. The protein was flash frozen and stored at -80 oC.
Tagging with [Ru(bpy)2(H2O)2](CO3)211
The protein was prepared for tagging by exchanging the buffer into 300 mM KHCO3 pH 7.4.
The protein was then concentrated to 6 mL to 1.25 mM. The reaction mixture was separated into 8
aliquots of 750 μL of the protein and 75 μL of 12.5 mM [Ru(bpy)2(H2O)2](CO3)2. The tag stock
solution was prepared by dissolving 48.2 mg of [Ru(bpy)2(H2O)2](CO3)2 in 8 mL of 300 mM KHCO3
pH 7.4 buffer, which provides a concentration of 12.5 mM. The stock solution was stored in a vial in
the dark. The protein and the tag were stirred in a 12 mL falcon tube in the dark. The reaction was not
degassed. The reaction was run for 48 h at room temperature.
To remove the excess ruthenium tag from the reaction, the reaction mixture was passed
through a PD 10 desalting column immediately after 48 h. The column was previously equilibrated
with 300 mM KHCO3 pH 7.4. The first band eluted from the column contained a mixture of labeled
and unlabeled protein, while the second band was eliminated as it contained unreacted ruthenium tag.
To isolate the tagged protein from the untagged protein, a HiTrap Chelating HP 5 mL column loaded
with Cu(II) was used. The binding buffer was 20 mM NaPi buffer pH 7.2 + 1 M NaCl, while the
eluting buffer was 20 mM NaPi buffer pH 7.2 + 1 M NH4Cl. The protein was loaded onto the column.
The protein that did not bind to the column contained the ruthenium tag. The non-tagged protein
remained because its histidine bound to the Cu+2
on the column; it was eluted off of the column by
30% of the eluting buffer. The resulting labeled species is a Ru(bpy)2(H2O)(HisX) labeled protein.
The ruthenium-tagged protein was collected and dialyzed against 400 mM imidazole pH 8.0
buffer. Dialysis was conducted at 0 oC for 5 days with two buffer exchanges within the first 12 h.
Following dialysis, the protein was concentrated using Amicon Ultra-15 and the protein was

90
exchanged into 20 mM NaPi pH 7.2 buffer. The singly ruthenium-tagged protein was then separated
from any free label or doubly labeled protein using a HiPrep Mono Q HP 5 mL column. The binding
buffer was 20 mM NaPi pH 7.2. The protein was eluted with a stepwise gradient of 0 – 1 M NaCl.
Following purification on the Mono Q column, the protein was again exchanged into 10 mM NaOAc
pH 4.1 buffer. The Mono S column was then employed to separate the aquo substituted species from
the imidazolyl species. The binding buffer and eluting buffer had a decreased pH of 4.1 from the
normal Mono S buffers in order to resolve the imidazolyl species cleanly. The protein was eluted out
with ~15% of the buffer B, 10 mM NaOAc pH 4.1 + 1 M NaCl.
Wavelength-Dependent Nanosecond Laser System (NS-I): Instrument Setup for 480 nm
The wavelength-dependent nanosecond laser system is composed of a pump/probe setup (see
figure 2.b). The pump is the Spectra-Physics Nd:YAG laser coupled with a OPO. The Nd:YAG
utilized in the nanosecond system pulses at 1064 nm for approximately 10 ns. The frequency is
tripled to generate 355 nm pulses at 10 Hz. This pulse is sent through the OPO in order to access the
wavelength of 480 nm. Laser shots are around 300 – 400 mJ/pulse leaving the Nd:YAG box, which
are reduced to around 40 – 50 mJ/pulse after leaving the OPO box. Directly out of the OPO, the laser
beam is directed into a half wave plate utilizing a 70/30 mirrored crystal. The pump beam is then
directed through a polarizer to modulate the beam and reduce the power of the pulse. As the pump is
angled onto the table containing the probe alignment, the power has been reduced to around 1 – 3
mJ/pulse in order to protect the protein samples.
The probe setup is aligned through the sample overlapping the pump beam in order to
examine the change in absorption once the sample is excited. The multiple-wavelength probe is a Xe
arc lamp. The Xe lamp is aligned through the sample utilizing two concave mirrors which also focus
the probe beam into a monochromator. Between the mirrors and the monochromator, the probe is
passed through a series of broadband filters and a neutral density filter which are used to block out

91
unnecessary light and emission from the pump laser. The monochromator is attached to a
photomultiplier tube (PMT) which converts the signal into a current. With the cytochrome
experiments only the fast amplifier was used to detect the signal.
Sample Preparation: Cytochrome cb562
The ferric heme protein sample was contained in a quartz cuvette with clear windows on all
four sides. The cuvette was modified to have an extended arm which attached to a port on a Schlenk
line and a double Teflon seal. A sample size of 0.75 – 1.5 mL of labeled protein was inserted into the
cuvette. For cytochrome samples, the protein was at concentrations from 4 – 8 μM in 10 mM NaPi
pH 7.2 buffer. The sample was degassed using a pump/purge method. The cuvette was attached to the
Schlenk line and the Teflon seal was rotated to the first seal (isolates the system from external air).
The pump/purge began with a quick pull on the air in the head space of the cuvette. Once the gas
mixture has been removed, the line was sealed on a closed system to allow the gas in the solution to
displace into the head space. Before the solution begins to bubble violently, the cuvette is purged with
argon gas. This setup was repeated for 15 cycles. Before the cuvette is removed from the line, the
Teflon seal was closed to the second seal in order to isolate the sample from the line attachment.
Following the final seal, the cuvette was removed from the line.
6.4 Experimental Results
Mutants
For cytochrome b562, nine sites were analyzed. Each of the nine sites was engineered as
plasmids. While two of the sites, H63 (the native histidine) and D12H were expressed and labeled,
the seven other mutants are currently in varying states of preparation.

92
Transient Absorption Experiments
For both H63 and D12H cytochrome cb562, several wavelengths were examined in order to
probe electron transfer, more specifically the slower (activationless) back electron transfer rate. These
wavelengths were determined by the greatest difference between the absorption spectra of the ferric
and ferrous protein and the excited state Ru-label and the ground Ru2+
state. (see figures 6.3 and 6.4).
15
10
5
0
E (
µM
-1cm
-1)
600550500450400350300
nm
cyt cb562 Fe+3
cyt cb562 Fe+2
[Ru(bpy)2(im)2]+2
Figure 6.3: UV-Vis absorption spectra of ferric and ferrous protein
with the photo-label. The species are charted based on equal molar
concentrations to compare signals based on molar absorptivity.
Wavelength (nm)
424 nm
Figure 6.4: Graph of the difference (blue) of the Fe+2 and Fe+3 protein
and the absolute values (red) in order to show the greatest differentials.
e
409 nm

93
With the results from the difference between the ferric and ferrous UV-Vis spectra, the two
greatest signals were used to examine the decay rate of the photo-reduced protein to the ground state
ferric protein. As the Soret band shifts blue for the ferrous to ferric back electron transfer, there will
be a bleach recovery at 409 nm (see figure 6.4) and a growth decay at 424 nm. Also to compare a
third feature, the monochromator will be set to 370 nm to observe the decay from the ruthenium
excited state to the ground state. Two things will be noted at the 370 nm wavelength: first absorption
decay of unreacted *Ru and second bleach recovery due to the back electron transfer. This bleach
recovery is indicated in Figure 6.4 as a positive first differential that persists in the range around 370
nm.
Figure 6.5: Transient absorption trace at 409 nm for the
labeled original histidine, Ru(H63), cytochrome cb562.
-6
-4
-2
0
2
m
OD
2.01.51.00.50.0
Time (µs)
kET = 8.85 x 10⁵ s
-1 Fe+3
Fe+2
observered at 409 nm

94
Figure 6.6: Transient absorption trace at 424 nm for the
labeled original histidine, Ru(H63), cytochrome cb562.
6
4
2
0
-2
m
OD
50403020100
Time (µs)
kET = 9.35 x 10⁵ s
-1 Fe+3
Fe+2
observered at 424 nm
Figure 6.7: Transient absorption trace at 409 nm for the
labeled mutant, Ru(D12H), cytochrome cb562.
-2
-1
0
1
m
OD
1086420
Time (µs)
Fe+3
- Fe+2
observed at 409 nmkET = 5.90 x 10⁶ s
-1

95
Figure 6.8: Transient absorption trace at 424 nm for the
labeled mutant, Ru(D12H), cytochrome cb562.
2.5
2.0
1.5
1.0
0.5
0.0
-0.5
m
OD
1086420
Time (µs)
kET = 6.01 x 10⁶ s
-1
Fe+3
- Fe+2
observed at 424 nm
Table 6.1: Comparing Experimental Data to Previous
Reported Data [s-1]
Protein Rates at observed wavelengths
Cyt cb562 Fe+2 424 nm Fe+3 409 nm
H63 9.79 x 10⁵ 8.85 x 10⁵
D12H 5.90 x 10⁶ 6.01 x 10⁶
Cyt b56211 Fe+2 430 nm Fe+2 414 nm
H63 6.9 x 10⁶ 6.2 x 10⁶
D12H 2.1 x 10⁷ 3.3 x 10⁷

96
6.5 Discussion
Of the nine mutants labeled for cytochrome b562, only two mutants had single dominant
pathways when analyzed by Beratan’s coupling coherence model. Both of these mutants, D12H and
Figure 6.9: Transient absorption trace at 370 nm for Ru(H63)
cyt cb562. The first rate corresponds to the excited state while
the second decay corresponds to the back electron transfer.
10
8
6
4
2
0
-2
m
OD
1086420
Time (µs)
kexp1 = 1.35 x 10⁷ s
-1
kexp2 = 9.80 x10⁵ s
-1
Ru+2
— Ru+2
observed at 370 nm
Figure 6.10: Transient absorption trace at 370 nm for Ru(D12H)
cyt cb562. The first rate corresponds to the excited state while the
second decay corresponds to the back electron transfer.
12
10
8
6
4
2
0
m
OD
1086420
Time (µs)
kexp1= 1.32 x 10⁷ s
-1
kexp2 = 6.01 x 10⁶ s
-1Ru
+2— Ru
+2
observed at 370 nm

97
D73H, had electron tunneling pathways that were coupled to the metal acceptor, iron heme, through
one of the axial ligands. The remaining seven sites (one being the native histidine at position 63) were
considered to have multiple pathways and were coupled to the acceptor through the porphyrin ring. In
order to test if covalently attaching the heme through two thioether bonds to the protein backbone
will actually generate a new single dominant pathway, one of each type of tunneling pathway was
tested. For the multiple pathways site the native histidine was labeled on cytochrome cb562; while the
mutant D12H was selected as the single dominant pathway site to examine.
The native histidine 63 is considered to have multiple pathways for the electron to travel
between the donor and acceptor in b562. While the site 63 is in the middle on the third helix of
cytochrome b562 and cytochrome cb562, the pathways to the porphyrin ring do not include the face that
was covalently attached to helix four. The expected rate of electron transfer when comparing b562 to
cb562 should be similar unless a more favorably coupled pathway opened up due to the rigidity caused
by the linked heme. As shown in table 6.1, the rate for H63 in the cyt cb562 decreased, but not very
much. This decrease could be due to a couple of factors. First, as the decrease was not statistically
significant the rate change is essentially comparable to the non-modified protein. Second, even
though the two proteins are structurally super-imposable (see figure 6.2), the ruthenium label may be
oriented in a different configuration that slightly elongates the distance between electron transfer
partners. Lastly, the rigidity of the modified heme with the two covalent bonds may actually remove
certain “faster” (more coupled) pathways. By removing a few faster pathways, a site which is
dominated by a multiple pathways model would by default have a slower average rate. One or more
of these factors could be causing the slight decrease in rate for the Ru(H63) cytochrome cb562.
The mutant D12H was selected as the representative for the single dominant pathway
model.16
The site 12 is located on the first helix and assumed to have a single pathway that travels
from the peptide of helix one to the iron through the axial methionine ligand (Met 7) located on helix
one. This mutant also should not have any strong effect from the thioether bonds as they cannot

98
participate in the electron pathway. However, according to Table 6.1, the cytochrome cb562
Ru(D12H) mutant has essentially a rate decrease by a factor of 3 compared to Ru(D12H) in b562. In
the case of a single dominant pathway any perturbations to ruthenium orientation or angle of the axial
ligand could cause minor distance increases. This distance increase for an identically coupled single
dominant system should lead to a slight decrease to the rate of electron transfer.
Hypothetically the factor of 3 decrease in rate for the Ru(D12H) cytochrome cb562 could be
due to an increase in electron transfer distance; yet are there any tests available to confirm such a
claim? To model the system, a collaboration was arranged with Tatiana Prytkova, the original
developer of the computational model for predicting if a metal labeled protein has a single dominant
pathway or multiple pathways.16,17
With her model, she can predict distances as well as electron
pathways and electron transfer rates. The data she was able to produce for the Ru(D12H) cb562 and
Ru(D12H) b562 (see Table 6.2) indicate that the model predicts a slight increase in distance between
the ruthenium and iron for the cb562 mutant. Another way to experimentally determine the distance
would be to grow crystals of the Ru(D12H) cb562 mutant, which is an experiment for future work.
Table 6.2: Comparing Experimental Data to Theoretical Data [s-1]
Protein(mutant)
TheoreticalDistance (Å)
Experimental Rates (s-1)
Theoretical Rates (s-1)
Cyt cb562
H63 18.8 9.5 x 10⁵ 5.5 x 10⁵
D12H 15.8 6.0 x 10⁶ 1.7 x 10⁶
Cyt b562
H63 19.0 6.9 x 10⁶
D12H 14.5 2.1 x 10⁷
99
While only two mutants are presented here, further test are being prepared to analyze two
other histidine sites, K19H and K92H. These sites have a few unique features to help probe if the
structural modification of thioether links to the heme could actually change the behavior of a single
dominant pathway or multiple pathways. First, the site 92 is located on the fourth helix and in
predictive models for the b562 protein, the face of the porphyrin that the electron travels through is the
same as the face covalently linked in cb562. Second, both sites 19 and 92 have been engineered as
cysteine mutants and connected to a flexible tether via a modified phenanthroline ruthenium
bisbipyridine metal label. As the electron transfer rates for both of the cysteine (K19C and K92C)
cb562 mutants have already been determined by a fellow Gray group student, Nicole Bouley Ford, the
electron transfer rates of histidine mutants with rigid metal labels can be compared to cysteine
mutants with flexible metal labels. More importantly with site 92 the effect of the covalent thioether
bond on the electron transfer pathway may be determined.
6.6 Conclusions
While this study did not generate a mutant with a well coupled single dominant pathway due
to the covalent attachment of the heme, a few conclusions can be summarized concerning the two
ruthenium modified sites. First, a site that does not have a new structural feature on its tunneling
pathway is less likely to see dramatic fluctuations to rate. Second, for the single dominant pathway, a
small perturbation in the distance of electron donor/acceptor pairs had a noticeable change to the rate.
Since both cytochrome b562 and cb562 are so similar in structure besides the covalent links to the heme,
the small difference in electron transfer rates is expected.
The several new sites being ruthenium-modified should interact with the porphyrin’s
thioether bonds, thus comparing how the new addition of a bond from acceptor to peptide affects
electron transfer. With rigid histidine ligands and flexible cysteine ligand bonds, more “structural”
modifications will provide a more dynamic picture. The flexible linkers provide interesting

100
opportunities to isolate a new well coupled single dominant pathway and change a slow single
dominant pathway to a faster multiple pathway mutant.

101
REFERENCES
(1) Regan, J. J.; Di Bilio, A. J.; Langen, R.; Skov, L. K.; Winkler, J. R.; Gray, H. B.;
Onuchic, J. N. Chem. Biol. 1995, 2, 489–496.
(2) Beratan, D. N.; Betts, J. N.; Onuchic, J. N. Science 1991, 252, 1285–1288.
(3) Beratan, D.; Betts, J.; Onuchic, J. J. Phys. Chem. 1992, 96, 2852–2855.
(4) Onuchic, J. N.; Beratan, D. N. J. Chem. Phys. 1990, 92, 722.
(5) Skourtis, S. S.; Regan, J. J.; Onuchic, J. N. J. Phys. Chem. 1994, 98, 3379–3388.
(6) Page, C. C.; Moser, C. C.; Chen, X.; Dutton, P. L. Nature 1999, 402, 47–52.
(7) Farid, R. S.; Moser, C. C.; Dutton, P. L. Curr. Opin. Struct. Biol. 1993, 3, 225–233.
(8) Moser, C.; Keske, J.; Warncke, K.; Farid, R.; Dutton, P. Nature 1992, 355, 796–802.
(9) Langen, R.; Chang, I. J.; Germanas, J. P.; Richards, J. H.; Winkler, J. R.; Gray, H. B.
Science 1995, 268, 1733–1735.
(10) Gray, H. B.; Winkler, J. R. J. Electroanal. Chem. 1997, 438, 43–47.
(11) Farrow, N. Investigation of Electron Transfer in the alpha-Helical Protein Cytochrome
b562, Thesis, California Institute of Technology, 1999.
(12) Winkler, J. R.; Di Bilio, A.; Farrow, N. A.; Richards, J. H.; Gray, H. B. Pure Appl. Chem.
1999, 71, 1753–1764.
(13) Winkler, J. R. Curr. Opin. Chem. Biol. 2000, 4, 192–198.
102
(14) Gray, H. B.; Winkler, J. R. Proc. Natl. Acad. Sci. USA 2005, 102, 3534–3539.
(15) Reddy, K. B.; Cho Mo, M. P.; Wishart, J. F.; Emge, T. J.; Isied, S. S. Inorg. Chem. 1996,
35, 7241–7245.
(16) Prytkova, T. R.; Kurnikov, I. V.; Beratan, D. N. Science 2007, 315, 622–625.
(17) Prytkova, T. R.; Kurnikov, I. V.; Beratan, D. N. J. Phys. Chem., B 2005, 109, 1618–1625.
(18) Faraone-Mennella, J.; Tezcan, F. A.; Gray, H. B.; Winkler, J. R. Biochemistry 2006, 45,
10504–10511.


