
Enlargement of the European Union: Three Years Later
Susan SchadlerEuropean DepartmentInternational Monetary Fund
EU enlargement has succeeded on three fronts
1. Absorption of EU transfers

Rising use of EU Funds helps sustain consumption, investment in new
membersCE4: Gross Inflow of EU Funds 2004-06 (percent of GDP)
Source: National authorities, European Commission, IMF staff estimates.
0.0
0.5
1.0
1.5
2.0
2.5
3.0
3.5
4.0
Czech Rep. Slovenia Slovakia Poland Hungary Estonia Lithuania Latvia
2004 2005 2006

EU enlargement has succeeded on three fronts
1. Rising use of EU funds
2. High and steady trade growth

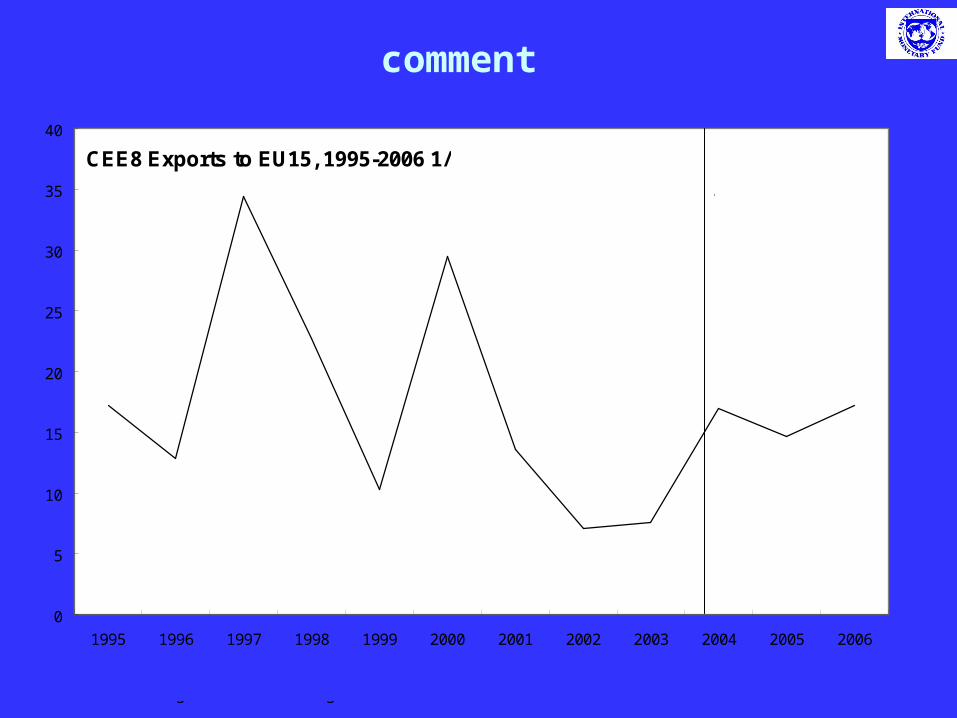
Sustained high export growth from CE8 to EU15
CEE8 Exports to EU15, 1995-2006 1/
0
5
10
15
20
25
30
35
1995 1996 1997 1998 1999 2000 2001 2002 2003 2004 2005 2006
Source: Direction of Trade Statistics, IMF.1/ Excluding Belgium and Luxembourg.
(Annual Percent Change)
pre-enlargement post-enlargement
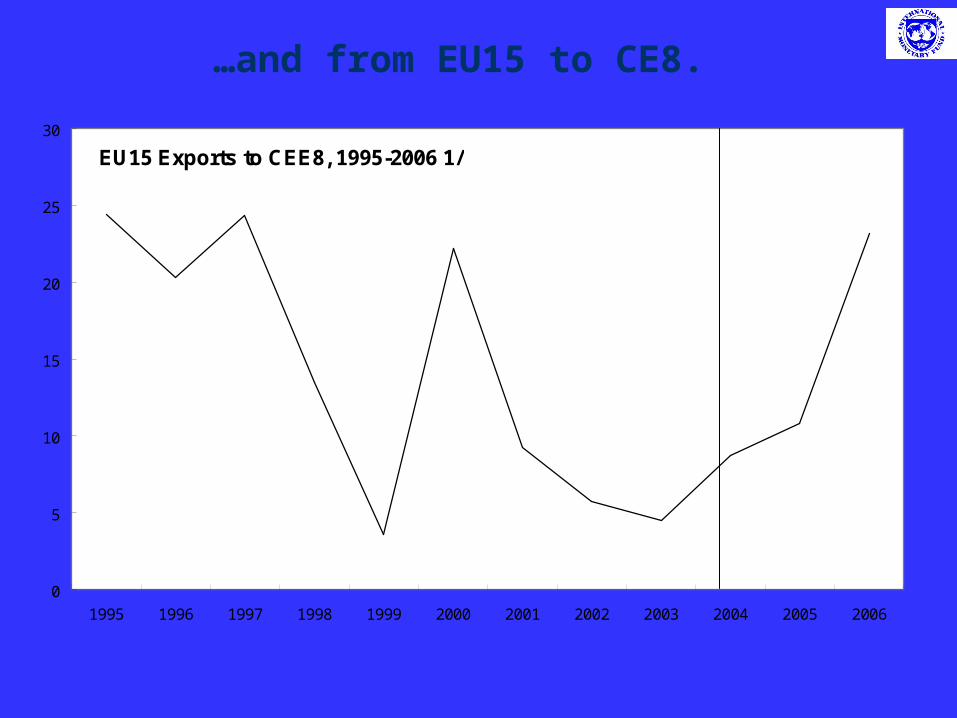
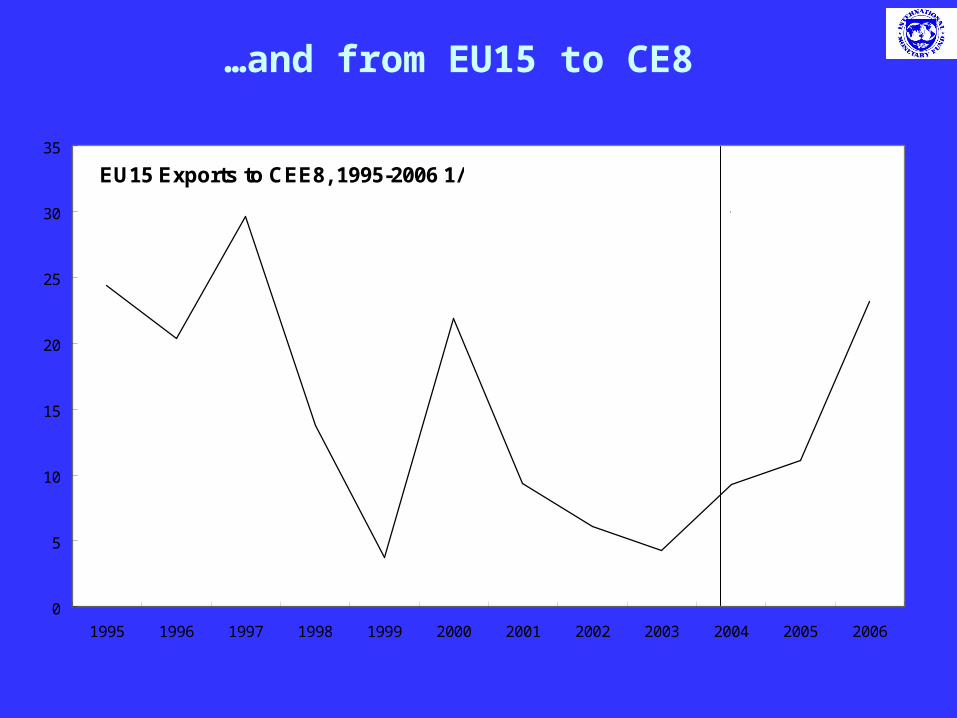
…and from EU15 to CE8.
EU15 Exports to CEE8, 1995-2006 1/
0
5
10
15
20
25
30
1995 1996 1997 1998 1999 2000 2001 2002 2003 2004 2005 2006
Source: Direction of Trade Statistics, IMF.1/ Excluding Belgium and Luxembourg.
(Annual Percent Change)
pre-enlargement post-enlargement
EU enlargement has succeeded on three fronts
1. Rising use of EU funds
2. High and steady trade growth
3. Financial market integration
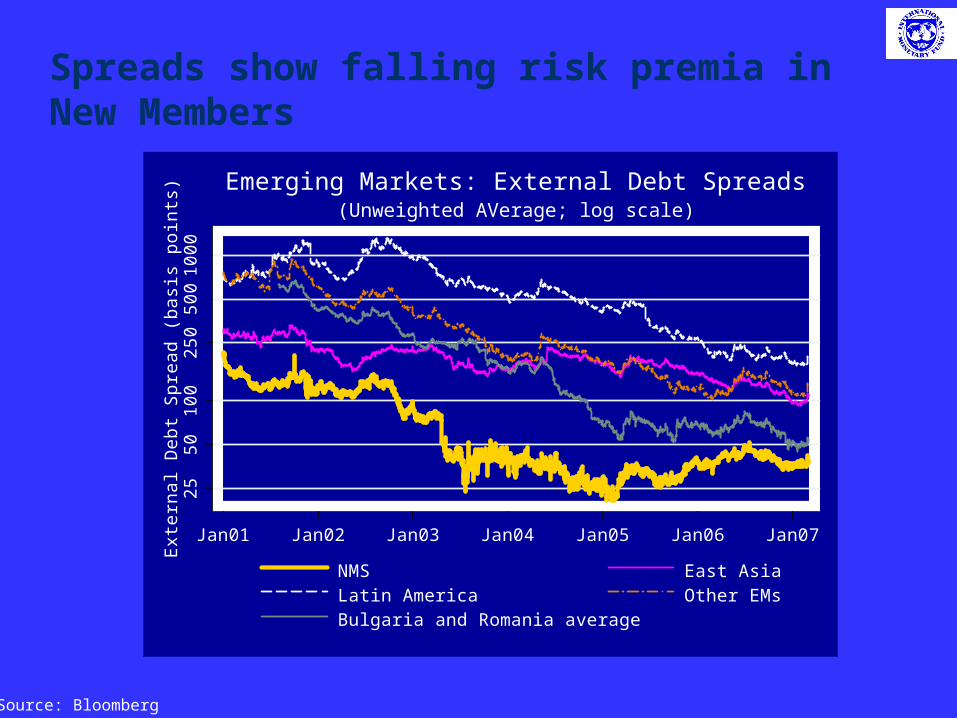
Spreads show falling risk premia in New Members
Source: Bloomberg
2550
100
250
500
1000
Ext
erna
l Deb
t Spr
ead
(bas
is p
oint
s)
Jan01 Jan02 Jan03 Jan04 Jan05 Jan06 Jan07
NMS East AsiaLatin America Other EMsBulgaria and Romania average
(Unweighted AVerage; log scale)Emerging Markets: External Debt Spreads
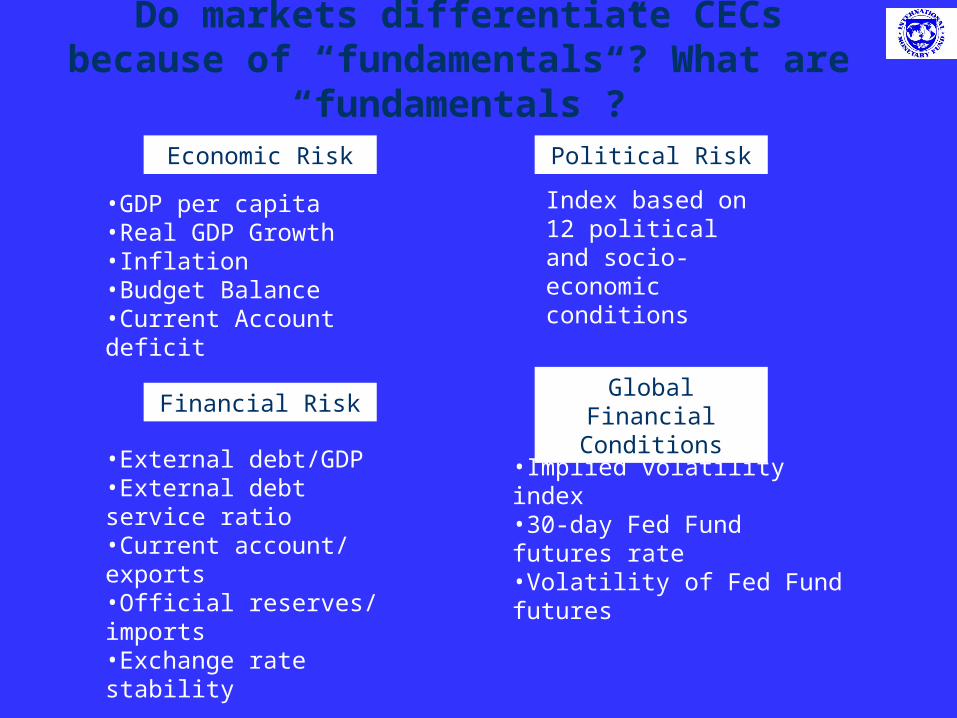
Do markets differentiate CECs because of “fundamentals”? What are
“fundamentals”?Economic Risk
•GDP per capita•Real GDP Growth•Inflation•Budget Balance•Current Account deficit
Political Risk
Index based on 12 political and socio-economic conditions
Financial Risk
•External debt/GDP•External debt service ratio•Current account/ exports•Official reserves/ imports•Exchange rate stability
Global Financial Conditions
•Implied volatility index•30-day Fed Fund futures rate•Volatility of Fed Fund futures
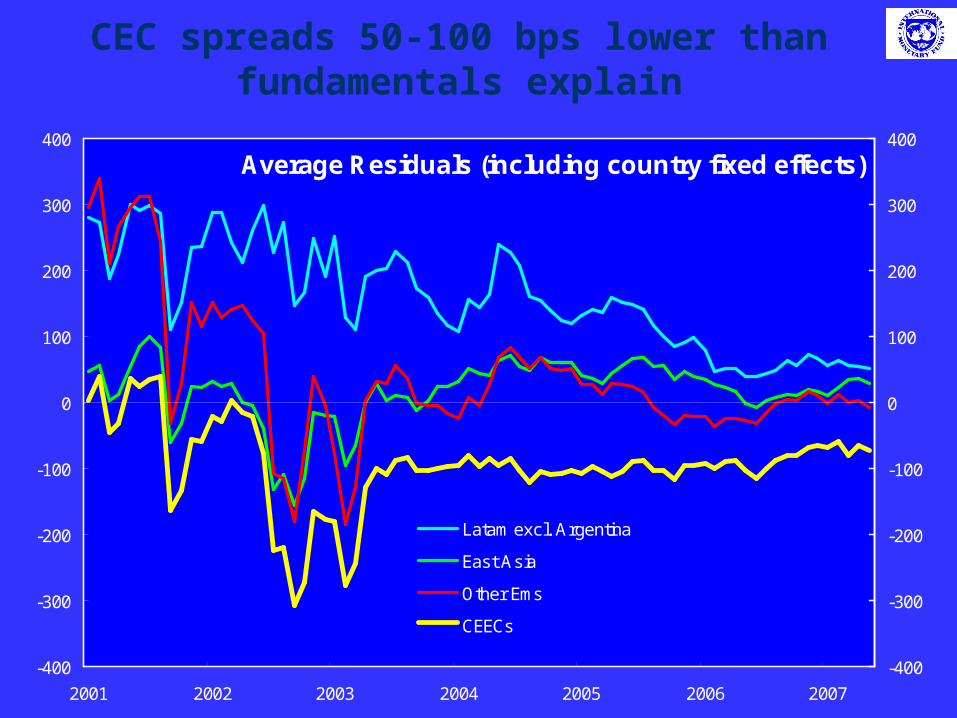
CEC spreads 50-100 bps lower than fundamentals explain
Average Residuals (including country fixed effects)
-400
-300
-200
-100
0
100
200
300
400
2001 2002 2003 2004 2005 2006 2007
-400
-300
-200
-100
0
100
200
300
400
Latam excl. Argentina
East Asia
Other Ems
CEECs(in basis points)
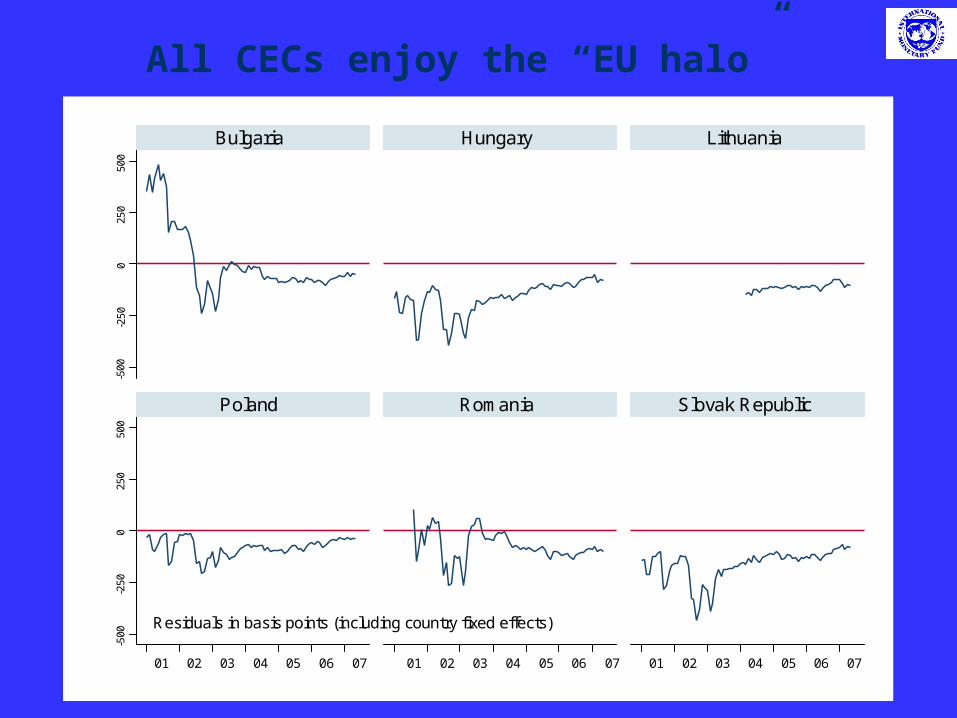
All CECs enjoy the “EU halo”-5
00-2
500
250
500
-500
-250
025
050
0
01 02 03 04 05 06 07 01 02 03 04 05 06 07 01 02 03 04 05 06 07
Bulgaria Hungary Lithuania
Poland Romania Slovak Republic
Residuals in basis points (including country fixed effects)
-500
-250
025
050
0-5
00-2
500
250
500
01 02 03 04 05 06 07 01 02 03 04 05 06 07 01 02 03 04 05 06 07
Bulgaria Hungary Lithuania
Poland Romania Slovak Republic
-500
-250
025
050
0-5
00-2
500
250
500
01 02 03 04 05 06 07 01 02 03 04 05 06 07 01 02 03 04 05 06 07
Bulgaria Hungary Lithuania
Poland Romania Slovak Republic
Residuals in basis points (including country fixed effects)

Real convergence is picking up
Yearly Growth of GDP per capita
0
2
4
6
8
10
1995 1996 1997 1998 1999 2000 2001 2002 2003 2004 2005 2006 2007projection
Source: WEO, IMF.
(In percent)
Euro area
CEE8
pre-enlargement post-enlargement


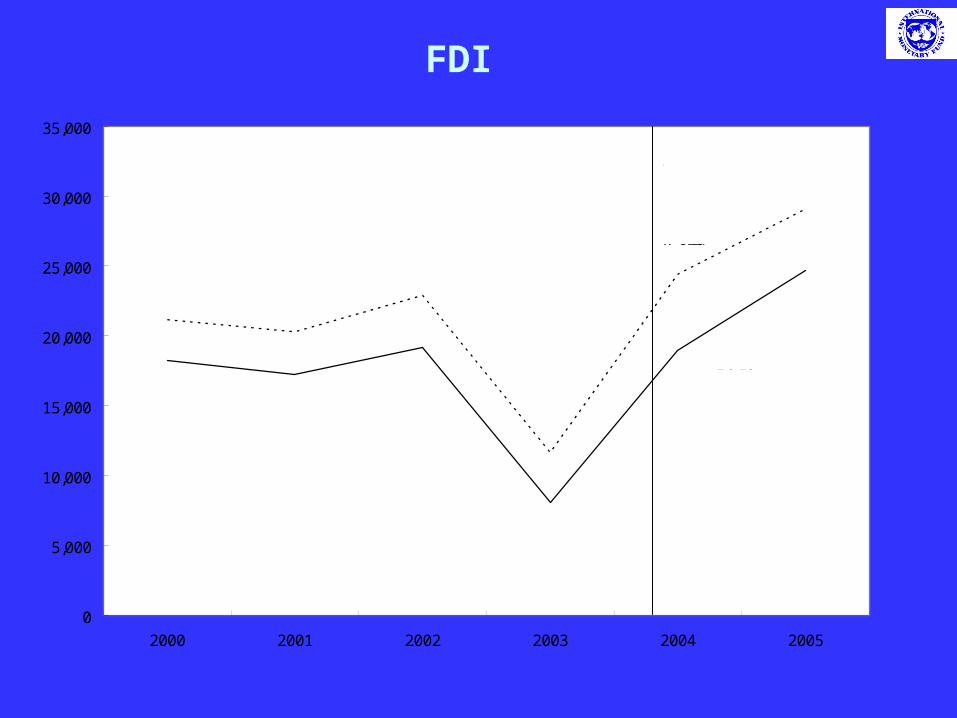
FDI
0
5,000
10,000
15,000
20,000
25,000
30,000
35,000
2000 2001 2002 2003 2004 2005
Source: Eurostat.
(Millions of euros)
EU15
World
pre-enlargement post-enlargement
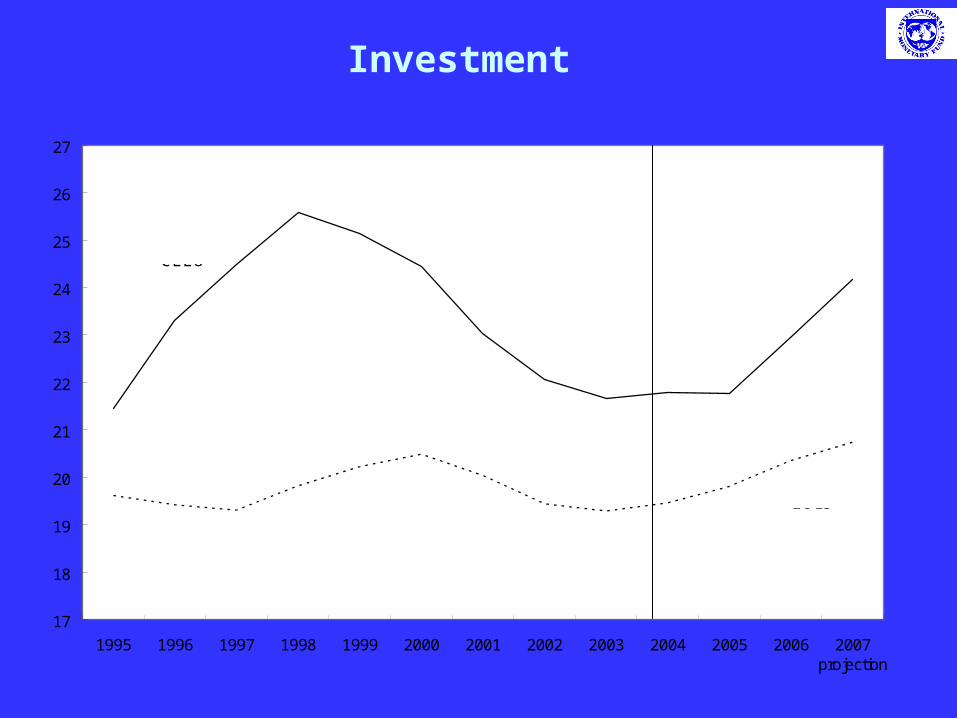
Investment
17
18
19
20
21
22
23
24
25
26
27
1995 1996 1997 1998 1999 2000 2001 2002 2003 2004 2005 2006 2007projection
Source: WEO, IMF.
(In percent of GDP)
EU15
CEE8
pre-enlargement post-enlargementFixed Investment

Title
Czech Rep.
Actual
Predicted
-8
-6
-4
-2
0
2
1997 1999 2001 2003 2005 2007
-8
-6
-4
-2
0
2Hungary
Actual
Predicted
-10
-8
-6
-4
-2
0
2
4
1997 1999 2001 2003 2005 2007
-10
-8
-6
-4
-2
0
2
4
Poland
Actual
Predicted
-10
-8
-6
-4
-2
0
2
1997 1999 2001 2003 2005 2007
-10
-8
-6
-4
-2
0
2
Slovak Rep.
Actual
Predicted
-12
-8
-4
0
4
1997 1999 2001 2003 2005 2007
-12
-8
-4
0
4
(Percent of GDP)

Title
Estonia
Actual
Predicted
-16
-12
-8
-4
0
4
8
1997 1999 2001 2003 2005 2007
-16
-12
-8
-4
0
4
8
Latvia
Actual
Predicted
-25
-20
-15
-10
-5
0
5
1997 1999 2001 2003 2005 2007
-25
-20
-15
-10
-5
0
5Lithuania
Actual
Predicted
-16
-12
-8
-4
0
4
1997 1999 2001 2003 2005 2007
-16
-12
-8
-4
0
4
(Percent of GDP)
comment
CEE8 Exports to EU15, 1995-2006 1/
0
5
10
15
20
25
30
35
40
1995 1996 1997 1998 1999 2000 2001 2002 2003 2004 2005 2006
Source: Direction of Trade Statistics, IMF.1/ Data for Belgium and Luxembourg start in 1997.
(Annual Percent Change)
pre-enlargement post-enlargement
…and from EU15 to CE8
EU15 Exports to CEE8, 1995-2006 1/
0
5
10
15
20
25
30
35
1995 1996 1997 1998 1999 2000 2001 2002 2003 2004 2005 2006
Source: Direction of Trade Statistics, IMF.1/ Data for Belgium and Luxembourg start in 1997.
(Annual Percent Change)
pre-enlargement post-enlargement
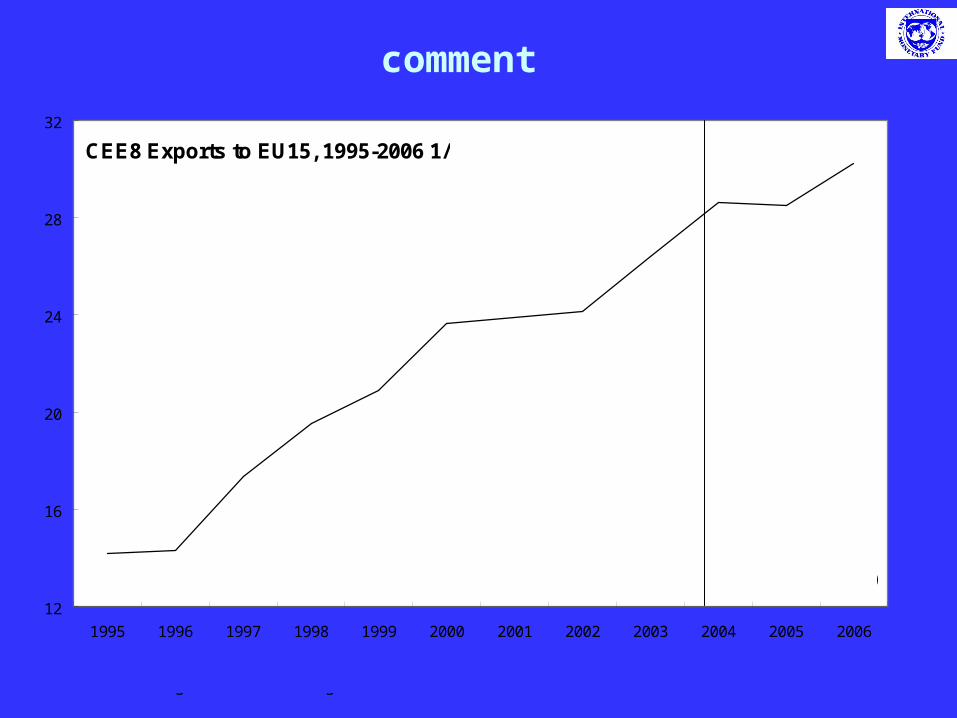
comment
CEE8 Exports to EU15, 1995-2006 1/
12
16
20
24
28
32
1995 1996 1997 1998 1999 2000 2001 2002 2003 2004 2005 2006
Source: Direction of Trade Statistics, IMF.1/ Data for Belgium and Luxembourg start in 1997.
(Percent of GDP)
pre-enlargement post-enlargement
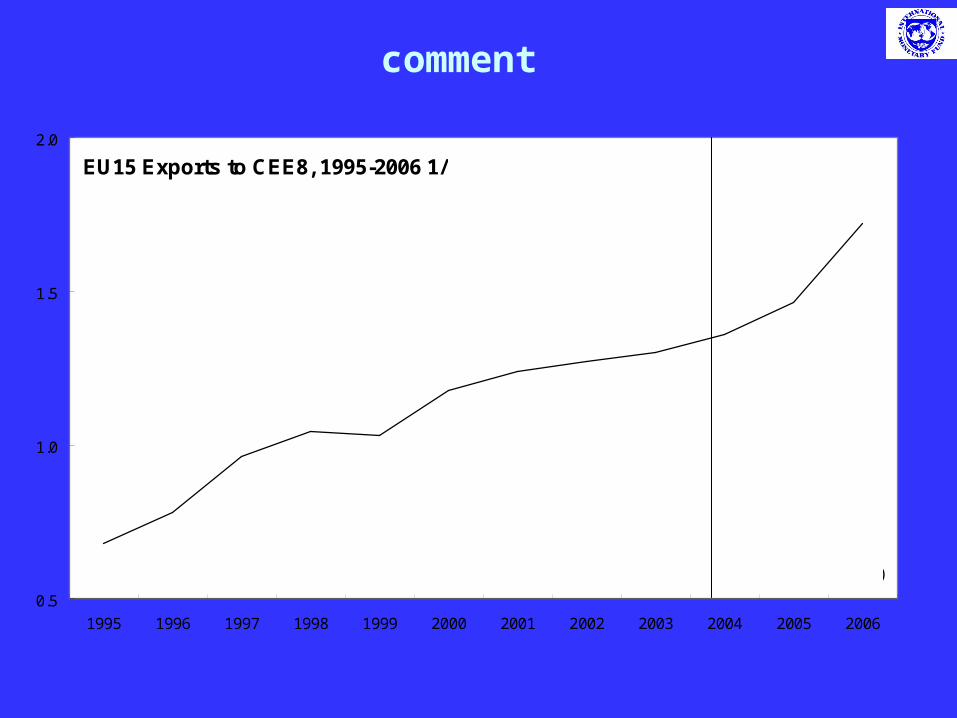
comment
EU15 Exports to CEE8, 1995-2006 1/
0.5
1.0
1.5
2.0
1995 1996 1997 1998 1999 2000 2001 2002 2003 2004 2005 2006
Source: Direction of Trade Statistics, IMF.1/ Data for Belgium and Luxembourg start in 1997.
(Percent of GDP)
pre-enlargement post-enlargement
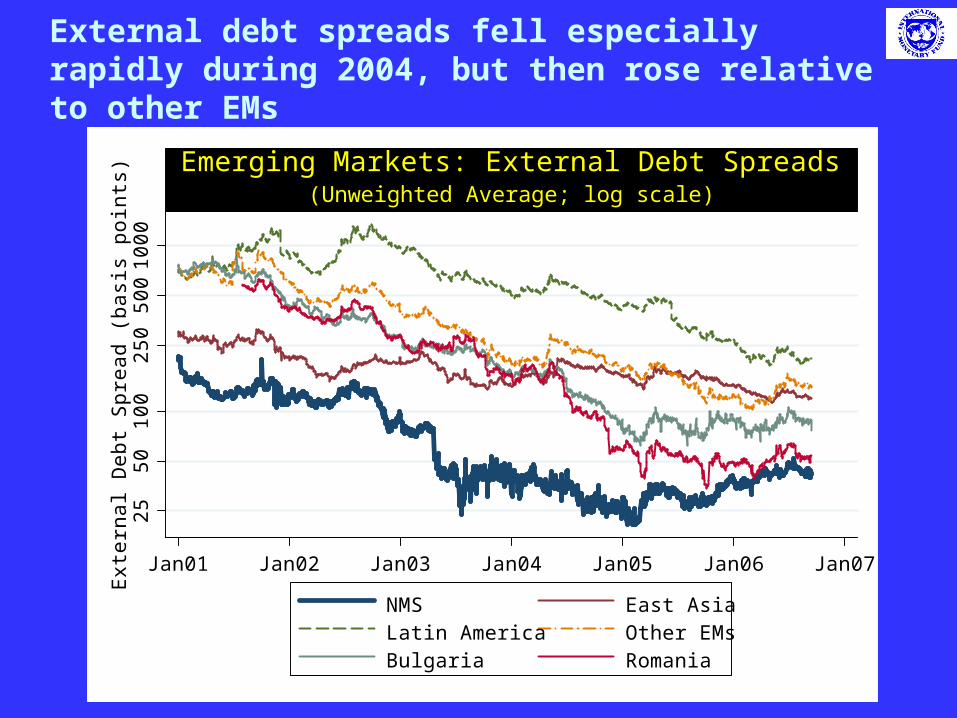
External debt spreads fell especially rapidly during 2004, but then rose relative to other EMs
2550
100
250
500
1000
Ext
erna
l Deb
t Spr
ead
(bas
is p
oint
s)
Jan01 Jan02 Jan03 Jan04 Jan05 Jan06 Jan07
NMS East AsiaLatin America Other EMsBulgaria Romania
(Unweighted Average; log scale)Emerging Markets: External Debt Spreads
Source: Bloomberg


