
1
Equity Valuation & Analysis of
GUESS INC.
Chris Yelverton
Toan Le
Eric Lundblad
Mike Wallace
Mark Chapman

2
Table of Contents
Executive Summary 4
Industry Analysis 8
Company Overview 8
Industry Overview 10
Five Forces Model 11
Value Chain Analysis 27
Accounting Analysis 33
Financial Analysis 46
Core Sales Manipulation Diagnostics 46
Core Expense Manipulation Diagnostics 49
Forecasting 53
CAPM Estimation 68
WACC Estimation 70
Method of Comparables 71
Discount Dividend Model 76
Discounted Free Cash Flows Model 78
AEG 80
Residual Income Valuation Model 83
Long Run ROE Income Model 86
Z Score 88
Appendix

3
Executive Summary
Investment Recommendation: Company Is Slightly Undervalued, Buy
GES – NYSE (06/30/07): $44.86
52 week range: $51.15 - $19.50
Market Capitalization: 4.49B
Shares Outstanding: 93.54M
Avg. Daily Trading Volume: 1.73M
ROE: 30%
ROA: 15%
Cost of Capital Estimate R2 Beta Ke
3-Month .055 .10 5.99
6-Month .045 .10 6.02
2-Year .078 .15 6.40
5-Year .117 .29 7.49
10-Year .163 .48 9.00
Altman Z-Score: 9.41
Ratio Comparison GES AEO GAP
Trailing P/E 28.2 16.8 14.6
Forward P/E 34.8 15.71 30.29
P/B 10.16 4.10 3.06
Valuation Estimates
Actual Price (06/30/2007): $48.04
Ratio Based Valuations
Trailing P/E $10.19
Forward P/E $24.00
P/B $25.78
P/EBIT $28.30
P/FCF $44.80
Intrinsic Valuations Actual Revised
Discounted Dividends $3.40 $73.66
Free Cash Flows $52.13 $71.85
Residual Income $70.92 $103.80
LR ROE $15.53 N/A
AEG $15.53 $137.47

4
Industry Analysis
Guess was founded in 1981 and currently operates as a Delaware corporation.
Guess Inc. (GES) is a component of the specialty retail industry which is a
segment of the overall retail industry. Guess Jeans designs, markets,
distributes, and licenses lifestyle collections of contemporary apparel and
accessories for men, women, and children that reflect American lifestyle and
European fashion sensibilities (Guess Inc. 2006 10-K). Their target customer is a
style-conscious consumer primarily between the ages of 18 and 32 which is a
highly desirable demographic group that is believed to have significant
disposable income. Guess currently operates 336 stores in North America and
386 additional stores internationally. To compete in the specialty retail industry
firms must be conscious of several key success factors.
Guess’ direct competitors include GAP, Abercrombie and Fitch, and American
Eagle Outfitters. These firms were chosen for comparisons because they are
traded publicly and have highly accessible financial data. Firms in the specialty
retail industry compete by differentiating their products from competitors. While
it is important to maintain competitive prices, the main focus in this industry is
not cost leadership. The primary factor that separates firms in the specialty
retail industry is creating a distinguished image that customer’s value. Another
factor that can help gain a competitive advantage is providing a product of
superior quality. Success is also dependent on the variety of products that a firm
provides. Competitors in the industry strive to expand product lines, develop
new product lines, and sell additional accessories.

5
Accounting Analysis
To be able to efficiently analyze a firm, an investor must next do a very
extensive accounting analysis to determine which key accounting strategies a
firm is using to affect their net income. First, key accounting policies are
discussed and then checked to determine if they coincide with the firms key
success factors in the five forces model. Due to GAAP standards and regulations,
firms are allowed a lot of flexibility on how they report on their financials. One of
the areas that firms are allowed a lot of flexibility in the specialty retail industry is
the reporting of inventory. One area that allows a lot of flexibility is the ability to
use off the balance sheet transactions to record operating leases. This allows a
company to understate their liabilities as well as manipulate their cash flows from
operations. By capitalizing the lease an analyst is able to see the true value of
firms’ liabilities and use them to value the firm accordingly.
In the specialty retail industry almost every firm uses operating leases as
opposed to capital leases. The operating lease enables the firm to receive tax
benefits be expensing lease payments as well as allowing them to decrease
liabilities. The capitalization of Guess’s operating leases allows investors to gain a
better understanding of their true financial standing, and that is recognizing
almost 3.5 million in liabilities that did not show up under operating leases.
Guess’s sales and expense ratio diagnostics did not appear to raise any potential
red flags for the company. Guess seems to be operating efficiently in their niche
and is relatively close to the industry average in this area. We believe that this is
a clear red flag. The fact that a company is able to understate its liabilities
significantly distorts its accounting numbers and can portray its company’s
financials in a more appealing manner.
6
Financial Analysis and Forecasting
To compare Guess’ financial performance and gauge their future outlook relative
to competitors we performed a series of liquidity, profitability, and capital
structure ratios for Guess and each of the mentioned competing firms. These
ratios also allow us to calculate an industry average which is useful as a
benchmark measure. The results of the financial analysis are then used to
forecast Guess’ financial statements 10 years out. Next you must estimate a
beta for the firm using the CAPM model, and the cost of equity can be
determined using regression analysis. Ultimately the cost of capital can be
calculated using the weighted cost of capital formula.
As far as the liquidity analysis goes Guess’ had been right at the industry
average. And for the profitability analysis they were among the industry leaders,
which means, they will continue to yield high profits in the future years of
operations. Using the current dividends of 6 cents paid out in 2006, we were
able to successfully forecast dividends out to 2011. We forecasted out other line
items such as earnings on the income statement by using an estimated sales
growth rate of that peaked at 28%. From that point, we gradually reduced the
growth rate and started heading it towards the industry average. This method of
growth is backed up by the very strong sales numbers that Guess has seen in
recent years. We believe that Guess will continue to grow at this strong rate.
Cash flow from investments and operations using the financial analysis derived
from our published statements. This allowed us to get a reasonable estimate on
future earnings that helped us further value the firm until our perpetuity year of
2017.

7
Valuation
Almost all aspects of a company can be analyzed to determine if the company is
over or under valued based upon their share price. Ultimately this is what
investors look at to determine if they would like to invest in the firms stock.
There are various models used to determine the valuation of the stock prices.
The first being the method of comparables, it is the quickest and easiest method
to implement but is not very reliable because the price per share is ultimately
determined upon an industry average. Second, the intrinsic valuation models are
more theory based and take into account the estimated of the companies next
ten years of forecasted financials. There was also a revised section where we
took into account the company’s use of operating leases as opposed to capital
leases. In conclusion, it was determined after running all of the valuation models
that Guess is an extremely overvalued company.
Industry Analysis
Company Overview
Guess Inc. (GES) designs distributes and licenses one of the worlds leading
lifestyle collections of contemporary apparel and accessories for men, women,
and children that reflect the American lifestyle and European fashion sensibilities.
Furthermore, Guess Inc. also grants licenses to manufactures and distribute a
broad range of products that compliment their apparel lines (Guess’s 2006 10-K).
Since Guess’ inception in 1981, Guess has targeted males and females between
the ages of 18 and 32 because they believe that this group is full of style
conscious consumers with enough disposable income to pay for a brand name.

8
Guess is headquartered in Los Angeles, California where it operates its retail,
wholesale, and European Licensing business segments. Guess uses three main
distribution channels to sell their products which includes; using their own stores,
through a network of wholesale accounts, and the Internet. Through these
distribution channels, Guess offers a full apparel line of both denim and cotton
jeans, pants, overalls, skirts, dresses, shorts, blouses, shirts, jackets, and
knitwear. In addition, Guess also offers accessories that promote and
complement its image which includes eyewear, watches, handbags, kids clothing,
footwear, and fragrances that are also distributed through these channels.
Currently, Guess operates 336 stores in the United States and Canada, 24 stores
in Europe and 3 stores in Mexico. Guess is very focused on constantly growing
and expanding their operations in the retail industry. During 2006 they opened a
total of 32 new stores and are planning to open 48 news stores in the year 2007.
Guess’ total revenue for 2006 totaled 1.19 billion dollars and net earnings totaled
123.2 million dollars. The table below demonstrates Guess’ recent success in
growth through sales and the increase in total assets.
2002 2003 2004 2005 2006
Total
Assets
$349,532 $362,765 $424,304 $633,374 $836,925
Sales $583,139 $636,585 $729,262 $936,092 $1,185,184 ** Assets and Sales in thousands**
Total Sales for the 2006 fiscal year was $1,185,184,000.00 which was a 21.02%
increase from the previous year. This increase in sales was nearly 4.2 percentage
points better than their closest competitor (AE 16.9%). This trend seems to be
holding true so far in 2007 with Guess having a sales growth rate of 26.6%
which is 6.3 percentage points better than American Eagle. (20.3%)
(Moneycentral.msn.com)
9
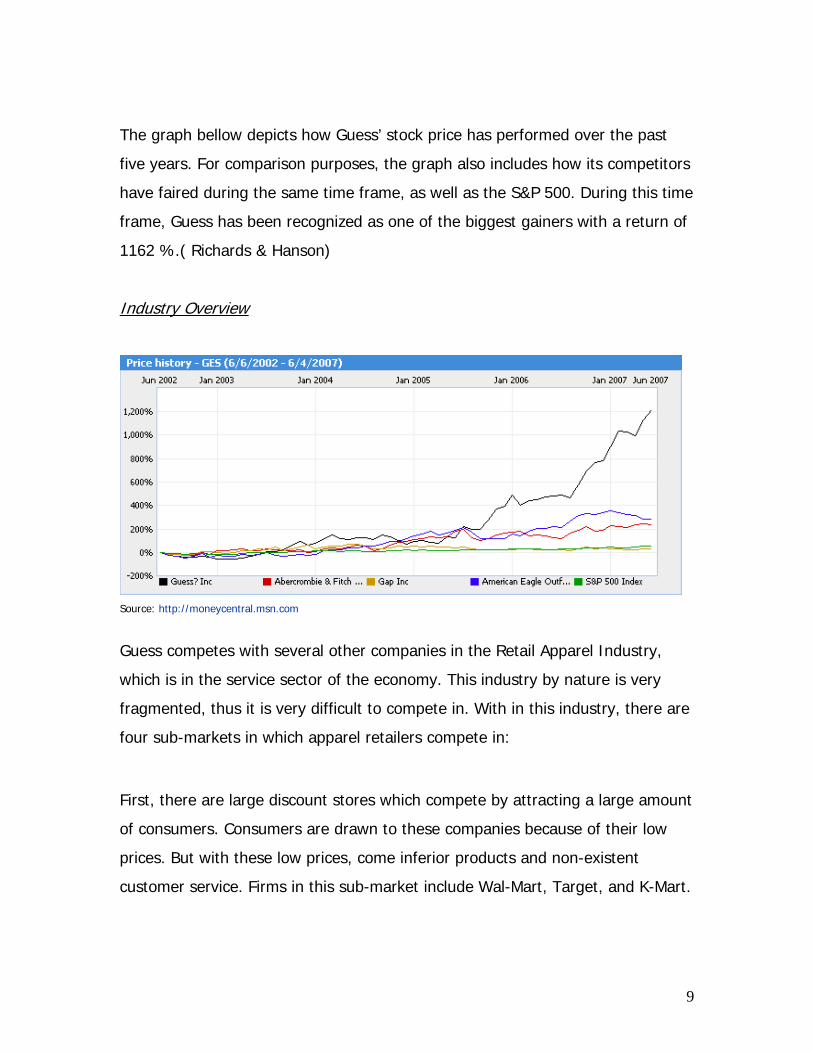
The graph bellow depicts how Guess’ stock price has performed over the past
five years. For comparison purposes, the graph also includes how its competitors
have faired during the same time frame, as well as the S&P 500. During this time
frame, Guess has been recognized as one of the biggest gainers with a return of
1162 %.( Richards & Hanson)
Industry Overview
Source: http://moneycentral.msn.com
Guess competes with several other companies in the Retail Apparel Industry,
which is in the service sector of the economy. This industry by nature is very
fragmented, thus it is very difficult to compete in. With in this industry, there are
four sub-markets in which apparel retailers compete in:
First, there are large discount stores which compete by attracting a large amount
of consumers. Consumers are drawn to these companies because of their low
prices. But with these low prices, come inferior products and non-existent
customer service. Firms in this sub-market include Wal-Mart, Target, and K-Mart.

10
The next sub-market is composed of mass merchandisers. Consumers are drawn
to them because they offer quality products at reasonable prices with fair
customer service. Participants in this market are primarily department stores like
Kohl’s, JC Penney, and Mervyn’s.
Another sub-market in the retail apparel industry is the upscale mass
merchandiser. These companies offer luxurious products and superior customer
service. Consumers of this division are willing to pay a premium for products and
service because of the prestige and status that is associated with shopping at
these companies. Firms associated in this market include Neiman Marcus,
Nordstrom’s, and Sac’s 5th Avenue.
The final sub-market in the retail apparel industry is the specialty retail division.
What makes this division so unique is that the retailers also provide their own
clothing line and accessories to sell. They offer quality differentiated products at
reasonable prices with fair customer service with their own flare. This is the
division in which Guess competes in. Consumers of this division typically range
from male and female teens to adults in their early 30’s. Consumers are attracted
to this division because they are brand image conscious and like the
differentiated products that firms produce. Companies in this division are direct
rivals to Guess and include Abercrombie and Fitch, American Eagle, and Gap.
Five Forces Model
The five forces model is a strategic market analyzing tool that enables firms to
analyze their specific industry and use its knowledge to create a competitive
edge over competing firms in the industry. The five forces model uses five
competitive forces to determine attractiveness to the industry, and the ability to
generate a profit. The five forces is composed of the threat of substitute
products, the threat of new entrants, rivalry among existing firms, and the

11
competitive bargaining power of both buyers and suppliers. The apparel industry
is a highly competitive industry, divided into smaller sub-markets such as men’s
and women’s clothing, and accessory apparel.
Rivalry Among Existing Firms
Rivalry among existing firms is one of the biggest sources of competition in an
industry, with firms all competing for the available profits created in the market.
The analysis of the existing firms allows a company to evaluate the level of
competition between the major players with in an industry and come to a
decision on how to create a competitive advantage. “In being a specialty retail
entity, we compete with numerous apparel manufacturers and distributors, both
domestically and internationally, as well as several well-known designers,
including some that have recently entered or re-entered the designer denim
market” (GUESS?, INC. 10k).
Guess Jeans Inc. competes on several different platforms in the retail industry,
allowing them to be very versatile in tapping into the fashion market. Guess
retail and outlet stores compete with a wide variety of other specialty retailers,
such as Gap, Abercrombie & Fitch, and American Eagle. Among these firms,
there are several factors that determine the degree of competition between
existing players in this industry.
Industry Growth
Industry growth helps a corporation determine the available share of the market,
as well as the level of competition with in the industry. If an industry is steadily
growing, companies do not have to compete for each others market share. The
apparel industry is a constantly growing market, with new fashions and styles
12
leading the way to new, evolving product markets. In 2006, GUESS opened a
total of 32 new stores in the United States and Canada alone, as well as
increasing their average retail outlet square footage by 5.3%. This shows that
the demand in the market is still high enough to satisfy their needs for growth
and increasing profits.
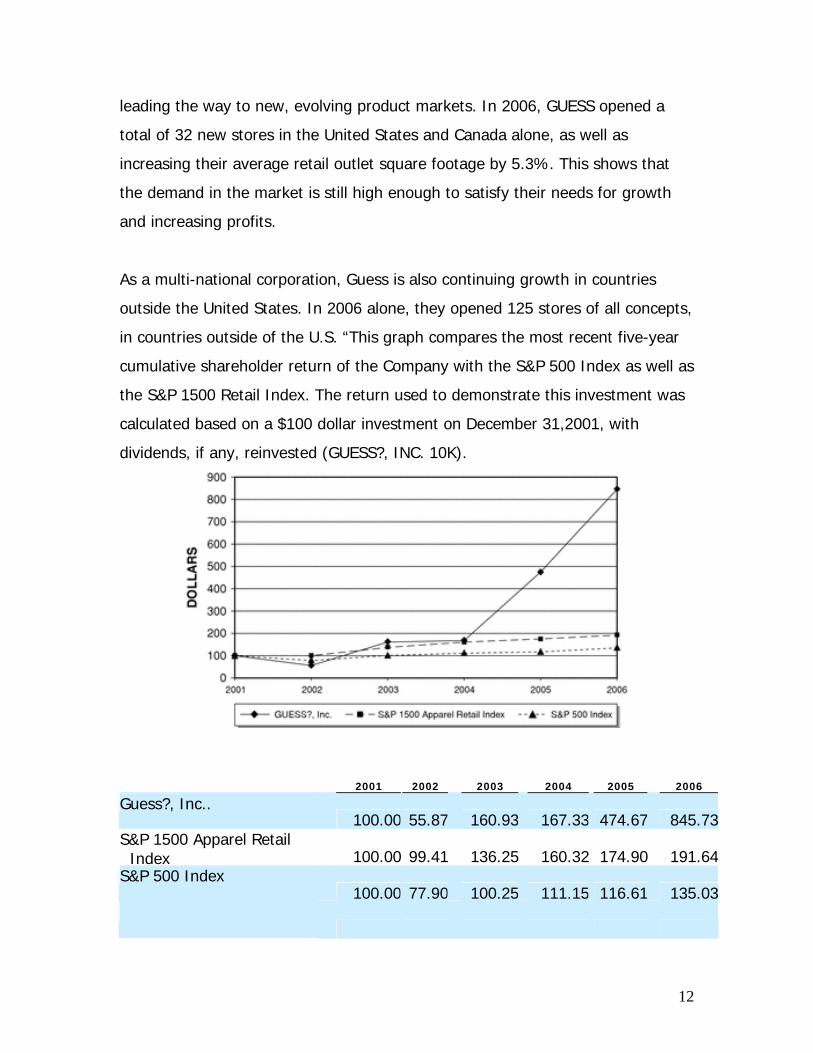
As a multi-national corporation, Guess is also continuing growth in countries
outside the United States. In 2006 alone, they opened 125 stores of all concepts,
in countries outside of the U.S. “This graph compares the most recent five-year
cumulative shareholder return of the Company with the S&P 500 Index as well as
the S&P 1500 Retail Index. The return used to demonstrate this investment was
calculated based on a $100 dollar investment on December 31,2001, with
dividends, if any, reinvested (GUESS?, INC. 10K).
2001
2002
2003
2004
2005
2006
Guess?, Inc..
100.00
55.87
160.93
167.33
474.67
845.73S&P 1500 Apparel Retail
Index
100.00
99.41
136.25
160.32
174.90
191.64S&P 500 Index
100.00
77.90
100.25
111.15
116.61
135.03

13
As you can see, the S&P Apparel Retail Index has been steadily increasing since
2001, with Guess significantly outperforming the index in the recent years. This
demonstrates to us that the Apparel industry is growing, allowing firms not to
engage in price competition.
The following graph shows the sales growth for the industry with in the past five
years. Based on the information, the industry is still experiencing growth from
year to year.
Percentage Sales Grwoth
0.00%
2.00%
4.00%
6.00%
8.00%
10.00%
Years
Perc
ent
Series1
Series1 8.65% 8.98% 6.49% 5.54% 5.32%
2002 2003 2004 2005 2006
We can also see that the industry is growing by assessing the assets of the
companies. By doing this, you can analyze the changes in total assets which
equates to growth or decay for firms in an industry. The graph bellow shows that
most of the firms within this industry are growing. However, Gap assets have
been decreasing for the past three years.

14
Total Assets
02000000400000060000008000000
1000000012000000
2002 2003 2004 2005 2006
Year
Tota
l A
sset
s(th
ousa
nds
ofdo
llars
)
Gap American EagleAbercrombie & Fitch Guess
Sources: www.gap.com, www.ae.com, www.abercrombie.com, www.guess.com
Gap’s diminishing assets correlates with the loss of market share that Gap has
also experienced over the past few years. This can also explain the very strong
growth that Guess and its other competitors have experienced over this five year
span. To help illustrate this situation, we used total sales to see how much of
their market share has been relinquished to its competitors over the past five
years. The graphs bellow illustrates the situation.
Market Share 2002
80%
8%
9%3%
Market Share 2006
69%
12%
14%5%
Sources: www.gap.com, www.ae.com, www.abercrombie.com, www.guess.com

15
In 2002, Gap held 80% of the market share, while American Eagle held 8%,
Abercrombie & Fitch held 9%, and Guess occupied 3% of the market share. Four
years later, Gap had relinquished 11% of its market share to its rivals. American
Eagle has increased its market share to 12%, while Abercrombie & Fitch
increased to 14%, and Guess saw an increase to 5%.
In 2007 we saw a significant slowdown in the retail/apparel industry. Many
economists argue that the downturn in the housing market as well as rising gas
prices has affected consumer spending, decreasing sales on non-commodity
items. “April was rough also for mall-based specialty stores. Gap Inc. reported a
16% same-store sales decline. Abercrombie & Fitch Co. said results will fall
below analysts' forecasts. American Eagle missed Wall Street expectations, with
a 10% decline in same-store sales, but it reaffirmed its first-quarter earnings
outlook of 34 to 35 cents a share (James Covert, WSJ, May 11, 2007).”
American Eagle credits their late increase due to the coming summer months, a
time when new fashions and styles are released into the market. These numbers
demonstrate the cyclical nature of the retail market. Increases and decreases in
net sales can be affected industry wide by availability of consumer spending as
well as other fashion related issues such as weather.
This graph shows the Net Sales (in Millions) of some of the leading competitors
in the retail industry today. With all but one of the companies reporting a loss, it
16
is easy for us to analyze and foresee events in the economy that would lead to
slowdowns in the retail industry.
Concentration and Balance of Competitors
The number of firms that compete in an industry and their relative sizes
determine the degree of concentration in an industry (Palepu 2-3). The amount
of concentration that is present in an industry influences whether competing
firms will co-ordinate their pricing to avoid price competition between firms.
Retailers are commonly positioned close to each other, either in shopping malls
or large strip centers. This highly concentrates the industry, with individual
retailers each competing for customers in a similar area. When an industry is
highly concentrated, it is dominated by a few key players, allowing them to
influence the market and help prices to remain fairly stable. When the market is
in low concentration, there is no large firm to establish pricing standards, and
firms will begin to compete on a “lowest cost” basis.
As previously mentioned, there are many different sub-markets in the apparel
market. Guess as well as their competitors try to differentiate themselves from
that type of genre, and focus more on the high end side of the clothing
spectrum. This “specialty” clothing sector of the market is less concentrated. This
allows them to focus on a client basis that relies more on brand name value, and
the quality and style associated with this sector.
Degree of Differentiation and Switching Costs
The degree of differentiation between products refers to the similarities those
different items in the same market share. If a product line can differentiate itself

17
from the other items in its genre, it can separate itself and not allow themselves
to become a common substitute for other items in its industry.
When Guess focuses on its customer base, individuals range in age from 18-32.
They also target both males and female consumer. In addition, Guess targets a
style-conscious customer that they believe to posses a significant disposable
income. By focusing on superior quality and features that can help a customer
focus on brand recognition, their product is able differentiate itself from other
products and avoid price competition. Guess accomplishes this by encompassing
business wear as well as the latest styles appealing to a slightly older customer
base.
This marketing strategy helps differentiate themselves from their most common
competitors Abercrombie & Fitch and American Eagle. These companies seem to
focus on a slightly younger, more laid back genre ranging from the ages of 15-25
(americaneagle.com; abercrombie.com). These companies do not do a good job
at differentiating themselves from one another. The lack of differentiation is
evident because it is difficult to distinguish products from Abercrombie & Fitch,
American Eagle, and Aeropostle. Abercrombie also faces additional problems
because it has not been successful at differentiating itself from the other apparel
lines that they offer such as Hollister and RUEHL. This has caused lower than
expected sales for the first quarter of 2007(MacNeally).
Switching costs relate to the cost the consumer will undertake in switching
between different items in the same market. Because of the nature of this
industry, switching costs for customers is generally low. In a market where
success is dominated by new and evolving fashion trends, a company is forced to
remain competitive by introducing new fashions and clothing styles. Consumers
of this market tend to switch between competitors in an industry quite
frequently; this forces competition for the target market to remain high. Since
18
the beginning, Guess has focused on superior product quality and style. They
believe the customer views a slightly higher price as a sign of quality, tending to
focus more on innovations in style and quality then to compete on a price basis.
Fixed-Variable Costs/Scale Economies
The methods a firm uses in its production and sales operations determines the
amount of money a company invests in developing its products, which is directly
related to consumer prices paid. In the specialty retail industry, fixed costs tend
to be low, with variable costs remaining high. This remains true at Guess for
many reasons.
Because of the cyclical nature of the business, certain times of the year can
remain stagnant while others can significantly increase in sales. Guess handles
this by striving to keep fixed costs relatively low. They do this by choosing not to
purchase land sites for stores, but to instead engage in operating leases.
Outsourcing is also a significant part of this strategy. Together, these methods
allow them to retain a reasonably low fixed to variable cost ratio. According to
Guess’ 10-K, they were able to lower their Selling, General, and Administrative
cost down 230 basis points. They credited this improvement because of better
leveraging of fixed cost in all areas.
By outsourcing product manufacturing and leasing retail sites, they keep their
fixed costs low at times when the apparel market is down, allowing them to pick
up production and increase spending only at times when the market demands it.
These measures are common in the retail industry, with Abercrombie & Fitch,
Gap, and American Eagle all leasing their retail sites, with most commonly being
located in shopping malls and large retail centers. By utilizing these strategies

19
retailers significantly reduce the markets competitive pressures as well as price
competition in the market.
Excess Capacity and Exit Barriers
Exit Barriers exist in an industry when companies have specific merchandise and
machinery that is difficult to liquidate, making it more costly to exit the industry
than to remain in and accept a loss. Because of the constant changing of fashion
styles accompanied with the different styles of clothing associated with the
seasons, liquidating inventory is a common practice of retail stores. This problem
is solved by large sales and discount promotions, usually 4 times a year. This
gives a company the chance to halt production, not replenishing inventory, and
to exit the industry. The increased competition affects negatively the other
incumbents. Incumbents’ profits are potentially lower than in a true competitive
market. These frequent opportunities for turnover accompanied by the common
practice of outsourcing production make the barriers of exit relatively low.
Excess Capacity deals with the notion that when supply grows in excess of
demand, companies must reduce prices and compete amongst each other for
market shares. This also leads the problem of unsold merchandise, resulting in a
loss of profit. Inventory liquidation, via large sales and discount promotions, are
also used to combat this problem. When the market seems slow, for instance at
a period in between seasons, retail companies will simply liquidate inventory for
a lower cost, generating less profits or sometimes breaking even. In the clothing
specialty retailer industry is a great amount of competition because every
clothing company is constantly changing their image and clothing styles to reflect
the current trends of seasonality or ever day wear. For instance, if you into an
typical clothing company in the spring time, they might have a sales rack selling
jackets, sweaters, etc. from the previous fall season on sale for considerably less

20
then what you could have bought it for in the actual fall season. Companies in
this industry must rely on inventory management to produce a profit. If they
don’t sell enough of their products then they will have to use an excess capacity
strategy by selling their products for less then what originally predicted. If you
find your company constantly having to use excess capacity in selling your
products then you will find that you will have to close down your store or
relocate. In this industry you see a lot of store closure or relocation in places like
malls, shopping centers, etc. mostly due to this excess capacity concept.
In conclusion, the degree among the competition of existing firms in the
specialty retail industry is very high. Close competitors are marketing to similar
customer bases, in close proximity to each other. This forces them to create
profits by differentiating themselves through style and image. These firms are
also competing among each other regarding price, yet in the specialty retail
subsidiary of the apparel market, price competition is not as highly focused on in
relation to cost competitive retailers such as Wal-Mart and Target.
Threat of New Entrants
The threat of new entrants deals with the idea that large profits in an industry
will attract new firms into the industry, shaving away profits from the existing
players in the market. There are several factors that decipher the level of
competition an industry has in regards to new entrants entering a market and
reducing a company’s market share.
Economies of Scale/Learning Economies
Companies that enter into a new market must compete with the smaller
manufacturers as well as the large staple companies in the industry. This could

21
be difficult on many levels for a company that is trying to generate a profit early
on in its company life.
Economies of scale deals with the idea that as a company begins to produce
more and more of a product, the price per unit of each item will effectively drop
as a result of a mass scale production operation. As we know, decreasing the
price of production for an item allows a company to reduce its prices more,
competing on a cost basis and forcing companies to lower their prices as well to
stay competitive.
This situation could be very difficult for a start up company to overcome because
they will have to possess a large amount of initial equity to be able to enter into
the market a competitive force. A company could try to enter the market with
less than optimum capacity, but this will force them to compete on a level of
product quality and consumer knowledge.
This is a difficult task in an industry where gaining a successful customer base
requires knowledge of customer styles, expectations, and the nature of the
business. The graph bellow shows total assets for Guess and its competitors over
the past five years. Based on this information, a start up company would have to
possess a large amount of assets to compete with existing firms. Based on these
numbers, it would probably be unrealistic for a start up firm to possess that
much in assets.

22
Total Assets
02000000400000060000008000000
1000000012000000
2002 2003 2004 2005 2006
Year
Tota
l A
sset
s(th
ousa
nds
ofdo
llars
)
Gap American EagleAbercrombie & Fitch Guess
Guess was formed in 1981 and possess 26 years of experience. This experience
has given them valuable knowledge of their customers, information regarding
business and manufacturing prices, and learning what works and what does not.
Seasoned firms use their knowledge of cyclical demands as well as new and
upcoming fashions to create and maintain a strong customer base resulting in
profit. New entrants into a market will struggle to adapt to find the right
customer base and learn what it takes to be successful in the specialty-retail
industry.
First-Mover Advantage
Since its conception in 1981, Guess Jeans has been a well recognized retailer in
the apparel industry. In the fashion industry brand recognition is a prevailing
factor that leads to the success of a company. This will inherently lead to a first-
mover advantage among companies in the industry. As a retailer becomes
seasoned in the market, it will gather a customer base that identifies the brand
name as being cool, stylish and as having exceptional quality. All of these factors

23
will result in brand loyalty and a strong customer base. It will be very difficult for
a start up company that has just entered into the market to compete with
retailers such as Guess, Abercrombie & Fitch, American Eagle, and Gap who are
recognized by consumers by their brand name and trademark style.
Access to Channel Distributions and Relationships
Since many retailers in the industry today outsource their manufacturing
responsibilities, it is very important that a company have access to these
distribution channels and obtain a positive professional relationship with them.
When outsourcing a product, quality will obviously become an issue a firm has to
deal with because even though they are not directly behind the creation of their
product, it is ultimately the retailers’ responsibility to produce a quality product
that is in line with the companies’ brand name, and that will be attractive to the
consumer. Without positive relationships with suppliers, a company can fail to
put out a quality product that is necessary to generate product in the specialty
market. Shipments must be timely and correct to compete with the cyclical
changes in fashion as well as the constantly changing clothing lines of similar
competitors. A new entrant into the industry will have to correctly identify a
reliable supplier and maintain a relationship with them that will allow them to
market a quality product and to remain efficient.
New entrants face this dilemma because there are limited suppliers in the market
place. So when there is a new entrant in the market, they are competing with
bigger firms who have bigger accounts with these suppliers. Suppliers will want
to please their bigger clients first. As a result, new entrants will find it harder to
get their products in a timely manner. In addition, their quality of product might
suffer because suppliers will rush to get their products to them in a timely
manner.

24
Legal Barriers
The retail industry has almost no legal barriers to entry. Trademarks of
companies tend to be the most restrictive barriers to new entrants. These
trademarks do not allow a company to mimic or reproduce products that are
directly related to a companies’ trademarked logo. This allows a company to
remain new and innovative in the industry, and not to be threatened by
competitors attempting recreate another retailers clothing line.
In conclusion, the threat of new entrants into the specialty-retail sector of the
apparel market is relatively low. New entrants into the market will have to deal
with the difficult issues of economies of scale, a large first-mover advantage, as
well as attaining efficient and reliable distribution channels.
The Threat of Substitute Products
Obviously in an industry such as clothing, substitute products will be very evident
in the market. Retailers in the specialty-retailing sector of the apparel market will
have to differentiate themselves from the rest of the pack, and look at factors
such as relative price and performance, as well as a buyers’ willingness to switch
from one product to another. Guess focuses on differentiated product designs
and styles they believe will separate themselves from the rest of the retail
industry. Because consumers tend to relate a higher product cost to a higher
product quality, Guess focuses more on exceptional product quality rather than
creating a lower cost.
Another factor that might influence a customer purchasing substitute products is
the manner in which they shop for their products. Guess not only sells its
25
products in a traditional retail locations, but also offer their products via the
internet. This new selling channel will become more prevalent in future years as
the general population begins to trust the internet more and becomes more
computer savvy. This idea is supported by the fact that online sales have
continued to increase from year to year.
This is different from our competitors in the industry such as American Eagle and
Abercrombie. Although they are categorized as specialty-retailers, they focus
more on relaxed, leisure clothing, which can sometimes be associated with a
slightly lesser cost. Guess chooses to focus on a customer base that is willing to
spend a higher price for the latest designs in fashion and the highest clothing
quality.
In conclusion, the threat of substitute products in the clothing industry is high
because of the extreme variety a consumer can choose when purchasing
clothing. For an industry to be successful in retailing, they must focus on brand
image and quality to gather and retain a customer base and create a profit.
Bargaining Power of Buyers
Bargaining power of buyers is determined by two things in the Specialty Retail
industry, price sensitivity and relative bargaining power. In the Specialty retail
industry companies suck as Guess customers or buyers are very price sensitive
because they can easily switch over to competitors apparel if they offer they
same item at a lower price. So price wars among the retail industry can get very
severe at times. Due to the fact that one single buyer in a retail industry does
not consumer a significant amount of the companies apparel, losing a couple of
customers due to price changes will not harm the company. Basically companies
in the retail industry need to constantly make an effort to keep up with changing

26
trends in fashion and preferences among certain age groups to ensure that they
can compete on a competitive level and maintain a significant amount of market
share in their industry. Furthermore, since one single buyer does not consume
massive amounts of inventory they have little to none relative bargaining power
over the suppliers. This is also true because the switching cost is very low for the
buyer. In essence, in the specialty retail industry the customer has very low
bargaining power because the individual suppliers i.e. the stores are forced to
compete on cost due to low switching cost.
Bargaining Power of Suppliers
In the specialty retail industry firms attempt to buy their goods at the lowest
price possible, and this gives suppliers very little bargaining power over the
buyers because the buyers can opt to change suppliers very easily due to the
large volume of suppliers willing to offer the goods at a lower price. There are so
many different retail suppliers that buyers can have produce their product that
might offer a lower price that the supplier has relatively low bargaining power
over the buyer. Because Guess is a widely recognized brand name they do not
have to compete on quality but more so on cost and trying to differentiate
themselves from their competitors. The suppliers want to offer the lowest price
they can due to the easy with witch the buyer can switch suppliers. So the
suppliers are very price sensitive and this gives bargaining power to the buyer
because they don’t have to rely on one single supplier. Overall, the specialty
retail industry has to compete on price most of all due to all the reasons stated
above.
Value Chain Analysis
Firms in the specialty retail industry compete on differentiation. To be successful
while following a differentiation strategy the firm must accomplish three things.

27
First, it needs to identify one or more attributes of a product that customer’s
value. It must then position itself to meet these customer needs in a unique
way. Finally, firms must achieve differentiation while maintaining a cost below
the price premium that customers are willing to pay. Because the industry is
highly competitive firms must also take into account some cost leadership
strategies to maximize their potential advantage. There are several key success
factors which are vital to achieving and sustaining a competitive advantage in the
specialty retail industry.
Key Success Factors
Differentiation
The primary factor that separates firms in the specialty retail industry is a
distinguished image that customer’s value. Firms are able to accomplish this by
investing resources in their brand image. By creating a reputable image and
distinct design, firms are able to capture and retain a certain customer base.
Because firms in this industry are not competing solely on cost leadership it is
imperative that they invest in developing a unique product image to differentiate
themselves from competitors.
Another factor is the ability to produce a product of superior quality. The
products created must have a high perceived quality to gain any kind of
competitive advantage in the specialty retail industry. There are general market
expectations for a certain level of quality within the industry. Without meeting or
exceeding these standards a firm cannot expect to compete.
The ability to develop a superior product variety is another important success
factor. There is an opportunity to achieve further competitive advantage by

28
offering a larger variety of products. Firms accomplish this through the
expansion of current product lines, creation of new product lines, and selling
additional accessories. Engaging in such a strategy allows firms to expand their
customer base and further serve their current customer base.
Cost Leadership
Because the specialty retail industry is highly competitive and fragmented, firms
that follow a differentiation strategy cannot ignore the cost leadership dimension.
There is a price premium that will turn customers away from firms in the
industry, so it is important to find ways to reduce production costs where
possible. Areas that firms can focus on are low-cost distribution and efficient
production. This can allow a firm to reduce production costs without sacrificing
the product quality or brand equity that is necessary in a differentiation strategy.
Firm Competitive Advantage Analysis
Since its founding in 1981 as a small California jeans company, Guess has
developed into one the most familiar brand names in the fashion industry. The
specialty retail clothing and apparel industry has been classified as one of the
most highly competitive industries due to many swift variations of consumer
wants and interests. “Guess believes that its success depends in large part upon
its ability to anticipate, gauge and respond to changing consumer demands and
fashion trends in a timely manner and upon the continued appeal to consumers
of the Guess image.” (GUESS?, Inc. 2007 10-K)

29
Brand Image
The best way of achieving competitive advantage in this industry is to possess a
strong attribute in differentiating your products from your competitors. They
have achieved this by continually leveraging what they want their brand image to
represent. With their headquarters in Los Angeles, CA, they are constantly
visiting dominant fashion locations where their marketing teams can see what
the new styles are and get a glimpse of where they think the industry is headed.
Guess puts most of its effort into new product innovation and differentiation.
They have done this by utilizing a retail strategy that focuses on opening more
retail stores, while at the same time, constantly improving the quality of the
stores that already exist. The constant improvement of stores will keep the brand
image consist with the current trends of the period. This is a very simple, but
effective strategy of maintaining, capturing, and retaining a susceptible customer
base.
Guess has also correlated their brand image into an expansion and growth plan.
This expansion plan can be a way of building brand awareness and executing
market penetration. “During 2006, we opened a total of 32 new stores in the
U.S. and Canada consisting of eight new full-price retail stores, seven factory
outlet stores, 11 MARCIANO stores and six Guess Accessories stores, while
closing 11 stores. Guess expects to open approximately 48 new stores in 2007,
consisting of 15 full-price retail, four factory outlet, 13 MARCIANO stores, three
Guess Accessories and 13 G by Guess stores.”(GUESS?, Inc. 10-K)
Internationally, Guess acquires licensees and distributors in Europe, South
America, Asia, Africa and the Middle East. If Guess can effectively establish itself
as a defiant manufacturer and distributor, it can take advantage of economies of
scale and further expand its operations abroad. Guess needs to be competitive
with constant expansion and growth. The more exposure in the market, the
more consumers will want to buy your products.

30
Superior Product Quality
Guess strives to offer products that are superior in quality. To ensure that
products meet the desired standards Guess has implemented a quality control
program. This program allows them to monitor the quality of the fabrics being
used prior to the production of a final product, and inspect prototypes of each
product before initiating production runs. Another aspect of the program is
random quality control checks during and after production before garments leave
the contractor. There are also final random quality checks after the products
have been received by the distribution centers. Guess believes that this policy of
inspection is important in maintaining quality and consistency in its products.
The quality control program allows Guess to produce a product of superior
quality which conforms to their strategy of differentiation.
Superior Product Variety
To achieve product variety Guess is placing additional emphasis on their
Accessories line and their MARCIANO line. Guess plans to direct greater
attention to these lines in existing stores as well as open additional stores that
exclusively feature these products. This strategy targets current Guess
customers while also aiming to capture new customers. By focusing on
developing superior product variety, Guess has enabled them to significantly
expand. In 2006 there were six Guess Accessories and 11 MARCIANO stores
opened. The previous year there were six Guess Accessories and nine
MARCIANO stores opened.
Another way that Guess is expanding their product variety is introducing a new
mid-tier brand concept. G by Guess targets a more price conscious
demographic. In early 2007 Guess will open the first G by Guess store in North
America. By the end of the year the expectation is to have approximately 32 G
31
by Guess locations. The product variety that Guess has pursued is essential to
the differentiation strategy that is necessary to gain a competitive advantage in
the specialty retail industry.
Efficient Production
To increase efficiency Guess has made improvements in their product sourcing.
In the past year, changes streamlined processes, provide calendar alignment,
and increase the timeliness of delivery. “This globalization of operations will
enable us to begin integrating our European, North American and Asian-based
supply chains. This, in turn, supports our long term strategy of developing a
global core product assortment, through collaboration between our U. S. and
Italy based design teams.” (GUESS?, Inc. 10-K) To assist the design process,
Guess has formed a Product Development team that dictates calendar deadlines,
assortment plans, and financial goals. These steps have allowed Guess to
increase the efficiency and lower the cost of production.
Low-Cost Distribution
Guess’ primary distribution center is located in Louisville, Kentucky. The site is
near the United Parcel Service’s national transit hub. (GUESS?, Inc. 10-K) This
had allowed the company to reduce shipping time and costs of distributing goods
to the Eastern part of the United States. Guess projects that it will continue to
reduce operating cost by reducing handling costs in this facility. The company
has also updated software systems in the Montreal and Los Angeles distribution
facilities to align with the systems used in the primary facility. This has resulted
in further operating efficiencies. The goal of these actions is to reduce future
processing and freight costs. (GUESS?, Inc. 10-K)

32
Looking Forward
Guess has been successful at creating a distinguished brand and valued product
lines within the specialty retail industry. By differentiating themselves from
competitors and maintaining competitive prices they have achieved a competitive
advantage. This has allowed Guess to expand domestically and internationally.
In 2006 Guess increased retail average square footage by 5.3%. Sales in 2006
were up 12.8% from the previous year. They plan to open 108 new stores in
2007 and further expand through international acquisitions. They are regularly
implementing new strategy and innovation to increase and sustain their
competitive advantage in this highly competitive industry.
Accounting Analysis
To thoroughly and properly analyze a firm and be able to value it with a high
degree of certainty, one must perform an accounting analysis to understand the
true underlying meaning of the numbers and ratios present in the financial
statements. The process of accounting analysis involves six key steps.
First, you need to identify the Key accounting policies which entails
understanding the policies and estimates the firm uses to implement their key
success factors to their business. A firm’s industry characteristics and competitive
advantage strategy both determine what makes up their key success factors and
risks. One of the goals of a company should be to evaluate their key success
factors and risks and how they plan to take advantage of success factors and to
avoid risks. As for a company like Guess in the Retail Sector Inventory
Management is a major key success factor.

33
Second, the degree of accounting flexibility needs to be assessed and this
directly relates to the amount of flexibility allowed through (GAAP) standards. A
company with a high degree of flexibility might be able to present their financial
statements in a more clear way in relation to their key success factors, and vice
versa if there is not a sufficient amount of flexibility.
The third step involved is evaluating the actual accounting strategy that the
managers of the firm use. From the previous step we know that managers have
the ability to manipulate financial figures. For this reason we must carefully
examine the accounting strategy that the firm implements. The fourth step is to
evaluate the quality of disclosure because the extent to which managers can
disclose their information can vary greatly across companies making financials
either transparent or very difficult to use in assessment of the firm.
The fifth step is to identify potential red flags such as unexplained increases or
decreases on the financial statements. This is done bye looking at the 10-Q’s for
a company. Many companies will defer expenses in the fourth quarter to the first
quarter of the following year. By doing this, companies incomes will be
overstated. Last, as an analyst if distortions are discovered they need to attempt
to undo the red flags to enhance the credibility and true underlying meaning of
the companies financials.
Key Accounting Policies
In determining a company’s key accounting policies it is imperative the
companies’ key success factors match up with the key accounting policies that
they company uses. As previous discussed in our companies five forces model a
company in the specialty retail industry like Guess has to create value through
tight cost control or cost leadership. There are many ways that a company can
manipulate their financials to make it seem as if costs are being lowered, which
looks pretty to investors, but as an analyst it must be explored to find the actual

34
reason for cost being lowered. Flexibility in (GAAP) enables this type of problem
to occur.
There are four distinctive qualities that are used in valuating a firms accounting
policy, each one bring more light to how the firms accounting is effecting their
overall performance. These qualities include reporting for Inventory methods,
Depreciation methods, Goodwill treatments, and Property, plant, and equipment
(PPE) valuations.
For evaluating inventory methods, you want to find out which method for
accounting for inventory the company actually used. Decipher whether the
company decided to use FIFO, LIFO, Weighted Average, etc. for their inventory
analysis. Out of these methods, you need to decide under which method the
company has the most flexibility to make their company look the best to an
investor. If they used one method over the other determined what the company
is really worth by working another method to compare it to the company’s
desired method.
Using the depreciation method of a company is also another way to determine
where there is flexibility for a company to make themselves look good. Whether
a company used straight-line method, declining balance method, or sum-of-years
digits method can make a big difference in determining how a company is really
performing. Once you determine which one they used, I would as beginning
investor would find out why the company picked that method, compare it all the
other methods and see how the company is performing.
Goodwill is the difference between the purchase price and the book value of an
acquired company’s assets. All U.S. firms are required to capitalize and amortize
goodwill against income for financial statements and deny them any tax
deductions for the amortization. Some companies get around this policy by

35
conducting a comprehensive estimation to determine assets being acquired by
both tangible and intangible. Then a depreciation deduction can be rationalized
with an established individual value and a limited life. Some company’s use this
method and some of them use the GAAP standard for accounting for goodwill,
the only way to determine whether the company is doing this or not is to look at
their journal entries on the financial statements.
Property, Plant, and Equipment (PPE) are the physical assets the company owns
but can't quickly convert to cash. Depending on the type of business, this may
make up a large portion of total assets. Whether it does or not depends on how
the company allocates for its PPE. Identify, whether it possesses a lot of land
and separate assets used in agricultural activity or if its productive assets held by
entities in the other industries. These qualities are very important in evaluating a
company. Using these methods will shine light on how a company makes itself
look to investors and what characteristics it does not want you know about.
Another key accounting policy is how a company reports on its building assets,
which can be either of the two options, capital or operating leases. Capital leases
will increase a company’s asset which directly increases owner’s equity on the
balance sheet. The use of operating leases is a more aggressive approach
because it attempts to decrease liabilities. In guess’s case they use both
operating and capital leases. Their operating leases only recognize the current
years rent as a liability rather than the life of the asset, so for the next five years
using a discount rate of 8.5% investors are seeing that liabilities are understated
by 4million making the company look like it is in better financial condition than it
really is. In other words this should be the true present value of the future
payments.
Another key accounting policy is how a company reports on its building assets,
which can be either of the two options, capital or operating leases. Capital leases

36
will increase a company’s asset which directly increases owner’s equity on the
balance sheet. The use of operating leases is a more aggressive approach
because it attempts to decrease liabilities. In guess’s case they use both
operating and capital leases. The use of operating leases has a major influence
on how companies financial appear to investors. By capitalizing all of Guess’s
operating leases we have determined that Guess must make an adjustment of
$388,532 to their liability section of the balance sheet. The discount factor that
we used was 3.8% which is not stated in the companies 10-K. This is probably
because the number observed is even lower than the risk-free rate which would
never feasibly happen. This forecast will give investors a more honest picture of
Guess’s true financial standing in the future.
Year Operating Lease PMT PV
Factor PV 2007 77,515 0.963 74677.262008 72,251 0.928 67057.782009 66,752 0.894 59685.972010 56,164 0.861 48380.312011 46,762 0.830 38806.662012 22,820 0.799 18244.482013 22,820 0.770 17576.572014 22,820 0.742 16933.112015 22,820 0.715 16313.212016 22,820 0.689 15716 2017 22,820 0.663 15140.66
TOTAL 388,532 Areas of Accounting Flexibility
All companies are required to prepare their consolidated financial statements in
conformity with Generally Accepted Accounting Principles. This requires
management to make estimates and assumptions which affects the amounts of
assets, liabilities, revenues and expenses during the reporting period.
Accounting rules allow flexibility because it is difficult to restrict management

37
discretion without reducing the information content of accounting data. For this
reason it is possible for corporate managers to introduce noise and bias into data
through their accounting decisions. Managers have a variety of incentives to
exercise their discretion to achieve certain objectives. Guess has disclosed
significant accounting polices which they believe involve a higher degree of
judgment and complexity. These disclosed policies are those for which GAAP has
left room for accounting flexibility and managers have choices in the way that
they disclose financial information. In the following areas Guess’ is less
constrained by accounting standards and conventions.
Guess recognizes retail operations at the point of sale and wholesale operations
revenue from the sale of merchandise when products are shipped. There is
room for accounting flexibility within GAAP standards when it comes to the way
that management recognizes sales returns. Guess accrues for estimated sales
returns and other allowances in the period in which the related revenue is
recognized. To recognize the impact of returns, Guess estimates the amount of
goods that will be returned based on historical experience and reduces sales and
cost of sales accordingly based on historical return experience. The change in
sales returns accruals decreased gross profit by $3.3 million at December 31,
2006 (Guess 2006 10-K). Management can manipulate the amount of allowance
for returns to affect the net income. An understated allowance for returns
results in overstated sales and thus overstated net income.
Guess leases their showrooms, advertising, licensing, sales and merchandising
offices, remote distribution and warehousing facilities and retail and factory
outlet store locations under non-cancelable operating lease agreements expiring
on various dates through January 2018 (GUESS? Inc. 10-K). Guess reports both
operating leases and capital leases however capital leases only account for 4.4%
of their total lease agreements. When a lease is capitalized the building is
booked as an asset and the firm can recognize depreciation and amortization

38
benefits. The benefit of having a large percentage of lease agreements remain
operating leases is that the expenses incurred are not fully recognized. This
understatement of expenses leads to an overstated net income and more
appealing financial outlook for the firm. The decision not to capitalize leases
allows the firm to understate liabilities, receive tax benefits, and overstate
equity. This aggressive accounting strategy allows managers to distort balance
sheet entries to make a companies financials look more appealing to investors.
Guess assesses the impairment of its long-lived assets such as goodwill,
intangible assets, and property and equipment which requires the company to
make assumptions and judgments regarding the carrying value of these assets
on an annual basis, or more frequently if events or changes in circumstances
indicate that the assets might be impaired (GUESS? Inc. 10-K). If the assets are
considered to be impaired, the impairment is recognized as the amount by which
the carrying value of the assets exceeds the fair value of those assets. There is
a great deal of flexibility in this policy because managers have discretion in
assigning carrying value to impaired assets. As of December 2006 Guess
reported goodwill of approximately $28 million and gross intangible assets as of
December 2006 were $24.8 million. Assessing the value of goodwill is highly
subjective because the company determines the fair value to be reported and
compares it to its carrying amount. Management is capable of overstating assets
or understating expenses which both result in overstatement of net income and
equity.
Since there is a certain degree of flexibility allowed in GAAP standards, these
policy choices provide managers with an opportunity to significantly impact the
numbers reported on the performance of a firm. Without this flexibility however,
accounting data are likely to be less informative for understanding the firm’s
economics. For these reasons we must critically evaluate the firm’s actual
accounting strategy to accurately evaluate their financial outlook.
39
Accounting Strategy Using the methods demonstrated in the key accounting policies, the accounting
strategy focuses on accounting flexibility and how they use this flexibility to
either communicate their firm’s economic situation or to hide their true
performance. Because of GAAP, managers have flexibility in their accounting
methods. They can use various accounting methods to help communicate the
company’s financial health, or they can use it to distort true performance. The
methods in which they use are conservative, moderate, or aggressive by nature.
A firm that uses a conservative accounting approach will not have as high a net
income as a firm with an aggressive approach. This is because firms that have an
aggressive accounting approach will manipulate anything to get their income as
high as they can. The approach that Guess uses is a combination of aggressive
and conservative accounting methods which correlate into their accounting
strategy.
When reporting their inventory, most companies use the First In – First Out
Method (FIFO). This means as a business purchases its inventory, holds the
inventory, and finally sells the inventory the first group of purchases will be
taken off the books first. (Mangan 2000) This method is considered to be
aggressive because it artificially inflates net income in an inflationary economy.
On the other hand, American Eagle uses the retail method. In this method,
“markdowns are fully accounted for in the month in which they have been taken.
It assumes most of the markdowns apply to good sold and therefore that few of
those goods are a part of the ending inventory.” (www.cfpsa.com) This method
is considered moderate by nature.
Like many retailers in our industry, Guess offers its customers the opportunity to
purchase gift cards for friends, family, and loved ones. In 2005, Guess accounted

40
for 8,460 of store credits and gift certificates. In 2006, Guess accounted for
10,705 of store credits and gift certificates which means there was a 2,245
increase in store credits and gift certificates in the year of 2005. The Company
defers all revenues related to gift certificates “cards” and store credits until they
are redeemed for merchandise. Based on prior redemption experience, the
Company does not recognize unredeemed balances prior to two years from the
date of issuance. The breakage income is subsequently recognized ratably into
operating income over a four-year period. Once this benchmark is met, the
unused portions are recognized into the operating income over a four year
period. This is considered a conservative method of accounting because
revenues are not recorded until they can be matched with their expenses.
One of Guess’ buildings is tied down to a capital lease and the remaining of their
facilities are tied down into operating leases. A capital lease is where the value of
the building is booked as an asset and the asset is depreciated over the lifetime
of the building. The lease payments are booked as a liability and decrease over
the life of the asset. Capital leases give more information on the financial
statements because it books all future lease payments for the asset as a liability.
If Guess had all of their facilities on a capital lease, it would paint a much more
accurate picture of how the company is doing financially. Capital leases recognize
expenses sooner than equivalent operating leases. In an operating lease, the
owner transfers only the right to use the property to the lessee. At the end of
the lease period, the lessee returns the property to the owner. Since the lessee
does not assume the risk of ownership, the lease expense is treated as an
operating expense in the income statement and the lease does not affect the
balance sheet. In a capital lease, the lessee assumes some of the risks of
ownership and enjoys some of the benefits. Consequently, the lease, when
signed, is recognized both as an asset and as a liability (for the lease payments)
on the balance sheet. The firm gets to claim depreciation each year on the asset
and also deducts the interest expense component of the lease payment each

41
year. In general, capital leases recognize expenses sooner than equivalent
operating leases ( pages.stern.nyu.edu).
However, Guess chooses to put the majority of their facilities into operating
leases. By using the operating leases, Guess only has to recognize the current
years rent as a liability. Guess has the future contractual rights to the properties
for at least 15 years thus these expenses should be classified as a liability. By
choosing operating leases over capital leases, Guess is allowed to keep a present
value amount of about $338 million of liability off of its balance sheet. This
practice of using operating leases is not just isolated to one firm in this industry.
As a matter of fact, Gap, Abercrombie & Fitch, and American Eagle all use
operating leases for their respected facilities. In operating leases, the lease
expense is treated as operating expense in the income statement, so it stays off
of the balance sheet. This is very significant to the effect that it is not reported
on the balance sheet and ultimately does not affect any value on it. The value
stated on the balance sheet is larger with the lease not stated on it then it would
be stated if the lease was to be added onto it. This accounting method is
considered to be very aggressive in nature, and is used by retailers in this
industry because it makes the companies in this industry much more attractive to
lenders and investors.
As you can see, the accounting methods in which a company uses can have a
substantial impact on the financial statements. Just by choosing to use operating
leases over a capital leases for their facilities, Guess was able to understate their
liabilities by over $338 million dollars. In addition, the FIFO method in which
Guess employs with its inventory produces a net income that is overstated.
Overall the various accounting methods Guess deploys make their accounting
strategy aggressive because of activities in reporting their inventory methods,
gift certificates, depreciation methods, goodwill treatment, property, plant, and
equipment, and their operating and capital leases.
42
Quality of Disclosure
Guess is a publicly traded company which means it must report its financial
standings to the SEC yearly in a document called the 10-K. The 10-K is a
collection of all the companies’ financial statements and management’s
discussion and analysis which is audited before being handed over to the SEC.
Managers determine how easy or hard it is for anyone to assess the firm’s
accounting quality. They possess considerable power over what they determine
should be disclosed and what should not be disclosed on the financial
statements. The quality of disclosure is very important because accounting rules
require a certain amount of information to disclose, but the information that the
mangers of the company discloses is exactly what you want to see. You must
determine whether this information is biased or not.
Qualitative
Qualitative information is individual narrative reports of experiences. Qualitative
information is gathered with methods that are personal, direct, and open-ended,
with very few constraints on what the answers to the questions may be. These
methods include formal research methods. It was found that Guess does a very
good job of presenting their information in their 10-K through their financials and
management discussion and analysis in a very clear manner. Most companies in
the retail industry use operating leases. Guess does a good job of disclosing
clearly whether they function using operating or capital leases. Most companies if
they do use both will attempt to only make the operating leases clear so that
liabilities do not look as high, but Guess was very credible in this area of
disclosure.

43
Furthermore, the quality of disclosure regarding how they account for sales
return reserves, pension benefit plan, and valuation of goodwill, everything is
clearly disclosed and supported with more than enough information for an
investor to gain a fair and true understanding of the business and its operations.
Another item that increases Guess’s credibility when it comes to reporting their
financial statements is they paint a very clear understanding of why there were
increases or decreases in different line items on the financials due to changes in
(GAAP), or changes in the operations of the company.
The only item that might seem slightly sketchy is they method they use to
account for inventory, which is, first in first out. This is considered an aggressive
approach as opposed to last in last out if there is inflation over the previous fiscal
year. And there is inflation of around 3.5% with almost every year that passes.
So the use of the FIFO method we assume is being used to increase revenues.
On the contrary, FIFO is acceptable to use under (GAAP) due to the flexibility, so
the company cannot be looked down upon for using this method in its entirety.
Quantitative
Quantitative information is very important to look at when evaluating a firm. This
type of information usually falls under a few categories in a company’s activities.
Social security, personal retirement accounts, payroll taxes, pensions, stock
trends, and bonds all fall under being analyzed as quantitative information.
Quantitative data and analysis is assessed using pure form data and numbers to
draw conclusions on the quality and disclosure of a company’s financials. The
conclusions drawn are more accurate because the decisions are based upon
factual numbers. The ratios on the graphs below will help to gain a better
understanding of core sales manipulation and core expense manipulation to
better understand the business and its competitors.

44
Potential “Red Flags”
From the information provided by Gap’s quarterly’s, it can be established that
Guess is making large fourth-quarterly adjustments on their books. When Guess
filed their 10-Q on 11/09/05, they reported an increase to selling, general, and
administrative expenses of $23.5 million, or 46.9%, equaling $79.0 million in the
three months ended October 1, 2005, from $53.7 million in the comparable 2004
period, primarily attributable to the increase in European operations. On their
05/11/06 10-Q filing, they reported another increase of $10.5 million, or 15.7%,
to $77.6 million in the first quarter ended April 1, 2006, from $67.1 million in the
comparable 2005 period, primarily due to increased costs in the European
operations, the incremental costs to run an average of 25 net new stores in
North America and additional compensation expenses, including the impact of
expensing options in accordance with the new accounting rules. This also
suggests that Guess could have been forced to make adjustments to their end of
the year results due to increased pressure from their external auditors. If Guess
is consistently making drastic fourth-quarter adjustments to their financial
statements, this means their accountants are operating under an aggressive
accounting management of interim reporting.
Undoing Accounting Distortions
When an analyst sorts through all of the financial statements, they will normal
find errors in reporting or aggressive accounting practices that affect the balance
sheet, income statement, or statement of cash flows. Once the analysis is done,
the analyst must make changes as they see fit to get a more accurate
assessment of the company.

45
As stated above, the only main issue that needed to be adjusted was converting
the operating leases to a capital lease. In conclusion Guess Jeans Inc. remains
competitive in regards to this ratio, and reveals to us that it is consistent with the
industry in regards to relating its cash flow from operations to its net operating
assets, and investing in operating assets wisely. This would not be considered a
“red flag” in their accounting policies.
Financial Analysis
Core Sales Manipulation Diagnostics
Sales manipulations diagnostics are a series of ratios designed to let you know if
you can believe a companies net income. More specifically, it enables you to
compare net sales to various revenue related accounts, such as, cash from sales,
net account receivables, and inventory. The following ratios were used to analyze
Guess and their competitors over the past five years. The tables provide an
industry average and compare Guess against their competitors in the industry.
This can help to identify potential red flags and help to gain a clearer
understanding of the current accounting policies in place.
Most of the companies in this industry do a good job of collecting cash from their
sales. In the specialty retail industry most of revenue over the past five years
analyzed comes from cash over those same years. For Guess a third party takes
on the responsibility of guess’s accounts receivables and Guess, is compared with
the cash. Therefore, accounts receivables directly related to customers never
appears on the balance sheet. Thus, the Net Sales/Cash from Sales ratio stays
relatively close to one.
Out of all the firms in the specialty industry that we compared to Guess, Guess
has the highest amount of credit sales. If they had the lowest amount of credit

46
sales they would have more cash to use in operating activities. But overall as a
whole the specialty retail industry does a relatively good job of collecting cash on
sales.
The net sales/inventory ratio for the past five years has increased then
decreased or leveled out. This pattern is fairly consistent with the industry;
Guess is the industry leader in this area of analysis. This means that their
inventory is stable and cost efficient.
Core Sales Manipulation Diagnostics
Net Sales/Cash from Sales
0.96
0.98
1
1.02
1.04
1.06
2002 2003 2004 2005 2006
Year
Net
Sal
es/C
ash
from
Sa
les
American Eagle Abercrombie and Fitch
Guess Jeans Inc. GAP
Most of the companies in this industry do a good job of collecting cash from their
sales. In the specialty retail industry most of revenue over the past five years
analyzed comes from cash over those same years. For Guess a third party takes
on the responsibility of guess’s accounts receivables and Guess, is compared with
the cash. Therefore, accounts receivables directly related to customers never
appears on the balance sheet. Thus, the Net Sales/Cash from Sales ratio stays
relatively close to one.

47
Net Sales/Net Accounts Recievable
0
50
100
150
200
250
2002 2003 2004 2005 2006
Year
Net
Sal
es/N
et
Acc
ount
s R
ecie
vabl
e
Abercrombie and Fitch Guess Jeans Inc.
American Eagle Corporation
Out of all the firms in the specialty industry that we compared to Guess, Guess
has the highest amount of credit sales. If they had the lowest amount of credit
sales they would have more cash to use in operating activities. But overall as a
whole the specialty retail industry does a relatively good job of collecting cash on
sales.
Net Sales/Inventory
0
5
10
15
2002 2003 2004 2005 2006
Year
Net
Sal
es/In
vent
ory
Guess Jeans Inc. Abercrombie and Fitch
American Eagle GAP
The net sales/inventory ratio for the past five years has increased then
decreased or leveled out. This pattern is fairly consistent with the industry;

48
Guess is the industry leader in this area of analysis. This means that their
inventory is stable and cost efficient.
Core Expense Manipulation Diagnostics
While the sales manipulation diagnostics are used to measure the accuracy of
net income, the expense manipulation ratios are a series of ratios that measure
aggregate expenses. These ratios help analyst test the accuracy of aggregate
expenses of a company.
Declining Asset Turnover
0.00
0.50
1.00
1.50
2.00
2.50
Year
Sale
s/A
sset
s
Abercrombie and Fitch Guess Jeans Inc. American Eagle GAP
Abercrombie and Fitch 1.60356023 1.23465457 1.49977851 1.5559496 1.47600494
Guess Jeans Inc. 1.66834224 1.75481372 1.71872525 1.4779451 1.41611733
American Eagle 1.97364633 1.63014283 1.46069946 1.44612054 1.40600327
GAP 1.8 1.46 1.48 1.62 1.82
2002 2003 2004 2005 2006
The asset turnover ratio measures net sales divided by total assets. This ratio is
useful to determine the amount of sales that are generated from each dollar of
assets. Companies with low profit margins tend to have high asset turnover,
those with high profit margins have low asset turnover. For companies in the
retail industry you would expect a very high turnover ratio mainly because of

49
competitive pricing (www.investopedia.com). Over the past 5 years Guess has
seen very slight fluctuations in their asset turnover ratio. This movement is very
consistent with the industry average and is not worthy of a red flag.
Changes in CFFO/OI
-10
-5
0
5
10
Year
CFF
O/O
I
Guess Jeans Inc. American Eagle Abercrombie and Fitch GAP
Guess Jeans Inc. -1.30400247 1.129059946 0.610200103 1.415062165 -0.12128754
American Eagle -4.11800851 -5.18794666 1.437898785 4.916230902 5.849040991
Abercrombie and Fitch 1.352801787 2.618552876 4.937040413 0.152770588 1.114683751
GAP 1.61 1.39 1.39 1.28 1.55
2002 2003 2004 2005 2006
The cash flow from operations ratio is used to determine the extent to which
cash flow differs from the reported level of operating income. It is a check on
the quality of a company’s earnings. It is better measure of a company’s profits
than earnings, because a company can show positive net earnings and still not
be able to pay its debts. If this ratio is substantially less than one or decreasing
cash flow problems are likely (www.valuebasedmanagement.com). Guess’ cash
flow from operations ratio has been up and down over the past 5 years. In 2002
and 2006 the ratio was negative. This is a potential red flag because it indicates
that Guess’ cash resources are poor.

50
Changes in CFFO/NOA
-80-60-40-20
0204060
Year
CFF
O/N
OA
Guess Jeans Inc. Abercrombie and Fitch American Eagle
Guess Jeans Inc. 2.44047894 -2.4014167 46.372549 2.18065396 -0.5461861
Abercrombie and Fitch 2.154012 0.20836339 1.42552071 0.23544932 0.46139465
American Eagle 10.7250718 2.57865153 30.0769294 -62.432619 5.50418359
2002 2003 2004 2005 2006
Cash flow from Operations is the main source of cash generation for a
corporation. It demonstrates the amount of cash that a company generates
internally, as opposed to external activities such as financing and investing. By
dividing this number by Net Operating Assets, such as property plant and
equipment and other working assets, we can analyze how much cash flow from
operations is being generated for every dollar unit that is being spent on working
assets. American Eagles ratio has drastically decreased following 2004 while
Abercrombie and Fitch has remained almost constant in the past four years.
Guess Jeans Inc. has performed well in this category, maintaining a level ratio
with our competitors from 2002-2003, and then separating itself from the pack in
2004-2005, then again leveling out with our competitors in the following years.
The systematic declining of the ratios from 2004-2005 reveals a possible industry
wide slow-down of the market, this could explain the common decrease in cash
flow from operations.

51
Total Accruals
-5
0
5
10
15
Year
Tota
l Acc
rual
s/C
hang
e in
Sal
es
Guess Jeans Inc. Abercrombie and Fitch American Eagle GAP
Guess Jeans Inc. 0.225262222 -1.02271452 -0.85231503 -0.70203065 -0.56696722
Abercrombie and Fitch 5.651425322 12.12997432 5.096521537 3.053371633 5.128882532
American Eagle 0.972523619 1.055836134 0.577103379 0.680413587 -0.7660309
GAP -0.02 -0.03 -0.03 -0.07 -0.05
2002 2003 2004 2005 2006
The total accruals are defined as earnings before discontinued operations and
extraordinary items less operating cash flows. An increase in accruals from one
period to the next may indicate management is attempting to manipulate
earnings through its discretionary authority over accrual policy. This ratio shows
that as sales increase/decrease, the amount of accruals should be consist with
the number of sales received throughout the year.
Looking at the graph, it can be stated that Abercrombie and Fitch’s Total
Accruals/Change in Sales plotted line ratio has considerably higher ratios then
American Eagle and Guess. This suggests that they either acquire more sales
then American Eagle and Guess each year or they possess a lot more accruals
then they can account for sales. American Eagle and Guess Total Accrual/Change
in Sales ratios seem to be in a relevant of range of each other implying they are
very competitive of each other and their accruals do not outweigh their account
for sales by a substantial amount.

52
Forecasting
Since value is determined by all future cash flows provided by company,
forecasting is crucial when determining the firm’s present value. The best way to
forecast future performance is to comprehensively produce an earnings, cash
flow, and balance sheet forecasts. To make these forecasts more accurate, it is
essential to look at the firms financial statements for the past five years to see if
there are any trends that have developed over time. We also looked at several
ratios to assist us in our forecast. After looking into the past, we can look into
the firm’s future with more certainty. We forecasted Guess’ financial statements
for the next ten years.
Income Statement
When beginning to forecast Guess’ financial statements, we started off by
forecasting their income statement. The first item of concern was forecasting
sales. Historically, Guess has been increasing sales by an average of 18.61%
each year since 2002. This growth rate is on par with how the industry has been
doing during this time frame. However, stronger than expected sales during the
first quarter of 2007 has shifted many analyst opinions about Guess’ growth
potential for the remaining of 2007 and the future. During the first quarter, sales
for Guess have increase by 26.6%. With these optimistic numbers, analysts have
predicted that Guess would continue its strong performance and beat Wall
Streets expectations for the year (Nag & Chakrabarty). Keeping with the current
trends, we grew Guess’ sales by 27% for the remainder of 2007. For the next
five years, we predict that Guess’ will continue to experience this rapid rate of
growth until sales grows to 29.5% in 2011. We believe that Guess will
experience this growth for the next five years as it opens more stores and gains
more market share. After these five years, Guess will have increased its market
share from 5% to about 11% and American Eagle and Abercrombie & Fitch

53
would have a market share of about 20% each. Gap’s market share would have
decreased by 20% in five years. Since everyone is on a more level playing field
five years down the road, we believe that Guess’ growth will slow down and
head toward the industry growth rate of 15%.
When forecasting Cost of Goods Sold (COGS), we noticed that COGS amount for
about 56% of total sales. However, this number has been decreasing over the
past six years. Keeping in line with what some of the competitors COGS is as a
percentage of sales, we predict that Guess will continue to head toward the
industry norm of about 51% over the next ten years.
When forecasting earnings from operations, we noticed that on the common size
income statement for Guess that earnings from operations have increased over
the past three years to 16.29% of total sales in 2006. We expect this trend to
continue until earnings from operations reaches about 24%. This falls in line with
what the industry leaders like Gap and Abercrombie & Fitch maintain.
When forecasting interest expense, we calculated that interest expense would
increase over the next five years due to the fact that many new stores are
expected to be opened in the near future. After that, we believe that their
interest expense would go back down to levels that they have recently enjoyed.
To get net income, we noticed that net income was about 10% of total sales. We
applied this method when computing net income. The following depicts our
prediction:

54
Actual Financial Statements Forecast Financial StatementsINCOME STATEMENT 2001 2002 2003 2004 2005 2006 2007 2008 2009 2010 2011 2012 2013 2014 2015 2016 2017
Net revenue:Product sales 640,700 544,081 596,806 682,020 887,782 1,119,945Net royalties 36,920 39,058 39,779 47,242 48,310 65,239Total Sales 677,620 583,139 636,585 729,262 936,092 1,185,184 1,493,332 1,889,065 2,397,223 3,044,473 3,836,037 4,718,325 5,661,990 6,681,148 7,750,132 8,835,150 10,072,071Cost of product sales 447,825 383,806 416,430 455,278 555,223 665,805 806,698 994,593 1,283,713 1,650,105 2,077,214 2,504,015 3,043,320 3,491,568 4,018,443 4,427,294 5,058,194Gross profit 229,795 199,333 220,155 273,984 380,869 519,379 673,084 875,065 1,140,423 1,486,393 1,920,805 2,414,492 2,959,672 3,559,224 4,206,202 4,883,421 558,496,359Selling, general and administrative expenses 201,527 202,930 197,130 218,502 279,059 326,356Earnings from operations 23,829 (8,526) 20,600 55,482 101,810 193,023 290,154 392,737 536,259 720,018 843,161 1,026,236 1,211,666 1,389,679 1,600,402 1,802,371 2,059,739Other expense (income):Interest expense 12,705 9,444 7,974 5,653 6,741 7,450 11,648 18,324 28,767 47,189 64,445 68,416 69,076 71,488 69,751 62,730 6,949,729Interest income (100) (313) (134) (619) (2,626) (5,947)Other, net 482 (825) (26) (265) (4,477)
13,087 8,306 7,814 4,769 4,115 (2,974)Earnings before income tax expense and 50,713 97,695 195,997minority interestIncome tax expense 21,147 38,882 72,715Minority interest 114Net earnings 6,242 (11,282) 7,286 29,566 58,813 123,168 164,267 213,464 281,674 362,292 464,160 580,354 719,073 865,209 1,011,392 1,161,822 1,329,513Earnings per share (Note 19)Basic 0 (0) 0 0 1 1Diluted 0 (0) 0 0 1 1Weighted average shares outstanding Basic 43,656 43,392 43,279 88,020 88,774 90,618Diluted 43,958 43,392 43,558 89,088 90,118 92,074
Actual Financial Statements Forecast Financial StatementsCOMMON SIZE INCOME STATEMENT 2001 2002 2003 2004 2005 2006 2007 2008 2009 2010 2011 2012 2013 2014 2015 2016 2017
Total Sales 100.00% 100.00% 100.00% 100.00% 100.00% 100.00% 100.00% 100.00% 100.00% 100.00% 100.00% 100.00% 100.00% 100.00% 100.00% 100.00%Cost of product sales 66.09% 65.82% 65.42% 62.43% 59.31% 56.18% 54.02% 52.65% 53.55% 54.20% 54.15% 53.07% 53.75% 52.26% 51.85% 50.11%Gross profit 33.91% 34.18% 34.58% 37.57% 40.69% 43.82% 45.07% 46.32% 47.57% 48.82% 50.07% 51.17% 52.27% 53.27% 54.27% 55.27%Selling, general and administrative expenses 29.74% 34.80% 30.97% 29.96% 29.81% 27.54%Earnings from operations 3.52% -1.46% 3.24% 7.61% 10.88% 16.29% 19.43% 20.79% 22.37% 23.65% 21.98% 21.75% 21.40% 20.80% 20.65% 20.40%Other expense (income):Interest expense 1.87% 1.62% 1.25% 0.78% 0.72% 0.63% 0.78% 0.97% 1.20% 1.55% 1.68% 1.45% 1.22% 1.07% 0.90% 0.71%Interest income -0.01% -0.05% -0.02% -0.08% -0.28% -0.50%Other, net 0.07% -0.14% 0.00% -0.04% -0.38%
1.93% 1.42% 1.23% 0.65% 0.44% -0.25%Earnings before income tax expense and 6.95% 10.44% 16.54%minority interestIncome tax expense 2.90% 4.15% 6.14%Minority interest 0.01%Net earnings 0.92% -1.93% 1.14% 4.05% 6.28% 10.39% 11.00% 11.30% 11.75% 11.90% 12.10% 12.30% 12.70% 12.95% 13.05% 13.15%

55
Income Statement (Revised) The income sheet above would have been sufficient if Guess did not use
operating leases. So, we must adjust the income statement to reflect this
discrepancy. To do this, we took the earnings from operations and subtracted
depreciation and interest expense. By doing this, operating expenses decrease
more than loss from interest and depreciation. Thus, the overall result was an
increase in net income. The following depicts this situation.
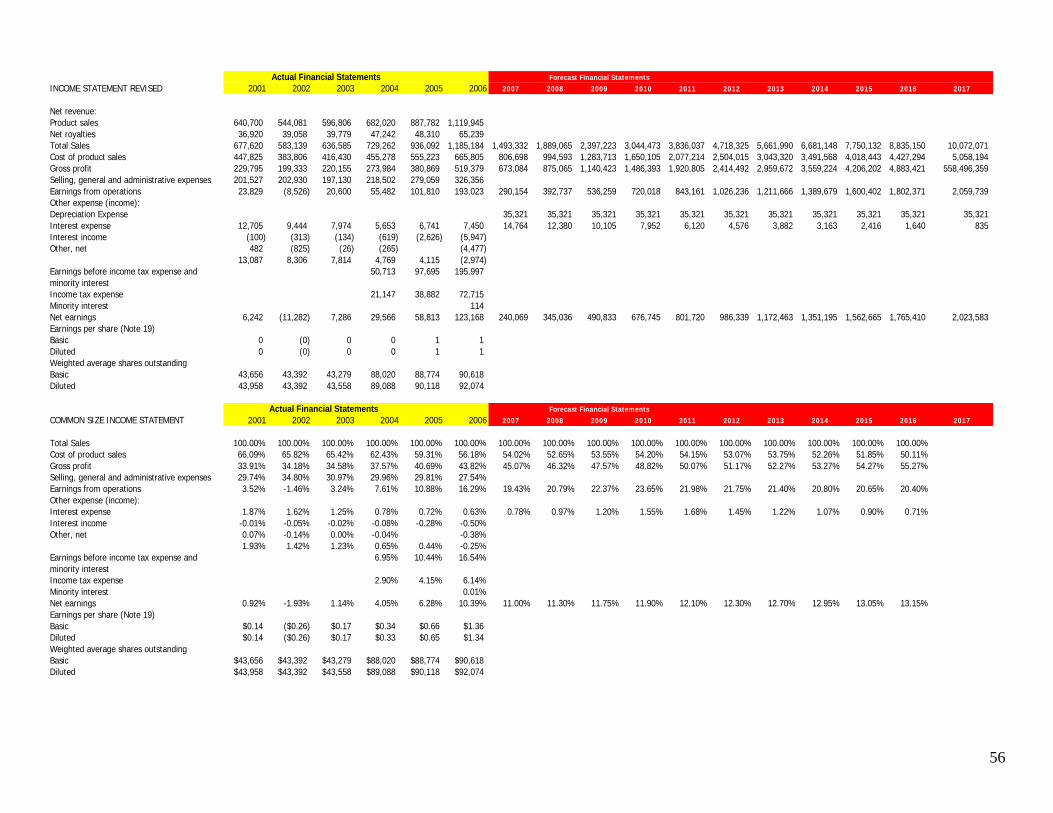
56
Actual Financial Statements Forecast Financial StatementsINCOME STATEMENT REVISED 2001 2002 2003 2004 2005 2006 2007 2008 2009 2010 2011 2012 2013 2014 2015 2016 2017
Net revenue:Product sales 640,700 544,081 596,806 682,020 887,782 1,119,945Net royalties 36,920 39,058 39,779 47,242 48,310 65,239Total Sales 677,620 583,139 636,585 729,262 936,092 1,185,184 1,493,332 1,889,065 2,397,223 3,044,473 3,836,037 4,718,325 5,661,990 6,681,148 7,750,132 8,835,150 10,072,071Cost of product sales 447,825 383,806 416,430 455,278 555,223 665,805 806,698 994,593 1,283,713 1,650,105 2,077,214 2,504,015 3,043,320 3,491,568 4,018,443 4,427,294 5,058,194Gross profit 229,795 199,333 220,155 273,984 380,869 519,379 673,084 875,065 1,140,423 1,486,393 1,920,805 2,414,492 2,959,672 3,559,224 4,206,202 4,883,421 558,496,359Selling, general and administrative expenses 201,527 202,930 197,130 218,502 279,059 326,356Earnings from operations 23,829 (8,526) 20,600 55,482 101,810 193,023 290,154 392,737 536,259 720,018 843,161 1,026,236 1,211,666 1,389,679 1,600,402 1,802,371 2,059,739Other expense (income):Depreciation Expense 35,321 35,321 35,321 35,321 35,321 35,321 35,321 35,321 35,321 35,321 35,321Interest expense 12,705 9,444 7,974 5,653 6,741 7,450 14,764 12,380 10,105 7,952 6,120 4,576 3,882 3,163 2,416 1,640 835Interest income (100) (313) (134) (619) (2,626) (5,947)Other, net 482 (825) (26) (265) (4,477)
13,087 8,306 7,814 4,769 4,115 (2,974)Earnings before income tax expense and 50,713 97,695 195,997minority interestIncome tax expense 21,147 38,882 72,715Minority interest 114Net earnings 6,242 (11,282) 7,286 29,566 58,813 123,168 240,069 345,036 490,833 676,745 801,720 986,339 1,172,463 1,351,195 1,562,665 1,765,410 2,023,583Earnings per share (Note 19)Basic 0 (0) 0 0 1 1Diluted 0 (0) 0 0 1 1Weighted average shares outstanding Basic 43,656 43,392 43,279 88,020 88,774 90,618Diluted 43,958 43,392 43,558 89,088 90,118 92,074
Actual Financial Statements Forecast Financial StatementsCOMMON SIZE INCOME STATEMENT 2001 2002 2003 2004 2005 2006 2007 2008 2009 2010 2011 2012 2013 2014 2015 2016 2017
Total Sales 100.00% 100.00% 100.00% 100.00% 100.00% 100.00% 100.00% 100.00% 100.00% 100.00% 100.00% 100.00% 100.00% 100.00% 100.00% 100.00%Cost of product sales 66.09% 65.82% 65.42% 62.43% 59.31% 56.18% 54.02% 52.65% 53.55% 54.20% 54.15% 53.07% 53.75% 52.26% 51.85% 50.11%Gross profit 33.91% 34.18% 34.58% 37.57% 40.69% 43.82% 45.07% 46.32% 47.57% 48.82% 50.07% 51.17% 52.27% 53.27% 54.27% 55.27%Selling, general and administrative expenses 29.74% 34.80% 30.97% 29.96% 29.81% 27.54%Earnings from operations 3.52% -1.46% 3.24% 7.61% 10.88% 16.29% 19.43% 20.79% 22.37% 23.65% 21.98% 21.75% 21.40% 20.80% 20.65% 20.40%Other expense (income):Interest expense 1.87% 1.62% 1.25% 0.78% 0.72% 0.63% 0.78% 0.97% 1.20% 1.55% 1.68% 1.45% 1.22% 1.07% 0.90% 0.71%Interest income -0.01% -0.05% -0.02% -0.08% -0.28% -0.50%Other, net 0.07% -0.14% 0.00% -0.04% -0.38%
1.93% 1.42% 1.23% 0.65% 0.44% -0.25%Earnings before income tax expense and 6.95% 10.44% 16.54%minority interestIncome tax expense 2.90% 4.15% 6.14%Minority interest 0.01%Net earnings 0.92% -1.93% 1.14% 4.05% 6.28% 10.39% 11.00% 11.30% 11.75% 11.90% 12.10% 12.30% 12.70% 12.95% 13.05% 13.15%Earnings per share (Note 19)Basic $0.14 ($0.26) $0.17 $0.34 $0.66 $1.36Diluted $0.14 ($0.26) $0.17 $0.33 $0.65 $1.34Weighted average shares outstanding Basic $43,656 $43,392 $43,279 $88,020 $88,774 $90,618Diluted $43,958 $43,392 $43,558 $89,088 $90,118 $92,074

57
Statement of Cash Flows
To compute cash flows from operation, we took net income and added back
depreciation. It is essential to add back depreciation because it is an accounting
method to account for the loss of value of an asset. This is necessary because
cash does not physically leave the firm. By doing this, you can get a more
accurate description of Guess’ cash flow.
So to project that depreciation and amortization expense will go up
proportionately with the rate that Guess is expanding their operations. For this
reason we analyzed the trend over the past five years and predict that
depreciation and amortization expense will be 3.5% of total sales. This number
is consistent with the amount of depreciation incurred over the past several
years. The following demonstrates our findings.

58

59
Cash Flow Statement Actual Financial Statements Forecast Financial Statements
2001 2002 2003 2004 2005 2006 2007 2008 2009 2010 2011 2012 2013 2014 2015 2016 2017Cash flows from operating activities:Net earnings 6,242 -11,282 7,286 29,566 58,813 123,168 182933 268654 373562 466314 596957 673900 923233 1167603 1287165 1514891 1329513Adjustments to reconcile net earningsto net cash provided by operating activities:Depreciation and amortization of property 39,751 37,727 34,924 34,975 32,364 35,309 41,481 52,267 66,117 83,903 106,557 134,261 165,141 198,170 233,840 271,255 309,320and equipment 0 0 0 0 0 0Amortization of intangible assets 1,271 252 20 467 2,275 2,745Stock-based compensation expense N/A N/A N/A 968 1,175 6,739Deferred income taxes 1,480 -8,867 5,013 -1,244 -25,658 -5,441Net (gain) loss on disposition of long-term 797 8,152 3,034 136 1,195 -970assets and property and equipmentOther items, net 211 362 1,639 2,665 -2,729 -369Minority interest N/A N/A N/A N/A N/A 114Changes in operating assets and liabilities:Receivables -6,117 5,063 2,835 -21,313 18,145 -52,073Inventories 48,115 422 12,153 1,201 -25,009 -25,177Prepaid expenses and other assets 9,868 -370 -6,717 -1,871 3,505 -4,128Accounts payable and accrued expenses -29,838 -1,870 6,796 23,624 40,116 53,983Long-term deferred rent and lease incentives N/A N/A N/A 10,335 3,406 2,548Long-term deferred royalties N/A N/A N/A 4,250 39,174 -1,418Other long-term liabilities N/A N/A N/A N/A 2,544 3,223Net cash provided by operating activities 71,780 29,589 62,474 83,759 149,316 138,253 224,415 320,921 439,679 550,217 703,514 808,161 1,088,374 1,365,772 1,521,005 1,786,145 1,638,833

60
Statement of Cash Flows (Revised) To revise the statement of cash flows, we had to add the depreciation expense
that correlated with the operating lease. We also had to use the net income from
the revised income statement. The result is that cash flows increased because of
the increase in net income. The following illustrates our findings:

61
Cash Flow Statement REVISED Actual Financial Statements Forecast Financial Statements
2001 2002 2003 2004 2005 2006 2007 2008 2009 2010 2011 2012 2013 2014 2015 2016 2017Cash flows from operating activities:Net earnings 6,242 -11,282 7,286 29,566 58,813 123,168 240,069 345,036 490,833 676,745 801,720 986,339 1,172,463 1,351,195 1,562,665 1,765,410 2,023,583Adjustments to reconcile net earningsto net cash provided by operating activities:Depreciation and amortization of property 39,751 37,727 34,924 34,975 32,364 35,309 29,619 29,619 29,619 29,619 29,619 29,619 29,619 29,619 29,619 29,619 29,619and equipment 0 0 0 0 0 0Amortization of intangible assets 1,271 252 20 467 2,275 2,745Stock-based compensation expense N/A N/A N/A 968 1,175 6,739Deferred income taxes 1,480 -8,867 5,013 -1,244 -25,658 -5,441Net (gain) loss on disposition of long-term 797 8,152 3,034 136 1,195 -970assets and property and equipmentOther items, net 211 362 1,639 2,665 -2,729 -369Minority interest N/A N/A N/A N/A N/A 114Changes in operating assets and liabilities:Receivables -6,117 5,063 2,835 -21,313 18,145 -52,073Inventories 48,115 422 12,153 1,201 -25,009 -25,177Prepaid expenses and other assets 9,868 -370 -6,717 -1,871 3,505 -4,128Accounts payable and accrued expenses -29,838 -1,870 6,796 23,624 40,116 53,983Long-term deferred rent and lease incentives N/A N/A N/A 10,335 3,406 2,548Long-term deferred royalties N/A N/A N/A 4,250 39,174 -1,418Other long-term liabilities N/A N/A N/A N/A 2,544 3,223Net cash provided by operating activities 71,780 29,589 62,474 83,759 149,316 138,253 269,688 374,655 520,452 706,364 831,339 1,015,958 1,202,082 1,380,814 1,592,284 1,795,029 2,053,202

62
Balance Sheet
The first item that we forecasted on the balance sheet was total assets. To forecast
this, we used our sales to assets ratio to determine assets. We used 1.42 that we
computed for the ratio and carried it out for the forecasted years. To accomplish this,
we just divided total forecasted sales by 1.42.
The next thing that we forecasted was stockholders equity. We accomplished this by
taking net income and dividing by our R.O.E. R.O.E. for the industry has been
consistently around 30% for the industry. By doing this, we were also able to get total
liabilities. Because A=L+E, we just now take assets minus equity to get total liabilities.
When forecasting total current assets, we noticed that total current assets were about
65% of total assets in recent history. We believe that this trend will continue because
many firms in the industry are hovering around 61-63% over the past few years as
well. Since these numbers have maintained consistent over the past few years, we will
continue to forecast current assets as 65% of total assets.
The same principle was used when forecasting current liabilities. Current liabilities have
historically averaged around 65% of liabilities varying within a few percentage points.
When forecasting accounts payable, historical data suggest that there is not a trend
because they are up and down from year to year. However this data gives us a nice
range when estimating future accounts payable. In years past, accounts payable has
range from 24% of current liabilities to 30%. We then chose to go with the median of
27%. The following demonstrates our findings:

63

64
BALANCE SHEET ACTUAL FINANCIAL STATEMENTS Forecast Financial Statements2001 2002 2003 2004 2005 2006 2007 2008 2009 2010 2011 2012 2013 2014 2015 2016 2017
ASSETSCurrent assets:Cash and cash equivalents 31,870 31,753 67,163 106,003 171,549 220,344Receivables, net 40,500 35,437 32,602 53,915 81,762 133,406Inventories 96,105 95,683 83,530 82,329 122,037 165,232 201,389 248,505 324,469 421,938 497,604 602,085 749,217 821,028 964,946 1,054,618 1,184,532Prepaid expenses and other current assets 10,141 11,278 13,341 14,516 16,231 21,741Deferred tax assets 10,420 14,836 9,499 10,600 16,439 18,169Total current assets 189,036 188,987 210,644 271,023 408,018 558,892 683,826 865,040 1,118,929 1,460,061 1,843,999 2,244,416 2,659,778 3,151,723 3,673,843 4,198,895 4,752,315Property and equipment, net 145,385 128,097 114,403 113,944 144,007 164,262Goodwill 0 0 11,610 11,610 20,623 28,004Other intangible assets, net 0 0 0 0 11,282 18,532Long-term deferred tax assets 0 0 16,244 16,984 37,226 43,084Other assets 28,042 32,448 9,864 10,833 12,218 24,151Total Noncurrent Assets 173,427 160,545 152,121 153,371 225,356 278,033 367,816 465,288 569,256 683,935 857,435 1,078,348 1,327,539 1,553,310 1,783,996 2,023,042 2,340,693Total Assets 362,463 349,532 362,765 424,304 633,374 836,925 1,051,642 1,330,327 1,688,185 2,143,995 2,701,434 3,322,764 3,987,317 4,705,034 5,457,839 6,221,937 7,093,008LIABILITIES AND STOCKHOLDERS EQUITYCurrent liabilities:Current installments of notes payable, 7,609 80,138 13,931 13,430 35,051 34,357long-term debt and capital lease obligationsAccounts payable 47,933 44,460 44,888 58,158 87,711 117,339 133,074 163,352 198,255 250,696 312,054 375,322 429,977 489,262 560,603 634,581 670,647Accrued expenses 38,231 42,963 52,056 61,211 94,464 132,200Total current liabilities 93,773 167,561 110,875 132,799 217,226 283,896 328,305 408,456 494,594 618,087 763,495 918,292 1,059,280 1,202,013 1,379,905 1,554,030 1,766,037Notes payable, long-term debt and capital 80,119 1,480 54,161 41,396 53,199 18,018lease obligations, excluding currentinstallmentsLong-term deferred rent and lease incentives N/A N/A 14,947 25,282 28,688 31,236Long-term deferred royalties N/A N/A N/A N/A 43,423 35,008Other long-term liabilities 10,647 14,211 N/A 4,250 2,545 32,955Total Noncurrent Liabilities 90,766 15,691 69,108 70,928 127,855 117,217 175,783 210,324 254,678 318,268 390,737 469,958 531,128 618,992 706,627 795,166 895,261Total Liabilities 184,539 183,252 179,983 203,727 345,081 401,113 504,087 618,780 749,273 936,354 1,154,233 1,388,251 1,590,408 1,821,005 2,086,532 2,349,196 2,661,298Stockholders equity 177,924 166,280 182,782 220,577 288,293 431,060 547,555 711,548 938,912 1,207,641 1,547,201 1,934,513 2,396,909 2,884,029 3,371,307 3,872,741 4,431,710

65
Balance Sheet Revised To revise the balance sheet, we had to add the operating leases as a capital
lease asset, and add it as a liability as lease obligations and current lease
obligations. This caused an increase of both liabilities and assets. Also, the
capital asset was depreciated using strait line depreciation over the next 11
years. The following chart demonstrates our findings.

66
BALANCE SHEET REVISED ACTUAL FINANCIAL STATEMENTS Forecast Financial Statements2001 2002 2003 2004 2005 2006 2007 2008 2009 2010 2011 2012 2013 2014 2015 2016 2017
ASSETSCurrent assets:Cash and cash equivalents 31,870 31,753 67,163 106,003 171,549 220,344Receivables, net 40,500 35,437 32,602 53,915 81,762 133,406Inventories 96,105 95,683 83,530 82,329 122,037 165,232Prepaid expenses and other current assets 10,141 11,278 13,341 14,516 16,231 21,741Deferred tax assets 10,420 14,836 9,499 10,600 16,439 18,169Total current assets 189,036 188,987 210,644 271,023 408,018 558,892Property and equipment, net 145,385 128,097 114,403 113,944 144,007 164,262Capital Lease Assets 388,532 325,781 265,910 209,262 161,050 120,408 102,164 83,226 63,569 43,164 21,985Goodwill 0 0 11,610 11,610 20,623 28,004Other intangible assets, net 0 0 0 0 11,282 18,532Long-term deferred tax assets 0 0 16,244 16,984 37,226 43,084Other assets 28,042 32,448 9,864 10,833 12,218 24,151Total Noncurrent Assets 173,427 160,545 152,121 153,371 225,356 278,033Total Assets 362,463 349,532 362,765 424,304 633,374 836,925 1,059,101 1,339,762 1,700,158 2,159,201 2,720,593 3,346,330 4,015,596 4,738,403 5,496,547 6,266,064 7,143,313LIABILITIES AND STOCKHOLDERS EQUITYCurrent liabilities:Current installments of notes payable, 7,609 80,138 13,931 13,430 35,051 34,357Current Lease Obligations 59,871 56,648 48,212 40,642 18,244 18,938 19,657 20,405 21,179 21,985 0Accounts payable 47,933 44,460 44,888 58,158 87,711 117,339 118,268 144,621 174,432 220,082 273,102 327,411 372,483 421,841 482,395 544,943 582,738Accrued expenses 38,231 42,963 52,056 61,211 94,464 132,200Total current liabilities 93,773 167,561 110,875 132,799 217,226 283,896 178,139 361,621 435,161 542,607 668,193 801,070 917,642 1,036,375 1,187,399 1,334,515 1,534,544Notes payable, long-term debt and capital 80,119 1,480 54,161 41,396 53,199 18,018lease obligations, excluding current 325,781 265,910 209,262 161,050 120,408 102,164 83,226 63,569 43,164 21,985 0installmentsLong-term deferred rent and lease incentives N/A N/A 14,947 25,282 28,688 31,236Long-term deferred royalties N/A N/A N/A N/A 43,423 35,008Other long-term liabilities 10,647 14,211 N/A 4,250 2,545 32,955Total Noncurrent Liabilities 90,766 15,691 69,108 70,928 127,855 117,217Total Liabilities 184,539 183,252 179,983 203,727 345,081 401,113 258,869 189,644 64,049 -96,616 48,194 58,534 107,386 234,420 287,663 381,365 398,036

67
Valuation
In this section we will use various types of methods to value the stock price of
Guess, and we will compare them to the specialty retail industry as a whole to
determine if the stock price is accurate, overvalued, or undervalued. The first
valuation analysis that will be done is the method of comparables; it is made up
of the company’s most recent financial data, and then compared against their
competitors to arrive at an industry average and then compare it to Guess’s
current stock price. The best thing about the comparables method is that it is
quick and easy to implement, other than that method is not very reliable because
the estimated price is calculated by using the industry average. Next, the best
method to use for accuracy is the theoretical valuation models. The two main
components that are used in these valuations are the cost of equity, and the
WACC, which we have previously calculated. More specifically the models that we
use to determine the present value of our financial data are the dividends
discount model, discounted free cash flow model, residual income, and long-run
residual income perpetuity, all of which will be discussed in great detail.
CAPM Estimation
To begin the valuation process we determined the cost of equity based on the
Capital Asset Pricing Model. First we ran a multiple series regression analysis.
The data used in the regression analysis included historical stock prices monthly
from May 2000 through May 2007, the historical S&P 500 prices for the same
period, and Treasury Bill rates for five separate time horizons on the yield curve.
Based on the information that we gathered from the Federal Reserve Bank of St.
Louis ’ website, we were able to estimate the risk free rate of return and market
risk premium used in our computations. By running a regression analysis using
the 3 month, 6 month, 2 year, 5 year, and 10 year Treasury Bill rates we were
able to examine a wide range of estimated Betas for the company. The

68
information provided by the regression allowed us to compute the cost of equity
for the firm. We used the Beta obtained in the 10 year Treasury Bill 72 month
computation because it had the highest adjusted R squared value and thus the
most explanatory power. With an estimated Beta of 0.48, a risk free rate of
5.20%, and a market risk premium of 8.00% we computed the cost of equity for
Guess at 9.00%.
Beta
3 Month Treasury
6 Month Treasury
2 Year Treasury
5 Year Treasury
10 Year Treasury
72 months 0.09897 0.10261 0.15 0.28669 0.475660 months 0.06914 0.06899 0.09738 0.20225 0.3498648 months 0.07138 0.07094 0.09612 0.21081 0.4322836 months 0.10773 0.1116 0.14354 0.25416 0.4709324 months 0.03311 0.02629 0.00481 0.05418 0.24183
R^2
3 Month Treasury
6 Month Treasury
2 Year Treasury
5 Year Treasury
10 Year Treasury
72 months 0.05517 0.0447 0.07826 0.11657 0.1630260 months 0.01332 0.01219 0.00829 0.04197 0.0902848 months -0.00161 -0.00322 0.00648 0.04582 0.1075336 months 0.01087 0.012329 0.02322 0.06439 0.0659524 months -0.0284 0.000718 -0.02608 -0.02837 -0.0137
Ke
3 Month Treasury
6 Month Treasury
2 Year Treasury
5 Year Treasury
10 Year Treasury
72 months 5.99176 6.02088 6.4 7.49352 9.004860 months 5.75312 5.75192 5.97904 6.818 7.9988848 months 5.77104 5.76752 5.96896 6.88648 8.6582436 months 6.06184 6.0928 6.34832 7.23328 8.9674424 months 5.46488 5.41032 5.23848 5.63344 7.13464

69
WACC Estimation
To estimate the weighted average cost of capital we had to obtain Guess’ market
value of debt and cost of debt as well as the market value of equity and cost of
equity computed above. In Guess’ most recent 10-K the debt balance was
disclosed as $86.50 million. Also disclosed in the 10-K was that the average
effective interest rate on Guess’ debt is 6.20%. We calculated the value of
equity by multiplying the observed share price of $48.87 by the number of
shares outstanding, $93.54 million. Adding the total value of debt and value of
equity we get that the total value of the firm is $4.28 billion. We used the initial
cost of equity value of 9.00% calculated using the regression analysis. With
these values we were able to compute a before tax WACC of 9.00%. Stated in
Guess’ most recent 10-K the corporate tax rate is 37.1%. We computed the after
tax WACC using this tax rate to be 8.89%.
Conclusion
The Beta that we computed for Guess was 0.48 which is less than a third of the
published Beta of 1.68 according to Google finance. Our calculations show that
Guess is three times less risky than analysts estimate. Our forecasted data
shows that Guess will be steadily growing and outperforming the industry
average over the next 10 years. This is one factor that could have led to the
reduced risk shown by our Beta value. Guess has an annual return on equity of
30% which is much higher than the WACC of 9.02%. This shows that for each
dollar invested in capital by Guess, 20 cents of value is added for shareholder.

70
Method of Comparables
The method of comparables is the quickest and easiest method to calculate,
because all you’re doing is taking each competitor individually then combining
them for an industry average. The forward price to earnings ratio uses the
current financial data of Guess and their competitors and the trailing price to
earnings ratio uses last years financial data.
Forward Price to Earnings
PPS EPS P/E
Industry
Avg. GES PPS
GES 47.34 1.36 34.80 20.88 28.39
GPS 19.39 0.64 30.29
ANF 76.92 4.62 16.64
AEO 26.56 1.69 15.71
In calculating the forward P/E ratio we divided all of the Price per share by
Earnings per share. Then to arrive at the industry average we took the sum of
the competitors, excluding Guess, and divided it by the total. Guess’s share price
was calculated by multiplying the industry average by Guess’s EPS. It is clearly
obvious that guess’s share price is overvalued using this method because 28.39
is extremely less than 47.34. Furthermore, since Guess has a higher P/E ratio
than the industry average there is not a projected positive outlook for future
earnings growth.

71
Trailing Price to Earnings
PPS EPS P/E
Industry
Avg. GES PPS
GES 18.61 0.66 28.2 15.43 10.19
GPS 3.5 0.24 14.6
ANF 57.07 3.83 14.9
AEO 21.67 1.29 16.8
The only difference in the forward and trailing P/E ratios is that forward uses
current financial data where as trailing uses last years financial data. This model
is calculated in the exact same way as the forward model to arrive at the
industry average and share price of our company. This model once again shows
that Guess is overvalued because they have their PPS at 18.61 and the model
shows that it should be at 10.19. and like before guess has a higher P/E than the
industry which is not good for future earnings growth.
Dividends to Price
PPS DPS D/P
Industry
Avg.
GES Share
Price
GES 47.34 0.24 0.01 0.01 24.00
GPS 19.39 0.32 0.02
ANF 76.79 0.72 0.01
AEO 26.56 0.32 0.01
In the dividends to price model, the companies’ dividends per share are
compared to the current market price per share. Then each of the companies
dividends per share are divided by the current market price per share. You then
average these values and Guess’s dividends per share are divided by this
amount. It is clear that using this model presents the same conclusion that

72
Guess’s Price per share is over valued because they are saying it is worth 44.86
and the model presents the number which is significantly lower.
Price to Book
PPS BPS P/B
Industry
Average
GES Share
Price
GES 47.34 4.66 10.16 5.53 25.78
ANF 76.79 15.96 4.81
AEO 26.56 6.48 4.10
GPS 19.39 6.34 3.06
In the price to book model we took price per share and divided it by the book
value of equity, this process is completed for Guess along with their competitors
in the industry. Next, we took the industry average and multiplied it by the book
value of equity for Guess to arrive at their share price. This method is showing
again that Guess’s share price is way overvalued. This also directly reflects Guess
price to book value being overvalued as compared to the industry average.
Price to Sales
Price Per
Share Sales P/Sales
Industry
Average GES
Guess Jeans 47.34 1,119.945 0.04227 0.01903 21.32
Abercrombie 76.79 3,318.158 0.02314
American
Eagle 26.56 2,794.409 0.00950
Gap 19.39 15,943.000 0.00122
The price to sales method is calculated by dividing the price per share by the
total sales for each year, this is done for Guess and their competitors. Then the
industry average is calculated only with the competitors P/Sales ratio. Last the

73
average is multiplied by Guess’s sales to arrive at the new share price stated
which is 21.32. This like the rest of the method of comparables valuation models
shows that guess’s share price is overvalued.
P/EBIT FORECAST
In addition to the Price-Book Ratio, there is the Price-Earnings before Interest &
Taxes “EBIT” forecast. In this formula, we take the firms current price and divide
it by its “EBIT”. This formula is used in developing which company or companies
are being stated at an under or overvalued price.
Price Per Share EBIT P/EBIT Industry Average GES
GES 47.34 $2.095 $22.59 $13.50 28.30 ANF 76.79 $7.630 $10.06 AEO 26.56 $2.876 $9.24 GPS 19.39 $1.599 $12.12
Guess jeans has a stated price per share of 47.34 and an EBIT of 2.095. When
the price per share is divided by its EBIT, we come up with a Price-EBIT of
$22.59. This number is considerably higher then the rest of the industry
competitors. This is a potential red flag for me because when I see a number like
this one, I start to wonder of the firm’s actual position in the industry and
whether they are being overvalued. When we compare Guess’ P/EBIT number to
the industry, we discover that not only has Guess out performed the industry’s
average but its price is $9.09 over the average. With an actual price of $28.30,
Guess has been considerably overvalued compared to its current price.

74
P/FCF Per Share In the Price-Future Cash Flows per Share forecast, we bring into light the effect
of how Cash Flows from Operating, Investing, and Financing effects the current
price of the firm. We start off by taking the price per share of a firm and using it
to compare it to its cash flows. We then, add up the cash flows from operating
and investment and subtract out cash flows from financing activities to arrive at
FCF “Future Cash Flows”. We use the future cash flows to divide it against how
many shares of the company currently possesses to get the FCF/Share. The next
stage is to use the price per share and divide it against the FCF/Share to get the
Price/FCF per share. Once we get all of these Price/FCF per share from each firm
in the industry, we use them to compare them to each other in performance.
The last step is to find out what the industry average so Guess can rank itself
against the overall average of the industry, so they can tell whether they are
performing over or under what the industry is.
PPS CFFO CFFI CFFF FCF GES 47.34 $138,253,000 $71,537,000 $19,189,000 $190,601,000ANF 76.79 $582,171,000 $473,764,000 $77,135,000 $978,800,000AEO 26.56 $749,268,000 $651,121,000 $168,761,000 $1,231,628,000GPS 19.39 $1,250,000,000 $150,000,000 $1,102,000,000 $298,000,000
FCF PShr Price/FCF
PShr Ind. Avg. GES Shr Price GES $2.04 $23.23 $21.99 44.80 ANF $11.11 $6.91 AEO $5.63 $4.72 GPS $0.37 $53.09
As you can see, Guess is once again being overvalued the current price that it is
selling for. I am a little less nervous though with this overvalue because the
amount is not as large as the previous P/EBIT forecast that performed above.
Under this forecast, Guess is only overvalued by $2.54 margin compared to the
$22.59 P/EBIT we evaluated above. This shows that in this category Guess’ Cash
Flows from Operating, Investing, and Financing activities were the lowest in the

75
industry. By having lower cash flows Guess has a more believable price per share
value relative to their cash flow activities. The other competitors are drastically
overstated in this forecast which means they have higher movement of cash
flows then Guess does.
In conclusion, after running all of the method of comparable models to
determine how the company was valued it is evident hat Guess is an overvalued
company. This method is often used because it is quick and easy to implement
but it lacks certain information from a company’s financials that would be helpful
in determining the value of a company, such as, the statement of cash flows and
various items on the balance sheet. It is also less reliable because Guess’s
estimated share price in each model is determined by using their competitors
average in the industry. The last reason this method is considered a less reliable
valuation model is that the raw data used in method of comparables is current
information, and it fails to look at historical information dating back more than
one year.
Discounted Dividends Model
The dividends discount valuation model uses the expected dividends paid out to
shareholders by a company to value the firm. As a firms’ earnings increase over
time, investors anticipate that dividends will also increase. Investors use this
model to calculate the PV of these payments and use it as a measure of value for
the firm. The problem with using this model arises when companies do not pay
annual dividends, or choose to re-invest the companies’ earnings back into the
firm to increase growth within the company.
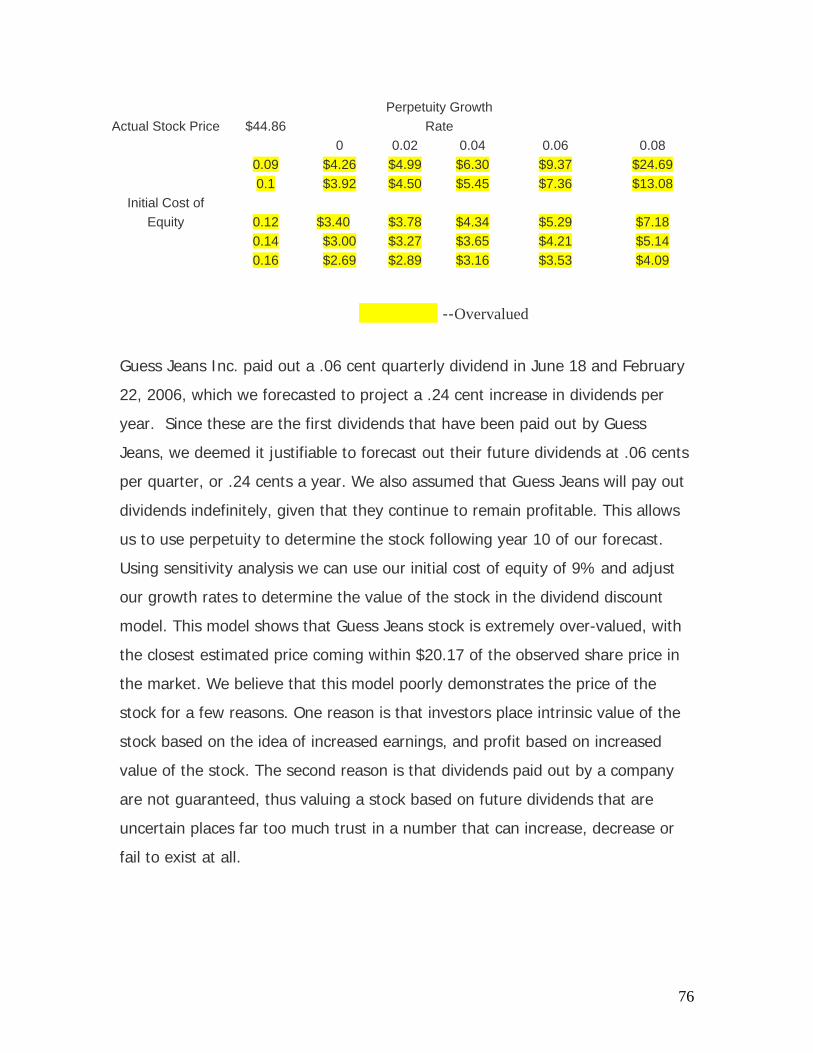
76
_________ --Overvalued
Guess Jeans Inc. paid out a .06 cent quarterly dividend in June 18 and February
22, 2006, which we forecasted to project a .24 cent increase in dividends per
year. Since these are the first dividends that have been paid out by Guess
Jeans, we deemed it justifiable to forecast out their future dividends at .06 cents
per quarter, or .24 cents a year. We also assumed that Guess Jeans will pay out
dividends indefinitely, given that they continue to remain profitable. This allows
us to use perpetuity to determine the stock following year 10 of our forecast.
Using sensitivity analysis we can use our initial cost of equity of 9% and adjust
our growth rates to determine the value of the stock in the dividend discount
model. This model shows that Guess Jeans stock is extremely over-valued, with
the closest estimated price coming within $20.17 of the observed share price in
the market. We believe that this model poorly demonstrates the price of the
stock for a few reasons. One reason is that investors place intrinsic value of the
stock based on the idea of increased earnings, and profit based on increased
value of the stock. The second reason is that dividends paid out by a company
are not guaranteed, thus valuing a stock based on future dividends that are
uncertain places far too much trust in a number that can increase, decrease or
fail to exist at all.
Actual Stock Price $44.86 Perpetuity Growth
Rate 0 0.02 0.04 0.06 0.08 0.09 $4.26 $4.99 $6.30 $9.37 $24.69 0.1 $3.92 $4.50 $5.45 $7.36 $13.08
Initial Cost of Equity 0.12 $3.40 $3.78 $4.34 $5.29 $7.18
0.14 $3.00 $3.27 $3.65 $4.21 $5.14 0.16 $2.69 $2.89 $3.16 $3.53 $4.09

77
Discounted Free Cash Flows Model
The term free cash flows describes the money that is able to generate that
allows it to maintain, or expand its asset base. This money is important in that it
helps increase shareholder wealth through investing the money into operations,
new products, paying dividends and also repaying company debt. Although a
positive Free Cash Flows is desirable, a negative cash flow does not always
indicate a struggling company. For instance a company could have recently made
a large investment in machinery or operating space, and this investment could
prove to have a high return and be profitable for a company. Free Cash Flows is
calculated by taking operating cash flows and subtracting capital expenditures.
We then use the Weighted Average Cost of Capital as our discount factor to
provide us with a present value in the PV formula. In this case we used .089, the
After Tax WACC of Guess Jeans Inc. We used the after tax WACC because cash
from operations and cash from investments was stated on the Statement of Cash
Flows as being before tax. The Free Cash Flows that are used for Guess Jeans
was found by forecasting the companies Cash Flow from Operations out to 2016,
followed by our terminal year. We then multiplied each of the ten years by the
discount factor, next summing the present values to come to a total Present
Value of the Annual Free Cash Flows. The sum of these numbers was
$4,873,660,568. We then found the perpetuity by forecasting out the Free Cash
Flows for the year 2017, this being our terminal year, and then dividing it by our
WACC minus the growth rate. This number was then discounted back to its
present value by multiplying it by the year 10 present value factor. We next
found the value of the firm by adding the present value of the annual free cash
flows to the present value of the terminal perpetuity. Subtracting the book value
of equity from the value of the firm, we come to Guess Jeans’ market value of
equity. The value of this equity divided by the firms 93,540,000 shares
outstanding gives us a value of $65.18 per share.

78
0 0.02 0.04 0.06 0.08 0.089 53.51 54.31 55.75 59.19 77.89 0.0927 52.13 52.83 54.06 56.79 68.14 0.11 46.33 46.73 47.37 48.51 51.17 0.12 43.39 43.69 44.15 44.91 46.42 0.13 40.71 40.94 41.27 41.8 42.74 0.14 38.24 38.42 38.67 39.05 39.68
< $40.00 Overvalued > $50.00 Undervalued $40.00-$50.00 Fair Priced
Actual Stock Price $44.86
When performing the sensitivity analysis, it reveals that according to the
Discounted Free Cash Flows model, Guess Jeans’ stock is undervalued when
maintaining a constant .0927 WACC. By adjusting our WACC upwards, and
relating it to theoretical yet reasonable growth rates, we can conclude that given
these possible growth rates in the market our stock will remain fair valued,
except in the cases where our WACC reached .14. This information displays to us
that given the current weighted average cost of capital, and expectations of our
growth rate, Guess Jeans will maintain a stock price that is slightly undervalued
and fairly valued in relation to the expectations of the market and the companies
Free Cash Flows. This model seems to estimate Guess Jeans’ stock price fairly
well, and will give an investor a reliable insight as to the value of the firm.

79
Discounted Free Cash Flows-REVISED
0 0.02 0.04 0.06 0.08 0.089 $ 73.66 $ 74.45 $ 75.89 $ 79.33 $ 98.03 0.0927 $ 71.85 $ 72.55 $ 73.78 $ 76.51 $ 87.85 0.11 $ 64.22 $ 64.63 $ 65.26 $ 66.40 $ 69.06 0.12 $ 60.33 $ 60.64 $ 61.09 $ 61.85 $ 63.36 0.13 $ 56.77 $ 57.00 $ 57.33 $ 57.86 $ 58.81 0.14 $ 53.49 $ 53.67 $ 53.92 $ 54.30 $ 54.93
< $40.00 Overvalued > $50.00 Undervalued $40.00-$50.00 Fair Priced
After revising the free cash flow model to include the capitalization of the
operating leases, there were a few changes regarding the sensitivity analysis of
the stock. The cash flow of operations was increased which caused an increase
in the present values of the annual and perpetuity cash flows. Even with the
increase in cash flow from operations, Guess still is deemed undervalued relative
to the discounted free cash flows method.
Abnormal Earnings Growth Model
-0.5 -0.4 -0.3 -0.2 0 0.09 $33.96 $28.41 $20.02 $5.84 N/A 0.11 $27.79 $23.25 $16.38 $4.78 N/A 0.13 $23.51 $19.67 $13.86 $4.04 N/A 0.15 $20.38 $17.05 $12.01 $3.50 N/A 0.17 $17.98 $15.04 $10.60 $3.09 N/A
< $40.00 Overvalued > $50.00 Undervalued $40.00-$50.00 Fair Priced
N/A Negative Stock Price Actual Stock
Price $44.86

80
The Abnormal Earnings Growth Model is calculated using a company’s reported
earnings and dividends. By taking the current years earnings and adding the
D.R.I.P. income (previous years dividends x Ke) we find the companies
Cumulative Dividend Earnings. We next find our normal income by multiplying
our previous years earnings by (1+.09) and subtract it from our cumulative
dividend earnings to reach our annual AEG adjustment. We confirmed our annual
AEG adjustment by relating it to the change per year in residual income. The
number matched up from years 2007-2017, proving we were using a correct AEG
adjustment. We again use our Ke (cost of equity) to find our present value
discount factor. Multiplying this PV factor by our AEG gives us our present value
AEG. Next, we use our year 10 AEG for the AEG perpetuity, using our cost of
equity (Ke) minus the growth rate to discount it back to year 10. We use a
negative growth rate that will bring the perpetuity back to zero over time.
Finally, we add up both of our calculated present values as well as our base year
earnings of $123,168,000 and divide it by our Ke, bringing it back to the value in
2007. This leads us to an estimated price per share of Guess Jeans stock at -
$117.08.
Obviously it is not possible to value a stock at less than 0, but we can use this
model to implement new growth rates in our sensitivity analysis to value the
stock even more efficiently. Despite our negative estimated price, when applying
the arbitrary growth rates, we realize that our observed share price is extremely
overvalued in relation to the AEG model. Only when using a -.5 growth rate and
our estimated cost of equity, does our stock come within ten dollars of our
observed price, at $33.96. The AEG model is the most reliable of the valuation
models, using earnings as well as dividends to find the intrinsic value of the firm.
In this case, it has proved to us that the value of Guess Jeans stock is
overvalued in the market.

81
Abnormal Earnings Growth Model-Revised
-0.5 -0.4 -0.3 -0.2 0 0.09 $137.47 $147.33 $162.24 $187.42 $405.72 0.11 $112.48 $120.54 $132.74 $153.35 $331.96 0.13 $95.17 $102.00 $112.32 $129.76 $280.89 0.15 $82.48 $88.40 $97.34 $112.45 $243.43 0.17 $72.78 $78.00 $85.89 $99.22 $214.79
< $40.00 Overvalued > $50.00 Undervalued
$40.00-$50.00 Fair Priced
The difference between the revised AEG and the previous model is because of
the capitalization of operating leases, this lead to a huge increase in our annual
AEG adjustment due to increased earnings. Comparing our annual AEG
adjustment to the change per year in residual income allows us to confirm that
our assumptions are correct, and that our forecasted statements are correctly
relating to each other. We encountered an overall underestimated price per
share when performing a sensitivity analysis on our new AEG model. Using this
revised AEG Model, all of the prices per share were underestimated compared to
the AEG model presented in the previous model. This difference is caused by the
recognition of operating leases as capital leases.

82
Residual Income Valuation
The Residual Income Valuation Model is an accentual variable involved in
determining the true nature and performance of a firm. It uses key components
like, Earnings Per Share, Dividends Per Share, Book value Per Share, Cash Flows
From Operating activities, and Cash Flows From Financing activates to forecast
out to 11 years its potential earnings. We use these components to valuate
“normal” (Benchmark) Earnings, Residual Income (actual), Present Value Factor,
PV of Annual Residual Income, Total PV of Annual Residual Income, Continuing
(Terminal) Value Perpetuity, PV of Terminal Value Perpetuity, Initial Book Value
of Equity, and Estimated Price Per Share. Free Cash Flows Model and Residual
Income Model possess some similar and different qualities when forecasting a
company. They both start their models off by forecasting out EPS, DPS, BPS,
CFFO, and CFFF of the company. While the Free Cash Flows model primarily
focuses on the measurement of firms ability to use their free cash flows to
generate or expand their asset base, Residual Income Valuation Model focuses
on the actual earnings of income and how they perform in one year compared to
a benchmark of the previous year’s income. Theoretically, you always would
want your actual year income to be higher then the previous year’s income and
from looking at our spreadsheet it can be determined that Guess’ actual income
will be higher then its benchmark for all the years forecasted. Residual Income
Model measures how your income has performed and will perform in the future
and we also use income in this model to determine how valuable the company
shares will be in the upcoming years.
Once we calculated this items, we use them for evaluating where the current
price per share is over, under, or fairly priced compared to its actual
performance. These different items are plugged into different growth rates and
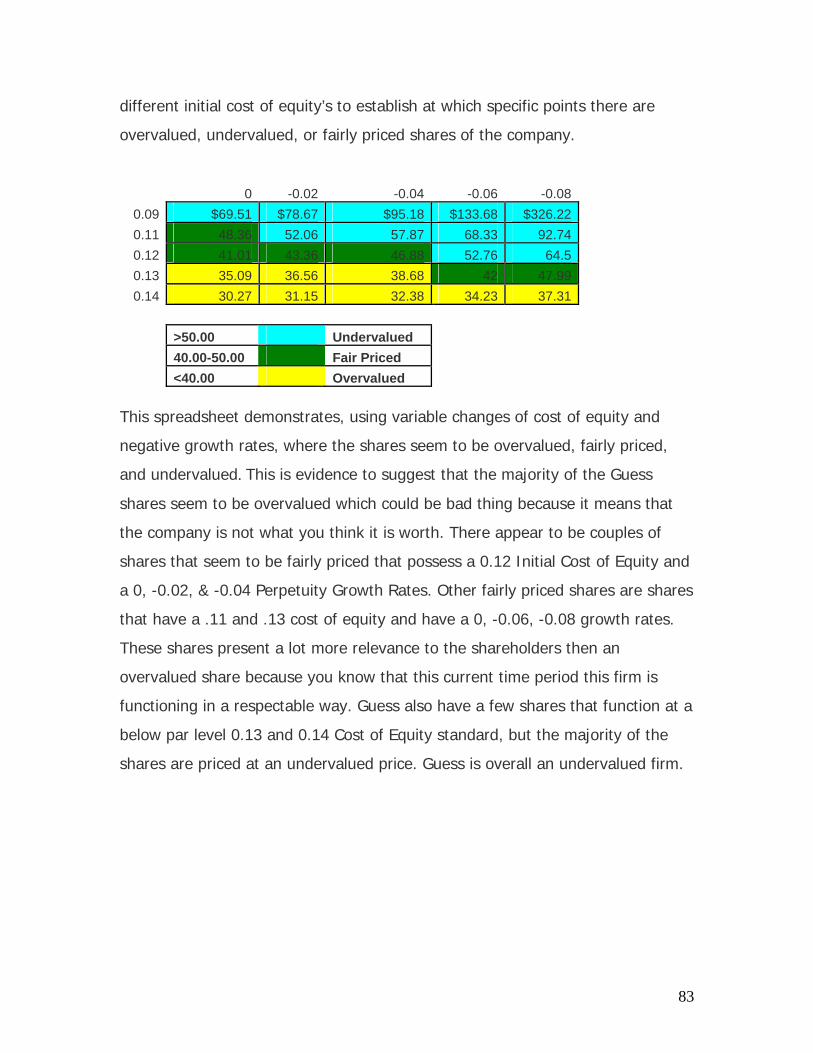
83
different initial cost of equity’s to establish at which specific points there are
overvalued, undervalued, or fairly priced shares of the company.
0 -0.02 -0.04 -0.06 -0.08 0.09 $69.51 $78.67 $95.18 $133.68 $326.22 0.11 48.36 52.06 57.87 68.33 92.74 0.12 41.01 43.36 46.88 52.76 64.5 0.13 35.09 36.56 38.68 42 47.99 0.14 30.27 31.15 32.38 34.23 37.31
>50.00 Undervalued 40.00-50.00 Fair Priced <40.00 Overvalued
This spreadsheet demonstrates, using variable changes of cost of equity and
negative growth rates, where the shares seem to be overvalued, fairly priced,
and undervalued. This is evidence to suggest that the majority of the Guess
shares seem to be overvalued which could be bad thing because it means that
the company is not what you think it is worth. There appear to be couples of
shares that seem to be fairly priced that possess a 0.12 Initial Cost of Equity and
a 0, -0.02, & -0.04 Perpetuity Growth Rates. Other fairly priced shares are shares
that have a .11 and .13 cost of equity and have a 0, -0.06, -0.08 growth rates.
These shares present a lot more relevance to the shareholders then an
overvalued share because you know that this current time period this firm is
functioning in a respectable way. Guess also have a few shares that function at a
below par level 0.13 and 0.14 Cost of Equity standard, but the majority of the
shares are priced at an undervalued price. Guess is overall an undervalued firm.

84
Residual Income Valuation-Revised
The revised residual income is much like the previous model in that it uses the
same key components used in the first model. The revised residual income
model uses revised earnings to calculate the estimated price per share then the
previous model did. These revised earnings played an enormous model in the
drastic change of the estimated price per share. The earnings increased the
entire estimated price per shares for all of the shares in the sensitivity analysis.
0 -0.02 -0.04 -0.06 -0.080.09 103.08 118.32 145.77 209.80 529.980.11 70.68 77.30 87.72 106.46 150.210.12 59.40 63.86 70.56 81.71 104.020.13 50.32 53.35 57.71 64.57 76.910.14 42.93 44.98 47.84 52.14 59.29
<40.00 Overvalued 40.00-50.00 Fairly Priced
>50.00 Undervalued
As you can see from the spreadsheet, most of the shares in the sensitivity
analysis are undervalued. This is due to the increase in earnings per year. The
increase in earnings makes; the book value of equity increase, the “normal”
(Benchmark) Earnings increase, the residual income increase, the Total PV and
PV of Annual Residual Income increase, and the estimated price per share
increase. With the majority of the shares been understated there are a few
shares that are stated at a fair price. With the first residual income model having
an undervalued rating, the revised model comes up with the same rating of
undervalued.

85
Long Run Return on Equity Residual Income Model The Long Run Return on Equity Residual Income Model (LR ROE RI) is a model
that is derived from the Residual Income Model. If the regression analysis results
prove unreliable, this model can also be very useful in calculating the cost of
equity. However, we did not have to use this model for this purpose. This model
determines intrinsic value based of the following formula:
Po= BVE( 1 + (ROE-Ke)/(Ke-g))
This valuation model is determined by the book value of equity (BVE), return on
equity (ROE), cost of equity (Ke), and growth (g). Since this model only contains
one constant and three variables, our sensitivity analysis has to be expanded to
account for the variations. Bellow are the different prices for Guess’ stock holding
one of the three variables constant.

86
Growth 0 0.02 0.04 0.06 0.07 ROE 0.2 10.35 11.98 14.91 21.74 30.28 0.25 12.94 15.31 19.57 29.5 41.93 0.3 15.53 18.64 24.23 37.27 53.58 0.35 18.12 21.96 28.89 44.86 65.23 0.4 20.71 25.29 33.55 52.8 76.88
Ke at 9 %
ROE 0.2 0.25 0.3 0.35 0.4 Ke 0.08 18.64 24.46 30.28 36.11 41.93 0.09 14.91 19.57 24.23 28.89 33.55 0.105 11.47 15.05 18.64 22.22 25.8 0.12 9.32 12.23 15.14 18.05 20.96 0.135 7.84 10.3 12.75 15.2 17.65
Growth at 4% Growth 0 0.02 0.04 0.06 0.07 Ke 0.08 17.47 21.74 30.28 55.91 107.16 0.09 15.53 18.64 24.23 37.27 53.58 0.105 13.31 15.35 18.64 24.85 30.62 0.12 11.64 13.05 15.14 18.63 21.43 0.135 10.35 11.34 12.75 14.91 16.49
ROE at 30%
<$40 Over Valued >$50 Under Valued $40-$50 Fair Valued
Based on this information, it seems to be that Guess’ stock is over valued. Out of
a possible 75 times, 65 times it showed that Guess’ stock price was over valued.
That is 87% of the time. On the other hand, it came back fairly value 3 times
and undervalued 7 times.

87
It is unnecessary to run a revised Long Run R.O.E. Model because it would not
change. Operating leases would not affect BVE, ROE, Ke, or growth
Conclusion
Based on the overall results of the valuation models, we believe that Guess’
current stock price is slightly undervalued. Guess has consistently outperformed
industry averages over recent history, and we expect continue growth to exceed
industry over the next few years.
Credit Risk Analysis
Altman’s Z-Score formula for a measurement of the financial health of a
company and is a powerful tool that forecasts the probability of a company
entering bankruptcy. A Z-Score of 3.0 or above bankruptcy for the firm is not
likely. If the Z-Score is 1.8 or less then bankruptcy is likely. A higher Z-Score is
more desirable. We calculated the Z-Score for Guess to be 9.41 which is well
above the 3.0 benchmark that says that the firm is in no risk of bankruptcy.


