
Error Compensation Phase Extraction Algorithm Used in
Phase Shifting Point Diffraction Interferometer Yu Jie, Zhang Haitao, Ma Dongmei, Jin Chunshui
State Key Laboratory of Applied Optics, Changchun Institute of Optics, Fine Mechanics and Physics, Chinese Academy of Science
Abstract: Phase-shifting point diffraction interferometer is influenced by some
error sources, and the precision descends. Some kinds of testing errors due to some
error sources can be eliminated by phase extraction algorithm. An error
compensation phase extraction algorithm designed by the author is compared with
some universal phase extraction algorithms. The simulation results illuminate that
the present algorithm is much more insensitive to phase shifter linearity and
nonlinearity of second order, intensity fluctuation linearity and nonlinearity of 2nd
order, frequency of light source fluctuation linearity and nonlinearity of 2nd order
than the other two algorithms. The results also illuminate that the error
compensation phase extraction algorithm have the advantage over other universal
algorithms in eliminating the phase-shifting noise, intensity noise, frequency noise,
vibration, temperature change, humidity change and pressure change. We have
developed a point diffraction interferometer with phase-shifting technique to
measure optical surface figure. A spherical concave mirror was tested with this
interferometer. The error compensation phase extraction algorithm was applied
during measurement. The measurement repeatability comes out better than 0.1 nm
RMS and validates the simulation well.
Key words: phase-shifting point diffraction interferometer; error compensation;
phase shifter error; light source error; vibration; repeatability;
1 Introduction Exterme Ultraviolet Lithography (EUVL) projection objective extremely harsh

aberration requirement take an unprecedented challenge to optical design, optical
fabrication, optical testing and system Integrated alignment[1~5]. In order to achieve
EUVL projection optics fabrication, the accuracy of optical figure measurement
instrument is required to reach deep-sub-nanometer.
Point diffraction interferometer (PDI) utilizes a near-ideal spherical wavefront
diffracted by a pinhole as reference beam, which eliminates the disadvantage caused
by reference element used in traditional interferometers, and achieves high accuracy
measurement. Since 1974 Smartt and Strong proposed PDI[6], after years of
development, PDI has been successfully applied in ultra-precision surface figure
measurement and system wavefront aberration measurement[7~9].
In this manuscript, an error compensation phase extraction algorithm is
introduced. Influences caused by multi error sources are analyzed. And a concave
mirror was used to estimate the wavefront repeatability of PDI by using of presented
algorithm.
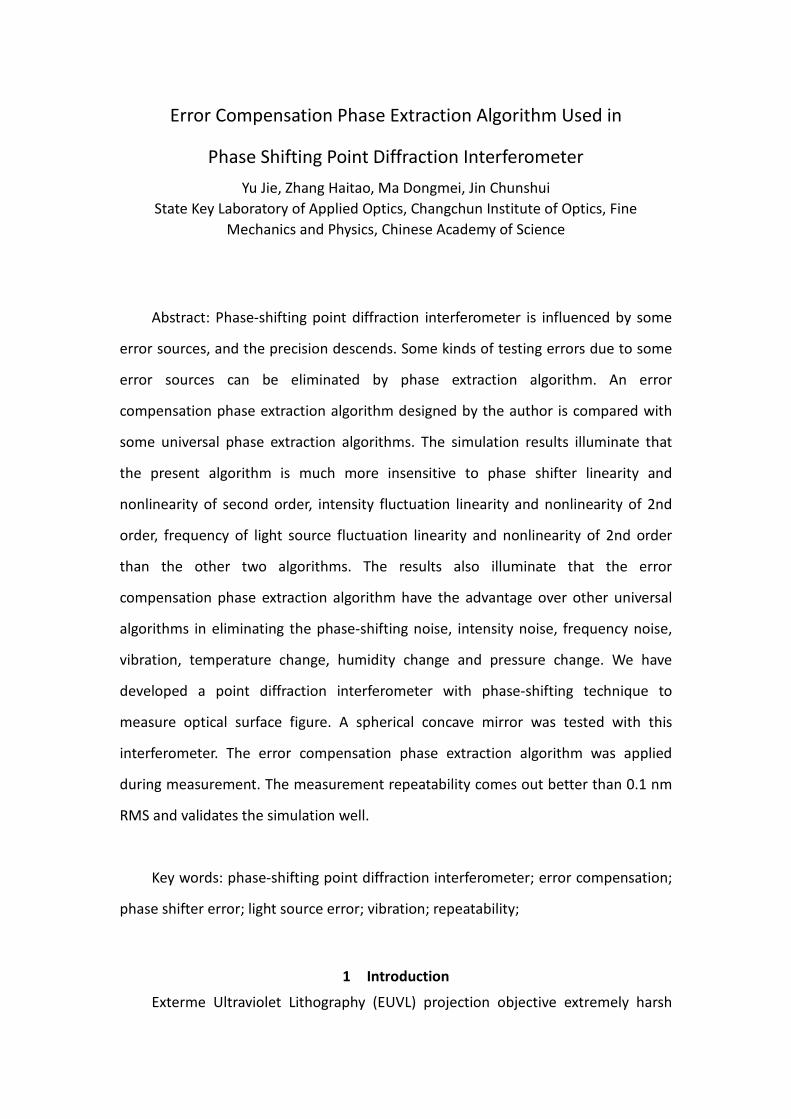
2 Summary of PDI and Error Compensation Phase Extraction Algorithm
Figure 1 shows the sketch map of constitution of PDI. The entire interferometer
is composed by illumination system, pinhole plate, imaging system and data
processing system. Illumination system focuses at and irradiates the pinhole. The
diameter of the pinhole is on the order of the wavelength of light source. A
near-ideal spherical wavefront diffracted by pinhole divides in two beams. One of
them acts as reference beam and the other acts as testing beam. The testing beam,
which is reflected by the tested surface and pinhole plate surface sequentially, is
relayed on the CCD camera together with reference beam. And then interference
fringe pattern are collected. It should be noticed that CCD imaging sensor should be
conjugated with the optical surface under test. In order to improve the accuracy of
measurement, Phase-shifting method is adapted. A piezoelectricity device is
employed here for moving the tested optical element for changing the phase of
interferograms.
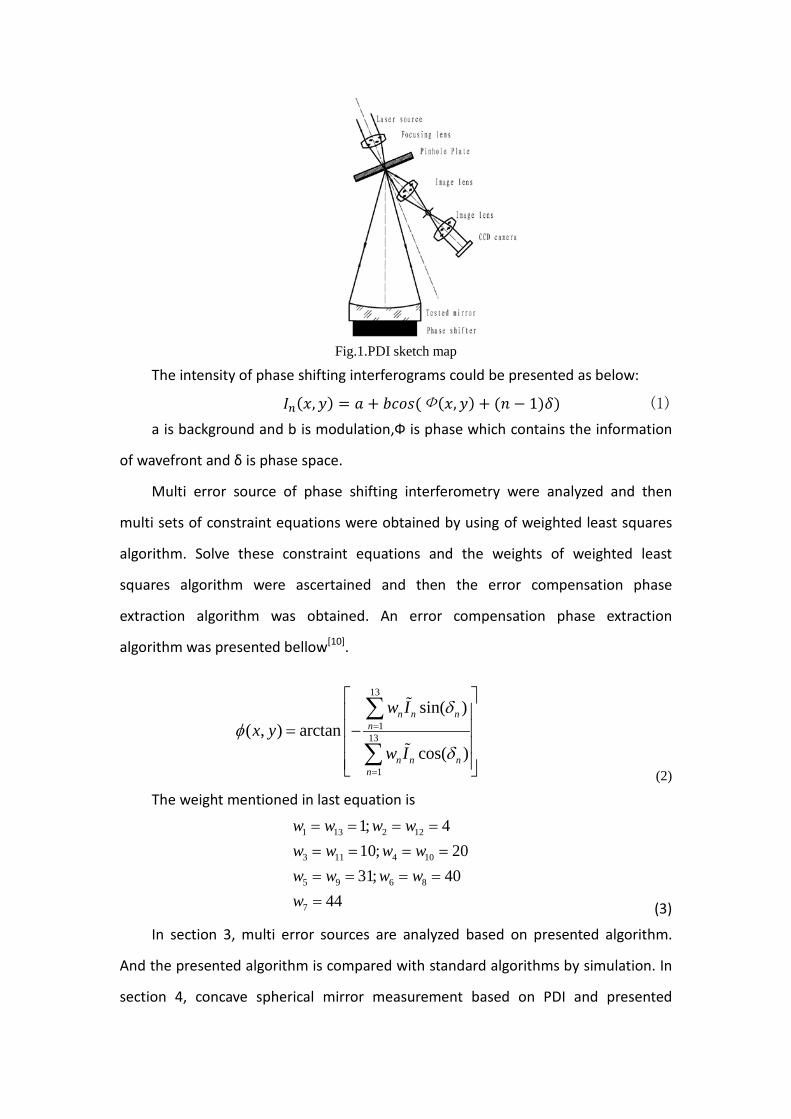
Fig.1.PDI sketch map
The intensity of phase shifting interferograms could be presented as below:
𝐼𝑛(𝑥,𝑦) = 𝑎 + 𝑏𝑏𝑏𝑏(Ф(𝑥,𝑦) + (𝑛 − 1)𝛿) (1) a is background and b is modulation,Ф is phase which contains the information
of wavefront and δ is phase space.
Multi error source of phase shifting interferometry were analyzed and then
multi sets of constraint equations were obtained by using of weighted least squares
algorithm. Solve these constraint equations and the weights of weighted least
squares algorithm were ascertained and then the error compensation phase
extraction algorithm was obtained. An error compensation phase extraction
algorithm was presented bellow[10].
13
113
1
sin( )( , ) arctan
cos( )
n n nn
n n nn
w Ix y
w I
δφ
δ
=
=
= −
∑
∑
(2)
The weight mentioned in last equation is
1 13 2 12
3 11 4 10
5 9 6 8
7
1; 410; 2031; 40
44
w w w ww w w ww w w ww
= = = == = = == = = == (3)
In section 3, multi error sources are analyzed based on presented algorithm.
And the presented algorithm is compared with standard algorithms by simulation. In
section 4, concave spherical mirror measurement based on PDI and presented

algorithm is introduced. In section 5, conclusions are given.
3 Errors analysis
Wavefront repeatability is the most basic evaluation of precision. The system's
repeatability of measurement is defined as the difference of sequential
measurements without adjusting and touching the equipment. Therefore, the
repeatability is mainly influenced by the performance of devices which compose the
interferometer and the environment during measurement. In this chapter, we discuss
the error sources which undermine the system's repeatability and the methods to
improve this property.
3.1 Phase shifting error
Phase-shifting error is caused by the imperfection of phase shifter which is one
of main error sources. Phase-shifting error includes linearity phase-shifting error,
nonlinearity phase-shifting error and phase-shifting noise. Previous research has
confirmed that demerit caused by linearity and low-order nonlinearity phase-shifting
error can be effectively decreased by adopting proper phase reversion algorithms.
Phase shifting error could be presented as below[11]
[ ]21 2( 1) ( 1)n n nδ ε δ ε δ∆ = − + − (4)
Δδn is phase shifting error of nth frame,δ is the ideal pahse shifting space,ε1 is
linearity phase shifting coefficient , ε2, ε3……are nonlinearity phase shifting
coefficient. The simulation of phase shifting error causing wavefront measurement
error was taken, and the result refers to fig 2.
3.2 Detector nonlinearity response error
Fig.2. Wavefront measurement error due to phase-shifting error. (a) Wavefront measurement testing error curve due to linear phase- shifting error;
(b) Wavefront measurement testing error curve due to 2nd nonlinear phase-shifting error;
(a) (b)
The relationship between detector input and output is not completely linear, and
then detector nonlinear response error is induced, which also cause phase extraction
error. The simulation of detector nonlinear response error causing wavefront
measurement error was taken, and the result refers to fig 3. Three kinds of
algorithms could completely decrease the influence caused by detector 2nd nonlinear
response and the measurement error mentioned in fig 3 is introduced by computer
calculation error.
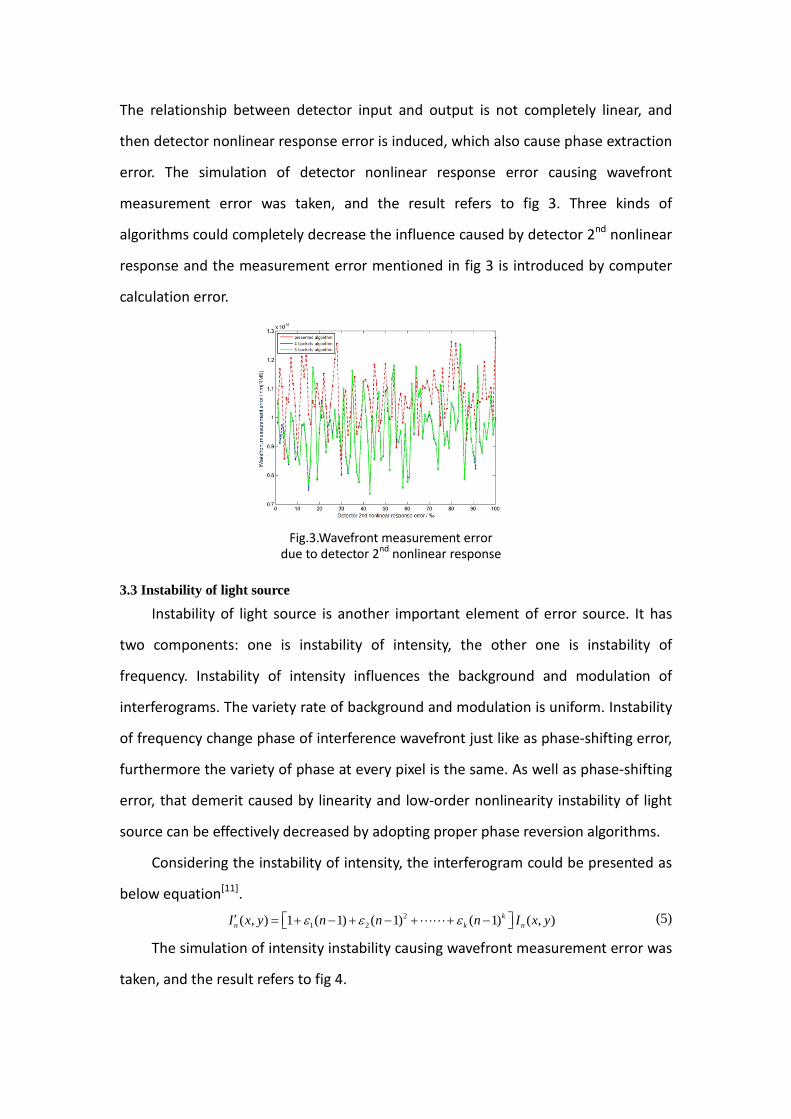
3.3 Instability of light source
Instability of light source is another important element of error source. It has
two components: one is instability of intensity, the other one is instability of
frequency. Instability of intensity influences the background and modulation of
interferograms. The variety rate of background and modulation is uniform. Instability
of frequency change phase of interference wavefront just like as phase-shifting error,
furthermore the variety of phase at every pixel is the same. As well as phase-shifting
error, that demerit caused by linearity and low-order nonlinearity instability of light
source can be effectively decreased by adopting proper phase reversion algorithms.
Considering the instability of intensity, the interferogram could be presented as
below equation[11]. 2
1 2( , ) 1 ( 1) ( 1) ( 1) ( , )kn k nI x y n n n I x yε ε ε′ = + − + − + + −
(5)
The simulation of intensity instability causing wavefront measurement error was
taken, and the result refers to fig 4.
Fig.3.Wavefront measurement error due to detector 2nd nonlinear response
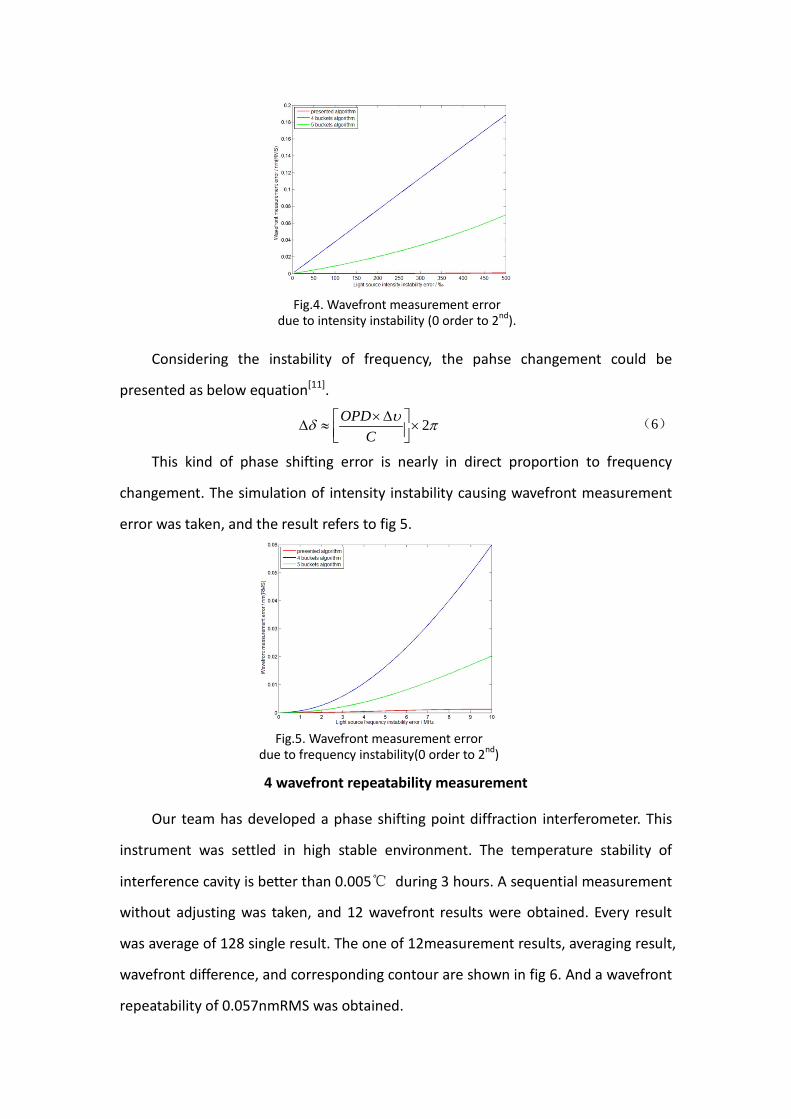
Considering the instability of frequency, the pahse changement could be
presented as below equation[11].
2OPDC
υδ π×∆ ∆ ≈ × (6)
This kind of phase shifting error is nearly in direct proportion to frequency
changement. The simulation of intensity instability causing wavefront measurement
error was taken, and the result refers to fig 5.
4 wavefront repeatability measurement
Our team has developed a phase shifting point diffraction interferometer. This
instrument was settled in high stable environment. The temperature stability of
interference cavity is better than 0.005℃ during 3 hours. A sequential measurement
without adjusting was taken, and 12 wavefront results were obtained. Every result
was average of 128 single result. The one of 12measurement results, averaging result,
wavefront difference, and corresponding contour are shown in fig 6. And a wavefront
repeatability of 0.057nmRMS was obtained.
Fig.4. Wavefront measurement error due to intensity instability (0 order to 2nd).
Fig.5. Wavefront measurement error due to frequency instability(0 order to 2nd)
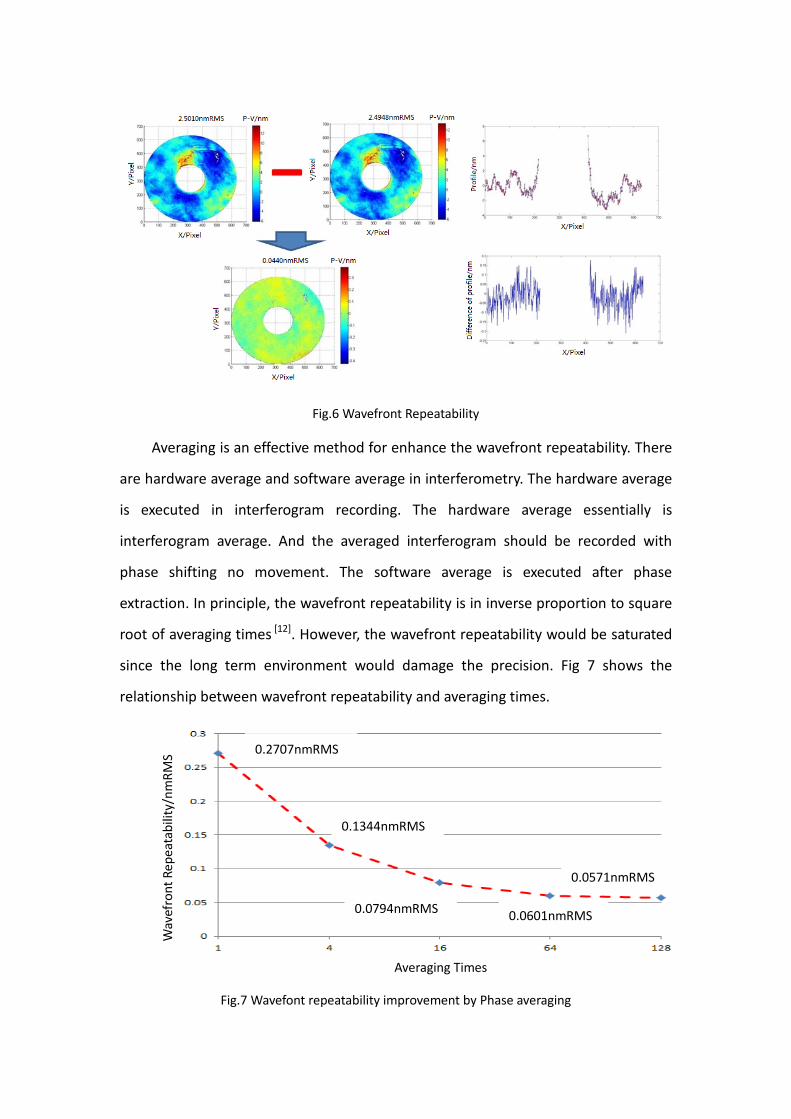
Fig.6 Wavefront Repeatability
Averaging is an effective method for enhance the wavefront repeatability. There
are hardware average and software average in interferometry. The hardware average
is executed in interferogram recording. The hardware average essentially is
interferogram average. And the averaged interferogram should be recorded with
phase shifting no movement. The software average is executed after phase
extraction. In principle, the wavefront repeatability is in inverse proportion to square
root of averaging times [12]. However, the wavefront repeatability would be saturated
since the long term environment would damage the precision. Fig 7 shows the
relationship between wavefront repeatability and averaging times.
Fig.7 Wavefont repeatability improvement by Phase averaging
Averaging Times
Wav
efro
nt R
epea
tabi
lity/
nmRM
S
0.0601nmRMS
0.2707nmRMS
0.0794nmRMS
0.0571nmRMS
0.1344nmRMS

5 Conclusions
In this paper, an error compensation phase extraction algorithm was introduced,
and the presented algorithm was compared to standard algorithms by simulation.
Some kinds of error sources were analyzed. The simulation results show that
presented is more insensitive to these error sources. A Wavefront repeatability
measurement based on presented algorithm and PDI was done. And the wavefront
repeatability of concave mirror measurement came out better than 0.1nmRMS.
Reference [1] Wu B, Kumar A. “Extreme ultraviolet lithography: a review”.
J.Vac.Sci.Technol.,2007,B25(6):1743-1761 [2] Hudyma R. “An overview of optical systems for 30 nm resolution lithography at EUV
wavelengths”. SPIE, 2002, 4832:137-148 [3] Lowisch M, Kuerz P, Mann H J, et al. “Optics for EUV production”. SPIE, 2010,7636:763603-1 [4] Miura T,Murakami K,Suzuki K, et al. “Nikon EUVL development progress summary”. SPIE,
2006,6151: 615105 [5] Takayuki H, Shigeyuki U, Tokuyuki H, et al. “Development Status of Canon’s Full-Field EUV
Tool”. SPIE,2009,7271:72711Y-1 [6] Smartt R. N., Strong J. “Point-diffraction interferometer”. Opt. Soc. Am, 1974, 62:737-742 [7] Gary E. Sommargren, “Phase Shifting Diffraction Interferometry for Measure Extreme
Ultraviolet Optics”, OSA Trends in Optics and Photonics. 1999, Vol.4: 108-112 [8] Kazuya Ota, Takahiro Yamamoto, Yusuke Fukuda, et al. “Advanced Point Diffraction
Interferometer for EUV Aspherical Mirrors”, Emerging Lithographic Technologies V, Proceedings of SPIE Vol. 4343 (2001)
[9] Kazuya Ota*, Takahiro Yamamoto, Yusuke Fukuda, et al. “Aspherical Mirror Measurement using a Point Diffraction Interferometer”, Emerging Lithographic Technologies VI, Proceedings of SPIE Vol. 4688 (2002)
[10] Yu Jie. “Weighted least square phase extraction algorithm for phase-shifting point diffraction interferometer”. Chinese Journal of Optics and Applied Optics[J].2010,3(6):605-615
[11] Yu Jie, Zhang Haitao, Ma Dongmei. “Phase-shifting Point Diffraction Interferometer with High Repeatability”.Opt. Precision Eng 2011.
[12] Sha Dingguo. “Error Analysis and Measurement Uncertainty Evaluation”. Beijing: China Metrology Publishing House, 2003.52~53
Jie Yu, E-mail:[email protected]; Address: Dongnanhu Road No.3888, Changchun, Jilin, China.
Haitao Zhang, E-mail:[email protected]; Address: Dongnanhu Road No.3888, Changchun, Jilin,

China.
Dongmei Ma, E-mail: [email protected] Address: Dongnanhu Road No.3888, Changchun,
Jilin, China.
Chunshui Jin, E-mail:[email protected] Address: Dongnanhu Road No.3888, Changchun, Jilin, China.


