

ESCO TECHNOLOGIES, INC.
2017 ANNUAL REPORT
ES
CO
TE
CH
NO
LO
GIE
S IN
C. • 2
01
7 A
NN
UA
L R
EP
OR
T

ESCO Technologies is a global provider of highly-engineered products and solutions to diverse and growing end-markets. The company consists of four technology-driven business segments – Filtration/Fluid Flow, RF Shielding & Test,Utility Solutions Group and Technical Packaging.
Filtration/Fluid Flow RF Shielding & Test Utility Solutions Group Technical Packaging
Company Portfolio
A balanced, multi-segment approach to sustained growth. Our focus continues to be on generating predictable and profitable long-term growth with innovation driving the expansion of our product offerings across each of our business segments. Our market leadership positions and consistent track record of solid operating results, coupled with key acquisitions broadening our product offerings have ESCO well-positioned to continue delivering long-term revenue and earnings growth.
Our Focus

1
Our Performance
Focused on Results
Financial HighlightsDOLLARS IN MILLIONS, EXCEPT PER SHARE AMOUNTS 2017 2016 2015
Net sales $685.7 571.5 537.3
Net earnings 53.7 45.9 42.5
Earnings per share – GAAP 2.07 1.77 1.62
Earnings per share – As adjusted(1) 2.22 2.03 1.59
CAPITAL PERFORMANCE (As of September 30)
Net debt $ 229 56 11
Leverage ratio 2.20 1.05 .68
Cash from operating activities 67 74 66
$8652% $123 Total Shareholder ReturnFIVE YEAR (9/30/12-9/30/17)
Five-Year Cash Returned to ShareholdersIN MILLIONS
2017 EBITDA – As Adjusted (3)
IN MILLIONS
2017 Sales DOLLARS IN MILLIONS
2017 EBIT – As Adjusted (2)
DOLLARS IN MILLIONS
(1) Excludes $6.1 million of purchase accounting inventory step up charges and acquisition costs in 2017 & $7.8 million of restructuring charges in 2016.(2) Excludes $29.4 million of Corporate Costs and $6.1 million of purchase accounting inventory step up charges and acquisition costs.(3) Excludes $6.1 million of purchase accounting inventory step up charges and acquisition costs.
Filtration/Fluid Flow $279.5RF Shielding & Test 160.8Utility Solutions Group 162.5Technical Packaging 82.9
Filtration/Fluid Flow $54.1RF Shielding & Test 19.5Utility Solutions Group 38.1Technical Packaging 8.5
45%
16%
32%
7%12%
23%
41%24%
2
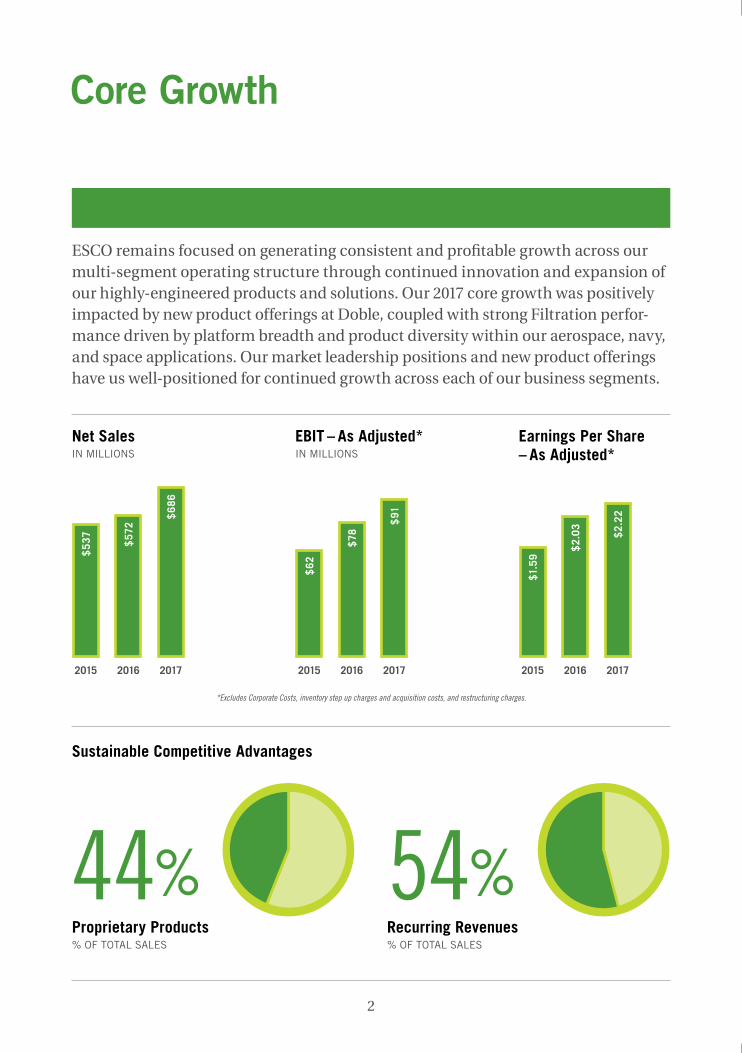
Net SalesIN MILLIONS
EBIT – As Adjusted*IN MILLIONS
Earnings Per Share – As Adjusted*
$53
7
$57
2
$68
6
2015 2016 2017
$62
$78
$91
2015 2016 2017
$1.5
9
$2.0
3
$2.2
2
2015 2016 2017
ESCO remains focused on generating consistent and profitable growth across our multi-segment operating structure through continued innovation and expansion of our highly-engineered products and solutions. Our 2017 core growth was positively impacted by new product offerings at Doble, coupled with strong Filtration perfor-mance driven by platform breadth and product diversity within our aerospace, navy, and space applications. Our market leadership positions and new product offerings have us well-positioned for continued growth across each of our business segments.
Sustainable Competitive Advantages
44% 54%Proprietary Products% OF TOTAL SALES
Recurring Revenues% OF TOTAL SALES
Core Growth
*Excludes Corporate Costs, inventory step up charges and acquisition costs, and restructuring charges.
5
Filtration / Fluid Flow
Utility Solutions Group
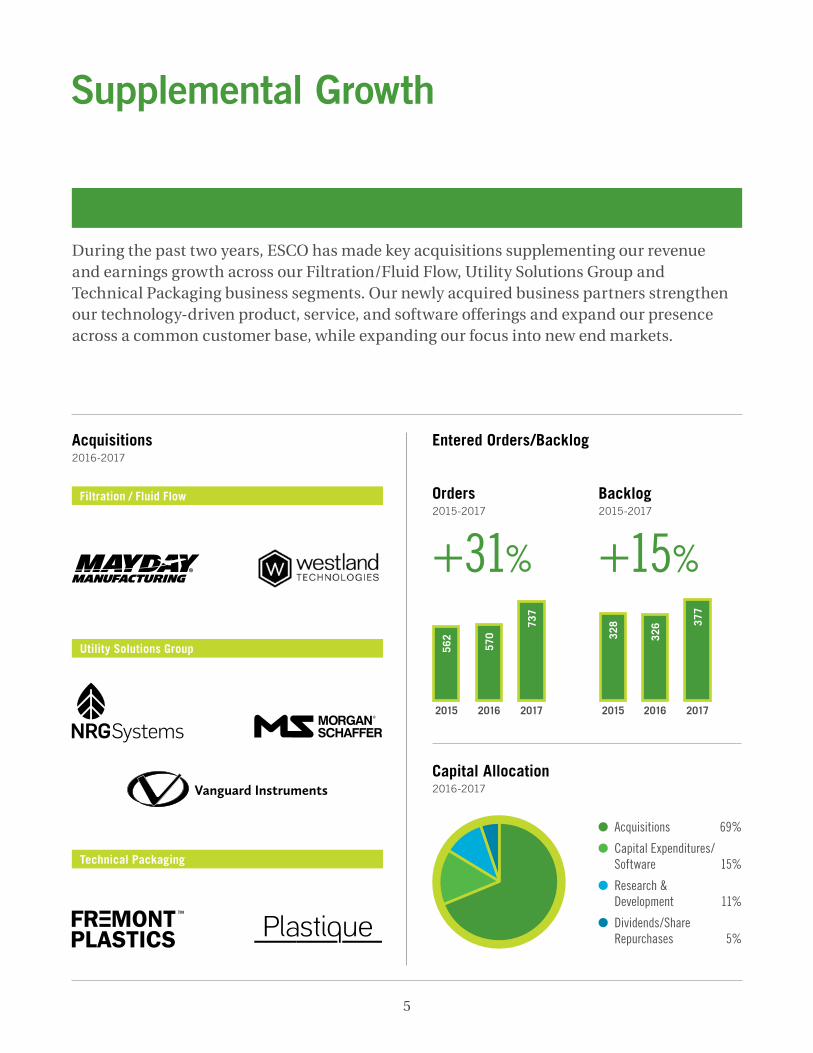
During the past two years, ESCO has made key acquisitions supplementing our revenue and earnings growth across our Filtration/Fluid Flow, Utility Solutions Group and Technical Packaging business segments. Our newly acquired business partners strengthen our technology-driven product, service, and software offerings and expand our presence across a common customer base, while expanding our focus into new end markets.
Supplemental Growth
Acquisitions 2016-2017
Technical Packaging
Capital Allocation 2016-2017
Acquisitions 69%
Capital Expenditures/ Software 15%
Research & Development 11%
Dividends/Share Repurchases 5%
Entered Orders/Backlog56
2
570
737
2015 2016 2017
328
326 37
72015 2016 2017
Orders2015-2017
+31%
Backlog2015-2017
+15%
3
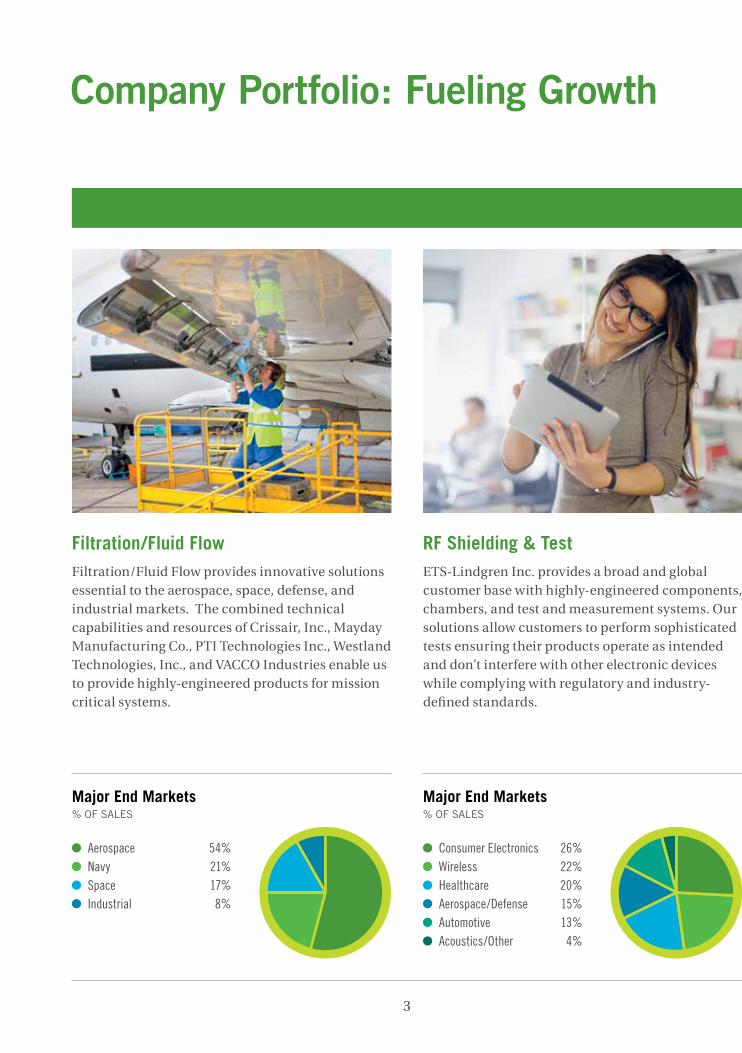
Major End Markets% OF SALES
Consumer Electronics 26%Wireless 22%Healthcare 20%
Aerospace/Defense 15%Automotive 13%
Acoustics/Other 4%
Filtration/Fluid FlowFiltration/Fluid Flow provides innovative solutions essential to the aerospace, space, defense, and industrial markets. The combined technical capabilities and resources of Crissair, Inc., Mayday Manufacturing Co., PTI Technologies Inc., Westland Technologies, Inc., and VACCO Industries enable us to provide highly-engineered products for mission critical systems.
RF Shielding & TestETS-Lindgren Inc. provides a broad and global customer base with highly-engineered components, chambers, and test and measurement systems. Our solutions allow customers to perform sophisticated tests ensuring their products operate as intended and don’t interfere with other electronic devices while complying with regulatory and industry-defined standards.
Company Portfolio: Fueling Growth
Major End Markets% OF SALES
Aerospace 54%Navy 21%Space 17%Industrial 8%

4
Major End Markets% OF SALES
Global Electric Utilities 60%Power Generation 22%Renewable Energy 14%Industrial 4%
Major End Markets% OF SALES
Retail/Consumer 36%Medical/Pharmaceutical 28%Medical Device 22%
Electronic/Food/Other 14%
Utility Solutions GroupThe combined product offerings of Doble Engineering, Morgan Schaffer, and Vanguard Instruments provide a comprehensive portfolio of industry-leading diagnostic equipment and intelligent software and services which minimize risk and optimize electric power infrastructure performance. NRG Systems broadens our portfolio into the renewable energy sector with its focus on serving multiple stages of wind and solar project development.
Technical PackagingTechnical Packaging provides innovative solutions to the medical, pharmaceutical, and commercial markets for thermoformed thin-gauge plastic and pulp-based packaging. Both Thermoform Engineered Quality (TEQ) in the U.S., and Plastique Limited in Europe, are focused on developing solutions for high precision applications as well as meeting the evolving need for enhanced sustainability.
CO
MPA
NY P
OR
TFOLIO
: FUELIN
G G
RO
WTH

6
Expanding Our Reach
Utility Solutions Group
With three acquisitions in 2017, our Utility Solutions Group is expanding to meet the changing requirements of the energy industry: NRG Systems (pictured) widens our focus into the renewable energy market; Morgan Schaffer broadens and strengthens our on-line condition monitoring portfolio; and Vanguard Instruments provides additional depth to our diagnostic test equipment product offerings.
Filtration/Fluid Flow
Westland Technologies and Mayday Manufacturing enhance our presence in the global aerospace and defense markets by providing significant opportunities to leverage our business across a common customer base. Additionally, our proven capabilities offer the potential for meaningful growth through new product development and further expansion into broader platform content.

7
Letter to Shareholders
Dear Shareholders:
2017 was a year in which ESCO continued delivering solid operating results in our core businesses while expanding our product offerings and served markets through key acquisitions. As we move forward, our multi-segment approach remains focused on generating consistent and profitable long-term growth through innovation and expansion of our highly-engineered products and solutions. Our commitment to new product development supplemented by strategic acquisitions continues to broaden our global footprint. We remain well-positioned to continue delivering long-term revenue and earnings growth.
Financial Results
Our 2017 financial performance was highlighted by significant growth in sales, earnings, and ending backlog. Sales increased $115 million (20 percent) to $686 million, led by strong performances at Vacco and Doble and significant contributions from acquisitions. EBITDA – As Adjusted increased 22 percent to $123 million and EPS – As Adjusted increased 9 percent to $2.22 per share.
Orders grew by 29 percent (to $737 million) increasing ending backlog by $51 million (16 percent) with growth reflected across all four business segments. Test led the way with nearly $200 million of orders resulting in a $38 million (49 percent) increase in ending backlog.
Generating $67 million in cash from operating activities helped fund our 2017 investments in acquisitions, capital expenditures, and research and
development and resulted in a very reasonable 2.2 leverage ratio. With continued cash flow generation and substantial credit capacity, we remain well-positioned to supplement our organic growth.
Filtration Fluid/Flow
Crissair, Mayday, PTI, VACCO, and Westland provide innovative products and solutions to the aerospace, space, navy, and industrial markets.
Filtration sales increased $72 million (35 percent) to $280 million in 2017, driven by $12 million at VACCO and $61 million contributed by Mayday and Westland. Adjusted EBIT increased $9 million (20 percent) to $54 million in part driven by Crissair’s strong EBIT margin.
VACCO’s sales increase was primarily driven by the first development contract award for the Virginia Payload Module (VPM) on the Virginia Class Block V submarines and a record year in aftermarket revenue. In 2017, VACCO also received its first production order for the Common Missile Compartment on the Columbia-class ballistic submarines. Space achieved a major milestone with the successful on-orbit demonstration of VACCO’s Micro-Propulsion System on the NanoAce CubeSat, positioning it as a leader in this emerging market.
Our Filtration segment recently added two new businesses to broaden our product offerings. Westland is the market leader in the design and manufacture of elastomeric-based signature

8
reduction solutions to enhance U.S. Navy maritime platform survivability. Westland complements VACCO’s unique submarine and surface ship technologies and expands our presence on the growing fleet of U.S. Naval platforms that serve as a cornerstone of the U.S. national security strategy. Mayday is a build-to-print manufacturer of precise-tolerance machined components and a full-service metal processor for the aerospace and defense industry. The addition of Mayday expands our content on existing platforms and creates the opportunity for meaningful growth across our common global customer base.
Crissair’s consistently strong profit contribution continued in 2017 with our investment in automation which reduces material and labor costs and improves consistency. In addition, Crissair completed the expansion of its facility in Mexico,
enabling increased capacity for lower cost future growth and the ability for insourcing supply chain activities to better control production flow and cost.
RF Shielding & Test
ETS-Lindgren is an innovative supplier of electromagnetic and acoustic measurement and containment solutions for the consumer electronics,
wireless, healthcare, aerospace, and automotive markets. Its test chambers and components create an environment that isolates and controls unintended electromagnetic energy emissions to insure immunity and compatibility during the design stage of new product development. ETS
“Our multi-segment approach remains focused on generating consistent and profitable long-term growth through innovation and
expansion of our highly engineered products and solutions.”
Vic Richey / Chairman, Chief Executive Officer & President
Victor L. Richey (center) Chairman, Chief Executive Officer and President / Gary E. Muenster (left) Executive Vice President and Chief Financial Officer / Alyson S. Barclay (right) Senior Vice President, Secretary and General Counsel

9
engineers are recognized as industry experts and work on a variety of standards committees that write, validate, and manage commercial and regulatory test standards.
A clear highlight for Test in 2017 was the strength of its orders. Record orders of almost $200 million (book-to-bill of 1.23x) reflect continued momentum in the wireless, electric vehicle, and automotive chamber markets. Test’s 2017 ending backlog, plus two large chamber wins in the government/defense and automotive markets subsequent to fiscal year end worth more than $30 million, meaningfully support our outlook for 2018 revenue growth.
While Test revenue was flat in 2017, EBIT margins increased to 12.1 percent. Test finished 2017 on a strong upward trend, reporting a 16 percent EBIT margin in Q4 and delivering $89 million in sales with a 15 percent EBIT margin over the final six months of the year. It’s encouraging to see that our efforts over the past few years to scale down our cost structure and enhance operating efficiency are resulting in increased competitiveness and profitability.
Utility Solutions Group
Our Utility Solutions Group provides industry-leading diagnostic equipment and intelligent software and services to minimize risk and optimize electric power
infrastructure performance for the electric utility and renewable energy industries.
USG sales increased $35 million (27 percent) in 2017, driven by $11 million (8 percent) of organic revenue growth at Doble related to new products and software solutions and $24 million in revenue from our newly acquired businesses. Adjusted EBIT increased $5 million (14 percent) to $38 million, with Doble leading the way with a 26 percent EBIT margin.
Utility industry cyber security regulations continue to drive growth as our customers respond to requirements to keep the power grid safe and secure. Customers are turning to Doble for protection software and database solutions (PowerBase) and field force automation programs (Doble Universal Controller™ or DUCe). Doble also recently announced its new Geometric Disturbance Risk Mitigation Services program to help customers comply with a new North American Electric Reliability Corporation (NERC) regulation regarding susceptibility to currents triggered by solar storms. Doble’s consulting services will assist transmission and generation owners by conducting initial and ongoing assessments of the potential impact of severe geomagnetic disturbances and developing targeted mitigation plans.
2017 was an exciting year for USG with the addition of three new companies. Morgan Schaffer and Vanguard design and manufacture innovative test equipment and expand our product offerings in dissolved gas analysis (DGA) and circuit breaker testing. NRG serves multiple stages of wind and solar energy project development and provides tools for atmospheric remote sensing applications. NRG is a global technology company and expands our focus into the renewable energy and resource

10
sustainability markets. The integration of these new business partners has gone well and has our USG segment positioned for continued growth, offering a broader product portfolio and global presence.
Technical Packaging
TEQ and Plastique provide innovative thermoformed and pulp based packaging solutions to the medical, pharmaceutical, and commercial markets.
Technical Packaging sales increased $8 million (11 percent) in 2017, and orders increased $10 million (13 percent) to $87 million driven by higher KAZ, medical, medical device, and pharmaceutical projects. With a book-to-bill of 1.05x, ending backlog increased $4 million (20 percent).
As we finalized the integration of Plastique, several projects were undertaken this year to enhance our European operations. A new state-of-the-art class 7 cleanroom for the production of custom thermoformed medical packaging was installed at Plastique’s facility in England. In addition, our manufacturing facility in Poznan, Poland was expanded to increase our thermoformed plastic and dry pressed fibre operations and to add warehouse space. These investments better position the group by increasing production capabilities to better serve our global end markets.
Our Focus Continues
2017 was an exciting year for ESCO as we delivered solid operating results while successfully expanding our company portfolio. Our corporate strategy remains centered around our multi-segment approach designed to enable sustainable sales and earnings growth, while mitigating risk through end-market diversification. We remain focused on creating profitable growth through new product development and selective acquisitions that broaden our product offerings and served markets.
Our management team is steadfast in its commitment to increasing long-term shareholder value, and we believe our recent share price appreciation is indicative of the market’s recognition of our commitment to, and success in delivering predictable and profitable long-term growth. Our market leadership positions and product diversity have us well-positioned for continued growth at levels above our peers.
On behalf of our management team and Board of Directors, I would like to thank our shareholders and employees for their continuing support.
November 29, 2017
Vic Richey Chairman, Chief Executive Officer & President
Gary Muenster Executive Vice President & Chief Financial Officer
“We remain focused on creating profitable growth through new product development and selective acquisitions that
broaden our product offerings and served markets.”
Vic Richey / Chairman, Chief Executive Officer & President

Fiscal Year 2017
ESCO TECHNOLOGIES, INC.
Form 10-K

UNITED STATES
SECURITIES AND EXCHANGE COMMISSION WASHINGTON, DC 20549
_______________________
FORM 10-K
[X] ANNUAL REPORT PURSUANT TO SECTION 13 OR 15(d) OF THE SECURITIES EXCHANGE ACT
OF 1934
For the fiscal year ended September 30, 2017
OR
[ ] TRANSITION REPORT PURSUANT TO SECTION 13 OR 15(d) OF THE SECURITIES EXCHANGE
ACT OF 1934
For the transition period from _____ to_____
Commission file number: 1-10596
_______________________
ESCO Technologies Inc. (Exact name of registrant as specified in its charter)
Missouri 43-1554045
(State or other jurisdiction (I.R.S. Employer
of incorporation or organization) Identification No.)
9900A Clayton Road
St. Louis, Missouri 63124-1186
(Address of principal executive offices) (Zip Code)
Registrant’s telephone number, including area code:
(314) 213-7200
Securities registered pursuant to section 12(b) of the Act:
Name of each exchange
Title of each class on which registered
Common Stock, par value $0.01 per share New York Stock Exchange
Securities registered pursuant to section 12(g) of the Act:
None
_______________________
Indicate by check mark if the registrant is a well-known seasoned issuer, as defined in Rule 405 of the Securities Act.
Yes No
Indicate by check mark if the registrant is not required to file reports pursuant to Section 13 or Section 15(d) of the
Act.
Indicate by check mark whether the registrant: (1) has filed all reports required to be filed by Section 13 or 15(d) of
the Securities Exchange Act of 1934 during the preceding 12 months (or for such shorter period that the registrant was
required to file such reports), and (2) has been subject to such filing requirements for the past 90 days. Yes No
Indicate by check mark whether the registrant has submitted electronically and posted on its corporate web site, if any,
every Interactive Data File required to be submitted and posted pursuant to Rule 405 of Regulation S-T during the
preceding 12 months (or for such shorter period that the registrant was required to submit and post such files).
Yes No
Indicate by check mark if disclosure of delinquent filers pursuant to Item 405 of Regulation S-K is not contained
herein, and will not be contained, to the best of registrant’s knowledge, in definitive proxy or information statements
incorporated by reference in Part III of this Form l0-K or any amendment to this Form l0-K.

Indicate by check mark whether the registrant is a large accelerated filer, an accelerated filer, a non-accelerated filer,
smaller reporting company, or an emerging growth company. See the definitions of “large accelerated filer”,
“accelerated filer,” “smaller reporting company” and “emerging growth company” in Rule 12b-2 of the Exchange Act.
Large accelerated filer Accelerated filer
Non-accelerated filer (Do not check if a smaller reporting company) Smaller reporting company
Emerging growth company
If an emerging growth company, indicate by check mark if the registrant has elected not to use the extended transition
period for complying with any new or revised financial accounting standards provided pursuant to Section 13(a) of the
Indicate by check mark whether the registrant is a shell company (as defined in Rule 12b-2 of the Act). Yes
No
Aggregate market value of the Common Stock held by non-affiliates of the registrant as of the close of trading on
March 31, 2017, the last business day of the registrant’s most recently completed second fiscal quarter: approximately
$1,455,041,000.*
* Based on the New York Stock Exchange closing price. For purpose of this calculation only,
without determining whether the following are affiliates of the registrant, the registrant has assumed
that (i) its directors and executive officers are affiliates, and (ii) no party who has filed a Schedule
13D or 13G is an affiliate.
Number of shares of Common Stock outstanding at November 6, 2017: 25,835,902
_______________________
DOCUMENTS INCORPORATED BY REFERENCE:
Part III of this Report incorporates by reference certain portions of the registrant’s definitive Proxy Statement for its
2018 Annual Meeting of Shareholders, which the registrant currently anticipates first sending to shareholders on or
about December 14, 2017 (hereinafter, the “2017 Proxy Statement”).
i
INDEX TO ANNUAL REPORT ON FORM 10-K
Page
FORWARD-LOOKING INFORMATION ii
PART I
1. Business 1 The Company 1 Products 2 Marketing and Sales 4 Intellectual Property 4 Backlog 5 Purchased Components and Raw Materials 5 Competition 5 Research and Development 6 Environmental Matters 6 Government Contracts 6 Discontinued Operations 6 Employees 6 Financing 7 Additional Information 7 Executive Officers of the Registrant 7 1A. Risk Factors 7 1B. Unresolved Staff Comments 12 2. Properties 13 3. Legal Proceedings 14 4. Mine Safety Disclosures 14
PART II
5. Market for Registrant’s Common Equity, Related Stockholder Matters and Issuer Purchases of Equity Securities 15
6. Selected Financial Data 17 7. Management’s Discussion and Analysis of Financial Condition and Results of Operations 17 7A. Quantitative and Qualitative Disclosures About Market Risk 30 8. Financial Statements and Supplementary Data 30 9. Changes in and Disagreements with Accountants on Accounting and Financial Disclosure 31 9A. Controls and Procedures 31 9B. Other Information 31
PART III
10. Directors, Executive Officers and Corporate Governance 32 11. Executive Compensation 32 12. Security Ownership of Certain Beneficial Owners and Management and Related Stockholder Matters 32 13. Certain Relationships and Related Transactions, and Director Independence 32 14. Principal Accounting Fees and Services 32
PART IV
15. Exhibits, Financial Statement Schedules 33
SIGNATURES 37
FINANCIAL INFORMATION F-1
EXHIBITS

ii
FORWARD-LOOKING INFORMATION
Statements contained in this Form 10-K regarding future events and the Company’s future results that are based on
current expectations, estimates, forecasts and projections about the Company’s performance and the industries in
which the Company operates are considered “forward-looking statements” within the meaning of the safe harbor
provisions of the Federal securities laws. These include, without limitation, statements about: the adequacy of the
Company’s buildings, machinery and equipment; the adequacy of the Company’s credit facilities and future cash
flows; the outcome of litigation, claims and charges; future costs relating to environmental matters; continued
reinvestment of foreign earnings and the resulting U.S. tax liability in the event such earnings are repatriated;
repayment of debt within the next twelve months; the outlook for 2018 and beyond, including amounts, timing and
sources of 2018 sales, revenues, sales growth, EBIT, EBITDA, EBIT margins and EPS; interest on Company debt
obligations; the ability of expected hedging gains or losses to be offset by losses or gains on related underlying
exposures; the Company’s ability to increase shareholder value; acquisitions; income tax expense and the Company’s
expected effective tax rate; minimum cash funding required by, expected benefits payable from, and Management’s
assumptions about future events which could affect liability under, the Company’s defined benefit plans and other
postretirement benefit plans; the recognition of unrecognized compensation costs related to share-based
compensation arrangements; the Company’s exposure to market risk related to interest rates and to foreign currency
exchange risk; the likelihood of future variations in the Company’s assumptions or estimates used in recording
contracts and expected costs at completion under the percentage of completion method; the Company’s estimates
and assumptions used in the preparation of its financial statements; cost and estimated earnings on long-term
contracts; valuation of inventories; estimates of uncollectible accounts receivable; the risk of goodwill impairment;
the Company’s estimates utilized in software revenue recognition, non-cash depreciation and the amortization of
intangible assets; the valuation of deferred tax assets; estimates of future cash flows and fair values in connection with
the risk of goodwill impairment; amounts of NOL not realizable and the timing and amount of the reduction of
unrecognized tax benefits; the effects of implementing recently issued accounting pronouncements; and any other
statements contained herein which are not strictly historical. Words such as expects, anticipates, targets, goals,
projects, intends, plans, believes, estimates, variations of such words, and similar expressions are intended to identify
such forward-looking statements.
Investors are cautioned that such statements are only predictions and speak only as of the date of this Form 10-K, and
the Company undertakes no duty to update the information in this Form 10-K except as may be required by applicable
laws or regulations. The Company’s actual results in the future may differ materially from those projected in the
forward-looking statements due to risks and uncertainties that exist in the Company’s operations and business
environment, including but not limited to those described herein under “Item 1A, Risk Factors,” and the following: Aclara’s continuing ability to perform contracts guaranteed by the Company; the impacts of labor disputes, civil
disorder, wars, elections, political changes, terrorist activities or natural disasters on the Company’s operations and
those of the Company’s customers and suppliers; the timing and content of future customer orders; the appropriation
and allocation of government funds; the termination for convenience of government and other customer contracts; the
timing and magnitude of future contract awards; weakening of economic conditions in served markets; the success of
the Company’s competitors; changes in customer demands or customer insolvencies; competition; intellectual
property rights; technical difficulties; the availability of selected acquisitions; delivery delays or defaults by
customers; performance issues with key customers, suppliers and subcontractors; material changes in the costs of
certain raw materials; material changes in the cost of credit; changes in laws and regulations including but not limited
to changes in accounting standards and taxation requirements; costs relating to environmental matters; litigation
uncertainty; and the Company’s successful execution of internal restructuring and other plans.
PART I
Item 1. Business
The Company
The Registrant, ESCO Technologies Inc. (ESCO), is a producer of engineered products and systems sold to customers
worldwide, primarily for utility, industrial, aerospace and commercial applications. ESCO conducts its business
through a number of wholly-owned direct and indirect subsidiaries. ESCO and its subsidiaries are referred to in this
Report as “the Company.”
ESCO was incorporated in Missouri in August 1990 as a wholly owned subsidiary of Emerson Electric Co. (Emerson)
to be the indirect holding company for several Emerson subsidiaries, which were primarily in the defense business.
Ownership of the Company was spun off by Emerson to its shareholders on October 19, 1990, through a special
distribution. Since that time, through a series of acquisitions and divestitures, the Company has shifted its primary
focus from defense contracting to the production and supply of engineered products and systems marketed to utility,
industrial, aerospace and commercial users.
The Company’s fiscal year ends September 30. Throughout this document, unless the context indicates otherwise,
references to a year (for example 2017) refer to the Company’s fiscal year ending on September 30 of that year.
The Company is organized based on the products and services it offers, and classifies its business operations in
segments for financial reporting purposes. As a result of the acquisitions of Plastique and Fremont discussed in Item 7,
“Management’s Discussion and Analysis of Financial Condition and Results of Operations,” beginning in the second
quarter of 2016 Management expanded the presentation of its reporting segments to include a fourth segment,
Technical Packaging. Prior period segment amounts have been reclassified to conform to the current period
presentation.
The Company’s four segments, together with the significant domestic and foreign operating subsidiaries within each
segment during 2017, are as follows:
Filtration/Fluid Flow (Filtration):
PTI Technologies Inc. (PTI)
VACCO Industries (VACCO)
Crissair, Inc. (Crissair)
Westland Technologies, Inc. (Westland)
Mayday Manufacturing Co. (Mayday)
Hi-Tech Metals, Inc. (Hi-Tech)
RF Shielding and Test (Test):
ETS-Lindgren Inc.
Except as the context otherwise indicates, the term “ETS-Lindgren” as used herein includes ETS-Lindgren
Inc. and the Company’s other Test segment subsidiaries.
Utility Solutions Group (USG):
Doble Engineering Company
Morgan Schaffer Ltd. (Morgan Schaffer)
NRG Systems, Inc. (NRG)
Except as the context otherwise indicates, the term “Doble” as used herein includes Doble Engineering
Company and the Company’s USG subsidiaries other than Morgan Schaffer and NRG.
Technical Packaging:
Thermoform Engineered Quality LLC (TEQ)
Plastique Limited
Plastique Sp. z o.o.
Plastique Limited and Plastique Sp. z o.o. are referred to together herein as “Plastique.”
The Company’s operating subsidiaries are engaged primarily in the research, development, manufacture, sale and
support of the products and systems described below. Their respective businesses are subject to a number of risks and
uncertainties, including without limitation those discussed in Item 1A, “Risk Factors.” See also Item 7,

2
“Management’s Discussion and Analysis of Financial Condition and Results of Operations,” and “Forward-Looking
Information.”
ESCO is continually seeking ways to save costs, streamline its business processes and enhance the branding of its
products and services. In October 2015 the Company announced several restructuring and realignment actions
involving the Test and USG segments which were completed during 2016, including closing ETS-Lindgren’s
operating subsidiaries in Germany and the United Kingdom and consolidating their operations into other existing Test
facilities; eliminating certain underperforming product line offerings in Test primarily related to lower margin
international shielding end markets; reducing headcount in Test’s U.S. business; and closing Doble’s Brazil operating
office and consolidating Doble’s South American sales and support activities.
ESCO is also continually seeking opportunities to supplement its growth by making strategic acquisitions. During
2017, the Company acquired Mayday, a leading manufacturer of mission-critical bushings, pins, sleeves and
precision-tolerance machined components for landing gear, rotor heads, engine mounts, flight controls, and actuation
systems for the aerospace and defense industries; Hi-Tech, a full-service metal processor offering aerospace original
equipment manufacturers (“OEMs”) and Tier 1 suppliers a large portfolio of processing services including anodizing,
cadmium and zinc-nickel plating, organic coatings, non-destructive testing, and heat treatment; NRG, the global
market leader in the design and manufacture of decision support tools for the renewable energy industry, primarily
wind; and the assets of Morgan Schaffer Inc., which designs, develops, manufactures and markets an integrated
offering of dissolved gas analysis, oil testing, and data management solutions which enhance the ability of electric
utilities to accurately monitor the health of critical power transformers. In August 2017, the Company acquired the
assets of Vanguard Instruments Company (Vanguard Instruments), a test equipment provider serving the global
electric utility market. More information about these 2017 acquisitions as well as the Company’s acquisition activity
during 2016 and 2015 is provided in Item 7, “Management’s Discussion and Analysis of Financial Condition and
Results of Operations,” and in Note 2 to the Consolidated Financial Statements included herein.
Products
The Company’s principal products are described below. See Note 13 to the Consolidated Financial Statements
included herein for financial information regarding business segments and 10% customers.
Filtration
The Filtration segment accounted for approximately 41%, 36% and 37% of the Company’s total revenue in 2017,
2016 and 2015, respectively.
PTI is a leading supplier of filtration and fluid control products serving the commercial aerospace, military aerospace
and various industrial markets. Products include filter elements, manifolds, assemblies, modules, indicators and other
related components. All products must meet stringent qualification requirements and withstand severe operating
conditions. Product applications include: hydraulic, fuel, cooling and air filtration systems for fixed wing and rotary
aircraft, mobile transportation and construction equipment, aircraft engines and stationary plant equipment. PTI
supplies products worldwide to OEMs and the U.S. government under long term contracts, and to the commercial and
military aftermarket through distribution channels.
VACCO supplies filtration and fluid control products including valves, manifolds, filters, regulators and various other
components for use in the space, military aerospace, defense missile systems, U.S. Navy and commercial industries.
Applications include aircraft fuel and de-icing systems, missiles, satellite propulsion systems, satellite launch vehicles
and other space transportation systems such as the Space Launch System. VACCO also utilizes its multi-fab
technology and capabilities to produce products for use in space and U.S. Navy applications.
Crissair supplies a wide variety of custom and standard valves, actuators, manifolds and other various components to
the aerospace, defense, automotive and commercial industries. Product applications include hydraulic, fuel and air
filtration systems for commercial and military fixed wing and rotary aircraft, defense missile systems and commercial
engines. Crissair supplies products worldwide to OEMs and to the U.S. Government under long term contracts and to
the commercial aftermarket through distribution channels.
Westland is a leading designer and manufacturer of elastomeric-based signature reduction solutions to enhance U.S.
Navy maritime survivability. Westland’s products include complex tiles and other shock and vibration dampening
systems that reduce passive acoustic signatures and/or modify signal (radar, infrared, acoustical, sonar) emission and
reflection to reduce or obscure a vessel’s signature. Westland’s products are used on the majority of the U.S. Naval
fleet including submarines, surface ships and aircraft carriers.

3
Mayday is a manufacturer of mission-critical bushings, pins, sleeves and precision-tolerance machined components
for landing gear, rotor heads, engine mounts, flight controls, and actuation systems for the aerospace and defense
industry.
Hi-Tech is a full-service metal processor offering aerospace OEM’s and Tier 1 suppliers a large portfolio of
processing services including anodizing, cadmium and zinc-nickel plating, organic coatings, non-destructive testing,
and heat treatment. Its portfolio includes over 100 OEM processing approvals.
Test
The Test segment accounted for approximately 23%, 28% and 33% of the Company’s total revenue in 2017, 2016 and
2015, respectively.
ETS-Lindgren designs and manufactures products to measure and contain magnetic, electromagnetic and acoustic
energy. It supplies customers with a broad range of isolated environments and turnkey systems, including RF test
facilities, acoustic test enclosures, RF and magnetically shielded rooms, secure communication facilities, RF
measurement systems and broadcast and recording studios. Many of these facilities include proprietary features such
as shielded doors and windows. ETS-Lindgren also provides the design, program management, installation and
integration services required to successfully complete these types of facilities.
ETS-Lindgren also supplies customers with a broad range of components including RF absorptive materials, RF
filters, active compensation systems, antennas, antenna masts, turntables and electric and magnetic probes, RF test
cells, proprietary measurement software and other test accessories required to perform a variety of tests.
ETS-Lindgren offers a variety of services including calibration for antennas and field probes, chamber certification,
field surveys, customer training and a variety of product tests. ETS-Lindgren’s test labs are accredited by the
following organizations: American Association for Laboratory Accreditation, National Voluntary Laboratory
Accreditation Program and CTIA-The Wireless Association Accredited Test Lab. ETS-Lindgren serves the acoustics,
medical, health and safety, electronics, wireless communications, automotive and defense markets.
USG
The USG segment accounted for approximately 24%, 22% and 23% of the Company’s total revenue in 2017, 2016
and 2015, respectively.
Doble develops, manufactures, and delivers diagnostic testing solutions for electrical equipment comprising the
electric power grid, and enterprise management systems, that are designed to optimize electrical power assets and
system performance, minimize risk and improve operations. It combines three core elements for customers –
diagnostic test and monitoring instruments, expert consulting, and testing services – and provides access to its large
reserve of related empirical knowledge. Doble flagship solutions include protection diagnostics with the Doble
Protection Suite and F6000 series, the M4100 and new transformational patent-pending technology of the M7100
Doble Tester, the dobleARMS® asset risk management system, and the Enoserv PowerBase® and DUCe compliance
tools for the North American Electric Reliability Corporation Critical Infrastructure Protection plan (NERC CIP), a set
of requirements designed to secure the assets required for operating North America’s bulk electric system. Doble has
seven offices in the United States and nine international offices.
Morgan Schaffer designs, develops, manufactures and markets an integrated offering of dissolved gas analysis, oil
testing, and data management solutions which enhance the ability of electric utilities to accurately monitor the health
of critical power transformers.
NRG is the global market leader in the design and manufacture of decision support tools for the renewable energy
industry, primarily wind.
Technical Packaging
The Technical Packaging segment accounted for approximately 12%, 13% and 7% of the Company’s total revenue in
2017, 2016 and 2015, respectively. Prior to 2016 the Technical Packaging business was included in the Filtration
segment.
TEQ produces highly engineered thermoformed products and packaging materials for medical, pharmaceutical, retail,
food and electronic applications. Through its alliance partner program, TEQ also provides its clients with a total
packaging solution including engineering services and testing, sealing equipment and tooling, contract manufacturing,
and packing.

4
Plastique, with locations in the UK and Poland, designs and manufactures plastic and pulp fibre packaging for
customers in the personal care, household products, pharmaceutical, food and broader retail markets. Through its
Fibrepak brand, Plastique became the first European manufacturer of smooth-surfaced press-to-dry pulp packaging, a
sustainable alternative to plastic packaging.
Marketing and Sales
The Company’s products generally are distributed to customers through a domestic and foreign network of
distributors, sales representatives, direct sales teams and in-house sales personnel.
The Company’s sales to international customers accounted for approximately $183 million (27%), $168 million (29%)
and $152 million (28%) of the Company’s total revenue in 2017, 2016 and 2015, respectively. See Note 13 to the
Consolidated Financial Statements included herein for financial information regarding geographic areas. See also Item
1A, “Risk Factors,” for a discussion of risks of the Company’s international operations.
Some of the Company’s products are sold directly or indirectly to the U.S. Government under contracts with the
Army, Navy and Air Force and subcontracts with prime contractors of such entities. Direct and indirect sales to the
U.S. Government, primarily related to the Filtration segment, accounted for approximately 20%, 14% and 15% of the
Company’s total revenue in 2017, 2016 and 2015, respectively.
Intellectual Property
The Company owns or has other rights in various forms of intellectual property (i.e., patents, trademarks, service
marks, copyrights, mask works, trade secrets and other items). As a major supplier of engineered products to industrial
and commercial markets, the Company emphasizes developing intellectual property and protecting its rights therein.
However, the scope of protection afforded by intellectual property rights, including those of the Company, is often
uncertain and involves complex legal and factual issues. Some intellectual property rights, such as patents, have only a
limited term. Also, there can be no assurance that third parties will not infringe or design around the Company’s
intellectual property. Policing unauthorized use of intellectual property is difficult, and infringement and
misappropriation are persistent problems for many companies, particularly in some international markets. In addition,
the Company may not elect to pursue an unauthorized user due to the high costs and uncertainties associated with
litigation. Further, there can be no assurance that courts will ultimately hold issued patents or other intellectual
property valid and enforceable. See Item 1A, “Risk Factors.”
A number of products in the Filtration segment are based on patented or otherwise proprietary technology that sets
them apart from the competition, such as VACCO’s proprietary quieting technology, Westland’s signature reduction
solutions, and Mayday’s and Hi-Tech’s business solutions software.
In the Test segment, patent protection has been sought for significant inventions. Examples of such inventions include
novel designs for window and door assemblies used in shielded enclosures and anechoic chambers, improved acoustic
techniques for sound isolation and a variety of unique antennas. In addition, the Test segment holds a number of
patents, and has patents pending, on products used to perform wireless device testing.
In the USG segment, the segment policy is to seek patent and/or other forms of intellectual property protection on new
and improved products, components of products and methods of operation for its businesses, as such developments
are made. Doble is pursuing patent protection on improvements to its line of diagnostic equipment and NERC CIP
compliance tools. Doble also holds an extensive library of apparatus performance information useful to Doble
employees and to entities that generate, distribute or consume electric energy. Doble makes part of this library
available to registered users via an Internet portal. NRG is pursuing patent protection on its upcoming line of bat
deterrent systems, which are expected to reduce bat mortality at windfarms.
The Technical Packaging segment emphasizes advanced manufacturing technology and methods. For example, the
TEQ 3-in-1 tooling system, with an added stacking tool, provides a competitive edge over traditional thermoform
tooling; and Plastique’s “Cure-In-The-Mold” technology produces high-quality, smooth-surface, thin-wall packaging
products which may be made from sustainable virgin crop fibers or virgin pulp. The segment’s intellectual property
consists chiefly of trade secrets and proprietary technology embodied in products for which the Company is the only
approved source, such as the TEQconnexTM and TEQethelyeneTM single polymer sterile barrier medical packaging
systems for which TEQ owns the validation studies required to register the package with the FDA.
The Company considers its patents and other intellectual property to be of significant value in each of its segments.
5
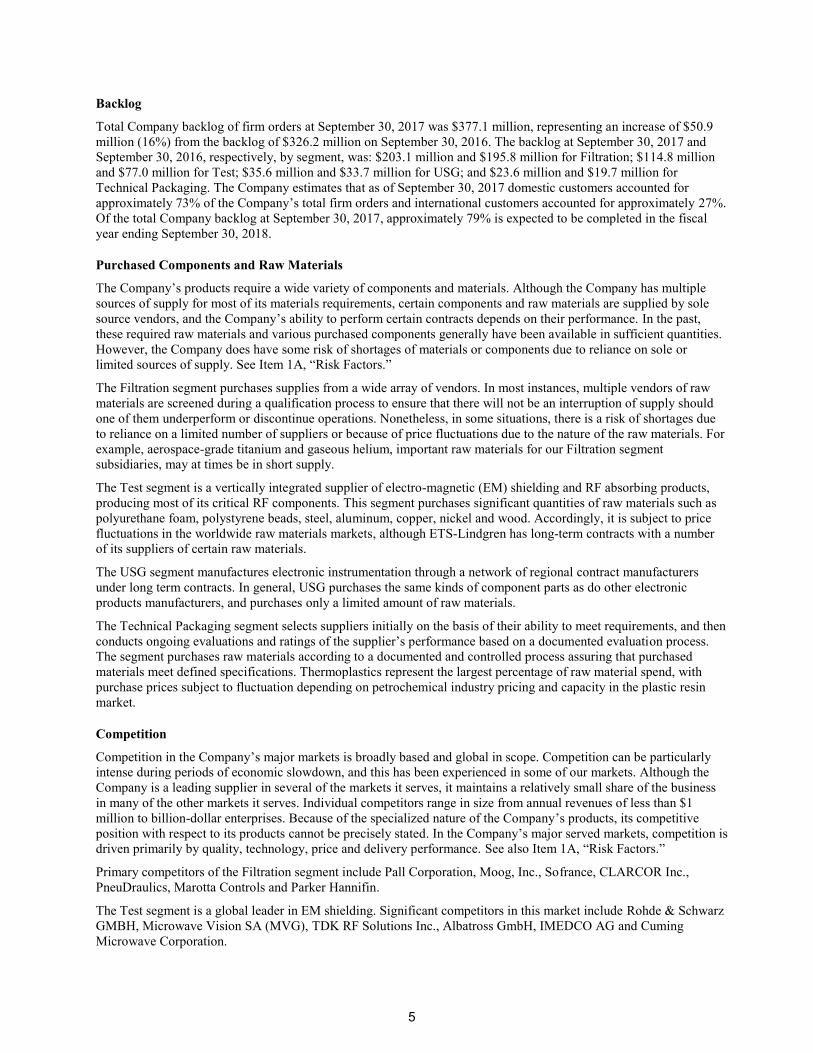
Backlog
Total Company backlog of firm orders at September 30, 2017 was $377.1 million, representing an increase of $50.9
million (16%) from the backlog of $326.2 million on September 30, 2016. The backlog at September 30, 2017 and
September 30, 2016, respectively, by segment, was: $203.1 million and $195.8 million for Filtration; $114.8 million
and $77.0 million for Test; $35.6 million and $33.7 million for USG; and $23.6 million and $19.7 million for
Technical Packaging. The Company estimates that as of September 30, 2017 domestic customers accounted for
approximately 73% of the Company’s total firm orders and international customers accounted for approximately 27%.
Of the total Company backlog at September 30, 2017, approximately 79% is expected to be completed in the fiscal
year ending September 30, 2018.
Purchased Components and Raw Materials
The Company’s products require a wide variety of components and materials. Although the Company has multiple
sources of supply for most of its materials requirements, certain components and raw materials are supplied by sole
source vendors, and the Company’s ability to perform certain contracts depends on their performance. In the past,
these required raw materials and various purchased components generally have been available in sufficient quantities.
However, the Company does have some risk of shortages of materials or components due to reliance on sole or
limited sources of supply. See Item 1A, “Risk Factors.”
The Filtration segment purchases supplies from a wide array of vendors. In most instances, multiple vendors of raw
materials are screened during a qualification process to ensure that there will not be an interruption of supply should
one of them underperform or discontinue operations. Nonetheless, in some situations, there is a risk of shortages due
to reliance on a limited number of suppliers or because of price fluctuations due to the nature of the raw materials. For
example, aerospace-grade titanium and gaseous helium, important raw materials for our Filtration segment
subsidiaries, may at times be in short supply.
The Test segment is a vertically integrated supplier of electro-magnetic (EM) shielding and RF absorbing products,
producing most of its critical RF components. This segment purchases significant quantities of raw materials such as
polyurethane foam, polystyrene beads, steel, aluminum, copper, nickel and wood. Accordingly, it is subject to price
fluctuations in the worldwide raw materials markets, although ETS-Lindgren has long-term contracts with a number
of its suppliers of certain raw materials.
The USG segment manufactures electronic instrumentation through a network of regional contract manufacturers
under long term contracts. In general, USG purchases the same kinds of component parts as do other electronic
products manufacturers, and purchases only a limited amount of raw materials.
The Technical Packaging segment selects suppliers initially on the basis of their ability to meet requirements, and then
conducts ongoing evaluations and ratings of the supplier’s performance based on a documented evaluation process.
The segment purchases raw materials according to a documented and controlled process assuring that purchased
materials meet defined specifications. Thermoplastics represent the largest percentage of raw material spend, with
purchase prices subject to fluctuation depending on petrochemical industry pricing and capacity in the plastic resin
market.
Competition
Competition in the Company’s major markets is broadly based and global in scope. Competition can be particularly
intense during periods of economic slowdown, and this has been experienced in some of our markets. Although the
Company is a leading supplier in several of the markets it serves, it maintains a relatively small share of the business
in many of the other markets it serves. Individual competitors range in size from annual revenues of less than $1
million to billion-dollar enterprises. Because of the specialized nature of the Company’s products, its competitive
position with respect to its products cannot be precisely stated. In the Company’s major served markets, competition is
driven primarily by quality, technology, price and delivery performance. See also Item 1A, “Risk Factors.”
Primary competitors of the Filtration segment include Pall Corporation, Moog, Inc., Sofrance, CLARCOR Inc.,
PneuDraulics, Marotta Controls and Parker Hannifin.
The Test segment is a global leader in EM shielding. Significant competitors in this market include Rohde & Schwarz
GMBH, Microwave Vision SA (MVG), TDK RF Solutions Inc., Albatross GmbH, IMEDCO AG and Cuming
Microwave Corporation.
6
Significant competitors of the USG segment include OMICRON electronics Corp., Megger Group Limited, Vaisala
and Qualitrol Company LLC (a subsidiary of Danaher Corporation).
Significant Competitors of the Technical Packaging segment include Nelipak Corporation, Prent Corporation, Placon
Corporation and Sonoco /Alloyd.
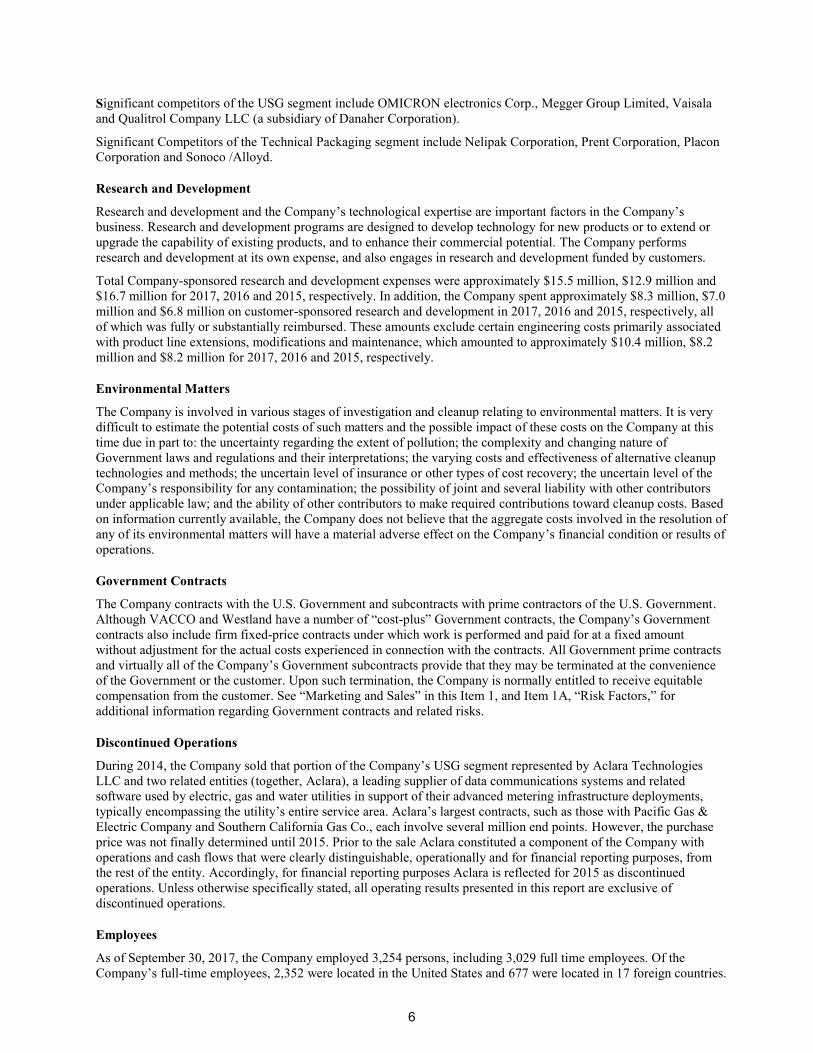
Research and Development
Research and development and the Company’s technological expertise are important factors in the Company’s
business. Research and development programs are designed to develop technology for new products or to extend or
upgrade the capability of existing products, and to enhance their commercial potential. The Company performs
research and development at its own expense, and also engages in research and development funded by customers.
Total Company-sponsored research and development expenses were approximately $15.5 million, $12.9 million and
$16.7 million for 2017, 2016 and 2015, respectively. In addition, the Company spent approximately $8.3 million, $7.0
million and $6.8 million on customer-sponsored research and development in 2017, 2016 and 2015, respectively, all
of which was fully or substantially reimbursed. These amounts exclude certain engineering costs primarily associated
with product line extensions, modifications and maintenance, which amounted to approximately $10.4 million, $8.2
million and $8.2 million for 2017, 2016 and 2015, respectively.
Environmental Matters
The Company is involved in various stages of investigation and cleanup relating to environmental matters. It is very
difficult to estimate the potential costs of such matters and the possible impact of these costs on the Company at this
time due in part to: the uncertainty regarding the extent of pollution; the complexity and changing nature of
Government laws and regulations and their interpretations; the varying costs and effectiveness of alternative cleanup
technologies and methods; the uncertain level of insurance or other types of cost recovery; the uncertain level of the
Company’s responsibility for any contamination; the possibility of joint and several liability with other contributors
under applicable law; and the ability of other contributors to make required contributions toward cleanup costs. Based
on information currently available, the Company does not believe that the aggregate costs involved in the resolution of
any of its environmental matters will have a material adverse effect on the Company’s financial condition or results of
operations.
Government Contracts
The Company contracts with the U.S. Government and subcontracts with prime contractors of the U.S. Government.
Although VACCO and Westland have a number of “cost-plus” Government contracts, the Company’s Government
contracts also include firm fixed-price contracts under which work is performed and paid for at a fixed amount
without adjustment for the actual costs experienced in connection with the contracts. All Government prime contracts
and virtually all of the Company’s Government subcontracts provide that they may be terminated at the convenience
of the Government or the customer. Upon such termination, the Company is normally entitled to receive equitable
compensation from the customer. See “Marketing and Sales” in this Item 1, and Item 1A, “Risk Factors,” for
additional information regarding Government contracts and related risks.
Discontinued Operations
During 2014, the Company sold that portion of the Company’s USG segment represented by Aclara Technologies
LLC and two related entities (together, Aclara), a leading supplier of data communications systems and related
software used by electric, gas and water utilities in support of their advanced metering infrastructure deployments,
typically encompassing the utility’s entire service area. Aclara’s largest contracts, such as those with Pacific Gas &
Electric Company and Southern California Gas Co., each involve several million end points. However, the purchase
price was not finally determined until 2015. Prior to the sale Aclara constituted a component of the Company with
operations and cash flows that were clearly distinguishable, operationally and for financial reporting purposes, from
the rest of the entity. Accordingly, for financial reporting purposes Aclara is reflected for 2015 as discontinued
operations. Unless otherwise specifically stated, all operating results presented in this report are exclusive of
discontinued operations.
Employees
As of September 30, 2017, the Company employed 3,254 persons, including 3,029 full time employees. Of the
Company’s full-time employees, 2,352 were located in the United States and 677 were located in 17 foreign countries.

7
Financing
For information about the Company’s credit facility, see Item 7, “Management’s Discussion and Analysis of Financial
Condition and Results of Operations – Bank Credit Facility,” and Note 8 to the Consolidated Financial Statements
included herein, which are incorporated into this Item by reference.
Additional Information
The information set forth in Item 1A, “Risk Factors,” is incorporated in this Item by reference.
The Company makes available free of charge on or through its website, www.escotechnologies.com, its annual report
on Form 10-K, quarterly reports on Form 10-Q, current reports on Form 8-K, and amendments to those reports filed or
furnished pursuant to Section 13(a) or 15(d) of the Securities Exchange Act of 1934, as amended, as soon as
reasonably practicable after such material is electronically filed with or furnished to the Securities and Exchange
Commission. Information contained on the Company’s website is not incorporated into this Report.
Executive Officers of the Registrant
The following sets forth certain information as of November 1, 2017 with respect to the Company’s executive
officers. These officers are elected annually to terms which expire at the first meeting of the Board of Directors after
the next Annual Meeting of Stockholders.
Name Age Position(s)
Victor L. Richey 60 Chairman of the Board of Directors and Chief Executive Officer since April 2003; President since October 2006 *
Gary E. Muenster 57 Executive Vice President and Chief Financial Officer since February 2008; Director since February 2011
Alyson S. Barclay 58 Senior Vice President, Secretary and General Counsel since November 2008 ____________
* Mr. Richey also serves as Chairman of the Executive Committee of the Board of Directors.
There are no family relationships among any of the executive officers and directors.
Item 1A. Risk Factors
This Form 10-K, including Item 1, “Business,” Item 2, “Properties,” Item 3, “Legal Proceedings,” Item 7,
“Management’s Discussion and Analysis of Financial Condition and Results of Operations,” and Item 7A,
“Quantitative and Qualitative Disclosures About Market Risk,” contains “forward-looking statements” within the
meaning of the safe harbor provisions of the federal securities laws, as described under “Forward-Looking
Statements” above.
In addition to the risks and uncertainties discussed in that section and elsewhere in this Form 10-K, the following
important risk factors could cause actual results and events to differ materially from those contained in any forward-
looking statements, or could otherwise adversely affect the Company’s business, operating results or financial
condition:
Our sales of products to the Government depend upon continued Government funding.
Sales to the U.S. Government and its prime contractors and subcontractors represent a significant portion of our
business. Over the past three fiscal years, from 14% to 20% of our revenues from continuing operations have been
generated from sales to the U.S. Government or its contractors, primarily within our Filtration segment. These sales
are dependent on government funding of the underlying programs, which is generally subject to annual Congressional
appropriations. There could be reductions or terminations of, or delays in, the government funding on programs which
apply to us or our customers. These funding effects could adversely affect our sales and profit, and could bring about a
restructuring of our operations, which could result in an adverse effect on our financial condition or results of
operations. A significant part of VACCO’s and Westland’s sales involve major U.S. Government programs such as
NASA’s Space Launch System (SLS) and the U.S. Navy’s submarine program. A reduction or delay in Government
spending on these programs could have a significant adverse impact on our financial results which could extend for
more than a single year.
8
Negative worldwide economic conditions and related credit shortages could result in a decrease in our sales and an increase in our operating costs, which could adversely affect our business and operating results.
If there is a worsening of global and U.S. economic and financial market conditions and additional tightening of
global credit markets, many of our customers may further delay or reduce their purchases of our products. During
2016, the government of Saudi Arabia announced several austerity programs which may impact future business in that
country; although their impact is still unknown it could be significant and could adversely affect future extensions of
Doble’s current multi-year project there involving the national power grid. Uncertainties in the global economy may
cause the utility industry and commercial market customers to experience shortages in available credit, which could
limit capital spending. To the extent this problem affects our customers, our sales and profits could be adversely
affected. Likewise, if our suppliers face challenges in obtaining credit, they may have to increase their prices or
become unable to continue to offer the products and services we use to manufacture our products, which could have
an adverse effect on our business, results of operations and financial condition.
Our quarterly results may fluctuate substantially.
We have experienced variability in quarterly results and believe our quarterly results will continue to fluctuate as a
result of many factors, including the size and timing of customer orders, governmental approvals and funding levels,
changes in existing taxation rules or practices, the gain or loss of significant customers, timing and levels of new
product developments, shifts in product or sales channel mix, increased competition and pricing pressure, and general
economic conditions.
A significant part of our manufacturing operations depends on a small number of third-party suppliers.
A significant part of our manufacturing operations relies on a small number of third-party manufacturers to supply
component parts or products. For example, Doble has arrangements with four manufacturers which produce and
supply substantially all of its end-products. One of these suppliers produces more than 50% of Doble’s products from
a single location within the United States. A significant disruption in the supply of those products could negatively
affect the timely delivery of products to customers as well as future sales, which could increase costs and reduce
margins.
Certain of our other businesses are dependent upon sole source or a limited number of third-party manufacturers of
parts and components. Many of these suppliers are small businesses. Since alternative supply sources are limited,
there is an increased risk of adverse impacts on our production schedules and profits if our suppliers were to default in
fulfilling their price, quality or delivery obligations. In addition, some of our customers or potential customers may
prefer to purchase from a supplier which does not have such a limited number of sources of supply.
Increases in prices of raw material and components, and decreased availability of such items, could adversely affect our business.
The cost of raw materials and product components is a major element of the total cost of many of our products. For
example, our Test segment’s critical components rely on purchases of raw materials from third parties. Increases in
the prices of raw materials (such as steel, copper, nickel, zinc, wood and petrochemical products) could have an
adverse impact on our business by, among other things, increasing costs and reducing margins. Aerospace-grade
titanium and gaseous helium, important raw materials for our Filtration segment, may at times be in short supply.
Further, many of Doble’s items of equipment which are provided to its customers for their use are in the maturity of
their life cycles, which creates the risk that replacement components may be unavailable or available only at increased
costs.
In addition, our reliance on sole or limited sources of supply of raw materials and components in each of our segments
could adversely affect our business, as described in the preceding Risk Factor. Weather-created disruptions in supply,
in addition to affecting costs, could impact our ability to procure an adequate supply of these raw materials and
components, and delay or prevent deliveries of products to our customers.
Our international operations expose us to fluctuations in currency exchange rates that could adversely affect our results of operations and cash flows.
We have significant manufacturing and sales activities in foreign countries, and our domestic operations have sales to
foreign customers. Our financial results may be affected by fluctuations in foreign currencies and by the translation of
the financial statements of our foreign subsidiaries from local currencies into U.S. dollars. In addition, a rise in the

9
dollar against foreign currencies could make our products more expensive for foreign customers and cause them to
reduce the volume of their purchases.
Failure or delay in new product development could reduce our future sales.
Much of our business is dependent on the continuous development of new products and technologies to meet the
changing needs of our markets on a cost-effective basis. Many of these markets are highly technical from an
engineering standpoint, and the relevant technologies are subject to rapid change. If we fail to timely enhance existing
products or develop new products as needed to meet market or competitive demands, we could lose sales
opportunities, which would adversely affect our business. In addition, in some existing contracts with customers, we
have made commitments to develop and deliver new products. If we fail to meet these commitments, the default could
result in the imposition on us of contractual penalties including termination. Our inability to enhance existing products
in a timely manner could make our products less competitive, while our inability to successfully develop new products
may limit our growth opportunities. Development of new products and product enhancements may also require us to
make greater investments in research and development than we now do, and the increased costs associated with new
product development and product enhancements could adversely affect our operating results. In addition, our costs of
new product development may not be recoverable if demand for our products is not as great as we anticipate it to be.
Changes in testing standards could adversely impact our Test and USG segments’ sales.
A significant portion of the business of our Test and USG segments involves sales to technology customers who need
to have a third party verify that their products meet specific international and domestic test standards. If regulatory
agencies were to eliminate or reduce certain domestic or international test standards, or if demand for product testing
from these customers were to decrease for some other reason, our sales could be adversely affected. For example, if
Wi-Fi technology in mobile phones were to be superseded by a new communications technology, then there might be
no need for certain testing on mobile phones; or if a regulatory authority were to relax the test standards for certain
electronic devices because they were determined not to interfere with the broadcast spectrum, our sales of certain
testing products could be significantly reduced.
The end of customer product life cycles could negatively affect our Filtration segment’s results.
Many of our Filtration segment products are sold to be components in our customers’ end-products. If a customer
discontinues a certain end-product line, our ability to continue to sell those components will be reduced or eliminated.
The result could be a significant decrease in our sales. For example, a substantial portion of PTI’s revenue is generated
from commercial aviation aftermarket sales. As certain aircraft are retired and replaced by newer aircraft, there could
be a corresponding decrease in sales associated with our current products. Such a decrease could adversely affect our
operating results.
Product defects could result in costly fixes, litigation and damages.
Our business exposes us to potential product liability risks that are inherent in the design, manufacture and sale of our
products and the products of third-party vendors which we use or resell. If there are claims related to defective
products (under warranty or otherwise), particularly in a product recall situation, we could be faced with significant
expenses in replacing or repairing the product. For example, the Filtration segment obtains raw materials, machined
parts and other product components from suppliers who provide certifications of quality which we rely on. Should
these product components be defective and pass undetected into finished products, or should a finished product
contain a defect, we could incur significant costs for repairs, re-work and/or removal and replacement of the defective
product. In addition, if a dispute over product claims cannot be settled, arbitration or litigation may result, requiring us
to incur attorneys’ fees and exposing us to the potential of damage awards against us.
We may not be able to identify suitable acquisition candidates or complete acquisitions successfully, which may inhibit our rate of growth.
As part of our growth strategy, we plan to continue to pursue acquisitions of other companies, assets and product lines
that either complement or expand our existing business. However, we may be unable to implement this strategy if we
are unable to identify suitable acquisition candidates or consummate future acquisitions at acceptable prices and
terms. We expect to face competition for acquisition candidates which may limit the number of acquisition
opportunities available to us and may result in higher acquisition prices. As a result, we may be limited in the number
of acquisitions which we are able to complete and we may face difficulties in achieving the profitability or cash flows
needed to justify our investment in them.

10
Our acquisitions of other companies carry risk.
Acquisitions of other companies involve numerous risks, including difficulties in the integration of the operations,
technologies and products of the acquired companies, the potential exposure to unanticipated and undisclosed
liabilities, the potential that expected benefits or synergies are not realized and that operating costs increase, the
potential loss of key personnel, suppliers or customers of acquired businesses and the diversion of Management’s time
and attention from other business concerns. Although we attempt to identify and evaluate the risks inherent in any
acquisition, we may not properly ascertain or mitigate all such risks, and our failure to do so could have a material
adverse effect on our business.
We may incur significant costs, experience short term inefficiencies, or be unable to realize expected long term savings from facility consolidations and other business reorganizations.
We periodically assess the cost and operational structure of our facilities in order to manufacture and sell our products
in the most efficient manner, and based on these assessments, we may from time to time reorganize, relocate or
consolidate certain of our facilities. These actions may require us to incur significant costs and may result in short
term business inefficiencies as we consolidate and close facilities and transition our employees; and in addition, we
may not achieve the expected long term benefits. Any or all of these factors could result in an adverse impact on our
operating results, cash flows and financial condition.
The trading price of our common stock continues to be volatile and may result in investors selling shares of our common stock at a loss.
The trading price of our common stock is volatile and subject to wide fluctuations in price in response to various
factors, many of which are beyond our control, including those described in this section and including but not limited
to: actual or anticipated variations in our quarterly operating results; changes in financial estimates by securities
analysts that cover our stock or our failure to meet those estimates; substantial sales of our common stock by our
existing shareholders; and general stock market conditions. In recent years the stock markets in general have
experienced dramatic price and volume fluctuations, which may continue indefinitely, and changes in industry,
general economic or market conditions could harm the price of our stock regardless of our operating performance.
The Company has guaranteed certain Aclara contracts.
In the normal course of business during the time that Aclara was our subsidiary, we agreed to provide guarantees of
Aclara’s performance under certain real property leases, certain vendor contacts, and certain large, long-term customer
contracts for the delivery, deployment and performance of AMI systems such as those described under “Discontinued
Operations” in Item 1. In connection with the sale of Aclara, we agreed to remain a guarantor of Aclara’s performance
of these contracts. If Aclara were to fail to perform any of these guaranteed contracts, the other party to the contract
could seek damages from us resulting from the non-performance, and if we were determined to be liable for these
damages they could have a material adverse effect on our business, operating results or financial condition. Although
we would be entitled to seek indemnification from Aclara for these damages, our ability to recover would be subject
to Aclara’s financial position at that time.
We may not realize as revenue the full amounts reflected in our backlog.
As of September 30, 2017 our twelve-month backlog was approximately $299 million, which represents confirmed
orders we believe will be recognized as revenue within the next twelve months. There can be no assurance that our
customers will purchase all the orders represented in our backlog, particularly as to contracts which are subject to the
U.S. Government’s ability to modify or terminate major programs or contracts, and if and to the extent that this
occurs, our future revenues could be materially reduced.
Economic, political and other risks of our international operations, including terrorist activities, could adversely affect our business.
In 2017, approximately 27% of our net sales were to customers outside the United States. An economic downturn or
an adverse change in the political situation in certain foreign countries in which we do business could cause a decline
in revenues and adversely affect our financial condition. For example, our Test segment does significant business in
Asia, and changes in the Asian political climate or political changes in specific Asian countries could negatively affect
our business; several of our subsidiaries are based in Europe and could be negatively impacted by weakness in the
European economy; Doble’s and Plastique’s UK-based businesses could be adversely affected by Brexit; and Doble’s
11
future business in Saudi Arabia as well as elsewhere in the Middle East could be adversely affected by government
austerity programs, continuing political unrest, wars and terrorism in the region.
Our international sales are also subject to other risks inherent in foreign commerce, including currency fluctuations
and devaluations, differences in foreign laws, uncertainties as to enforcement of contract rights, and difficulties in
negotiating and resolving disputes with our foreign customers.
Our governmental sales and our international and export operations are subject to special U.S. and foreign government laws and regulations which may impose significant compliance costs, create reputational and legal risk, and impair our ability to compete in international markets.
The international scope of our operations subjects us to a complex system of commercial and trade regulations around
the world, and our foreign operations are governed by laws and business practices that often differ from those of the
U.S. In addition, laws such as the U.S. Foreign Corrupt Practices Act and similar laws in other countries increase the
need for us to manage the risks of improper conduct not only by our own employees but by distributors and
contractors who may not be within our direct control. Many of our exports are of products which are subject to U.S.
Government regulations and controls such as the U.S. International Traffic in Arms Regulations (ITAR), which
impose certain restrictions on the U.S. export of defense articles and services, and these restrictions are subject to
change from time to time, including changes in the countries into which our products may lawfully be sold.
If we were to fail to comply with these laws and regulations we could be subject to significant fines, penalties and
other sanctions including the inability to continue to export our products or to sell our products to the U.S.
Government or to certain other customers. In addition, some of these regulations may be viewed as too restrictive by
our international customers, who may elect to develop their own domestic products or procure products from other
international suppliers which are not subject to comparable export restrictions; and the laws, regulations or policies of
certain other countries may also favor their own domestic suppliers over foreign suppliers such as the Company.
Despite our efforts, we may be unable to adequately protect our intellectual property.
Much of our business success depends on our ability to protect and freely utilize our various intellectual properties,
including both patents and trade secrets. Despite our efforts to protect our intellectual property, unauthorized parties or
competitors may copy or otherwise obtain and use our products and technology, particularly in foreign countries such
as China where the laws may not protect our proprietary rights as fully as in the United States. Our current and future
actions to enforce our proprietary rights may ultimately not be successful; or in some cases we may not elect to pursue
an unauthorized user due to the high costs and uncertainties associated with litigation. We may also face exposure to
claims by others challenging our intellectual property rights. Any or all of these actions may divert our resources and
cause us to incur substantial costs.
Disputes with contractors could adversely affect our Test segment’s results.
A major portion of our Test segment’s business involves working in conjunction with general contractors to produce
complex building components constructed on-site, such as electronic test chambers, secure communication rooms and
MRI facilities. If there are performance problems caused by either us or a contractor, they could result in cost overruns
and may lead to a dispute as to which party is responsible. The resolution of such disputes can involve arbitration or
litigation, and can cause us to incur significant expense including attorneys’ fees. In addition, these disputes could
result in a reduction in revenue, a loss on a particular project, or even a significant damages award against us.
Environmental or regulatory requirements could increase our expenses and adversely affect our profitability.
Our operations and properties are subject to U.S. and foreign environmental laws and regulations governing, among
other things, the generation, storage, emission, discharge, transportation, treatment and disposal of hazardous
materials and the clean-up of contaminated properties. These regulations, and changes to them, could increase our cost
of compliance, and our failure to comply could result in the imposition of significant fines, suspension of production,
alteration of product processes, cessation of operations or other actions which could materially and adversely affect
our business, financial condition and results of operations.
We are currently involved as a responsible party in several ongoing investigations and remediations of contaminated
third-party owned properties. In addition, environmental contamination may be discovered in the future on properties
which we formerly owned or operated and for which we could be legally responsible. Future costs associated with
these situations, including ones which may be currently unknown to us, are difficult to quantify but could have a

12
significant effect on our financial condition. See Item 1, “Business – Environmental Matters” for a discussion of these
factors.
We are or may become subject to legal proceedings that could adversely impact our operating results.
We are, and will likely be in the future, a party to a number of legal proceedings and claims involving a variety of
matters, including environmental matters such as those described in the preceding risk factor and disputes over the
ownership or use of intellectual property. Given the uncertainties inherent in litigation, including but not limited to the
possible discovery of facts adverse to our position, adverse rulings by a court or adverse decisions by a jury, it is
possible that such proceedings could result in a liability that we may have not adequately reserved for, that may not be
adequately covered by insurance, or that may otherwise have a material adverse effect on our financial condition or
results of operations.
The loss of specialized key employees could affect our performance and revenues.
There is a risk of our losing key employees having engineering and technical expertise to other employers. For
example, our USG segment relies heavily on engineers with significant experience and reputation in the utility
industry to furnish expert consulting services and support to customers. There is a current trend of a shortage of these
qualified engineers because of hiring competition from other companies in the industry. Loss of these employees to
other employers could reduce the segment’s ability to provide services and negatively affect our revenues.
Our decentralized organizational structure presents certain risks.
We are a relatively decentralized company in comparison with some of our peers. This decentralization necessarily
places significant control and decision-making powers in the hands of local management, which present various risks,
including the risk that we may be slower or less able to identify or react to problems affecting a key business than we
would in a more centralized management environment. We may also be slower to detect or react to compliance related
problems (such as an employee undertaking activities prohibited by applicable law or by our internal policies), and
Company-wide business initiatives may be more challenging and costly to implement, and the risks of noncompliance
or failures higher, than they would be under a more centralized management structure. Depending on the nature of the
problem or initiative in question, such noncompliance or failure could materially adversely affect our business,
financial condition or result of operations.
Provisions in our articles of incorporation, bylaws and Missouri law could make it more difficult for a third party to acquire us and could discourage acquisition bids or a change of control, and could adversely affect the market price of our common stock.
Our articles of incorporation and bylaws contain certain provisions which could discourage potential hostile takeover
attempts, including: a limitation on the shareholders’ ability to call special meetings of shareholders; advance notice
requirements to nominate candidates for election as directors or to propose matters for action at a meeting of
shareholders; a classified board of directors, which means that approximately one-third of our directors are elected
each year; and the authority of our board of directors to issue, without shareholder approval, preferred stock with such
terms as the board may determine. In addition, the laws of Missouri, in which we are incorporated, require a two-
thirds vote of outstanding shares to approve mergers or certain other major corporate transactions, rather than a simple
majority as in some other states such as Delaware. These provisions could impede a merger or other change of control
not approved by our board of directors, which could discourage takeover attempts and in some circumstances reduce
the market price of our common stock.
Item 1B. Unresolved Staff Comments
None

13
Item 2. Properties
The Company believes its buildings, machinery and equipment have been generally well maintained, are in good
operating condition and are adequate for the Company’s current production requirements and other needs.
The Company’s principal manufacturing facilities and other materially important properties, including those described
in the table below, comprise approximately 1,644,000 square feet of floor space, of which approximately 888,000
square feet are owned and approximately 756,000 square feet are leased. Leased facilities of less than 10,000 square
feet are not included in the table. See also Notes 14 and 15 to the Consolidated Financial Statements included herein.
Location Approx. Sq. Ft.
Owned / Leased (with Expiration Date) Principal Use(s)
Operating Segment
Modesto, CA 181,500 Leased (9/30/2023) Manufacturing, Office, Engineering Filtration
Denton, TX 145,000 Leased (9/30/2029, plus options)
Manufacturing, Warehouse, Office, Engineering
Filtration
Cedar Park, TX 130,000 Owned Manufacturing, Warehouse, Office, Engineering
Test
Oxnard, CA 127,400 Owned Manufacturing, Warehouse, Office, Engineering
Filtration
South El Monte, CA 100,100 Owned Manufacturing, Warehouse, Office, Engineering
Filtration
Durant, OK 100,000 Owned Manufacturing, Warehouse, Office, Engineering
Test
Huntley, IL 86,000 Owned Manufacturing, Warehouse, Office, Engineering
Technical Packaging
Watertown, MA 82,100 Owned Manufacturing, Office, Engineering USG
Valencia, CA 79,300 Owned Manufacturing, Office, Engineering Filtration
Hinesburg, VT 77,000 Leased (5/31/2029) Manufacturing, Warehouse, Office, Engineering
USG
South El Monte, CA 64,200 Leased (6/30/2019 & 6/30/2022)
Manufacturing, Warehouse, Office Filtration
Eura, Finland 41,500 Owned Manufacturing, Warehouse, Office, Engineering
Test
Fremont, IN 39,800 Owned Manufacturing, Warehouse, Office, Engineering
Technical Packaging
Beijing, China 33,300 Leased (12/31/2019) Manufacturing, Engineering Test
Minocqua, WI 35,400 Owned Manufacturing, Office, Engineering Test
LaSalle (Montreal), Quebec 35,200 Leased (8/31/2021) Manufacturing, Office, Engineering USG
Dabrowa, Poland 34,000 Owned Manufacturing, Office, Engineering Technical Packaging
Poznan, Poland 32,000 Owned Manufacturing, Office, Engineering Technical Packaging
Ontario, CA 26,900 Leased (8/29/2020) Manufacturing, Office, Engineering USG
Nottingham, England 23,900 Leased (7/31/2019) Manufacturing, Office, Engineering Technical Packaging
St. Louis, MO 21,500 Leased (8/31/2020 plus options)
ESCO Corporate Office Corporate
Tunbridge Wells, England 14,400 Leased (7/31/2019) Manufacturing, Office Technical Packaging
Morrisville, NC 11,600 Leased (8/31/2019) Office, Manufacturing USG
Huntley, IL 11,500 Leased (12/31/2018) Manufacturing Filtration
Marlborough, MA 11,200 Leased (6/30/2020) Office, Engineering USG
Wood Dale, IL 10,700 Leased (3/31/2019) Office Test
14
Item 3. Legal Proceedings
As a normal incident of the businesses in which the Company is engaged, various claims, charges and litigation are
asserted or commenced from time to time against the Company. With respect to claims and litigation currently
asserted or commenced against the Company, it is the opinion of Management that final judgments, if any, which
might be rendered against the Company are adequately reserved for, are covered by insurance, or are not likely to
have a material adverse effect on the Company’s financial condition or results of operations. Nevertheless, given the
uncertainties of litigation, it is possible that such claims, charges and litigation could have a material adverse impact
on the Company; see Item 1A, “Risk Factors.”
Item 4. Mine Safety Disclosures
Not applicable.

15
PART II
Item 5. Market for Registrant’s Common Equity, Related Stockholder Matters and Issuer Purchases of Equity Securities
Price Range Of Common Stock. The Company’s common stock is listed on the New York Stock Exchange under
the symbol “ESE.” The following table summarizes the high and low prices of the common stock for each quarter in
the last two fiscal years.
2017 2016
Quarter High Low High Low
First $ 58.75 42.95 $ 39.98 33.62 Second 58.95 51.80 39.59 31.50 Third 61.40 55.15 41.68 37.19 Fourth 63.80 50.30 47.39 39.14
Holders of Record. As of October 31, 2017 there were approximately 1,829 holders of record of the Company’s
common stock.
Dividends. For information about dividends paid on the common stock in the last two fiscal years, please refer to
Note 16 to the Company’s Consolidated Financial Statements included herein.
Company Purchases of Equity Securities. The Company did not repurchase any shares of its common stock during
the fourth quarter of fiscal 2017.
Securities Authorized for Issuance Under Equity Compensation Plans. For information about securities
authorized for issuance under the Company’s equity compensation plans, please refer to Item 12 of this Form 10-K
and to Note 10 to the Company’s Consolidated Financial Statements included herein.
Performance Graph. The graph and table below present a comparison of the cumulative total shareholder return on
the Company’s common stock as measured against the Russell 2000 index and two customized peer groups whose
individual component companies are listed below. Because the Company changed the composition of the peer group
for 2017, as described below, the peer group used for the corresponding disclosures in 2016 is also shown for
comparison. The Company is not a component of either the 2017 peer group or the 2016 peer group, but it is a
component of the Russell 2000 Index. The measurement period begins on September 30, 2012 and measures at each
September 30 thereafter. These figures assume that all dividends, if any, paid over the measurement period were
reinvested, and that the starting values of each index and the investments in the Company’s common stock were $100
at the close of trading on September 30, 2012.
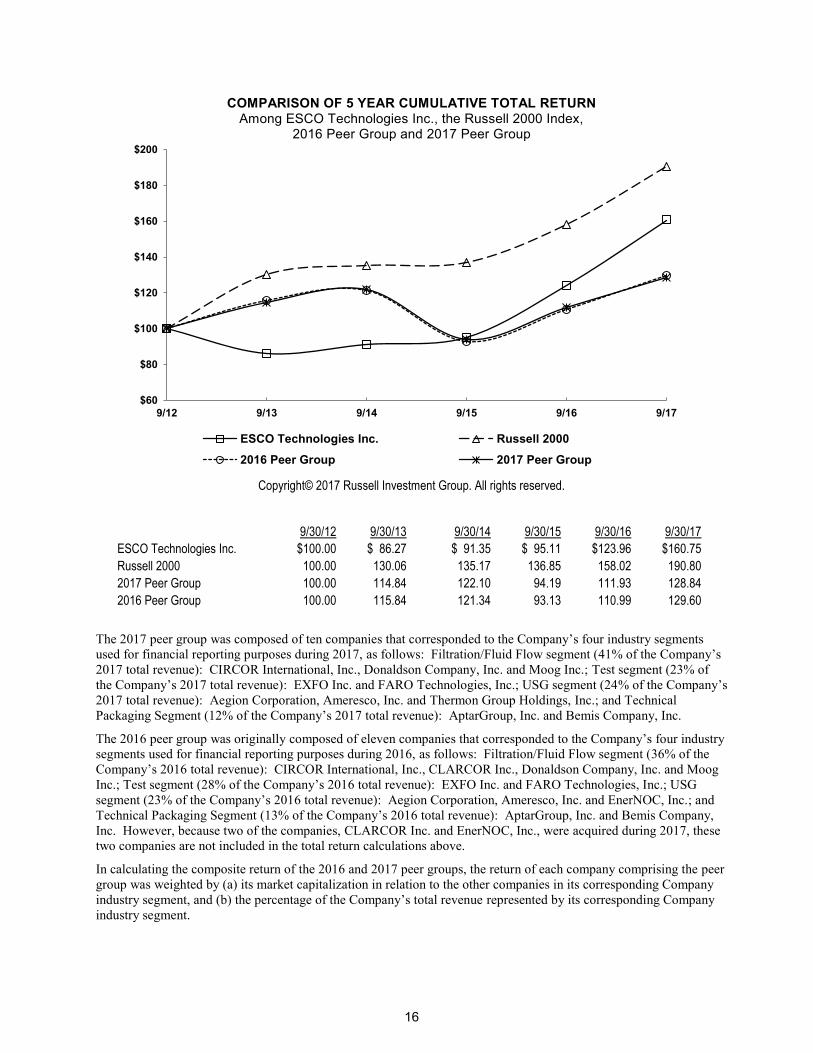
16
$60
$80
$100
$120
$140
$160
$180
$200
9/12 9/13 9/14 9/15 9/16 9/17
ESCO Technologies Inc. Russell 2000
2016 Peer Group 2017 Peer Group
COMPARISON OF 5 YEAR CUMULATIVE TOTAL RETURN Among ESCO Technologies Inc., the Russell 2000 Index,
2016 Peer Group and 2017 Peer Group
Copyright© 2017 Russell Investment Group. All rights reserved.
9/30/12 9/30/13
9/30/14 9/30/15 9/30/16 9/30/17
ESCO Technologies Inc. $100.00 $ 86.27 $ 91.35 $ 95.11 $123.96 $160.75
Russell 2000 100.00 130.06 135.17 136.85 158.02 190.80
2017 Peer Group 100.00 114.84 122.10 94.19 111.93 128.84
2016 Peer Group 100.00 115.84 121.34 93.13 110.99 129.60
The 2017 peer group was composed of ten companies that corresponded to the Company’s four industry segments
used for financial reporting purposes during 2017, as follows: Filtration/Fluid Flow segment (41% of the Company’s
2017 total revenue): CIRCOR International, Inc., Donaldson Company, Inc. and Moog Inc.; Test segment (23% of
the Company’s 2017 total revenue): EXFO Inc. and FARO Technologies, Inc.; USG segment (24% of the Company’s
2017 total revenue): Aegion Corporation, Ameresco, Inc. and Thermon Group Holdings, Inc.; and Technical
Packaging Segment (12% of the Company’s 2017 total revenue): AptarGroup, Inc. and Bemis Company, Inc.
The 2016 peer group was originally composed of eleven companies that corresponded to the Company’s four industry
segments used for financial reporting purposes during 2016, as follows: Filtration/Fluid Flow segment (36% of the
Company’s 2016 total revenue): CIRCOR International, Inc., CLARCOR Inc., Donaldson Company, Inc. and Moog
Inc.; Test segment (28% of the Company’s 2016 total revenue): EXFO Inc. and FARO Technologies, Inc.; USG
segment (23% of the Company’s 2016 total revenue): Aegion Corporation, Ameresco, Inc. and EnerNOC, Inc.; and
Technical Packaging Segment (13% of the Company’s 2016 total revenue): AptarGroup, Inc. and Bemis Company,
Inc. However, because two of the companies, CLARCOR Inc. and EnerNOC, Inc., were acquired during 2017, these
two companies are not included in the total return calculations above.
In calculating the composite return of the 2016 and 2017 peer groups, the return of each company comprising the peer
group was weighted by (a) its market capitalization in relation to the other companies in its corresponding Company
industry segment, and (b) the percentage of the Company’s total revenue represented by its corresponding Company
industry segment.

17
Item 6. Selected Financial Data
The following selected consolidated financial data of the Company and its subsidiaries should be read in conjunction
with the Company’s Consolidated Financial Statements, the Notes thereto, and Management’s Discussion and
Analysis of Financial Condition and Results of Operations, as of the respective dates indicated and for the respective
periods ended thereon.
(Dollars in millions, except per share amounts) 2017 2016 2015 2014 2013
For years ended September 30: Net sales $ 685.7 571.5 537.3 531.1 490.1
Net earnings from continuing operations 53.7 45.9 41.7 42.6 31.3 Net earnings (loss) from discontinued operations - - 0.8 (42.2 ) (56.9 )
Net earnings (loss) 53.7 45.9 42.5 0.4 (25.6 )
Earnings (loss) per share: Basic: Continuing operations $ 2.08 1.78 1.60 1.61 1.18 Discontinued operations - - 0.03 (1.60 ) (2.15 )
Net earnings (loss) $ 2.08 1.78 1.63 0.01 (0.97 ) Diluted: Continuing operations $ 2.07 1.77 1.59 1.60 1.17 Discontinued operations - - 0.03 (1.58 ) (2.13 )
Net earnings (loss) $ 2.07 1.77 1.62 0.02 (0.96 )
As of September 30: Working capital $ 197.8 165.4 155.0 148.9 163.6 Total assets 1,260.4 978.4 864.2 845.9 1,092.3 Total debt 275.0 110.0 50.0 40.0 172.0 Shareholders’ equity 671.9 615.1 584.2 580.2 601.7 Cash dividends declared per common share $ 0.32 0.32 0.32 0.32 0.32 __________
See also Note 2 to the Consolidated Financial Statements included herein for discussion of acquisition activity.
Item 7. Management’s Discussion and Analysis of Financial Condition and Results of Operations
The following discussion should be read in conjunction with the Consolidated Financial Statements included herein
and Notes thereto and refers to the Company’s results from continuing operations, except where noted.
Introduction
ESCO Technologies Inc. and its wholly owned subsidiaries (the Company) are organized into four operating segments
for financial reporting purposes: Filtration/Fluid Flow (Filtration), RF Shielding and Test (Test), Utility Solutions
Group (USG), and Technical Packaging. The Company’s business segments are comprised of the following primary
operating entities:
Filtration: PTI Technologies Inc. (PTI); VACCO Industries (VACCO); Crissair, Inc. (Crissair); Westland
Technologies, Inc. (Westland); and Mayday Manufacturing Co. (Mayday) and its affiliate Hi-Tech Metals, Inc.
(Hi-Tech).
Test: ETS-Lindgren Inc. (ETS-Lindgren).
USG: Doble Engineering Company (Doble); Morgan Schaffer Ltd. (Morgan Schaffer); and NRG Systems, Inc.
(NRG).
Technical Packaging: Thermoform Engineered Quality LLC (TEQ); Plastique Limited and Plastique Sp. z o.o.
(together, Plastique).
18
Filtration. PTI, VACCO and Crissair primarily design and manufacture specialty filtration products including
hydraulic filter elements and fluid control devices used in commercial aerospace applications, unique filter
mechanisms used in micro-propulsion devices for satellites and custom designed filters for manned aircraft and
submarines. Westland designs, develops and manufactures elastomeric-based signature reduction solutions for U.S.
naval vessels. Mayday designs and manufactures mission-critical bushings, pins, sleeves and precision-tolerance
machined components for landing gear, rotor heads, engine mounts, flight controls, and actuation systems for the
aerospace and defense industries. Hi-Tech is a full-service metal processor serving aerospace suppliers.
Test. ETS-Lindgren is an industry leader in providing its customers with the ability to identify, measure and contain
magnetic, electromagnetic and acoustic energy.
USG. Doble provides high-end, intelligent diagnostic test solutions for the electric power delivery industry and is a
leading supplier of power factor and partial discharge testing instruments used to assess the integrity of high-voltage
power delivery equipment. Morgan Schaffer provides an integrated offering of dissolved gas analysis, oil testing, and
data management solutions which enhance the ability of electric utilities to accurately monitor the health of critical
power transformers. NRG designs and manufactures decision support tools for the renewable energy industry,
primarily wind.
Technical Packaging. The companies within this segment provide innovative solutions to the medical and
commercial markets for thermoformed and precision molded pulp fiber packages and specialty products using a wide
variety of thin gauge plastics and pulp.
The Company continues to operate with meaningful growth prospects in its primary served markets and with
considerable financial flexibility. The Company continues to focus on new products that incorporate proprietary
design and process technologies. Management is committed to delivering shareholder value through organic growth,
ongoing performance improvement initiatives, and acquisitions.
Highlights of 2017 Operations
Sales, net earnings and diluted earnings per share in 2017 were $685.7 million, $53.7 million and $2.07 per share,
respectively, compared to sales, net earnings and diluted earnings per share in 2016 of $571.5 million, $45.9
million and $1.77 per share, respectively.
Diluted EPS – As Adjusted for 2017 was $2.22 and excludes $6.1 million of pretax charges (or $0.15 per share
after tax) consisting of non-cash purchase accounting inventory step-up charges and costs incurred to complete
the Company’s 2017 acquisitions, described below. Diluted EPS – As Adjusted for 2016 was $2.03 and excludes
$7.8 million of pretax charges (or $0.26 per share after tax) of restructuring charges related to the 2016 Test and
Doble restructuring actions.
Net cash provided by operating activities was approximately $67.3 million in 2017 compared to $73.9 million in
2016, mainly due to an increase in working capital.
At September 30, 2017, cash on hand was $45.5 million and outstanding debt was $275 million, for a net debt
position (total debt less net cash) of approximately $229.5 million.
Entered orders for 2017 were $736.6 million resulting in a book-to-bill ratio of 1.07x. Backlog at September 30,
2017 was $377.1 million compared to $326.2 million at September 30, 2016.
In August 2017, the Company acquired the assets of Vanguard Instruments Company (Vanguard Instruments), a
test equipment provider serving the global electric utility market, located in Ontario, California, for a purchase
price of $36.0 million in cash. Since the date of acquisition, the operating results for Vanguard Instruments have
been included as a product line of Doble within the Company’s USG segment.
In May 2017, the Company acquired the assets of Morgan Schaffer Inc. (Morgan Schaffer), a global utilities
provider located in Montreal, Quebec, Canada for a purchase price of $48.8 million in cash. Morgan Schaffer
manufactures an integrated offering of dissolved gas analysis, oil testing, and data management solutions serving
the electric utility market. Since the date of acquisition, the operating results for Morgan Schaffer have been
included in the Company’s USG segment.
In May 2017, the Company acquired NRG Systems, Inc. (NRG), located in Hinesburg, Vermont, for a purchase
price of $38.6 million in cash. NRG is a market leader in the design and manufacture of decision support tools for
the renewable energy industry, primarily wind. Since the date of acquisition, the operating results for NRG have
been included in the Company’s USG segment.

19
In November 2016, the Company acquired aerospace suppliers Mayday Manufacturing Co. (Mayday) and its
affiliate, Hi-Tech Metals, Inc. (Hi-Tech), located in Denton, Texas, for a purchase price of approximately $75
million in cash. Mayday is a manufacturer of bushings, pins, sleeves and precision-tolerance machined
components for the aerospace and defense industry. Since the date of acquisition, the operating results for
Mayday and Hi-Tech have been included in the Company’s Filtration segment.
The Company declared dividends of $0.32 per share during 2017, totaling $8.3 million in dividend payments.
Results of Operations
Net Sales
Change Change Fiscal year ended 2017 2016
(Dollars in millions) 2017 2016 2015 vs. 2016 vs. 2015
Filtration $ 279.5 207.8 196.7 34.5 % 5.6 % Test 160.9 161.5 177.6 (0.4 )% (9.1 )% USG 162.4 127.8 123.6 27.1 % 3.4 %
Technical Packaging 82.9 74.4 39.4 11.4 % 88.8 %
Total $ 685.7 571.5 537.3 20.0 % 6.4 %
Net sales increased $114.2 million, or 20.0%, to $685.7 million in 2017 from $571.5 million in 2016. The increase in
net sales in 2017 as compared to 2016 was due to a $71.7 million increase in the Filtration segment, a $34.6 million
increase in the USG segment and an $8.5 million increase in the Technical Packaging segment, partially offset by a
$0.6 million decrease in the Test segment.
Net sales increased $34.2 million, or 6.4%, to $571.5 million in 2016 from $537.3 million in 2015. The increase in net
sales in 2016 as compared to 2015 was due to a $35.0 million increase in the Technical Packaging segment, an $11.1
million increase in the Filtration segment and a $4.2 million increase in the USG segment, partially offset by a $16.1
million decrease in the Test segment.
Filtration.
The $71.7 million, or 34.5% increase in net sales in 2017 as compared to 2016 was primarily driven by the
Company’s recent acquisitions of Westland and Mayday, described under “Acquisitions” below, which contributed
$21.0 million and $40.0 million, respectively; and a $12.4 million increase at VACCO due to higher shipments of its
defense products including Navy spares, partially offset by a $2.4 million decrease in sales at Crissair due to lower
aerospace shipments.
The $11.1 million, or 5.6%, increase in net sales in 2016 as compared to 2015 was primarily due to a $4.6 million
increase in net sales from Crissair due to higher aerospace shipments, a $2.5 million increase in net sales from PTI due
to higher shipments of aero assemblies and elements, a $1.4 million increase in net sales from VACCO due to higher
shipments of its Space products and a $2.5 million sales contribution from Westland (acquired on September 2, 2016).
Test.
The net sales decrease of $0.6 million in 2017 as compared to 2016 was mainly due to a $6.4 million decrease in net
sales from the Company’s European operations due to the 2016 restructuring activities to close the Test business
operating facilities in Germany and England, offset by a $7.5 million increase in net sales from its U.S. operations
related to higher sales volumes of chamber projects.
The net sales decrease of $16.1 million, or 9.1%, in 2016 as compared to 2015 was mainly due to a $12 million
decrease in net sales from the segment’s European operations due to the 2016 restructuring activities mentioned above
and a $10 million decrease in net sales from the segment’s U.S. operations driven by a decrease in acoustic projects,
partially offset by a $6 million increase in net sales from the segment’s Asian operations driven by timing of projects.
USG.
The net sales increase of $34.6 million, or 27.1% in 2017 as compared to 2016 was mainly driven by the Company’s
2017 acquisitions of NRG and Morgan Schaffer, described under “Acquisitions” below, which contributed $16.2
million and $6.5 million, respectively; and an $11.9 million increase in net sales at Doble from new products and
software solutions.
20
The net sales increase of $4.2 million, or 3.4%, in 2016 as compared to 2015 was driven by additional software and
service revenue at Doble and the sales contribution from the Enoserv acquisition (acquired January 2015).
Technical Packaging.
The $8.5 million, or 11.4%, increase in net sales in 2017 as compared to 2016 was mainly due to the $9.3 million
increase in sales contribution from Plastique which was acquired in January 2016 partially offset by a $0.8 million
decrease in net sales from TEQ due to lower shipments to medical customers.
The $35.0 million, or 88.8%, increase in net sales in 2016 as compared to 2015 was primarily driven by the 2016
acquisitions of Plastique and Fremont, which contributed $22 million and $7 million, respectively, to 2016 sales and
an increase in shipments to commercial customers.
Orders and Backlog
New orders received in 2017 were $736.6 million as compared to $570.2 million in 2016, resulting in order backlog
of $377.1 million at September 30, 2017 as compared to order backlog of $326.2 million at September 30, 2016.
Orders are entered into backlog as firm purchase order commitments are received.
In 2017, the Company recorded $286.8 million of orders related to Filtration products, $198.6 million of orders
related to Test products, $164.3 million of orders related to USG products and $86.9 million of orders related to
Technical Packaging products. In 2016, the Company recorded $224.7 million of orders related to Filtration
products, $143.4 million of orders related to Test products, $125.3 million of orders related to USG products and
$76.8 million of orders related to Technical Packaging products.
Selling, General and Administrative Expenses
Selling, general and administrative (SG&A) expenses were $148.4 million, or 21.6% of net sales, in 2017; $131.5
million, or 23.0% of net sales, in 2016; and $130.2 million, or 24.2% of net sales, in 2015.
The increase in SG&A expenses in 2017 as compared to 2016 was mainly due to an increase in SG&A expenses both
within the Filtration segment (due to the acquisitions of Mayday and Westland, which contributed $9.3 million to the
increase) and the USG segment (due to the acquisitions of NRG and Morgan Schaffer, which contributed $6.9 million
to the increase, as well as additional sales and marketing expenses at Doble), partially offset by a decrease in SG&A
expenses in the Test segment (as a result of the 2016 restructuring activities).
The increase in SG&A expenses in 2016 as compared to 2015 was mainly due to an increase in SG&A expenses both
within the Technical Packaging segment (due to the acquisitions of Plastique and Fremont) and at Corporate (higher
acquisition costs, including professional fees), partially offset by a decrease in SG&A expenses within the Test and
USG segments due to the facility consolidations and headcount reductions.
Amortization Of Intangible Assets
Amortization of intangible assets was $16.3 million in 2017, $11.6 million in 2016 and $8.9 million in 2015.
Amortization of intangible assets included $8.6 million, $4.9 million and $4.0 million of amortization of acquired
intangible assets in 2017, 2016 and 2015, respectively, related to the Company’s acquisitions. The amortization of
acquired intangible assets related to the Company’s acquisitions is included in the Corporate operating segment’s
results. The remaining amortization expenses relate to other identifiable intangible assets (primarily software, patents
and licenses), which are included in the respective segment’s operating results. The increase in amortization expense
in 2017 as compared to 2016 and 2015 was mainly due to the amortization of intangibles related to the Company’s
recent acquisitions and an increase in software amortization.
Other Expenses (Income), Net
Other income, net, was $0.7 million in 2017, compared to other expenses, net, of $7.8 million in 2016 and $1.1
million in 2015. The principal components of other income, net, in 2017 included $0.6 million from the sale of
certain intellectual property and $0.4 million related to death benefit insurance proceeds from a former subsidiary.
The principal components of other expenses, net, in 2016 included $4.9 million of restructuring costs related to the
Test segment facility consolidation and $2.2 million of costs related to the USG segment restructuring activities. The
restructuring costs mainly related to severance and compensation benefits, professional fees and asset impairment
charges related to abandoned assets. The principal component of other expenses, net, in 2015 was $0.9 million of
severance expenses related to headcount reductions primarily at VACCO. There were no other individually
significant items included in other expenses (income), net, in 2017, 2016 or 2015.
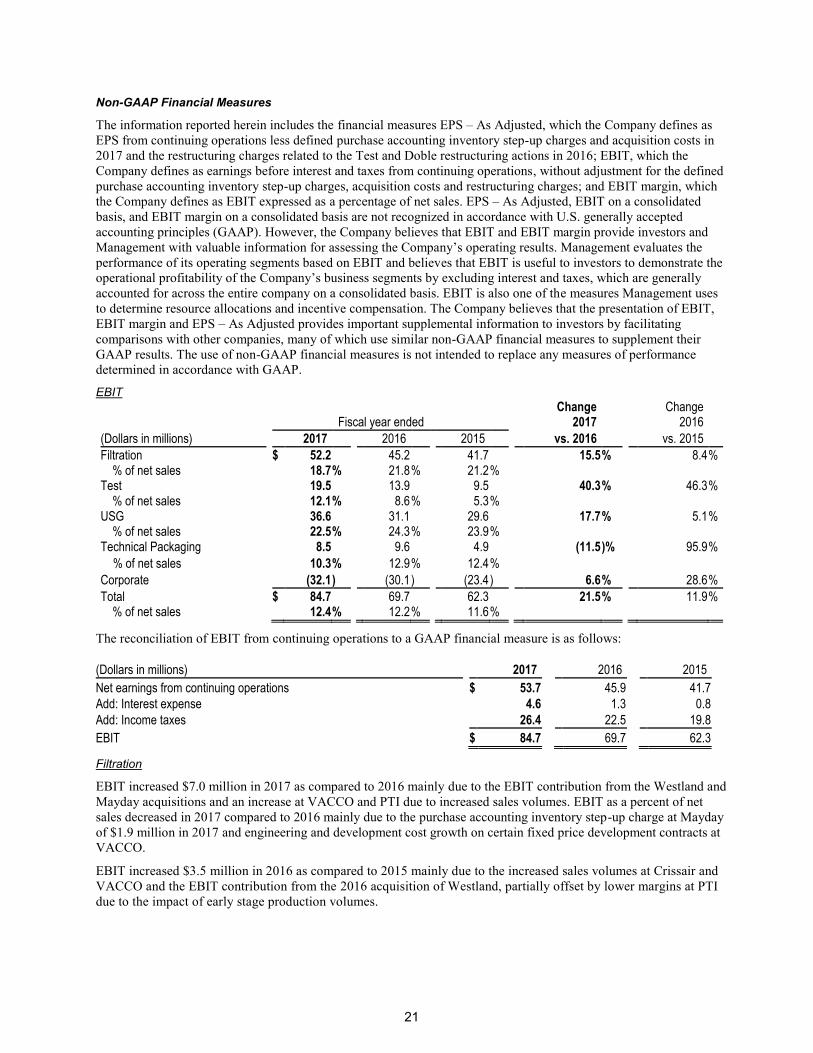
21
Non-GAAP Financial Measures
The information reported herein includes the financial measures EPS – As Adjusted, which the Company defines as
EPS from continuing operations less defined purchase accounting inventory step-up charges and acquisition costs in
2017 and the restructuring charges related to the Test and Doble restructuring actions in 2016; EBIT, which the
Company defines as earnings before interest and taxes from continuing operations, without adjustment for the defined
purchase accounting inventory step-up charges, acquisition costs and restructuring charges; and EBIT margin, which
the Company defines as EBIT expressed as a percentage of net sales. EPS – As Adjusted, EBIT on a consolidated
basis, and EBIT margin on a consolidated basis are not recognized in accordance with U.S. generally accepted
accounting principles (GAAP). However, the Company believes that EBIT and EBIT margin provide investors and
Management with valuable information for assessing the Company’s operating results. Management evaluates the
performance of its operating segments based on EBIT and believes that EBIT is useful to investors to demonstrate the
operational profitability of the Company’s business segments by excluding interest and taxes, which are generally
accounted for across the entire company on a consolidated basis. EBIT is also one of the measures Management uses
to determine resource allocations and incentive compensation. The Company believes that the presentation of EBIT,
EBIT margin and EPS – As Adjusted provides important supplemental information to investors by facilitating
comparisons with other companies, many of which use similar non-GAAP financial measures to supplement their
GAAP results. The use of non-GAAP financial measures is not intended to replace any measures of performance
determined in accordance with GAAP.
EBIT
Change Change Fiscal year ended 2017 2016
(Dollars in millions) 2017 2016 2015 vs. 2016 vs. 2015
Filtration $ 52.2 45.2 41.7 15.5 % 8.4 % % of net sales 18.7 % 21.8 % 21.2 %
Test 19.5 13.9 9.5 40.3 % 46.3 % % of net sales 12.1 % 8.6 % 5.3 %
USG 36.6 31.1 29.6 17.7 % 5.1 % % of net sales 22.5 % 24.3 % 23.9 %
Technical Packaging 8.5 9.6 4.9 (11.5 )% 95.9 %
% of net sales 10.3 % 12.9 % 12.4 %
Corporate (32.1 ) (30.1 ) (23.4 ) 6.6 % 28.6 %
Total $ 84.7 69.7 62.3 21.5 % 11.9 % % of net sales 12.4 % 12.2 % 11.6 %
The reconciliation of EBIT from continuing operations to a GAAP financial measure is as follows:
(Dollars in millions) 2017 2016 2015
Net earnings from continuing operations $ 53.7 45.9 41.7
Add: Interest expense 4.6 1.3 0.8
Add: Income taxes 26.4 22.5 19.8
EBIT $ 84.7 69.7 62.3
Filtration
EBIT increased $7.0 million in 2017 as compared to 2016 mainly due to the EBIT contribution from the Westland and
Mayday acquisitions and an increase at VACCO and PTI due to increased sales volumes. EBIT as a percent of net
sales decreased in 2017 compared to 2016 mainly due to the purchase accounting inventory step-up charge at Mayday
of $1.9 million in 2017 and engineering and development cost growth on certain fixed price development contracts at
VACCO.
EBIT increased $3.5 million in 2016 as compared to 2015 mainly due to the increased sales volumes at Crissair and
VACCO and the EBIT contribution from the 2016 acquisition of Westland, partially offset by lower margins at PTI
due to the impact of early stage production volumes.

22
Test
The $5.6 million increase in EBIT in 2017 as compared to 2016 was primarily due to the $5.1 million of restructuring
charges incurred in 2016 related to closing the Test business operating facilities in Germany and England, consisting
mainly of employee severance and compensation benefits, professional fees, and asset impairment charges.
The $4.4 million increase in EBIT in 2016 as compared to 2015 was mainly due to the higher sales volumes from the
segment’s Asian operations and operational improvement initiatives that were partially offset by $5.1 million of
incremental restructuring charges related to closing the Test business operating facilities in Taufkirchen, Germany
and Stevenage, England consisting mainly of employee severance and compensation benefits, professional fees, and
asset impairment charges. In addition, 2015 EBIT was negatively impacted by incremental charges related to the
write-down of certain inventories.
USG
The $5.5 million increase in EBIT in 2017 as compared to 2016 was primarily due to higher sales volumes and
additional contribution from new products and software solutions, as well as the EBIT contribution from the 2017
acquisitions of NRG, Morgan Schaffer and Vanguard Instruments. EBIT as a percent of net sales decreased in 2017
compared to 2016 mainly due to the purchase accounting inventory step-up charges at NRG, Morgan Schaffer and
Vanguard Instruments totaling $1.9 million.
The $1.5 million increase in EBIT in 2016 as compared to 2015 was primarily due to an increase in sales volumes
and the full year EBIT contribution from the 2015 acquisition of Enoserv. In addition, 2016 EBIT was negatively
impacted by $2.0 million of incremental restructuring charges incurred related to the closing of the Brazil office
consisting mainly of employee severance and compensation benefits and asset write downs.
Technical Packaging
EBIT decreased $1.1 million in 2017 as compared to 2016 mainly due to higher SG&A expenses at Plastique due to
the full year being included in 2017.
EBIT increased $4.7 million in 2016 as compared to 2015 mainly due to the acquisitions of Plastique and Fremont
and the higher sales volumes to commercial and medical customers.
Corporate
Corporate operating charges included in 2017 consolidated EBIT increased to $32.1 million as compared to $30.1
million in 2016 due to an increase in acquisition related expenses, mainly from increased amortization of intangible
assets on recent acquisitions.
Corporate operating charges included in 2016 consolidated EBIT increased to $30.1 million as compared to $23.4
million in 2015 due to an increase in professional fees, acquisition related expenses, and head count related
expenses.
The “Reconciliation to Consolidated Totals (Corporate)” in Note 13 to the Consolidated Financial Statements
included herein represents Corporate office operating charges.
Interest Expense, Net
Interest expense was $4.6 million in 2017, $1.3 million in 2016 and $0.8 million in 2015. The increase in interest
expense in 2017 as compared to 2016 was due to higher average outstanding borrowings ($211.3 million compared
to $89.2 million) and higher average interest rates (2.1% vs. 1.6%) as a result of the additional borrowings to fund
the Company’s 2017 acquisitions (Mayday, Morgan Schaffer, NRG and Vanguard Instruments).The increase in
interest expense in 2016 as compared to 2015 was due to higher average interest rates (1.6% vs. 1.3%) and higher
average outstanding borrowings ($89.2 million vs. $68.5 million) as a result of the additional borrowings to fund the
Company’s 2016 acquisitions (Westland, Plastique and Fremont).
Income Tax Expense
The effective tax rates from continuing operations for 2017, 2016 and 2015 were 33.0%, 32.9% and 32.2%,
respectively. The increase in the 2017 effective tax rate as compared to 2016 as well as the 2016 effective tax rate as
compared to 2015 was primarily due to normal tax fluctuations within the ordinary course of business.
The Company’s foreign subsidiaries had accumulated unremitted earnings of $48.9 million and cash of $28.4 million
at September 30, 2017. No deferred taxes have been provided on these accumulated unremitted earnings because these
funds are not needed to meet the liquidity requirements of the Company’s U.S. operations and it is the Company’s
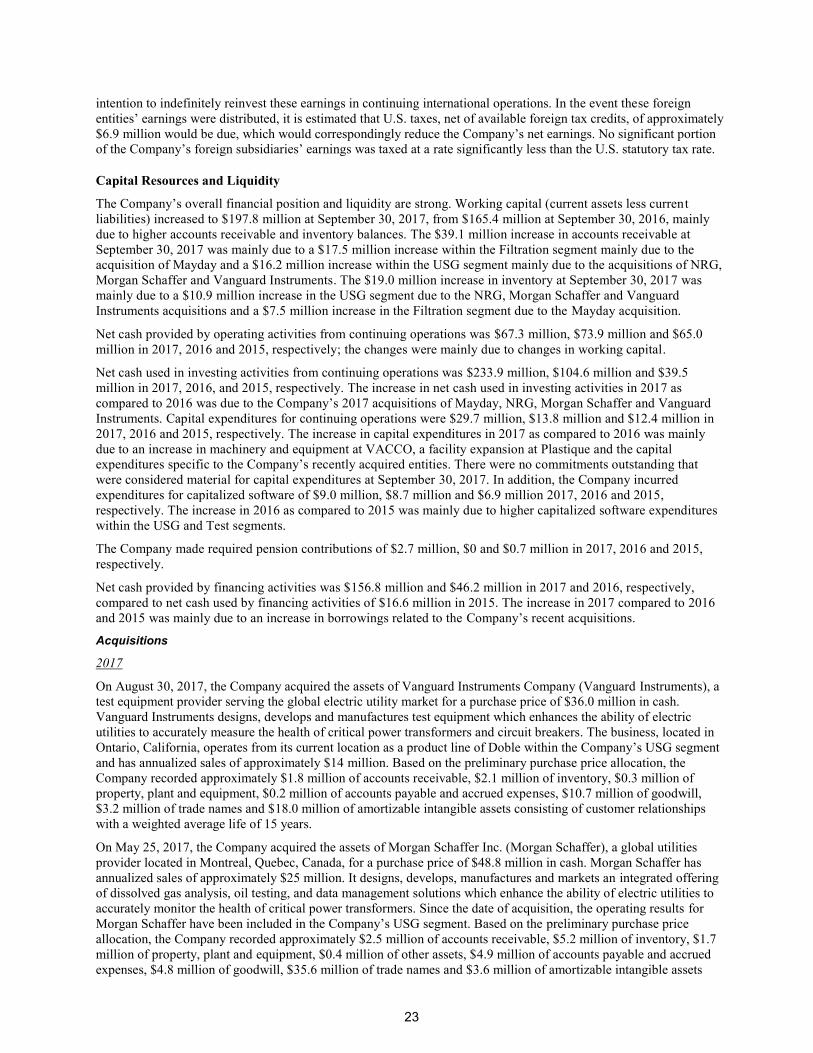
23
intention to indefinitely reinvest these earnings in continuing international operations. In the event these foreign
entities’ earnings were distributed, it is estimated that U.S. taxes, net of available foreign tax credits, of approximately
$6.9 million would be due, which would correspondingly reduce the Company’s net earnings. No significant portion
of the Company’s foreign subsidiaries’ earnings was taxed at a rate significantly less than the U.S. statutory tax rate.
Capital Resources and Liquidity
The Company’s overall financial position and liquidity are strong. Working capital (current assets less curren t
liabilities) increased to $197.8 million at September 30, 2017, from $165.4 million at September 30, 2016, mainly
due to higher accounts receivable and inventory balances. The $39.1 million increase in accounts receivable at
September 30, 2017 was mainly due to a $17.5 million increase within the Filtration segment mainly due to the
acquisition of Mayday and a $16.2 million increase within the USG segment mainly due to the acquisitions of NRG,
Morgan Schaffer and Vanguard Instruments. The $19.0 million increase in inventory at September 30, 2017 was
mainly due to a $10.9 million increase in the USG segment due to the NRG, Morgan Schaffer and Vanguard
Instruments acquisitions and a $7.5 million increase in the Filtration segment due to the Mayday acquisition.
Net cash provided by operating activities from continuing operations was $67.3 million, $73.9 million and $65.0
million in 2017, 2016 and 2015, respectively; the changes were mainly due to changes in working capital.
Net cash used in investing activities from continuing operations was $233.9 million, $104.6 million and $39.5
million in 2017, 2016, and 2015, respectively. The increase in net cash used in investing activities in 2017 as
compared to 2016 was due to the Company’s 2017 acquisitions of Mayday, NRG, Morgan Schaffer and Vanguard
Instruments. Capital expenditures for continuing operations were $29.7 million, $13.8 million and $12.4 million in
2017, 2016 and 2015, respectively. The increase in capital expenditures in 2017 as compared to 2016 was mainly
due to an increase in machinery and equipment at VACCO, a facility expansion at Plastique and the capital
expenditures specific to the Company’s recently acquired entities. There were no commitments outstanding that
were considered material for capital expenditures at September 30, 2017. In addition, the Company incurred
expenditures for capitalized software of $9.0 million, $8.7 million and $6.9 million 2017, 2016 and 2015,
respectively. The increase in 2016 as compared to 2015 was mainly due to higher capitalized software expenditures
within the USG and Test segments.
The Company made required pension contributions of $2.7 million, $0 and $0.7 million in 2017, 2016 and 2015,
respectively.
Net cash provided by financing activities was $156.8 million and $46.2 million in 2017 and 2016, respectively,
compared to net cash used by financing activities of $16.6 million in 2015. The increase in 2017 compared to 2016
and 2015 was mainly due to an increase in borrowings related to the Company’s recent acquisitions.
Acquisitions
2017
On August 30, 2017, the Company acquired the assets of Vanguard Instruments Company (Vanguard Instruments), a
test equipment provider serving the global electric utility market for a purchase price of $36.0 million in cash.
Vanguard Instruments designs, develops and manufactures test equipment which enhances the ability of electric
utilities to accurately measure the health of critical power transformers and circuit breakers. The business, located in
Ontario, California, operates from its current location as a product line of Doble within the Company’s USG segment
and has annualized sales of approximately $14 million. Based on the preliminary purchase price allocation, the
Company recorded approximately $1.8 million of accounts receivable, $2.1 million of inventory, $0.3 million of
property, plant and equipment, $0.2 million of accounts payable and accrued expenses, $10.7 million of goodwill,
$3.2 million of trade names and $18.0 million of amortizable intangible assets consisting of customer relationships
with a weighted average life of 15 years.
On May 25, 2017, the Company acquired the assets of Morgan Schaffer Inc. (Morgan Schaffer), a global utilities
provider located in Montreal, Quebec, Canada, for a purchase price of $48.8 million in cash. Morgan Schaffer has
annualized sales of approximately $25 million. It designs, develops, manufactures and markets an integrated offering
of dissolved gas analysis, oil testing, and data management solutions which enhance the ability of electric utilities to
accurately monitor the health of critical power transformers. Since the date of acquisition, the operating results for
Morgan Schaffer have been included in the Company’s USG segment. Based on the preliminary purchase price
allocation, the Company recorded approximately $2.5 million of accounts receivable, $5.2 million of inventory, $1.7
million of property, plant and equipment, $0.4 million of other assets, $4.9 million of accounts payable and accrued
expenses, $4.8 million of goodwill, $35.6 million of trade names and $3.6 million of amortizable intangible assets
24
consisting of customer relationships and developed technology with a weighted average life of approximately 10
years.
On May 8, 2017, the Company acquired NRG Systems, Inc. (NRG), located in Hinesburg, Vermont, for a purchase
price of $38.6 million in cash. NRG is the global market leader in the design and manufacture of decision support
tools for the renewable energy industry, primarily wind. NRG has annualized sales of approximately $45 million.
Since the date of acquisition, the operating results for NRG have been included in the Company’s USG segment.
Based on the preliminary purchase price allocation, the Company recorded approximately $1.5 million of cash, $4.1
million of accounts receivable, $5.1 million of inventory, $1.0 million of other assets, $9.4 million of property, plant
and equipment (including a capital lease), $4.1 million of accounts payable and accrued expenses, $9.7 million of
lease liability, $8.0 million of goodwill, $8.1 million of trade names and $17.2 million of amortizable intangible assets
consisting of customer relationships with a weighted average life of approximately 14 years.
On November 7, 2016, the Company acquired aerospace suppliers Mayday Manufacturing Co. (Mayday) and its
affiliate Hi-Tech Metals, Inc. (Hi-Tech), which share a state-of-the-art, expandable 130,000 square foot facility in
Denton, Texas, for a purchase price of approximately $75 million in cash. Mayday is a leading manufacturer of
mission-critical bushings, pins, sleeves and precision-tolerance machined components for landing gear, rotor heads,
engine mounts, flight controls and actuation systems for the aerospace and defense industry. Hi-Tech is a full-service
metal processor offering aerospace OEM’s and Tier 1 suppliers a large portfolio of processing services including
anodizing, cadmium and zinc-nickel plating, organic coatings, non-destructive testing and heat treatment. Mayday and
Hi-Tech together have annual sales of approximately $40 million. Since the date of acquisition, the consolidated
operating results for Mayday and Hi-Tech have been included in the Company’s Filtration segment. Based on the
purchase price allocation, the Company recorded approximately $7.3 million of accounts receivable, $10.6 million of
inventory, $16.6 million of property, plant and equipment (including a capital lease), $10.1 million of lease liability,
$15.6 million of deferred tax liabilities, $30.2 million of goodwill, $4.8 million of trade names and $32.8 million of
amortizable identifiable intangible assets consisting primarily of customer relationships with a weighted-average life
of approximately 20 years.
2016
On September 2, 2016, the Company acquired the stock of Westland Technologies, Inc. (Westland), located in
Modesto, California, for a purchase price of approximately $41 million in cash. Westland is a market leader in the
design, development and manufacture of elastomeric-based signature reduction solutions which enhance U.S. Naval
maritime platform survivability. Westland has annual sales of approximately $25 million. Since the date of
acquisition, the operating results for Westland have been included within the Company’s Filtration segment. Based on
the purchase price allocation, the Company recorded tangible assets, net, of $5.5 million, deferred tax liabilities of
$9.5 million, goodwill of $17.9 million, and $28.3 million of identifiable intangible assets primarily consisting of
customer relationships.
On January 29, 2016, the Company acquired Plastique, which is headquartered in Tunbridge Wells, England and has
manufacturing locations in Nottingham, England and Poznan, Poland, for a purchase price of approximately $31.6
million (of which $2.7 million is due over the next two years). Plastique is a market leader in the development and
manufacture of highly-technical thermoformed plastic and precision molded pulp fiber packaging primarily serving
pharmaceutical, personal care, and various specialty end markets. Since the date of acquisition, the operating results
for Plastique have been included within the Company’s Technical Packaging segment. Plastique has annual sales of
approximately $35 million. Based on the purchase price allocation, the Company recorded tangible assets, net, of $9.6
million, goodwill of $10.2 million, and $11.9 million of identifiable intangible assets primarily consisting of customer
relationships.
On October 16, 2015, the Company acquired the stock of Fremont Plastics, Inc. (Fremont) for a purchase price of
$10.5 million in cash. The Company also purchased for $2 million Fremont’s real property located in Fremont,
Indiana. Fremont was a developer, manufacturer, promoter and seller of high quality sterile-ready and non-sterile thin
gauge thermoformed medical plastic packaging products. Immediately following the closing of the transaction,
Fremont was merged into TEQ, and therefore since the date of acquisition the operating results for Fremont have been
included as part of TEQ.
2015
On January 28, 2015, the Company acquired the assets of Enoserv, LLC (Enoserv), headquartered in Tulsa,
Oklahoma, for $20.5 million in cash. Enoserv provides utility customers with high quality, user-friendly multi-
platform software and has annual revenues of approximately $8 million. Since the date of acquisition the operating

25
results for Enoserv have been included as part of Doble within the Company’s USG segment. Based on the purchase
price allocation, the Company recorded approximately $10.0 million of goodwill and $9.0 million of amortizable
identifiable intangible assets consisting primarily of customer relationships and developed technology.
All of the Company’s acquisitions have been accounted for using the purchase method of accounting, and
accordingly, the respective purchase prices were allocated to the assets (including intangible assets) acquired and
liabilities assumed based on estimated fair values at the date of acquisition. The financial results from these
acquisitions have been included in the Company’s financial statements from the date of acquisition.
Bank Credit Facility
The Company’s existing credit facility (“the Credit Facility”) matures December 21, 2020. The Credit Facility
includes a $450 million revolving line of credit as well as provisions allowing for the increase of the credit facility
commitment amount by an additional $250 million, if necessary, with the consent of the lenders. The bank syndication
supporting the facility is comprised of a diverse group of nine banks led by JP Morgan Chase Bank, N.A., as
Administrative Agent.
At September 30, 2017, the Company had approximately $166 million available to borrow under the Credit Facility,
plus the $250 million increase option, in addition to $45.5 million cash on hand. The Company classified $20.0
million as the current portion of long-term debt as of September 30, 2017, as the Company intends to repay this
amount within the next twelve months; however, the Company has no contractual obligation to repay such amount
during the next twelve months.
The Credit Facility requires, as determined by certain financial ratios, a facility fee ranging from 12.5 to 27.5 basis
points per annum on the unused portion. The terms of the facility provide that interest on borrowings may be
calculated at a spread over the London Interbank Offered Rate (LIBOR) or based on the prime rate, at the Company’s
election. The facility is secured by the unlimited guaranty of the Company’s material domestic subsidiaries and a 65%
pledge of its material foreign subsidiaries’ share equity. The financial covenants of the Credit Facility include a
leverage ratio and an interest coverage ratio. As of September 30, 2017, the Company was in compliance with all bank
covenants.
Cash flow from operations and borrowings under the Credit Facility are expected to provide adequate resources to
meet the Company’s capital requirements and operational needs for the foreseeable future.
Dividends
Since 2010 the Company has paid a regular quarterly cash dividend at an annual rate of $0.32 per share. The
Company paid dividends of $8.3 million, $8.2 million and $8.4 million in 2017, 2016 and 2015, respectively.
Contractual Obligations
The following table shows the Company’s contractual obligations as of September 30, 2017:
Payments due by period
Less than 1 to 3 3 to 5 More than (Dollars in millions) Total 1 year years years 5 years
Long-Term Debt Obligation $ 275.0 - - 275.0 - Estimated Interest Payments (1) 31.4 8.3 15.1 7.5 0.5 Operating Lease Obligations 21.7 6.4 9.1 4.7 1.5 Purchase Obligations (2) 9.8 8.4 1.4 - -
Total $ 337.9 23.1 25.6 287.2 2.0
(1) Estimated interest payments for the Company’s debt obligations were calculated based on Management’s determination of the estimated applicable interest rates and payment dates.
(2) A purchase obligation is defined as a legally binding and enforceable agreement to purchase goods and services that specifies all significant terms. Since the majority of the Company’s purchase orders can be cancelled, they are not included in the table above.
As of September 30, 2017, the Company had $0.1 million of liabilities for uncertain tax positions. The unrecognized
tax benefits have been excluded from the table above due to uncertainty as to the amounts and timing of settlement
with taxing authorities.
The Company had no off-balance-sheet arrangements outstanding at September 30, 2017.

26
Share Repurchases
In August 2012, the Company’s Board of Directors authorized a common stock repurchase program under which the
Company may repurchase shares of its stock from time to time in its discretion, in the open market or otherwise, up to
a maximum total repurchase amount of $100 million (or such lesser amount as may be permitted under the
Company’s bank credit agreements). This program has been twice extended by the Company’s Board of Directors and
is currently scheduled to expire September 30, 2019. There were no share repurchases in 2017. The Company
repurchased approximately 120,000 shares for $4.3 million in 2016 and 517,000 shares for $18.2 million in 2015. At
September 30, 2017 approximately $50.4 million remained available for repurchases under the program.
Pension Funding Requirements
The minimum cash funding requirements related to the Company’s defined benefit pension plans are estimated to be
approximately $2.8 million in 2018, $2.8 million in 2019, and $3.1 million in 2020.
Other
As a normal incident of the business in which the Company is engaged, various claims, charges and litigation are
asserted or commenced from time to time against the Company. Additionally, the Company is currently involved in
various stages of investigation and remediation relating to environmental matters. It is the opinion of Management
that the aggregate costs involved in the resolution of these matters, and final judgments, if any, which might be
rendered against the Company are adequately reserved for, are covered by insurance or are not likely to have a
material adverse effect on the Company’s results from continuing operations, capital expenditures or competitive
position.
Outlook
Management continues to see meaningful sales and Adjusted EBITDA growth across each of the Company’s business
segments and anticipates growth rates in 2018 and beyond that exceed the Company’s defined peer group and the
broader industrial market. The details of Management’s growth expectations for 2018 compared to 2017 are as
follows:
• Sales are expected to increase approximately 13% driven by: incremental sales from acquisitions being included
for a full year; increased commercial aerospace deliveries at PTI, Crissair and Mayday; higher organic sales at
USG; significantly higher sales at Test including new product wins currently in backlog; partially offset by a
reduction in lower margin industrial/automotive market product deliveries at PTI; and flat sales in Technical
Packaging.
• Interest expense on higher debt (acquisition funding) is expected to be approximately $9.5 million, reflecting an
increase of $4.9 million (or $0.12 per share) over the $4.6 million of interest expense in 2017;
• Non-cash depreciation and amortization of intangibles is expected to increase approximately $7.1 million (or
$0.18 per share after-tax) as a result of the recent acquisitions. Purchase accounting intangible asset amortization
charges are recorded at Corporate;
• Income tax expense is expected to increase in 2018 as Management is projecting a 35% effective tax rate
calculated on higher pretax earnings.
• In summary, Management projects 2018 EPS to be in the range of $2.30 to $2.40 per share, including the profit
contributions from the recent acquisitions, the additional depreciation and amortization charges, higher interest,
and incremental tax expense as described above.
On a quarterly basis, Management expects 2018 operating results to reflect a profile similar to 2017 and previous
years, with revenues and EPS being more second-half weighted. As with past years, projected second half 2018 sales
and EPS are expected to be significantly stronger than the first half. Management expects Q1 2018 EPS to be in the
range of $0.28 to $0.33 per share. The timing of quarterly sales and earnings throughout the year, coupled with higher
non-cash charges within the respective quarters impacts comparability in Q1.
Market Risk Analysis
Market Risk Exposure
Market risks relating to the Company’s operations result primarily from changes in interest rates and changes in
foreign currency exchange rates. The Company is exposed to market risk related to changes in interest rates and
selectively uses derivative financial instruments, including forward contracts and swaps, to manage these risks.

27
During 2016, the Company entered into several forward contracts to purchase pounds sterling (GBP) to hedge two
deferred payments due in connection with the acquisition of Plastique. In 2017, the Company’s Canadian subsidiary
Morgan Schaffer entered into foreign exchange contracts to manage foreign currency risk, as a portion of their
revenue is denominated in U.S. dollars. All derivative instruments are reported on the balance sheet at fair value. For
derivative instruments designated as cash flow hedges, the gain or loss on the derivative is deferred in accumulated
other comprehensive income until recognized in earnings with the underlying hedged item.
The Company has determined that the market risk related to interest rates with respect to its variable debt is not
material. The Company estimates that if market interest rates averaged one percentage point higher, the effect would
have been less than 4% of net earnings for the year ended September 30, 2017.
The following is a summary of the notional transaction amounts and fair values for the Company’s outstanding
derivative financial instruments as of September 30, 2017.
(In thousands) Notional Amount
(Currency) Fair Value
(US$)
Forward contracts 1,859 GBP (173 ) Forward contracts 3,250 USD 149 Forward contracts 200 EUR (5 )
The Company is also subject to foreign currency exchange rate risk inherent in its sales commitments, anticipated
sales, anticipated purchases and assets and liabilities denominated in currencies other than the U.S. dollar. The foreign
currencies most significant to the Company’s operations are the Canadian Dollar and the Euro. The Company
occasionally hedges certain foreign currency commitments by purchasing foreign currency forward contracts. The
Company does not have material foreign currency market risk; net foreign currency transaction gain/loss was less than
2% of net earnings for 2017, 2016 and 2015.
Critical Accounting Policies
The preparation of financial statements in conformity with U.S. generally accepted accounting principles (GAAP)
requires Management to make estimates and assumptions in certain circumstances that affect amounts reported in the
accompanying Consolidated Financial Statements. In preparing these financial statements, Management has made its
best estimates and judgments of certain amounts included in the Consolidated Financial Statements, giving due
consideration to materiality. The Company does not believe there is a great likelihood that materially different
amounts would be reported under different conditions or using different assumptions related to the accounting policies
described below. However, application of these accounting policies involves the exercise of judgment and use of
assumptions as to future uncertainties and, as a result, actual results could differ from these estimates. The Company’s
senior Management discusses the critical accounting policies described below with the Audit and Finance Committee
of the Company’s Board of Directors on a periodic basis.
The following discussion of critical accounting policies is intended to bring to the attention of readers those
accounting policies which Management believes are critical to the Consolidated Financial Statements and other
financial disclosure. It is not intended to be a comprehensive list of all significant accounting policies that are more
fully described in Note 1 to the Consolidated Financial Statements included herein.
Revenue Recognition
Filtration Segment: Within the Filtration segment, approximately 86% of revenues (approximately 36% of
consolidated revenues) are recognized when products are delivered (when title and risk of ownership transfers) or
when services are performed for unaffiliated customers.
Approximately 14% of the segment’s revenues (approximately 6% of consolidated revenues) are recorded under the
percentage-of-completion method because the Company manufactures complex products for aerospace and military
customers under production contracts. The majority of these contracts are cost-reimbursable contracts which provide
for the payment of allowable costs incurred during the performance of the contract plus an incentive fee. The
remainder of the contracts are fixed-price contracts. The percentage-of-completion method of accounting involves the
use of various estimating techniques to project costs at completion. These estimates involve various assumptions and
projections relative to the outcome of future events over a period of several years, including future labor productivity
and availability, the nature and complexity of the work to be performed, availability of materials, the impact of
delayed performance, the timing of product deliveries, and estimates of incentive fees based on past experience and
anticipated performance. These estimates are based on Management’s judgment and the Company’s substantial
experience in developing these types of estimates. Changes in underlying assumptions/estimates may adversely affect

28
financial performance if they increase estimated project costs at completion, or positively affect financial performance
if they decrease estimated project costs at completion. Due to the nature of these contracts and the operating unit’s
cost estimating process, the Company believes that these estimates generally should not be subject to significant
variation in the future. There have been no material changes to these estimates for the financial statement periods
presented. The Company regularly reviews its estimates to assess revisions in contract values and estimated costs at
completion.
Test Segment: Within the Test segment, approximately 30% of revenues (approximately 7% of consolidated
revenues) are recognized when products are delivered (when title and risk of ownership transfers) or when services are
performed for unaffiliated customers.
Approximately 70% of the segment’s revenues (approximately 16% of consolidated revenues) are recorded under the
percentage-of-completion method due to the complex nature of the enclosures that are designed and produced under
these contracts. As discussed above, this method of accounting involves the use of various estimating techniques to
project costs at completion, which are based on Management’s judgment and the Company’s substantial experience in
developing these types of estimates. Changes in underlying assumptions/estimates may adversely or positively affect
financial performance in a period. Due to the nature of these contracts and the operating unit’s cost estimating process,
the Company believes that these estimates generally should not be subject to significant variation in the future. There
have been no material changes to these estimates for the financial statement periods presented. The Company
regularly reviews its contract estimates to assess revisions in contract values and estimated costs at completion.
USG Segment: Within the USG segment, approximately 78% of revenues (approximately 18% of consolidated
revenues) are recognized when products are delivered (when title and risk of ownership transfers) or when services are
performed for unaffiliated customers. Approximately 22% of the segment’s revenues (approximately 5% of
consolidated revenues) are recognized on a straight-line basis over the lease term.
Technical Packaging Segment: Within the Technical Packaging segment, 100% of revenues (approximately 12% of
consolidated revenues) represent products and services sold and are recognized when products are delivered (when
title and risk of ownership transfers), or when services are performed for unaffiliated customers.
Income Taxes
The Company operates in numerous taxing jurisdictions and is subject to examination by various U.S. Federal, state
and foreign jurisdictions for various tax periods. The Company’s income tax positions are based on research and
interpretations of the income tax laws and rulings in each of the jurisdictions in which the Company does business.
Due to the subjectivity of interpretations of laws and rulings in each jurisdiction, the differences and interplay in tax
laws between those jurisdictions, as well as the inherent uncertainty in estimating the final resolution of complex tax
audit matters, Management’s estimates of income tax liabilities may differ from actual payments or assessments.
Management regularly assesses the Company’s position with regard to tax exposures and records liabilities for these
uncertain tax positions and related interest and penalties, if any, according to the principles of Financial Accounting
Standards Board (FASB) ASC Topic 740, Income Taxes (ASC 740). The Company has recorded an accrual that
reflects the recognition and measurement process for the financial statement recognition and measurement of a tax
position taken or expected to be taken on a tax return based upon ASC 740. Additional future income tax expense or
benefit may be recognized once the positions are effectively settled. It is the Company’s policy to follow FASB ASC
740-10-45-20 and record the tax effects of changes in the opening balance of unrecognized tax benefits in net earnings
from continuing operations.
At the end of each interim reporting period, Management estimates the effective tax rate expected to apply to the full
fiscal year. The estimated effective tax rate contemplates the expected jurisdiction where income is earned, as well as
tax planning strategies. Current and projected growth in income in higher tax jurisdictions may result in an increasing
effective tax rate over time. If the actual results differ from Management’s estimates, Management may have to adjust
the effective tax rate in the interim period if such determination is made.
Income taxes are accounted for under the asset and liability method. Deferred tax assets and liabilities are recognized
for the future tax consequences attributable to differences between the financial statement carrying amounts of
existing assets and liabilities and their respective tax bases. Deferred tax assets and liabilities are measured using
enacted tax rates expected to apply to taxable income in the years in which those temporary differences are expected
to be recovered or settled. Deferred tax assets may be reduced by a valuation allowance if it is more likely than not
that some portion of the deferred tax assets will not be realized. The effect on deferred tax assets and liabilities of a
change in tax rates is recognized in income in the period that includes the enactment date. The Company regularly
reviews its deferred tax assets for recoverability and establishes a valuation allowance when Management believes it

29
is more likely than not such assets will not be recovered, taking into consideration historical operating results,
expectations of future earnings, tax planning strategies, and the expected timing of the reversals of existing temporary
differences.
Goodwill And Other Long-Lived Assets
Management annually reviews goodwill and other long-lived assets with indefinite useful lives for impairment or
whenever events or changes in circumstances indicate the carrying amount may not be recoverable. If the Company
determines that the carrying value of the long-lived asset may not be recoverable, a permanent impairment charge is
recorded for the amount by which the carrying value of the long-lived asset exceeds its fair value. Fair value is
measured based on a discounted cash flow method using a discount rate determined by Management to be
commensurate with the risk inherent in the Company’s current business model. The estimates of cash flows and
discount rate are subject to change due to the economic environment, including such factors as interest rates, expected
market returns and volatility of markets served. Management believes that the estimates of future cash flows and fair
value are reasonable; however, changes in estimates could result in impairment charges. At September 30, 2017, the
Company has determined that no reporting units are at risk of goodwill impairment as the fair value of each reporting
unit substantially exceeded its carrying value.
Intangible assets with estimable useful lives are amortized over their respective estimated useful lives to their
estimated residual values, and are reviewed for impairment whenever events or changes in business circumstances
indicate the carrying value of the assets may not be recoverable.
Pension Plans and Other Postretirement Benefit Plans
The measurement of liabilities related to pension plans and other postretirement benefit plans is based on
Management’s assumptions related to future events including interest rates, return on pension plan assets, and health
care cost trend rates. Actual pension plan asset performance will either decrease or increase unamortized pension
losses/gains that will affect net earnings in future years. Depending upon the performance of the equity and bond
markets in 2018, the Company could be required to record a charge to other comprehensive income/loss. In addition,
if the discount rate were decreased by 25 basis points from 3.65% to 3.40%, the projected benefit obligation for the
defined benefit plan would increase by approximately $2.8 million and result in an additional after-tax charge to other
comprehensive income/loss of approximately $1.8 million. The discount rate used in measuring the Company’s
pension and postretirement welfare obligations was developed by matching yields of actual high-quality corporate
bonds to expected future pension plan cash flows (benefit payments). Over 400 Aa-rated, non-callable bonds with a
wide range of maturities were used in the analysis. After using the bond yields to determine the present value of the
plan cash flows, a single representative rate that resulted in the same present value was developed.
Other Matters
Contingencies
As a normal incident of the businesses in which the Company is engaged, various claims, charges and litigation are
asserted or commenced from time to time against the Company. Additionally, the Company is currently involved in
various stages of investigation and remediation relating to environmental matters. It is the opinion of Management
that the aggregate costs involved in the resolution of these matters, and final judgments, if any, which might be
rendered against the Company are adequately accrued, are covered by insurance or are not likely to have a material
adverse effect on the Company’s results from continuing operations, capital expenditures, or competitive position.
Quantitative and Qualitative Disclosures About Market Risk
Market risks relating to the Company’s operations result primarily from changes in interest rates and changes in
foreign currency exchange rates. The Company is exposed to market risk related to changes in interest rates and
selectively uses derivative financial instruments, including forward contracts and swaps, to manage these risks.
During 2016 the Company entered into several forward contracts to purchase pounds sterling (GBP) to hedge two
deferred payments (one due in January 2018 and one due in January 2019) due in connection with the acquisition of
Plastique. In addition, the Company’s Canadian subsidiary Morgan Schaffer has entered into foreign exchange
contracts to manage foreign currency risk as a portion of their revenue is denominated in U.S. dollars. All derivative
instruments are reported on the balance sheet at fair value. For derivative instruments designated as cash flow
hedges, the gain or loss on the derivative is deferred in accumulated other comprehensive income until recognized in
earnings with the underlying hedged item. See further discussion regarding the Company’s market risks in
“Market Risk Analysis,” above.

30
Controls and Procedures
For a description of the Company’s evaluation of its disclosure controls and procedures, see Item 9A, “Controls and
Procedures.”
New Accounting Pronouncements
In January 2017, the FASB issued Accounting Standards Update (ASU) No. 2017-04, Simplifying the Test for
Goodwill Impairment (ASU 2017-04), which eliminates Step 2 from the goodwill impairment test. Under the
amendments in this update, an entity should recognize an impairment charge for the amount by which the carrying
amount exceeds the reporting unit’s fair value; however, the loss recognized should not exceed the total amount of
goodwill allocated to that reporting unit. The new standard is effective for fiscal years beginning after December 15,
2019. Early adoption is permitted for interim or annual goodwill impairment tests performed on testing dates after
January 1, 2017. The Company adopted this standard in the fourth quarter of 2017 with its annual goodwill
impairment tests. The adoption of ASU 2017-04 did not have an impact on the Company’s Consolidated Financial
Statements.
In March 2016, the FASB issued ASU No. 2016-09, Improvements to Employee Share-Based Payment Accounting,
which simplified the income tax consequences, accounting for forfeitures and classification on the Statements of
Consolidated Cash Flows. The Company adopted this standard in the current year resulting in the income tax
expense in the third quarter and fiscal year 2017 being favorably impacted by additional tax benefits on share-based
compensation that vested during the third quarter of 2017 decreasing the effective tax rate by 5.1% and 1.1%,
respectively.
In February 2016, the FASB issued ASU No. 2016-062, Leases (Topic 842), which, among other things, requires an
entity to recognize lease assets and lease liabilities on the balance sheet and disclose key information about leasing
arrangements. This new standard will increase an entity’s reported assets and liabilities. The new standard is
effective for fiscal years beginning after December 15, 2018 and mandates a modified retrospective transition period
for all entities. The Company is currently assessing the impact of this new standard on its consolidated financial
statements and related disclosures.
In November 2015, the FASB issued ASU No. 2015-17, Balance Sheet Classification of Deferred Taxes, which
requires entities to present deferred tax assets and deferred tax liabilities as noncurrent in a classified balance sheet.
This new standard is effective for annual periods beginning after December 15, 2016. The Company adopted this
standard during the fourth quarter of 2016 and applied it on a prospective basis.
In May 2014, the FASB issued ASU No. 2014-09, Revenue from Contracts with Customers, which requires an entity
to recognize the amount of revenue to which it expects to be entitled for the transfer of promised goods or services to
customers. This guidance has been further clarified and amended. The new standard will be effective for annual
reporting periods beginning after December 15, 2017, and interim periods within those annual periods. The standard
permits the use of either the retrospective or cumulative effect transition method. The Company is currently in the
process of calculating the effect that ASU 2014-09 will have on its consolidated financial statements and related
disclosures. The Company has selected the Cumulative Effect method of transition to the new standard.
Item 7A. Quantitative and Qualitative Disclosures About Market Risk
See “Market Risk Analysis” and “Other Matters – Quantitative And Qualitative Disclosures About Market Risk” in
Item 7, “Management’s Discussion and Analysis of Financial Condition and Results of Operations,” which are
incorporated into this Item by reference.
Item 8. Financial Statements and Supplementary Data
The information required by this Item is incorporated by reference to the Consolidated Financial Statements of the
Company, the Notes thereto, and the related “Report of Independent Registered Public Accounting Firm” of KPMG
LLP, as set forth in the Financial Information section beginning on page F-1 of this Annual Report; an Index is
provided on page F-1.
31
Item 9. Changes in and Disagreements with Accountants on Accounting and Financial Disclosure
Not Applicable.
Item 9A. Controls and Procedures
For 2017 the Company carried out an evaluation of the effectiveness of the design and operation of the Company’s
disclosure controls and procedures, as defined in Rules 13a-15(e) and 15d–15(e) under the Securities Exchange Act of
1934, as amended (the Exchange Act). The evaluation was conducted under the supervision and with the participation
of the Company’s Management, including the Company’s Chief Executive Officer and Chief Financial Officer, using
the Internal Control – Integrated Framework (2013) issued by the Committee of Sponsoring Organizations of the
Treadway Commission (COSO). Disclosure controls and procedures are controls and procedures that are designed to
ensure that information required to be disclosed in Company reports filed or submitted under the Exchange Act is
recorded, processed, summarized and reported within the time periods specified in the Securities and Exchange
Commission’s rules and forms. Based upon that evaluation, the Company’s Chief Executive Officer and Chief
Financial Officer concluded that the Company’s disclosure controls and procedures were effective as of September
30, 2017.
There were no changes in the Company’s internal control over financial reporting (as defined in Rule 13a-15(f) under
the Exchange Act) during the fiscal quarter ended September 30, 2017 that have materially affected, or are reasonably
likely to materially affect, the Company’s internal control over financial reporting.
For the remainder of the information required by this item, see “Management’s Report on Internal Control over
Financial Reporting” and the related “Report of Independent Registered Public Accounting Firm” of KPMG LLP, in
the Financial Information section beginning on page F-1 of this Annual Report, which are incorporated into this Item
by reference.
Item 9B. Other Information
None.
32
PART III
Item 10. Directors, Executive Officers and Corporate Governance
Information regarding nominees and directors, the Company’s Code of Ethics, its Audit and Finance Committee, and
compliance with Section 16(a) of the Securities Exchange Act of 1934 is hereby incorporated by reference to the
sections captioned “Proposal 1: Election of Directors,” “Board of Directors – Governance Policies and Management
Oversight,” “Committees” and “Securities Ownership – Section 16(a) Beneficial Ownership Reporting
Compliance” in the 2017 Proxy Statement.
Information regarding the Company’s executive officers is set forth in Item 1, “Business – Executive Officers of the
Registrant,” above.
Item 11. Executive Compensation
Information regarding the Company’s compensation committee and director and executive officer compensation is
hereby incorporated by reference to the sections captioned “Committees – Compensation Committee Interlocks and
Insider Participation,” “Director Compensation” and “Executive Compensation Information” in the 2017 Proxy
Statement.
Item 12. Security Ownership of Certain Beneficial Owners and Management and Related Stockholder Matters
Information regarding the beneficial ownership of shares of the Company’s common stock by nominees and directors,
by executive officers, by directors and executive officers as a group and by any known five percent stockholders is
hereby incorporated by reference to the section captioned “Securities Ownership” in the 2017 Proxy Statement.
Information regarding shares of the Company’s common stock issued or issuable under the Company’s equity
compensation plans is hereby incorporated by reference to the section captioned “Proposal 3: Approval of 2018
Omnibus Incentive Plan – Other Equity Compensation Plan Information” in the 2017 Proxy Statement.
Item 13. Certain Relationships and Related Transactions and Director Independence
Information regarding transactions with related parties and the independence of the Company’s directors, nominees
for directors and members of the committees of the board of directors is hereby incorporated by reference to the
sections captioned “Board of Directors” and “Committees” in the 2017 Proxy Statement.
Item 14. Principal Accounting Fees and Services
Information regarding the Company’s independent registered public accounting firm, its fees and services, and the
Company’s Audit and Finance Committee’s pre-approval policies and procedures regarding such fees and services, is
hereby incorporated by reference to the section captioned “Audit-Related Matters” in the 2017 Proxy Statement.

33
PART IV
Item 15. Exhibits, Financial Statement Schedules
(a) The following documents are filed as a part of this Report:
(1) Financial Statements. The Consolidated Financial Statements of the Company, and the Report of
Independent Registered Public Accounting Firm thereon of KPMG LLP, are included in this Report
beginning on page F-1; an Index thereto is set forth on page F-1.
(2) Financial Statement Schedules. Financial Statement Schedules are omitted because either they are not
applicable or the required information is included in the Consolidated Financial Statements or the Notes
thereto.
(3) Exhibits. The following exhibits are filed with this Report or incorporated herein by reference to the
document location indicated:
Exhibit No. Description Document Location
3.1(a) Restated Articles of Incorporation Exhibit 3(a) to the Company’s Form 10-K for the fiscal year ended September 30, 1999
3.1(b) Amended Certificate of Designation, Preferences and Rights of Series A Participating Cumulative Preferred Stock
Exhibit 4(e) to the Company’s Form 10-Q for the fiscal quarter ended March 31, 2000
3.1(c) Articles of Merger, effective July 10, 2000 Exhibit 3(c) to the Company’s Form 10-Q for the fiscal quarter ended June 30, 2000
3.2 Bylaws Exhibit 3.1 to the Company’s Form 8-K filed August 7, 2014
4.1 Specimen revised Common Stock Certificate Exhibit 4.1 to the Company’s Form 10-Q for the fiscal quarter ended March 31, 2010
4.2 Credit Agreement dated as of May 14, 2012 among the Registrant, the Foreign Subsidiary Borrowers from time to time party thereto, the Lenders from time to time party thereto, JPMorgan Chase Bank, N.A. as Administrative Agent, PNC Bank, National Association as Syndication Agent, and SunTrust Bank, Wells Fargo Bank, National Association and Bank of America, N.A. as Co-Documentation Agents.
Exhibit 4.1 to the Company’s Form 8-K filed May 18, 2012
4.3 Amended and Restated Credit Agreement dated as of December 21, 2015 among the Registrant, the Foreign Subsidiary Borrowers from time to time party thereto, the Lenders from time to time party thereto, JP Morgan Chase Bank, N.A. as Administrative Agent, and Bank of America, N.A., BMO Harris Bank, N.A., SunTrust Bank and Wells Fargo Bank, National Association as Co-Documentation Agents
Exhibit 4.1 to the Company’s Form 8-K filed December 23, 2015
4.4 Amendment No. 1 to Credit Agreement dated as of December 21, 2015, effective September 30, 2016
Exhibit 4.4 to the Company’s Form 10-K filed November 29, 2016
4.5 Amendment No. 2 to Credit Agreement dated as of December 21, 2015, effective May 15, 2017
Exhibit 4.4 to the Company’s Form 10-Q filed August 8, 2017
10.1 Securities Purchase Agreement dated March 14, 2014 between ESCO Technologies Holding LLC and Meter Readings Holding LLC
Exhibit 10.1 to the Company’s Form 8-K filed March 28, 2014

34
Exhibit No. Description Document Location
10.2 Form of Indemnification Agreement with each of ESCO’s non-employee directors
Exhibit 10.1 to the Company’s Form 10-K for the fiscal year ended September 30, 2012
10.3(a) * First Amendment to the ESCO Electronics Corporation Supplemental Executive Retirement Plan, effective August 2, 1993 (comprising restatement of entire Plan)
Exhibit 10.2(a) to the Company’s Form 10-K for the fiscal year ended September 30, 2012
10.3(b) * Second Amendment to Supplemental Executive Retirement Plan, effective May 1, 2001
Exhibit 10.4 to the Company’s Form 10-K for the fiscal year ended September 30, 2001
10.3(c) * Form of Supplemental Executive Retirement Plan Agreement
Exhibit 10.28 to the Company’s Form 10-K for the fiscal year ended September 30, 2002
10.4(a) * Directors’ Extended Compensation Plan, adopted effective October 11, 1993
Exhibit 10.3(a) to the Company’s Form 10-K for the fiscal year ended September 30, 2012
10.4(b) * First Amendment to Directors’ Extended Compensation Plan effective January 1, 2000
Exhibit 10.11 to the Company’s Form 10-K for the fiscal year ended September 30, 2000
10.4(c) * Second Amendment to Directors’ Extended Compensation Plan, effective April 1, 2001
Exhibit 10.7 to the Company’s Form 10-K for the fiscal year ended September 30, 2001
10.4(d) * Third Amendment to Directors’ Extended Compensation Plan, effective October 3, 2007
Exhibit 10.43 to the Company’s Form 10-K for the fiscal year ended September 30, 2007
10.4(e) * Fourth Amendment to Directors’ Extended Compensation Plan, effective August 7, 2013
Exhibit 10.3(e) to the Company’s Form 10-K for the fiscal year ended September 30, 2013
10.5(a) * Compensation Plan For Non-Employee Directors, as restated to reflect all amendments through May 29, 2014
Exhibit 10.1 to the Company’s Form 8-K filed October 2, 2014
10.5(b) * Compensation Plan For Non-Employee Directors, as amended and restated November 8, 2017
Exhibit 10.3 to the Company’s Form 8-K filed November 14, 2017
10.6(a) * 2013 Incentive Compensation Plan Appendix A to the Company’s Schedule 14A Proxy Statement filed December 19, 2012
10.6(b) * Form of Notice of Award (2013-14) – Performance-Accelerated Restricted Stock (2013 Incentive Compensation Plan)
Exhibit 10.7(b) to the Company’s Form 10-K for the fiscal year ended September 30, 2013
10.6(c) * Form of Award Agreement under 2013 Incentive Compensation Plan, effective November 11, 2015
Exhibit 10.1 to the Company’s Form 8-K filed November 12, 2015
10.6(d) * Form of Amendment to 2012-2014 Awards under 2004 and 2013 Incentive Compensation Plans, effective November 11, 2015
Exhibit 10.2 to the Company’s Form 8-K filed November 12, 2015
10.7(a) * Sixth Amendment and Restatement of Employee Stock Purchase Plan effective as of October 15, 2003
Appendix C to the Company’s Schedule 14A Proxy Statement filed December 29, 2003
10.7(b) * Seventh Amendment to Employee Stock Purchase Plan effective as of February 6, 2013
Exhibit 10.8(b) to the Company’s Form 10-K for the fiscal year ended September 30, 2013
10.8(a) * Performance Compensation Plan for Corporate, Subsidiary and Division Officers and Key Managers, adopted August 2, 1993, as amended and restated through August 8, 2012
Exhibit 10.9 to the Company’s Form 10-K for the fiscal year ended September 30, 2012
10.8(b) * Performance Compensation Plan for Corporate, Subsidiary and Division Officers and Key Managers, adopted August 2, 1993, as amended and restated through November 9, 2017
Exhibit 10.1 to the Company’s Form 8-K filed November 14, 2017

35
Exhibit No. Description Document Location
10.9 * Incentive Compensation Plan for Executive Officers, adopted November 9, 2005, as amended and restated through August 8, 2012
Exhibit 10.10 to the Company’s Form 10-K for the fiscal year ended September 30, 2012
10.10 * Compensation Recovery Policy, adopted effective February 4, 2010
Exhibit 10.6 to the Company’s Form 8-K filed February 10, 2010
10.11 Severance Plan adopted as of August 10, 1995, as Amended and Restated November 11, 2015
Exhibit 10.1 to the Company’s Form 8-K/A filed November 30, 2015
10.12(a) * Employment Agreement with Victor L. Richey, effective November 3, 1999
Exhibit 10(bb) to the Company’s Form 10-K for the fiscal year ended September 30, 1999
(Note: Agreement with Victor L. Richey is substantially identical to the referenced Exhibit and is therefore omitted as a separate exhibit pursuant to Rule 12b-31)
10.12(b) * Second Amendment to Employment Agreement with Victor L. Richey, effective May 5, 2004
Exhibit 10.1 to the Company’s Form 10-Q for the fiscal quarter ended June 30, 2004
10.12(c) * Third Amendment to Employment Agreement with Victor L. Richey, effective December 31, 2007
Exhibit 10.1 to the Company’s Form 8-K filed January 7, 2008
10.13(a) * Employment Agreement with Gary E. Muenster, effective November 3, 1999
Exhibit 10(bb) to the Company’s Form 10-K for the fiscal year ended September 30, 1999
(Note: Agreement with Gary E. Muenster is substantially identical to the referenced Exhibit except that it provides a minimum base salary of $108,000, and is therefore omitted as a separate exhibit pursuant to Rule 12b-31)
10.13(b) * Second Amendment to Employment Agreement with Gary E. Muenster, effective May 5, 2004
Exhibit 10.2 to the Company’s Form 10-Q for the fiscal quarter ended June 30, 2004
10.13(c) * Third Amendment to Employment Agreement with Gary E. Muenster, effective December 31, 2007
Exhibit 10.1 to the Company’s Form 8-K filed January 7, 2008
(Note: Third Amendment with Gary E. Muenster is substantially identical to the referenced Exhibit except that (i) the termination amounts payable under Paragraph 9.a(1) are equal to base salary for 12 months and (ii) under Paragraph 9.a(1)(B), such termination amounts may be paid in biweekly installments equal to 1/26th of such amounts, and is therefore omitted as a separate exhibit pursuant to Rule 12b-31)
10.13(d) * Fourth Amendment to Employment Agreement with Gary E. Muenster, effective February 6, 2008
Exhibit 10.1 to the Company’s Form 8-K filed February 12, 2008
10.14(a) * Employment Agreement with Alyson S. Barclay, effective November 3, 1999
Exhibit 10(bb) to the Company’s Form 10-K for the fiscal year ended September 30, 1999
(Note: Agreement with Alyson S. Barclay is substantially identical to the referenced Exhibit except that it provides a minimum base salary of $94,000, and is therefore omitted as a separate exhibit pursuant to Rule 12b-31)

36
Exhibit No. Description Document Location
10.14(b) * Second Amendment to Employment Agreement with Alyson S. Barclay, effective May 5, 2004
Exhibit 10.2 to the Company’s Form 10-Q for the fiscal quarter ended June 30, 2004
(Note: Second Amendment with Alyson S. Barclay is substantially identical to the referenced Exhibit, and is therefore omitted as a separate exhibit pursuant to Rule 12b-31)
10.14(c) * Third Amendment to Employment Agreement with Alyson S. Barclay, effective December 31, 2007
Exhibit 10.1 to the Company’s Form 8-K filed January 7, 2008
(Note: Third Amendment with Alyson S. Barclay is substantially identical to the referenced Exhibit except that (i) the termination amounts payable under Paragraph 9.a(1) are equal to base salary for 12 months and (ii) under Paragraph 9.a(1)(B), such termination amounts may be paid in biweekly installments equal to 1/26th of such amounts, and is therefore omitted as a separate exhibit pursuant to Rule 12b-31)
10.14(d) * Fourth Amendment to Employment Agreement with Alyson S. Barclay, effective July 29, 2010
Exhibit 10.1 to the Company’s Form 8-K filed August 3, 2010
21 Subsidiaries of the Company Filed herewith
23 Consent of Independent Registered Public Accounting Firm
Filed herewith
31.1 Certification of Chief Executive Officer Filed herewith
31.2 Certification of Chief Financial Officer Filed herewith
32 ** Certification of Chief Executive Officer and Chief Financial Officer
Filed herewith
101.INS *** XBRL Instance Document Submitted herewith
101.SCH *** XBRL Schema Document Submitted herewith
101.CAL *** XBRL Calculation Linkbase Document Submitted herewith
101.LAB *** XBRL Label Linkbase Document Submitted herewith
101.PRE *** XBRL Presentation Linkbase Document Submitted herewith
101.DEF *** XBRL Definition Linkbase Document Submitted herewith
-----------
* Indicates a management contract or compensatory plan or arrangement.
** Furnished (and not filed) with the Commission pursuant to Item 601(b)(32)(ii) of Regulation S-K.
*** Exhibit 101 to this report consists of documents formatted in XBRL (Extensible Business Reporting Language).

37
SIGNATURES
Pursuant to the requirements of Section 13 or 15(d) of the Securities Exchange Act of 1934, the registrant has duly
caused this report to be signed on its behalf by the undersigned, thereunto duly authorized.
ESCO TECHNOLOGIES INC.
By: /s/ Victor L. Richey
Victor L. Richey
President and Chief Executive Officer
Date: November 29, 2017
Pursuant to the requirements of the Securities Exchange Act of 1934, this report has been signed below by the
following persons on behalf of the registrant in the capacities and on the dates indicated.
Signature Title Date
/s/ Victor L. Richey
Victor L. Richey
Chairman, President, Chief Executive
Officer and Director
November 29, 2017
/s/ Gary E. Muenster
Gary E. Muenster
Executive Vice President, Chief Financial
Officer (Principal Accounting Officer)
and Director
November 29, 2017
/s/ Patrick M. Dewar
Patrick M. Dewar
Director November 29, 2017
/s/ Vinod M. Khilnani
Vinod M. Khilnani
Director November 29, 2017
/s/ Leon J. Olivier
Leon J. Olivier
Director November 29, 2017
/s/ Robert J. Phillippy
Robert J. Phillippy
Director November 29, 2017
/s/ Larry W. Solley
Larry W. Solley
Director November 29, 2017
/s/ James M. Stolze
James M. Stolze
Director November 29, 2017

[This page is intentionally left blank]
F-1
FINANCIAL INFORMATION
INDEX Report of Independent Registered Public Accounting Firm F-2 Consolidated Statements of Operations F-3 Consolidated Statements of Comprehensive Income (Loss) F-3 Consolidated Balance Sheets F-4 Consolidated Statements of Shareholders’ Equity F-6 Consolidated Statements of Cash Flows F-7 Notes to Consolidated Financial Statements F-8 Management’s Statement of Financial Responsibility F-28 Management’s Report on Internal Control Over Financial Reporting F-29 Report of Independent Registered Public Accounting Firm F-30
F-2
REPORT OF INDEPENDENT REGISTERED PUBLIC ACCOUNTING FIRM
The Board of Directors and Shareholders
ESCO Technologies Inc.:
We have audited the accompanying consolidated balance sheets of ESCO Technologies Inc. and subsidiaries (the
Company) as of September 30, 2017 and 2016, and the related consolidated statements of operations, comprehensive
income (loss), shareholders’ equity, and cash flows for each of the years in the three-year period ended September 30,
2017. These consolidated financial statements are the responsibility of the Company’s management. Our
responsibility is to express an opinion on these consolidated financial statements based on our audits.
We conducted our audits in accordance with the standards of the Public Company Accounting Oversight Board
(United States). Those standards require that we plan and perform the audit to obtain reasonable assurance about
whether the financial statements are free of material misstatement. An audit includes examining, on a test basis,
evidence supporting the amounts and disclosures in the financial statements. An audit also includes assessing the
accounting principles used and significant estimates made by management, as well as evaluating the overall financial
statement presentation. We believe that our audits provide a reasonable basis for our opinion.
In our opinion, the consolidated financial statements referred to above present fairly, in all material respects, the
financial position of the Company as of September 30, 2017 and 2016, and the results of its operations and its cash
flows for each of the years in the three-year period ended September 30, 2017, in conformity with U.S. generally
accepted accounting principles.
We also have audited, in accordance with the standards of the Public Company Accounting Oversight Board (United
States), ESCO Technologies Inc.’s internal control over financial reporting as of September 30, 2017, based on
criteria established in Internal Control – Integrated Framework (2013) issued by the Committee of Sponsoring
Organizations of the Treadway Commission (COSO), and our report dated November 29, 2017 expressed an
unqualified opinion on the effectiveness of the Company’s internal control over financial reporting.
/s/ KPMG LLP
St. Louis, Missouri
November 29, 2017

F-3
CONSOLIDATED STATEMENTS OF OPERATIONS
(Dollars in thousands, except per share amounts) Years ended September 30, 2017 2016 2015
Net sales $ 685,740 571,459 537,291 Costs and expenses:
Cost of sales 436,918 350,807 334,850 Selling, general and administrative expenses 148,433 131,493 130,166 Amortization of intangible assets 16,338 11,630 8,850 Interest expense, net 4,578 1,308 785 Other (income) expenses, net (680 ) 7,801 1,119
Total costs and expenses 605,587 503,039 475,770
Earnings before income tax 80,153 68,420 61,521 Income tax expense 26,450 22,538 19,785
Net earnings from continuing operations 53,703 45,882 41,736 Earnings on sale from discontinued operations, net of tax expense of $390 in
2015 – – 776
Net earnings from discontinued operations – – 776
Net earnings $ 53,703 45,882 42,512
Earnings per share: Basic:
Continuing operations $ 2.08 1.78 1.60 Discontinued operations – – 0.03
Net earnings $ 2.08 1.78 1.63
Diluted: Continuing operations $ 2.07 1.77 1.59 Discontinued operations – – 0.03
Net earnings $ 2.07 1.77 1.62
Average common shares outstanding (in thousands): Basic 25,774 25,762 26,077 Diluted 25,995 25,968 26,265
See accompanying Notes to Consolidated Financial Statements.
CONSOLIDATED STATEMENTS OF COMPREHENSIVE INCOME (LOSS)
(Dollars in thousands) Years ended September 30, 2017 2016 2015
Net earnings $ 53,703 45,882 42,512 Other comprehensive income (loss), net of tax:
Foreign currency translation adjustments 6,383 (1,462 ) (6,297 ) Amortization of prior service costs and actuarial gains (losses) 5,573 (5,250 ) (6,961 ) Net unrealized gain (loss) on derivative instruments 19 (33 ) (94 )
Total other comprehensive income (loss), net of tax 11,975 (6,745 ) (13,352 )
Comprehensive income $ 65,678 39,137 29,160
See accompanying Notes to Consolidated Financial Statements.

F-4
CONSOLIDATED BALANCE SHEETS
(Dollars in thousands) As of September 30, 2017 2016
ASSETS Current assets:
Cash and cash equivalents $ 45,516 53,825 Accounts receivable, less allowance for doubtful accounts of $2,030 and $1,930 in 2017 and
2016, respectively 160,580 121,486 Costs and estimated earnings on long-term contracts, less progress billings of $64,099 and
$31,129 in 2017 and 2016, respectively 47,286 28,746 Inventories 124,515 105,542 Other current assets 14,895 13,884
Total current assets 392,792 323,483
Property, plant and equipment:
Land and land improvements 9,964 9,374 Buildings and leasehold improvements 88,469 62,822 Machinery and equipment 129,366 99,240 Construction in progress 4,599 5,423
232,398 176,859
Less accumulated depreciation and amortization (99,650 ) (84,454 )
Net property, plant and equipment 132,748 92,405 Intangible assets, net 351,134 231,759 Goodwill 377,879 323,616 Other assets 5,891 7,108
Total Assets $ 1,260,444 978,371
See accompanying Notes to Consolidated Financial Statements.
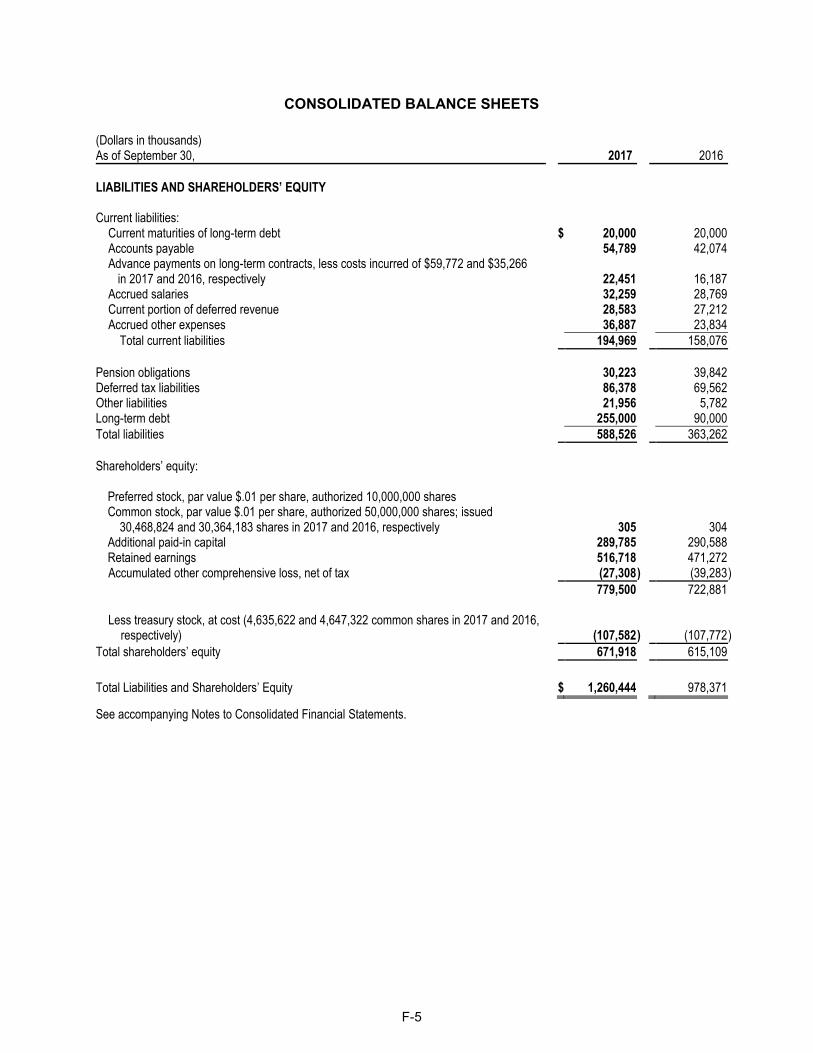
F-5
CONSOLIDATED BALANCE SHEETS
(Dollars in thousands) As of September 30, 2017 2016
LIABILITIES AND SHAREHOLDERS’ EQUITY Current liabilities:
Current maturities of long-term debt $ 20,000 20,000 Accounts payable 54,789 42,074 Advance payments on long-term contracts, less costs incurred of $59,772 and $35,266
in 2017 and 2016, respectively 22,451 16,187 Accrued salaries 32,259 28,769 Current portion of deferred revenue 28,583 27,212 Accrued other expenses 36,887 23,834
Total current liabilities 194,969 158,076
Pension obligations 30,223 39,842 Deferred tax liabilities 86,378 69,562 Other liabilities 21,956 5,782 Long-term debt 255,000 90,000
Total liabilities 588,526 363,262
Shareholders’ equity:
Preferred stock, par value $.01 per share, authorized 10,000,000 shares Common stock, par value $.01 per share, authorized 50,000,000 shares; issued
30,468,824 and 30,364,183 shares in 2017 and 2016, respectively 305 304 Additional paid-in capital 289,785 290,588 Retained earnings 516,718 471,272 Accumulated other comprehensive loss, net of tax (27,308 ) (39,283 )
779,500 722,881
Less treasury stock, at cost (4,635,622 and 4,647,322 common shares in 2017 and 2016, respectively) (107,582 ) (107,772 )
Total shareholders’ equity 671,918 615,109
Total Liabilities and Shareholders’ Equity $ 1,260,444 978,371
See accompanying Notes to Consolidated Financial Statements.

F-6
CONSOLIDATED STATEMENTS OF SHAREHOLDERS’ EQUITY
(In thousands)
Common Stock
Additional Paid-In Capital
Retained Earnings
Accumulated Other
Comprehensive Income (Loss)
Treasury Stock Total Shares Amount
Balance, September 30, 2014 30,248 $ 302 285,305 399,451 (19,186 ) (85,701 ) 580,171
Comprehensive income (loss):
Net earnings — — — 42,512 — — 42,512
Translation adjustments, net of tax of $63 — — — — (6,297 ) — (6,297 )
Net unrecognized actuarial loss, net of tax of $3,979 — — — — (6,961 ) — (6,961 )
Forward exchange contract, net of tax of $35 — — — — (94 ) — (94 )
Cash dividends declared
($0.32 per share) — — — (8,331 ) — — (8,331 )
Stock options and stock compensation plans,
net of tax of $300 111 2 1,180 — — 248 1,430
Purchases into treasury — — — — — (18,248 ) (18,248 )
Balance, September 30, 2015 30,359 $ 304 286,485 433,632 (32,538 ) (103,701 ) 584,182
Comprehensive income (loss):
Net earnings — — — 45,882 — — 45,882
Translation adjustments, net of tax of $383 — — — — (1,462 ) — (1,462 )
Net unrecognized actuarial loss, net of tax of $3,059 — — — — (5,250 ) — (5,250 )
Forward exchange contract, net of tax of $95 — — — — (33 ) — (33 )
Cash dividends declared
($0.32 per share) — — — (8,242 ) — — (8,242 )
Stock options and stock compensation plans,
net of tax of $18 5 — 4,103 — — 232 4,335
Purchases into treasury — — — — — (4,303 ) (4,303 )
Balance, September 30, 2016 30,364 $ 304 290,588 471,272 (39,283 ) (107,772 ) 615,109
Comprehensive income (loss):
Net earnings — — — 53,703 — — 53,703
Translation adjustments, net of tax of $0 — — — — 6,383 — 6,383
Net unrecognized actuarial gain, net of tax of $(2,938) — — — — 5,573 — 5,573
Forward exchange contracts, net of tax of $(66) — — — — 19 — 19
Cash dividends declared
($0.32 per share) — — — (8,257 ) — — (8,257 )
Stock options and stock compensation plans,
net of tax of $0 105 1 (803 ) — — 190 (612 )
Balance, September 30, 2017 30,469 $ 305 289,785 516,718 (27,308 ) (107,582 ) 671,918
See accompanying Notes to Consolidated Financial Statements.

F-7
CONSOLIDATED STATEMENTS OF CASH FLOWS
(Dollars in thousands) Years ended September 30, 2017 2016 2015
Cash flows from operating activities: Net earnings $ 53,703 45,882 42,512 Adjustments to reconcile net earnings to net cash provided by operating
activities: Net earnings from discontinued operations, net of tax — — (776 ) Depreciation and amortization 32,229 23,568 18,584 Stock compensation expense 5,444 4,704 4,779 Changes in assets and liabilities (17,889 ) 1,746 (745 ) Effect of deferred taxes on tax provision 1,360 (2,993 ) 1,417 Pension contributions (2,677 ) — (650 ) Other (4,830 ) 952 (144 )
Net cash provided by operating activities – continuing operations 67,340 73,859 64,977 Net cash provided by discontinued operations — — 776
Net cash provided by operating activities 67,340 73,859 65,753
Cash flows from investing activities: Acquisition of businesses, net of cash acquired (198,628 ) (82,062 ) (20,500 ) Capital expenditures (29,728 ) (13,843 ) (12,444 ) Additions to capitalized software (9,002 ) (8,665 ) (6,901 )
Proceeds from sale of land 1,184 — — Proceeds from life insurance 2,307 — — Net cash used by investing activities – continuing operations (233,867 ) (104,570 ) (39,845 ) Net cash provided by investing activities – discontinued operations — — —
Net cash used by investing activities (233,867 ) (104,570 ) (39,845 )
Cash flows from financing activities: Proceeds from long-term debt 257,000 140,000 106,000
Principal payments on long-term debt (92,000 ) (80,000 ) (96,000 ) Dividends paid (8,257 ) (8,248 ) (8,369 ) Purchases of shares into treasury — (4,303 ) (18,248 ) Debt issuance costs — (1,097 ) — Other 20 (128 ) (24 )
Net cash provided (used) by financing activities 156,763 46,224 (16,641 )
Effect of exchange rate changes on cash and cash equivalents 1,455 (1,099 ) (4,987 )
Net (decrease) increase in cash and cash equivalents (8,309 ) 14,414 4,280 Cash and cash equivalents at beginning of year 53,825 39,411 35,131
Cash and cash equivalents at end of year $ 45,516 53,825 39,411
Changes in assets and liabilities:
Accounts receivable, net $ (23,587 ) (9,088 ) 3,848 Costs and estimated earnings on long-term contracts, net (18,540 ) (359 ) (589 ) Inventories 3,959 1,101 (5,494 ) Other assets and liabilities 4,928 772 1,420 Accounts payable 8,735 (1,953 ) (2,496 ) Advance payments on long-term contracts, net 6,264 (2,439 ) 3,591 Accrued expenses 5,644 4,042 (7,045 )
Deferred revenue and costs, net 1,650 5,460 1,183 Pension obligations (6,942 ) 4,210 4,837
$ (17,889 ) 1,746 (745 )
Supplemental cash flow information: Interest paid $ 3,731 1,361 876 Income taxes paid (including state & foreign) 25,674 22,631 13,611
See accompanying Notes to Consolidated Financial Statements.

F-8
NOTES TO CONSOLIDATED FINANCIAL STATEMENTS
1. Summary of Significant Accounting Policies
A. Principles of Consolidation
The Consolidated Financial Statements include the accounts of ESCO Technologies Inc. (ESCO) and its wholly
owned subsidiaries (the Company). All significant intercompany transactions and accounts have been eliminated in
consolidation.
B. Basis of Presentation
The Company’s fiscal year ends September 30. Throughout these Consolidated Financial S tatements, unless the
context indicates otherwise, references to a year (for example 2017) refer to the Company’s fiscal year ending on
September 30 of that year. Certain prior period amounts have been reclassified to conform to the current period
presentation.
The Company accounts for shipping and handling costs on a gross basis and they are included in net sales. The
Company accounts for taxes collected from customers and remitted to governmental authorities on a net basis and
they are excluded from net sales.
Aclara is reflected as discontinued operations in the consolidated financial statements and related notes for fiscal
2015, in accordance with accounting principles generally accepted in the United States of America (GAAP).
C. Nature of Operations
The Company is organized based on the products and services it offers, and classifies its business operations in
segments for financial reporting purposes. Under the current organization structure, the Company has four segments
for financial reporting purposes: Filtration/Fluid Flow (Filtration), RF Shielding and Test (Test), Utility Solutions
Group (USG) and Technical Packaging.
Filtration: The companies within this segment primarily design and manufacture specialty filtration products
including hydraulic filter elements and fluid control devices used in commercial aerospace applications, unique filter
mechanisms used in micro-propulsion devices for satellites, custom designed filters for manned aircraft and
submarines, elastomeric-based signature reduction solutions to enhance U.S. Navy maritime survivability, precision-
tolerance machined components for the aerospace and defense industry, and metal processing services.
Test: ETS-Lindgren Inc. provides its customers with the ability to identify, measure and contain magnetic,
electromagnetic and acoustic energy.
USG: The companies within this segment provide high-end, intelligent, diagnostic test and data management
solutions for the electric power delivery industry, and decision support tools for the renewable energy industry,
primarily wind.
Technical Packaging: The companies within this segment provide innovative solutions to the medical and
commercial markets for thermoformed and precision molded pulp fiber packages and specialty products using a wide
variety of thin gauge plastics and pulp.
D. Use of Estimates
The preparation of financial statements in conformity with GAAP requires Management to make estimates and
assumptions that affect the reported amounts of assets and liabilities. Actual results could differ from those estimates.
E. Revenue Recognition
Filtration: Within the Filtration segment, approximately 86% of revenues (approximately 36% of consolidated
revenues) are recognized when products are delivered (when title and risk of ownership transfers) or when services are
performed for unaffiliated customers.
Approximately 14% of the segment’s revenues (approximately 6% of consolidated revenues) are recorded under the
percentage-of-completion method. The majority of these contracts are cost-reimbursable contracts which provide for
the payment of allowable costs incurred during the performance of the contract plus an incentive fee. The remainder
of the contracts are fixed-price contracts. Products accounted for under this guidance include the design, development

F-9
and manufacture of complex fluid control products, quiet valves, manifolds and systems primarily for the aerospace
and military markets. For fixed-price contracts that are accounted for under this guidance, the Company estimates
profit as the difference between total estimated revenue and total estimated cost of a contract and recognizes these
revenues and costs based on units delivered. The percentage-of-completion method of accounting involves the use of
various techniques to estimate expected costs at completion. These estimates are based on Management’s judgment
and the Company’s substantial experience in developing these types of estimates.
Test: Within the Test segment, approximately 30% of revenues (approximately 7% of consolidated revenues) are
recognized when products are delivered (when title and risk of ownership transfers) or when services are performed
for unaffiliated customers.
Approximately 70% of the segment’s revenues (approximately 16% of consolidated revenues) are recorded under the
percentage-of-completion method due to the complex nature of the enclosures that are designed and produced under
these contracts. Products accounted for under this guidance include the construction and installation of complex test
chambers to a buyer’s specifications that provide its customers with the ability to measure and contain magnetic,
electromagnetic and acoustic energy. As discussed above, for arrangements that are accounted for under this guidance,
the Company estimates profit as the difference between total estimated revenue and total estimated cost of a contract
and recognizes these revenues and costs based primarily on contract milestones. The percentage-of-completion
method of accounting involves the use of various techniques to estimate expected costs at completion. These estimates
are based on Management’s judgment and the Company’s substantial experience in developing these types of
estimates.
USG: Within the USG segment, approximately 78% of revenues (approximately 18% of consolidated revenues) are
recognized when products are delivered (when title and risk of ownership transfers), or when services are performed
for unaffiliated customers. Approximately 22% of the segment’s revenues (approximately 5% of consolidated
revenues) are recognized on a straight-line basis over the lease term.
Technical Packaging: Within the Technical Packaging segment, 100% of revenues (approximately 12% of
consolidated revenues) are recognized when products are delivered (when title and risk of ownership transfers) or
when services are performed for unaffiliated customers.
F. Cash and Cash Equivalents
Cash equivalents include temporary investments that are readily convertible into cash, such as money market funds,
with original maturities of three months or less.
G. Accounts Receivable
Accounts receivable have been reduced by an allowance for amounts that the Company estimates are uncollectible in
the future. This estimated allowance is based on Management’s evaluation of the financial condition of the customer
and historical write-off experience.
H. Costs and Estimated Earnings on Long-Term Contracts
Costs and estimated earnings on long-term contracts represent unbilled revenues, including accrued profits, accounted
for under the percentage-of-completion method, net of progress billings.
I. Inventories
Inventories are valued at the lower of cost (first-in, first-out) or market value. Inventories are regularly reviewed for
excess quantities and obsolescence based upon historical experience, specific identification of discontinued items,
future demand, and market conditions. Inventories under long-term contracts reflect accumulated production costs,
factory overhead, initial tooling and other related costs less the portion of such costs charged to cost of sales.
J. Property, Plant and Equipment
Property, plant and equipment are recorded at cost. Depreciation and amortization are computed primarily on a
straight-line basis over the estimated useful lives of the assets: buildings, 10-40 years; machinery and equipment, 3-10
years; and office furniture and equipment, 3-10 years. Leasehold improvements are amortized over the remaining term
of the applicable lease or their estimated useful lives, whichever is shorter. Long-lived tangible assets are reviewed for
impairment whenever events or changes in business circumstances indicate the carrying value of the assets may not be
recoverable. Impairment losses are recognized based on fair value.
F-10
K. Leases
Lease agreements are evaluated to determine whether they are capital or operating leases in accordance with ASC
840, Leases (ASC 840). When any one of the four test criteria in ASC 840 is met, the lease then qualifies as a capital
lease. Capital leases are capitalized at the lower of the net present value of the total amount payable under the leasing
agreement (excluding finance charges) or the fair market value of the leased asset. Capital lease assets are depreciated
on a straight-line basis, over a period consistent with the Company’s normal depreciation policy for tangible fixed
assets. The Company allocates each lease payment between a reduction of the lease obligation and interest expense
using the effective interest method. Rent expense for operating leases, which may include free rent or fixed escalation
amounts in addition to minimum lease payments, is recognized on a straight-line basis over the duration of the lease
term. Capital lease obligations are included within other long-term liabilities (long-term portion) and accrued other
expenses (current portion).
L. Goodwill and Other Long-Lived Assets
Goodwill represents the excess of purchase price over the fair value of net identifiable assets acquired in business
acquisitions. Management annually reviews goodwill and other long-lived assets with indefinite useful lives for
impairment or whenever events or changes in circumstances indicate the carrying amount may not be recoverable. If
the Company determines that the carrying value of the long-lived asset may not be recoverable, a permanent
impairment charge is recorded for the amount by which the carrying value of the long-lived asset exceeds its fair
value. Fair value is measured based on a discounted cash flow method using a discount rate determined by
Management to be commensurate with the risk inherent in the Company’s current business model.
Other intangible assets represent costs allocated to identifiable intangible assets, principally customer relationships,
capitalized software, patents, trademarks, and technology rights. Intangible assets with estimable useful lives are
amortized over their respective estimated useful lives to their estimated residual values, and are reviewed for
impairment whenever events or changes in business circumstances indicate the carrying value of the assets may not be
recoverable. See Note 3 regarding goodwill and other intangible assets activity.
M. Capitalized Software
The costs incurred for the development of computer software that will be sold, leased, or otherwise marketed are
charged to expense when incurred as research and development until technological feasibility has been established for
the product. Technological feasibility is typically established upon completion of a detailed program design. Costs
incurred after this point are capitalized on a project-by-project basis. Capitalized costs consist of internal and external
development costs. Upon general release of the product to customers, the Company ceases capitalization and begins
amortization, which is calculated on a project-by-project basis as the greater of (1) the ratio of current gross revenues
for a product to the total of current and anticipated future gross revenues for the product or (2) the straight-line method
over the estimated economic life of the product. The Company generally amortizes the software development costs
over a three-to-seven year period based upon the estimated future economic life of the product. Factors considered in
determining the estimated future economic life of the product include anticipated future revenues, and changes in
software and hardware technologies. Management annually reviews the carrying values of capitalized costs for
impairment or whenever events or changes in circumstances indicate the carrying amount may not be recoverable. If
expected cash flows are insufficient to recover the carrying amount of the asset, then an impairment loss is recognized
to state the asset at its net realizable value.
N. Income Taxes
Income taxes are accounted for under the asset and liability method. Deferred tax assets and liabilities are recognized
for the future tax consequences attributable to differences between the financial statement carrying amounts of
existing assets and liabilities and their respective tax bases. Deferred tax assets and liabilities are measured using
enacted tax rates expected to apply to taxable income in the years in which those temporary differences are expected
to be recovered or settled. Deferred tax assets may be reduced by a valuation allowance if it is more likely than not
that some portion or all of the deferred tax assets will not be realized. The effect on deferred tax assets and liabilities
of a change in tax rates is recognized in income in the period that includes the enactment date. The Company regularly
reviews its deferred tax assets for recoverability and establishes a valuation allowance when Management believes it
is more likely than not such assets will not be recovered, taking into consideration historical operating results,
expectations of future earnings, tax planning strategies, and the expected timing of the reversals of existing temporary
differences.
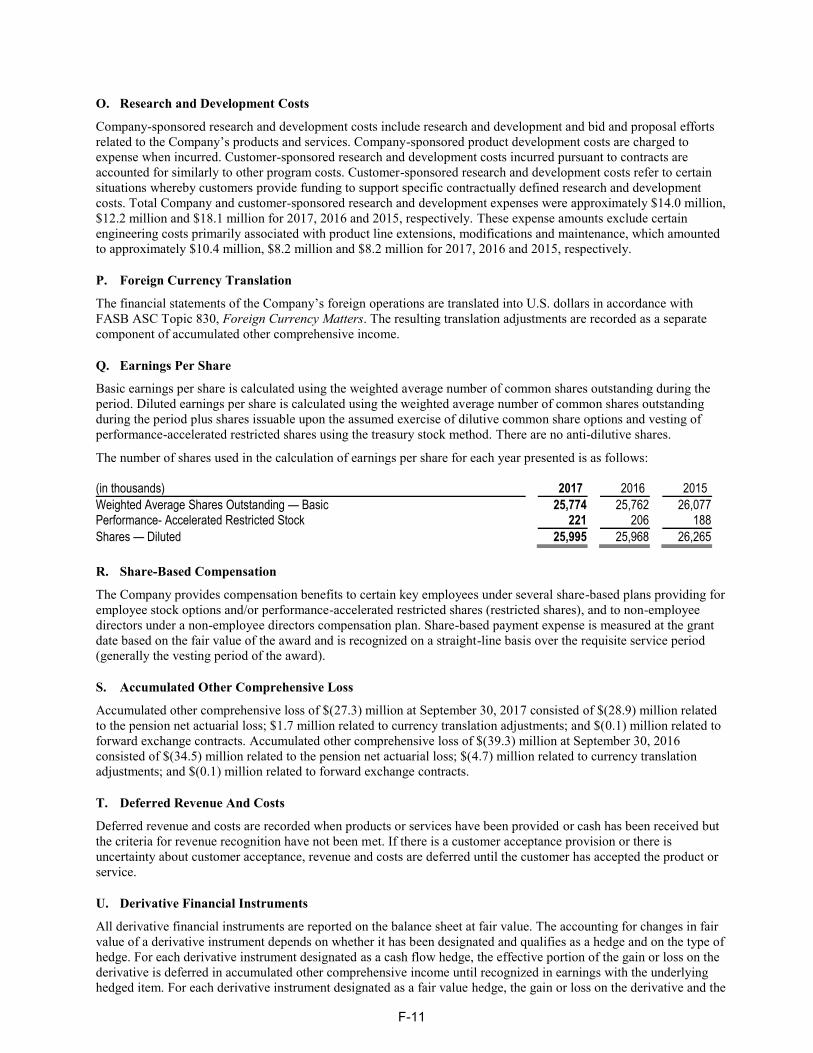
F-11
O. Research and Development Costs
Company-sponsored research and development costs include research and development and bid and proposal efforts
related to the Company’s products and services. Company-sponsored product development costs are charged to
expense when incurred. Customer-sponsored research and development costs incurred pursuant to contracts are
accounted for similarly to other program costs. Customer-sponsored research and development costs refer to certain
situations whereby customers provide funding to support specific contractually defined research and development
costs. Total Company and customer-sponsored research and development expenses were approximately $14.0 million,
$12.2 million and $18.1 million for 2017, 2016 and 2015, respectively. These expense amounts exclude certain
engineering costs primarily associated with product line extensions, modifications and maintenance, which amounted
to approximately $10.4 million, $8.2 million and $8.2 million for 2017, 2016 and 2015, respectively.
P. Foreign Currency Translation
The financial statements of the Company’s foreign operations are translated into U.S. dollars in accordance with
FASB ASC Topic 830, Foreign Currency Matters. The resulting translation adjustments are recorded as a separate
component of accumulated other comprehensive income.
Q. Earnings Per Share
Basic earnings per share is calculated using the weighted average number of common shares outstanding during the
period. Diluted earnings per share is calculated using the weighted average number of common shares outstanding
during the period plus shares issuable upon the assumed exercise of dilutive common share options and vesting of
performance-accelerated restricted shares using the treasury stock method. There are no anti-dilutive shares.
The number of shares used in the calculation of earnings per share for each year presented is as follows:
(in thousands) 2017 2016 2015
Weighted Average Shares Outstanding — Basic 25,774 25,762 26,077 Performance- Accelerated Restricted Stock 221 206 188
Shares — Diluted 25,995 25,968 26,265
R. Share-Based Compensation
The Company provides compensation benefits to certain key employees under several share-based plans providing for
employee stock options and/or performance-accelerated restricted shares (restricted shares), and to non-employee
directors under a non-employee directors compensation plan. Share-based payment expense is measured at the grant
date based on the fair value of the award and is recognized on a straight-line basis over the requisite service period
(generally the vesting period of the award).
S. Accumulated Other Comprehensive Loss
Accumulated other comprehensive loss of $(27.3) million at September 30, 2017 consisted of $(28.9) million related
to the pension net actuarial loss; $1.7 million related to currency translation adjustments; and $(0.1) million related to
forward exchange contracts. Accumulated other comprehensive loss of $(39.3) million at September 30, 2016
consisted of $(34.5) million related to the pension net actuarial loss; $(4.7) million related to currency translation
adjustments; and $(0.1) million related to forward exchange contracts.
T. Deferred Revenue And Costs
Deferred revenue and costs are recorded when products or services have been provided or cash has been received but
the criteria for revenue recognition have not been met. If there is a customer acceptance provision or there is
uncertainty about customer acceptance, revenue and costs are deferred until the customer has accepted the product or
service.
U. Derivative Financial Instruments
All derivative financial instruments are reported on the balance sheet at fair value. The accounting for changes in fair
value of a derivative instrument depends on whether it has been designated and qualifies as a hedge and on the type of
hedge. For each derivative instrument designated as a cash flow hedge, the effective portion of the gain or loss on the
derivative is deferred in accumulated other comprehensive income until recognized in earnings with the underlying
hedged item. For each derivative instrument designated as a fair value hedge, the gain or loss on the derivative and the

F-12
offsetting gain or loss on the hedged item are recognized immediately in earnings. Regardless of type, a fully effective
hedge will result in no net earnings impact while the derivative is outstanding. To the extent that any hedge is
ineffective at offsetting cash flow or fair value changes in the underlying hedged item, there could be a net earnings
impact.
V. Fair Value Measurements
Fair value is defined as the price at which an asset could be exchanged in a current transaction between
knowledgeable, willing parties or the amount that would be paid to transfer a liability to a new obligor, not the
amount that would be paid to settle the liability with the creditor. Where available, fair value is based on observable
market prices or parameters or derived from such prices or parameters. Where observable prices or inputs are not
available, valuation models are applied. These valuation techniques involve some level of Management estimation
and judgment, the degree of which is dependent on the price transparency for the instruments or market and the
instruments’ complexity.
The accounting guidance establishes a three-level hierarchy for disclosure of fair value measurements, based upon the
transparency of inputs to the valuation of an asset or liability as of the measurement date, as follows:
Level 1 – Inputs to the valuation methodology are quoted prices (unadjusted) for identical assets or liabilities in
active markets.
Level 2 –Inputs to the valuation methodology include quoted prices for similar assets and liabilities in active
markets, and inputs that are observable for the asset or liability, either directly or indirectly, for substantially the
full term of the financial instrument.
Level 3 – Inputs to the valuation methodology are unobservable and significant to the fair value measurement.
Financial Assets and Liabilities
The Company has estimated the fair value of its financial instruments as of September 30, 2017 using available
market information or other appropriate valuation methodologies. The carrying amounts of cash and cash
equivalents, receivables, inventories, payables and other current assets and liabilities approximate fair value because
of the short maturity of those instruments. The carrying amounts due under the revolving credit facility approximate
fair value as the interest on outstanding borrowings is calculated at a spread over the London Interbank Offered Rate
(LIBOR) or based on the prime rate, at the Company’s election.
Nonfinancial Assets and Liabilities
The Company’s nonfinancial assets such as property, plant and equipment, and other intangible assets are not
measured at fair value on a recurring basis; however they are subject to fair value adjustments in certain
circumstances, such as when there is evidence that an impairment may exist. No impairments were recorded during
2017.
W. New Accounting Standards
In January 2017, the FASB issued Accounting Standards Update (ASU) No. 2017-04, Simplifying the Test for
Goodwill Impairment (ASU 2017-04), which eliminates Step 2 from the goodwill impairment test. Under the
amendments in this update, an entity should recognize an impairment charge for the amount by which the carrying
amount exceeds the reporting unit’s fair value; however, the loss recognized should not exceed the total amount of
goodwill allocated to that reporting unit. The new standard is effective for fiscal years beginning after December 15,
2019. Early adoption is permitted for interim or annual goodwill impairment test performed on testing dates after
January 1, 2017. The Company adopted this standard in the fourth quarter of 2017 with its annual goodwill
impairment tests. The adoption of ASU 2017-04 did not have an impact on the Company’s consolidated financial
statements.
In March 2016, the FASB issued ASU No. 2016-09, Improvements to Employee Share-Based Payment Accounting,
which simplified the income tax consequences, accounting for forfeitures and classification on the Statements of
Consolidated Cash Flows. The Company adopted this standard in the current year resulting in the income tax
expense in the third quarter and fiscal year 2017 being favorably impacted by additional tax benefits on share-based
compensation that vested during the third quarter of 2017 decreasing the effective tax rate by 5.1% and 1.1%,
respectively.
F-13
In February 2016, the FASB issued ASU No. 2016-062, Leases (Topic 842), which, among other things, requires an
entity to recognize lease assets and lease liabilities on the balance sheet and disclose key information about leasing
arrangements. This new standard will increase an entity’s reported assets and liabilities. The new standard is
effective for fiscal years beginning after December 15, 2018 and mandates a modified retrospective transition period
for all entities. The Company is currently assessing the impact of this new standard on its consolidated financial
statements and related disclosures.
In November 2015, the FASB issued ASU No. 2015-17, Balance Sheet Classification of Deferred Taxes, which
requires entities to present deferred tax assets and deferred tax liabilities as noncurrent in a classified balance sheet.
This new standard is effective for annual periods beginning after December 15, 2016. The Company adopted this
standard during the fourth quarter of 2016 and applied it on a prospective basis.
In May 2014, the FASB issued ASU No. 2014-09, Revenue from Contracts with Customers, which requires an entity
to recognize the amount of revenue to which it expects to be entitled for the transfer of promised goods or services to
customers. this guidance has been further clarified and amended. The new standard will be effective for annual
reporting periods beginning after December 15, 2017, and interim periods within those annual periods. The standard
permits the use of either the retrospective or cumulative effect transition method. The Company is currently in the
process of calculating the effect that ASU 2014-09 will have on its consolidated financial statements and related
disclosures. The Company has selected the Cumulative Effect method of transition to the new standard.
2. Acquisitions
2017
On August 30, 2017, the Company acquired the assets of Vanguard Instruments Company (Vanguard Instruments), a
test equipment provider serving the global electric utility market, located in Ontario, California, for a purchase price
of $36.0 million in cash. Vanguard Instruments has annualized sales of approximately $14 million. Since the date of
acquisition, the operating results for Vanguard Instruments have been included as a product line of Doble within the
Company’s USG segment. Based on the preliminary purchase price allocation, the Company recorded approximately
$1.8 million of accounts receivable, $2.1 million of inventory, $0.3 million of property, plant and equipment,
$0.2 million of accounts payable and accrued expenses, $10.7 million of goodwill, $3.2 million of tradenames and
$18.0 million of amortizable intangible assets consisting of customer relationships with a weighted average life of
15 years.
On May 25, 2017, the Company acquired the assets of Morgan Schaffer Inc. (Morgan Schaffer), a global utilities
provider located in Montreal, Quebec, Canada, for a purchase price of $48.8 million in cash. Morgan Schaffer has
annualized sales of approximately $25 million. It designs, develops, manufactures and markets an integrated offering
of dissolved gas analysis, oil testing, and data management solutions which enhance the ability of electric utilities to
accurately monitor the health of critical power transformers. Since the date of acquisition, the operating results for
Morgan Schaffer have been included in the Company’s USG segment. Based on the preliminary purchase price
allocation, the Company recorded approximately $2.5 million of accounts receivable, $5.2 million of inventory, $1.7
million of property, plant and equipment, $0.4 million of other assets, $4.9 million of accounts payable and accrued
expenses, $4.8 million of goodwill, $35.6 million of trade names and $3.6 million of amortizable intangible assets
consisting of customer relationships and developed technology with a weighted average life of approximately 10
years.
On May 8, 2017, the Company acquired NRG Systems, Inc. (NRG), located in Hinesburg, Vermont, for a purchase
price of $38.6 million in cash. NRG is the global market leader in the design and manufacture of decision support
tools for the renewable energy industry, primarily wind. NRG has annualized sales of approximately $45 million.
Since the date of acquisition, the operating results for NRG have been included in the Company’s USG segment.
Based on the preliminary purchase price allocation, the Company recorded approximately $1.5 million of cash, $4.1
million of accounts receivable, $5.1 million of inventory, $1.0 million of other assets, $9.4 million of property, plant
and equipment (including a capital lease), $4.1 million of accounts payable and accrued expenses, $9.7 million of
lease liability, $8.0 million of goodwill, $8.1 million of trade names and $17.2 million of amortizable intangible assets
consisting of customer relationships with a weighted average life of approximately 14 years.
On November 7, 2016, the Company acquired aerospace suppliers Mayday Manufacturing Co. (Mayday) and its
affiliate, Hi-Tech Metals, Inc. (Hi-Tech), which share a state-of-the-art, expandable 130,000 square foot facility in
Denton, Texas, for a purchase price of approximately $75 million in cash. Mayday is a leading manufacturer of
mission-critical bushings, pins, sleeves and precision-tolerance machined components for landing gear, rotor heads,
engine mounts, flight controls and actuation systems for the aerospace and defense industry. Hi-Tech is a full-service

F-14
metal processor offering aerospace OEM’s and Tier 1 suppliers a large portfolio of processing services including
anodizing, cadmium and zinc-nickel plating, organic coatings, non-destructive testing and heat treatment. Mayday and
Hi-Tech together have annual sales of approximately $40 million. Since the date of acquisition, the consolidated
operating results for Mayday and Hi-Tech have been included in the Company’s Filtration segment. Based on the
purchase price allocation, the Company recorded approximately $7.3 million of accounts receivable, $10.6 million of
inventory, $16.6 million of property, plant and equipment (including a capital lease), $10.1 million of lease liability,
$15.6 million of deferred tax liabilities, $30.2 million of goodwill, $4.8 million of trade names and $32.8 million of
amortizable identifiable intangible assets consisting primarily of customer relationships with a weighted-average life
of approximately 20 years.
2016
On September 2, 2016, the Company acquired the stock of Westland Technologies, Inc. (Westland), located in
Modesto, California, for a purchase price of approximately $41 million in cash. Westland is a market leader in the
design, development and manufacture of elastomeric-based signature reduction solutions which enhance U.S. Naval
maritime platform survivability. Westland has annual sales of approximately $25 million. Since the date of
acquisition, the operating results for Westland have been included within the Company’s Filtration segment. Based on
the purchase price allocation, the Company recorded tangible assets, net, of $5.5 million, deferred tax liabilities of
$9.5 million, goodwill of $17.9 million, and $28.3 million of identifiable intangible assets primarily consisting of
customer relationships.
On January 29, 2016, the Company acquired Plastique Limited and Plastique Sp. z o.o. (together, Plastique),
headquartered in Tunbridge Wells, England with manufacturing locations in Nottingham, England and Poznan,
Poland, for a purchase price of approximately $31.6 million (of which $2.7 million is due over the next two years, one
payment in January 2018 and one in January 2019). Plastique is a market leader in the development and manufacture
of highly-technical thermoformed plastic and precision molded pulp fiber packaging primarily serving
pharmaceutical, personal care, and various specialty end markets. Since the date of acquisition, the operating results
for Plastique have been included within the Company’s Technical Packaging segment. Plastique has annual sales of
approximately $35 million. Based on the purchase price allocation, the Company recorded tangible assets, net, of $9.6
million, goodwill of $10.2 million, and $11.9 million of identifiable intangible assets primarily consisting of customer
relationships.
On October 16, 2015, the Company acquired the stock of Fremont Plastics, Inc. (Fremont) for a purchase price of
$10.5 million in cash. The Company also purchased for $2 million Fremont’s real property located in Fremont,
Indiana. Fremont was a developer, manufacturer, promoter and seller of high quality sterile-ready and non-sterile thin
gauge thermoformed medical plastic packaging products. Immediately following the closing of the transaction,
Fremont was merged into TEQ, and therefore since the date of acquisition the operating results for Fremont have been
included as part of TEQ.
2015
On January 28, 2015, the Company acquired the assets of Enoserv LLC (Enoserv), headquartered in Tulsa, Oklahoma,
for $20.5 million in cash. Enoserv provides utility customers with high quality, user-friendly multi-platform software
and has annual revenues of approximately $8 million. Since the date of acquisition the operating results for Enoserv
have been included as part of Doble within the Company’s USG segment. Based on the purchase price allocation, the
Company recorded approximately $10.0 million of goodwill and $9.0 million of amortizable identifiable intangible
assets consisting primarily of customer relationships and developed technology.
All of the Company’s acquisitions have been accounted for using the purchase method of accounting and accordingly,
the respective purchase prices were allocated to the assets (including intangible assets) acquired and liabilities
assumed based on estimated fair values at the date of acquisition. The financial results from these acquisitions have
been included in the Company’s financial statements from the date of acquisition.
Unaudited pro forma sales and earnings before tax were $746.0 million and $84.5 million, respectively, for 2017, and
$695.0 million and $76.2 million, respectively, for 2016. These pro forma amounts reflect consolidated results of
operations as if the 2017 acquisitions of Vanguard Instruments, Morgan Schaffer, NRG and Mayday had occurred on
October 1, 2015. The pro forma financial information was prepared based on historical financial information and has
been adjusted to give effect to pro forma adjustments that are (i) directly attributable to the above acquisitions, (ii)
factually supportable and (iii) expected to have a continuing impact on the combined results. The pro forma
information uses estimates and assumptions based on information available at the time. Management believes the
estimates and assumptions to be reasonable; however, actual results may differ significantly from this pro forma
information. The pro forma information is not intended to reflect the actual results that would have occurred had the
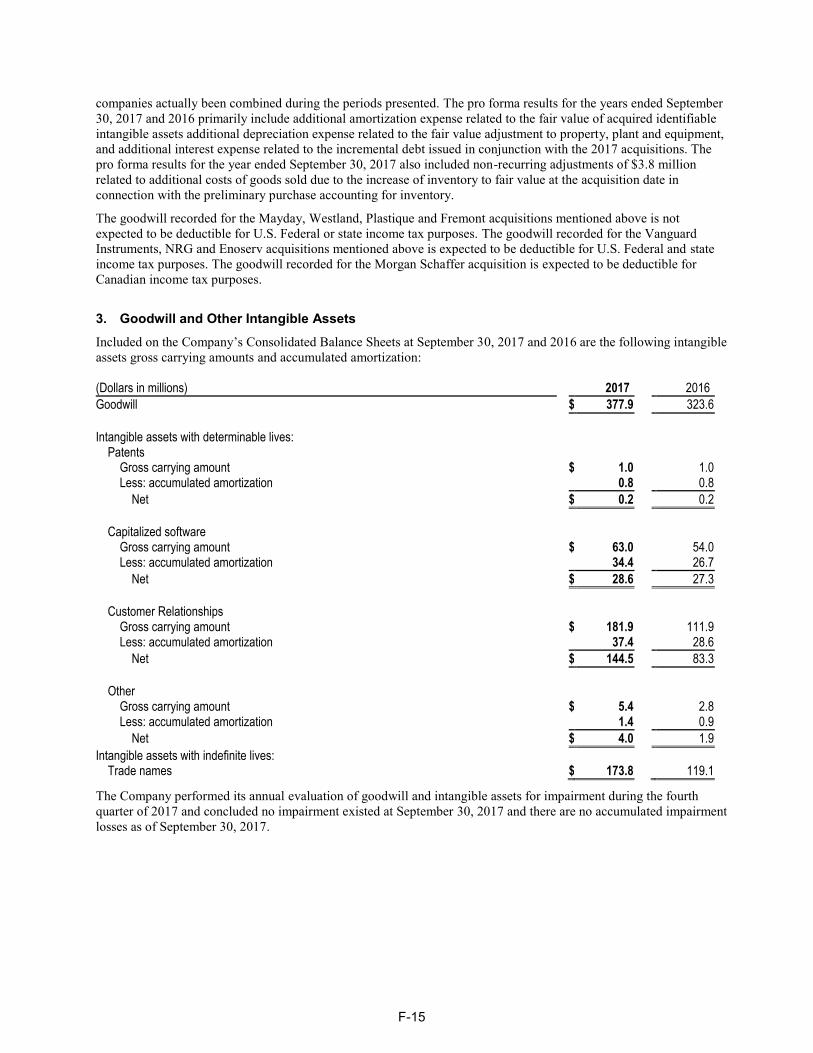
F-15
companies actually been combined during the periods presented. The pro forma results for the years ended September
30, 2017 and 2016 primarily include additional amortization expense related to the fair value of acquired identifiable
intangible assets additional depreciation expense related to the fair value adjustment to property, plant and equipment,
and additional interest expense related to the incremental debt issued in conjunction with the 2017 acquisitions. The
pro forma results for the year ended September 30, 2017 also included non-recurring adjustments of $3.8 million
related to additional costs of goods sold due to the increase of inventory to fair value at the acquisition date in
connection with the preliminary purchase accounting for inventory.
The goodwill recorded for the Mayday, Westland, Plastique and Fremont acquisitions mentioned above is not
expected to be deductible for U.S. Federal or state income tax purposes. The goodwill recorded for the Vanguard
Instruments, NRG and Enoserv acquisitions mentioned above is expected to be deductible for U.S. Federal and state
income tax purposes. The goodwill recorded for the Morgan Schaffer acquisition is expected to be deductible for
Canadian income tax purposes.
3. Goodwill and Other Intangible Assets
Included on the Company’s Consolidated Balance Sheets at September 30, 2017 and 2016 are the following intangible
assets gross carrying amounts and accumulated amortization:
(Dollars in millions) 2017 2016
Goodwill $ 377.9 323.6
Intangible assets with determinable lives:
Patents Gross carrying amount $ 1.0 1.0 Less: accumulated amortization 0.8 0.8
Net $ 0.2 0.2
Capitalized software
Gross carrying amount $ 63.0 54.0 Less: accumulated amortization 34.4 26.7
Net $ 28.6 27.3
Customer Relationships
Gross carrying amount $ 181.9 111.9 Less: accumulated amortization 37.4 28.6
Net $ 144.5 83.3
Other
Gross carrying amount $ 5.4 2.8 Less: accumulated amortization 1.4 0.9
Net $ 4.0 1.9
Intangible assets with indefinite lives: Trade names $ 173.8 119.1
The Company performed its annual evaluation of goodwill and intangible assets for impairment during the fourth
quarter of 2017 and concluded no impairment existed at September 30, 2017 and there are no accumulated impairment
losses as of September 30, 2017.

F-16
The changes in the carrying amount of goodwill attributable to each business segment for 2017 and 2016 are as
follows:
(Dollars in millions) Filtration Test USG Technical
Packaging
Total
Balance as of September 30, 2015 $ 26.0 34.2 226.2 4.8 291.2 Acquisition activity 17.9 – – 14.5 32.4 Foreign currency translation and other – (0.1 ) – 0.1 –
Balance as of September 30, 2016 43.9 34.1 226.2 19.4 323.6 Acquisition activity 29.8 – 23.6 – 53.4
Foreign currency translation and other – – 0.4 0.5 0.9
Balance as of September 30, 2017 $ 73.7 34.1 250.2 19.9 377.9
Amortization expense related to intangible assets with determinable lives was $16.3 million, $11.6 million and $8.9
million in 2017, 2016 and 2015, respectively. Patents are amortized over the life of the patents, generally 17 years.
Capitalized software is amortized over the estimated useful life of the software, generally three to seven years.
Customer relationships are generally amortized over fifteen to twenty years. Intangible asset amortization for fiscal
years 2018 through 2022 is estimated at approximately $20 million per year.
4. Accounts Receivable
Accounts receivable, net of the allowance for doubtful accounts, consist of the following at September 30, 2017 and
2016:
(Dollars in thousands) 2017 2016
Commercial $ 152,265 112,280 U.S. Government and prime contractors 8,315 9,206
Total $ 160,580 121,486
5. Inventories
Inventories consist of the following at September 30, 2017 and 2016:
(Dollars in thousands) 2017 2016
Finished goods $ 28,127 20,502 Work in process 43,750 37,922 Raw materials 52,638 47,118
Total $ 124,515 105,542
6. Related Parties
One of the Company’s directors is an officer at a customer of the Company’s subsidiary Doble. Doble sells products,
leases equipment and provides testing services to the customer in the ordinary course of Doble’s business. The total
amount of these sales were approximately $3.6 million, $1.4 million and $0.8 million during fiscal 2017, 2016 and
2015, respectively. All transactions between Doble and the customer are intended to be and have been consistent with
Doble’s normal commercial terms offered to its customers, and the Company’s Board of Directors has determined that
the relationship between the Company and the customer is not material and did not impair either the Company’s or the
director’s independence.
7. Income Tax Expense
Total income tax expense (benefit) for 2017, 2016 and 2015 was allocated to income tax expense as follows:
(Dollars in thousands) 2017 2016 2015
Income tax expense from Continuing Operations $ 26,450 22,538 19,785 Income tax expense from Discontinued Operations – – 390
Total income tax expense $ 26,450 22,538 20,175

F-17
The components of income from continuing operations before income taxes for 2017, 2016 and 2015 consisted of the
following:
(Dollars in thousands) 2017 2016 2015
United States $ 72,353 62,353 56,661 Foreign 7,800 6,067 4,860
Total income before income taxes $ 80,153 68,420 61,521
The principal components of income tax expense (benefit) from continuing operations for 2017, 2016 and 2015
consist of:
(Dollars in thousands) 2017 2016 2015
Federal: Current $ 21,448 19,236 11,906 Deferred 628 (909 ) 5,406
State and local: Current 1,795 1,674 867 Deferred (49 ) (222 ) 16
Foreign: Current 4,450 1,899 1,525 Deferred (1,822 ) 860 65
Total $ 26,450 22,538 19,785
The actual income tax expense (benefit) from continuing operations for 2017, 2016 and 2015 differs from the
expected tax expense for those years (computed by applying the U.S. Federal corporate statutory rate) as follows:
2017 2016 2015
Federal corporate statutory rate 35.0 % 35.0 % 35.0 % State and local, net of Federal benefits 2.4 2.0 1.2 Foreign (0.1 ) (1.0 ) (1.5 ) Research credit (1.1 ) (2.5 ) (1.8 ) Domestic production deduction (2.7 ) (2.8 ) (2.6 ) Change in uncertain tax positions – – (0.2 ) Executive compensation (0.1 ) 0.9 0.9 Valuation allowance (0.3 ) 1.8 1.0 Other, net (0.1 ) (0.5 ) 0.2
Effective income tax rate 33.0 % 32.9 % 32.2 %
The tax effects of temporary differences that give rise to significant portions of the deferred tax assets and liabilities at
September 30, 2017 and 2016 are presented below:
(Dollars in thousands) 2017 2016
Deferred tax assets: Inventories $ 9,639 7,553 Pension and other postretirement benefits 11,345 13,978 Net operating and capital loss carryforwards — domestic 501 372 Net operating loss carryforward — foreign 4,486 4,991 Other compensation-related costs and other cost accruals 12,104 13,678 State credit carryforward 2,098 1,944
Total deferred tax assets 40,173 42,516 Deferred tax liabilities:
Goodwill (4,874 ) (15,528 ) Acquisition assets (91,752 ) (69,934 ) Depreciation, software amortization (24,092 ) (20,285 )
Net deferred tax liabilities before valuation allowance (80,545 ) (63,231 ) Less valuation allowance (4,440 ) (5,711 )
Net deferred tax liabilities $ (84,985 ) (68,942 )
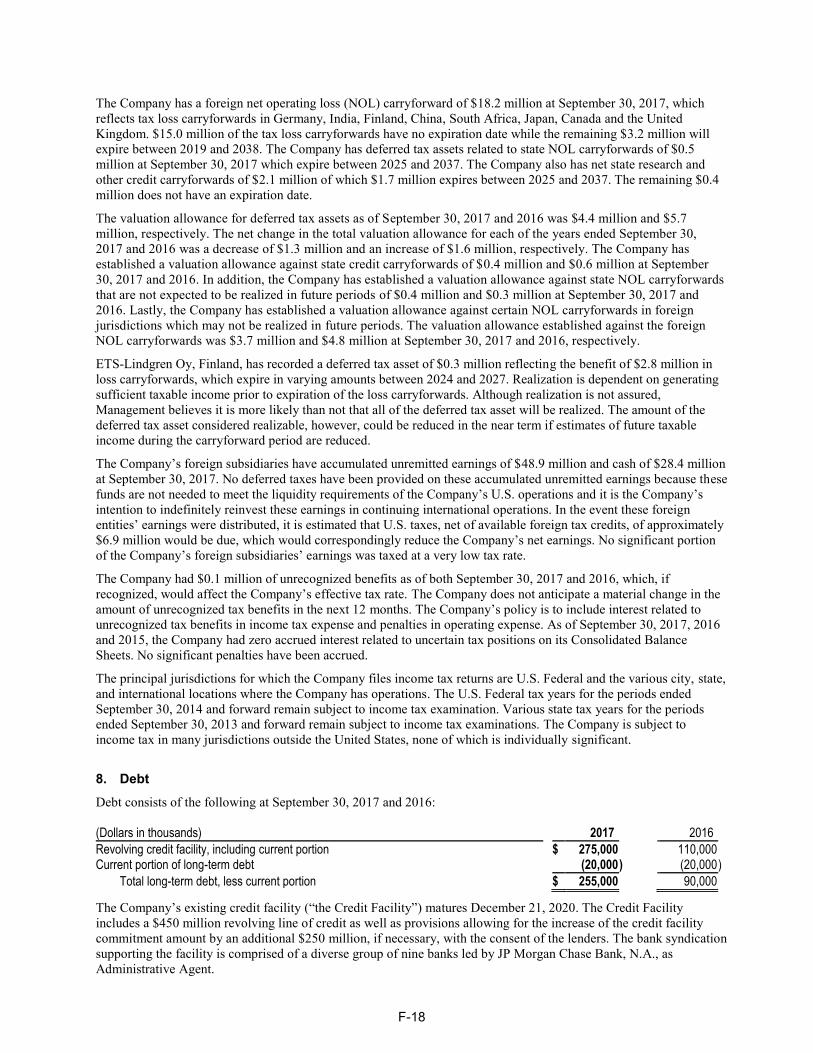
F-18
The Company has a foreign net operating loss (NOL) carryforward of $18.2 million at September 30, 2017, which
reflects tax loss carryforwards in Germany, India, Finland, China, South Africa, Japan, Canada and the United
Kingdom. $15.0 million of the tax loss carryforwards have no expiration date while the remaining $3.2 million will
expire between 2019 and 2038. The Company has deferred tax assets related to state NOL carryforwards of $0.5
million at September 30, 2017 which expire between 2025 and 2037. The Company also has net state research and
other credit carryforwards of $2.1 million of which $1.7 million expires between 2025 and 2037. The remaining $0.4
million does not have an expiration date.
The valuation allowance for deferred tax assets as of September 30, 2017 and 2016 was $4.4 million and $5.7
million, respectively. The net change in the total valuation allowance for each of the years ended September 30,
2017 and 2016 was a decrease of $1.3 million and an increase of $1.6 million, respectively. The Company has
established a valuation allowance against state credit carryforwards of $0.4 million and $0.6 million at September
30, 2017 and 2016. In addition, the Company has established a valuation allowance against state NOL carryforwards
that are not expected to be realized in future periods of $0.4 million and $0.3 million at September 30, 2017 and
2016. Lastly, the Company has established a valuation allowance against certain NOL carryforwards in foreign
jurisdictions which may not be realized in future periods. The valuation allowance established against the foreign
NOL carryforwards was $3.7 million and $4.8 million at September 30, 2017 and 2016, respectively.
ETS-Lindgren Oy, Finland, has recorded a deferred tax asset of $0.3 million reflecting the benefit of $2.8 million in
loss carryforwards, which expire in varying amounts between 2024 and 2027. Realization is dependent on generating
sufficient taxable income prior to expiration of the loss carryforwards. Although realization is not assured,
Management believes it is more likely than not that all of the deferred tax asset will be realized. The amount of the
deferred tax asset considered realizable, however, could be reduced in the near term if estimates of future taxable
income during the carryforward period are reduced.
The Company’s foreign subsidiaries have accumulated unremitted earnings of $48.9 million and cash of $28.4 million
at September 30, 2017. No deferred taxes have been provided on these accumulated unremitted earnings because these
funds are not needed to meet the liquidity requirements of the Company’s U.S. operations and it is the Company’s
intention to indefinitely reinvest these earnings in continuing international operations. In the event these foreign
entities’ earnings were distributed, it is estimated that U.S. taxes, net of available foreign tax credits, of approximately
$6.9 million would be due, which would correspondingly reduce the Company’s net earnings. No significant portion
of the Company’s foreign subsidiaries’ earnings was taxed at a very low tax rate.
The Company had $0.1 million of unrecognized benefits as of both September 30, 2017 and 2016, which, if
recognized, would affect the Company’s effective tax rate. The Company does not anticipate a material change in the
amount of unrecognized tax benefits in the next 12 months. The Company’s policy is to include interest related to
unrecognized tax benefits in income tax expense and penalties in operating expense. As of September 30, 2017, 2016
and 2015, the Company had zero accrued interest related to uncertain tax positions on its Consolidated Balance
Sheets. No significant penalties have been accrued.
The principal jurisdictions for which the Company files income tax returns are U.S. Federal and the various city, state,
and international locations where the Company has operations. The U.S. Federal tax years for the periods ended
September 30, 2014 and forward remain subject to income tax examination. Various state tax years for the periods
ended September 30, 2013 and forward remain subject to income tax examinations. The Company is subject to
income tax in many jurisdictions outside the United States, none of which is individually significant.
8. Debt
Debt consists of the following at September 30, 2017 and 2016:
(Dollars in thousands) 2017 2016
Revolving credit facility, including current portion $ 275,000 110,000 Current portion of long-term debt (20,000 ) (20,000 )
Total long-term debt, less current portion $ 255,000 90,000
The Company’s existing credit facility (“the Credit Facility”) matures December 21, 2020. The Credit Facility
includes a $450 million revolving line of credit as well as provisions allowing for the increase of the credit facility
commitment amount by an additional $250 million, if necessary, with the consent of the lenders. The bank syndication
supporting the facility is comprised of a diverse group of nine banks led by JP Morgan Chase Bank, N.A., as
Administrative Agent.

F-19
At September 30, 2017, the Company had approximately $166 million available to borrow under the Credit Facility,
plus the $250 million increase option, in addition to $45.5 million cash on hand. The Company classified
$20.0 million as the current portion of long-term debt as of September 30, 2017, as the Company intends to repay this
amount within the next twelve months; however, the Company has no contractual obligation to repay such amount
during the next twelve months.
The Credit Facility requires, as determined by certain financial ratios, a facility fee ranging from 12.5 to 27.5 basis
points per annum on the unused portion. The terms of the facility provide that interest on borrowings may be
calculated at a spread over the London Interbank Offered Rate (LIBOR) or based on the prime rate, at the Company’s
election. The facility is secured by the unlimited guaranty of the Company’s material domestic subsidiaries and a 65%
pledge of its material foreign subsidiaries’ share equity. The financial covenants of the Credit Facility include a
leverage ratio and an interest coverage ratio. As of September 30, 2017, the Company was in compliance with all bank
covenants.
During 2017 and 2016, the maximum aggregate short-term borrowings at any month-end were $298 million and $110
million, respectively, and the average aggregate short-term borrowings outstanding based on month-end balances were
$211.3 million and $89.2 million, respectively. The weighted average interest rates were 2.09%, 1.58% and 1.27% for
2017, 2016 and 2015, respectively. The letters of credit issued and outstanding under the Credit Facility totaled $9.7
million and $4.9 million at September 30, 2017 and 2016, respectively.
9. Capital Stock
The 30,468,824 and 30,364,183 common shares as presented in the accompanying Consolidated Balance Sheets at
September 30, 2017 and 2016 represent the actual number of shares issued at the respective dates. The Company held
4,635,622 and 4,647,322 common shares in treasury at September 30, 2017 and 2016, respectively.
In August 2012, the Company’s Board of Directors authorized a common stock repurchase program under which the
Company may repurchase shares of its stock from time to time in its discretion, in the open market or otherwise, up to
a maximum total repurchase amount of $100 million (or such lesser amount as may be permitted under the
Company’s bank credit agreements). This program has been repeatedly extended by the Company’s Board of
Directors and is currently scheduled to expire September 30, 2019. There were no share repurchases in 2017. The
Company repurchased approximately 120,000 shares for $4.3 million in 2016 and 517,000 shares for $18.2 million in
2015.
10. Share-Based Compensation
The Company provides compensation benefits to certain key employees under several share-based plans providing for
performance-accelerated restricted share unit (PARS) awards, and to non-employee directors under a non-employee
directors compensation plan. The Company has no stock options currently outstanding. As of September 30, 2017, the
Company had 1,072,401 shares available for future issuance under equity compensation plans.
Performance-Accelerated Restricted Share Unit Awards
A PARS award represents the right to receive a specified number of shares of Company common stock if and when
the award vests. A PARS award is not stock and does not give the recipient any rights as a shareholder until it vests
and is paid out in shares of stock. PARS awards currently outstanding have a five-year vesting period, with
accelerated vesting if certain targets based on market conditions are achieved. In these cases, if it is probable that the
performance condition will be met, the Company recognizes compensation cost on a straight-line basis over the
shorter performance period; otherwise, it will recognize compensation cost over the longer service period.
Compensation cost for the majority of the outstanding PARS awards is being recognized over the shorter performance
period as it is probable the performance condition will be met. The PARS award grants were valued at the stock price
on the date of grant. Pretax compensation expense related to the PARS awards for continuing operations was $4.4
million, $3.9 million and $4.0 million for 2017, 2016 and 2015, respectively.
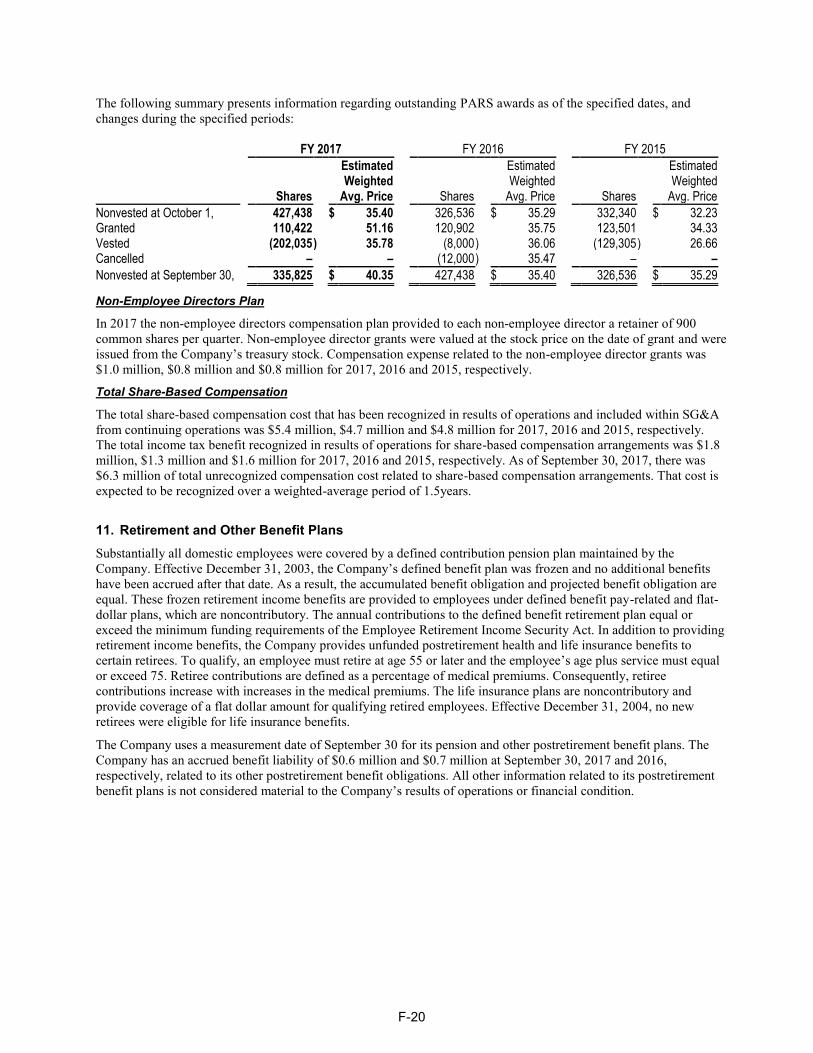
F-20
The following summary presents information regarding outstanding PARS awards as of the specified dates, and
changes during the specified periods:
FY 2017 FY 2016 FY 2015
Shares
Estimated Weighted
Avg. Price Shares
Estimated Weighted
Avg. Price Shares
Estimated Weighted
Avg. Price
Nonvested at October 1, 427,438 $ 35.40 326,536 $ 35.29 332,340 $ 32.23 Granted 110,422 51.16 120,902 35.75 123,501 34.33 Vested (202,035 ) 35.78 (8,000 ) 36.06 (129,305 ) 26.66 Cancelled – – (12,000 ) 35.47 – –
Nonvested at September 30, 335,825 $ 40.35 427,438 $ 35.40 326,536 $ 35.29
Non-Employee Directors Plan
In 2017 the non-employee directors compensation plan provided to each non-employee director a retainer of 900
common shares per quarter. Non-employee director grants were valued at the stock price on the date of grant and were
issued from the Company’s treasury stock. Compensation expense related to the non-employee director grants was
$1.0 million, $0.8 million and $0.8 million for 2017, 2016 and 2015, respectively.
Total Share-Based Compensation
The total share-based compensation cost that has been recognized in results of operations and included within SG&A
from continuing operations was $5.4 million, $4.7 million and $4.8 million for 2017, 2016 and 2015, respectively.
The total income tax benefit recognized in results of operations for share-based compensation arrangements was $1.8
million, $1.3 million and $1.6 million for 2017, 2016 and 2015, respectively. As of September 30, 2017, there was
$6.3 million of total unrecognized compensation cost related to share-based compensation arrangements. That cost is
expected to be recognized over a weighted-average period of 1.5years.
11. Retirement and Other Benefit Plans
Substantially all domestic employees were covered by a defined contribution pension plan maintained by the
Company. Effective December 31, 2003, the Company’s defined benefit plan was frozen and no additional benefits
have been accrued after that date. As a result, the accumulated benefit obligation and projected benefit obligation are
equal. These frozen retirement income benefits are provided to employees under defined benefit pay-related and flat-
dollar plans, which are noncontributory. The annual contributions to the defined benefit retirement plan equal or
exceed the minimum funding requirements of the Employee Retirement Income Security Act. In addition to providing
retirement income benefits, the Company provides unfunded postretirement health and life insurance benefits to
certain retirees. To qualify, an employee must retire at age 55 or later and the employee’s age plus service must equal
or exceed 75. Retiree contributions are defined as a percentage of medical premiums. Consequently, retiree
contributions increase with increases in the medical premiums. The life insurance plans are noncontributory and
provide coverage of a flat dollar amount for qualifying retired employees. Effective December 31, 2004, no new
retirees were eligible for life insurance benefits.
The Company uses a measurement date of September 30 for its pension and other postretirement benefit plans. The
Company has an accrued benefit liability of $0.6 million and $0.7 million at September 30, 2017 and 2016,
respectively, related to its other postretirement benefit obligations. All other information related to its postretirement
benefit plans is not considered material to the Company’s results of operations or financial condition.

F-21
The following tables provide a reconciliation of the changes in the pension plans and fair value of assets over the two-
year period ended September 30, 2017, and a statement of the funded status as of September 30, 2017 and 2016:
(Dollars in millions)
Reconciliation of benefit obligation 2017 2016
Net benefit obligation at beginning of year $ 100.6 93.6 Interest cost 3.2 3.9 Actuarial (gain) loss (4.1 ) 11.1 Gross benefits paid (4.4 ) (7.8 )
Settlements – (0.2 )
Net benefit obligation at end of year $ 95.3 100.6
(Dollars in millions)
Reconciliation of fair value of plan assets 2017 2016
Fair value of plan assets at beginning of year $ 60.6 63.0 Actual return on plan assets 5.9 5.1 Employer contributions 2.9 0.5 Gross benefits paid (4.4 ) (7.8 ) Settlements – (0.2 )
Fair value of plan assets at end of year $ 65.0 60.6
(Dollars in millions)
Funded Status 2017 2016
Funded status at end of year $ (30.3 ) (40.0 ) Accrued benefit cost (30.3 ) (40.0 )
Amounts recognized in the Balance Sheet consist of: Current liability (0.2 ) (0.2 ) Noncurrent liability (30.1 ) (39.8 ) Accumulated other comprehensive (income)/loss (before tax effect) 47.4 56.0
Amounts recognized in accumulated other comprehensive (income)/loss consist of: Net actuarial loss 47.4 56.0
Accumulated other comprehensive (income)/loss (before tax effect) $ 47.4 56.0
The estimated amount that will be amortized from accumulated other comprehensive (income) loss into net periodic
benefit cost (income) in 2018 is $2.3 million.
The following table provides the components of net periodic benefit cost for the plans for 2017, 2016 and 2015:
(Dollars in millions) 2017 2016 2015
Service cost $ – – – Interest cost 3.2 3.9 3.8 Expected return on plan assets (3.9 ) (4.4 ) (4.5 ) Net actuarial loss 2.6 2.0 1.8
Net periodic benefit cost 1.9 1.5 1.1 Defined contribution plans 6.3 5.2 5.0
Total $ 8.2 6.7 6.1
The discount rate used in measuring the Company’s pension obligations was developed by matching yields of actual
high-quality corporate bonds to expected future pension plan cash flows (benefit payments). Over 400 Aa-rated, non-
callable bonds with a wide range of maturities were used in the analysis. After using the bond yields to determine the
present value of the plan cash flows, a single representative rate that resulted in the same present value was developed.
The expected long-term rate of return on plan assets assumption was determined by reviewing the actual investment
return of the plans since inception and evaluating those returns in relation to expectations of various investment
organizations to determine whether long-term future returns are expected to differ significantly from the past.

F-22
The following weighted-average assumptions were used to determine the net periodic benefit cost for the pension
plans:
2017 2016 2015
Discount rate 3.25 % 4.25 % 4.25 % Rate of increase in compensation levels N/A N/A N/A Expected long-term rate of return on assets 3.25 % 6.75 % 6.75 %
The following weighted-average assumptions were used to determine the net periodic benefit obligations for the
pension plans:
2017 2016
Discount rate 3.65 % 3.25 % Rate of increase in compensation levels N/A N/A
The assumed rate of increase in compensation levels is not applicable in 2017, 2016 and 2015 as the plan was frozen
in earlier years.
The asset allocation for the Company’s pension plans at the end of 2017 and 2016, and the Company’s acceptable
range and the target allocation for 2018, by asset category, are as follows:
Asset Category
Target Allocation
2018 Acceptable
Range
Percentage of Plan Assets at Year-end
2017 2016
Return seeking 60% 55-65% 62% 59% Liability hedging 40% 35-45% 35% 38% Cash/cash equivalents – 0-5% 3% 3%
The Company’s pension plan assets are managed by outside investment managers and assets are rebalanced when the
target ranges are exceeded. Pension plan assets consist principally of funds which invest in marketable securities
including common stocks, bonds, and interest-bearing deposits. The Company’s investment strategy with respect to
pension assets is to achieve a total rate of return (income and capital appreciation) that is sufficient to accomplish the
purpose of providing retirement benefits to all eligible and future retirees of the pension plan. The Company regularly
monitors performance and compliance with investment guidelines.
Fair Value of Financial Measurements
The fair values of the Company’s defined benefit plan investments as of September 30, 2017 and 2016, by asset
category, were as follows:
(Dollars in millions) 2017 2016
Investments at fair value: Cash and cash equivalents $ 1.9 1.6 Common and preferred stock funds:
Domestic large capitalization 10.6 8.9 Domestic small-/mid-capitalization 3.3 2.7 International funds 14.3 12.3
Fixed income funds 30.7 30.6 Real estate investment funds 4.2 4.5
Total investments at fair value $ 65.0 60.6
The following methods were used to estimate the fair value of each class of financial instrument:
Cash and cash equivalents: The carrying value of cash represents fair value as it consists of actual currency.
Investment Funds: The fair value of the investment funds, which offer daily redemptions, is determined based on the
published net asset value of the funds as a practical expedient for fair value.

F-23
Expected Cash Flows
Information about the expected cash flows for the pension and other postretirement benefit plans follows:
(Dollars in millions) Pension Benefits
Other Benefits
Expected Employer Contributions — 2018 $ 3.0 0.1 Expected Benefit Payments: 2018 4.9 0.1 2019 5.1 0.1 2020 5.7 0.1 2021 5.4 0.1 2022 5.6 0.1 2023-2027 $ 29.5 0.3
12. Derivative Financial Instruments
Market risks relating to the Company’s operations result primarily from changes in interest rates and changes in
foreign currency exchange rates. The Company is exposed to market risk related to changes in interest rates and
selectively uses derivative financial instruments, including forward contracts and swaps, to manage these risks.
During 2016, the Company entered into several forward contracts to purchase pounds sterling (GBP) to hedge two
deferred payments due in connection with the acquisition of Plastique. In addition, the Company’s Canadian
subsidiary Morgan Schaffer enters into foreign exchange contracts to manage foreign currency risk as a portion of
their revenue is denominated in U.S. dollars. The Company expects hedging gains or losses to be essentially offset
by losses or gains on the related underlying exposures. The amounts ultimately recognized may differ for open
positions, which remain subject to ongoing market price fluctuations until settlement. For derivative instruments
designated as cash flow hedges, the gain or loss on the derivative is deferred in accumulated other comprehensive
income until recognized in earnings with the underlying hedged item. The fair value of the foreign currency
derivative is classified in accrued expenses on the Company’s Consolidated Balance Sheets. The forward contracts
listed below will be recognized within the next twelve months except for 700 GBP which will be recognized in 2019.
The following is a summary of the notional transaction amounts and fair values for the Company’s outstanding
derivative financial instruments as of September 30, 2017.
(In thousands) Notional Amount
(Currency) Fair Value
(US$)
Forward contracts 1,859 GBP (173 ) Forward contracts 3,250 USD 149 Forward contracts 200 EUR (5 )
Fair value of financial instruments
The Company’s forward contracts are classified within Level 2 of the valuation hierarchy in accordance with FASB
Accounting Standards Codification (ASC) 825, as presented below as of September 30, 2017:
(In thousands) Level 1 Level 2 Level 3 Total
Liabilities: Forward contracts $ – (29) – (29)
Valuation was based on third party evidence of similarly priced derivative instruments. There are no master netting
arrangements with financial parties.

F-24
13. Business Segment Information
The Company is organized based on the products and services it offers, and classifies its business operations in
segments for financial reporting purposes. Currently, the Company has four reporting segments: Filtration/Fluid
Flow (Filtration), RF Shielding and Test (Test), Utility Solutions Group (USG) and Technical Packaging.
The Filtration segment’s operations consist of: PTI Technologies Inc. (PTI), VACCO Industries (VACCO), Crissair,
Inc. (Crissair), Mayday Manufacturing Co. (Mayday), Hi-Tech Metals, Inc. (Hi-Tech) and Westland Technologies,
Inc. (Westland). PTI, VACCO and Crissair design and manufacture specialty filtration products including hydraulic
filter elements and fluid control devices used in commercial aerospace applications, unique filter mechanisms used in
micro-propulsion devices for satellites and custom designed filters for manned aircraft and submarines. Mayday
designs and manufactures mission-critical bushings, pins, sleeves and precision-tolerance machined components for
landing gear, rotor heads, engine mounts, flight controls, and actuation systems for the aerospace and defense
industries. Hi-Tech is a full-service metal processor offering aerospace OEM’s and Tier 1 suppliers, a large portfolio
of processing services including anodizing, cadmium and zinc-nickel plating, organic coatings, non-destructive
testing, and heat treatment. Westland designs, develops and manufactures elastomeric-based signature reduction
solutions for U.S. naval vessels.
The Test segment’s operations consist of ETS-Lindgren Inc. and related subsidiaries (ETS-Lindgren). ETS-Lindgren
is an industry leader in providing its customers with the ability to identify, measure and contain magnetic,
electromagnetic and acoustic energy. ETS-Lindgren also manufactures radio frequency shielding products and
components used by manufacturers of medical equipment, communications systems, electronic products, and shielded
rooms for high-security data processing and secure communication.
The USG segment’s operations consist of Doble Engineering Company and related subsidiaries (Doble), Morgan
Schaffer Ltd. (Morgan Schaffer), and NRG Systems, Inc. (NRG). Doble provides high-end, intelligent diagnostic test
solutions for the electric power delivery industry and is a leading supplier of power factor and partial discharge testing
instruments used to assess the integrity of high-voltage power delivery equipment. Morgan Schaffer provides an
integrated offering of dissolved gas analysis, oil testing, and data management solutions which enhance the ability of
electric utilities to accurately monitor the health of critical power transformers. NRG designs and manufactures
decision support tools for the renewable energy industry, primarily wind.
The Technical Packaging segment’s operations consist of Thermoform Engineered Quality LLC (TEQ) and Plastique.
The companies within this segment provide innovative solutions to the medical and commercial markets for
thermoformed and precision molded pulp fiber packages and specialty products using a wide variety of thin gauge
plastics and pulp.
Accounting policies of the segments are the same as those described in the summary of significant accounting policies
in Note 1 to the Consolidated Financial Statements. The operating units within each reporting segment have been
aggregated because of similar economic characteristics and meet the other aggregation criteria of FASB ASC 280.
The Company evaluates the performance of its operating units based on EBIT, which is defined as earnings before
interest and taxes. EBIT on a consolidated basis is a non-GAAP financial measure; see “Non-GAAP Financial
Measures” in Item 7, “Management’s Discussion and Analysis of Financial Condition and Results of Operations.”
Intersegment sales and transfers are not significant. Segment assets consist primarily of customer receivables,
inventories, capitalized software and fixed assets directly associated with the production processes of the segment.
Segment depreciation and amortization is based upon the direct assets listed above.
Net Sales
(Dollars in millions) Year ended September 30, 2017 2016 2015
Filtration $ 279.5 207.8 196.7 Test 160.9 161.5 177.6 USG 162.4 127.8 123.6
Technical Packaging 82.9 74.4 39.4
Consolidated totals $ 685.7 571.5 537.3
No customer exceeded 10% of sales in 2017 or 2016.

F-25
EBIT
(Dollars in millions) Year ended September 30, 2017 2016 2015
Filtration $ 52.2 45.2 41.7 Test 19.5 13.9 9.5 USG 36.6 31.1 29.6 Technical Packaging 8.5 9.6 4.9 Reconciliation to consolidated totals (Corporate) (32.1 ) (30.1 ) (23.4 )
Consolidated EBIT 84.7 69.7 62.3 Less: interest expense (4.6 ) (1.3 ) (0.8 )
Earnings before income tax $ 80.1 68.4 61.5
Identifiable Assets
(Dollars in millions) Year ended September 30, 2017 2016
Filtration $ 194.2 143.5 Test 132.2 110.9 USG 175.5 85.4 Technical Packaging 47.1 40.9 Corporate – Goodwill 377.9 323.6 Corporate – Other assets 333.5 274.1
Consolidated totals $ 1,260.4 978.4
Corporate assets consist primarily of goodwill, deferred taxes, acquired intangible assets and cash balances.
Capital Expenditures
(Dollars in millions) Year ended September 30, 2017 2016 2015
Filtration $ 10.2 3.3 5.0 Test 4.5 3.3 3.1 USG 7.6 3.3 3.3 Technical Packaging 7.4 3.9 1.0 Corporate – – –
Consolidated totals $ 29.7 13.8 12.4
In addition to the above amounts, the Company incurred expenditures for capitalized software of $9.0 million, $8.7
million and $6.9 million in 2017, 2016 and 2015, respectively.
Depreciation and Amortization
(Dollars in millions) Year ended September 30, 2017 2016 2015
Filtration $ 6.6 4.0 3.8 Test 3.6 3.6 3.1 USG 9.8 8.1 6.2 Technical Packaging 3.5 2.9 1.4 Corporate 8.7 5.0 4.1
Consolidated totals $ 32.2 23.6 18.6
Depreciation expense of property, plant and equipment was $15.9 million, $11.9 million and $9.7 million for 2017,
2016 and 2015, respectively.
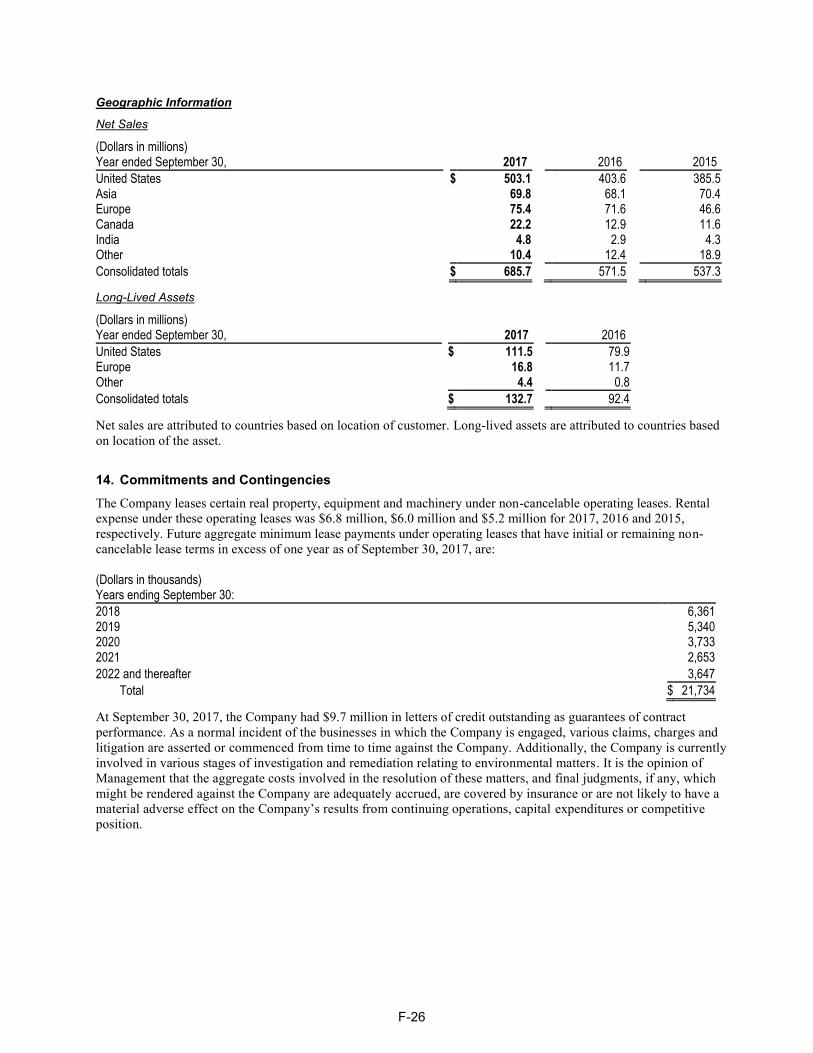
F-26
Geographic Information
Net Sales
(Dollars in millions) Year ended September 30, 2017 2016 2015
United States $ 503.1 403.6 385.5 Asia 69.8 68.1 70.4 Europe 75.4 71.6 46.6 Canada 22.2 12.9 11.6 India 4.8 2.9 4.3 Other 10.4 12.4 18.9
Consolidated totals $ 685.7 571.5 537.3
Long-Lived Assets
(Dollars in millions) Year ended September 30, 2017 2016
United States $ 111.5 79.9 Europe 16.8 11.7 Other 4.4 0.8
Consolidated totals $ 132.7 92.4
Net sales are attributed to countries based on location of customer. Long-lived assets are attributed to countries based
on location of the asset.
14. Commitments and Contingencies
The Company leases certain real property, equipment and machinery under non-cancelable operating leases. Rental
expense under these operating leases was $6.8 million, $6.0 million and $5.2 million for 2017, 2016 and 2015,
respectively. Future aggregate minimum lease payments under operating leases that have initial or remaining non-
cancelable lease terms in excess of one year as of September 30, 2017, are:
(Dollars in thousands) Years ending September 30:
2018 6,361 2019 5,340 2020 3,733 2021 2,653
2022 and thereafter 3,647
Total $ 21,734
At September 30, 2017, the Company had $9.7 million in letters of credit outstanding as guarantees of contract
performance. As a normal incident of the businesses in which the Company is engaged, various claims, charges and
litigation are asserted or commenced from time to time against the Company. Additionally, the Company is currently
involved in various stages of investigation and remediation relating to environmental matters. It is the opinion of
Management that the aggregate costs involved in the resolution of these matters, and final judgments, if any, which
might be rendered against the Company are adequately accrued, are covered by insurance or are not likely to have a
material adverse effect on the Company’s results from continuing operations, capital expenditures or competitive
position.

F-27
15. Capital Leases
The Company leases certain real property, equipment and machinery under capital leases, primarily associated with
the 2017 acquisitions of NRG and Mayday. The facility leases expire in 2029 and the machinery leases expire in 2020.
As of September 30, 2017, the net carrying value and accumulated depreciation of the assets under capital leases
recorded by the Company were $16.1 million and $0.8 million, respectively. Capital lease obligations are included
within other long-term liabilities (long-term portion) and accrued other expenses (current portion). Remaining
payments due on the Company’s capital lease obligations as of September 30, 2017, are:
(Dollars in thousands) Years ending September 30:
2018 $ 1,883 2019 1,922 2020 1,914 2021 1,858
2022 and thereafter 15,977
Total minimum lease payments 23,554
Less: amounts representing interest 4,233
Present value of net minimum lease payments 19,321
Current portion of capital lease obligations 1,370
Non-current portion of capital lease obligations $ 17,951
16. Quarterly Financial Information (Unaudited)
First Second Third Fourth Fiscal (Dollars in thousands, except per share amounts) Quarter Quarter Quarter Quarter Year
2017
Net sales $ 146,368 161,178 171,189 207,005 685,740 Net earnings 10,727 11,157 12,645 19,174 53,703
Basic earnings (loss) per share: Net earnings 0.42 0.43 0.49 0.74 2.08
Diluted earnings (loss) per share: Net earnings 0.41 0.43 0.49 0.74 2.07
Dividends declared per common share $ 0.08 0.08 0.08 0.08 0.32
2016
Net sales $ 132,833 138,930 140,191 159,505 571,459 Net earnings 8,829 8,610 11,528 16,915 45,882
Basic earnings (loss) per share: Net earnings 0.34 0.33 0.45 0.66 1.78
Diluted earnings (loss) per share: Net earnings 0.34 0.33 0.44 0.65 1.77
Dividends declared per common share $ 0.08 0.08 0.08 0.08 0.32

F-28
MANAGEMENT’S STATEMENT OF FINANCIAL RESPONSIBILITY
The Company’s Management is responsible for the fair presentation of the Company’s financial statements in
accordance with accounting principles generally accepted in the United States of America, and for their integrity and
accuracy. Management is confident that its financial and business processes provide accurate information on a timely
basis.
Management, with the oversight of ESCO’s Board of Directors, has established and maintains a strong ethical
climate in which the Company’s affairs are conducted. Management also has established an effective system of
internal controls that provide reasonable assurance as to the integrity and accuracy of the financial statements, and
responsibility for the Company’s assets. KPMG LLP, the Company’s independent registered public accounting firm,
reports directly to the Audit and Finance Committee of the Board of Directors. The Audit and Finance Committee
has established policies consistent with corporate reform laws for auditor independence. In accordance with
corporate governance listing requirements of the New York Stock Exchange:
A majority of Board members are independent of the Company and its Management.
All members of the key Board committees — the Audit and Finance, the Human Resources and
Compensation and the Nominating and Corporate Governance Committees — are independent.
The independent members of the Board meet regularly without the presence of Management.
The Company has a clear code of ethics and a conflict of interest policy to ensure that key corporate
decisions are made by individuals who do not have a financial interest in the outcome, separate from their
interest as Company officials.
The charters of the Board committees clearly establish their respective roles and responsibilities.
The Company has a Corporate Ethics Committee, ethics officers at each operating location and an
ombudsman hot line available to all domestic employees and all foreign employees have local ethics
officers and access to the Company’s ombudsman.
The Company has a strong financial team, from its executive leadership to each of its individual contributors.
Management monitors compliance with its financial policies and practices over critical areas including internal controls,
financial accounting and reporting, accountability, and safeguarding of its corporate assets. The internal audit function
maintains oversight over the key areas of the business and financial processes and controls, and reports directly to the
Audit and Finance Committee. Additionally, all employees are required to adhere to the ESCO Code of Business
Conduct and Ethics, which is monitored by the Corporate Ethics Committee.
Management is dedicated to ensuring that the standards of financial accounting and reporting that are established are
maintained. The Company’s culture demands integrity and a commitment to strong internal practices and policies.
The Consolidated Financial Statements have been audited by KPMG LLP, whose report is included herein.
November 29, 2017
/s/Victor L. Richey /s/Gary E. Muenster
Victor L. Richey Gary E. Muenster
Chairman, Chief Executive Officer Executive Vice President
and President and Chief Financial Officer
F-29
MANAGEMENT’S REPORT ON INTERNAL CONTROL OVER FINANCIAL REPORTING
The Company’s Management is responsible for establishing and maintaining adequate internal control over financial
reporting (as defined in Rule 13a-15(f) under the Securities Exchange Act of 1934). Our internal control over financial
reporting is designed to provide reasonable assurance regarding the reliability of financial reporting and the
preparation of financial statements for external purposes in accordance with generally accepted accounting principles
in the United States of America.
Because of its inherent limitations, any system of internal control over financial reporting, no matter how well
designed, may not prevent or detect misstatements due to the possibility that a control can be circumvented or
overridden or that misstatements due to error or fraud may occur that are not detected. Also, because of changes in
conditions, internal control effectiveness may vary over time.
Management assessed the effectiveness of the Company’s internal control over financial reporting as of September 30,
2017, using criteria established in Internal Control — Integrated Framework (2013) issued by the Committee of
Sponsoring Organizations of the Treadway Commission (COSO) and concluded that the Company maintained
effective internal control over financial reporting as of September 30, 2017, based on these criteria.
Our internal control over financial reporting as of September 30, 2017, has been audited by KPMG LLP, an
independent registered public accounting firm, as stated in its report which is included herein.
We acquired NRG Systems, Inc. (NRG) on May 8, 2017, and the assets of Morgan Schaffer Inc. (Morgan Schaffer)
on May 25, 2017 and Vanguard Instruments Company (Vanguard Instruments) on August 30, 2017. NRG, Morgan
Schaffer and Vanguard Instruments had total assets representing 11.6 percent of consolidated assets, and total sales
representing 3.6 percent of consolidated net sales, as of and for the year ended September 30, 2017. We excluded from
our assessment of the effectiveness of our internal control over financial reporting as of September 30, 2017 internal
control over financial reporting associated with NRG, Morgan Schaffer and Vanguard Instruments.
November 29, 2017
/s/Victor L. Richey /s/Gary E. Muenster
Victor L. Richey Gary E. Muenster
Chairman, Chief Executive Officer Executive Vice President
and President and Chief Financial Officer
F-30
REPORT OF INDEPENDENT REGISTERED PUBLIC ACCOUNTING FIRM
The Board of Directors and Shareholders
ESCO Technologies Inc.:
We have audited ESCO Technologies Inc.’s (the Company) internal control over financial reporting as of September
30, 2017, based on criteria established in Internal Control – Integrated Framework (2013) issued by the Committee of
Sponsoring Organizations of the Treadway Commission (COSO). ESCO Technologies Inc.’s management is
responsible for maintaining effective internal control over financial reporting and for its assessment of the
effectiveness of internal control over financial reporting, included in the accompanying Management’s Report on
Internal Control over Financial Reporting. Our responsibility is to express an opinion on the Company's internal
control over financial reporting based on our audit.
We conducted our audit in accordance with the standards of the Public Company Accounting Oversight Board (United
States). Those standards require that we plan and perform the audit to obtain reasonable assurance about whether
effective internal control over financial reporting was maintained in all material respects. Our audit included obtaining
an understanding of internal control over financial reporting, assessing the risk that a material weakness exists, and
testing and evaluating the design and operating effectiveness of internal control based on the assessed risk. Our audit
also included performing such other procedures as we considered necessary in the circumstances. We believe that our
audit provides a reasonable basis for our opinion.
A company's internal control over financial reporting is a process designed to provide reasonable assurance regarding
the reliability of financial reporting and the preparation of financial statements for external purposes in accordance
with generally accepted accounting principles. A company’s internal control over financial reporting includes those
policies and procedures that (1) pertain to the maintenance of records that, in reasonable detail, accurately and fairly
reflect the transactions and dispositions of the assets of the company; (2) provide reasonable assurance that
transactions are recorded as necessary to permit preparation of financial statements in accordance with generally
accepted accounting principles, and that receipts and expenditures of the company are being made only in accordance
with authorizations of management and directors of the company; and (3) provide reasonable assurance regarding
prevention or timely detection of unauthorized acquisition, use, or disposition of the company’s assets that could have
a material effect on the financial statements.
Because of its inherent limitations, internal control over financial reporting may not prevent or detect misstatements.
Also, projections of any evaluation of effectiveness to future periods are subject to the risk that controls may become
inadequate because of changes in conditions, or that the degree of compliance with the policies or procedures may
deteriorate.
In our opinion, ESCO Technologies Inc. maintained, in all material respects, effective internal control over financial
reporting as of September 30, 2017, based on criteria established in Internal Control – Integrated Framework (2013)
issued by the Committee of Sponsoring Organizations of the Treadway Commission (COSO).
The Company acquired NRG Systems, Inc. (NRG) and the assets of Morgan Schaffer Inc. (Morgan Schaffer), and
Vanguard Instruments Company (Vanguard Instruments) during the year ended September 30, 2017, and management
excluded from its assessment of the effectiveness of the Company’s internal control over financial reporting as of
September 30, 2017, NRG’s, Morgan Schaffer’s, and Vanguard Instruments’ internal control over financial reporting
associated with total assets representing 11.6 percent of consolidated assets, and total sales representing 3.6 percent of
consolidated net sales, included in the consolidated financial statements of ESCO Technologies Inc. and subsidiaries
as of and for the year ended September 30, 2017. Our audit of internal control over financial reporting of the
Company also excluded an evaluation of the internal control over financial reporting of NRG, Morgan Schaffer and
Vanguard Instruments.
We also have audited, in accordance with the standards of the Public Company Accounting Oversight Board (United
States), the consolidated balance sheets of ESCO Technologies Inc. and subsidiaries as of September 30, 2017 and 2016,
and the related consolidated statements of operations, comprehensive income (loss), shareholders’ equity, and cash
flows for each of the years in the three-year period ended September 30, 2017, and our report dated November 29, 2017
expressed an unqualified opinion on those consolidated financial statements.
/s/ KPMG LLP
St. Louis, Missouri
November 29, 2017

EXHIBITS
The following exhibits are submitted with and attached to this Form 10-K; exhibit numbers correspond to the exhibit
table in Item 601 of Regulation S-K. For a complete list of exhibits including those incorporated by reference, see
Item 15(a)(3) of this Form 10-K, above.
Exhibit No. Exhibit
21 Subsidiaries of the Company
23 Consent of Independent Registered Public Accounting Firm
31.1 Certification of Chief Executive Officer
31.2 Certification of Chief Financial Officer
32 * Certification of Chief Executive Officer and Chief Financial Officer
101.INS ** XBRL Instance Document
101.SCH ** XBRL Schema Document
101.CAL ** XBRL Calculation Linkbase Document
101.LAB ** XBRL Label Linkbase Document
101.PRE ** XBRL Presentation Linkbase Document
101.DEF ** XBRL Definition Linkbase Document
-----------
* Furnished (and not filed) herewith pursuant to Item 601(b)(32)(ii) of Regulation S-K.
** Exhibit 101 to this report consists of documents formatted in XBRL (Extensible Business
Reporting Language); a printed copy is not included.

EXHIBIT 21
Subsidiaries of Esco Technologies Inc.
The following list omits certain of the Company’s subsidiaries which, if considered in the aggregate as a single
subsidiary, would not, as of the end of the year covered by this Report, constitute a “significant subsidiary” as defined
in SEC Regulation S-X.
Name
State or Jurisdiction of Incorporation or Organization
Name(s) Under Which It Does Business
Beijing Lindgren ElectronMagnetic Technology Co., Ltd. People’s Republic of China Same; also ETS-Lindgren
Crissair, Inc. California Same
Doble Engineering Company Massachusetts Same
Doble PowerTest Limited United Kingdom Same
ESCO Finance International S.à r.l. Luxembourg Same
ESCO International Holding Inc. Delaware Same
ESCO Technologies Holding LLC Delaware Same
ETS-Lindgren Inc. Illinois Same
ETS-Lindgren OY Finland Same
Hi-Tech Metals, Inc. Texas Same
Mayday Manufacturing Co. Texas Same
Morgan Schaffer Ltd. Quebec, Canada Same
NRG Systems, Inc. Vermont Same
Plastique Limited United Kingdom Same
Plastique Sp. z o.o. Poland Same
PTI Technologies Inc. Delaware Same
Thermoform Engineered Quality LLC Delaware Same
VACCO Industries California Same
Westland Technologies, Inc. California Same

EXHIBIT 23
Consent of Independent Registered Public Accounting Firm
The Board of Directors
ESCO Technologies Inc.:
We consent to the incorporation by reference in the registration statements (Nos. 333-77887, 333-63930, 333-117953,
333-186537, and 333-192663) on Form S-8 of ESCO Technologies Inc. (the Company) of our reports dated
November 29, 2017, with respect to the consolidated balance sheets of ESCO Technologies Inc. and subsidiaries as of
September 30, 2017 and 2016, and the related consolidated statements of operations, comprehensive income (loss),
shareholders’ equity, and cash flows for each of the years in the three-year period ended September 30, 2017, and the
effectiveness of internal control over financial reporting as of September 30, 2017, which reports appear in the
September 30, 2017 annual report on Form 10-K of the Company.
Our report dated November 29, 2017, on the effectiveness of internal control over financial reporting as of September
30, 2017, contains an explanatory paragraph that states the Company acquired NRG Systems, Inc. (NRG) and the
assets of Morgan Schaffer Inc. (Morgan Schaffer), and Vanguard Instruments Company (Vanguard Instruments)
during the year ended September 30, 2017, and management excluded from its assessment of the effectiveness of the
Company’s internal control over financial reporting as of September 30, 2017, NRG’s, Morgan Schaffer’s, and
Vanguard Instruments’ internal control over financial reporting associated with total assets representing 11.6 percent
of consolidated assets, and total net sales representing 3.6 percent of consolidated net sales, included in the
consolidated financial statements of ESCO Technologies Inc. and subsidiaries as of and for the year ended September
30, 2017. Our audit of internal control over financial reporting of the Company also excluded an evaluation of the
internal control over financial reporting of NRG, Morgan Schaffer, and Vanguard Instruments.
/s/ KPMG LLP
St. Louis, Missouri
November 29, 2017

EXHIBIT 31.1
Certification
I, Victor L. Richey, certify that:
1. I have reviewed this annual report on Form 10-K of ESCO Technologies Inc.;
2. Based on my knowledge, this report does not contain any untrue statement of a material fact or omit to state a
material fact necessary to make the statements made, in light of the circumstances under which such
statements were made, not misleading with respect to the period covered by this report;
3. Based on my knowledge, the financial statements, and other financial information included in this report,
fairly present in all material respects the financial condition, results of operations and cash flows of the
registrant as of, and for, the periods presented in this report.
4. The registrant’s other certifying officer and I are responsible for establishing and maintaining disclosure
controls and procedures (as defined in Exchange Act Rules 13a-15(e) and 15d-15(e)) and internal control
over financial reporting (as defined in Exchange Act Rules 13a-15(f) and 15d-15(f)) for the registrant, and
have:
(a) Designed such disclosure controls and procedures, or caused such disclosure controls and procedures to
be designed under our supervision, to ensure that material information relating to the registrant,
including its consolidated subsidiaries, is made known to us by others within those entities, particularly
during the period in which this report is being prepared;
(b) Designed such internal control over financial reporting, or caused such internal control over financial
reporting to be designed under our supervision, to provide reasonable assurance regarding the reliability
of financial reporting and the preparation of financial statements for external purposes in accordance
with generally accepted accounting principles;
(c) Evaluated the effectiveness of the registrant’s disclosure controls and procedures and presented in this
report our conclusions about the effectiveness of the disclosure controls and procedures, as of the end of
the period covered by this report based on such evaluation; and
(d) Disclosed in this report any change in the registrant’s internal control over financial reporting that
occurred during the registrant’s most recent fiscal quarter (the registrant’s fourth fiscal quarter in the
case of an annual report) that has materially affected, or is reasonably likely to materially affect, the
registrant’s internal control over financial reporting; and
5. The registrant’s other certifying officer and I have disclosed, based on our most recent evaluation of internal
control over financial reporting, to the registrant’s auditors and the audit and finance committee of the
registrant’s board of directors (or persons performing the equivalent functions):
(a) All significant deficiencies and material weaknesses in the design or operation of internal control over
financial reporting which are reasonably likely to adversely affect the registrant’s ability to record,
process, summarize and report financial information; and
(b) Any fraud, whether or not material, that involves management or other employees who have a
significant role in the registrant’s internal control over financial reporting.
Date: November 29, 2017
/s/ Victor L. Richey
Victor L. Richey
Chairman, President and Chief Executive Officer

EXHIBIT 31.2
Certification
I, Gary E. Muenster, certify that:
1. I have reviewed this annual report on Form 10-K of ESCO Technologies Inc.;
2. Based on my knowledge, this report does not contain any untrue statement of a material fact or omit to state a
material fact necessary to make the statements made, in light of the circumstances under which such
statements were made, not misleading with respect to the period covered by this report;
3. Based on my knowledge, the financial statements, and other financial information included in this report,
fairly present in all material respects the financial condition, results of operations and cash flows of the
registrant as of, and for, the periods presented in this report.
4. The registrant’s other certifying officer and I are responsible for establishing and maintaining disclosure
controls and procedures (as defined in Exchange Act Rules 13a-15(e) and 15d-15(e)) and internal control
over financial reporting (as defined in Exchange Act Rules 13a-15(f) and 15d-15(f)) for the registrant, and
have:
(a) Designed such disclosure controls and procedures, or caused such disclosure controls and procedures to
be designed under our supervision, to ensure that material information relating to the registrant,
including its consolidated subsidiaries, is made known to us by others within those entities, particularly
during the period in which this report is being prepared;
(b) Designed such internal control over financial reporting, or caused such internal control over financial
reporting to be designed under our supervision, to provide reasonable assurance regarding the reliability
of financial reporting and the preparation of financial statements for external purposes in accordance
with generally accepted accounting principles;
(c) Evaluated the effectiveness of the registrant’s disclosure controls and procedures and presented in this
report our conclusions about the effectiveness of the disclosure controls and procedures, as of the end of
the period covered by this report based on such evaluation; and
(d) Disclosed in this report any change in the registrant’s internal control over financial reporting that
occurred during the registrant’s most recent fiscal quarter (the registrant’s fourth fiscal quarter in the
case of an annual report) that has materially affected, or is reasonably likely to materially affect, the
registrant’s internal control over financial reporting; and
5. The registrant’s other certifying officer and I have disclosed, based on our most recent evaluation of internal
control over financial reporting, to the registrant’s auditors and the audit and finance committee of the
registrant’s board of directors (or persons performing the equivalent functions):
(a) All significant deficiencies and material weaknesses in the design or operation of internal control over
financial reporting which are reasonably likely to adversely affect the registrant’s ability to record,
process, summarize and report financial information; and
(b) Any fraud, whether or not material, that involves management or other employees who have a
significant role in the registrant’s internal control over financial reporting.
Date: November 29, 2017
/s/ Gary E. Muenster
Gary E. Muenster
Executive Vice President and Chief Financial Officer

EXHIBIT 32
Certification Pursuant to 18 U.S.C. Section 1350
As Adopted Pursuant to Section 906 of the Sarbanes-Oxley Act of 2002
In connection with the annual report of ESCO Technologies Inc. (the “Company”) on Form 10-K for the period ended
September 30, 2017 as filed with the Securities and Exchange Commission on the date hereof (the “Report”), we,
Victor L. Richey, Chairman, President and Chief Executive Officer of the Company, and Gary E. Muenster, Executive
Vice President and Chief Financial Officer of the Company, certify, to the best of our knowledge, pursuant to
18 U.S.C. Section 1350, as adopted pursuant to Section 906 of the Sarbanes-Oxley Act of 2002, that:
(1) The Report fully complies with the requirements of Section 13(a) or 15(d) of the Securities Exchange
Act of 1934; and
(2)`The information contained in the Report fairly presents, in all material respects, the financial condition
and results of operations of the Company.
Date: November 29, 2017
/s/ Victor L. Richey
Victor L. Richey
Chairman, President and Chief Executive Officer
/s/ Gary E. Muenster
Gary E. Muenster
Executive Vice President and Chief Financial Officer

[This page is intentionally left blank]

[This page is intentionally left blank]

1 Executive Committee
2 Audit and Finance Committee
3 Human Resources and Compensation Committee
4 Nominating and Corporate Governance Committee
This annual report is printed on recycled paper,
made in the USA, with 10% post-consumer waste.
SHAREHOLDERS’ ANNUAL MEETINGThe Annual Meeting of Shareholders of ESCO Technologies Inc. will be held at 9:30 a.m. Central Time on Friday, February 2, 2018 at ETS-Lindgren Inc., 1301 Arrow Point Drive,Cedar Park, TX 78613.You may access this Annual Report as well as the Notice of the meeting and the Proxy Statement on the Company’s Annual Meeting website at www.edocumentation.com/ese.
CERTIFICATIONS Pursuant to New York Stock Exchange (NYSE) requirements, the Company submitted to the NYSE the annual certifications by the Company’s chief executive officer dated February 9, 2017 and February 10, 2016, that he was not aware of any violations by the Company of NYSE’s corporate governance listing standards. In addition, the Company filed with the Securities and Exchange Commission the certifications by the Company’s chief executive officer and chief financial officer required under Section 302 of the Sarbanes-Oxley Act of 2002 as exhibits to the Company’s Forms 10-K for its fiscal years ended September 30, 2017 and September 30, 2016.
10-K REPORT The Company’s 2017 Annual Report on Form 10-K as filed with the Securities and Exchange Commission is included in this Annual Report to Shareholders, except that certain of its Exhibits have been omitted. The complete Form 10-K is available on the Company’s website at www.escotechnologies.com, or a copy will be provided to shareholders without charge upon written request to Kate Lowrey, Director of Investor Relations, ESCO Technologies Inc., 9900A Clayton Road, St. Louis, MO 63124.
INVESTOR RELATIONS Additional investor-related information may be obtained by contacting the Director of Investor Relations at (314) 213-7277 or toll free at (888) 622-3726. Information is also available through the Company’s website at www.escotechnologies.com or via e-mail to [email protected].
TRANSFER AGENT AND REGISTRAR Shareholder inquiries concerning lost certificates, transfer of shares or address changes should be directed to:
Computershare Shareholder ServicesP.O. Box 30170College Station, TX 77842-3170(800) 368-5948www.computershare.com/investor
CAPITAL STOCK INFORMATION ESCO Technologies Inc. common stock shares (symbol ESE) are listed on the New York Stock Exchange. There were approximately 1,829 holders of record of shares of common stock at October 31, 2017.
INDEPENDENT REGISTERED PUBLIC ACCOUNTING FIRMKPMG LLP10 South Broadway, Suite 900St. Louis, MO 63102
EXECUTIVE OFFICERS
Victor RicheyChairman, Chief Executive Officer & President
Gary MuensterExecutive Vice President & Chief Financial Officer
Alyson BarclaySenior Vice President, Secretary & General Counsel
CORPORATE STAFF
Deborah BoniskeVice PresidentHuman Resources
Mark DungerVice President Planning & Development
Richard GarretsonVice PresidentTax
Charles KretschmerVice President
Michele MarrenVice President & Corporate Controller
David SchatzVice President & Intellectual Property Counsel & Asst. Secretary
OPERATING EXECUTIVES
Mike AlfredPresidentCrissair, Inc.
Bruce ButlerPresidentETS-Lindgren Inc.
Sam ChapettaFiltration Group President
Trevor DrewManaging DirectorPlastique Limited
Rowland EllisSenior Vice President & General ManagerPTI Technologies Inc.
Antonio GonzalezPresidentVACCO Industries
John GrizzardPresidentWestland Technologies, Inc.
May ScallyChief Operating OfficerMorgan Schaffer Ltd.
Randall LogaTechnical Packaging Group Vice President & PresidentThermoform Engineered Quality LLC
Bryan SaylerUtility Solutions Group President & President Doble Engineering Company
Tom ShawVice President & General ManagerMayday Manufacturing Co.
Justin WheatingPresidentNRG Systems, Inc.
BOARD OF DIRECTORS
Patrick M. Dewar 2
Chief Executive The Trenton Group, LLC
Vinod M. Khilnani 2,3
Retired Executive ChairmanCTS Corporation
Gary E. MuensterExecutive Vice President & Chief Financial Officer
Leon J. Olivier 4
EVP of Enterprise Energy Strategy & Business DevelopmentEversource Energy
Robert J. Phillippy 2,4
Executive Advisor; Former President and Chief Executive Officer of Newport Corporation
Victor L. Richey 1
Chairman, Chief Executive Officer & President
Larry W. Solley 3,4
Retired Executive Vice PresidentEmerson Electric Co.
James M. Stolze 1,2,3
Retired Vice President & Chief Financial OfficerStereotaxis, Inc.
Shareholders’ Summary Management and Board of Directors

ESCO TECHNOLOGIES INC.9900A Clayton Road • St. Louis, MO 63124
www.escotechnologies.com
Our focus continues...
ES
CO
TE
CH
NO
LO
GIE
S IN
C. • 2
01
7 A
NN
UA
L R
EP
OR
T


