

Essential Reproductive
Management Considerations
CLIFF LAMB

FACTORS AFFECTING FERTILITY
Body weight
Age
Genetics
Nutritional management
Reproductive management
Rate of gain
Plane of nutrition
Body composition
Animal handling
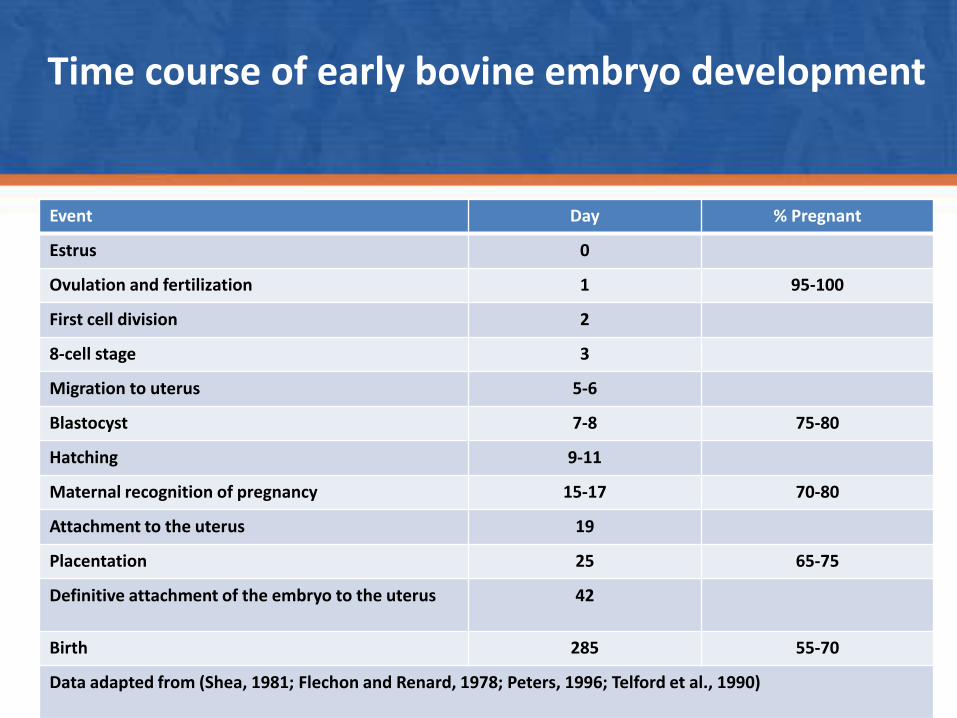
Event Day % Pregnant
Estrus 0
Ovulation and fertilization 1 95-100
First cell division 2
8-cell stage 3
Migration to uterus 5-6
Blastocyst 7-8 75-80
Hatching 9-11
Maternal recognition of pregnancy 15-17 70-80
Attachment to the uterus 19
Placentation 25 65-75
Definitive attachment of the embryo to the uterus 42
Birth 285 55-70
Data adapted from (Shea, 1981; Flechon and Renard, 1978; Peters, 1996; Telford et al., 1990)
Time course of early bovine embryo development
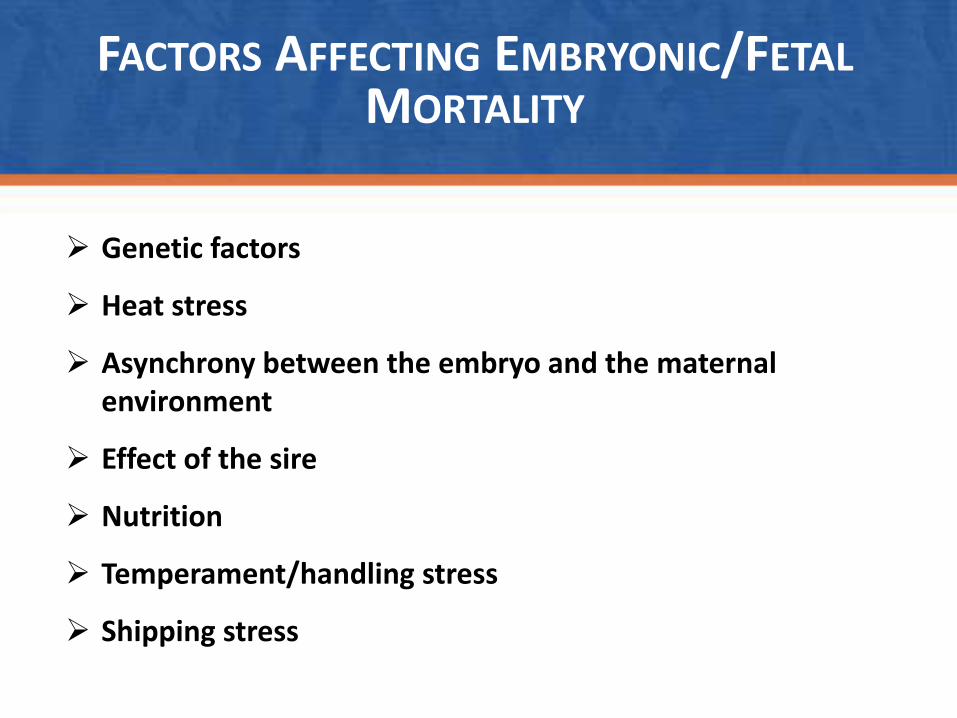
FACTORS AFFECTING EMBRYONIC/FETALMORTALITY
Genetic factors
Heat stress
Asynchrony between the embryo and the maternal environment
Effect of the sire
Nutrition
Temperament/handling stress
Shipping stress
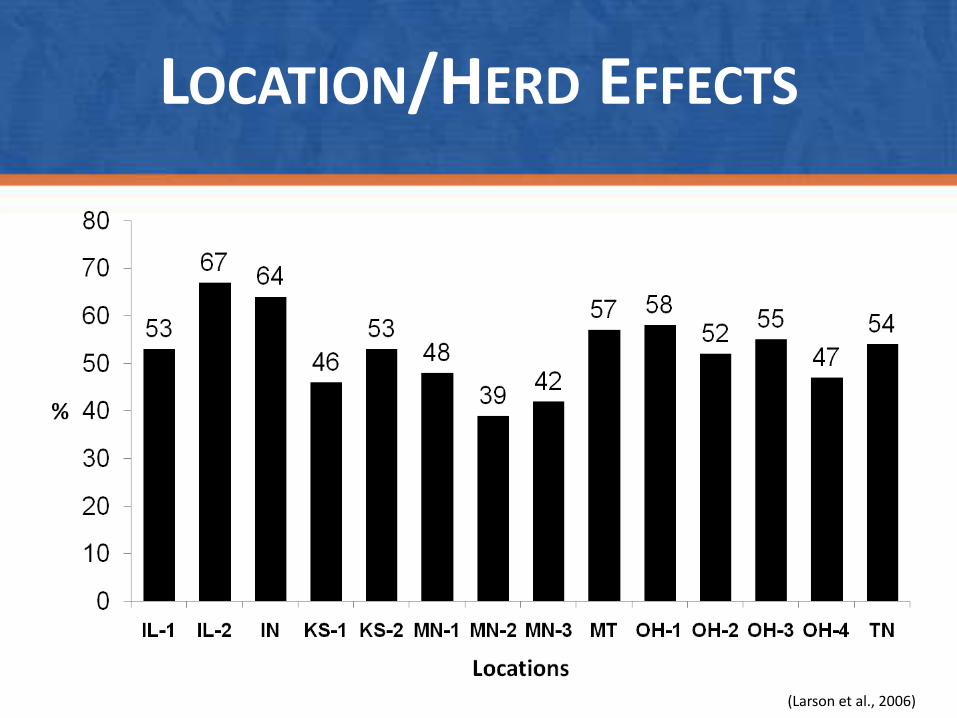
LOCATION/HERD EFFECTS
(Larson et al., 2006)

Changes Income from
Cattle Sales
2007 2008 2009 2010 2011 2012 2013 2014 20152016YTD
$52,809 $107,253 $92,765 $183,803 $158,776 $202,820 $185,233 $217,717 $306,115 $366,014
$0
$100,000
$200,000
$300,000
$400,000
Inc
om
e, $
Year
Total income from cattle

Changes Income from
Cattle Sales
2007 2008 2009 2010 2011 2012 2013 2014 20152016YTD
$52,809 $107,253 $92,765 $183,803 $158,776 $202,820 $185,233 $217,717 $306,115 $366,014
$0
$100,000
$200,000
$300,000
$400,000
Inc
om
e, $
Year
Total income from cattle

WHAT WERE THE NEGATIVE FACTORS AFFECTINGTHE PRODUCTIVITY OF THE OPERATION?
Long breeding season Extra labor during the calving season No uniformity in the calf crop Decreased value of the calves at market
Use of natural service sires No proven sires Increased dystocia Differing calf types among sire groups Cost of maintaining and managing bulls Risk of bull becoming sterile
Cow and calf management Differing vaccination, weaning, and/or branding dates

UF-NFREC CASE STUDY

Pregnancy has 4 times greater economic impact
than any other production trait!

MY EXPECTATIONS FOR EVERY FEMALE INTHE HERD
Must calve by 24 months of age
Cow must have a calf every 365 days
Cow must calve without assistance
Cow must provide sufficient resources for the calf to reach it’s genetic potential
Calf must be genetically capable to perform
Cows must maintain their body condition score for my conditions
Must not be crazy (disposition)
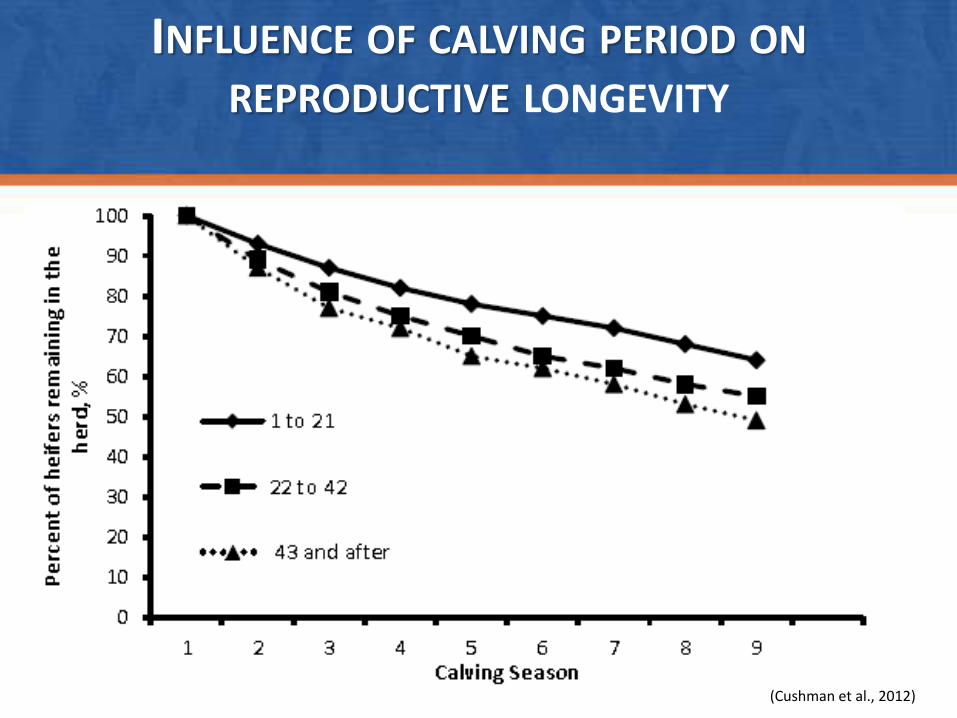
(Cushman et al., 2012)
INFLUENCE OF CALVING PERIOD ON
REPRODUCTIVE LONGEVITY

(Cushman et al., 2012)
INFLUENCE OF CALVING PERIOD ONWEANING WEIGHTS

AI heifers AI cows
1 8
AI late calving cows
49 70 110
2008
Start breedingseason
1 120
2007
Removebulls
Start breedingseason
1 120
2006
Removebulls
Removebulls
AI late, latecalving cows
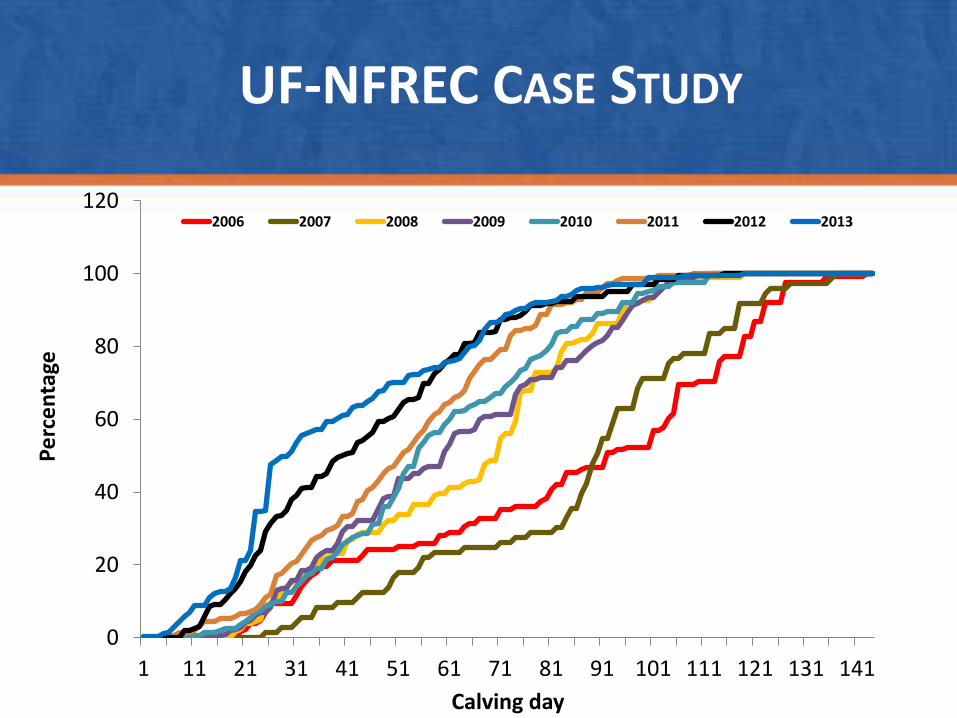
UF-NFREC CASE STUDY
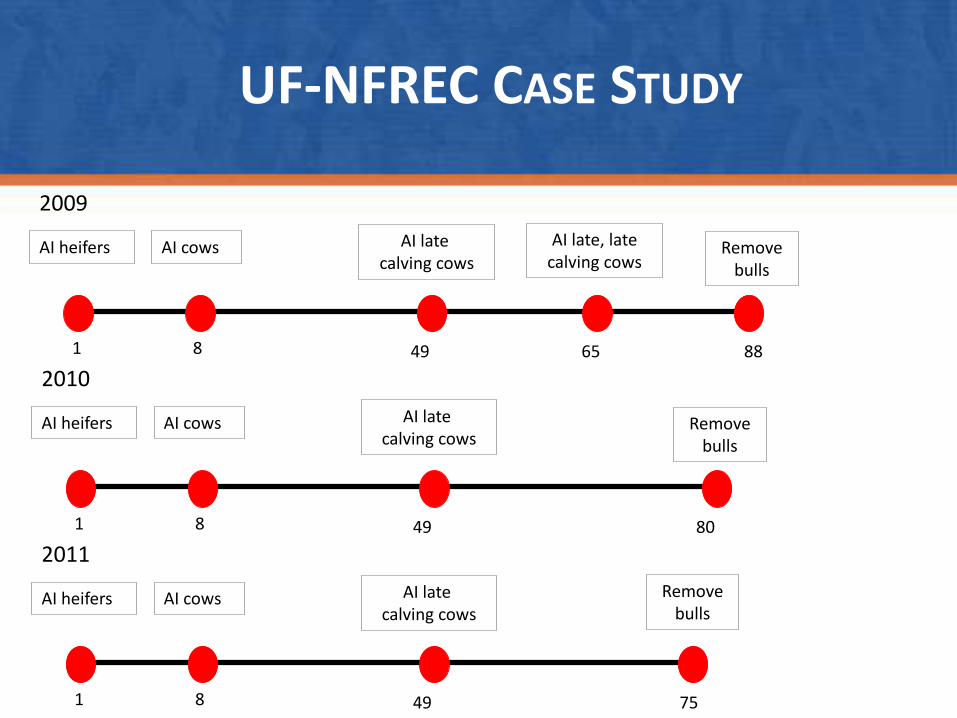
AI heifers AI cows
1 8
AI late calving cows
49 65 88
2009
AI heifers AI cows
1 8
AI late calving cows
49 80
2010
AI heifers AI cows
1 8
AI late calving cows
49 75
2011
Removebulls
Removebulls
Removebulls
AI late, latecalving cows
UF-NFREC CASE STUDY
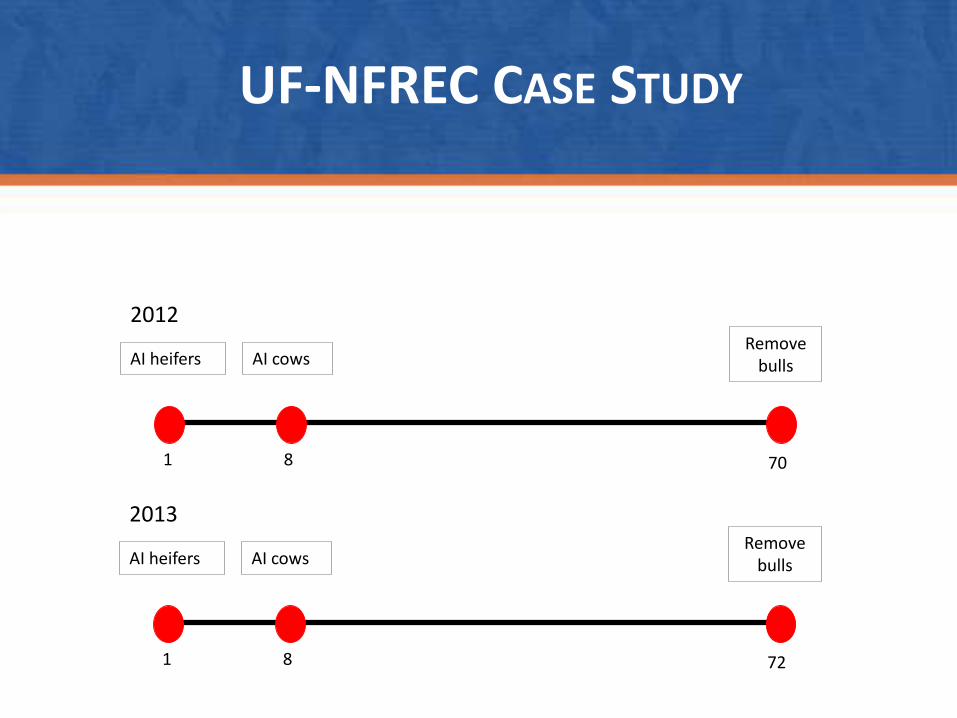
AI heifers AI cows
1 8 70
2012Remove
bulls
UF-NFREC CASE STUDY
AI heifers AI cows
1 8 72
2013Remove
bulls
UF-NFREC CASE STUDY
0
20
40
60
80
100
120
1 11 21 31 41 51 61 71 81 91 101 111 121 131 141
Pe
rce
nta
ge
Calving day
2006 2007 2008 2009 2010 2011 2012 2013

Change in calf value:
Year 2006 2007 2008 2009 2010 2011 2012 2013
Mean calving day
79.2 80.9 59.2 56.2 53.7 47.2 39.5 38.7
Difference from
2006/20070 0 21.7 24.7 27.2 33.7 41.4 42.2
Per calf increase in
value0 0 $87 $99 $109 $135 $166 $169
Herd increase in value
0 0 $19,100 $29,700 $32,700 $40,500 $49,800 $50,700
UF-NFREC CASE STUDY

We know how to synchronize
cattle!

ESTRUS SYNCHRONIZATION AND AI IN BEEF CATTLE

ESTROUS SYNCHRONIZATION AND AI IN BEEF CATTLE

56.9
62.1
45.2
65.8
44.4
50.4
45.248.5
0
10
20
30
40
50
60
70
80
1 2 3 4 5 6 7 8
Pre
gnan
cy r
ate
, %
Herd
PREGNANCY RATES BY HERDS

0
5
10
15
20
25
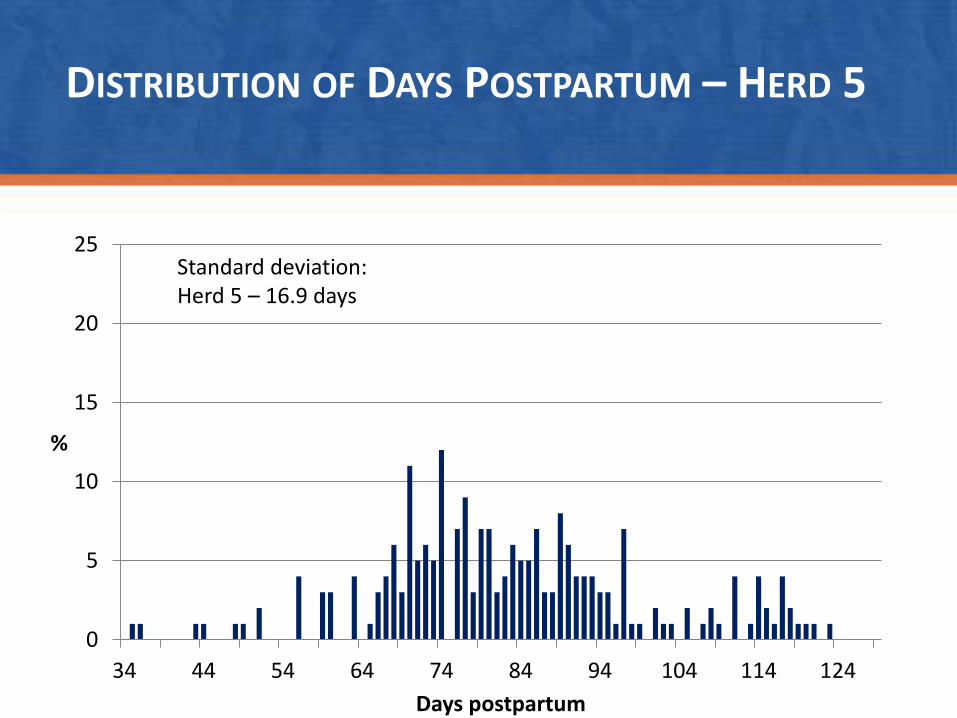
34 44 54 64 74 84 94 104 114 124
%
Days postpartum
DISTRIBUTION OF DAYS POSTPARTUM – HERD 1
Standard deviation:Herd 1 – 5.6 days
0
5
10
15
20
25
34 44 54 64 74 84 94 104 114 124
%
Days postpartum
DISTRIBUTION OF DAYS POSTPARTUM – HERD 5
Standard deviation:Herd 5 – 16.9 days
0
5
10
1 11 21 31 41 51 61 71
% c
alvi
ng
Calving season day
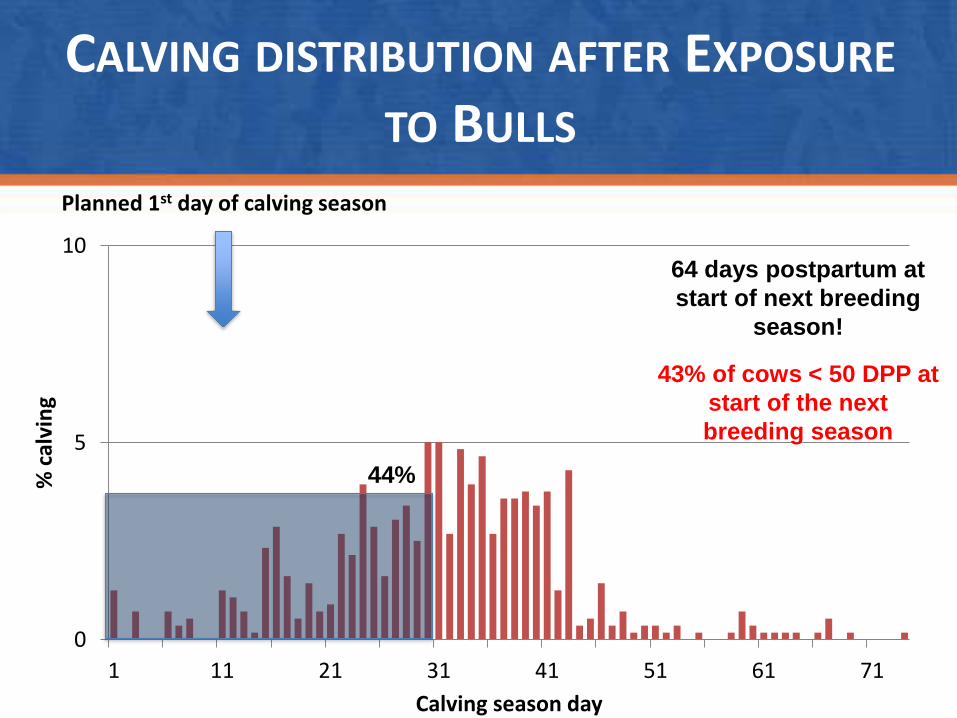
CALVING DISTRIBUTION AFTER EXPOSURE
TO BULLS
44%
64 days postpartum at
start of next breeding
season!
Planned 1st day of calving season
43% of cows < 50 DPP at
start of the next
breeding season

0
5
10
1 11 21 31 41 51 61 71
% c
alvi
ng
Calving season day
CALVING DISTRIBUTION AFTER EXPOSURE
TO AI AND ES
88%
79 days postpartum at
start of next breeding
season!
Planned 1st day of calving season
7% of cows < 50 DPP at
start of the next
breeding season

Other Factors Influencing Reproductive Performance
CLIFF LAMB

Estrous cyclicity responses of heifers of distinct body
conditions to energy restriction and repletion

BCS 3
BCS 5
BCS 7

IMPACT OF CHANGE IN BCS ON
REPRODUCTION IN HEIFERS
BCS 7
BCS 5
Restriction Re-feeding
Termination of estrous cycles
Resumption of estrous cycles
??(FAT)
(MODERATE)
Cassady et al., (2009)

Treatments
Item MODERATE FAT
Initial BW, kg 937a 1,136b
Initial BCS 5.0a 7.1b
BW at anestrus, kg 781 838
BCS at anestrus 3.1 3.3
Days to anestrus 66.5a 155.9b
CHANGE IN BW, BCS AND DAYS TO
ANESTRUS DURING FEED RESTRICTION
Cassady et al., (2009)

Treatments
Item MODERATE FAT
BW at anestrus, kg 781 838
BCS at anestrus 3.1 3.3
BW at 1st estrous cycle, kg 1,003a 1,131b
BCS at 1st estrous cycle 5.2a 6.0b
Days to 1st estrous cycle 67.7 78.9
CHANGE IN BW, BCS AND DAYS TO 1ST ESTROUS
CYCLE AFTER INITIATION OF FEED REPLETION
Cassady et al., (2009)

Summary
• Body weight
• Nutritional management
• Reproductive management
• Plane of nutrition
• Body composition
• Animal handling

THANK YOU!Contact Information:
Cliff Lamb
Texas A&M University
Kleberg Center, Room 133
2471 TAMU
College Station, TX 77843-2471


