

Publications (WR) Water Resources
8-1987
Estimation of food limitation in Daphnia Pulexfrom Boulder Basin, Lake MeadThomas Mark BartanenUniversity of Nevada, Las Vegas
Follow this and additional works at: https://digitalscholarship.unlv.edu/water_pubs
Part of the Biology Commons, Environmental Health and Protection Commons, EnvironmentalIndicators and Impact Assessment Commons, Environmental Microbiology and Microbial EcologyCommons, Fresh Water Studies Commons, Laboratory and Basic Science Research Commons, andthe Water Resource Management Commons
This Thesis is brought to you for free and open access by the Water Resources at Digital Scholarship@UNLV. It has been accepted for inclusion inPublications (WR) by an authorized administrator of Digital Scholarship@UNLV. For more information, please contact [email protected].
Repository CitationBartanen, T. M. (1987). Estimation of food limitation in Daphnia Pulex from Boulder Basin, Lake Mead.Available at: https://digitalscholarship.unlv.edu/water_pubs/103
ESTIMATION OF FOOD LIMITATION
IN DAPHNIA PULEX
FROM BOULDER BASIN,
LAKE MEAD
<f"-'S; |
L.x~ L.
-2
by
Thomas Mark Bartanen
A thesis submitted in partial fulfillmentof the requirements for the degree of
Master of Science
i n
the Biological Sciences
Department of Biological SciencesUniversity of Nevada, Las Vegas
August, 1987
UNIVERSITY OF NEVADA, LAS VEGASLIBRARY

The thesis of Thomas Mark Bartanen for the degree ofMaster of Science in the Biological Sciences is approved,
IA/J 6Chairperson, Peter L. Starkweather
Exami-FH'ng Committee Member, Larry J. Paulson
Examining Committee Member, James E. Deacon
r-
Graduate Faculty Representative, David Weide
Graduate Dean, Ronald W. Smith
i i

Table of Contents
Title Page
Approval Page
Table of Contents
List of Figures
List of Tables
Abstract
Acknowledgements
Introduction
Daphnia Feeding Behavior
Temperature and Food Limitation Effects
Objectives
Materials and Methods
Site Description
Experimental Procedure
Results
Food Supp1y
Explanation of Figures and Tables
Patterns in Survivorship
Growth
Reproduct ion
Discussion
Literature Cited
Appendix 1- Experimental Chronology
i i i
Page
i
i i
i i i
i v
vi
vi i
ix
1
2
9
12
13
13
17
28
28
30
32
41
50
63
71
79

Figure No,
1
List of FiguresPage
if"6yp'V
3
4
5
6
7
8
9
10
11
12
13
14
Anterior view of Daphpia oulexshowing 1st and 2nd antennules,major mouthparts and 5 pairs ofthoracic appendanges 3
Map of Lake Mead showing location ofsampling station 14
Diagram of flow-through feedingapparatus ' 22
Concentration of chlorophyl1-a inBoulder Basin during 1981 and 1982... 29
Survivorship curves for February,March and Apr i 1 1982 35
Survivorship curves for May and June1982 36
Survivorship curves for November,December 1982 and January 1983 39
Growth in Daphnia pulex duringFebruary, March and April 1982 43
Growth in Daphnia pulex duringMay and June 1982 47
Growth in Daphnia pulex duringNovember, December 1982 and January1983 49
Neonates (or Eggs) produced perfemale per day in February, March andApril 1982 51
Neonates produced per female per dayin May and June 1982 55
Neonates (or Eggs) produced perfemale per day in November, December1982 and January 1983 58
Zooplankton abundance in BoulderBasin, 1982 61
iv
15
16
17
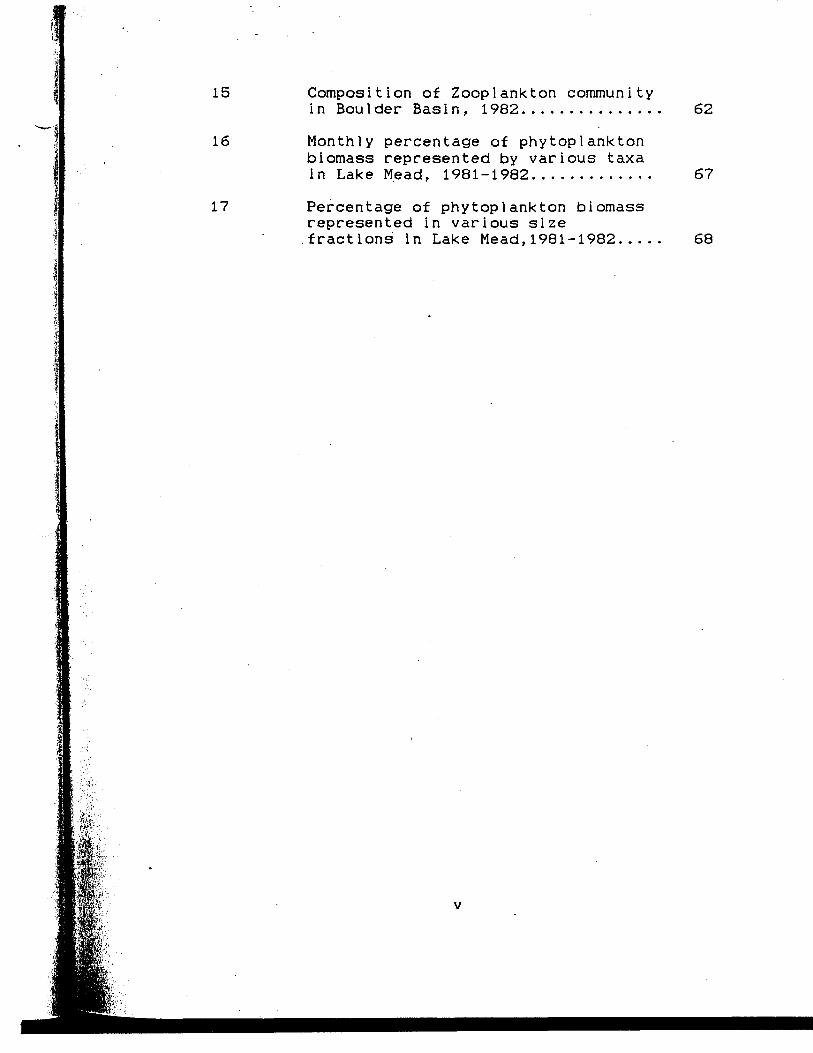
Composition of Zooplankton communityin Boulder Basin, 1982
Monthly percentage of phytoplanktonbiomass represented by various taxain Lake Mead, 1981-1982
Percentage of phytoplankton biomassrepresented in various size.fractions in Lake Mead,1981-1982....
62
67
68

!
Table no,
1
2
3
List of Tables
Collection dates and comparison of fieldand laboratory temperature and lightregimes
Departures from experimental procedure..
Results of Kolmogorov-Smirnov goodnessof fit analysis on Daohnia mortality....
Page
24
26
37
vi

ABSTRACT
In February, 1982 I began a year-long study to
determine if growth and reproduction in Daphnia PUI ex were
limited by .the amount of food available in Boulder Basin,
Lake Mead. To determine this, I made monthly collections
of Daphnia pulex and natural lake seston from an already
established station in Boulder Basin. I cultured the
Daphnia pulex under simulated field conditions in a
flow-through feeding apparatus using four different food
regimes; 1-natural lake seston filtered through 80 urn mesh
to remove other zooplankton, 2-lake seston (as above) with
an enrichment of 103 cells-ml"1 of Chlamvdomonas
reinhardtl. 3-lake seston (as above) with an enrichment of
105 cells'ml"1 of Ch1amvdomonas relnhardti. 4-0.45 um (HA
Millipore) filtered lake water with 105 cells-mi"1 of
Chlamvdomonas reinhardti. The last two food regimes
contain amounts of algae in excess of the incipient
limiting concentration and therefore, growth and
reproduction should not be limited by lack of food.
For each of the 8 months that I was able to run
successful experiments, I found that animals fed only lake
seston grew more slowly and reproduced less than the
animals fed enriched food regimes. There were some months
(February, May 1982 and January 1983) when the amount of
vi i
extra food in the lowest enrichment (103 cells-mi"1 of
Chlamvdomonas reinhardti) was not enough to improve growth
or reproduction significantly. These were the months when
phytoplankton was most abundant in Boulder Basin and 103
cells-mi"1 provided relatively less enrichment than in
other months. The months for which data could not be
obtained (July-October) coincide with the lowest abundance
of Daphnia pulex in Boulder Basin. The low levels of
Daphnia pulex and moderate levels of chlorophy11-a present
in Boulder Basin, indicate that the animals may have been
already food limited during those months. From this, I
concluded that during the entire year, Daphnia pulex is
food limited in Boulder Basin, Lake Mead. Comparison of
this study with other.studies confirms that food
limitation of Daphnia pulex is primarily due to low
phytoplankton abundance Cas indicated by low
concentrations of chlorophyl1-a) although the food quality
of the seston may also contribute to the food limitation.
vii i

i
Acknowledgements
There are many people whose aid proved invaluable in
the completion of my thesis. To them I give my profound
thanks and gratitute. To Dr. Paulson for mentioning that
no one had yet studied food limitation in zooplankton at
Lake Mead and thus provided me with the subject for this
thesis and provided me with information on Lake
conditions. The members of the Lake Mead Limnological
Research Center, who collected many of my samples for me
in addition to their already full schedule. Dr. Deacon
for his guidance and comments as a member of my thesis
committe.e. Dr. Yfantis for his assistance with the
statistical analyses and to Dr. Wiede who was gracious
enough to take Dr. Yfantis'' place as my outside committee
member. Patrick Fitzgibbon for his assistance with
plotting the figures. To all the members of the
Department of Biological Sciences for their patience and-
to my family and all my friends who helped keep me going
throughout this project. My deepest thanks go to Dr.
Starkweather for his patience, guidance and assistance in
my research and course work. Once again, my thanks to you
al 1 .
ix

INTRODUCTION
There are many trophic interactions which contribute
to the structure of freshwater, suspension-feeding,
zooplankton communities. Predation, by fish and by other
zooplankton, plays an important role in establishing the
"diversity and seasonal succession of zooplankton groups
(Gliwicz et al.1981, Benndorf and Horn 1985, Gophen and
Pollingher 1985). Competition is important as it may
"cause some organisms to exclude other organisms in ways
which appear to be driven by food limitation (Gliwicz
1980, Mateev 1985, Gilbert 1985, Orcutt 1985, Edmondson
1985, Geller 1985, Kerfoot et al. 1985, Romanovsky and
Feinova 1985). Recent reviews detail the complexity of
such interactions in freshwater, limnetic ecosystems
(Kerfoot 1980, Meyers and Strickler 1984, Lampert 1985).
What these studies have as common themes are the concepts
of food (or nutrient) limitation and the behavioral and
evolutionary strategies that organisms have developed to
avoid it.
A l l aquatic organisms are involved in predation as
either predator or prey. Whether it is Daphnla feeding on
nannoplankton (Gliwicz and Hi 1lbricht-11Ikowska 1972,
McCauley and Kalff 1981) or fish feeding on Daphnia
(Paulson and Baker 1983), all aquatic organisms attempt to
maximize their input of energy and avoid the effects of
food limitation, often at the expense of other organisms.

AI
In the recent literature there are many studies of the
effects of food limitation (Lampert 1980, Threkeld 1985,
Ghilarov 1985, Larsson et al. 1985, Lampert and Muck
1985). A common species subject to probable food
limitation, and a frequent subject of such studies is the
cladoceran, Daphnia pulex.
Daphnia Feeding Behavior
Daphnia pulex is a suspension feeding cladoceran which
uses its thoracic appendages for both feeding and gas
exchange (Cannon 1933). Particles are collected on the
thoracic limb setae and setules (Figure 1) , concentrated
in the food groove, and delivered to the mouthparts
(Geller and Muller 1981, Porter et al. 1982). The
filtering rate <or filtration rate, Rigler 1971) is
defined as the volume of water filtered, containing the
number of cells eaten by the animal, in a given time. It
does not assume that all particles are removed; that those
removed are ingested or even that the volume of water
actually sieved by the appendages, is known. Feeding rate
is the amount of food collected and ingested. Both
filtering rate and filtration rate are dependent on the
motions of the thoracic feeding appendages. After food is
collected in the food groove it is formed into a bolus and
ingested (Cannon 1933). Sometimes the food groove becomes
clogged with algae, the bolus is too large to be ingested
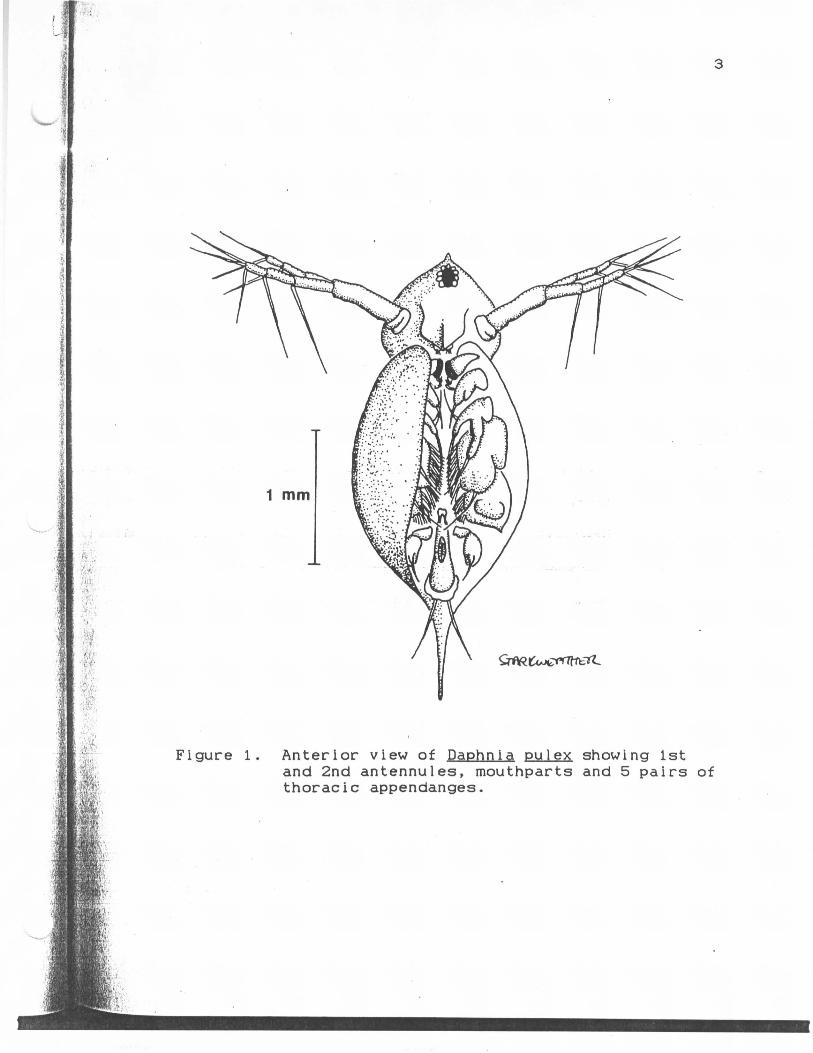
Figure 1. Anterior view of Daphnia pulex showing 1stand 2nd antennules, mouthparts and 5 pairs ofthoracic appendanges.
or it contains chemically unacceptable food items (Porter
and Orcutt, 1980). When this happens, rejection occurs.
Vigorous movements of the postabdominal claw dislodge the
bolus or other obstuctions. However, the rejection
process causes the loss of the food collected and the
energy used to collect the food.
Studies indicate that the filtering rate is constant
and maximal at low concentrations of particles (McMahon
and Rigler, 1963). Above a certain concentration of
particles, termed the "incipient limiting concentration",
filtering rate gradually declines asymptotically (Burns
and Rigler, 1967). The filtering rate never reaches zero>
since movement of the filtering appendages is necessary
for respiration (Rigler 1961). Filtering rates can be
affected by the nutritional state of Daphnia. Ryther
(1954) found that starved animals maintained higher
filtering and feeding rates than would be expected in high
food concentrations. After a period of time, the animals
would acclimate to the new concentration, and filtering
rates would decline. McMahpn and Rigler (1965) indicated
that the filtering rate is mediated by the amount of food
in the gut, which explains why filtering rates in starved
animals return to normal after a few minutes. The
filtering rate is also dependent upon environmental
factors such as temperature (Burns 1968), pH (Ivanova
1969, Kring and O'Brien 1976) and oxygen (Green 1956).

• - s i
Different species of zooplankton, show different optimal
ranges for these variables. Above or below the optimal
range, the filtering rate declines.
Filtering rates determined for animals feeding on
pure cultures were found to be higher than those for
animals feeding in natural suspensions (Ryther 1954; Burns
and Rigler 1967; Burns 1968; Growley 1973). Subsequent
research showed that this reduction in filtering rate is
caused by the interference large algal filaments with the
collection of food (Burns 1968, Arnold 1971; Crowley 1973;
Webster and Peters 1978; Gliwicz and Siedlar 1980). Many
investigations have found that increasing concentrations
of filamentous algae (such as cyanobacteria) resulted in
higher rejection rates (Gliwicz 1980; Porter and Orcutt
1980, Webster and Peters 1978). Porter and McDonough
(1984) found that this increase in rejection is associated
with increased respiration rates. They suggest that the
decreased food intake and increased energy expenditure,
reduces significantly the energy available for growth and
reproduction. Arnold (1971) found that Daphnia pulex. fed
on several different species of cyanobacteria, had levels
of ingest ion, assimilation, survivorship and reproduction
that were lower than those in Daphnia pulex fed on green
algae. Webster and Peters (1978) found lower filtering
rates occurred, and smaller brood sizes were produced, as
the concentration of algal filaments increased. Porter

6
and Orcutt (1980) observed similar results when Daphnia
magna were fed Anabaena flos-aauae. Gliwicz (1980) found
that different species of Cladocerans vary in their
a b i l i t y to regulate carapace gape (a mechanism to exclude
large filaments). Porter and Orcutt (1980) suggest that
smaller species of cladocerans are less disturbed by
abundant net plankton since their carapace gap is already
small enough to exclude large algae.
Closely related to the filtering rate is the feeding
or ingestion rate. Rigler <1961) found that below the
incipient limiting concentration, the ingestion rate is
limited, by the filtering rate and is directly proportional
to the food concentration. Above the incipient limiting
concentration, feeding rate is relatively constant and
maximum, 1imited only by gut retention time or digestion
rates. Not a l l particles in the seston are collected and
ingested bv Daphnia* Depending on the species, much of
the seston biomass is unsuitable because it is either: 1-
too large (colonies and filaments, Gliwicz and Siedlar
1980), 2-too small (bacteria, Geller and Muller 1981),
3-contains toxins like cyanobacteria (Crowley 1973) and
senescent algae (Ryther 1954, McMahon and Rigler 1965) or
4-is resistant to digestion (Porter and Orcutt 1980,
Infante 1973). Porter (1977), suggests that particles
from 0.8 jam up to 45 jjm in diameter can be ingested by the
largest Daphnia. Geller and Muller (1981) used scanning

electron microscopy to measure intersetular gaps and found
that depending on the species, cladocerans should be able
to utilize particles down to 0.2 jam in diameter.
Subsequent work by DeMott ('1985) and Brendel berger (1985)
supports the hypothesis that capture "efficiency is related
to filter mesh size. Growley (1973) and Lampert (1978),
suggested that the upper limit of 45jjm-50jjm diameter
particles for Daphnia pulex is too high and that 35 jjm is
a better approximation. Larger particles can be collected
if they are elongated or flexible and even short segments
of filamentous algae can be consumed. The major food
source for Daphnla and other zooplankton thus appears to
be nannoplankton (Gliwicz and Hi 1lbrict-11Ikowska 1972,
Porter 1977, McCauley and Kalff 1981). .This nannoplankton
can be, and often is, supplemented by other food sources
such as bacteria (McMahon and Rigler 1965, Pace et al.
1983) and detritus (Pavylutin 1975 and Hrbacek 1985).
There is no standard definition of what phytoplankton size
fraction constitutes the nannoplankton (Janik 1984), so
for comparison purposes, I, wi l l define it as cells whose
equivalent spherical diameter is less than 64 tm.
Berman and Richman (1974) found that Daphnia pulex
can select food primarily, but not exculsively, on the
basis of biomass. It is probable that Daphnia pulex can
select particles of a given size from a suspension of
different sized particles when they are pre-fed particles
8
of the size that they later select for. Berman and
Richman (1974) in another experiment, found that when the
biomass of all particles was equal, selection was for
small particles present in high numbers. In contrast to
selectivity in D. pu 1 ex. DeMott 1982 found that El. rosea
showed no selectivity when presented two different sized
particles (Ch1amvdomonas reinhardt i and bacteria), but
that Bosmina longirostris preferentially selected
Ch1amvdomonas. Meise et al.1985, found that Daphnia pulex
can modify its behavior to feed on a small high-quality
alga, over a slightly larger but closely related alga (of
lower food value) or intermediately sized latex spheres.
Clearly, Cladocerans differ In their ability to
discriminate among food sources.
When Daphnia are placed in enclosed containers they
exhibit two types of swimming behavior while feeding.
When suspended food levels are high the animals feed via
the hop-and-sink method also termed "grazing" (McMahon and
Rigler 1963, Burns 1969). When levels of food are low or
the animals are unfed they forage on the bottom of their
containers, a behavior termed "browsing". Browsing is
thought to dislodge detritus from the bottom of the
containers which is then captured and consumed. Horton et
al. (1978) found that as food levels increased the
proportion of animals browzing on the bottom decreased and
that only above the incipient limiting concentration did
I
the animals spend more than 50 percent of their time
grazing. Even at the lowest food levels, animals
occasionally swam into the open water, which Horton et al .
(1978) assumed represented the animals "sampling" the
upper layers in search of higher food concentrations.
Browsing behavior is not just limited to the laboratory.
During a field study in a small temperate lake, Meyers
(1985) found that when levels of ingestible phytoplankton
were low, Daphnia pulex (normally a limnetic "grazer")
would invade the littoral zone to feed within beds of
macrophytes. Browsing, while an important behavior in my
experiments, should not be important in large, limnetic
areas like Boulder Basin where there are no container
walls or nearby 1ittoral zones.
Temporal variations in the feeding behavior of
Daphnia have also been noted and are dicussed in detail in
Starkweather (1983). Another important diel behavior of
Daphnia and other zooplankton is vertical migration. Many
zooplankton spend the day deep in the water column and
rise to the surface at night. This behavior has very
important ramifications for zooplankton populations.
During the vertical migrations, they are subjected to
variations in temperature, predation and food availablity.
Effects of Temperature and Food Limitation
10
*l
W,
I
Green (1956) studied the relationship between growth,
size and reproduction in the Cladocera, in relation to
food and temperature and found that, as temperature
increased, the rate of growth increased and the interval
between instars (developemental stages) decreased. He
found that the growth rate decreased as the animals got
older and that low levels of food slowed growth. He also
found that at low temperatures growth was slowed, but the
final length of the animals was larger. Higher
temperatures also decreased the size of primiparous
animals and the size of the young. Bottrell <1975a,
1975b) found a similar decrease in the development time
with increased temperature for epiphytic cladocerans (and
other zooplankton) in the Thames River, England. The
studies also found differences between the species in the
amount of increase brought about by increased temperature.
Munro and White (1975) found that in Daphnia longispina.
growth increased and egg development time decreased with
increasing temperature. Lei and Armitage (1980) confirmed
that for Daphnia amblgua. instar duration decreased with
increased temperature. Comparing animals in the
laboratory and in the field, they found that development
time was shorter, brood size was larger and more total
young were produced in the lab animals fed high
concentrations of food. Vijverberg (1976) and Lampert
(1978) also found that increased temperature led to
11
increased egg production and that the curves were similar
to those found for increasing food concentrations. These
studies show that temperature is an important variable in
controlling growth and reproduction in zooplankton. As
temperature increases, the rate of growth and reproduction
can also increase, given that sufficient food' is present.
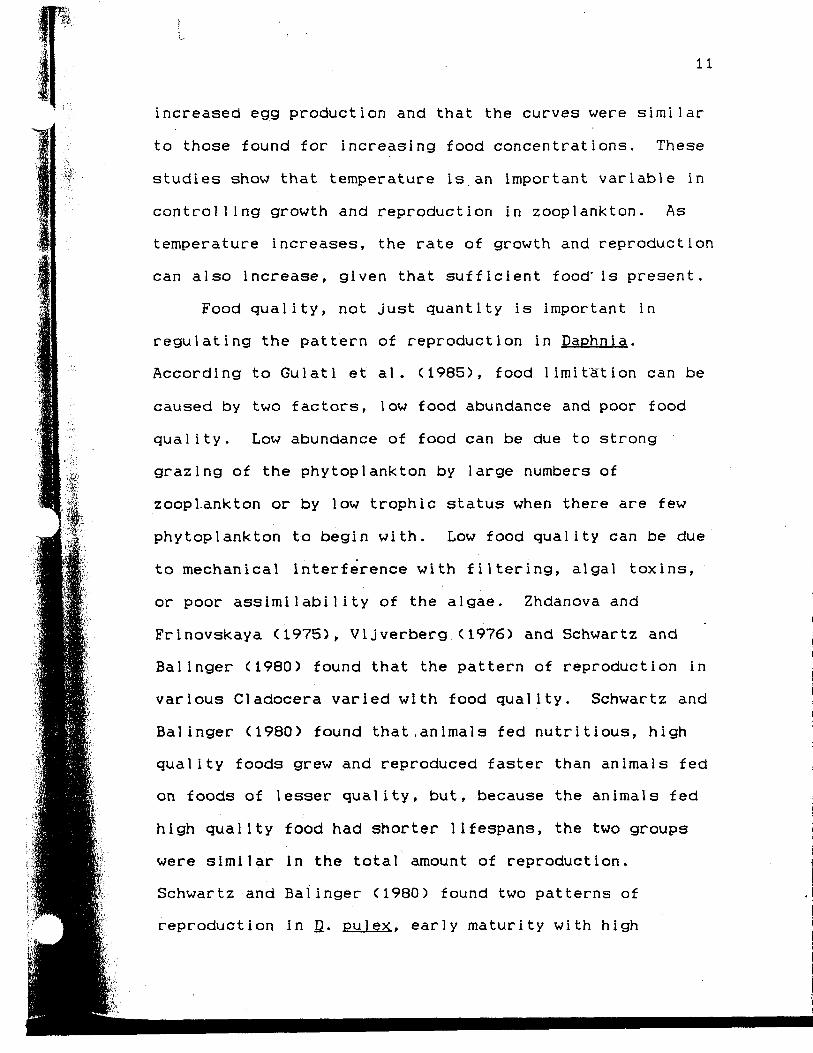
Food quality, not just quantity is important in
regulating the pattern of reproduction in Daphnia.
According to Gulati et al. (1985), food limitation can be
caused by two factors, low food abundance and poor food
quality. Low abundance of food can be due to strong
grazing of the phytoplankton by large numbers of
zooplankton or by low trophic status when there are few
phytoplankton to begin with. Low food quality can be due
to mechanical interference with filtering, algal toxins,
or poor assimilabi1ity of the algae. Zhdanova and
Frinovskaya (1975), Vijverberg (1976) and Schwartz and
Balinger (1980) found that the pattern of reproduction in
various Cladocera varied with food quality. Schwartz and
Balinger (1980) found that.animals fed nutritious, high
quality foods grew and reproduced faster than animals fed
on foods of lesser quality, but, because the animals fed
high quality food had shorter llfespans, the two groups
were similar in the total amount of reproduction.
Schwartz and Balinger (1980) found two patterns of
reproduction in £). pulex. early maturity with high

1
«r
12
fecundity and short lifespan and delayed maturity with
lower fecundity and longer lifespan. They speculated that
JD. PU 1 ex could take advantage of an increase in high
quality food by greatly increasing its reproduction over
the short term. While in less favorable environments,
reproduction is limited, but lifespan is lengthened
(possible due to dcreased stress from reproduction).
Taylor (1985) found diminished growth and reproduction at
low concentrations of food.
Object 1ves
For my study, I wanted to determine whether or not
Daphnia pulex in Lake Mead were food limited and, if so,
at what times of the year. Because my experiments were to
take place in the laboratory, several major factors that
affect natural populations would not be present in my
study. Predation pressure would be lifted and so would
competition with other species. Temperature is an
important variable because I wanted to duplicate field
conditions as closely as possible. The variations in the
phytoplankton would also be important. Because the
presence of large net plankton can have a profound effect
on growth and reproduction, the make up of the seston, not
just the abundance w i l l have an effect on my experiments.
Finally, the light regime the animals are exposed to must
be regulated to avoid responses that would not be

13
appropriate to the season being studied (Starkweather,
1983).
MATERIALS AND METHODS
Si te Descript ion
Lake Mead is a large reservoir located in the Mojave
Desert along the border between southeastern Nevada and
northwestern Arizona. Formed in 1935 by the construction
of Hoover Dam, it is, by volume, the largest reservoir in
North America (Baker and Paulson, 1980). The lake is
divided into two large basins (upper and lower) by Boulder
Canyon (Paulson 1981). The site for my study was Boulder
Basin, a subdivision of the lower basin that receives
water from the Colorado River via the Upper Basin and from
the Las Vegas Wash (Fig. 2 from Paulson 1981 used with
permission). I chose Boulder Basin for the site of this
study because it is typical of the lake as a whole
(personal communication, L. J. Paulson) and because a
number of other studies have been conducted at that site.
These have included Burke's 1977 study of the relationship
of the zooplankton to the metalimnetic oxygen minimum,
Janik's 1984 study of the the role of the nannoplankton in
the phytoplankton dynamics in Lake Mead, and Wilde's 1984
study of the seasonal and spatial heterogeneity in the
limnetic zooplankton community of Lake Mead.

LAKE MEADARIZONA —NEVADA
LEGEND
Tholweg of Colorado River
0 5km
IcebergCanyonBoulder
CanyonInner MiddleLas Vega* Las Vegas
Bay /Bay
Boulder BasinVirgin
Canyon
Figure 2. Map of .Lake Mead showing l oca t i on of s a m p l i n gs ta t ion ( u n d e r l i n e d ) .
15
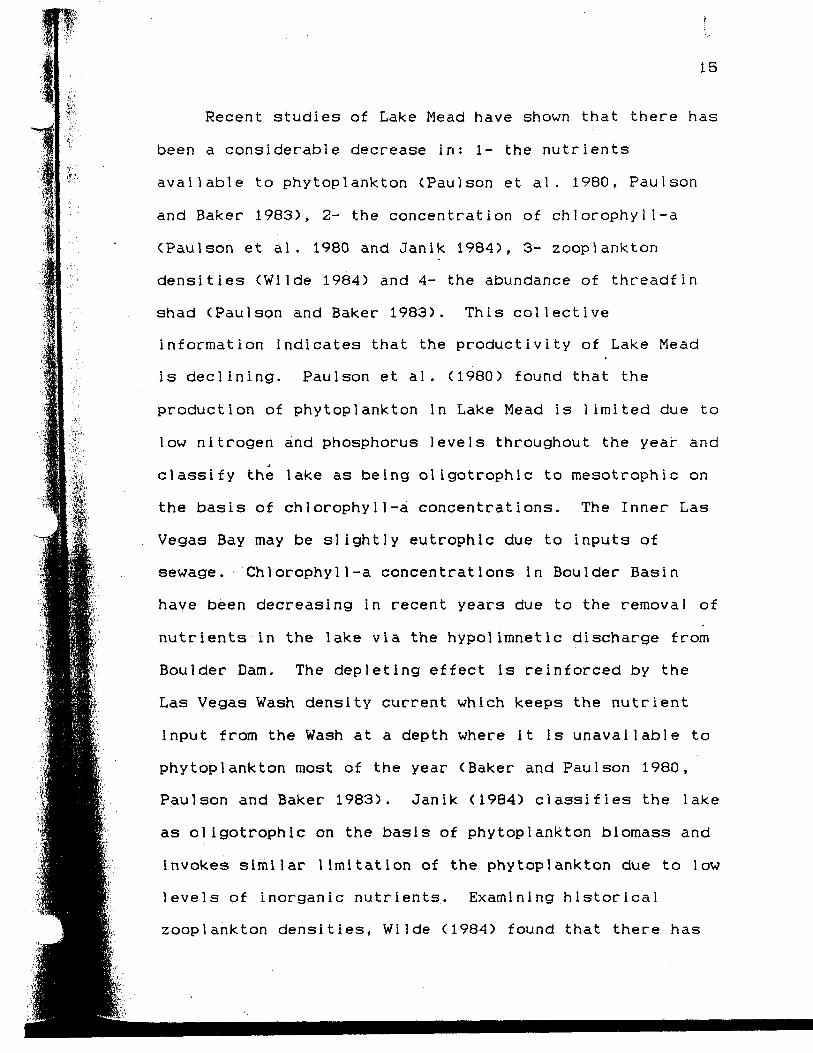
Recent studies of Lake Mead have shown that there has
been a considerable decrease in: l- the nutrients
available to phytoplankton (Paulson et al. 1980, Paulson
and Baker 1983), 2- the concentration of ch1orophy11-a
<Paulson et al. 1980 and Janik 1984), 3- zooplankton
densities (Wilde 1984) and 4- the abundance of threadfin
shad (Paulson and Baker 1983). This collective
information indicates that the productivity of Lake Mead
is declining. Paulson et al. (1980) found that the
production of phytoplankton in Lake Mead is limited due to
low nitrogen and phosphorus levels throughout the year and^
classify the lake as being oligotrophic to mesotrophic on
the basis of chlorophy11-a concentrations. The Inner Las
Vegas Bay may be slightly eutrophic due to inputs of
sewage. Chiorophy11-a concentrations in Boulder Basin
have been decreasing in recent years due to the removal of
nutrients in the lake via the hypolimnetic discharge from
Boulder Dam. The depleting effect is reinforced by the
Las Vegas Wash density current which keeps the nutrient
input from the Wash at a depth where it is unavailable to
phytoplankton most of the year (Baker and Paulson 1980,
Paulson and Baker 1983). Janik (1984) classifies the lake
as oligotrophic on the basis of phytoplankton biomass and
invokes similar limitation of the phytoplankton due to low
levels of inorganic nutrients. Examining historical
zooplankton densities, Wilde (1984) found that there has

been a 90 percent reduction in total zooplankton density
in the lake since 1971. Paulson and Baker (1983) suggest
that the reduced levels of zooplankton may be responsible
for lower densities of threadfin shad, a planktivore
normally abundant in the limnetic areas of Lake Mead. The
lower densities of zooplankton in summer (especially
Daphnia) might be due to intense predation alone, if it
were not for the fact that threadfin shad are now rare in
the limnetic areas of the Lake and predation by shad is
therefore, minimal (Paulson and Baker, 1983). This
information coupled with the fact that phytoplankton
growth is limited in the' lake suggests that the
zooplankton in most of Lake Mead are food limited.
Few studies on zooplankton in Lake Mead have been
done other than those describing the species of
zooplankton present, their abundance, and their seasonal
and spatial heterogenity (Burke 1976, Paulson et al . 1980
and Wilde 1984). Various zooplankton species are dominant
during different times of the year in Lake Mead. I chose
Daphnia pulex (a filter feeding cladoceran) as the
organism for my study for a number of reasons. Daphnia
PU1 ex is present in Lake Mead throughout the entire year,
which allowed a full year study with a single species.
Thus, I avoid having to compare growth and reproduction in
different species, which may have quite different
responses to seasonal changes in the phytoplankton.
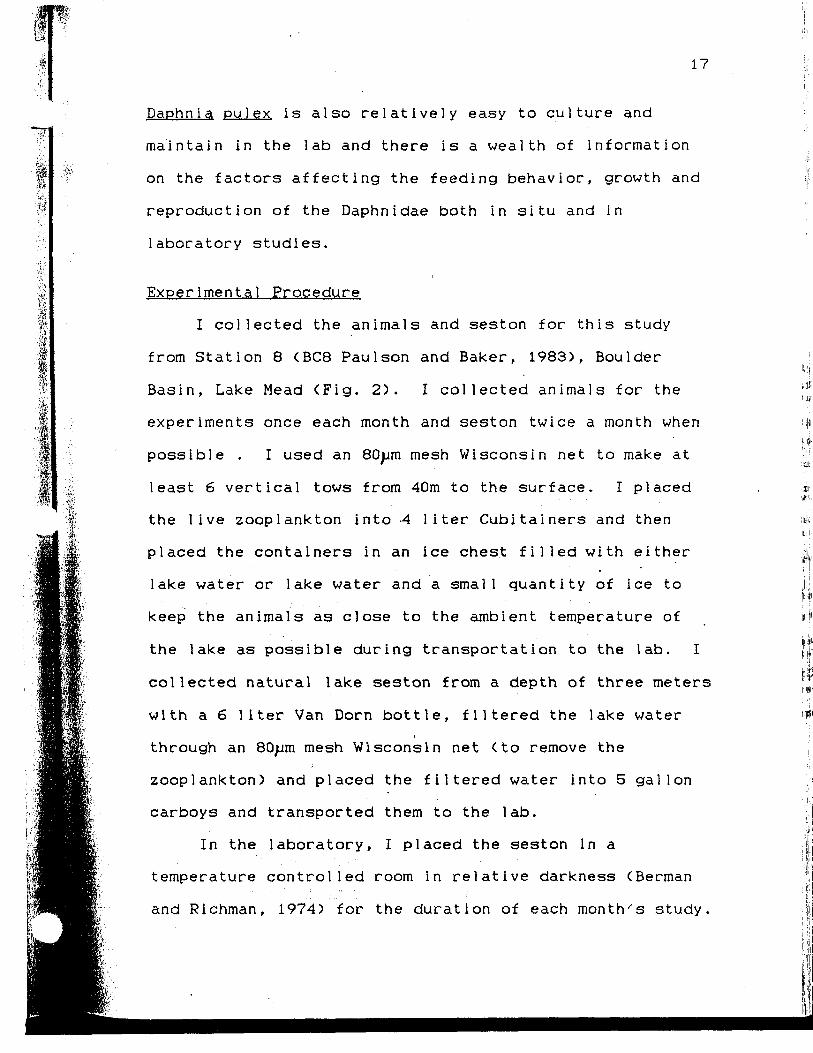
Daphn i a PU1 ex is also relatively easy to culture and
maintain in the lab and there is a wealth of information
on the factors affecting the feeding behavior, growth and
reproduction of the Daphnidae both in situ and in
laboratory studies.
Experimental Procedure
I collected the animals and seston for this study
from Station 8 <BC8 Paulson and Baker, 1983), Boulder
Basin, Lake Mead (Fig. 2). I collected animals for the
experiments once each month and seston twice a month when
possible . I used an 80jam mesh Wisconsin net to make at
least 6 vertical tows from 40m to the surface. I placed
the live zooplankton into -4 liter Cubitainers and then
placed the containers in an ice chest fi l l e d with either
lake water or lake water and a small quantity of ice to
keep the animals as close to the ambient temperature of
the lake as possible during transportation to the lab. I
collected natural lake seston from a depth of three meters
with a 6 liter Van Dorn bottle, filtered the lake water
through an 80jjm mesh Wisconsin net (to remove the
zooplankton) and placed the filtered water into 5 gallon
carboys and transported them to the lab.
In the laboratory, I placed the seston in a
temperature controlled room in relative darkness (Berman
and Richman, 1974) for the duration of each month's study.

18
I aerated the carboys containing the lake water gently in
the hope that it would prolong the useful l i f e of the
seston. I filtered one carboy of the lake water through
0.45 im <HA) Millepore filters to remove a l l algae and
detritus from the water. Before removing water for
feeding suspensions, the carboys s t i l l containing seston
were gently shaken to resuspend any settled seston.
For each monthly run, I fed groups of animals on the
following 4 food regimes: Chamber 1, 80/am filtered lake
water containing natural nannoplanktonic seston; Chamber
2, lake water as in Chamber 1 plus an additional 103
cells-ml"1 o'f Chi amvdomonas reinhardt i ; Chamber 3, lake
water as in Chamber 1 and an enrichment of lO^cells' ml"1
of C.reinhardti ; and Chamber 4 animals were fed on 0.45}jm
HA Millipore filtered lake water and 105 cells- ml"1 C.
reinhardt i. I chose an enrichment concentration of 10^
cells- ml"1 because based on chlorophy11-a concentrations
in the lake during 1981, this regime should approximately
double the amount of food available to the animals. I
chose 10^ cellS'ml"1 because this concentration is above
the incipient limiting food concentration for Daphnia
pu1 ex (P.L. Starkweather personal communication ), and
young animals fed at this concentration should not be food
limited. There has been some question as to the
suitability of Ch1amvdomonas reinhardt i as food for
Daphnia pulex (Taub and Dollar 1968) but this idea has
19
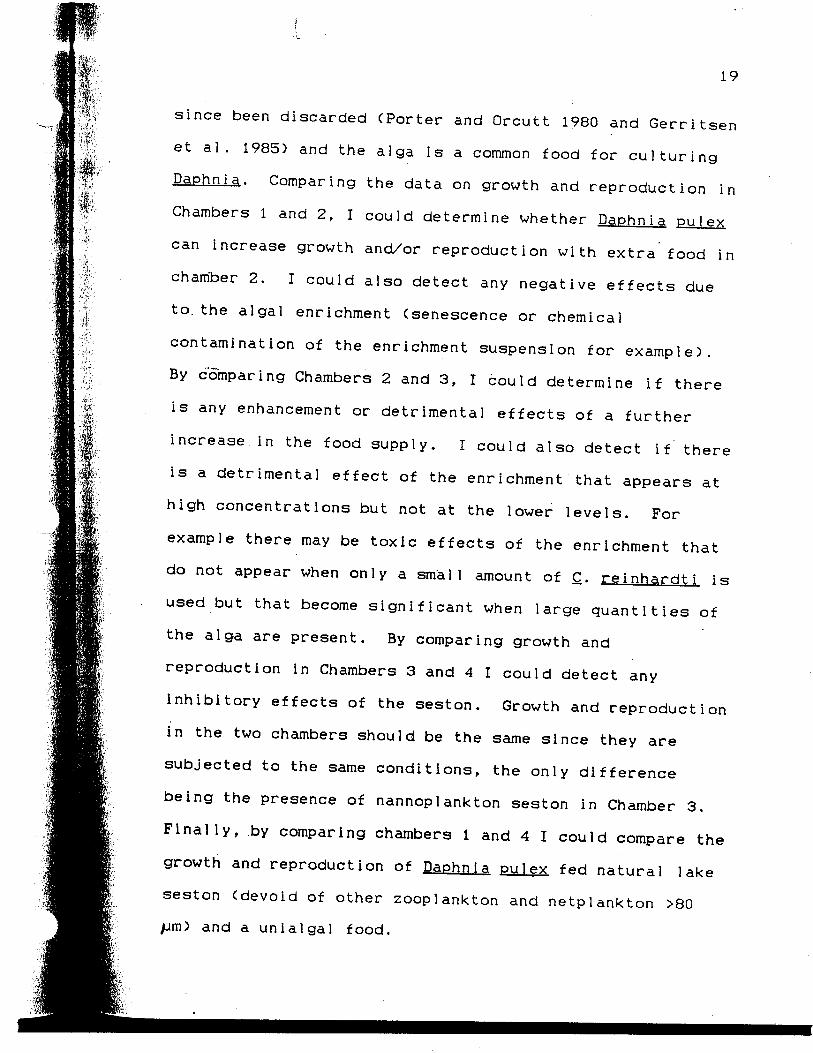
since been discarded (Porter and Orcutt 1980 and Gerritsen
et al. 1985) and the alga is a common food for culturing
Daphn i a. Comparing the data on growth and reproduction in
Chambers 1 and 2, I could determine whether Daphn i a pu1 ex
can increase growth and/or reproduction with extra food in
chamber 2. I could also detect any negative effects due
to. the algal enrichment (senescence or chemical
contamination of the enrichment suspension for example).
By comparing Chambers 2 and 3, I could determine if there
is any enhancement or detrimental effects of a further
increase in the food supply. I could also detect if there
is a detrimental effect of the enrichment that appears at
high concentrations but not at the lower levels. For
example there may be toxic effects of the enrichment that
do not appear when only a small amount of C_. rei nhardt i is
used but that become significant when large quantities of
the alga are present. By comparing growth and
reproduction in Chambers 3 and 4 I could detect any
inhibitory effects of the seston. Growth and reproduction
in the two chambers should be the same since they are
subjected to the same conditions, the only difference
being the presence of nannoplankton seston in Chamber 3.
Finally, by comparing chambers 1 and 4 I could compare the
growth and reproduction of DaphnI a pulex fed natural lake
seston (devoid of other zooplankton and netplankton >80
jum) and a unialgal food.

20
it1i
I
For each experiment, I separated the Daphnia sp. from
the other zooplankton in the sample and removed only the
smallest individuals for use in the experiments. When
delays occurred in starting the experiments, the animals
were kept from starving by additions of C. reinhardt i.
Whenever possible I tried to use animals less than imm in
length. I used 40 animals for each experiment, 10 in each
chamber. If forty animals of suitable size were not
available, gravid females from the rest of the sample were
isolated until their next molt. These neonates were then
pooled with the other juveniles. When sufficient total
young were present, I removed each one using a wide mouth
pipette and placed it in a well slide for observation. I
removed most of the water from around the animal to
immobilize it and examined it to make sure that it was a
female Daphnia pulex (Brooks 1953). After measuring its
length from the top of the helmet to the base of the
caudal spine with an ocular micrometer, I placed the
animal into its appropriate 500 ml feeding chamber.
Arnold (1971) found that this,technique did not affect the
subsequent behavior of the animals.
After separating the animals, I prepared the feeding
suspensions. I established, prior to collection of
samples, an axenic culture of Chlamvdomonas reinhardt i in
the lab. I suspended cultures between 6 and 14 days old
in 0.45/jm <HA) Millepore filtered lake water. I then
.'!*«
;' j
II i ij
3jrLf
uJJIIK
1
I>i«l i i
I
21
placed the algae in a 125ml Erhlenmyer flask with a
magnetic stirrer to facilitate the breakup of algal
clumps. After there were no visible clumps left I passed
the suspension through a 20/jm Nitex filter mesh and a
small sample was counted in an electronic particle counter
to determine the number of cells (or small cell clusters)-
ml"1. The resulting value was then used to determine the
necessary dilutions to give the final feeding
concentrations. Four liters of each feeding suspension
were then placed in separate plastic Cubitainers and were
continuously and vigorously aerated with aquarium bubblers
to keep the algae suspended and the water well oxygenated.
The flow-through 'feeding apparatus I used for the
experiments (Figure 3) is similar to that used by Hampert •
(1975). No water bath was used but I kept the entire
apparatus in a temperature controlled room. I connected
all -4 food reserviors and feeding chambers through one,
four-channel peristaltic pump. I calibrated the pump to
provide a flow rate of 1 liter per day to each chamber so
that the entire contents of each chamber would be replaced
twice each day. I screened both the inlets and outlets of
each 500ml feeding chamber with 80um Nitex mesh to keep
the Daphnia in the chambers. I removed the animals from
the chambers three times a week to take measurements. I
took length measurements for each animal and counted the
number of eggs present (if any). I removed and counted

1=4 LITER FDDD RESERVDIR8=AERATDR
3=PERISTALTIC PUMP4=INLET5=DUTFLDV6=500 ml FEEDING CHAMBER7=CARDBDARD SLEEVE8=LIGHT SOURCE
EXPERIMENTAL APPARATUS
Figure 3. Diagram of flow-through feeding apparatus.tv>

23
any neonates present in each chamber. I then placed the
animals, in clean chambers with their proper food medium.
Any dead animals were given a final length measurement,
examined for signs of trauma and discarded. After a l 1 the
measurements were completed al l the chambers were
reconnected and the pump restarted. On average the entire
process of measurements caused an interruption of flow to
the chambers for 2 hours. I illuminated the chambers with
two fluorescent lamps at an intensity of 300 lux and
covered each chamber with a cardbord sleeve so that light
would enter only at the top of each chamber and not the
sides. In this way I hoped to minimize behavioral
abberations in the animals caused by their orientation to
the light source (Young et al . , 1984). To maintain
conditions in the lab as close to those in the lake as
possible, I adjusted the temperature and photoperiod
weekly (when necessary) to match conditions in the lake
(Table 1). Due to the limits of the timer for controlling
the lights, changes to the Light/Dark cycle were made in
15 minute increments. As noted above, I tried to collect
fresh lake water every two weeks when possible. This was
done so that during experiment the animals would be
exposed to the natural changes in the seston of the lake.
But sometimes, I only used one collection of seston for
the duration of that month's experiment (see Table 1).
24
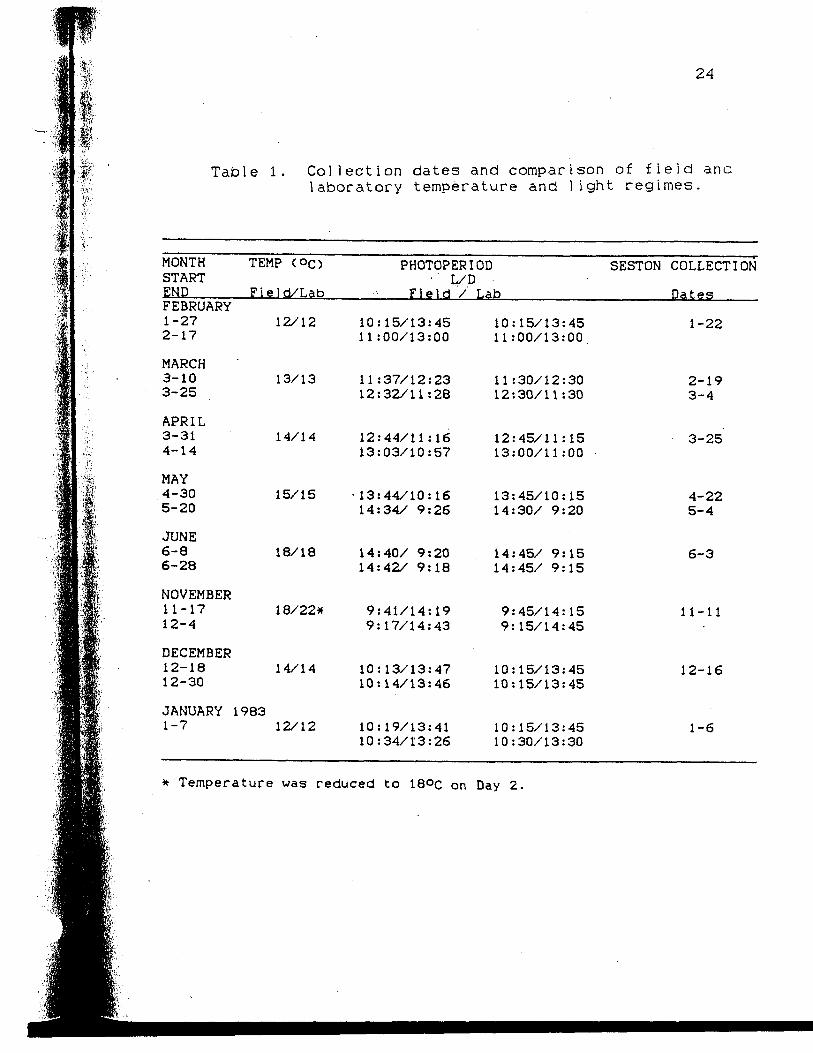
Table 1. C o l l e c t i o n dates and comparison of f i e l d analaboratory temperature and l i g h t regimes .
MONTHSTARTENDFEBRUARY1-272-17
MARCH3-103-25
APRIL3-314-14
MAY4-305-20
JUNE6-86-28
NOVEMBER11-1712-4
DECEMBER12-1812-30
JANUARY1-7
TEMP (°C>
Field/Lab
12/12
13/13
14/14
15/15
18/18
1 8/22*
14/14
198312/12
PHOTOPERIODL/D
Field / Lab
10:15/13:4511:00/13:00
11:37/12:2312:32/11:28
12:44/11:1613:03/10:57
• 13:44/10:1614:34/ 9:26
14:40/ 9:2014:42/ 9:18
9:41/14:199:17/14:43
10:13/13:4710:14/13:46
10:19/13:4110:34/13:26
10:15/13:4511 :00/13:00
11 :30/12:3012:30/11:30
12:45/11:1513:00/11:00
13:45/10:1514:30/ 9:20
14:45/ 9:1514:45/ 9:15
9:45/14:159:15/14:45
10:15/13:4510:15/13:45
10:15/13:4510:30/13:30
SESTON COLLECTION
Dates
1-22
2-193-4
3-25
4-225-4
6-3
11-11
12-16
1-6
Temperature was reduced to 18°c on Day 2.

ftt
25
I ran the experiments until all the animals in one
chamber were dead, there was no more lake seston or
Chiamvdomonas left for feeding or to prepare for the next
month's experiment, whichever came first, I ran one
experiment each month starting with the collection of
animals on January 22, 1982 and terminated the last
experiment on January 23, 1983. For a complete listing of
the temperatures, L/D cycles and experimental deviations,
see Tables 1 and 2.
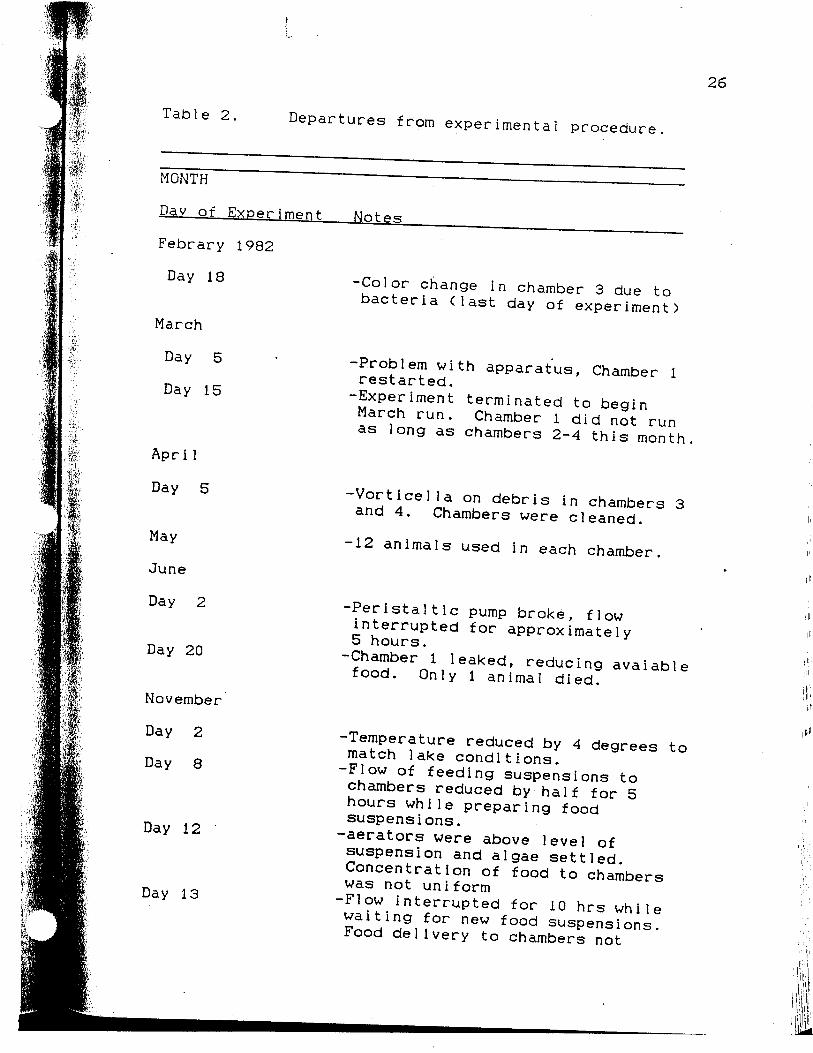
Table 2. Departures from experimental procedure
MONTH
Day of Experiment Notes
Febrary 1982
Day 18
March
Day 5
Day 15
Apri 1
Day 5
Color change in chamber 3 due tobacteria (last day of experiment)
Problem with apparatus, Chamber 1restarted.Experiment terminated to beginMarch run. Chamber 1 did not runas long as chambers 2-4 this month
Vorticella on debris in chambers 3and 4. Chambers were cleaned.
November
Day 2
Day 8
26
-12 animals used in each chamber.
Peristaltic pump broke, flowinterrupted for approximately5 hours.Chamber 1 leaked, reducing avaiablefood. Only 1 animal died.
-Temperature reduced by 4 degrees tomatch lake conditions.-Flow of feeding suspensions tochambers reduced by half for 5hours while preparing foodsuspensions,-aerators were above level ofsuspension and algae settled.Concentration of food to chamberswas not uniform-Flow interrupted for 10 hrs whilewaiting for new food suspensions.Food delivery to chambers not

.«•
1
*At
M
4
December
Day 8
Day 9
January 1983
Day 8
Day 10
27
uni form.
-Flow reduced by half for 4 hourswhile preparing new foodsuspensi ons.-Flow interrupted for 3.5 hours dueto power outage.
-Flow interrupt for over 20 hrs dueto broken peristaltic pump.-Flow interrupted for 5 hours whilepreparing food suspensions.
28
RESULTS
Food Supp1v
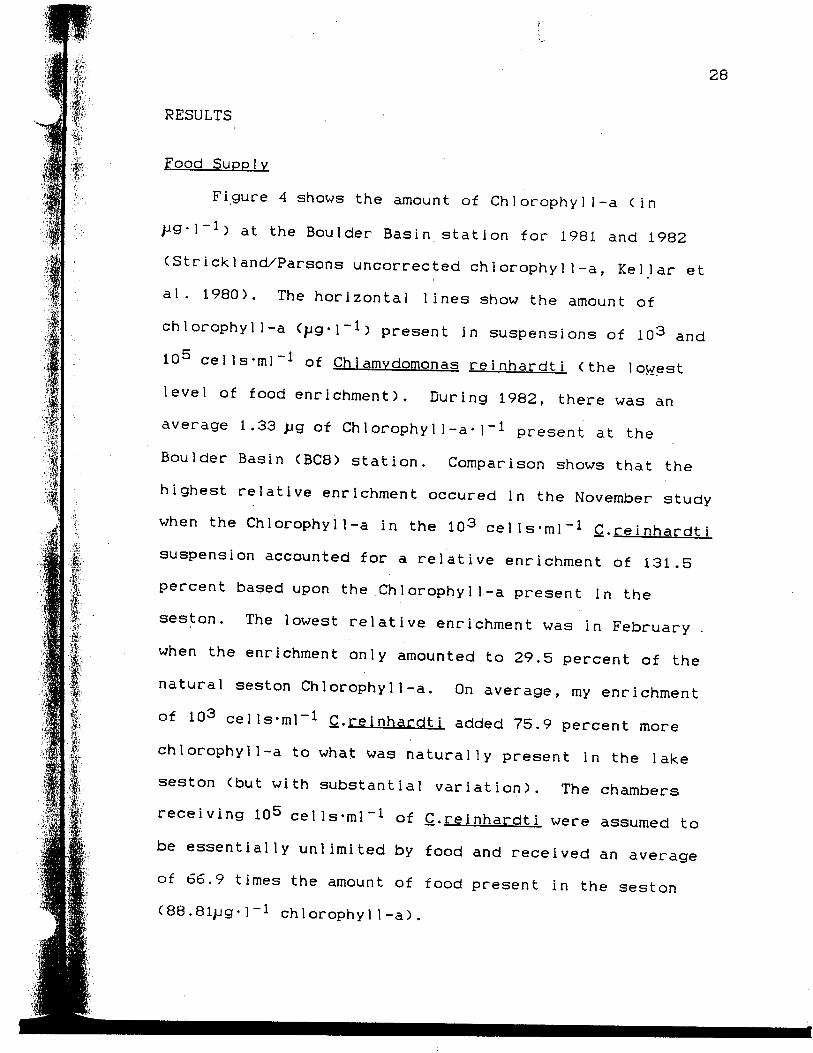
Figure 4 shows the amount of Ch]orophy11-a (in
y-ig-l"1) at the Boulder Basin, stat i on for 1981 and 1982
(Strickland/Parsons uncorrected chlorophy11-a, Kellar et
al. 1980). The horizontal lines show the amount of
ch 1 orophy 1 1-a (jjg-1"1) present in suspensions of 103 and
105 cells-mi"1 of Ch1amvdomonas rei nhardt i (the lowest
level of food enrichment). During 1982, there was an
average 1.33 pg of Chlorophy11-a-1-1 present at the
Boulder Basin (BC8) station. Comparison shows that the
highest relative enrichment occured in the November study
when the Chlorophyl 1-a in the 103 cells-mi"1 C.reinhardt i
suspension accounted for a relative enrichment of 131.5
percent based upon the Chlorophy11-a present in the
seston. The lowest relative enrichment was in February .
when the enrichment only amounted to 29.5 percent of the
natural seston Chlorophyl1-a. On average, my enrichment
of 103 cells-mi"1 C.reinhardti added 75.9 percent more
chlorophyl 1-a to what was naturally present in the lake
seston (but with substantial variation). The chambers
receiving 10^ cells-mi"1 of C.reinhardti were assumed to
be essentially unlimited by food and received an average
of 66.9 times the amount of food present in the seston
chlorophyl 1-a).

<10) CELLS -ore. REINHARTI
<10>3 CELLS-nflC. REINHARTI
I 1 1 1 1 1 1J F M A M J J A S D N D
TIME <MDNTHS>
CHLQRDPHYLL-A CDNCENTRATIDNSIN BDULDER BASIN DURING1981 & 1982
Figure 4. Concentration of chlorophy11-a in Boulder Basinduring 1981 and 1982. -o
;.;.:,:: - .feasssBasssWsS -i.-.ii-.'ti- J-.--.-;.-:-•-•-»- -i*7* -*-=*rfTSirr»s3S iiai:-s&jSri-iS.-Jer= -isna --«i-*

a
:1 ': !.
"w
30
Explanation of Figures and Tables
Figures 5,6 and 7 show the survivorship over time for
treatment and each experimental run. Included in the
graphs are decreases due to animals lost and those that
were discovered to be males. I did not consider them to
be mortalities for stastistical tests, but the decrease in
the number of animals in each chamber is noted in the
figures. Each month, I tested the hypotheses: Ho=
survivorship is constant over the course of the experiment
in each chamber and Ho= survivorship is the same in a l l
four treatments. For this I used a Kolmogorov-Smirnov
.goodness of fit analysis with a level of significance 5
percent (Zar 1974). I did this to check for differences
in mortality that might be due to collection trauma (high
mortality at the beginning of the experiment, l i t t l e or
none thereafter), due to the treatments (food-limited
animals starving) or toxic effects due to contamination of
the feeding suspensions.
Figures 8,9 and 10 show the increase in average body
length over time for each experimental treatment (± 1
standard error). To correct for differences in average
initial length of the animals in each of the four
treatments, I subtracted the average i n i t i a l length for
the animals in a given chamber from all subsequent average
length determinations for that chamber. Therefore, Figure
4 (and subsequent figures) show the increase in average

31
length above the average i n i t i a l length (0 on the graphs)
for each treatment. I feel that this technique allows
easier comparisons of growth in the chambers. Especially
in those months when there was a significant difference in
the average i n i t i a l lengths of the animals in the four
treatments. I used a single factor analysis of variance
(One-Way ANOVA) with a 5 percent level of significance to
test if there was a significant difference in the i n i t i a l
lengths of the animals (Zar 1974).
Figures 11, 12 and 13 show the average number of
neonates produced per female, per day (#-$~"^ -d~^ ). For
the months of April 1982, December 1982 and January 1983
the number of neonates produced was extremely low. To
better illustrate reproductive activity, I plotted these
months as the number of eggs per female per day (#• $-1
.d~~l>. Days where data were unavaiable are marked with
breaks in the graph lines.
Table 1 lists the starting and ending dates for the
experiments, temperature in the field and the temperature
used in the lab runs and dates of seston collections.
Also listed are the natural light/dark cycle and the
approximation used in the lab. Table 2 lists deviations
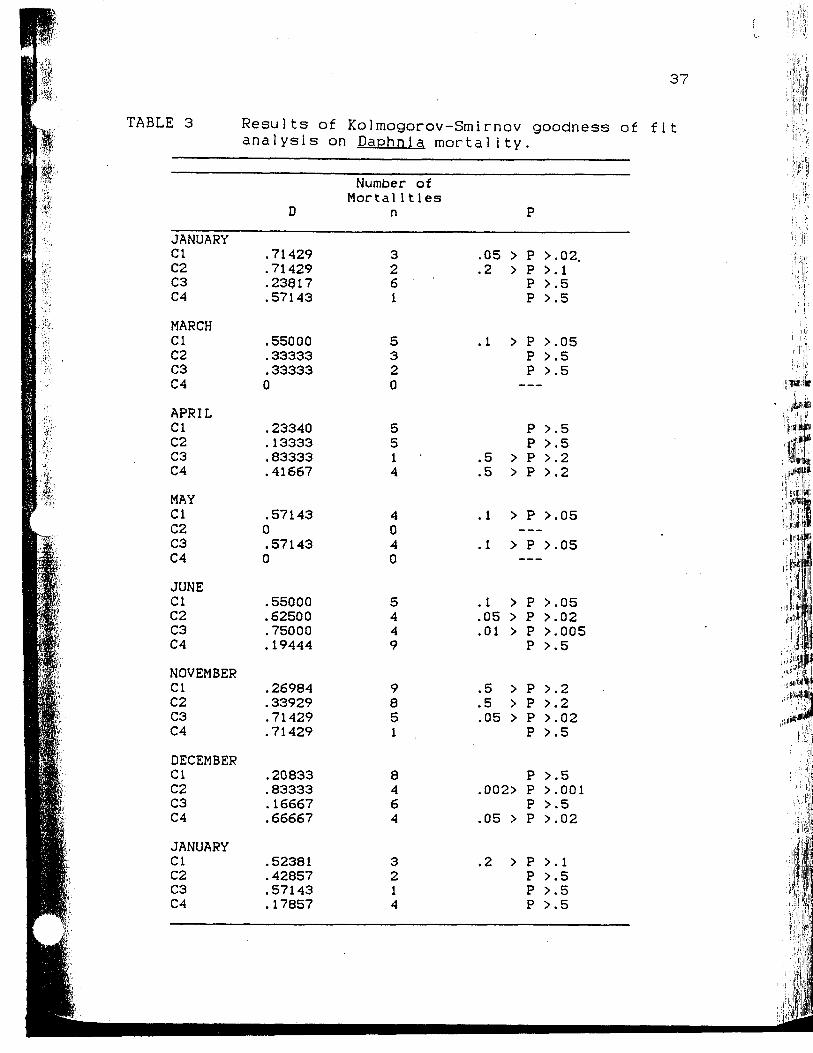
from the established methods during each month. Table 3
list the results of Kolmogorov-Smirnov goodness of fit
analysis testing Ho: mortality is constant over the
duration of the experiment in a given chamber.
32
Patterns In Survivorship
I examined the patterns of survivorship over the
eight experiments to see if there were any significant
differences in the timing of mortalities or the amount of
mortality in a given treatment. The pattern of
survivorship seen in a given chamber or within a given
treatment provides clues to the cause of the mortality.
When many animals die at the beginning of the experiment,
mortality is most likely due to trauma to the animals
during collection and sorting. If the animals in the lake
were already in poor condition due to an inadequate food
supply, trauma during collection would be even more likel y
to result in early deaths among the experimental animals.
Many deaths among the animals towards the end of the
experiment might be due to toxic effects of senescent
algae in the food enriched regimes, or due to decreasing
food quality of the collected seston over time.
Mortalities not due to either the food regimes or
collection trauma should be randomly distributed over the
course of the experiment.
I used a Kolmogorov-Smirnov goodness of fit analysis
(Zar 1974) and a Heterogenity Chi-square analysis (Zar
1974) to test the null hypothesis: The amount of mortality
in each treatment (C1-C4) was the same. Neither test
showed any significant difference between the four
treatments, Kolrnogorov-Smi rnov (overall), D=.09426 n=122

33
.5> P >,2 ; Chi-square(heterogenetity>X2=28.105 d.f.21
.25> P >.!.: Chi-square(pooled) "X2=6.459 d.f.=3 .i> P
>.05. I next tested the n u l l hypothesis: The mortality in
each month of my study is constant within a given
treatment (in chamber 1 , mortality in January = February
= March, etc.). There was no significant difference in
any treatment except chamber 4, (Chamber 1, D=.10H9 n=42
P > .5; Chamber 2, D=.14286 n=28 P > .5; Chamber 3,
D=.09052 n=29 P > .5; Chamber 4, D=.28261 n=23 .05> P
>.02). In the December run, chamber 4, a l l mortality
occured in the first 4 days of the experiment after which
there were no mortalities in that chamber. In March and
May, there was no mortality at all (the decreased numbers
in the figures are due to missing animals). The other
months showed no significant changes in mortality over
time (see Table 3).
A Kolmogorov-Smirnov goodness of fit test (Zar 1974)-
on the survivorship curves for the February run showed no
significant difference in the survivorship of the animals
in the 4 treatments (D=.16667, n=12, P>.05). Testing
H0:Mortality is constant over the duration of the
experiment in a given chamber with a Kolmogorov-Smirnov
test for goodness of fit, I found that mortality was not
constant over the course of the experiment in Cl
(D=.71429, .02<P<.05 ). All mortality occurred in the
last 5 days of the- experiment and may have been due to low

flp
34
food value of the seston since the lake water was 3 weeks
old by this time (Fig. 5). There were no significant
changes in mortality over time in the other chambers
(Table 3).
Figure 5 shows the survivorship curves for the March
experiment. There were no significant differences in
survivorship either between the treatments (D=.30000.
n=10, .5> P>.2> or within the chambers over the course of
the experiment (Table 3).
Survivorship curves for April are shown in Figure 5.
I found no significant differences in the survivorship
over the course of the experiment in any of the treatments
(Table 3). Neither is there any significant difference
between the treatments (D=.16667, n=15, P>.Q5).
Analysis of survivorship (Fig.6) for May showed no
significant differences within the chambers over time
(Table 3). Kolmogorov-Smirnov goodness of fit showed no
significant difference in the amount of mortality between
the 4 treatments (D=.25, n=8, .5> P>.2). A heterogeneity
Chi-square analysis (Zar 1974) did show a significant
difference (7C.2-8.000 d.f.=3 <7.815 a=0.05). This is the
only month that a Heterogeneity Chi-square analysis found
a significant difference in the survivorship in the four
treatments (all X.2 calcualat ions at the 5 percent level
of significance with 3 d.f.J. Chambers 2 and 3 did show a
decrease in survivorship in the period just after the new

35
9*
Figure 5. Survivorship curves for February, March andApril 1982.
OMMK* 1-CHMKR 2-OMHKR 3>CHMKX 4- O
FEBRUARY
SURVIVORSHIP OF D. PULEX
CHMOClt i-OMMKR t-CHMKR IfOUHKll 4-
MARCHSURVIVORSHIP OF D. PULEX
Milm i
-111:m
ImMM':B I

36
;*CHAMBER 1» WCHAMBER 2= • ICHAMBER 3' AICHAMBER 4« Q
Z 3 4 3 6 7 8 9 10 11 12 13 14 13 16 17 18 19 20 21
TIME (DAYS)
MAY
SURVIVORSHIP DF D. PULEX
11 12 13 14 IS 16 17 18 19 20 215 6 7 8 9
TIME <DAYS)
CHAMBERCHAMBER 2* • ORCHAMBER 3° A ORCHAMBER 4= O
JUNESURVIVORSHIP OF D. PULEX
Figure 6. Survivorship curves for May and June 1982,
\-f-m
II
- i
37
TABLE 3 Results of Kolmogorov-Smirnov goodness of fitanalysis on Daphnia mortality.
\r of
Mortal itlesD n
JANUARYClC2C3C4
MARCHClC2C3C4
APRILClC2C3C4
MAYClC2C3C4
JUNEClC2C3C4
NOVEMBERClC2C3C4
DECEMBERClC2C3C4
JANUARYClC2C3C4
.71429
.71429
.23817
.57143
.55000
. 33333
. 333330
. 23340
.13333
. 83333
.41667
.571430.571430
.55000
.62500
.75000
.19444
.26984
. 33929
.71429
.71429
.20833
.83333
.16667
.66667
.52381
. 42857
.57143
.17857
3261
5320
5514
4040
5449
9851 ,
8464
3214
.05 >
.2 >
.1 >
.5 >
.5 >
.1 >
.1 >
.1 >
.05 >
.01 >
.5 >
.5 >
.05 >
,002>
.05 >
.2 >
P
P >P >P >P >
P >P >P >
P >P >P >P >
P >
P >
P >P >P >P >
P >P >P >P >
P >P >P >P >
P >P >P >P >
.02.
. i
.5
.5
.05
.5
.5
.5
.5
.2
.2
.05
.05
.05
.02
.005
.5
.2
.2
.02
.5
.5
.001
.5
.02
. l
.5
.5
.5
M

II
38
lake seston was first used. The link between the seston
and the mortality in chambers 3 and 4 is not clear since
survivorship in chambers 1 and 4 were not affected.
Chamber 1 should have been more succeptible to seston
changes since it does not have the buffering effect of
extra food. If the effect was due to the enrichment food,
chamber 4 should have been the most affected. If the
effect were due to water chemistry all chambers should
have been affected.
I found that survivorship in June was significantly
different (Table 3) in Chambers 2 and 3 over the 20 day
run of the experiment, with most of the mortality
occurring in the first 5 days of the experiment (Figure
6). I did not find any significant difference in
survivorship between the four chambers (D=.15909, n=22,
Examining the November survivorship data (Fig. 7) I
found that mortality increased dramatically after Day 6.
This constant loss of large animals depressed the average
length in chamber 1 and kept the total increase in body
length low. Death of individual animals occured in
chamber 1 until Day 17 when I found 3 dead animals in the
chamber and the last, obviously dying. The mortality was
not due to any physical damage that I could detect. I
found that the animals in chamber 2 showed a pattern of
growth and mortality similar to that in chamber 1. I also

39
1 2 3 4 3 4 7 8 » 10 11 12 13 14 13 16 17 18 19 M
TIME (DATS)
CHAMKR 1' ©CHAMBER 2- • ORCHAMKR 3- ADRCHAHKR 4- O
NOVEMBERSURVIVORSHIP OF D. PULEX
CHAMKR 1'CHAMKR !!•CHAMKR 3»CHAMKR 4-
DECEMBERSURVIVORSHIP DF D. PULEX
1 2 3 4
CHAMKR 1-CHAMKR 2-CHAMKR 3-CHAMKR 4-
3 t 7 t » 10 U 12 13 14 13 1* 17 18 1» 20 H
TINE (DAYS)
JANUARY
SURVIVORSHIP OF D. PULEX
Figure 7. Survivorship curves for November, December 1982and January 1983.
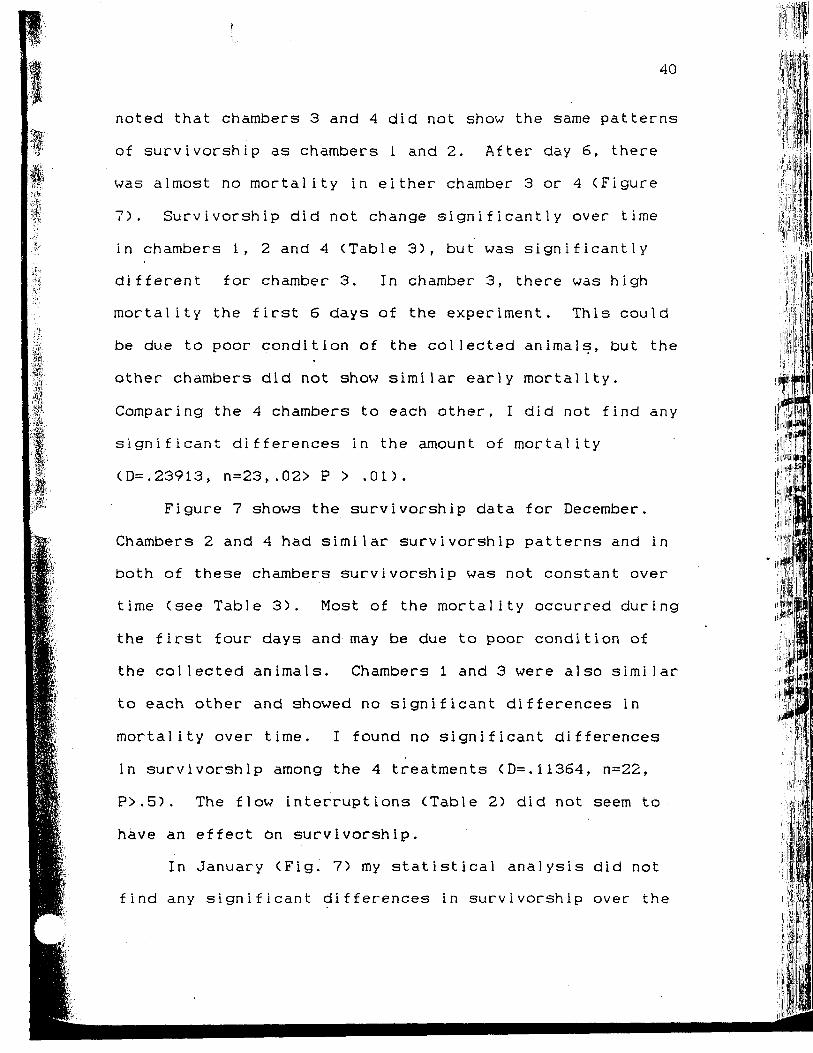
40
noted that chambers 3 and 4 did not show the same patterns
of survivorship as chambers 1 and 2. After day 6, there
was almost no mortality in either chamber 3 or 4 (Figure
7). Survivorship did not change significantly over time
in chambers 1, 2 and 4 (Table 3), but was significantly
different for chamber 3. In chamber 3, there was high
mortality the first 6 days of the experiment. This could
be due to poor condition of the collected animals, but the
other chambers did not show similar early mortality.
Comparing the 4 chambers to each other, I did not find any
significant differences in the amount of mortality
(D=. 23913, n=23,.02> P > .01).
Figure 7 shows the survivorship data for December.
Chambers 2 and 4 had similar survivorship patterns and in
both of these chambers survivorship was not constant over
time (see Table 3). Most of the mortality occurred during
the first four days and may be due to poor condition of
the collected animals. Chambers 1 and 3 were also similar
to each other and showed no significant differences in
mortality over time. I found no significant differences
in survivorship among the 4 treatments (D=. 11364, n=22,
P>.5). The flow interruptions (Table 2) did not seem to
have an effect on survivorship.
In January (Fig. 7) my statistical analysis did not
find any significant differences in survivorship over the
f
•:

41
?
course of the experiment (Table 3) or in the mortality
between the treatments (D=.15, n=10, P>.5>,
Survivorship was variable in the a l l treatments and
showed no discernible pattern within a month or season.
In most of the experiments, there was no significant
difference in the amount of mortality over time (Table 3).
This is probably due to the small sample sizes of only
10-12 individuals per treatment. Changes in mortality
that might be important, do not test as statistically
si gn i f i cant .
Growth
The growth of Daphn i a pu 1 ex for each of the four
treatments in the eight experimental runs are shown in
Figures 8, 9 and 10. In every experiment, the animals fed'
the 105 cells- ml"1 enrichment (chambers 3 and 4) showed
substantially more growth than the animals fed only lake
seston (chamber 1). I found similar results with the 103
cells- ml"1 enrichment, but the increase in growth was
considerably less. I expected this because there is a 100
fold difference in the enrichment (based on ch 1 orophy 1 1 -a
concentrations) between chambers 2 and 3.
In chambers 1 and 2, there was very l i t t l e difference
in the amount of growth during the winter runs (February
and December 1982, January 1983, Figures 8 and 10). I
expected growth in chamber 2 to be higher than in chamber
! "

42
m•I
1 because of the enrichment. During February 1982, levels
of ch1orophy11-a in Boulder Basin were at their highest
point (Fig.4). During this month, the 10-^ c e l l s - ml"* of
Ch1amvdomonas re inhardt i provided a relative enrichment of
less than 30 percent, which was not enough to enhance the
growth of D.- PU lex. In December, the animals in chamber 2
showed better growth than those in chamber 1, except at
the very end of the experiment. The large error bars for
chamber 1 on Day 12 are due to a difference in size of
over 0.5 mm between the two surviving individuals.
Overall, growth in Chamber 2 seems to be better than that
in Chamber 1, but it is not significant due to the large
variation in the length of the animals in Chamber 1
(F=2.05 d.f.=l,6 .25>P>.1). In January, chamber 1
actually shows more growth than chamber 2 during the first
two-thirds of the experiment. Mortality among large
individuals does not account for the slower growth in
Chamber 2. Senescence of the Chiamvdomonas is also
unlikely since growth in all regimes receiving enrichment
should have been affected, and chamber 3 showed no such
effect. A possible explanation is that the chamber was
contaminated by improper cleaning.
In the March experiment <Fig. 8), drawing conclusions
that growth is better in chamber 2 than in chamber 1 must
be made carefully. Because of problems with the
apparatus, the duration of the experiment was shorter in
11*1
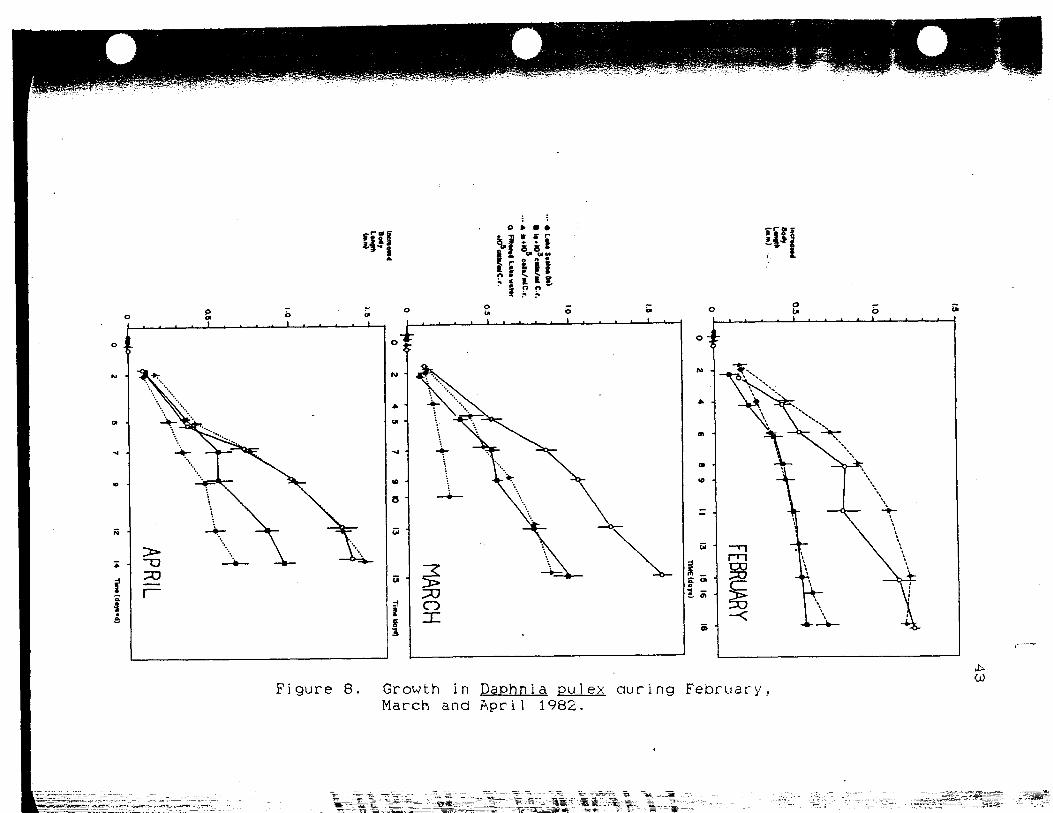
Figure 8. Growth in Daphnia pulex during February.March and April 1982.
44
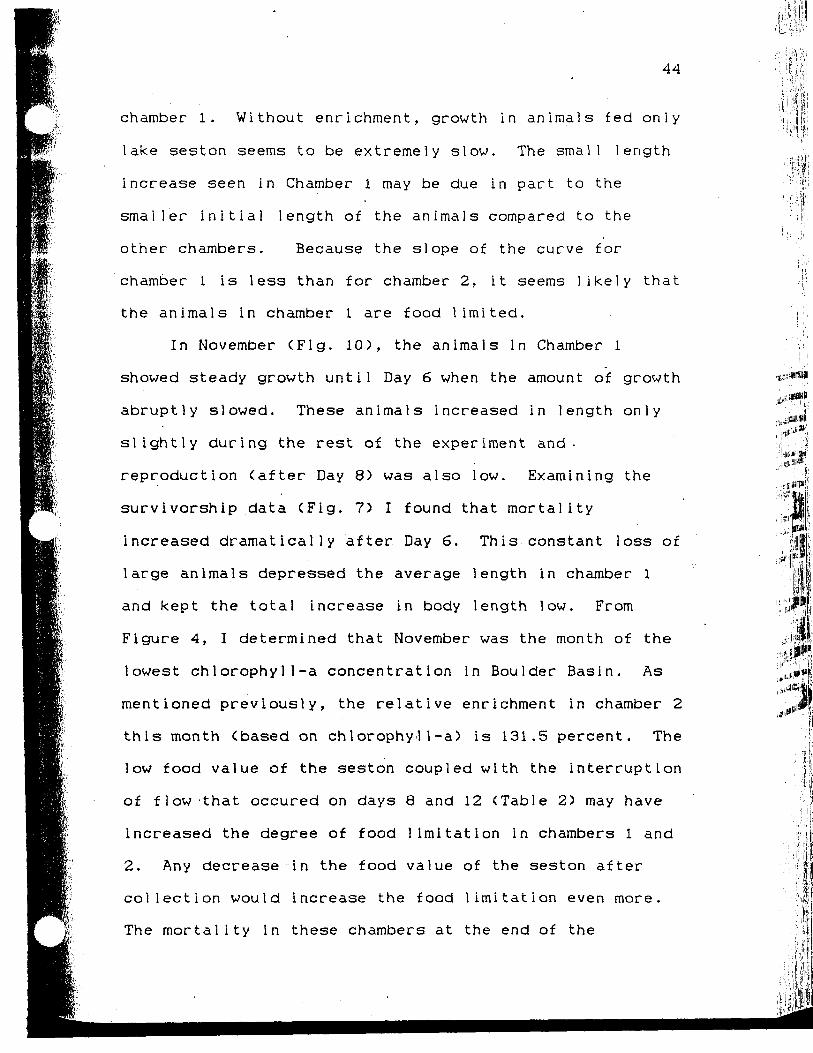
chamber 1. Without enrichment, growth in animals fed only
lake seston seems to be extremely slow. The small length
increase seen in Chamber 1 may be due in part to the
smaller i n i t i a l length of the animals compared to the
other chambers. Because the slope of the curve for
chamber 1 is less than for chamber 2, it seems l i k e l y that
the animals in chamber 1 are food limited.
In November (Fig. 10), the animals in Chamber 1
showed steady growth until Day 6 when the amount of growth
abruptly slowed. These animals increased in length only
slightly during the rest of the experiment and-
reproduction (after Day 8) was also low. Examining the
survivorship data (Fig. 7) I found that mortality
increased dramatically after Day 6. This constant loss of
large animals depressed the average length in chamber 1
and kept the total increase in body length low. From
Figure 4, I determined that November was the month of the
lowest chlorophy11-a concentration in Boulder Basin. As
mentioned previously, the relative enrichment in chamber 2
this month (based on chlorophy11-a) is 131.5 percent. The
low food value of the seston coupled with the interruption
of flow-that occured on days 8 and 12 (Table 2) may have
increased the degree of food limitation in chambers 1 and
2. Any decrease in the food value of the seston after
collection would increase the food limitation even more.
The mortality in these chambers at the end of the
45
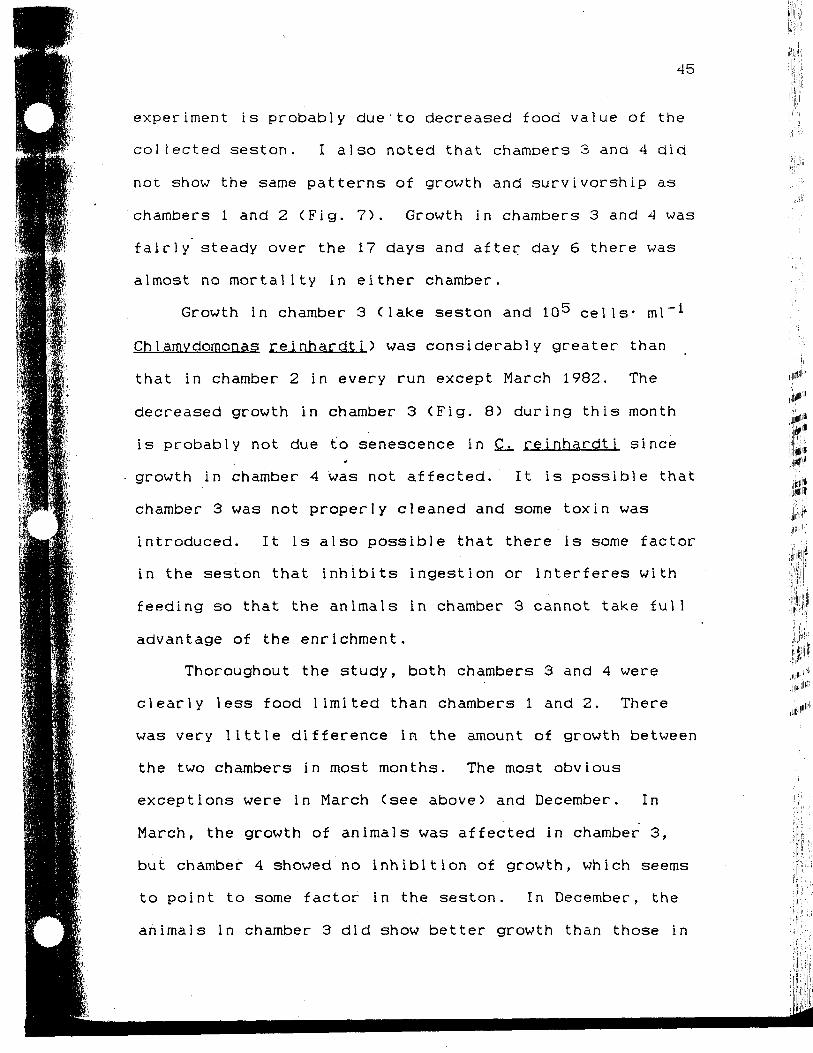
experiment is probably due'to decreased food value of the
collected seston. I also noted that chambers 3 and 4 did
not show the same patterns of growth and survivorship as
chambers 1 and 2 (Fig. 7). Growth in chambers 3 and 4 was
fairly steady over the 17 days and after day 6 there was
almost no mortality in either chamber.
Growth in chamber 3 Clake seston and 10^ cells4 ml~*
Ch1amvdomonas rei nhardt i) was considerably greater than
that in chamber 2 in every run except March 1982. The
decreased growth in chamber 3 (Fig. 8) during this month
is probably not due to senescence in C, reinhardt i since>
growth in chamber 4 was not affected. It is possible that
chamber 3 was not properly cleaned and some toxin was
introduced. It is also possible that there is some factor
in the seston that inhibits ingestion or interferes with
feeding so that the animals in chamber 3 cannot take full
advantage of the enrichment.
Thoroughout the study, both chambers 3 and 4 were
clearly less food limited than chambers 1 and 2. There
was very l i t t l e difference in the amount of growth between
the two chambers in most months. The most obvious
exceptions were in March (see above) and December. In
March, the growth of animals was affected in chamber 3,
but chamber 4 showed no inhibition of growth, which seems
to point to some factor in the seston. In December, the
animals in chamber 3 did show better growth than those in
III!

46
chamber 2, but less than in chamber 4. Th i s-wou 1 d seem to
indicate that there is some factor in the seston that
prevents f u l l use of the enrichment by animals in chamber
3.
During many of the experiments, chamber 3 exhibited*
slightly better growth than chamber 4 i n i t i a l l y , but by
the end of the experiment growth in chamber 4 had equalled
that in chamber 3. The greater final length of the
chamber 3 animals seen in May and June (Fig. 9) are
probably an artifact because so few animals in chamber 4
survived to the end of the experiments. In the May run;
chamber 4 had the fastest growth the first 5 days of the
experiment, but this changed after Day 5 when chamber 3
showed the greatest increase in length. This changeover
corresponds with my use of the newly collected lake
seston. Chamber 1 also shows a similar increase in the
amount of growth, but chamber 2 does not. This may
indicate that either the old seston was losing its food
value or that a change had occurred in the natural lake
seston that increased its food value over that of just
Ch1amvdomonas. Examining Figure 3, I found that
chlorophyl1-a levels were increasing at this time. The
increase in growth from chamber 2 was not as great as in
the other chambers receiving lake seston. It is likely
that the extra energy was used for reproduction
(Arnold,1971>. Growth in chamber 3 was greater than in
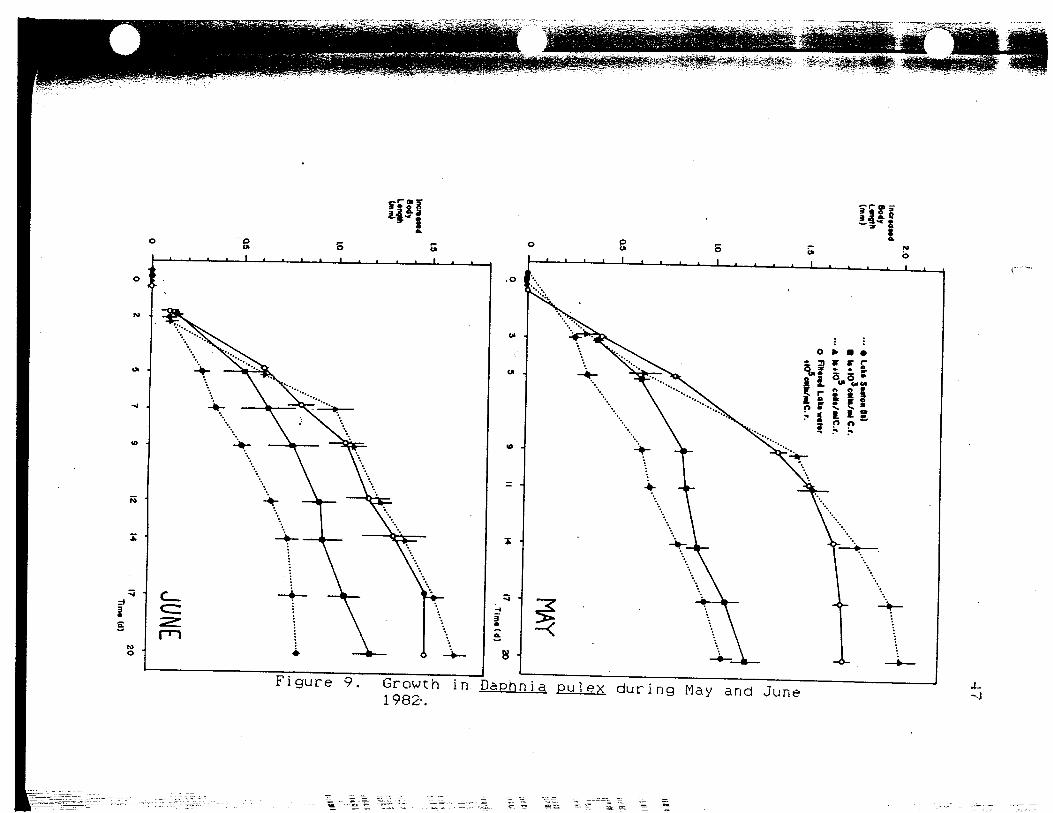
r~T aunf pue A^j 6urjnp xs i nd e"t u
••2861: u i
\- 9.

m48
chamber 4 by the end of the experiment. The lower growth
in chamber 4 .is not an artifact due to mortality (Figure
9). It is probably not due to senescent algae either,
because chamber 3 should have also been affected. It is
possible that for larger Daphnia pulex. 105 celis-ml""- 1 is
no longer a "food unlimited" regime and the extra energy
provided by the seston allows more growth. Alternately,
the seston may provide nutrients that make the regime in
chamber 3 more "complete" and allow better growth.
In January, there are some unusual patterns, not seen
in the previous months (Fig. 10). Chamber 3 shows more
growth than Chamber 4 throughout most of the experiment.
Even more surprising, chamber 4 doesn't exhibit greater
growth than chamber 1 (fed only lake seston) for the first
two-thirds of the experiment! This fact would point to
some toxic effect of the enrichment algae except fot the
fact that chamber 3 does not show a simliar limitation.
It is possible that there might have been something in the
Chiamvdomonas (due to senescence perhaps) that offset the
benefits the extra food present. But if this were the
case chamber 3 should have been affected too. Another
explanation, chambers 2 and 4 may not have been cleaned
properly and they were subject to some chemica-l
contamination. The point for Chamber 3 not included on
the l i n e at Day 11 was due to errors I made measuring the
1*4
1si *ita

49
H> It TMM)
1.8
>M• kilo'MK/MC.r.
-A ««IO' Ml/alC.f.0 >IHra4 Ltt> MM
•«>«WMC.r.
3 5 7 » II 13
F i g u r e 10. Growth in Daphnia pu i ex during November.December 1982 and January 1983.'
50
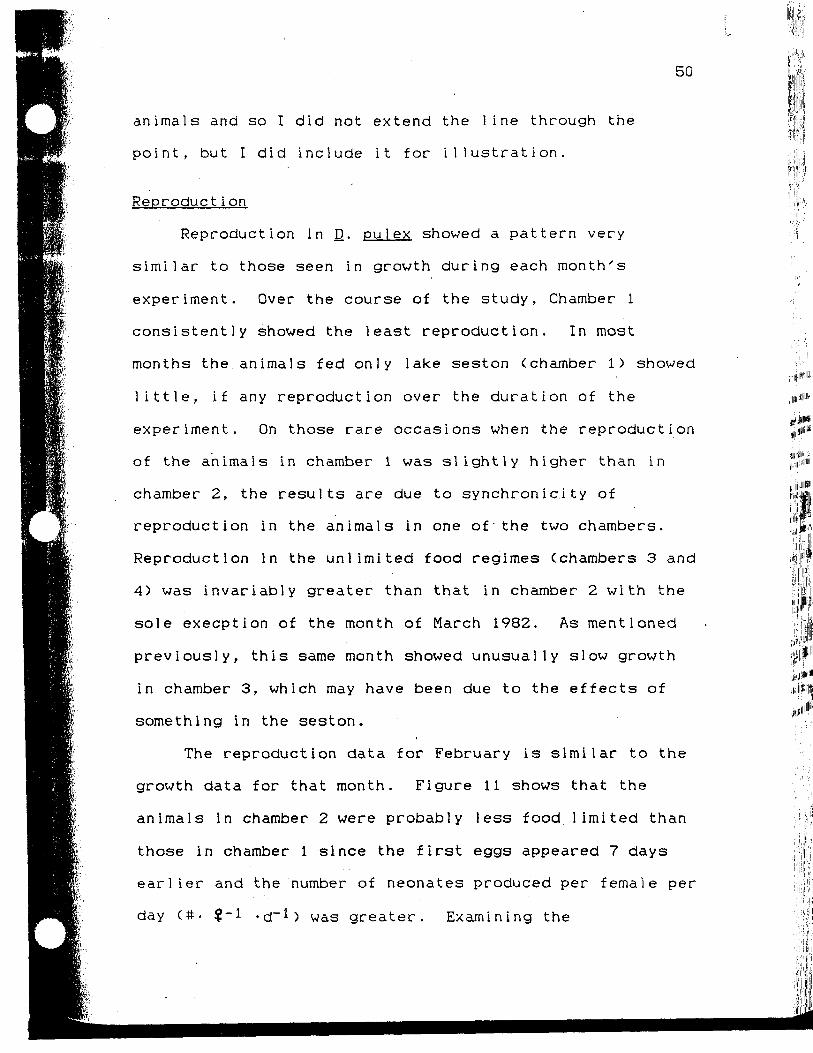
animals and so I did not extend the li n e through the
point, but I did include it for illustration.
Reproduct i on
Reproduction in JD. PU 1 ex showed a pattern very
similar to those seen in growth during each month's
experiment. Over the course of the study, Chamber 1
consistently showed the least reproduction. In most
months the animals fed only lake seston (chamber 1) showed
l i t t l e , if any reproduction over the duration of the
experiment. On those rare occasions when the reproduction
of the animals in chamber 1 was slightly higher than in
chamber 2, the results are due to synchronicity of
reproduction in the animals in one of- the two chambers.
Reproduction in the unlimited food regimes (chambers 3 and
4) was invariably greater than that in chamber 2 with the
sole exception of the month of March 1982. As mentioned
previously, this same month showed unusually slow growth
in chamber 3, which may have been due to the effects of
something in the seston.
The reproduction data for February is similar to the
growth data for that month. Figure 11 shows that the
animals in chamber 2 were probably less food limited than
those in chamber 1 since the first eggs appeared 7 days
earlier and the number of neonates produced per female per
day (#• $-1 -d"1) was greater. Examining the
1 Z 10 U 12 13 14 13 16 17 18 1» W Zl
CMKK* !•CHAMKR t-CHAMKR >CHAMKR 4. O
TIME (OATS}
FEBRUARY
REPRODUCTION OF D. PUUEX
13 14 13 16 17 18 19 20 a
CHAMKR INCHAMKR Z- „CHAMKR 3- AOR,CHAMKR 4- Q
MARCH
REPRODUCTION OF D. PULEX
CHAMKR 1"CHAHKR 2-CHAMKR 3> A CR/CHANKR 4- O
3 4 3 t 7 I » 10 U 12 13 14 13 U 17 II 1» M
TIME (DATS)
APRIL
REPRODUCTION OF D. PULEX
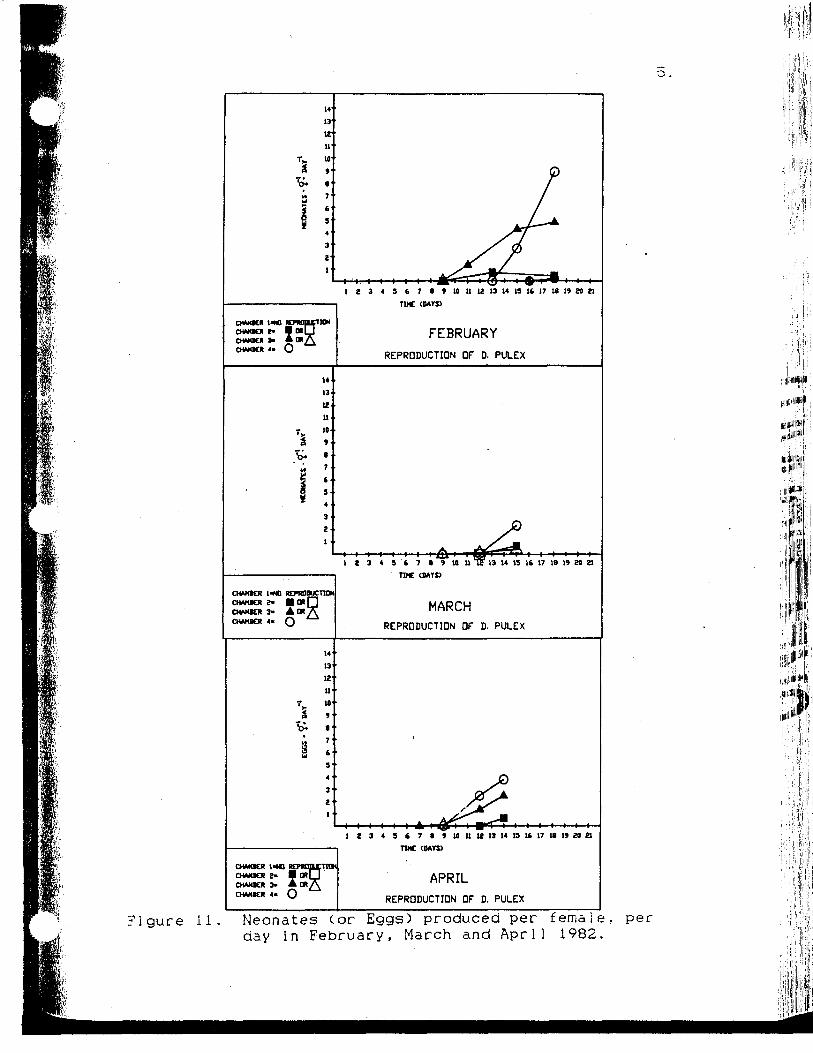
?i gure 11 . Neonates (or Eggs) produced per female, perday in February, March and April 1982.
52
ch1orophy11-a data (Fig. 4) I found that February was the
month with the lowest relative enrichment (29.5 percent).
IL seems that what benefit the animals in chamber 2 derive
from the enrichment is shunted into reproduction, not
growth. This supports the observations of Arnold (1971),
who found that the response to changing food conditions is
principally seen in changes in reproduction. Animals in
chamber 2 did produce a total of 2 ephippia (resting
embryos) on days 11 and -18. Epipphia are normally
produced when crowded or poor food conditions exist.
Conditions are obviously less than optimal in chamber 2,
even with the enrichment. Reproduction started earlier in
chamber 3, but once reproduction began in chamber 4, the
animals produced more #.$ -1 -d"1 than in chamber 3. There
was no significant difference in the average i n i t i a l
length of animals in these two chambers (F=0.53 P>0.25),
so earlier reproduction is probably not due to age
differences of the animals. It would seem that there is
some factor in the seston that allows faster i n i t i a l
growth and earlier reproduction in Daphnia pulex.
In March, A 100 fold increase in enrichment (105 as
opposed to 10^ cells per ml) failed to increase either
growth or reproduction in chamber 3 over that in chamber
2. In fact, even though reproduction was delayed in
chamber 2, it did show more reproduction than chamber 3 by
experiment's end (Fig. 11). Though the animals did

53
benefit from the enrichment to a certain degree, there is
probably some factor in the seston that prevents the
animals from deriving the f u l l benfit of the enrichment in
chamber 3. Unexpectedly, a low level of enrichment
benfits growth and reproduction of Daphn i a pu1 ex but a
higher enrichment does not. If the effect were due to the
.enrichment alga, growth and reproduction should have also
been affected in chambers 2 and 4, and this was not found.
Reproduction data (Fig. 8) shows no reproduction over the
10 day run in Chamber 1 and the most reproduction taking
place in chamber 4. Chambers 2 and 3 show a situation
similar to that found in Chambers 4 and 3 in February,
with reproduction coming earlier in chamber 3 but the
delayed onset of reproduction in chamber 2-result ing in
more #•?-! .-d"1 being produced. Again, I expected to
find greater reproduction in chamber 3 than in chamber 2.
As noted earlier, April's reproduction data are
graphed as eggs per female per day since neonate
production was low (Fig. 11). Reproduction in the April
experiment followed the same pattern seen in February.
In Chamber 1 there was no reproduction during the course
of the experiment. In Chamber 2 no neonates were produced
but eggs were found on the last day of the experiment.
The animals in chamber 3 started reproducing slightly
earlier than chamber 4(1 egg in 1 female on day 9), but
was out reproduced on the basis of neonates produced per

54
female per day by chamber 4. The fact that no neonates
were produced over the course of the experiment, despite
the higher temperature, could be due to the fact that the
average i n i t i a l lengths of the animals in this month's
study are slightly smaller than in previous months.
Compared with February's data the total amount of growth
seen in April is higher.
I found far more reproduction taking place in the
chambers in May than in previous months (Fig.12). This is
due to a longer experimental duration <20 days) and the
higher temperature which increased growth rates and brood
sizes and decreased development times (Lei and Armitage,
1980). In fact, starting with Day 9, so many eggs were
being produced in chambers 3 and 4, that I could only
estimate the number of eggs/female. By the end of the
experiment ther was no difference in the amount of
reproduction taking place in chambers 1 and 2. As can be
seen from Figure 12, reproduction began much earlier in
chamber 2 so it is safe to assume that the animals are
less food limited than those in chamber K The increase
in reproduction slowed somewhat in chamber 3 and decreased
dramatically in chamber 4 on the last day of the
experiment. I thought that this might be due to the fact
that there were so many animals in the chambers during the
latter part of the experiment that the neonates were
depleteing the food available to the adults even with a
lilp!!

55
5 6 7 8
TIME <DAtS>
11 12 13 U 15 16 17 18 19 SO 21
CHAMBERCHAMBER 8-CHAMBER 3=CHAMBER 4=
MAY
REPRDDUCTIDN OF D. PULEX
'CM
H—I h—t-1 2 3 4
H 1-
CHAMBER 1=NO REPRQDCHAMBER 2° • OR[CHAMBER 3- A DR^CHAMBER 4» Q
CTIDN
5 6 7 8 9 10 11 12 13 14 IS 16 -17 18 19 20 21
TIME <DAYS>
JUNE
REPRODUCTION DF D. PULEX
Figure 12. Neonates produced per female per day in Mayand June 1982.
56
complete turnover of chamber contents twice each day. I
was removing up to 168 neonates from chambers 3 and 4
every 2 days by the end of the experiment. Another
explanation might be that synchronicity of reproduction
among the animals contibuted to the dramatic decrease in
the number of neonates per female per day in chamber 4.
This is a distinct possibility given the small number of
animals in each chamber. I found males among the neonates
of chamber 4 on Day 17 and in chamber 3 on day 20. I also
found ephippia in Chamber 2 on Days 14 and 20 and in
chamber 4 on Days 14, 17, and 20. Both of these phenomena
are probably due to the crowded conditions in the
chambers. The average production of neonates per female
over the entire 20 day period was 45.71 for chamber 3,
39.02 for chamber 4, 1.42 for Chamber 2 and 1.14 for
Chamber 1. So the reproductive patterns seem to parallel
those of growth this month. It should be noted that May
was the month of highest Daphnia pulex abundance in
Boulder Basin, Lake Mead in 1982 (Figure 15). Growth and
reproduction in chambers 1 and 2, when compared with
chambers 3 and 4, show a definite pattern of food
limitation this month.
I found from the the data in Figure 12 that the
lowest level of reproduction in June was found in Chamber
1. The surviving females did not reproduce soon enough to
release neonates by Day 20 although they did contain eggs.

57
The graph for Chamber 2 looks the way it does due to
reproductive synchronicity among the animals. Chamber 3
shows a steady increase in the number of neonates produced
per female per day through out the course of the
experiment. The lone individual in chamber 4 neither grew
nor produced eggs during the last 6 days of the
experiment. Despite the loss of neonates on Day 20, the
number of eggs per female in the surviving animals
indicates that reproduction was s t i l l increasing in
Chambers 1-3. These results show a pattern of
reproduction similar to that found in May. Reproduction
in animals fed only lake seston was extremely low both
months. The large peak in chamebr 4 is due to
reproductive synchrony among the animals in the chamber
and the sharp decrease after Day 14 is due to mortality in
the chamber where 4 of the remaining 5 animals died.
The reproduction data in November (Fig. 13) shows
similar patterns of reproduction in' chamber 3 and chamber
4. The sudden decrease in reproduction after day 13 can
be explained by synchronicity of reproduction among the
animals in the chambers since the number of eggs per
female continued to increase in chamber 4, and decreased
only slightly in chamber 3. I n i t i a l l y , reproduction was
higher in chamber 3. By .the end of the experiment,
chamber 4 was producing more neonates per female per day
than chamber 3. Chamber 1 showed more reproduction than
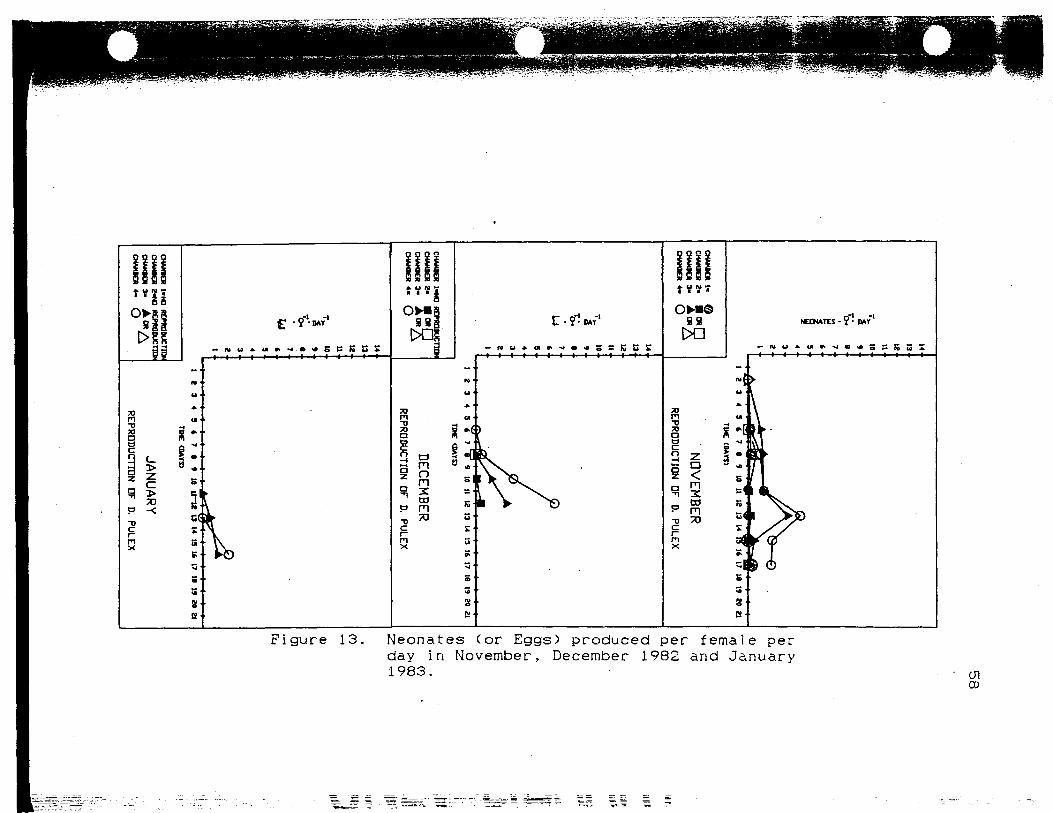
3 t_§ >
5!p -<T)
I I I I I
ag
z OD 9-n gp n5 30r~mx
Ci-
NEDNATES - ?"• B*Y~'
n«3TOoa
Sia 5•n 2« WP nT) 70
Figure 13. Neonates (or Eggs) produced per female perday in November, December 1982 and January1983. 01
oo

59
|H«
I
{
I *f
chamber 2, probably due to the fact that the animals were
i n i t i a l l y larger, and therefore closer to reproductive age
than those in Chamber 2. Two days later Chamber 2 was
producing more neonates-.?"1-day'1 than Chamber 1 and
continued to do so for the rest of the experiment. The.
peak on Day 17 for Chamber. 1 is a statistical anomaly due
to the small number of animals in the chamber. It
represents a total of 2 neonates produced over the last
two days by the last surviving individual. No ephippia or
males were produced by any animals during the experiment.
The animals in chamber 4 were the only ones that
produced neonates by the end of the experiment in
December. To better illustrate how the animals were
reproducing, Figure 13 shows the number of eggs produced
per female per day. Chamber 4 shows the highest
production of eggs followed by chamber 3 and chamber 2.
Again this seems to indicate some inhibitory effect of the
seston on the growth and reproduction of Chambers 1-3. I
observed no production of epphippia or males during the
experiment.. Clearly, from this month's data there is
definite food limitation and probably negative effects due
to some factor in the seston.
Reproduction data for January was also plotted as the
number of eggs produced per female per day (Fig. 13).
Chambers 3 and 4 were the only ones to produce eggs during
the experiment, a result which indicates a definite
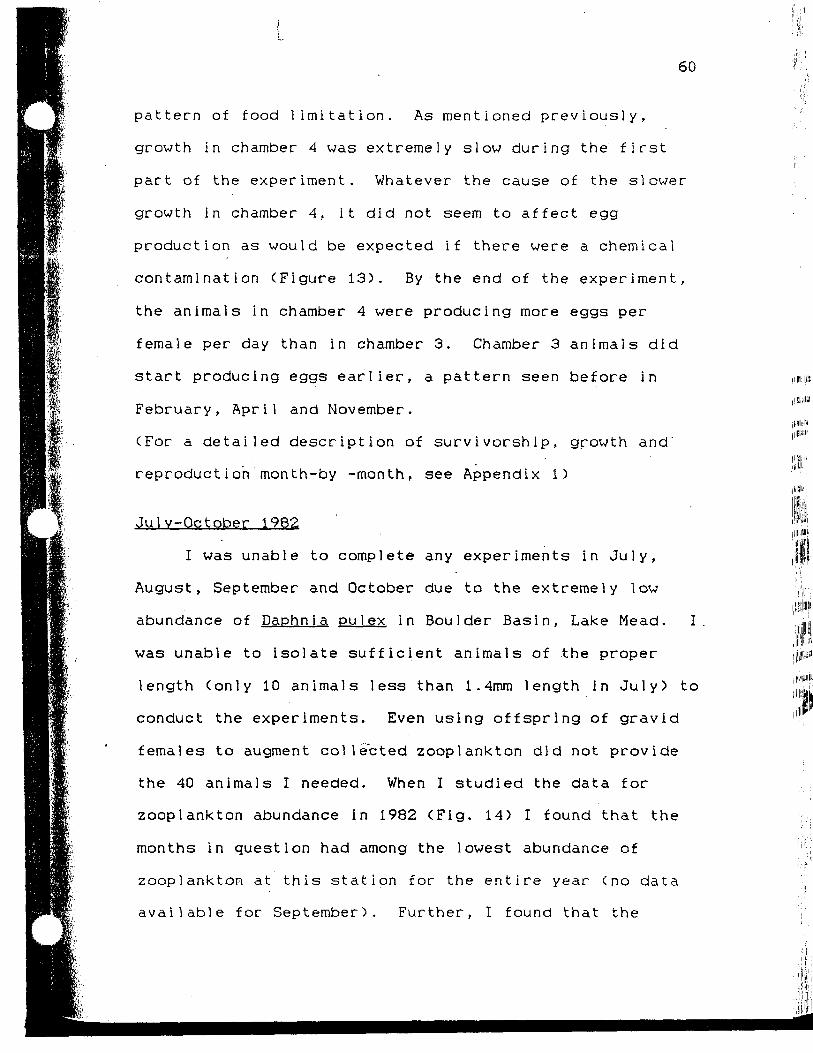
60
pattern of food limitation. As mentioned previously,
growth in chamber 4 was extremely slow during the first
part of the experiment. Whatever the cause of the slower
growth in chamber 4, it did not seem to affect egg
production as would be expected if there were a chemical
contamination (Figure 13). By 'the end of the experiment,
the animals in chamber 4 were producing more eggs per
female per day than in chamber 3. Chamber 3 animals did
start producing eggs earlier, a pattern seen before in
February, April and November.
(For a detailed description of survivorship, growth and
reproduction month-by -month, see Appendix 1)
July-October 1982
I was unable to complete any experiments in July,
August, September and October due to the extremely low
abundance of Daphn ia pulex in Boulder Basin, Lake Mead. I
was unable to isolate sufficient animals of the proper
length (only 10 animals less than 1.4mm length in July) to
conduct the experiments. Even using offspring of gravid
females to augment collected zooplankton did not provide
the 40 animals I needed. When I studied the data for
zooplankton abundance in 1982 (Fig. 14) I found that the
months in question had among the lowest abundance of
zooplankton at this station for the entire year (no data
available for September). Further, I found that the
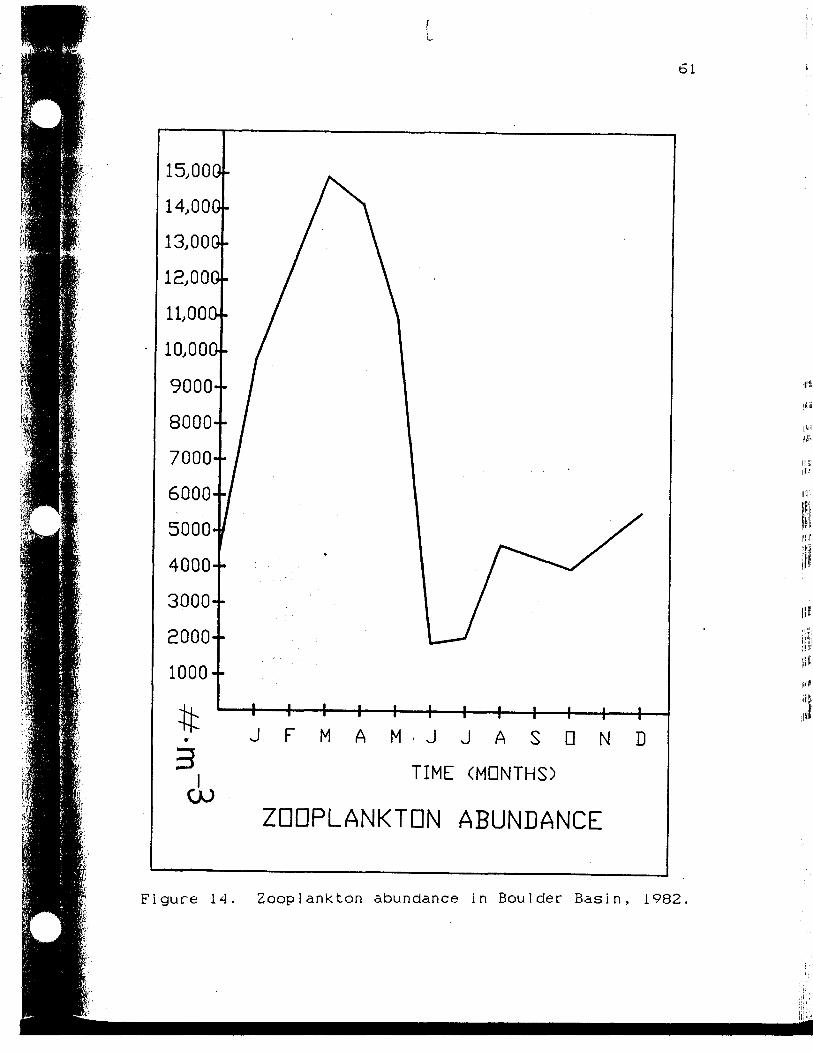
61
J F M A M ' J J A S Q N D
TIME (MONTHS)
ZDDPLANKTDN ABUNDANCE
i;!1;!
in*'IIS
Figure 14. Zooplankton abundance in Boulder Basin, 1982,

iuu-
90-
80-
^ 70-
60-
50-
40-
30-
20-
10-
[j]]=DAPHNIA PULEX
_ = OTHER CLADDCERANS
== = COPEPODS
^= ROTIFERS
• . . . • . • . •^fc-
j|||
Mil l JIM II |1 I
J F M A M
^v" ' • • ' • ' . - ' • ' • • ' •
-\ V -
J J A S D N DTIME (MONTHS)
PROPORTION OF ZOOPLANKTONPRESENT IN BDULDER BASIN,L, MEAD STATION #8 IN 1982
Figure 15. Composition of Zoop]ankton community inBoulder Basin, 1982.
ro
««

jitl,1
I
63
months of August-October are the months when Daphn i a pu1 ex
is least abundant in Boulder Basin (Fig. 15). I attempted
to run experiments in each of the months July-October with
the few animals available. However, I could not draw any
meaningful conclusions from the data due to the small
numbers of individuals available, large differences in the
average in i t i a l lengths of the animals and the short
duration of the experiments due to high mortality.
However, given the low levels of ch1orophy11-a (Fig. 4)
and the low abundance of Daphn i a pulex during these months
(Fig. 15), I feel it is safe to assume that Daphnia pulexj
is food limited during this period.
DISCUSSION
The data I collected from the 8 successful
experiments shows a clear pattern of food limitation in
Daphn ia pulex from Boulder Basin, Lake Mead. At no time
during my study did growth or reproduction in animals fed
only lake seston approach that of the food unlimited
animals in chamber 4 (apart from the exception noted for
chambers 1 and 4 in January, 1983). It is possible (but
not very likely) that the duration of my experiments was
too short to allow a proper appraisal of reproduction in
the animals fed only lake seston (especially in the March
experiment). The l i f e span of Daphn ia pulex is months,
not just weeks long. Even so there is obviously a
llM«!!*l :! ' , j,|j|Ul I > ; , :
laj'l
II
m

64
considerable delay in the onset of reproduction (possibly
more than 16 days depending on the season). No data was
obtainable for the months July-October 1982 but given the
extremely low levels of Daphn i a pu1 ex present and the low
ch1orophy11-a concentrations in the lake during those
months, the low abundances of Daphn i a pu1 ex present in
Boulder Basin in the summer (Paulson and Baker 1980,1983
and Wilde 1984),and the difficulty I had in running
experiments during these months, I doubt that the animals
would have shown a different pattern. Another sensitive
indicator of the nutritional state of cladocerans is the
L-0 (1ipid-ovary) index of Tessier and Goulden (1982).
Cladocerans such as Daphn i a store their energy reserves as
droplets of triglcerides (Tessier and Goulden 1982,
Goulden and Hornig 1983). During reproduction these l i p i d
droplets are transferred to the ovary and a droplet of
l i p i d is deposited in each egg. By ranking organisms as
to the amount and size of the l i p i d droplets present, and
the opacity of the ovaries, A relative index of the
nutritional state of Cladocerans can be determined. I
used the L-0 index during the November, December and
January runs. I found that the Daphn i a in chambers 3 and
4 had much higher indices than those in chambers 1 and 2
(Bartanen unpublished). These results very closely
paralleled those of growth and reproduction.
HUM
iillS
'•Ml
•IP in
•:4lw.|65
The average relative enrichment, based upon
ch1orophy11-a, was just over 75 percent for chamber 2. It
was enough that it did increase the amount of growth and
reproduction s l i g h t l y in most of the months except
February 1982, and January 1983 when the animals in
chamber 2 actually showed slower growth. I looked to
Janik (1984) and his study of phytoplankton succession in
Lake Mead for clues as to what might have caused these
anomalies. During the winter the phytoplankton is
dominated by cryptomonads < >60 percent of phytopiankton
biomass by size, Figure 16 (used with permission), from
Janik (1984). Almost 80 percent of the biomass present in
the lake at this time is <44jjm equivalent spherical
diameter so there should be adaquate amounts of food of
appropriate size for Daphn i a pulex (Figure 17, from Janik,
1984 (used with permission)). An unanswered question
remains, is there any inhibitory effect on the filtering
rate of Daphn i a pu1 ex when fed cells of borderline size?
As noted earlier, cells > 35 im equivalent spherical
diameter, are thought to be too large to be ingested by
any but the largest Daphnia pulex. If this is so, then
more information is needed on the u t i l i z a t i o n of cells 35
to 44jjm equivalent spherical diameter in Lake Mead.
For most of the study, growth was the same in
chambers 3 and 4. In March and December growth was
depressed in Chamber 3 indicating that there may have been
0.
66
j•
some fraction of the seston that inhibited feeding.
Examination of Figure 17 shows that during those two
months in 1981 (one year earlier) the phytopankton biomass
was over 85 percent and 75 percent (respectively)
comprised of cells larger than 21um equvalent spherical
diameter and over 65 percent and 45 percent (respectively)
of cells greater than 44jjm in diameter. Assuming that
there is at least a rough correspondence between the
phytop 1ankton sucession in 1981 and 1982 would mean that
much of the phytoplankton biomass was unavailable to
Daphnia pulex. The further effect of these large cells
would be to increase the rejection rate and prevent f u l l
use of the enrichment by the animals. Further examination
of Janik's data (Fig. 16) reveals that in both of these
months the phytoplankton was dominated (over 60 percent of
the biomass) by members of the cryptophyta (Cryptomonas
and Rhodomonas).
Although Crvptomonas and Rhodomonas are small and
digestible, Schindler (1971), Wetzel (1975 p. 449) and
Nadine-Hurley and Duncan (1976) indicate that Cryptomonads
may not be readily consumed by Daphn i a. The results of a
study by Sarnelle (1986) indicate that Crvptomonas and
Rhodomonas do not support high reproduction in
cladocerans. If this is true, it offers another mechanism
for the reduction of growth and reproduction in a
treatment which should not have been food limited. At
S.SU
I'k*
II
L.I1
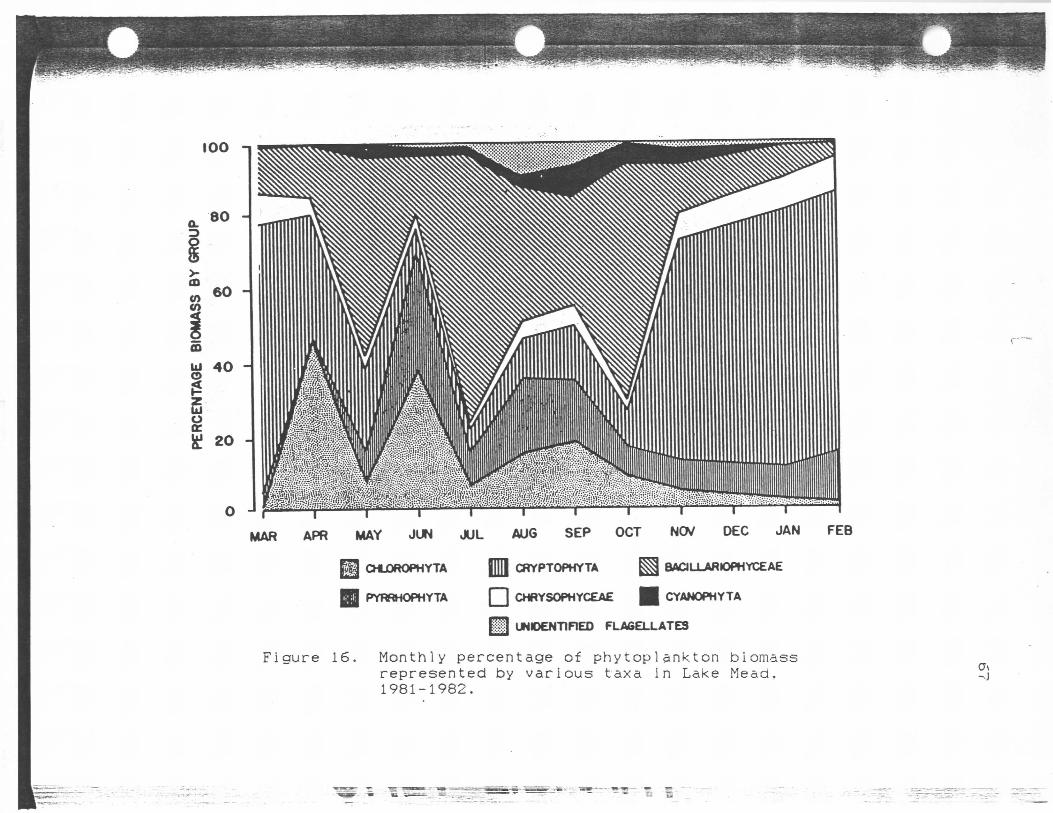
PE
RC
EN
TA
GE
B
IOM
AS
S
BY
GR
OU
P
'iI! ..... I
HM
10n(D
•- T
2•o CD oC
OT
3 D
i-* •"! rf
I CD
ZTi-
CO ~
O
CD
•<00 3M
n- "0•
CD CDa noD" <1>•<
Drl-
<
CU
H C
D
O
OC
*~K
01•D
X
n-
tu O-D
3
0.'
I-1 A"
£1J /-T
A"
OCD
D
2
CTCD
—&'
Oa
3-
aien
ad35?
s•o
Q
oIoI
CDO
•< f!
mOO1o
OO
-nm03
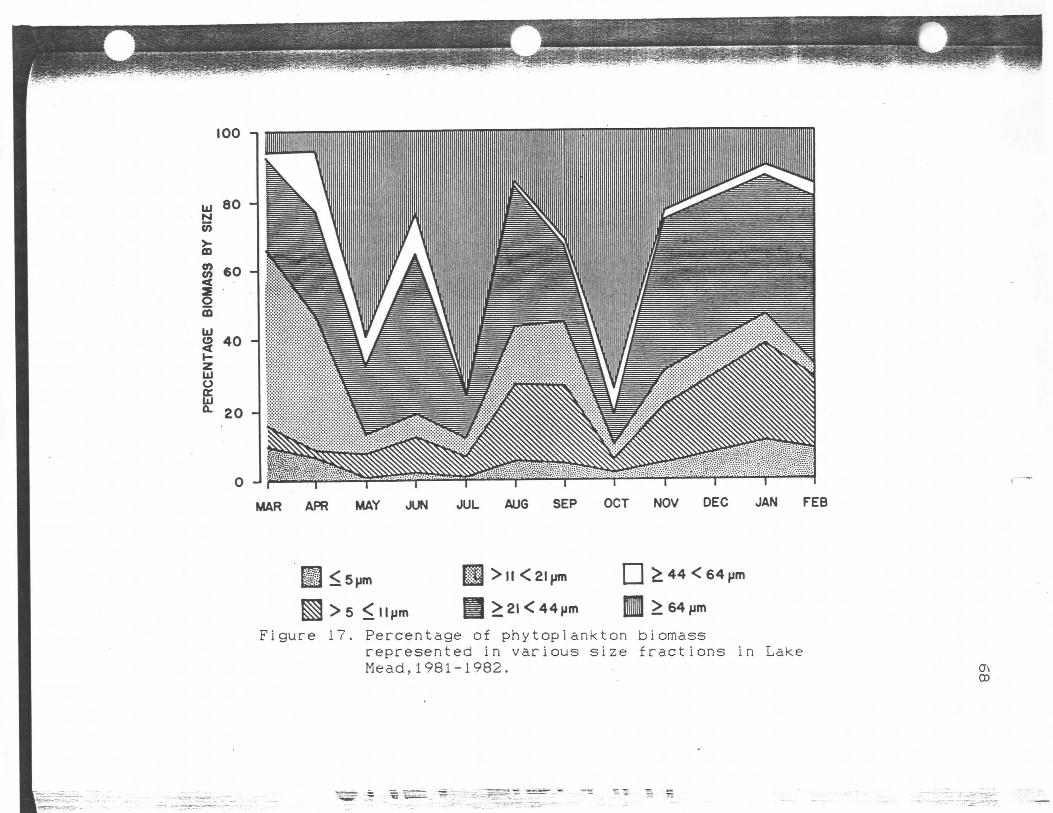
100 -i
80 -
CO
6O -
oCD
Ul<£ 40
Ulo
20 -
0 J
MAR APR MAY JUN JUL AUG SEP OCT NOV DEC JAN FEB
< 64pm
H > 5
Figure 17.
>2l<44j im > 64
Percentage of phy topi ankton biomassrepresented in various size fractionsMead, 1981-1982.
in LakeasCO

69
least for some months of the year, my results do seem to
confirm those of (Ryther 1954; Burns and Rigler 1967;
Burns 1968; Crowley 1973) who found lower growth and
reproduction in lake water than in mixed lake water and
pure algal enrichment. I also noted a pattern in the
onset of reproduction in chambers 3 and 4. Reproduction
started earlier in chamber 3, but when reproduction did
begin in chamber 4 (usually a couple of days later) the
animals produced more neonates per female per day. There
may be some nutritional factor in the lake seston that
causes a change in the pattern of reproduction.
A note of caution in interpreting these results. The
data in Janik (1984) is from March 1981 through February
1982 and the only month our studies overlapped was
February 1982. Paulson and Baker (1983) found that
productivity in Boulder Basin, Lake Mead was lower in 1982
than in 1981 and this probably had an effect on the
phytoplankton succession at this station.
As mentioned above, Paulson and Baker (1983) found
decreasing productivity in Boulder Basin, which they
attributed to lower phosphorus inputs from the Wash due to
the operations of the Advanced Treatment Plant. As I
noted in the section on the history of Lake Mead there has
been a pattern of declining productivity or abundance at
every .trophic level. My study shows that the reductions
in Daphn i a pu1 ex abundance are due in part to food

i
70
l i m i t a t i o n , not solely due to predation or competition
with other organisms. Although predation and competition
are certainly important in regulating the numbers of
Daphn i a in the lake. A feeding experiment conducted in
1981 (Paulson and Baker 1983) got results very similar to
mine using water from more productive areas of the lake
(the Inner and Middle Las Vegas Bay). This shows that the
lake is capable of supporting higher growth and
reproduction in Daphn i a if more nutrients are supplied to
phytopiankton. The project currently under way (personal
communication with L. J. Paulson, 1987), to fertilize an.
arm of Lake Mead to improve-productivity should yield very
interesting results. If the enrichment proves successful
to phytoplankton species that are suitable forage for
zooplankton like Daphnia. the project should meet with
success.
71
L i terature c i ted
Arnold, D. E. 1971. Ingestion, assimilation, survival andreproduction by Daphn i a pulex fed seven speciesof blue-green algae. Limnol. Oceanogr. 16: 906-920.
Baker, J.R. and L.J. Paulson 1980. Influence of Las VegasWash density current on nutrient a v a i l a b i l i t y andphytop 1ankton growth in Lake Mead. Proc. of theSymposium on surface water impoundments ASCE.1638-1645.
Berman, M. S. and S. Richman 1974. The feeding behaviorof Daphnia pulex from Lake Winnebago, Wisconsin.Limnol. Oceanogr. 19:105-109.
Benndorf, J. and W. Horn 1985. Theoretical considerationson the relative importance of food limitation andpredation in structuring zooplankton communities.Arch. Hydrobiol. Beih., Ergebn. Limnol. 21:383-396.
Bottrell, H. H. 1975a. The relationship betweentemperature and duration of egg development in someepiphytic Cladocera and Copepoda from the riverThames, Reading, with a discussion of temperaturefunctions. Oecologia 18:63-84. -
Bottrell, H. H. 1975b. Generation time, length of l i f e ,instar duration and frequency of moulting, and theirrelationship to temperature in eight species ofCladocera from the River Thames, Reading. Oecologia19:129-140.
Brende1berger, H. Filter mesh-size and retentionefficiency for small particles: comparative studieswith Cladocera. Arch. Hydrobiol. Beih., Ergebn.Limnol. 21:135-146.
Brooks, J.L. 1953. Re-descriptions of Daphn i a pulexvar. PU! icaria Forbes,_D. thorata F. and ID.dentifera F. Amer. M i d i . Naturalist 49:772-800
Brooks, J.L. 1957.Daphnia. Mem.
The systematicsConn. Acad. Arts
of North AmericanSci. 13: 180pp.
Burke, T.A. 1977. The limnetic zooplankton community ofBoulder Basin, Lake Mead in relat.ion to themetalimnetic oxygen minimum. M.S. Thesis. Univ. ofNev., Las Vegas. 95 pp.
72
Burns, C. W. 1968. Direct' observations of mechanismsregulating feeding behavior of Daphn i a. in lakewater. Int. Rev. ges. Hydrobiol. 53: 83-100.
Burns, C. W. 1969a. Particl-e size and sedimentation inthe feeding behavior of two species of Daphn i a.Limnol. Oceanogr. 14: 392-402.
Burns, C. W. 1969b. Relation between f i l t e r i n g rate,temperature and body size in four species ofDaphn ia. Limnol. Oceanogr. 14:693-700.
Burns, C. W. and F, H. Rigler 1967. Comparison offiltering rates of Daphn i a rosea in lake waterand in suspensions of yeast. Limnol. Oceanogr.12:492-502.
Crowley P. H. 1973. Filtering rate inhibition ofDaphn i a pulex in Wintergreen Lake water. Limnol.Oceanogr. 18: 394-402.
DeMott, W. R. 1982. Feeding selectivities and relativeingestion rates of Daphnia and Bosmi na. Limnol.Oceanogr. 27:518-527
DeMott, W. R. 1985. Relations between filter mesh size,feeding mode and capture efficiency for cladoceransfeeding on ultrafine particles. Arch. Hydrobiol.Beih., Ergebn. Limnol. 21: 125-134.
Geller, W. 1985. Production, food utilization and lossesof two coexisting, ecologically different Daphn iaspecies. Arch. Hydrobiol. Beih., Ergebn. Limnol,21:67-79.
Geller, W. and H. Muller 1981. The filtration apparatusof Cladocera: Filter mesh sizes and theirimplications on food selectivity. Oecologia (Berl)49: 316-321.
Gerri tsen,Rep 1 y
J., J. D. Orcutt, Jr., and K. G. Porter 1985,to Schoenberg. Ecology 66:1088-1090.
Ghilarov, A. M. 1985. Dynamics and structure ofcladoceran populations under conditions of foodlimitation. Arch. Hydrobiol. Beih., Ergebn.Limnol. 21: 323-332.
Gliwicz, Z. M.se1ect i onaspect of
1980. Filtering rates, food size, and feeding rates in Cladocerans- anotherinterspecific competion in filter-feeding
73
zooplankton. In: W. C. Kerfoot (eci.). Evolution andecology of zooplankton communities. University Pressof New England, Hanover: 282- 291.
Gliwicz, Z. M., A. Ghilarov and J. Pijanowska 1981. Foodand predation as major factors l i m i t i n g two naturalpopulations of Daphn i a cucu11ata Sars.Hydrobiologia 80: 205-218. •
Gliwicz, Z. M. and A. Hi 11bricht-I1kowska 1985.Efficiency of the utilization of nannop1anktonprimary production by communities of f i l t e r feedinganimals measured in situ. Arch. Hydrobiol. Beih.,Ergebn. Limnol. 21:197-203.
Gliwicz, Z. M.and algaeDaphnla.
and E. Siedlar 1980. Food size limitationinterfering with food collection inArch. Hydrobiol. 88: 155-177.
Green, J. 1956. Growth, size and reproduction inDaphnia (Crustacea: Cladocera). Proc. Zool. Soc . ,London. 126:173-204.
Gophen, M. and U, Pollingher 1985. Relationships betweenfood a v a i l a b i l i t y , fish predation and the abundanceof the herbivorous zooplankton community in LakeKinneret. Arch. Hydrobiol. Beih., Ergebn. Limnol
• 21: 397-405.
Goulden, C. E. and L. L. Henry 1983. Lipid energyreserves and their role in Cladocera. In Trophicinteractions within aquatic ecosystems. AAASSelected Symp., Westview Press, Boulder,Colorado.Gulati, R.D., K.
Horton, P. A., M. Rowan, K. E. Webster and R. H. Peters.1979. Browsing and grazing by cladoceran filterfeeders. Can. J. Zool. 57:206-212.
Hrbacek, J. 1985. The role of al1ochthonousmatter in the competition of Daphnia inlimited zooplankton communities.. Arch.Beih., Ergebn. Limnol. 21: 461-464.
organicfoodHydrobi ol
Infante, V. A. 1973. Investigations on the incorporationof different algae by some zooplankton species.Arch. Hydrbiol. Suppl. 42. 340-405.
Ivanova, M. B. 1969.reaction on theArch. Hydrobiol
The influence of active waterfiltration rate of cladocera.16: 115-124.
Pol

74
Janik, J.J. 1984. The role ofphytop 1ankton dynamics ofreservoirs (Lakes Powell,M.S. Thesis. Univ. of Nev
the nannoplankton in thefour Colorado RiverMead, Mojave and Havasu)Las Vegas. 133 pp.
Kerfoot, W. C. 1980. Evolution and Ecology of ZooplanktonCommunties. University Press of New England, Hanover.
Kerfoot, V, C., W. R. DeMott and D. L. DeAngelis 1985.Interactions among cladocerans: food l i m i t a t i o n andexploitative competition. Arch. Hydrobiol. Beih..Ergebn. Limnol. 21: 431-451.
Kring, R. L. and W. J. O'Brien 1976. Accomodation ofDaphn i a pu1 ex to altered pH conditions asmeasured by feeding rate. Limn.ol . Oceanogr. 21:313-314.
Lampert, W. 1975. A laboratory system for the cultivationof large numbers of Daphn i a under controlledconditions. Arch. Hydrobiol./Supp1.48:138-140.
Lampert, W. 1978. A field study on the dependence of thefecundity of Daphnia spec, on food concentration.Oecologia (Berl.) 36: 363-369.
Lampert, W. <ed.) 1985. Food limitation and the structureof zooplankton communities. Arch. Hydrobiol.Beih., Ergebn. Limnol. 21.
Lampert, W. and P. Muck 1985. Multiple aspects of foodlimitation in zooplankton communities: theDaphn i a-Eudi aptomus example. Arch. Hydrobiol.Beih., Ergebn. Limnol. 21: 311-322.
Lampert, W. and U. Schober 1980. The importance of"threshold food concentrations. In: W. C. Kerfoot(ed.). Evolution and ecology of zooplanktoncommunities. University Press of New England,Hanover: 264-267.
Larsson, P., S. Andersen, Y. Borsheim, P. Jakobsen and G.Johnsen 1985. Individual growth of Daphnia1ongispina in the summer decline phase of thepopulation. Arch. Hydrobiol. Beih., Ergebn.Limnol. 21: 341-350.
Lei, C. H. and K. B. Armitage 1980. Growth, developmentand body size of field and laboratory population ofDaphnia ambigua. Oikos 35:31-48.
75
I?
McCau)ey, E.betweeni akes.
and J. KalffphytoplanktonCan. J. Fish.
1981. Empirical relationshipsand zooplankton biomass inAquat. Sci. 38: 458-463.
McMahon, J. W. and F. H. Rigler 1963. Mechanismsregulating the feeding rate of Daphn i a magnaStraus. Can. J. of Zool. 41: 321-332.
McMahon, J. W. and F. H. Rigler 1965. Feeding rate ofDaphnia magna Straus in differnet foods labeledwith radioactive phosphorus. Limnol. Oceanoar. 10105-112.
Meise, C. J., W. R.- Munns, Jr. and N. G.analysis of the feeding behavior ofLimnol. Oceanogr. 30:862-870.
Hairston,Jr. AnDaphn ia pu1 ex
§••
Meyers, D. G. 1983. Habitat shifting, feeding modeversatility, and alternate resource exploitation byherbivorous zooplankton in a montane lake. InTrophic interactions within aquatic ecosystems. AAASSelected Symp., Westview Press, Boulder, Colorado.
Meyers, D. G. and J. R. Strickler (ed.) 1983. Trophicinteractions within aquatic ecosystems. AAASSelected Symp., Westview Press, Boulder, Colorado.
Mateev. V. 1985. Delayed dependence and competitiveability in two cladocerans. Arch. Hydrobiol .Beih., Ergebn. Limnol. 21:453-459.
Munro, I. G. and R. W. G. White 1975. Comparison of theinfluence of temperature on the egg development andgrowth of Daphnia 1ongispina 0. F. Muller(Crustacea: Cladocera) from two habitats in southernEngland. Oecologia (Berl.) 20:157-165.
Orcutt, J. D. Jr. 1985 Food level effects on thecompetitive interact ions,of two co-occurringcladoceran zooplankton: Diaphanasoma brachvurumand Daphn i a amblgua. Arch. Hydrobiol. Beih.,Ergebn. Limnol. 21: 465-473.
Pace, M.L., K.G. Porter and Y. S. Feig 1983. Species- andage-specific differences in bacterials resourceutilization by two co-occurring cladocerans. Ecology64:1145-1156.
Pavy1ut in, A. P,freshwater7-12.
1975. Food value of detritus for certaincladoceran species. Hydrobiol. J. 12:

76
Paulson, L. J., J. R. Baker and J. E. Deacon 1980. Thelimnological status of Lake Mead and Lake Mohaveunder present and future powerplant operations ofHoover Dam. Lake Mead Limnol. Res. Cent., U n i v . of.Nev., Las Vegas. Tech Rept. 1. 229 pp.
Paulson, L.J. 1981. Nutrient management with hydroeietricdams on the Colorado River system. Lake Mead Limnol.Res. Cent., Univ. of Nev., Las Vegas. Tech Rept. 8.39 pp.
Paulson, L.J. and J. R. Baker 1983. Interrelationshipsbetween nutrients, plankton and striped bass in LakeMead.Lake Mead Limnol. Res. Cent., Univ. of Nev., LasVegas. Tech Rept. 10. 94 pp.
Porter, K. G. 1977. The plant-animal interface infreshwater ecosystems. Amer. Scientist 65: 159-170.
Porter, K. G., J. Gerritsen and J. D. Orcutt, Jr. 1982.The effect of food concentration on swimmiungpatterns, feeding behavior, ingestion, assimilation,and respiration by Daphn i a. Limnol. Oceanogr. 27:935-949.
I
!Porter, K. C. and R. McDonough 1984.
of response to blue-green algalcladocerans. Limnol. Oceanogr.
The energeticf i1aments by29: 365-369.
cost
Porter, K. C. and J. D. Orcutt, Jr. 1980. Nutritionaladequacy, manageability, and toxicity as factorsthat determine the food quality of green andblue-green algae for Daphnia. In: W. C. Kerfoot(ed.). Evolution and ecology of zooplanktoncommunities. University Press of New England,Hanover:268-281.
Rigler, F. H. 1961. The relation between concentration offood and feeding rate of Daphn i a magna Straus.Can. J. Zool. 39: 857-868.
Romanovsky, Y.E. 1985. Food limitation and life historystrategies in cladoceran crustaceans.Arch.Hydrobiol. Beih., Ergebn. Limnol. 21:363-372.
!' I
Romanovsky, Y.E. and I.Y. Feniova 1985. Competition amongCladocera: effect of different levels of food supply.Oikos 44: 243-252.
Ryther, J. H. 1954. Inhibitory effects of phytoplankton
77
upon the feeding of Daphn i a magna withto growth, reproduction and survival.522-533.
referenceEcology 35:
Sarnelle. 0. 1986. Field assesment of the quality ofphytoplanktonic food available to Daphnla andBosmina. Hydrobiologia 131:47-56.
Schindler, J. E.nutr i t i on.
1971. Food quality and zooplanktonJ. Anim. Ecol. 40:589-595.
Schoenberg, S. A. 1985. Reduced fitness at surplus foodlevels in Daphn i a: an artifact? Ecology66:1085-1088.
Schwartz, S. S. and R. E. Ballinger 1980. Variations inthe life history of Daphnia pulex fed differentalgal species. Oecolologia 44:141-144.
Siewertsen and G. Postema 1985. Zooplankton structure andgrazing activities in relation to food quality andconcentration in Dutch lakes. Arch. Hydrobiol.Beih., Ergebn. Limnol. 21:91-102.
Starkweather, P. L. 1983. Daily patterns of feedingbehavior in Daphnia and related microcrustacea:implications for cladoceran autecology and thezooplankton community. Hybrobiologia 100:203-221.
Taub, F. B. and A. M. Dollar 1968. The nutritionalinadequacy of Ch1orel1 a and Ch1amvdomonas as foodfor Daphnia pulex. Limnol. Oceanogr. 13:607-617.
Tessier, A. J. and C. E. Goulden 1982. Estimating foodlimitation in cladoceran populations. Limnol.Oceanogr. 27:707-717.
Threkeld, S.T. 1985. Resource variation and theinitiation of midsummer declines of cladoceranpopulations. Arch. Hydrobiol. Beih., Ergebn.Limnol. 21: 333-340.
Vijverberg, 1976. The effect of food quantity andquality on the growth, birth-rate and longevity ofDaphnia hvalina Leydig. Hydrobiologia 51:99-108.
Webster, K.E. and R. H. Peters 1978. Some size-dependentinhibitions of larger cladoceran filterers infilamentous suspensions. Limnol. Oceanogr.23:1238-1245.
78
Wetzel, R. G. 1975. Limnology.Philadelphia. PA. 743 pp.
W. B. Saunders Co.
Wilde, G.R. 1984. Seasonal and spatial heterogeneity inthe limnetic zooplankton community of Lake Mead. M.S.Thesis. Univ. of Nev., Las Vegas. 95pp.
Young, S., V. A. Taylor and E. Watts 1984. Visual factorsin Daphn ia feeding. Limnol . Oceanogr.29:1300-1308.
Zar, J. H. 1974. Biostatistical Analysis. Pub. byPrentice-Hall, Inc., Engelwood Cliffs, N. J. 620 pp.
Zhdanova, G. A. and T. V. Frinovskya 1974. Effect ofalgae as food on the growth, fecundity and life-spanof Bosmina longirostris (0. F. Muller)Hydrobiological J. 12: 66-69.
II
I
79
APPENDIX 1: EXPERIMENTAL CHRONOLOGY
February 1982
Animals for the first experiment (February) were
collected on 22 January, 1982 and by 28 January, 1982 I
had enough algae cultured to start the experiment. During
the interim (as with other months), I added C_. re i nhardt i
to the container with the collected animals to keep them
from being starved. This experiment ran for a total of 18
days at a temperature of 12°C. I found the average i n i t i a l
length of animals in chamber 2 to be significantly larger
than the other chambers (F=34.09, P<.0005).
Figure 8 shows the increase in body length over time
for the animals in each treatment. There is very l i t t l e
difference in the amount of growth in chambers 1 and 2.
This is unusual since I expected growth in chamber 2 to be
higher than in chamber 1. The reproduction data (Figure
11) however, shows that the animals in chamber 2 were
probably less food limited since the first eggs appeared 7
days earlier and the number of neonates produced per
female per day (tt-?"1 -d"1) was greater. Animals in
chamber 2 did produce a total of 2 ephippia (resting
embryos) on days 11 and 18. Epipphia are normally
reproduced when crowded or poor food conditions exist.
Conditions are obviously less than optimal in chamber 2,
even with the enrichment.

80
Chamber 3 exhibited slightly better growth than
chamber 4 i n i t i a l l y . By the end of the experiment growth
in chamber 4 had equalled that in chamber 3. The decrease
in growth on day 11 (chamber 4) and day 18 (chamber 3) was
linked to the deaths of 1 or more large individuals in the
chambers which lowered the average length of the animals.
Reproduction started earlier in chamber 3, but once
reproduction began in chamber 4, the animals produced more
#• £-1 'd-1 than in chamber 3. There was no significant
difference in the average i n i t i a l length of animals in
these two chambers (F=0.53 P>0.25), so earlier
reproduction is probably not due to age differences of the
an imals.
Figure 5 shows the survivorship curves for the first
run. A Kolmogorov-Smirnov goodness of fit test (Zar 1974)
showed no significant difference in the survivorship of
the animals in the 4 treatments (D=.16667, n=12, P>.05).
Testing HQ:Mortality is constant over the duration of the
experiment in a given chamber with a Kolmogorov-Smirnov
test for goodness of f i t , I found that mortality was not
constant over the course of the experiment in chamber 1
(Table 3). A l l mortality occurred in the last 5 days of
the experiment. There were no significant changes in
mortality over time in the other chambers (Table 3).
March 1982

81
Experiment 2 animals and seston were collected on 19
February and I began the experiment on 10 March. The
shorter duration of the experiment in Chamber 1 was due to
a problem with the apparatus (Table 2). Chamber 1 was
restarted with new animals but could not be run as long as
the others to prepare for the April experiment. I had
fresh lake water collected on 4 March, so the experiment
was not run on old seston (Table 1).
Figure 8 shows the growth data for March. There was
a significant difference in the i n i t i a l length of the
animals, with the chamber 1 animals being significantly
shorter than the others (F=4.02 P <.0005>. In this
experiment the greatest growth was seen in the animals fed
only Ch1amvdomonas re i nhardt i (chamber 4). The least
growth was seen in the animals fed only lake seston
(chamber 1). The fact that there appears to be no
difference in growth between the enrichments of 103 and
105 cells/ml of Ch1amvdomonas rei nhardt i is unexpected. A
100 fold increase in enrichment failed to increase either
growth or reproduction in chamber 3 over that in chamber
2. In fact, even though reproduction was delayed in
chamber 2, it did show more reproduction than chamber 3 by
experiment's end.
The data (Fig. 11) shows no reproduction over the 10
day run in Chamber 1 and the most reproduction taking
place in chamber 4. chambers 2 and 3 show a situation

•w'
82
similar to that found in chambers 4 and 3 in February,
with reproduction coming earlier in chamber 3 but the
delayed onset of reproduction in chamber 2, resulting in
more #• $ -1 -d"1 being produced. Figure 5 shows the
survivorship curves for the March experiment. There were
no significant differences in survivorship either between
the treatments (D=.30000, n=10, .5> P>.2) or within the
chambers over the course of the experiment (Table 3).
April 1982
Animals and water for the April experiment were
collected on 25 March and I began the experiment on 31
March at a temperature of 14° c (Table 1). There was no
significant difference in the i n i t i a l lengths of the
animals (F=0.22, P>.25>. The duration of the experiment
was 14 days and was terminated due to lack of
Chiamvdomonas from culture plates. Growth was slowest in
Chamber 1, Chamber 2 showed a definite enhancement of
growth and Chambers 3 and 4 even more enhancement (Fig. 8
). Chambers 3 and 4 show no difference in the amount of
growth at the end of the experiment although growth was a
l i t t l e slower i n i t i a l l y in chamber 4. This lag in growth
can be explained by the high early mortality in chamber 4
which resulted in lower average lengths when compared to
chamber 3. The flat portion of the graph between days 7
83
and 9 for chamber 2 is not an anomaly. There was no
growth in the chamber during this period.
This month's reproduction data are graphed as eggs
per female per day since neonate production was low (Fig.
11). Reproduction in the April experiment followed the
same pattern seen in February. In Chamber 1 there was no
reproduction during the course of the experiment. In
Chamber 2 no neonates were produced but eggs were found on
the last day of the experiment. The animals in chamber 3
started reproducing slightly earlier than chamber 4(1 egg
in 1 female on day 9), but was out reproduced on the basis
of neonates produced per female per day by chamber 4.
Survivorship curves are shown in Figure 5. I found no
significant difference in the survivorship over the course
of the experiment (Table 3), nor was there any significant
difference between the treatments (D=. 16667, n=l5, P>.05).
May 1982
I collected the animals on 22 April and began the
experiment on 30 April at a starting temperature of 15° c.
I received fresh seston on 4 May which was used u n t i l 20
May, the end of the experiment (see Table 1). The average
i n i t i a l lengths of the animals in the four treatments were
significantly different (F=3.08, .05<P<.25>. The animals
in chamber 2 were slightly longer than the others.
84
I found that chamber 1 animals had the least growth
followed by chamber 2, chamber 4 and chamber 3 (Fig. 9).
Over the first 5 days of the experiment, chamber 4 had the
fastest growth but this changed after Day 5 when chamber 3
showed the greatest increase in length. Chamber 1 also
shows a similar increase in the amount of growth, but
chamber 2 does not. Growth in chamber 3 was greater than
in chamber 4 by the end of the experiment. The lower
growth in chamber 4 is not an artifact due to mortality
(Figure 6). It is probably not due to senescent algae,
since chamber 3 should have also been affected.
Starting with Day 9, so many eggs were being produced
in chambers 3 and 4, that I could only estimate the. number
of .eggs/female. The increase in reproduction slowed
somewhat in chamber 3 and decreased dramatically in
chamber 4 on the last day of the experiment (Fig. 9). I
thought that this might be due to the fact that there were
so many animals in the chambers during the latter part of
the experiment that the neonates were depleteing the food
available to the adults even,with a complete turnover of
chamber contents twice each day. I was removing up to 168
neonates from chambers 3 and 4 every 2 days by the end of
the experiment. Another explanation might be that
synchronicity of reproduction among the animals contibuted
to the dramatic decrease in the number of neonates per
female per day in chamber 4. This is a distinct
85
possibility given the small number of animals in each
chamber.
To estimate the f i l t e r i n g rate of Daphn ia PU1 ex. I
used the formula derived by Burns (1969). I calculated
the fi l t e r i n g rates per day for neonates 0.5 mm and 1.0 mm
in length at 15° C. I did not determine lengths for
neonates removed from the chambers so I chose 0.5mm as the
length of a neonate since it was the shortest i n i t i a l
length of any animal used for my experiments. I also
included the figure for animals of 1 mm length. Animals
this long are probably larger than any neonates but they
are approximately the starting length of the experimental
animals. In calculating the total volume filtered for the
largest number of animals in a given chamber, I included
the volume filtered by the adult animals (using the
average length of the adults that day). The filtering
rate is 396 ml-day-1 (40 percent of the 1 liter of
suspension delivered to the chamber each day) for neonates
assumed .5mm in length. For neonates assumed 1.0mm
length, the filtering per day was 875 ml. The actual
figure is probably somewhere between these two extremes.
Therfore, the animals are not totally depleting the food
suspension, but they are filtering a significant portion
of it. Unfortunately, I had to terminate the experiment
before I could determine whether reproduction recovered.

86
I found males among the neonates of chamber 4 on Day
17 and in chamber 3 on day 20. I also found ephippia in
Chamber 2 on Days 14 and 20 and in chamber 4 on Days 14,
17, and 20. The average production of neonates per female
over the entire 20 day period was 45.71 for chamber 3,
39.02 for chamber 4, 1.42 for Chamber 2 and 1.14 for
Chamber 1.
Analysis of survivorship (Fig.6) for May showed no
significant differences within the chambers over time
(Table 3). Kolmogorov-Smirnov goodness of fit showed no
significant difference in the amount of mortality between
the 4 treatments (D=.25, n=8, .5> P>.2). A heterogeneity
Chi-square analysis (Zar 1974) did show a significant
difference (X2=g.oOO d.f.=3 <7.815 a=0.05). This is the
only month that a Heterogeneity Chi-square analysis found
a significant difference in the survivorship in the four
treatments (allX2 cal cual at ions at the 5 percent level of
significance with 3 d.f.). Chambers 2 and 3 did show a
decrease in survivorship in the period just after the new
lake seston was first used.
June 1982
I collected the animals for the experiment on 3 June
and began the experiment on 8 June at a starting
temperature of 18° C (see Table 1). I found no
significant difference in the starting lengths of the

87
animals (F=2.39, .!> P >.05). Figure 9 shows the increase
in body length for the June experiment. In a situation
similar to May. I found that Chamber 1 showed the least
amount of growth and that the enrichment in chamoer 2
increased growth. There doesn't seem to be much
difference in amount of growth in chambers 3 and 4. There
was no growth in chamber 4 over the last 3 days of the
experiment is because there was only 1 animal in the
chamber which did not molt in that period of time. This
is also why the last two points on the curve for chamber 4
have no error bars.
I found from the the data in Figure 12 that the
lowest level of reproduction was found in Chamber 1. The
surviving females did not reproduce soon enough to release
neonates by Day 20 although they did contain eggs. The
graph for Chamber 2 looks the way it does due to
reproductive synchronicity among the animals. Chamber 3
shows a steady increase in the number of neonates produced
per female per day through out the course of the
experiment. The lone individual in chamber 4 neither grew
nor produced eggs during the last 6 days of the
experiment. The apparent growth in chamber 4 for days
14-17 was due to the deaths of some shorter individuals.
Despite the loss of .neonates on Day 20, the number of eggs
per female in the surviving animals indicates that
reproduction was s t i l l increasing in Chambers 1-3.

88
I found that survivorship was significantly different
(Table 3) in Chambers 2 and 3 over the 20 day run of the
experiment, with most of the mortality occurring in the
first 5 days of the experiment (Figure 6). I did not find
any significant difference in survivorship between the
four chambers (D=.15909, n=22, P>.5).
November 1982
I collected the animals for this experiment on 11
.November and started the actual experiment at 18° c on 17
November (see Table 1). I found that there was a
significant difference in the average i n i t i a l length of
the animals with those individuals in Chamber 1 being
longer (F=4.02, .025>P>.01>.
The increase in body length for the four treatments
is shown in Figure 10. The animals in Chamber 1 showed
steady growth until Day 6 when the amount of growth
abruptly slowed. These animals increased in length only
slightly during the rest of the experiment and
reproduction (after Day 8) was also low. Examining the
survivorship data (Fig. 7) I found that mortality
increased dramatically after Day 6. Death of individual
animals occured in chamber 1 until Day 17 when I found 3
dead animals in the chamber and the last, obviously dying.
The mortality was not due to any phyiscal damage that I

89
could detect. The decrease in the rate of growth did not
occur u n t i l after day 8 in chamber 2.
Survivorship did not change significantly over time
in chambers 1, 2 and 4 (Table 3), but was s i g n i f i c a n t l y
different for chamber 3 <D=.71429, n=5, .005> P >.002>.
In chamber 3, there was high mortality the first 6 days of
the experiment. Comparing the 4 chambers to each other, I
did not find any significant differences in the amount of
mortality (D=.23913, n=23,.02> P > .01).
The reproduction data (Fig. 13) shows similar
patterns of reproduction in chamber 3 and chamber 4. The
peak on Day 17 for Chamber 1 is a statist'ical anomaly due
to the .small number of animals in the chamber. It
represents a total of 2 neonates produced over the last
two days by the last surviving individual. No epphippia
or males were produced by any animals during the
experiment.
December 1982
I ran the December experiment for a total of 12 days
at a starting temperature of 14° C. I collected anima'ls
and seston on 16 December and started the experiment on 18
December. It was terminated when I ran out of lake seston
(see Table 1). There was a significant difference in the
average i n i t i a l lengths of the animals .in the 4 treatments
(F=4.02, .025> P >.01)

90
Figure 10 shows the growth of the animals in each of
the treatments for this month. In Chamber 1, the slight
decrease in average length on Day 10 was due to the death
of 1 large individual and the large error bars an Day 12
are due to a difference in size of over 0.5 mm between the
two surviving individuals. Growth in Chamber 2 seems to
be better than in Chamber 1 but it is not significant due
to the large variation in the length of the animals in
Chamber 1 <F=2.05 d.f.=l,6 .25>P>.1>. Chamber 4 seems
to have better growth than chamber 3. The growth response
in chambers 2 and 3 is similar to that seen in March,
except that this month chamber 3 does seem to benefit from
the hundredfold increase in enrichment.
The animals in chamber 4 were the only ones that
produced neonates by the end of the experiment. Figure 13
shows the number of eggs produced per female per day.
Chamber 4 shows the highest production of eggs followed by
chamber 3 and chamber 2. I observed no production of
epphippia or males during the experiment. Figure 7 shows
the survivorship data for December. Chambers 2 and 4 had
similar survivorship patterns and in both of these
chambers survivorship was not constant over time (Table
3). Most of the mortality occurred during the first four
days and may be due to poor condition of the collected
animals. Chambers 1 and 3 were also similar to each other
and showed no significant differences in mortality over

91
time. I found no significant differences in survivorship
among the 4 treatments <D=.11364, n=22, P>.5). The flow
interruptions (Table 2) did not seem to have an effect on
surv i vorsh ip.
January 1983
I collected the animals for this final experiment on
6 January and started the experiment the next day on 7
January. I ran the experiment for 16 days at a constant
temperature of 12o c (see Table 1). The average i n i t i a l
length of the animals in each of the treatments were not
significantly different (F=0.24, P>.25>.
In Figure 10, I have plotted the growth data for this
month. Chamber 1 shows more growth than chamber 2 during
the -first two-thirds of the. experiment. Mortality (Fig.
7) among large individuals does not account for the slow
growth in Chamber 2. Chamber 3 also shows more growth
than Chamber 4 throughout most of the experiment. Chamber
4 doesn't exhibit greater growth than chamber 1 (fed only
lake seston) for the first two-thirds of the experiment.
This fact would point to some toxic effect of the
enrichment algae except fot the fact that chamber 3 does
not show a similar limitation. The point for Chamber 3
not included on the line at Day 11 was due to errors I
made measuring the animals and so I did not extend the

92
l i n e through the point, but I did include it for
i 1 1ustrat ion.
The fi n a l average length in chamber 4 did not differ
from that in chamber 3. It did not seem to affect egg
production as would be expected if there were a chemical
contamination (Figure' 13). By the end of the experiment,
the animals in chamber 4 were producing more eggs per
female per day than in chamber 3. Chamber 3 animals did
start producing eggs earlier, a pattern seen before in
February, April and November. My statistical analysis did
not find any significant differences in survivorship over
the course of the experiment (Table 3) or in the mortality
between the treatments (D=.15, n=10, P>.5>.


