

EU economic governance and fiscal
decentralisation
Joaquim Oliveira Martins
Head, Regional Development Policy Division
OECD
Brussels, 24 June 2014

Subnational governments (SNGs) are key
economic actors in the OECD and the EU
39,9%
63,3%
50,0%
72,2%
33,2%
19,6%33,6%
51,7%
45,9%
65,8%
26,6%
15,7%
0%
10%
20%
30%
40%
50%
60%
70%
80%
90%
100%
Expenditure Staff
expenditure
Public
procurement
Direct
investment
Tax revenue Debt
OECD average Minimum Maximum European Union average
% of General Government - 2012

Weight of the subnational government expenditure
in GDP and Total Public expenditures
Australia*
Austria
Belgium
Canada**
Germany
Mexico* Spain
Switzerland*
United States*
Czech Rep.
Denmark
Estonia
Finland
France
Greece
Hungary
Iceland
Ireland Israel*
Italy
Japan*
Korea*
Luxembourg
Netherlands
New Zealand**
Norway
Poland
Portugal
Slovak Rep.Slovenia
Sweden
Turkey*
United Kingdom
OECD33
EU27
0%
10%
20%
30%
40%
50%
60%
70%
80%
0% 5% 10% 15% 20% 25% 30% 35% 40%
Subnational government expenditure as a % of GDP in 2012
Su
bn
ati
on
al g
ove
rnm
en
t e
xpe
nd
itu
re a
s a
% o
f p
ub
lic
exp
en
dit
ure
in 2
01
2
* 2011 data ; ** : 2010 data

Role of Subnational Governments by types of
expenditures
26%
18%
14% 14%12%
16%
20%
13%12%
16%
20%18%
0%
5%
10%
15%
20%
25%
30%
Education Health Economic
Affairs
General
Services
Social
protection
Other*
OECD (27 countries) EU27
OECD and EU (2011, % of expenditure)
*Other: Defence; Public order and safety; Housing and community amenities; Recreation, culture and religion; Environment.

The role of SNGs is particularly marked for Public
Investments
5
72%66%
0%
10%
20%
30%
40%
50%
60%
70%
80%
90%
100%
Ca
na
da
Be
lgiu
m
Un
ite
d S
tate
s
Ge
rma
ny
Sw
itze
rla
nd
Jap
an
Fra
nce
Fin
lan
d
OE
CD
33
avg
Ita
ly
Ire
lan
d
Au
stri
a
Au
stra
lia
EU
27
Ne
the
rla
nd
s
Me
xico
Isra
el
Sp
ain
De
nm
ark
Slo
ve
nia
Cze
ch R
ep
ub
lic
Ko
rea
Po
rtu
ga
l
Sw
ed
en
No
rwa
y
Un
ite
d K
ing
do
m
Slo
va
k R
ep
ub
lic
Ice
lan
d
Po
lan
d
Ne
w Z
ea
lan
d
Luxe
mb
ou
rg
Hu
ng
ary
Tu
rke
y
Est
on
ia
Gre
ece
Rest of public sector (central government and social security)
Subnational governments (States, regions and local governments)
Subnational direct investment as a % of public direct investment (2012)

Among subnational government expenditures,
Public investment was the most hit (EU, 2000-13)
In volume, base
year 2000 = 100
Change in 2013 (%)
+0,1%
-2,3%
-0,8%
+1,0%
-1,4%
+0,2%
100
105
110
115
120
125
130
135
140
145
150
2000 2001 2002 2003 2004 2005 2006 2007 2008 2009 2010 2011 2012 2013
GDP Total expenditure
Direct investment Social benefits
Staff expenditure Intermediate consumption
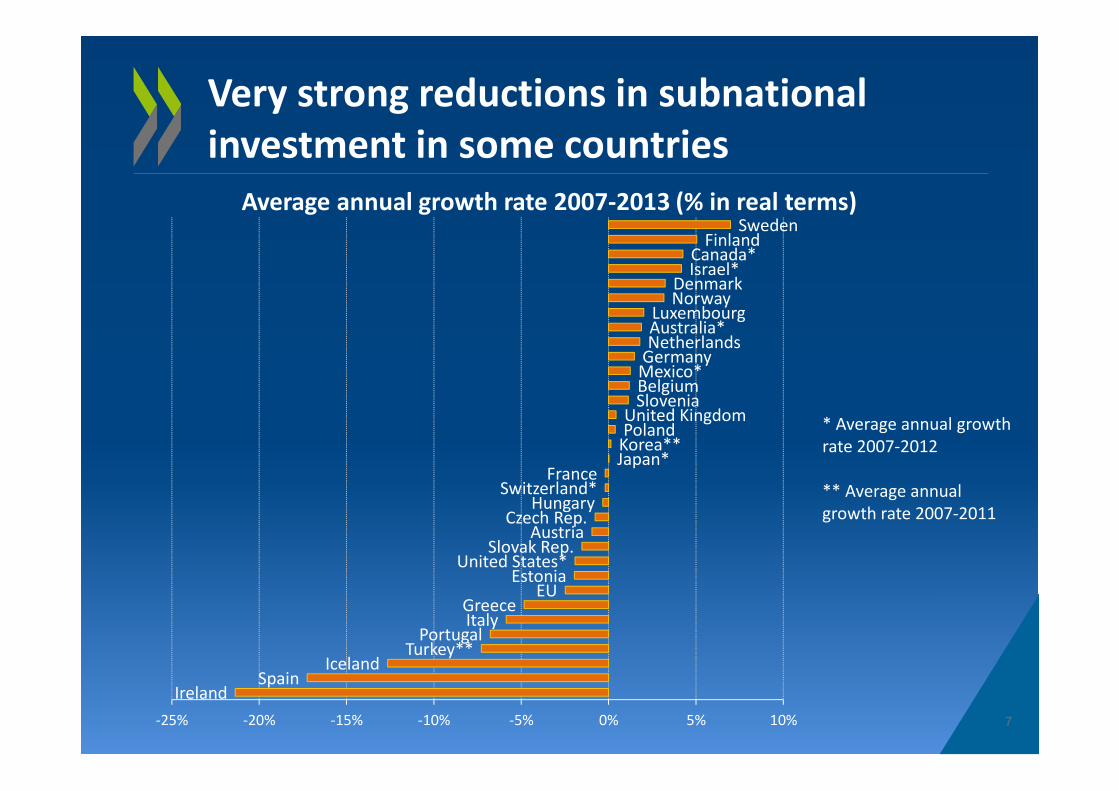
Very strong reductions in subnational
investment in some countries
7
* Average annual growth
rate 2007-2012
** Average annual
growth rate 2007-2011
IrelandSpain
IcelandTurkey**
PortugalItalyGreece
EUEstonia
United States*Slovak Rep.
AustriaCzech Rep.
HungarySwitzerland*
FranceJapan*Korea**PolandUnited Kingdom
SloveniaBelgiumMexico*GermanyNetherlandsAustralia*Luxembourg
NorwayDenmark
Israel*Canada*
FinlandSweden
-25% -20% -15% -10% -5% 0% 5% 10%
Average annual growth rate 2007-2013 (% in real terms)
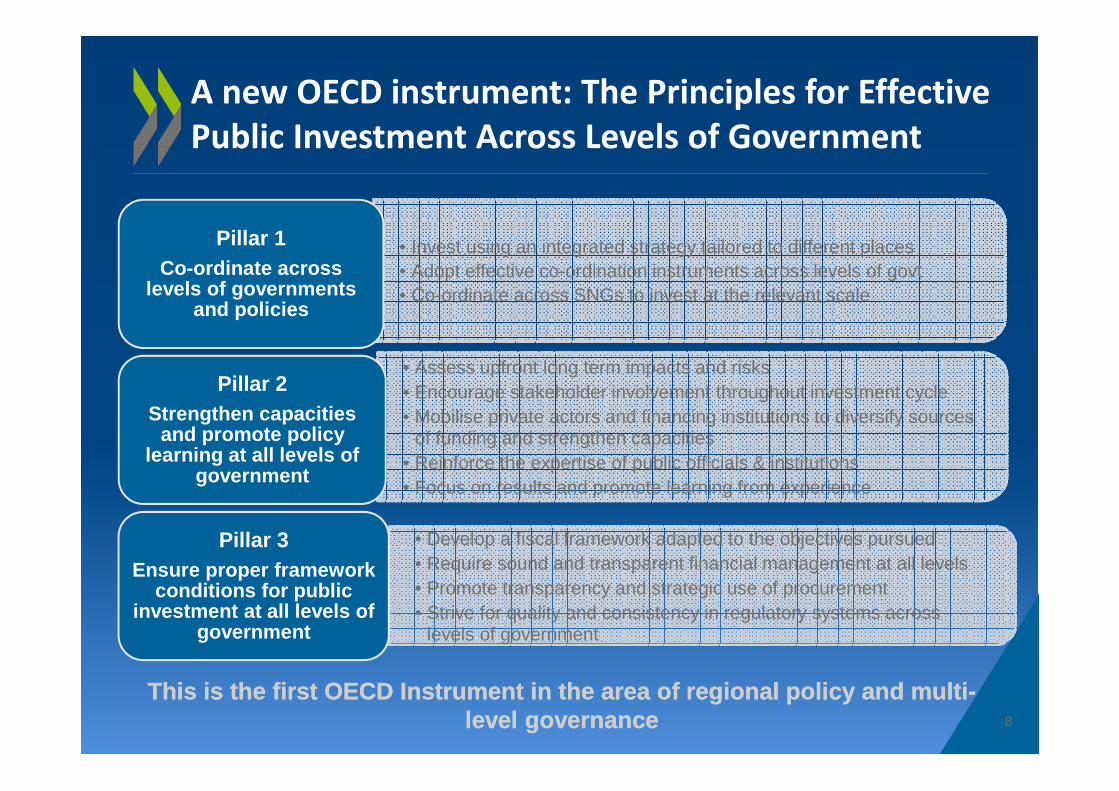
• Invest using an integrated strategy tailored to different places• Adopt effective co-ordination instruments across levels of govt• Co-ordinate across SNGs to invest at the relevant scale
Pillar 1Co-ordinate across
levels of governments and policies
• Assess upfront long term impacts and risks• Encourage stakeholder involvement throughout investment cycle• Mobilise private actors and financing institutions to diversify sources
of funding and strengthen capacities• Reinforce the expertise of public officials & institutions • Focus on results and promote learning from experience
Pillar 2Strengthen capacities
and promote policy learning at all levels of
government
• Develop a fiscal framework adapted to the objectives pursued• Require sound and transparent financial management at all levels• Promote transparency and strategic use of procurement • Strive for quality and consistency in regulatory systems across
levels of government
Pillar 3Ensure proper framework
conditions for public investment at all levels of
government
8
A new OECD instrument: The Principles for Effective
Public Investment Across Levels of Government
This is the first OECD Instrument in the area of re gional policy and multi-level governance
This is the first OECD Instrument in the area of re gional policy and multi-level governance

The Governance system of SNGs:
a fragmented and evolving picture
Federations & quasi-federation
Unitary countries
38 960
4 160
360
573
78
2 489
1 766
2443 031310 8 185
36 828
8 222
437
114
74
11 638
446 311320
254
338
3 1962 935
2 3632 434
605
4202 875
6 267
103
106
211
226
OECD: 140 879 subnational governments in 2012:
• 136 346 municipal-level entities• 4 007 intermediary-level entities• 526 regional or State-level entities

10
Large variation in average population and
land size across municipalities
1317171724293236375052628796102126200220266266274299406440440601612
7989001 057
1 3921 552
2 1922 408
4 0256 000
0 1 000 2 000 3 000 4 000 5 000 6 000 7 000
Czech RepublicSlovak Republic
SwitzerlandFrance
LuxembourgHungary
GermanyAustria
ItalyEU27
BelgiumSpainIsrael
SloveniaNetherlands
PolandEstonia
JapanOECDTurkey
United StatesPortugal1
GreeceDenmark
Korea1United Kingdom1
IrelandMexicoNorwayFinlandIceland
SwedenChile
CanadaNew-Zealand
Australia
Average municipal area, km²
1 6801 7351 8503 1403 3053 5904 3204 6055 6705 6905 9057 1707 3058 2408 8159 1159 66511 72515 54516 91518 85525 18031 05032 93534 05034 88538 96040 08541 12544 78050 44056 180
64 55074 170
155 775220 285
0 50 000 100 000 150 000 200 000 250 000
Czech RepublicFrance
Slovak RepublicHungary
SwitzerlandAustriaIceland
LuxembourgEU27Spain
EstoniaGermany
ItalyCanada
United StatesOECD
SloveniaNorwayPolandFinland
BelgiumTurkey
IsraelSwedenPortugalGreeceIreland
AustraliaNetherlands
MexicoChile
DenmarkNew-Zealand
JapanUnited Kingdom
Korea
Average number of inhabitants per municipality

Regional governments vs. municipal
governments: a more contrasted picture
11
Germany
Mexico
ItalyFrance*
Spain
Japan
Poland
Netherlands
Chile DenmarkAustria Turkey Greece
Czech rep.Slovak rep.Hungary
Sweden New Zealand
Switzerland
Norway
0
500
1.000
1.500
2.000
2.500
3.000
3.500
4.000
4.500
5.000
5.500
0 10.000 20.000 30.000 40.000 50.000 60.000 70.000 80.000
Av
era
ge
re
gio
na
l g
ov
ern
me
nt
size
(th
ou
san
ds
of
inh
ab
ita
nts
)
Average municipal size (inhabitants)
France: without overseas regions ;
Belgium, United Kingdom, Canada, United States, Australia and Korea are not represented on this graph.
Average size of regional and municipal governments (population)

Size of regional government budget in 2012 (expenditure as a % of GDP)
Economic weight of regional governments
may not match their population size
12
1,0%
1,3%
1,5%
1,7%
2,2%
3,9%
6,0%
6,6%
9,7%
9,9%
11,3%
12,2%
13,4%
15,3%
18,1%
19,4%
0% 2% 4% 6% 8% 10% 12% 14% 16% 18% 20%
Poland
France
Netherlands
Slovak Rep.
Norway*
Czech rep.*
Denmark
Sweden
Austria*
Mexico
Italy
Germany
Switzerland
Belgium
Spain
Canada
Austria* : excluding Vienna; Norway*: excluding Oslo
Czech republic*. estimated 2011 figures
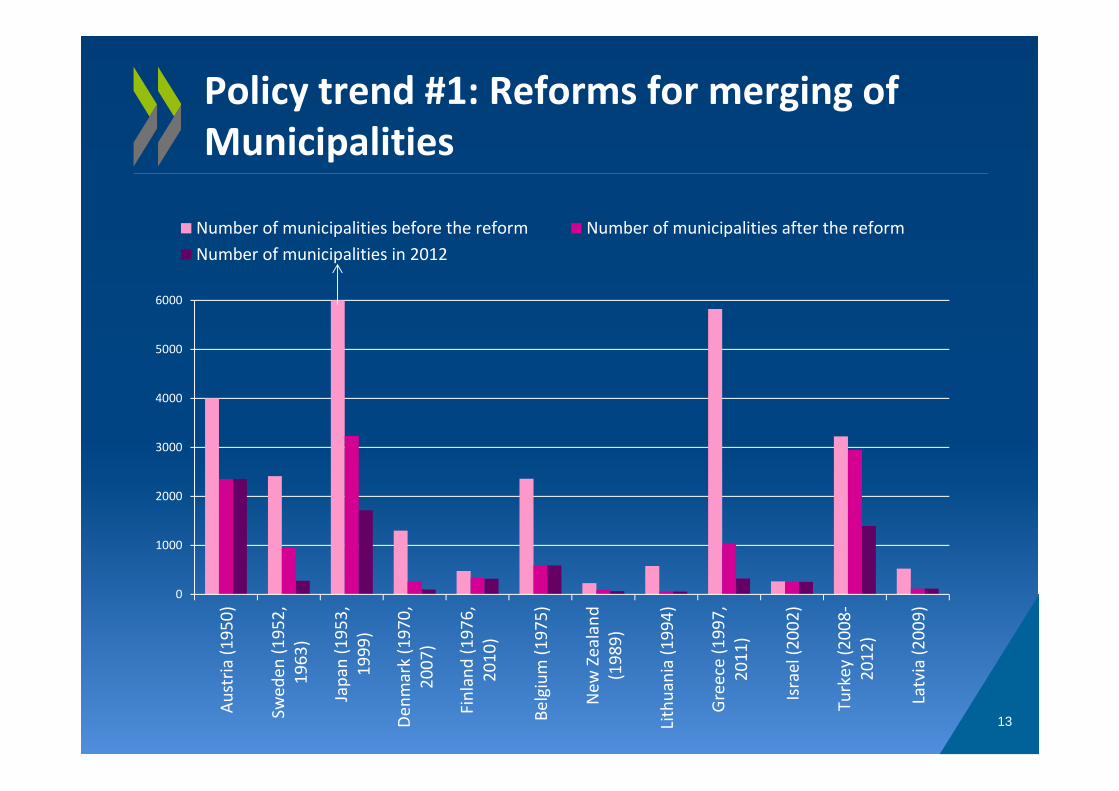
Policy trend #1: Reforms for merging of
Municipalities
13
0
1000
2000
3000
4000
5000
6000
Au
stri
a (
19
50
)
Sw
ed
en
(1
95
2,
19
63
)
Jap
an
(1
95
3,
19
99
)
De
nm
ark
(1
97
0,
20
07
)
Fin
lan
d (
19
76
,
20
10
)
Be
lgiu
m (
19
75
)
Ne
w Z
ea
lan
d
(19
89
)
Lith
ua
nia
(1
99
4)
Gre
ece
(1
99
7,
20
11
)
Isra
el
(20
02
)
Tu
rke
y (
20
08
-
20
12
)
Latv
ia (
20
09
)
Number of municipalities before the reform Number of municipalities after the reform
Number of municipalities in 2012

Policy trend #2: A growing focus on
metropolitan governance
14
Average number of metropolitan governance bodies created or reformed in OECD countries per decade
0
5
10
15
20
25
30
35
40
45
50
1951-1960 1961-1970 1971-1980 1981-1990 1991-2000 2001-2010

Policy trend #3: Fiscal autonomy and
partnerships across levels of government
� Creation of new taxes
� Tax collection
� Leeway over tax rates
� Leeway over tax bases
� Legal power
� Regulatory / administrative /
adaptation power
� Scope of competences and
functions
Tax autonomy
index:
Own-source tax
revenue as a %
of total
revenues
The main components of fiscal
autonomy
0
2
4
6
8
10
Assets management
(financial, physical)
Tariffs & fees
(leaway)
Taxes
Grants and subsidies
(earmarked/general)
Borrowing
Budget management
Spending and investment
(norms & standards, etc.)
Human
resources
Local public service
delivery
Control : monitoring, audit,
evaluation, performance
assessment
Equalisation mechanisms

• OECD national accounts and Eurostat
• OECD (2013) « Regions at a Glance »
• OECD (2014) “Subnational government in OECD countries: key
data”
• “Investing Together: Working Effectively across Levels of
Government”, OECD Publishing (forthcoming December 2013)
• OECD Regional Outloook 2014 (forthcoming)
• http://www.oecd.org/gov/regional-policy/
• OECD Fiscal Network: : http://www.oecd.org/tax/federalism/
Thank you !
16


