

EUropean Best Information through Regional Outcomes in Diabetes
Risk Adjusted Diabetes
Indicators Fabrizio Carinci
Technical Coordinator
The BIRO Academy2nd Residential Course
Brussels, 23rd-25th January 2011

The BIRO Academy 2nd Residential Course Brussels, 23rd-25th January 2011
Quality of Care and Outcomes Monitoring
• Meaningful assessment of quality of care and outcomes requires:– Measure of quality of care or outcome
(indicator)– A way to risk adjust for the different risk of
patients for various outcomes– Risk adjustment methods allow us to
compare quality of care and outcomes for groups of patients with different risk factors

The BIRO Academy 2nd Residential Course Brussels, 23rd-25th January 2011
Unexplained variability in patient outcomes
“...your results are quite different from the mean”
“...my patients are different!”

The BIRO Academy 2nd Residential Course Brussels, 23rd-25th January 2011
These are everywhere today!
Case-mixProvider Profiling

The BIRO Academy 2nd Residential Course Brussels, 23rd-25th January 2011
Standardization
(the epidemiologist way....)
Two main forms of standardisation:
1.Direct Applies the strata-specific rates of outcomes
of the population of interest to the standard population (calculates the rate of events IF the populations of interest had the same structure as a reference population)

The BIRO Academy 2nd Residential Course Brussels, 23rd-25th January 2011
Standardization (2)
2.Indirect
Adjusts for differences in case-mix by calculating the number of events expected for the outcome of interest in a specific population, based on its structure, if it had the same distribution of outcomes as a reference population.

The BIRO Academy 2nd Residential Course Brussels, 23rd-25th January 2011
Standardization (3)
• Standardized Ratio:– O/E%
• Risk Adjusted Average– Standardized Ratio*Population Average

The BIRO Academy 2nd Residential Course Brussels, 23rd-25th January 2011
Provider Comparisons
8/800 (1%)20/200 (10%)
A
50% (1%)50% (5%)
2/200 (1%)80/800 (10%)
B
10/800 (1.25%)25/200
(12.50%)C
Low Risk
High Risk
Standard Population2.8%
8.2%
3.5%
3%

The BIRO Academy 2nd Residential Course Brussels, 23rd-25th January 2011
Provider Comparisons
8/800 (1%)20/200 (10%)
A
50% (1%)50% (5%)
2/200 (1%)80/800 (10%)
B
10/800 (1.25%)25/200
(12.50%)C
Low Risk
High Risk
Standard Population2.8%
8.2%
3.5%
3%
4.7%
5.8%
5.8%

The BIRO Academy 2nd Residential Course Brussels, 23rd-25th January 2011
Statistical Models
Allow performing standardization in more complex situations, where risk factors may be several and the sources of variability at different levels
Risk adjustment methods require the development of statistical models that explain the outcome variables of interest based on patient characteristics we wish to control.

The BIRO Academy 2nd Residential Course Brussels, 23rd-25th January 2011
Key questions
• Risk of what?
• Over what time frame?
• What population?
• What is the purpose of the model?
• What are the risk factors?
• What are the data sources?
• What tools are available to build the models?

The BIRO Academy 2nd Residential Course Brussels, 23rd-25th January 2011
The unreliability of individual physician "report cards" for assessing the costs and quality of care of a chronic disease, Hofer TP et al., JAMA. 1999 Jun 9;281(22):2098-105.
1991 1992
-0.4
-0.2
0.0
0.2
0.4
-0.4
-0.2
0.0
0.2
0.4
Outlier Physicians (1991)
Non-outlier Physicians (1991)

The BIRO Academy 2nd Residential Course Brussels, 23rd-25th January 2011
Functional forms to model risk

The BIRO Academy 2nd Residential Course Brussels, 23rd-25th January 2011
Diabetes Indicators
• Many diabetes indicators are expressed in terms of percentages. They can be read as a deviation from an optimal target (e.g. 100% patients with at least one GP visit per year)
• Measurements at the level of each patient take the numeric form of 0=No / 1=Yes (binary outcomes). They are easy to interpret and can be easily managed by policy makers in terms of performance indicators.

The BIRO Academy 2nd Residential Course Brussels, 23rd-25th January 2011
Odds Ratio
The level of association between a set of potential risk factors
and a binary outcome is usually expressed in terms of odds
ratios. For each trial i a set of explanatory variables is linked
to the outcome through the following relationship:
ln[pi/(1-p
i)] = +
1 X
1,i +
2X
2,i +...
k X
k,i
Slope: coefficient
Multiplier of "log odds" for each unit increase in X
exp() is the effect of the independent variable on the "odds ratio“
OR<1 factor “associated” with a DECREASE in risk
OR=1 no association
OR>1 factor “associated” with an INCREASE in risk
The BIRO Academy 2nd Residential Course Brussels, 23rd-25th January 2011
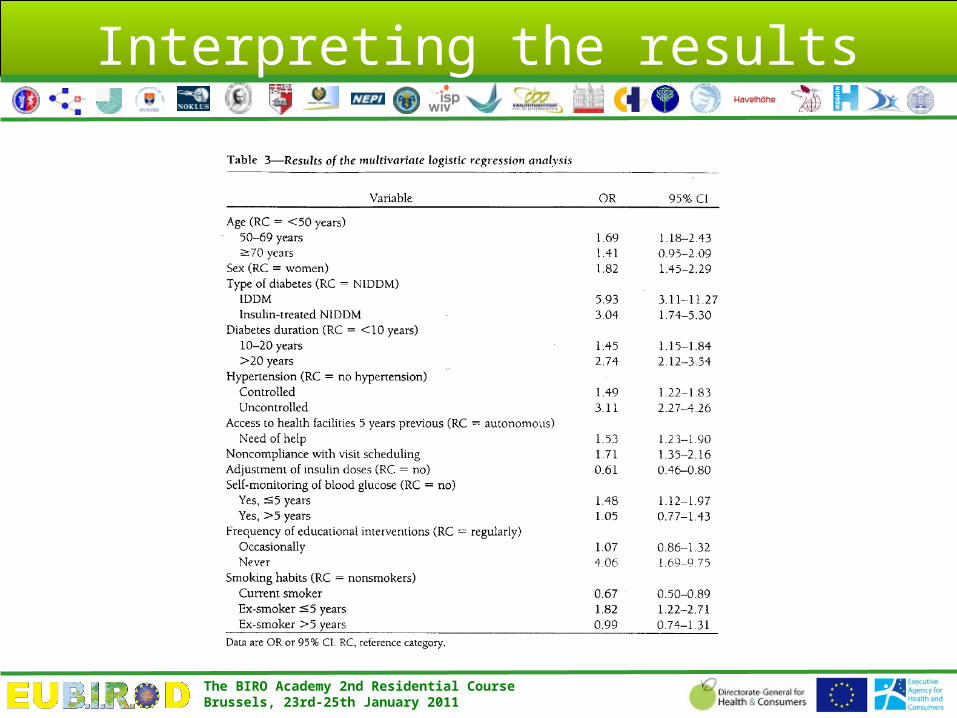
Interpreting the results

The BIRO Academy 2nd Residential Course Brussels, 23rd-25th January 2011
US AHRQuality Indicators

The BIRO Academy 2nd Residential Course Brussels, 23rd-25th January 2011
Risk models
• A risk model is usually required separately for each outcome of interest (one for each diabetes indicator)
• Age and gender are routine candidates to be included in risk adjustment models

The BIRO Academy 2nd Residential Course Brussels, 23rd-25th January 2011
AHRQ Standardization
Risk adjustment model (overall or within a region)
Y(%) = 0+1(females)+2(age_class1)+...k(age_class4)
Source unit
Yi expected= 0+1(females)+2(age_class1)+...k(age_class4)
Predi x 100 = Expected Rate
Standardized Rate= (observed rate/expected rate)*population rate

The BIRO Academy 2nd Residential Course Brussels, 23rd-25th January 2011
Logistic regression without individual data
Complete Sample
Combinations ofLevels of Covariates
Same results !

The BIRO Academy 2nd Residential Course Brussels, 23rd-25th January 2011
BIRO System Standardization

The BIRO Academy 2nd Residential Course Brussels, 23rd-25th January 2011
Adjusted Outcome Indicators
• Predicted Value for each combination=
e(+1 X1,i +2X2,i +...k Xk,i )/(1+e(+1 X1,i +2X2,i +...k Xk,i ))• Expected Rate=Sum of the Total Predicted
Values over a unit (multiply each predicted value by the total number of observations per stratum, then sum)
• Compute Adjusted Rate

The BIRO Academy 2nd Residential Course Brussels, 23rd-25th January 2011
Application
• BIRO Data• R program
d <-read.csv("riskdata_528.csv", header=TRUE)
d<-d[d$age2_c!="[0 - 18)",]
m<-glm(hypert_med~sex*age2_c, d, family=binomial, weights=n)
summary(m)
s<-m$fitted*d$n
exp<-aggregate(s,by=list(dbname=d$dbname),FUN=sum)
write.csv(m$coefficients,file="coeff_riskdata_528.csv")


