
European gas hubs: how strong is price correlation?
Beatrice Petrovich
NG 79
October 2013

ii
The contents of this paper are the authors’ sole responsibility. They do not necessarily represent the views of the
Oxford Institute for Energy Studies or any of its members.
Copyright © 2013
Oxford Institute for Energy Studies
(Registered Charity, No. 286084)
This publication may be reproduced in part for educational or non-profit purposes without special permission from
the copyright holder, provided acknowledgment of the source is made. No use of this publication may be made
for resale or for any other commercial purpose whatsoever without prior permission in writing from the Oxford
Institute for Energy Studies.
ISBN 978-1-907555-82-4

iii
Acknowledgements
I am very grateful for the encouragement, support and helpful suggestions from the Oxford Institute for Energy
Studies and in particular my grateful thanks go to Howard Rogers and Jonathan Stern. I must also thank the
Tankard Parties staff for their invaluable help and support through the project (and in particular a big thanks to
Alexandra Davidson, Jeremy Elliott, Matt Joy, Richard Frape and Arancha Hernan). I am really grateful for the
insightful comments received during the Gas Programme Sponsors’ Meetings. I also would like to thank APX
ENDEX (Wouter de Klein, Paul Suripatty), EEX market service team and the Cegh exchange market service
team.
I would like to thank the sponsors of the Natural Gas Research Programme (OIES) for their support and useful remarks.
Thank you to all who supported and encouraged me during this research project.
I am, however, fully responsible for any remaining shortcomings and errors.

iv
Preface
While the UK’s traded market became an established feature of the European gas landscape as early as 1996,
the development of the Continental European gas hubs has by and large been a post-2005 phenomenon. The
UK’s NBP was the outcome of more than a decade of privatisation and competition policy and national
legislation. While the succession of pro-competition measures (or ‘packages’) at the EU level since the early
2000s certainly favoured the development of the continental trading hubs, their progress has faced headwinds in
the form of dominance on the supply-side of the market by long-term contracts which, until recently, were almost
exclusively priced in relation to oil products.
In the 2008 to 2011 period, a surge of LNG supply to Europe, growing accessible pipeline connectivity, supplier
choice for end-consumers and a protracted period in which hub prices were considerably below those of oil-
indexed contract prices, together catalysed the development of liquidity at the continental hubs. Some upstream
suppliers came to embrace this transition, others continue to resist; but in the downstream markets hub
development has been generally assisted by co-operation between system operators and regulators.
Despite these favourable trends, in order to assess the degree to which the European traded hubs have matured
to the point where they can be said to represent a reliable and representative ‘market price’ extensive data and
quantitative analysis is required. In this context Beatrice Petrovich’s paper is a truly landmark work. The analysis
in this paper accesses price data available from the various trading exchanges in Europe, however what sets it
aside from previous research is that it also incorporates OTC (Over the Counter) market data. Through an OIES
data licence agreement with the Tankard Parties (ICAP Energy Limited (ICAP), Marex Spectron Group (Marex
Spectron) and Tullett Prebon Group Limited (Tullett Prebon)), brokers who in aggregate represent some 80% to
90% of the European gas OTC market, Beatrice was able to access and analyse anonymised price and volume
data on every trade on every European hub considered since January 2007.
The degree of price correlation between hubs demonstrated by this analysis provides compelling support for the
hypothesis that the European hubs do provide a reliable price reference. Where anomalies occur they can be
related either to hub immaturity in early periods or to physical connectivity constraints.
The development of the European gas market has been a core research theme for the Oxford Institute for Energy
Studies Gas Programme since its inception. Beatrice’s success in managing and analysing a truly enormous
mass of data to distil such clear and unequivocal findings is highly commendable. I am delighted to add this
paper to the canon of European gas market research published by the Gas Programme.
Howard Rogers
Oxford September 2013.
v
Contents
Acknowledgements ................................................................................................................................ iii
Preface ................................................................................................................................................... iv
Contents ................................................................................................................................................ v
Introduction ........................................................................................................................................... vi
1. Background ......................................................................................................................................... 2
1.1 Relevance of the research question ............................................................................................. 2
1.2 Related literature .......................................................................................................................... 3
2. Methodology ....................................................................................................................................... 5
3. Data ..................................................................................................................................................... 9
3.1 Data Sources ................................................................................................................................. 9
3.2 Dataset features .......................................................................................................................... 10
3.2.1 Dataset description .............................................................................................................. 10
3.2.2 Selected contracts ................................................................................................................ 10
3.2.3 Daily weighted average prices ............................................................................................. 11
3.3 Data coverage ............................................................................................................................. 12
4. Data overview ................................................................................................................................... 13
4.1 Volumes ...................................................................................................................................... 13
4.2 Prices ........................................................................................................................................... 19
5. Results ............................................................................................................................................... 31
5.1 OTC - exchange price correlation ................................................................................................ 31
5.2 Short term trading price correlation ........................................................................................... 34
5.3 Longer term trading price correlation ........................................................................................ 36
5.4 Which is the benchmark hub? .................................................................................................... 39
5.5 Temporary Price Delinkages ....................................................................................................... 40
6. Conclusions ....................................................................................................................................... 50
Appendix 1: Data creation .................................................................................................................... 51
Appendix 2: Additional methodological notes ..................................................................................... 56
Appendix 3: Robustness test ................................................................................................................. 57
Glossary ................................................................................................................................................. 60
Bibliography .......................................................................................................................................... 63
vi
Figures
Figure: 1 Selected contracts .................................................................................................................... 7
Figure 2: TTF gas futures contracts traded on ICE ENDEX exchange in 2012 (no. of transactions across
different contracts) ............................................................................................................................... 11
Figure 3: Volume breakdown for each hub, 2007-1H2012, 4 selected contracts (TWh) ..................... 14
Figure 4: Gas volumes traded, OTC DA 2007-2011, (TWh) ................................................................... 15
Figure 5: Gas volumes traded, OTC MA, 2007-2011 (TWh) .................................................................. 15
Figure 6: OTC volume breakdown for each hub, DA and MA contract, 2007-1H2012 (TWh) .............. 17
Figure 7: Exchange traded volumes, DA contract (TWh) ...................................................................... 18
Figure 8: Exchange traded volumes, MA contract (TWh) ..................................................................... 19
Figure 9: OTC DA daily prices on the European hubs in 2007 (€/MWh)............................................... 20
Figure 10: OTC DA daily prices on the European hubs in 2008 (€/MWh)............................................. 21
Figure 11: OTC DA daily prices on the European hubs in 2009 (€/MWh)............................................. 21
Figure 12: OTC DA daily prices on the European hubs in 2010 (€/MWh)............................................. 22
Figure 13: OTC DA daily prices on the European hubs in 2011 (€/MWh)............................................. 22
Figure 14: OTC DA daily prices on the European hubs in 20121H (€/MWh) ........................................ 23
Figure 15: OTC DA box plots (€/MWh) ................................................................................................. 24
Figure 16: Box plots for OTC DA price premium/discount to NBP, 2007-2012 (€/MWh) .................... 25
Figure 17: OTC MA daily prices on the European hubs in 2007 (€/MWh) ............................................ 26
Figure 18 OTC MA daily prices on the European hubs in 2008 (€/MWh) ............................................. 26
Figure 19: OTC MA daily prices on the European hubs in 2009 (€/MWh) ............................................ 27
Figure 20: OTC MA daily prices on the European hubs in 2010 (€/MWh) ............................................ 27
Figure 21: OTC MA daily prices on the European hubs in 2011 (€/MWh) ............................................ 28
Figure 22: OTC MA daily prices on the European hubs in 20121H (€/MWh) ....................................... 28
Figure 23: OTC MA box plots (€/MWh) ................................................................................................ 29
Figure 24: Box plots for hubs OTC MA price premium/discount over NBP, 2007-2012 (€/MWh) ....... 30
Figure 25: Scatter plots DA exchange versus OTC prices (2007-2012 1H) ............................................ 32
Figure 26: Scatter plots MA exchange versus OTC prices (2007-2012 1H) ........................................... 32
Figure 27: OTC DA pair-wise correlation coefficients, 2007-2012 ........................................................ 34
Figure 28: OTC DA group correlation coefficients, 2007-20121H ........................................................ 35
Figure 29: OTC MA pair-wise correlation coefficients, 2007-20121H .................................................. 36
Figure 30: OTC MA prices on PSV and TTF, 20121H (€/MWh) ............................................................. 37
Figure 31: OTC DA prices on TTF and PSV, 20121H (€/MWh) .............................................................. 38
Figure 32: OTC MA Group correlation coefficients, 2007-2012 ........................................................... 39

vii
Figure 33: Correlation with TTF and correlation with NBP (OTC DA prices) ......................................... 39
Figure 34: Correlation with TTF and correlation with NBP (OTC MA prices) ........................................ 40
Figure 35: IUK flows as a percentage of total transport capacity 2007-20121H .................................. 41
Figure 36: ZEE-NBP spread against IUK flows as a percentage of total capacity by year .................... 42
Figure 37: ZEE-NBP spread and IUK flows as a percentage of total capacity, 2007-1H2012................ 43
Figure 39: OTC DA prices on PEG and TTF, 2012 (€/MWh) .................................................................. 45
Figure 40: OTC MA prices on PEG and TTF, 2012 (€/MWh).................................................................. 45
Figure 41: PEG S, PEG N and PEG S-PEG N spread (OTC DA) (€/MWh) ................................................ 46
Figure 42: PEG S, PEG N and PEG S-PEG N spread (OTC MA) (€/MWh) ............................................... 46
Figure 43: Scatter plot for OTC DA PEG N against PEG S (€/MWh) ...................................................... 47
Figure 44: Scatter plot for OTC MA PEG N against PEG S (€/MWh) ..................................................... 47
Figure 45: Average ratio between net allocations and reduced capacity in the direction of North to
South and Peg North-Peg South transport capacity ............................................................................. 48
Figure 46: Price correlation across hubs, daily percentage change in OTC DA prices .......................... 58
Figure 47: Price correlation across groups of hubs, daily percentage change in OTC DA prices .......... 58
Figure 48: Price correlation across hubs, daily percentage change in OTC MA prices ......................... 59
Figure 49: Price correlation across groups of hubs, daily percentage change in OTC MA prices ......... 59
Tables
Table: 1 Selected contracts and sources ............................................................................................... 10
Table 2: Yearly Pearson correlation coefficients, DA contract ............................................................. 33
Table 3: Yearly Pearson correlation coefficients, MA contract ............................................................ 33
Table 4: Delivery points associated with each hub ............................................................................... 51

1
Introduction
The integration of the European gas market is an important goal of the European Union energy strategy.
Improving open access between the so called “gas hubs”, the marketplaces where gas is exchanged between
participants, is at the top of the EU agenda for the single European gas market1. The EU Gas Target Model will
create incentives for all gas to be delivered and traded at hubs2. Assessing integration between hubs is therefore
fundamental to tracking the outcome of the EU open access policy.
Gas hubs are also playing an important role in the transition of the European gas market away from the oil-
indexed price formation framework, which has been successfully anticipated and tracked by the OIES Gas
Programme3. Within this context, it is crucial to identify and assess which ones of the gas hubs represent the
most reliable market benchmark. In the new system, market pricing – i.e. pricing based on supply and demand
for gas – should be the guiding principle for European gas. Gas hubs are therefore the natural candidates to
provide a valid reference for market pricing. Although European gas hubs are not yet a “perfect” representation of
supply/demand pricing, the 2012 paper by Patrick Heather4 suggests that they can provide the new market
benchmark for pricing natural gas within Europe. Despite this and other papers, the role and reliability of hub
prices continues to be widely debated.
Based on new and extensive empirical evidence, this paper examines the metrics to assess the reliability of hub
price signals as well as their integration i.e. the price correlation across hubs which becomes increasingly strong
over time. This paper suggests that based on price correlations, European gas hubs are already part of the same
integrated market and indeed can increasingly be regarded as providing a reliable price reference for gas in
Europe.
The paper is organized as follows. Chapter 1 argues why price correlation is a relevant issue and presents the
related literature. Chapter 2 describes the methodology. Chapter 3 expands on the data, highlighting the crucial
aspect of data sources, describes the dataset features and finally discusses the span of representation of our
sample. Chapter 4 provides an overview of the volumes involved and hub price evolution. Chapter 5 presents the
results, first assessing the degree of price correlation and then investigating whether there is an obvious
candidate for a benchmark-market hub, i.e. a hub that appears to set the price for at least some of the others.
Chapter 5.5 focuses on two case studies of periods of low correlation (“delinkage”) between hub prices and
investigates whether they can be explained by transient physical factors, such as congestion in transport capacity
between hubs. Chapter 6 concludes.
1 The European Gas Target model envisages “a competitive European gas market as a combination of entry-exit zones with
virtual hubs” where “the development of competition should be based on the development of liquid hubs across Europe at
which gas can be traded (these may be national or cross-border). Market integration should be served by efficient use of
infrastructures, allowing market players to freely ship gas between market areas and respond to price signals to help gas flow
to where it is valued most.” CEER (2011).
2 CEER (2011).
3 Stern and Rogers (2011).
4 Heather (2012).

2
1. Background
1.1 Relevance of the research question
Price correlation across European hubs5 is important in that it may indicate whether gas hubs are part of the
same integrated market for gas and express a broadly common competitive price signal.
Across hubs the price of gas, which is a homogeneous good6, should tend towards uniformity, (allowances being
made for transportation and other transaction costs), only in the absence of regulatory distortions, physical
barriers to trade and other barriers that prevent competition and arbitrage activities. In fact, in such a competitive
context, arbitrage across the hubs should eliminate price differences apart from those due to transaction costs
(such as the cost of transportation). This is often referred by economists as the “relative law of one price” and the
area within which the price of the homogeneous good equalizes, net of transaction costs, is referred as a
“geographic market”7 or, more simply, the markets within this area are defined as integrated markets. Whether
markets are integrated or not can be determined on the basis of price correlation across them, provided that
transportation and transaction costs are not highly volatile8. In fact, within integrated markets, prices in different
locations rarely differ by exactly the transaction costs, as these may differ between market participants and
shocks to supply and demand may create divergent price movements. However, such price movements are
usually limited in time and scale9. Even if the relationship between prices may not be constant over time, the
markets will become more closely integrated as their price movements converge10
.
Since hubs are physically linked through gas infrastructure11
, if we find closely parallel price movements across
hubs, this suggests that hubs form a single geographical market, characterized by competition and without
national regulatory distortions and other barriers to trading activities across hubs. In this study, we believe it is
sufficient to compare price movements across the various hubs as we assume that transportation and transaction
costs are either a minor or at least a stable source of price differences.
Price correlation is therefore important in shedding light on the integration of the European gas market12
, and in
addition, is considered as one possible, although not an exhaustive, metric to assess the efficiency and
competitiveness of hub gas trading. The rationale is the following. The alleged manipulation of hub prices by few
large local market players has been proposed as a reason why a price indexation based on gas hub trades
should be avoided. However, if the prices across different gas market places moved closely over time, this would
make the manipulation hypothesis in this form very unlikely. In fact, according to the relative law of one price,
within interconnected and competitive markets, gas prices resulting from market forces, rather than from
influential market players’ choices, would be highly correlated with spreads depending essentially on transaction
costs, and periods of abnormal correlation would be explained simply by transient physical factors rather than by
market power. Observing tight structural correlation between prices across different gas trading areas is hence a
necessary condition for the presence of efficient pricing.
This said, price correlation is not a sufficient condition for concluding that hubs are fully-functioning and
competitive. For instance, evidence of good correlation does not rule out completely the possibility that prices are
5 A gas hub is a virtual or physical location within the grid where the exchange of gas volumes takes place. In fact a gas hub is
a market for gas, where the commodity is traded on a standardized basis between market participants.
6 Quality differences, in terms of calorific value, do however exist, for instance there is H-gas and L-gas. In this study such
differences are dealt with by using prices based on energy and not volume.
7 Doane and Spulber (1994), P. 488
8 Stigler and Sherwin (1985). P. 557
9 Stigler and Sherwin (1985). P. 557-559.
10 Stigler and Sherwin (1985). P 557-559.
11 See detailed maps at ENTSO-E, www.entsog.eu
12 Note that since our analysis focuses on the European gas consuming areas where hub trading exists, our findings cannot be
used directly to prove the degree of integration in the whole European gas market, which includes also a significant number of
gas consuming areas where a hub does not exist and gas is mostly contracted under long term agreements.
3
affected by the choices of some influential market players. In fact one player may heavily influence prices on a
particular hub and prices in other hubs may follow movements in this hub. Indeed, the present analysis does not
on its own identify the forces that set the baseline trend for hub prices in Europe. In particular the supply
management of upstream players who represent a significant proportion of European supply is likely to influence
general price levels even though such levels were prevalent across the European geography with limited
variation.
It is not the purpose of price correlation analysis and geographical market definition to determine whether the
market is competitive or monopolistic, but a correlation test is usually a step towards the determination of market
competitiveness13
. Other metrics should complement correlation measurement in order to fully assess the
“efficiency” and competitiveness of the hubs. For instance, the influence of players on hub pricing and market
power should be assessed by looking also at their concentration level in the wholesale market14
; market
efficiency may be evaluated by looking at how spreads compared to transaction costs or by assessing the
relationship between flow directions and price differentials. Other complementary metrics for hub efficiency may
include: measures of liquidity such as the churn rate or the re-trading ratio, the depth of liquidity in the futures
curve, the number of participants, measures of trades concentration such as the frequency distribution of
volumes traded on an individual basis, degree of responsiveness to short term perturbations along with possibly
more qualitative measures for reliability and transparency.
Concluding, hub price correlation remains one of the factors indicating that European gas hubs may be capable
of giving a correct price signal for setting the price of gas sold under long term contract. Indeed, although not
sufficient in wholly proving its existence, hub price correlation is a necessary pre-condition for efficient and
competitive market pricing.
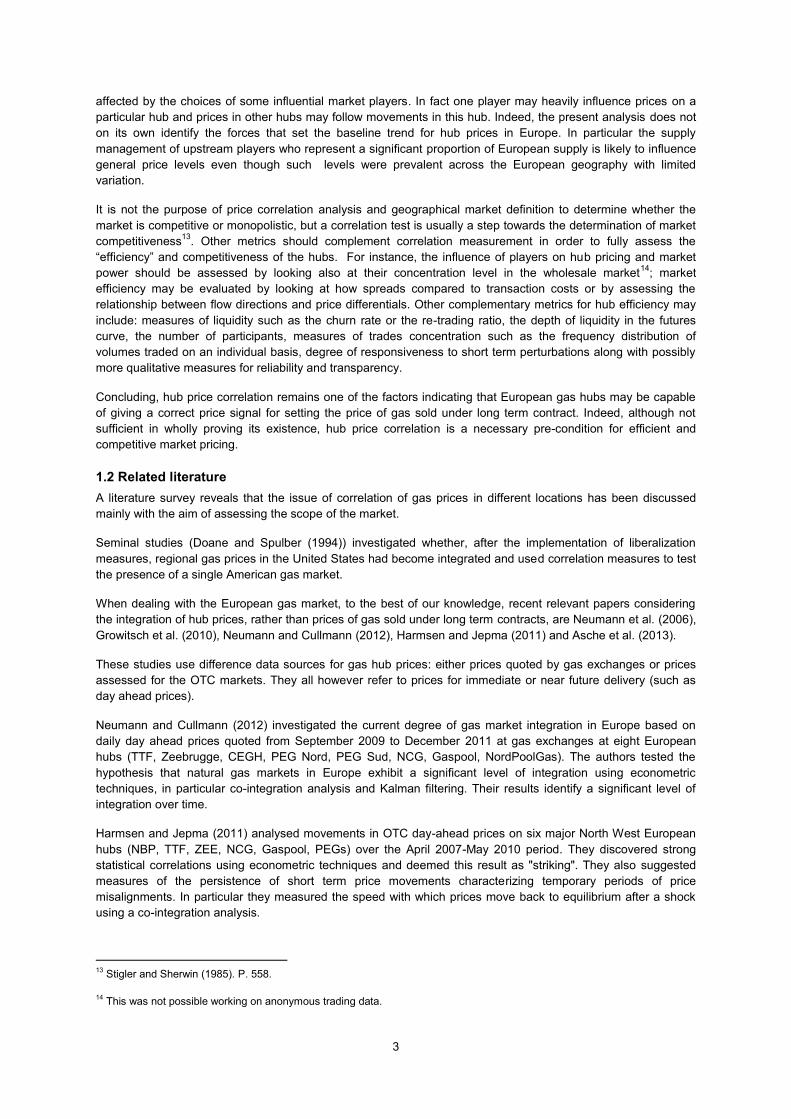
1.2 Related literature
A literature survey reveals that the issue of correlation of gas prices in different locations has been discussed
mainly with the aim of assessing the scope of the market.
Seminal studies (Doane and Spulber (1994)) investigated whether, after the implementation of liberalization
measures, regional gas prices in the United States had become integrated and used correlation measures to test
the presence of a single American gas market.
When dealing with the European gas market, to the best of our knowledge, recent relevant papers considering
the integration of hub prices, rather than prices of gas sold under long term contracts, are Neumann et al. (2006),
Growitsch et al. (2010), Neumann and Cullmann (2012), Harmsen and Jepma (2011) and Asche et al. (2013).
These studies use difference data sources for gas hub prices: either prices quoted by gas exchanges or prices
assessed for the OTC markets. They all however refer to prices for immediate or near future delivery (such as
day ahead prices).
Neumann and Cullmann (2012) investigated the current degree of gas market integration in Europe based on
daily day ahead prices quoted from September 2009 to December 2011 at gas exchanges at eight European
hubs (TTF, Zeebrugge, CEGH, PEG Nord, PEG Sud, NCG, Gaspool, NordPoolGas). The authors tested the
hypothesis that natural gas markets in Europe exhibit a significant level of integration using econometric
techniques, in particular co-integration analysis and Kalman filtering. Their results identify a significant level of
integration over time.
Harmsen and Jepma (2011) analysed movements in OTC day-ahead prices on six major North West European
hubs (NBP, TTF, ZEE, NCG, Gaspool, PEGs) over the April 2007-May 2010 period. They discovered strong
statistical correlations using econometric techniques and deemed this result as "striking". They also suggested
measures of the persistence of short term price movements characterizing temporary periods of price
misalignments. In particular they measured the speed with which prices move back to equilibrium after a shock
using a co-integration analysis.
13
Stigler and Sherwin (1985). P. 558.
14 This was not possible working on anonymous trading data.
4
Asche et al. (2013) investigated the degree of market integration between three hub prices (NBP, Zeebrugge and
TTF), the German contract gas price and oil price, using co-integration tests. The authors assessed whether
there are independent price determination processes for natural gas in different hubs (NBP, Zeebrugge and
TTF) and studied the link between hub prices, the price of a representative long term contract (the German
contract gas price) and oil price. They used monthly data from October 1999 (January 2004 for TTF data) to
March 2010, referring to short term price assessments provided by the Argus Price Reporting Agency for NBP,
Zeebrugge and TTF, as well as to the prices of gas contracted under long term contract as published by the
German Federal Ministry of Economics and Technology15
. Their results indicate highly integrated markets and a
stable relationship between the considered hub short term prices, oil price and contracted gas price.
Finally, a forthcoming study by the University of Groningen (Kuper and Mulder (2013)) discusses the relationship
between cross-border infrastructure constraints, regulatory measures and economic integration of the Dutch –
German gas market, using Bloomberg data for prices.
15
The Federal Office of Economics and Export Control (BAFA), a federal authority subordinated to the Federal Ministry of
Economics and Technology, provides statistics for natural gas imports into Germany.

5
2. Methodology
The primary scope of this paper is to measure to what extent different European hub gas prices move together,
following the same pattern over time. Assessing the strength of price correlation across European gas hubs
appears a relatively simple question at first sight, but in fact is rather complex. There are at least three aspects to
clarify in order to properly address the research question:
1) Which are the relevant gas hubs?
2) Does each of these hubs provide a unique price for the natural gas commodity? If not, which price should we
consider?
3) How do we measure quantitatively the correlation between many prices over time?
Which are the relevant hubs? First of all, it is important to identify which price areas are we considering. Gas in
Europe may be either traded on a hub (i.e. a virtual or physical location within the grid where the exchange of gas
volumes takes place) or traded at the border (before entering the national or European transmission grid).
Additionally, gas can be purchased/sold on the traded market or can be contracted through bilateral, usually long
term, agreements. The focus in this analysis is exclusively on hub trading; long-term contracted gas and border
trading are not considered. Gas hubs have not been developed in all European countries so, based on Heather
(2012) we will focus on the eight major European hubs16
:
National Balancing Point (NBP), based in Great Britain and quoting prices in pence/therm
Title Transfer Facility (TTF) , based in the Netherlands and quoting prices in euro/MWh
Zeebrugge Hub (ZEE) , based in Belgium and quoting prices in pence/therm
Central European Gas Hub (CEGH) , based in Austria and quoting prices in euro/MWh
Gaspool (GSL), based in Germany and quoting prices in euro/MWh
Net Connect Germany (NCG) , based in Germany and quoting prices in euro/MWh
Points d’Echange de Gaz (PEG) including Peg Nord, Peg Sud and Peg TIGF, based in France and quoting
prices in euro/MWh
Punto di Scambio Virtuale (PSV), based in Italy and quoting prices in euro/MWh.
Which prices to look at? First, although natural gas possesses virtually the same properties17
all over Europe,
this commodity can be traded using a wide range of products or contracts having different characteristics,
basically depending on the delivery period. These contracts cannot therefore be considered as a homogeneous
good, they include: annual contracts for delivery of gas over one specific calendar or gas year18
, seasonal
contracts for delivery of gas over a certain summer or winter, quarterly contracts for delivery of gas over a
specific quarter, monthly contracts for delivery of gas over a given month, daily contracts for delivery on a given
day (e.g. the day ahead of the current trading day) and within day contracts for delivery on the same day of the
trading transaction. Note that this is not an exhaustive list. Commonly gas contracts are split into ‘spot’ (up to
16
For an excellent description of these hubs see Heather (2012).
17 Quality differences, in terms of calorific value, do however exist, for instance there is H-gas and L-gas. In this study such
differences are dealt with by using prices based on energy and not volume.
18 In Europe a gas year commences on October 1st and ends on September 30th of the following calendar year.

6
month ahead) or ‘curve’ (products with delivery at least one month ahead)19
. The usual reason for trading in the
spot contracts is to physically balance a portfolio at, or just ahead of, delivery; the curve is usually used for
hedging or speculative purposes20
. Since, at the same moment, each type of contract may be priced differently
from the others due to its own features (ostensibly driven by a view of the gas market fundamentals prevailing in
the relevant timeframe), we conclude that they should be treated separately in a correlation analysis.
Secondly, it is important to take into account that gas contracts may be traded either in the ‘over the counter’
(OTC) market or through organized exchange platforms21
. Although both OTC and exchange trading offer
standardised products22
, trading gas OTC has some notably different features compared to exchange trading23
.
While OTC transactions are not regulated, the Exchanges are subject to regulation and monitoring by the
relevant financial regulator. Moreover OTC deals are bilateral, whereas exchange deals are anonymous and the
Clearing House acts as a central counterparty to all exchange deals. OTC trading does not insure against
counter-party risk as opposed to exchange trading, where the clearing houses provide the gas trading community
with credit risk coverage and leave the parties with very little counter-party risk. The European Exchanges that
offer gas contracts are: ICE-Endex, EEX, Powernext, CEGH Gas Exchange and GME. The decision to engage in
OTC trading rather than trading on an exchange is one which may carry consequences for traders. For instance,
we can imagine that while large firms have significant assets to back their credit position, the smaller players may
have more difficulty securing credit lines and so have a limited capability to trade in the OTC market, and may
prefer exchanges. According to industry sources, due to high capital and credit costs, increasingly OTC trades
are being replaced by exchange clearing to address the counterparty risk, especially for longer-dated products
that imply higher exposure. However trading on exchanges does require guarantees to be given in advance by
participants which could also be a deterrent. At present in generalised terms, OTC is the most common form of
energy trading, but exchange trading is becoming increasingly popular24
.
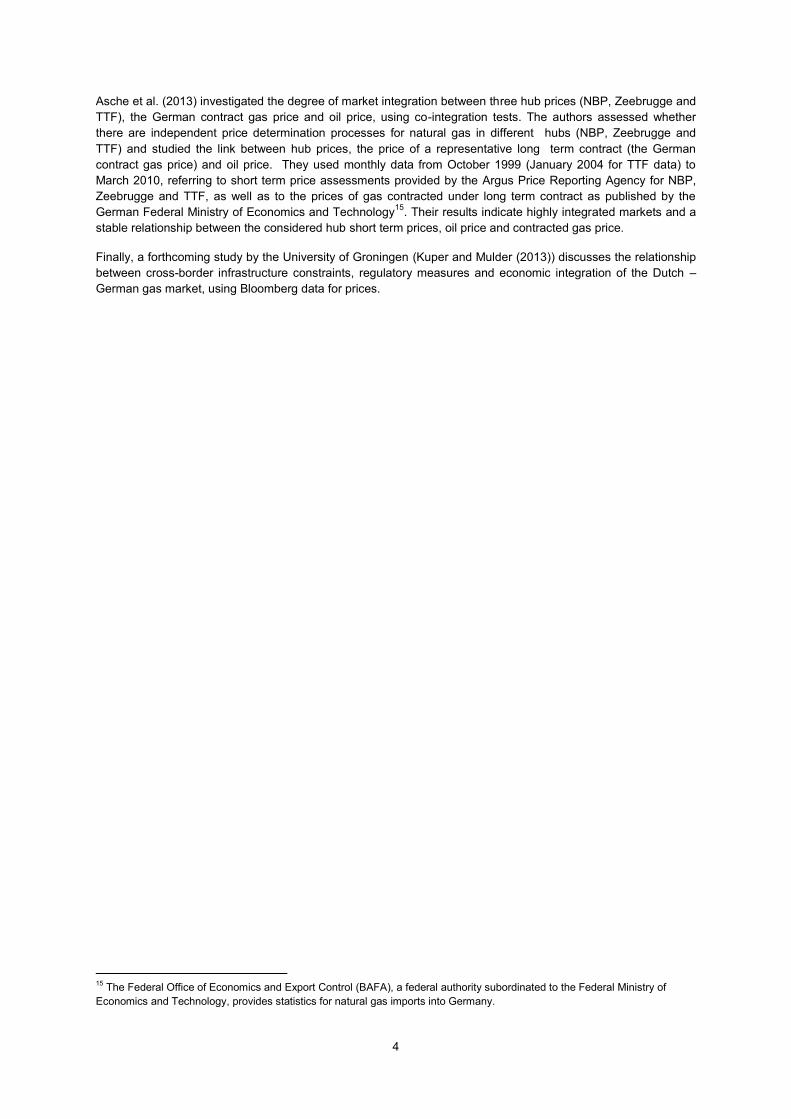
As the range of contracts is so wide, we will focus only on two representative contracts: the day ahead and month
ahead, relating to physical delivery25
of the commodity the day after the trading date and the month after the
trading date respectively (Figure 1). Our choice is motivated by the fact that the differing price correlations across
products characterized by different delivery period is of interest and also that these products are, by and large,
frequently traded and liquid across all the hubs. Accordingly we will consider both OTC and, when possible,
correspondent exchange traded contracts, in order to check whether their prices are consistent. Our analysis
therefore considers four different contracts: OTC day ahead (OTC DA), OTC month ahead (OTC MA), exchange
day ahead (EX DA) and exchange month ahead (EX MA). Section 4.2 discusses these further.
19
Note that ‘spot’, ’forward’, ‘prompt’ are imprecise words and there is not a consensus on the exact delivery time framework
they indicate. Usually spot and prompt refer to up to less than one month ahead delivery, including within day, day ahead,
balance of week.
20 Heather (2010). P. 28.
21 For a description of different methods of trading see Heather(2010). P. 24-27.
22 Meaning that the contracts to trade gas are not entirely negotiated individually by parties, but contracts include standardised
billing and payment terms, standardised rate at which traded volumes are delivered, standardized force majeure clauses etc.
Only the price and volume are negotiated (Heather 2010).
23 See Heather (2010) P. 24-27 for details
24 Heather (2010). P. 25, Heather (2012), P.30.
25 Note that at expiry a contract is settled through physical delivery of the commodity, but a financial player - or anyone who
does not want to sell or to consume the gas - may settle the payment but “give up” the volume to an exchange (i.e. tendering
the quantity of gas on an exchange platform for whatever price it can be sold for). Alternatively a financial player may re-sell the
quantity ahead of the deadline for physical nomination to a physical OTC buyer. The actual physical volume delivered through
the grid is what has been nominated to the system operator on day d-t (usually the day ahead delivery) after “netting off” all the
traded volumes relating to contracts which go to physical delivery straight after day d-t (usually the day after).
7
Figure: 1 Selected contracts
Source: Author
As many trades for the same contract will be closed on the same day, in order to have a representative daily
price time series, we considered the daily volume-weighted average price for OTC DA, OTC MA, EX DA and EX
MA. Section 4.2 further discusses this methodological choice.
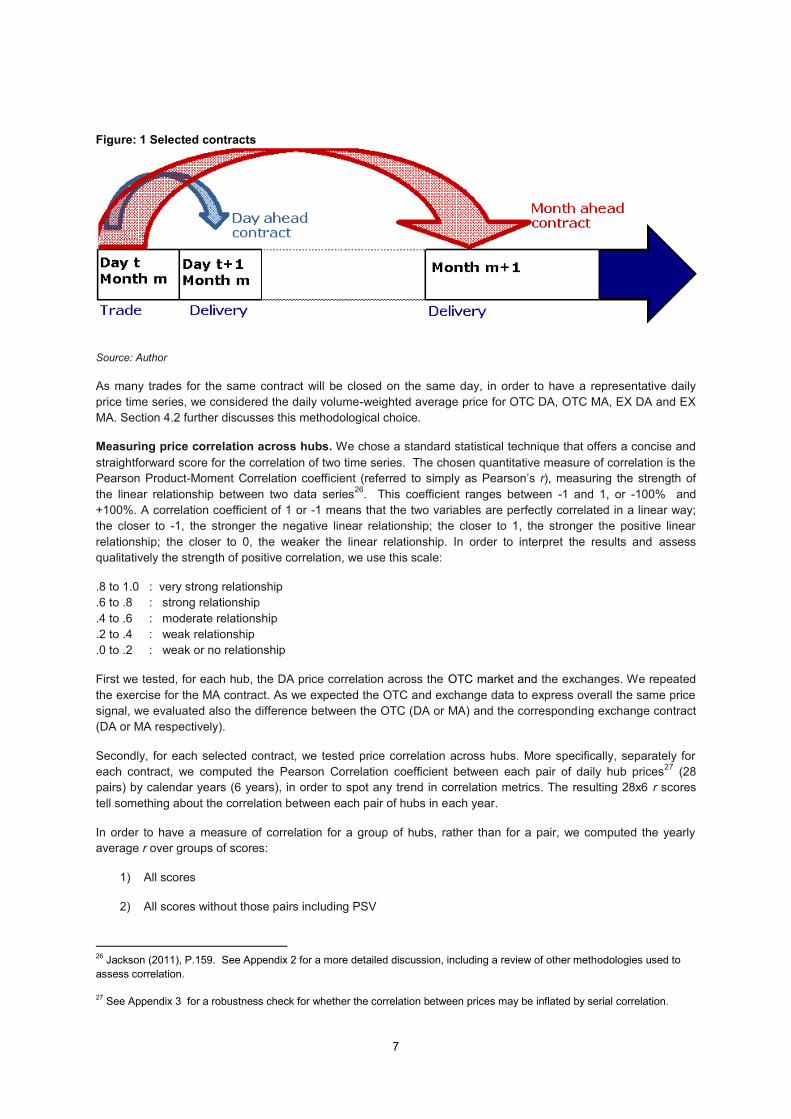
Measuring price correlation across hubs. We chose a standard statistical technique that offers a concise and
straightforward score for the correlation of two time series. The chosen quantitative measure of correlation is the
Pearson Product-Moment Correlation coefficient (referred to simply as Pearson’s r), measuring the strength of
the linear relationship between two data series26
. This coefficient ranges between -1 and 1, or -100% and
+100%. A correlation coefficient of 1 or -1 means that the two variables are perfectly correlated in a linear way;
the closer to -1, the stronger the negative linear relationship; the closer to 1, the stronger the positive linear
relationship; the closer to 0, the weaker the linear relationship. In order to interpret the results and assess
qualitatively the strength of positive correlation, we use this scale:
.8 to 1.0 : very strong relationship
.6 to .8 : strong relationship
.4 to .6 : moderate relationship
.2 to .4 : weak relationship
.0 to .2 : weak or no relationship
First we tested, for each hub, the DA price correlation across the OTC market and the exchanges. We repeated
the exercise for the MA contract. As we expected the OTC and exchange data to express overall the same price
signal, we evaluated also the difference between the OTC (DA or MA) and the corresponding exchange contract
(DA or MA respectively).
Secondly, for each selected contract, we tested price correlation across hubs. More specifically, separately for
each contract, we computed the Pearson Correlation coefficient between each pair of daily hub prices27
(28
pairs) by calendar years (6 years), in order to spot any trend in correlation metrics. The resulting 28x6 r scores
tell something about the correlation between each pair of hubs in each year.
In order to have a measure of correlation for a group of hubs, rather than for a pair, we computed the yearly
average r over groups of scores:
1) All scores
2) All scores without those pairs including PSV
26
Jackson (2011), P.159. See Appendix 2 for a more detailed discussion, including a review of other methodologies used to
assess correlation.
27 See Appendix 3 for a robustness check for whether the correlation between prices may be inflated by serial correlation.

8
3) All scores without those pairs including PSV and CEGH
4) All scores without those pairs including PSV, CEGH and NBP (i.e. all the scores involving the all the
West European hubs: ZEE, TTF, PEG, NCG and GSL)
5) All scores without those pairs including PSV, CEGH, NBP and ZEE (i.e. all the scores involving the
euro-quoted West European hubs: TTF, PEG, NCG and GSL)
6) All scores without those pairs including PSV, CEGH, NBP, ZEE and PEG (i.e. between TTF and the
German hubs)
By excluding hubs one by one, we separate out the marginal contribution of each to global correlation in a given
year. If all the hubs share exactly the same pattern in a given year, we would expect that excluding one does not
result in an increase in yearly group correlation. Instead, in the case where one hub expresses a price somehow
less well correlated to the others, we would expect its exclusion to increase group correlation. We started
excluding first the PSV, as at least until 2012, based on the related literature28
, this gas hub has been the “rear
guard” in terms of liquidity and interconnection to the others. We expected that excluding it should increase group
correlation, at least in the earlier years. After PSV we excluded CEGH, a transit hub, and then subsequently the
two sterling-quoted hubs, starting from the NBP which is more remote from the others and perhaps conditioned
by specific features of the GB market. Finally, we excluded the French hubs, as they should be the least liquid
among the euro-quoted West European hubs group29
.
We used a group coefficient to perform comparisons across years and across contracts. By comparing group
scores across years we aimed to assess the existence of any trend in correlation metrics, and in particular
whether correlation had increased over time. By comparing yearly group scores across contracts we investigated
the difference in correlation across products characterized by different delivery period (curve versus spot). We
suspected the month ahead product would be less affected by transient local factors; therefore, according to our
expectations, the month ahead contract should display better correlation scores.
Price correlation itself does not explain the direction of the causality and hence whether there is a leader and a
follower in price changes. Therefore, to assess whether there is a ‘benchmark hub’, we assumed that the leaders
should be the more mature markets as assessed by Heather (2012) and consequently compared the evolution of
correlation with TTF versus NBP30
.
Having clarified the objective of our analysis and the methodology, the choice of data sources turned out to be a
challenge. First hand OTC price and volume data are not in the public domain. Exchange data are available but
assembling a consistent dataset presents difficulties. In light of this, we developed an in-house dataset, which is
a distinctive feature of this work compared with the existing literature.
28
Heather 2012. P. 18-21
29 Heather 2012. P. 18-21.
30 When using co-integration techniques (see Appendix 2) information about leading prices may be also tested through
hypothesis testing on the parameters in the co-integration vector.
9
3. Data
A most important feature of this work is the very sizeable and unique set of data on European gas trading that
underpins the research findings. This Chapter illustrates the sources and features of our dataset, which, to the
best of our knowledge, is one of the most comprehensive sets of data on gas trading in Europe assembled for
academic research purposes.
3.1 Data Sources
As noted above the objects of our analysis are two contracts traded on the OTC market (OTC DA, OTC MA) and
two contracts traded on the organized energy exchanges (EX DA, EX MA). Consequently, we had to cope with
the fact that first hand OTC price and volume data are not in the public domain31
and, although exchange data
are mostly available, building a consistent dataset presents difficulties. Hence, in order to draw conclusions from
a reliable dataset, the Oxford Institute for Energy Studies (OIES) undertook the challenge to develop a purpose-
built, consistent and transaction-based database.
Data on OTC trading were provided, under licence, by the three brokers ICAP Energy, Tullett Prebon and Marex
Spectron (the Tankard Parties), who together represent 80-90% of the OTC gas market in Europe. In particular,
OIES has access, for academic research purposes only, to anonymised data for every trade on every hub since
2007 up to June 2012 brokered by the Tankard Parties. OIES entered a data license agreement for this data.
It is worth highlighting a distinguishing feature of the dataset32
. Information on OTC markets is normally available
only as a result of surveys carried out by Price Reporting Agencies (such as Platts, ICIS Heren and Argus) with
input from a subset of operators, rather than representing the totality of OTC trading transactions. Price Reporting
Agencies (PRA) hence rely heavily on interaction with traders who submit price information.
The dataset used in this research is based on the trading transactions effectively brokered in each day of the
considered period, so it is arguably more likely to return a reliable price signal.
The sources for exchange price and volume data are either the exchange operators or the exchange websites33
.
For the sake of simplicity, although the same product can be traded on different exchanges34
, we refer only to
one exchange for each hub:
Exchange month ahead prices and volumes for NBP are those quoted by ICE ENDEX (former ICE) 35
Day ahead and month ahead for TTF are those quoted by ICE ENDEX (former APX-ENDEX)
ZEE day ahead are those quoted by ICE ENDEX (former APX-ENDEX)36
Day ahead and month ahead for CEGH are quoted by CEGH Gas Exchange
NCG and GSL exchange prices and volumes are those quoted by EEX
PEG quotations source is Powernext.
31
Data on OTC daily prices are published by Price Reporting Agencies (PRA) but, as discussed below, these figures are based
on interaction with traders rather than the transactions actually concluded on a given day.
32 Previous studies have focussed mostly on exchange data, possibly due to their accessibility, rather than on OTC. OTC data
are however a very important part of the story as most of gas trading occurs over the counter.
33 Note that historical exchange volume and price data are not always available in the public domain.
34 For instance, ICE ENDEX also offers contracts for the German hubs, EEX offers contract for the TTF.
35ICE ENDEX (former ICE), up to June 2012, did not do day ahead contract. ICE ENDEX operates the liquid OCM market
concerning within day contracts and a NBP DA market that has low liquidity. For more details see Appendix 1.
36 It is not possible to trade month ahead contracts for Zeebrugge on any exchange, hence exchange trading for Zeebrugge
refers only to the day ahead product.

10
PSV exchange data were excluded from the analysis as the activity of the exchange platforms operated by GME
is relatively low37
.
3.2 Dataset features
This Section discusses further the choice of the variables for analysis.
3.2.1 Dataset description
For each contract (OTC DA, OTC MA, EX DA and EX MA) and hub (NBP, TTF, ZEE, PEG, NCG, GSL, CEGH,
PSV), our dataset contains 1) daily price and 2) total daily traded volume information, sourced from Tankard
Parties data or exchanges.
Our dataset covers the period from January 2007 up to June 2012, as Tankard’s data were available to that
date38
. Prices are expressed in euro/MWh and volumes in MWh: for NBP and ZEE we converted from sterling to
euros and therms to MWh39
.
Table 1 outlines the daily price series under consideration and the corresponding source. For a detailed
discussion on each variable see Appendix 1.
Table: 1 Selected contracts and sources40
Hub OTC DA OTC MA Exchange DA Exchange MA
NBP Tankard Tankard // ICE
TTF Tankard Tankard ICE Endex ICE Endex
ZEE Tankard Tankard ICE Endex //
CEGH Tankard Tankard CEGH Gas Ex. CEGH Gas Ex.
NCG Tankard Tankard EEX EEX
GSL Tankard Tankard EEX EEX
PEG Tankard Tankard Powernext Powernext
PSV Tankard Tankard // //
Source: Author
Selected price series for exchange traded products are consistent with the corresponding OTC series (we used,
when available, weighted average daily prices), although exchange data do not cover the whole period under
consideration for some hubs.
3.2.2 Selected contracts
Our analysis includes contracts for prompt delivery (the DA) and also a longer dated contract (MA)41
, as the
differing correlations across products in different delivery time frames are of interest. While the sale and purchase
of day ahead contracts can be considered as representative of a short term trading of gas, month ahead (or front
month) product here exemplifies longer term trading, possibly less affected by transient local factors.
37
For more detailed discussion see Appendix 1.
38 Future research will be supported by data updates on an annual basis.
39 Correlations were done using euro values as in primary goods markets when the price is not quoted in a single currency the
literature often assumes perfect exchange rate pass through, and denote the prices in a common currency (Asche et al.
(2000), P.8 ).
40 The symbol // means that data were not included in the analysis. For details refer to Appendix 1.
41 This represents a difference from related literature, at least to the best of our knowledge.

11
While the range of standardized contracts available for trading is much wider, the products we selected are, by
and large, frequently traded on all the hubs, either via OTC or exchanges, so providing us with a broad
quantitative sample42
.
The distribution of ENDEX TTF future transactions in 2012 (Figure 2) confirms the importance of the month
ahead contract. In 2012 TTF the month ahead contract was by far the most liquid; front season, front quarter and
next calendar year are also important but involved fewer trading transactions.
Figure 2: TTF gas futures contracts traded on ICE ENDEX exchange in 2012 (no. of transactions across
different contracts)
Source: ICE-ENDEX
We chose to exclude products with delivery beyond a month, such as Calendar Year or Gas Year ahead,
because they are likely to reflect only very generalised market sentiment on market tightening or softening in the
future since market fundamentals (especially the important impact of weather) are not anticipated so well in
advance.
3.2.3 Daily weighted average prices
Another feature of our dataset is the use, whenever possible, of weighted average prices. On this basis, the price
of a given contract on day t represents the volume-weighted average over the prices of all the contracts of the
same type traded on day t, while, for each contract, the correspondent day t volume represents the sum of the
volumes of all the contracts of the same type traded on day t with a delivery date in the future43
.
Whilst for this analysis we chose a Daily Weighted Average Price (DAP) rather than a Settlement or End of Day
price (EOD), it is fair to point out that the latter is normally considered as a market reference. However, the
differences between EOD and DAP are not significant over long time periods, as was verified using ICE Month
Ahead price data (see Appendix 1); moreover for the aims of correlation analysis choosing EOD or DAP should
not affect the result44
. Note that when comparing OTC and exchange price series, whenever possible, we always
compare consistent daily averages.
42
In the period considered period summer, winter, one quarter, gas year, calendar year, weekend and balance of month
products were also traded rather frequently in the OTC market and on the exchange, although not equally across all the hubs.
43 Note that this is not the same as considering the average price and the total volume of historical trades with delivery in day t.
44 For a discussion on the choice of this daily price reference see Appendix 1.
12
3.3 Data coverage
The analysis was designed to cover both spot trading and longer dated trading, (through the use of both day
ahead and month ahead); and in addition to this, our data reflect the two main “routes to market”, trading in the
OTC markets and trading on the organized exchanges. The brokered deals we had access to represent some
80-90% of the OTC market, and exchange data include most of the day ahead and month ahead products
offered by European gas exchanges.
However, it is fair to point out that our data do not include information on directly negotiated deals between
counterparties, which are not picked up either by the brokers or by the exchanges, these being the result of a
bilateral agreement. The relevance of these trades varies from country to country. In Great Britain and Holland,
this element of trading is likely to be now extremely small (when referring to traded deals rather than contracted
deals). On the rest of the Continent though, these deals may be more significant.
It should be noted that most of the analysis focuses on OTC trading, due to the more complete set of information.
Nonetheless we compare OTC and exchange data to check, firstly, whether their time pattern and levels are
consistent and, secondly, whether they lead to different results in terms of price correlation.

13
4. Data overview
4.1 Volumes
Figure 3 illustrates the breakdown of the volumes included in our dataset.
The depicted gas quantities represent gross traded volumes, i.e. the total amounts of gas that are traded on each
hub, which are usually a multiple of the physical quantity that is actually delivered on the grid. The latter, in fact,
corresponds to the volumes which are nominated to the system operator after “netting off” all traded contracts
expiring directly after the nomination deadline and is known as ‘netted physical traded volume‘. Indeed the same
gas “molecule” may be renegotiated many times before being delivered. Note that hub liquidity as a whole
cannot be directly inferred from here as these volumes refer to only four contracts.
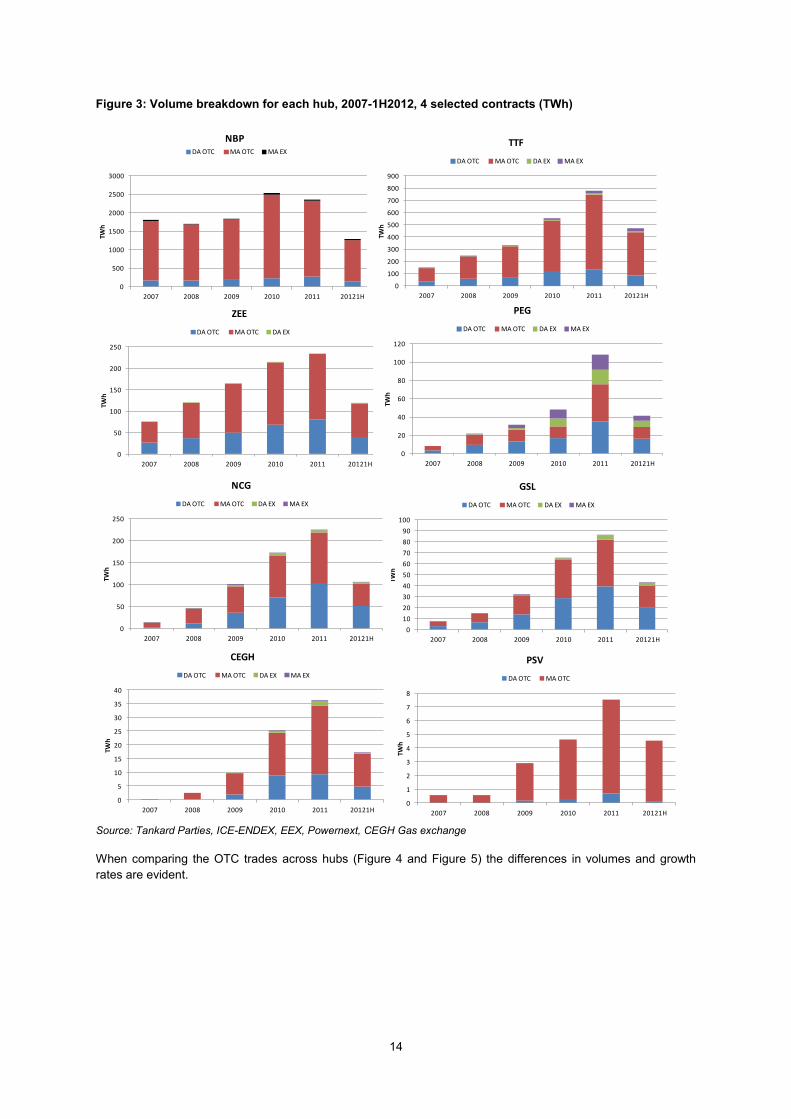
Overall, on the Continental Europe hubs traded volumes for the MA and the DA contract have grown
exponentially since 2007. The volumes on NBP, already extremely liquid in 2007, experienced a less marked
growth rate and dropped slightly from 2010 to 201145
.
The volumes involved in the analysis are large46
. However, MA and DA traded volumes at different hubs are of a
different scale of magnitude, ranging from a yearly total above 2,000 TWh in 2011 for NBP to less than 10 TWh in
2011 for PSV. Exchange volumes appear to be significantly below volumes traded in the OTC market, with the
exception of the French PEG, where Powernext volumes represent a more significant share of the total.
45
Note that volumes for the MA and DA contracts may not follow the same trend as the total volumes. Data on OTC total traded
volumes provided by the London Energy Brokers Association (LEBA) are not available prior to 2011 and they do not detail
contract volume breakdown.
46 Using yearly gas consumption in the hub area as a reference: in 2011 yearly gas consumption in the NBP area was about
907 TWh (Eurostat data for UK) and 443 TWh in the TTF area (Eurostat data for the Netherlands).
14
Figure 3: Volume breakdown for each hub, 2007-1H2012, 4 selected contracts (TWh)
0
500
1000
1500
2000
2500
3000
2007 2008 2009 2010 2011 20121H
TWh
NBPDA OTC MA OTC MA EX
0
50
100
150
200
250
2007 2008 2009 2010 2011 20121H
TWh
ZEE
DA OTC MA OTC DA EX
0
100
200
300
400
500
600
700
800
900
2007 2008 2009 2010 2011 20121H
TWh
TTF
DA OTC MA OTC DA EX MA EX
0
20
40
60
80
100
120
2007 2008 2009 2010 2011 20121H
TWh
PEG
DA OTC MA OTC DA EX MA EX
0
10
20
30
40
50
60
70
80
90
100
2007 2008 2009 2010 2011 20121H
TWh
GSL
DA OTC MA OTC DA EX MA EX
0
50
100
150
200
250
2007 2008 2009 2010 2011 20121H
TWh
NCG
DA OTC MA OTC DA EX MA EX
0
5
10
15
20
25
30
35
40
2007 2008 2009 2010 2011 20121H
TWh
CEGH
DA OTC MA OTC DA EX MA EX
0
1
2
3
4
5
6
7
8
2007 2008 2009 2010 2011 20121H
TWh
PSV
DA OTC MA OTC
Source: Tankard Parties, ICE-ENDEX, EEX, Powernext, CEGH Gas exchange
When comparing the OTC trades across hubs (Figure 4 and Figure 5) the differences in volumes and growth
rates are evident.
15
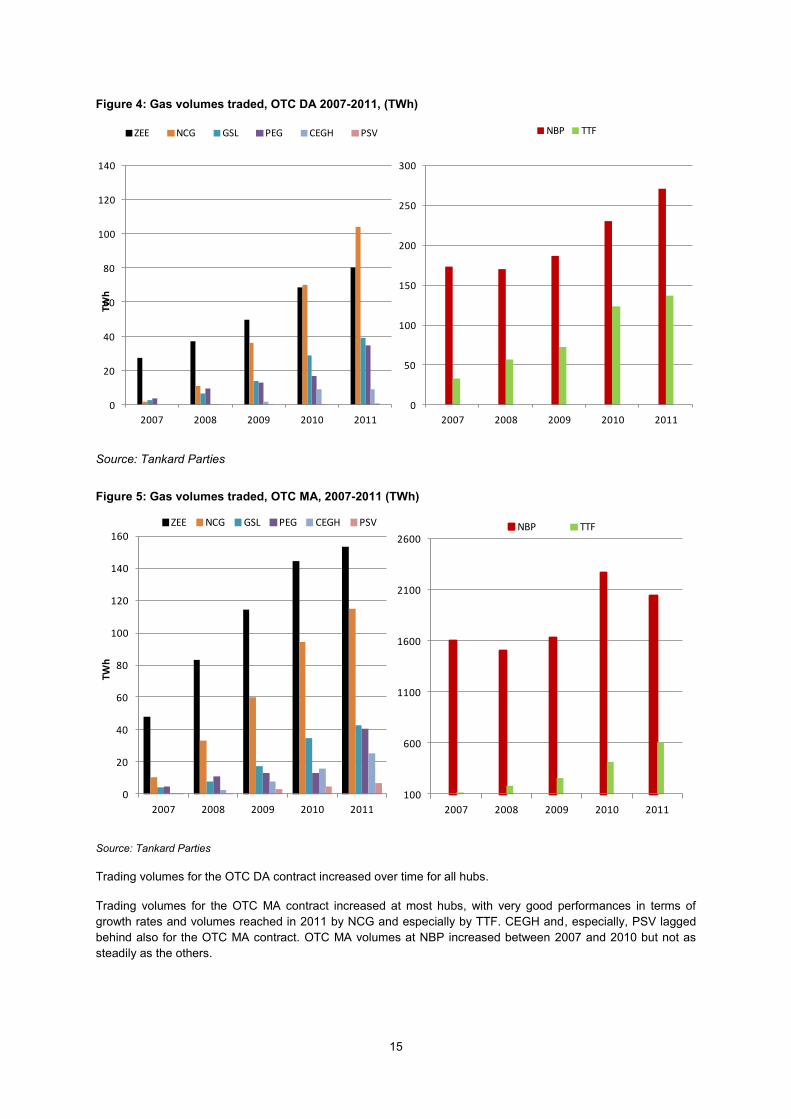
Figure 4: Gas volumes traded, OTC DA 2007-2011, (TWh)
0
20
40
60
80
100
120
140
2007 2008 2009 2010 2011
TWh
ZEE NCG GSL PEG CEGH PSV
0
50
100
150
200
250
300
2007 2008 2009 2010 2011
NBP TTF
Source: Tankard Parties
Figure 5: Gas volumes traded, OTC MA, 2007-2011 (TWh)
0
20
40
60
80
100
120
140
160
2007 2008 2009 2010 2011
TWh
ZEE NCG GSL PEG CEGH PSV
100
600
1100
1600
2100
2600
2007 2008 2009 2010 2011
NBP TTF
Source: Tankard Parties
Trading volumes for the OTC DA contract increased over time for all hubs.
Trading volumes for the OTC MA contract increased at most hubs, with very good performances in terms of
growth rates and volumes reached in 2011 by NCG and especially by TTF. CEGH and, especially, PSV lagged
behind also for the OTC MA contract. OTC MA volumes at NBP increased between 2007 and 2010 but not as
steadily as the others.

16
The growth in traded volumes may be linked to purchases on the hubs being cheaper in this period than supply
under long term contracts and to changing attitudes in energy buying and trading47
.
Notwithstanding the impressive growth rates on Continental hubs, the volumes remained remarkably
concentrated. In the OTC market, in 2011 only NBP, TTF and NCG accounted for over 100 TWh traded day
ahead, while ZEE, GSL and French hubs were above 10 TWh but below 100 TWh. In the same year, OTC DA
contracts were assessed at less than 10 TWh both for PSV and CEGH. Differences in traded volumes are even
more marked when turning to the MA contract: for all the Continental hubs, the gap with NBP is pretty evident, an
effect possibly due to the intense financial trading activity for risk hedging at NBP. For instance, NBP month
ahead contracts brokered by ICAP Energy, Marex Spectron and Tullett Prebon in 2007 accounted for over
1,500TWh and exceeded 2,000 TWh in 2011, whereas the TTF follows far behind (about 100TWh in 2007) and in
2011 still does not approach the 2007 figure for NBP.
The UK hub indeed dwarfs all the Continental hubs in terms of liquidity: in the OTC market the difference in 2011
volumes between NBP and TTF is a factor of about 2 for DA and over 3 for MA; the gap is much wider between
NBP and all the other hubs. However, NBP’s lead over the other Continental hubs has been diminishing for DA
and MA trades, particularly due to exponential growth in TTF trades.
The relative importance within the same hub of short term trading versus longer term trading varies (Figure 6).
47
Heather (2012), P.21-30.
17
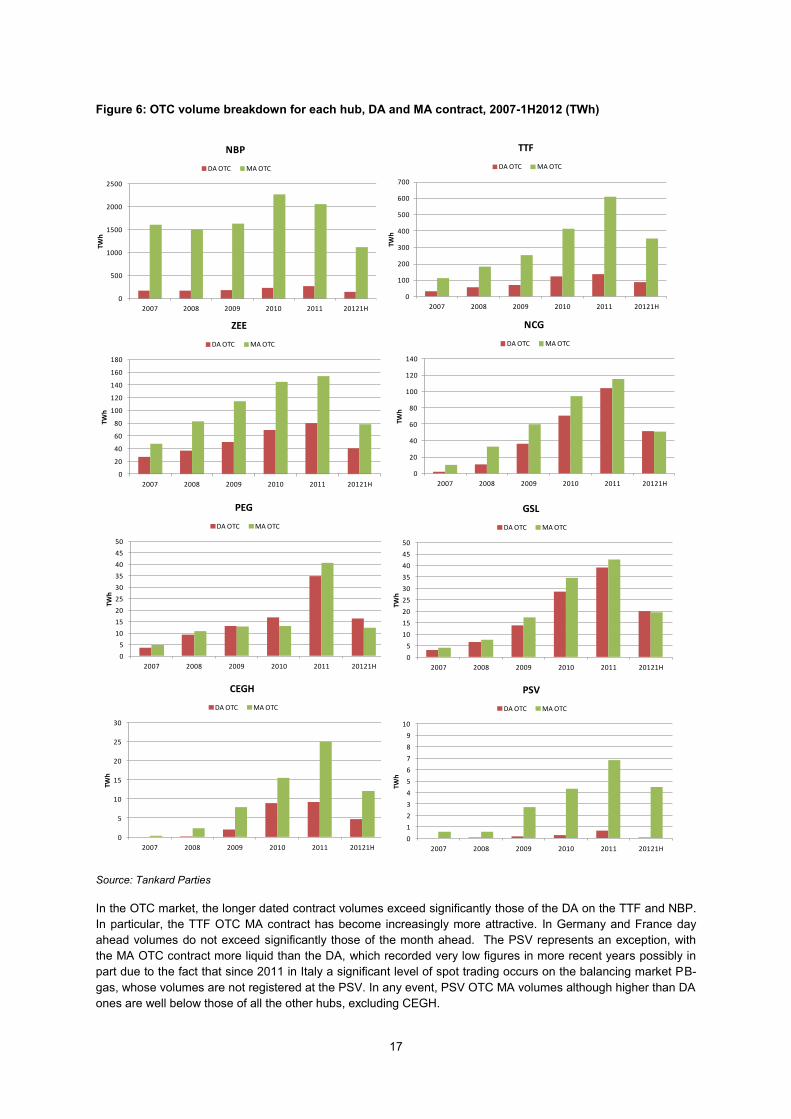
Figure 6: OTC volume breakdown for each hub, DA and MA contract, 2007-1H2012 (TWh)
0
500
1000
1500
2000
2500
2007 2008 2009 2010 2011 20121H
TWh
NBP
DA OTC MA OTC
0
20
40
60
80
100
120
140
160
180
2007 2008 2009 2010 2011 20121H
TWh
ZEE
DA OTC MA OTC
0
100
200
300
400
500
600
700
2007 2008 2009 2010 2011 20121H
TWh
TTF
DA OTC MA OTC
0
5
10
15
20
25
30
35
40
45
50
2007 2008 2009 2010 2011 20121H
TWh
PEG
DA OTC MA OTC
0
5
10
15
20
25
30
35
40
45
50
2007 2008 2009 2010 2011 20121H
TWh
GSL
DA OTC MA OTC
0
20
40
60
80
100
120
140
2007 2008 2009 2010 2011 20121H
TWh
NCG
DA OTC MA OTC
0
5
10
15
20
25
30
2007 2008 2009 2010 2011 20121H
TWh
CEGH
DA OTC MA OTC
0
1
2
3
4
5
6
7
8
9
10
2007 2008 2009 2010 2011 20121H
TWh
PSV
DA OTC MA OTC
Source: Tankard Parties
In the OTC market, the longer dated contract volumes exceed significantly those of the DA on the TTF and NBP.
In particular, the TTF OTC MA contract has become increasingly more attractive. In Germany and France day
ahead volumes do not exceed significantly those of the month ahead. The PSV represents an exception, with
the MA OTC contract more liquid than the DA, which recorded very low figures in more recent years possibly in
part due to the fact that since 2011 in Italy a significant level of spot trading occurs on the balancing market PB-
gas, whose volumes are not registered at the PSV. In any event, PSV OTC MA volumes although higher than DA
ones are well below those of all the other hubs, excluding CEGH.

18
This may suggest that while the DA contract, presumably along with other spot contracts, is more developed
across all the European hubs as a consequence of local shippers’ physical balancing needs; longer dated
contracts, usually linked to hedging purposes, are mostly traded on relatively few hubs. Our sample suggests that
liquidity further along the curve is more developed on the TTF and NBP hubs.
While the relative size of OTC and exchange volumes varies by hub, the OTC market still accounts for most of
the volumes for all hubs (Figure 3). Based on the data analysed, the OTC markets’ size is significantly greater
than that of the more recent exchanges, with OTC traded volumes accounting for at least 80% of total day ahead
trading volume in each considered year across all hubs and 90% of total month ahead trading volume, with the
exception of PEG. This stresses the importance of analysis based on a reliable dataset of OTC prices and
volumes. However TTF, the German hubs and, to a greater extent, the PEG present a more balanced distribution
between OTC and exchange trading.
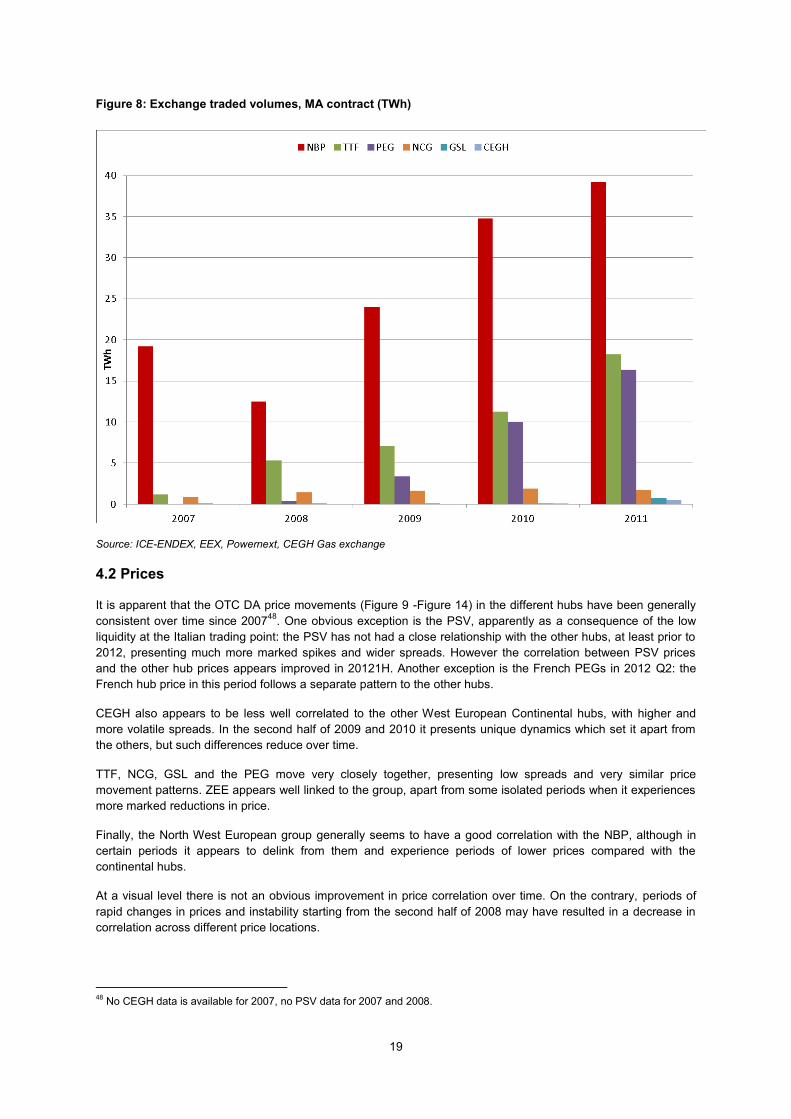
While the majority of transactions are conducted on the OTC markets, the volumes traded on exchanges have
been consistently increasing. Recently the role of exchanges in offering DA contracts has grown, notably in the
Netherlands and, unexpectedly, in France: exchange traded volumes for delivery on the TTF grew from less than
1 TWh in 2008 to over 11 TWh in 2011, while in the same period Powernext saw volumes surging from 0.8 TWh
to over 16 TWh (Figure 7). The role of exchanges in month ahead trading increased in the case of NBP, TTF
and PEG. Exchange MA volumes are very low for the other hubs.
Figure 7: Exchange traded volumes, DA contract (TWh)
Source: ICE-ENDEX, EEX, Powernext, CEGH Gas exchange
19
Figure 8: Exchange traded volumes, MA contract (TWh)
Source: ICE-ENDEX, EEX, Powernext, CEGH Gas exchange
4.2 Prices
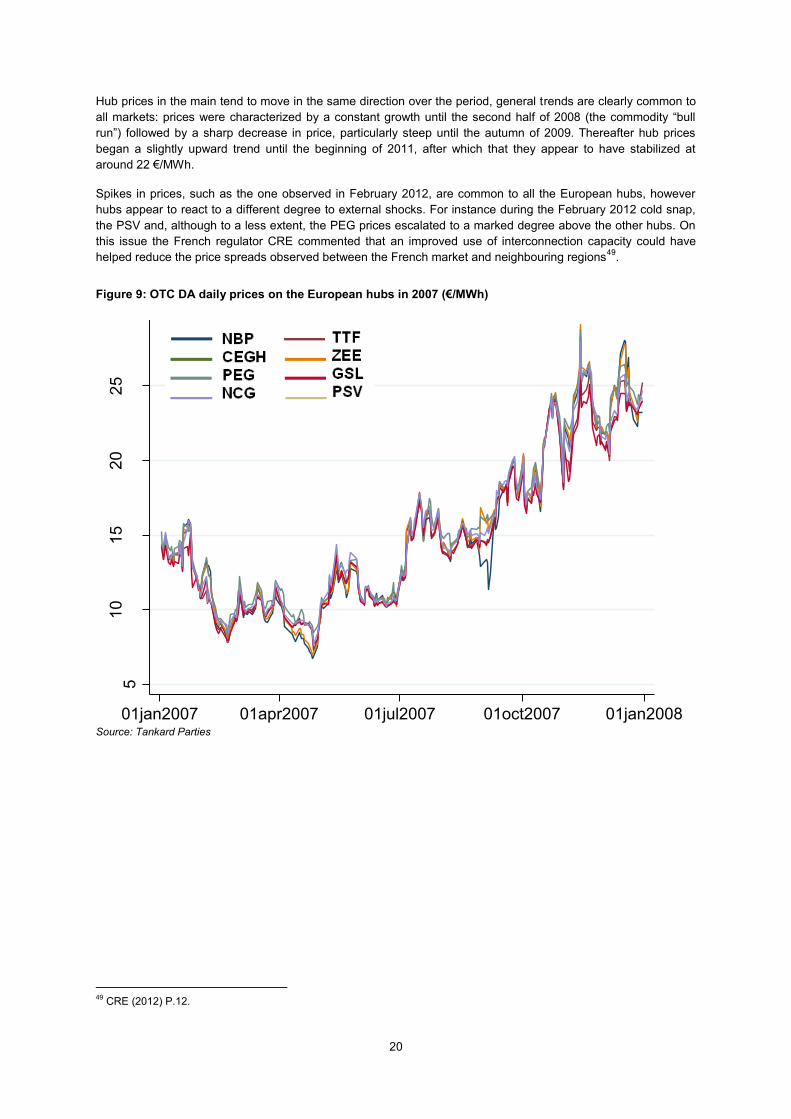
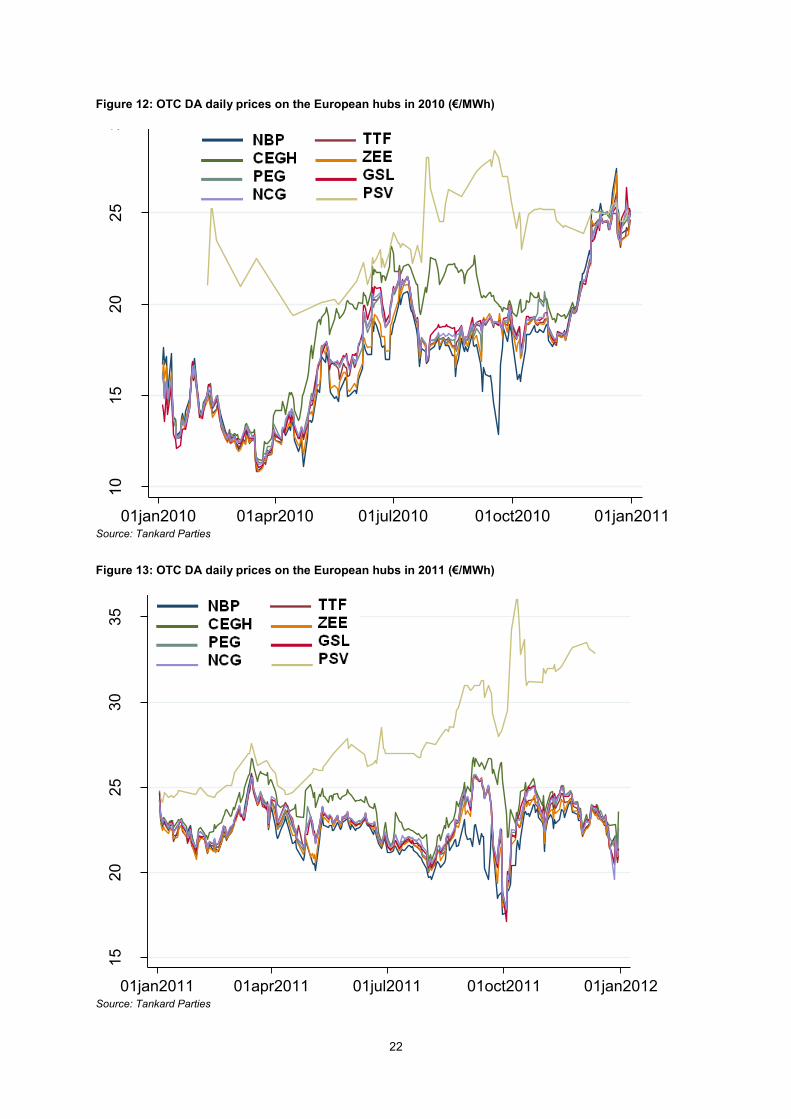
It is apparent that the OTC DA price movements (Figure 9 -Figure 14) in the different hubs have been generally
consistent over time since 200748
. One obvious exception is the PSV, apparently as a consequence of the low
liquidity at the Italian trading point: the PSV has not had a close relationship with the other hubs, at least prior to
2012, presenting much more marked spikes and wider spreads. However the correlation between PSV prices
and the other hub prices appears improved in 20121H. Another exception is the French PEGs in 2012 Q2: the
French hub price in this period follows a separate pattern to the other hubs.
CEGH also appears to be less well correlated to the other West European Continental hubs, with higher and
more volatile spreads. In the second half of 2009 and 2010 it presents unique dynamics which set it apart from
the others, but such differences reduce over time.
TTF, NCG, GSL and the PEG move very closely together, presenting low spreads and very similar price
movement patterns. ZEE appears well linked to the group, apart from some isolated periods when it experiences
more marked reductions in price.
Finally, the North West European group generally seems to have a good correlation with the NBP, although in
certain periods it appears to delink from them and experience periods of lower prices compared with the
continental hubs.
At a visual level there is not an obvious improvement in price correlation over time. On the contrary, periods of
rapid changes in prices and instability starting from the second half of 2008 may have resulted in a decrease in
correlation across different price locations.
48
No CEGH data is available for 2007, no PSV data for 2007 and 2008.
20
Hub prices in the main tend to move in the same direction over the period, general trends are clearly common to
all markets: prices were characterized by a constant growth until the second half of 2008 (the commodity “bull
run”) followed by a sharp decrease in price, particularly steep until the autumn of 2009. Thereafter hub prices
began a slightly upward trend until the beginning of 2011, after which that they appear to have stabilized at
around 22 €/MWh.
Spikes in prices, such as the one observed in February 2012, are common to all the European hubs, however
hubs appear to react to a different degree to external shocks. For instance during the February 2012 cold snap,
the PSV and, although to a less extent, the PEG prices escalated to a marked degree above the other hubs. On
this issue the French regulator CRE commented that an improved use of interconnection capacity could have
helped reduce the price spreads observed between the French market and neighbouring regions49
.
Figure 9: OTC DA daily prices on the European hubs in 2007 (€/MWh)
51
01
52
02
53
0
01jan2007 01apr2007 01jul2007 01oct2007 01jan2008Date
Source: Tankard Parties
49
CRE (2012) P.12.

21
Figure 10: OTC DA daily prices on the European hubs in 2008 (€/MWh) 1
52
02
53
03
5
01jan2008 01apr2008 01jul2008 01oct2008 01jan2009Date
Source: Tankard Parties
Figure 11: OTC DA daily prices on the European hubs in 2009 (€/MWh)
01
02
03
04
0
01jan2009 01apr2009 01jul2009 01oct2009 01jan2010Date
Source: Tankard Parties
22
Figure 12: OTC DA daily prices on the European hubs in 2010 (€/MWh) 1
01
52
02
53
0
01jan2010 01apr2010 01jul2010 01oct2010 01jan2011Date
Source: Tankard Parties
Figure 13: OTC DA daily prices on the European hubs in 2011 (€/MWh)
15
20
25
30
35
01jan2011 01apr2011 01jul2011 01oct2011 01jan2012Date
Source: Tankard Parties

23
Figure 14: OTC DA daily prices on the European hubs in 20121H (€/MWh) 2
03
04
05
06
07
0
01jan2012 01mar2012 01may2012 01jul2012Date
Source: Tankard Parties
A powerful tool for grasping the overall price dynamics is the box plot.
A box plot is a convenient way of graphically depicting groups of numerical data through their quartiles. Box plots
have a main rectangular body (the box itself) and lines extending vertically from the box (so called whiskers). The
bottom and top of the box are the first and third quartiles, and the band inside the box is the median; the ends of
the whiskers represent the upper and lower adjacent values: the largest value smaller or equal to upper quartile +
1.5 IQR (where IQR is the interquartile range, a measure of statistical dispersion, being equal to the difference
between the upper and lower quartiles, IQR = Q3 − Q1) and the smallest value greater or equal to the lower
quartile - 1.5 IQR. Any points more extreme then the upper and lower adjacent values are represented as dots.
The length of the box represents the IQR and helps indicate the degree of dispersion (volatility) in the data: the
more stretched the box is, the more variable prices are within the year. The length of the whiskers is another
measure of dispersion; while dots identify outliers, i.e. isolated price peaks or troughs that do not fit the general
trend. By comparing the bands inside the boxes within the same year, we get some insight of the yearly
differences in price across different hubs.

24
Figure 15: OTC DA box plots (€/MWh)
02
04
06
0
2007 2008 2009 2010 2011 2012
Source: Tankard Parties
Figure 15 shows that within any year the price of gas was very similar across different hubs, except for PSV
which was on average the dearest. Volatility was at the highest levels in 2007 and the lowest in 2011-2012, (as
shown by the length of the boxes and whiskers), which reduced significantly from 2007 to 2011. 2009 featured
frequent peaks in price, because the overall price level fell rapidly. Some spikes were registered in 2012 as well,
but ignoring these isolated movements, prices were rather stable and within a narrow range of variation.
The evolution of spreads over time provides further insight on the relationship between prices (Figure 16). This
confirms that transactions costs are small (mostly well below 1 €/MWh) and not so volatile, with the exception of
PSV and, to a lesser extent, CEGH.

25
Figure 16: Box plots for OTC DA price premium/discount to NBP, 2007-2012 (€/MWh)50
-5
05
10
15
2007 2008 2009 2010 2011 2012
Source: Tankard Parties
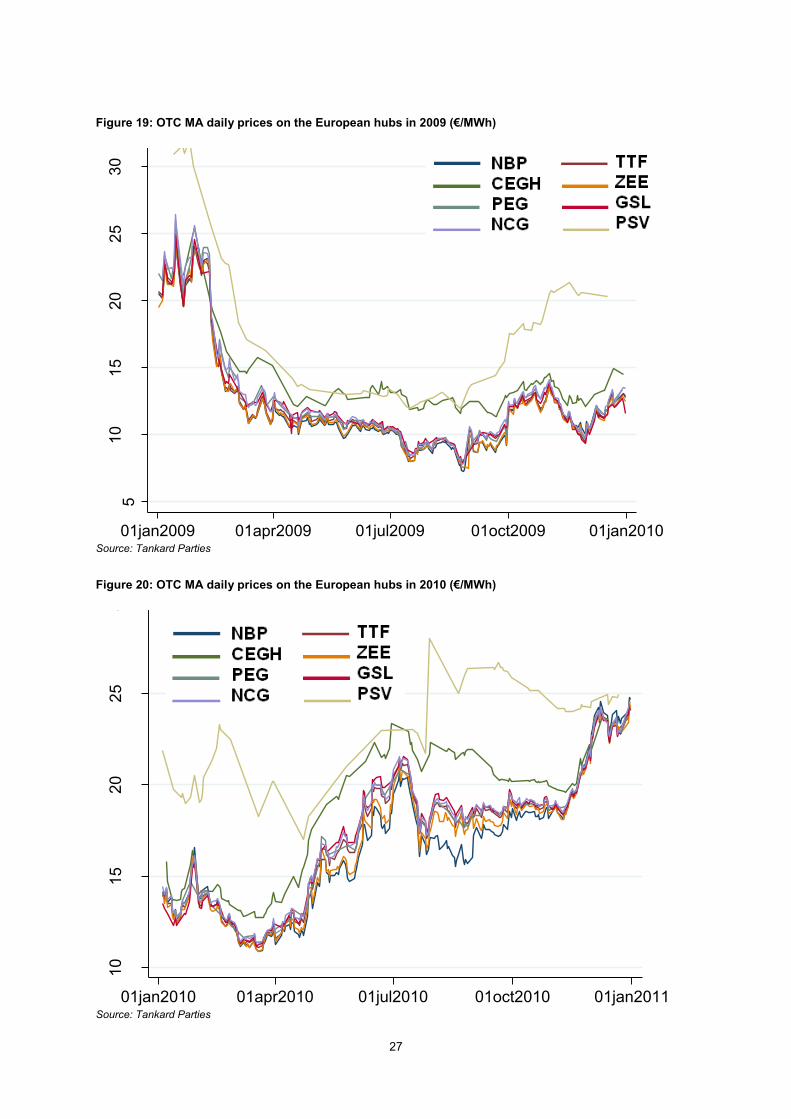
General trends are common to both DA and MA OTC prices (Figure 17-Figure 22)51
, reflecting how much the
price of longer-dated contracts depends on the patterns observed in the spot market. Moreover, when focusing
on the MA price, it may be noticed that daily prices for delivery in the same month vary significantly, not only at
month end but also in subsequent days: this may indicate that sometimes daily changes in the DA prices are
reflected in the MA prices quoted on the same day. However, some exceptional short term movements in prices
are not shared by MA prices (for instance see the spike during the February 2012 crisis) signalling that the
market players expected the price shock to be overcome within less than one month.
50
In few days in the sample PSV exceeded NBP by more than 15 euro/MWh. For the sake of clarity these outliers are not
represented in the box plot.
51 No CEGH data in 2007, no PSV data in 2007.

26
Figure 17: OTC MA daily prices on the European hubs in 2007 (€/MWh)
51
01
52
02
53
0
01jan2007 01apr2007 01jul2007 01oct2007 01jan2008Date
Source: Tankard Parties
Figure 18 OTC MA daily prices on the European hubs in 2008 (€/MWh)
20
25
30
35
40
01jan2008 01apr2008 01jul2008 01oct2008 01jan2009Date
Source: Tankard Parties
27
Figure 19: OTC MA daily prices on the European hubs in 2009 (€/MWh) 5
10
15
20
25
30
01jan2009 01apr2009 01jul2009 01oct2009 01jan2010Date
Source: Tankard Parties
Figure 20: OTC MA daily prices on the European hubs in 2010 (€/MWh)
10
15
20
25
30
01jan2010 01apr2010 01jul2010 01oct2010 01jan2011Date
Source: Tankard Parties

28
Figure 21: OTC MA daily prices on the European hubs in 2011 (€/MWh) 2
02
53
03
5
01jan2011 01apr2011 01jul2011 01oct2011 01jan2012Date
Source: Tankard Parties
Figure 22: OTC MA daily prices on the European hubs in 20121H (€/MWh)
20
25
30
35
01jan2012 01mar2012 01may2012 01jul2012Date
Source: Tankard Parties

29
Figure 23: OTC MA box plots (€/MWh) 0
10
20
30
40
2007 2008 2009 2010 2011 2012
Source: Tankard Parties
It is interesting to note that in 2010 and 2011 planned maintenance shutdowns on the Bacton-Zeebrugge
Interconnector in the month of September (which prevented gas export from Great Britain to Continental Europe
and hence retained the gas within UK), may explain the fact that the month ahead NBP price is lower than the
ZEE price in August, while the day ahead NBP price is lower than the ZEE price in September.
From both the OTC MA and DA prices it is not easy to detect clear seasonality patterns. Other trends appear to
prevail over any summer/winter difference.
It appears that MA prices may be better correlated than DA prices, as expected and confirmed by a lower
variability in spreads (Figure 24).

30
Figure 24: Box plots for hubs OTC MA price premium/discount over NBP, 2007-2012 (€/MWh) -5
05
10
15
2007 2008 2009 2010 2011 2012
Source: Tankard Parties
31
5. Results
5.1 OTC - exchange price correlation
Given the difference in traded volumes between OTC and exchange trading, for each hub we assessed how
closely exchange prices compared to OTC prices. No significant differences were expected since both refer to
the same hub market. According to industry commentators, usually the difference between OTC and exchange
for the same product is not a major one. However, in some cases OTC and exchange quotations might differ
when a player has large volumes of gas to trade and chooses an exchange to trade anonymously rather than via
OTC. This may have an effect on exchange price that is not reflected in the corresponding OTC average price.
The correlation between OTC and exchange-based trading prices is indeed a relevant issue. If exchange prices,
(though representing relatively small traded volumes), did closely match OTC prices (based on significantly
higher volumes), this would confirm that transparent52
and accessible price signals expressed by exchanges can
be trusted and used as a market reference.
Scatter plots show visually that overall prices do not present significant differences when comparing OTC
markets and exchanges, irrespective of the delivery time framework (Figure 25 and Figure 26).
52
Although historical data for exchange trading are not always available in the public domain, all the exchanges publish daily
price indexes or real time price and volume data.

32
Figure 25: Scatter plots DA exchange versus OTC prices (2007-2012 1H)
Source: Tankard Parties, ICE-ENDEX, EEX, CEGH Gas exchange, Powernext
Figure 26: Scatter plots MA exchange versus OTC prices (2007-2012 1H)
Source: Tankard Parties, ICE-ENDEX, EEX, CEGH Gas exchange, Powernext
Metrics confirm that both front month and day ahead prices do not present significant differences when
comparing OTC markets and exchanges (Table 2 and Table 3). In fact, the correlation is always positive and
almost perfect: r coefficients over the whole period are closed to or higher than 90% for longer-dated contracts
over all considered hubs where it is possible to carry out the comparison. Similarly, focusing on the shorter term
products, all the hubs present a very good level of positive correlation between OTC and exchange quoted
prices: the Pearson coefficient is above 74% for all hubs over the whole period taken in aggregate.
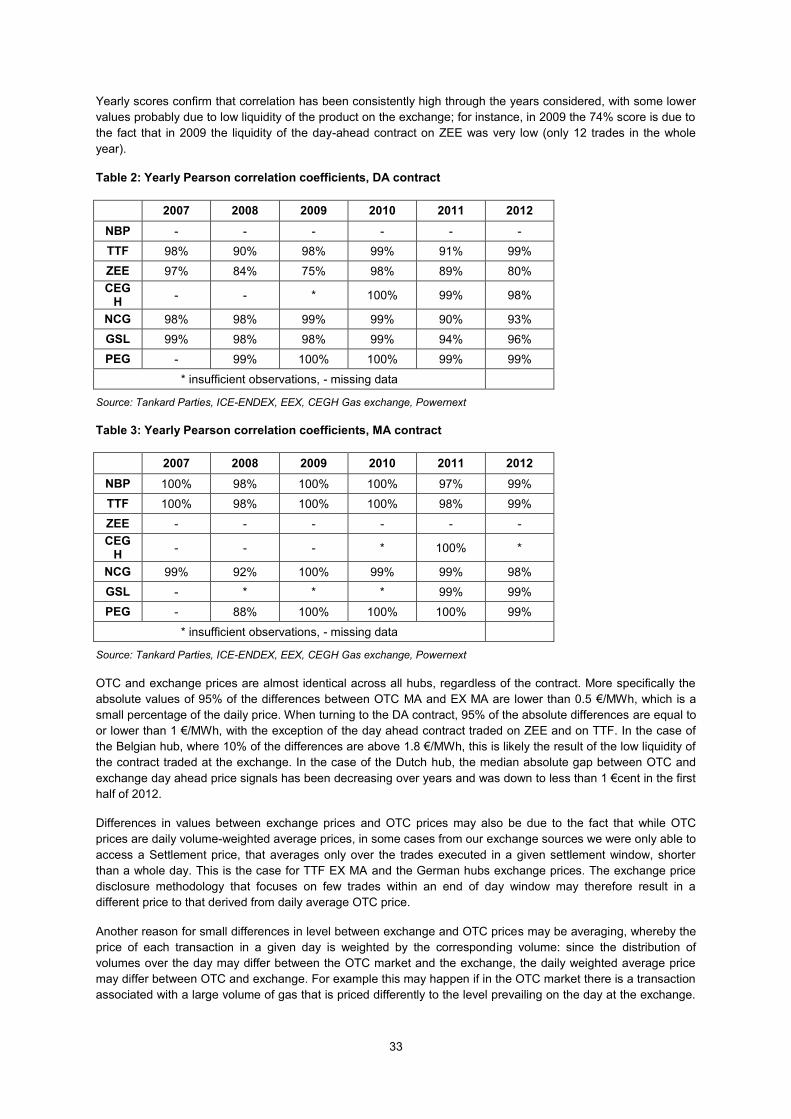
33
Yearly scores confirm that correlation has been consistently high through the years considered, with some lower
values probably due to low liquidity of the product on the exchange; for instance, in 2009 the 74% score is due to
the fact that in 2009 the liquidity of the day-ahead contract on ZEE was very low (only 12 trades in the whole
year).
Table 2: Yearly Pearson correlation coefficients, DA contract
2007 2008 2009 2010 2011 2012
NBP - - - - - -
TTF 98% 90% 98% 99% 91% 99%
ZEE 97% 84% 75% 98% 89% 80%
CEGH
- - * 100% 99% 98%
NCG 98% 98% 99% 99% 90% 93%
GSL 99% 98% 98% 99% 94% 96%
PEG - 99% 100% 100% 99% 99%
* insufficient observations, - missing data
Source: Tankard Parties, ICE-ENDEX, EEX, CEGH Gas exchange, Powernext
Table 3: Yearly Pearson correlation coefficients, MA contract
2007 2008 2009 2010 2011 2012
NBP 100% 98% 100% 100% 97% 99%
TTF 100% 98% 100% 100% 98% 99%
ZEE - - - - - -
CEGH
- - - * 100% *
NCG 99% 92% 100% 99% 99% 98%
GSL - * * * 99% 99%
PEG - 88% 100% 100% 100% 99%
* insufficient observations, - missing data
Source: Tankard Parties, ICE-ENDEX, EEX, CEGH Gas exchange, Powernext
OTC and exchange prices are almost identical across all hubs, regardless of the contract. More specifically the
absolute values of 95% of the differences between OTC MA and EX MA are lower than 0.5 €/MWh, which is a
small percentage of the daily price. When turning to the DA contract, 95% of the absolute differences are equal to
or lower than 1 €/MWh, with the exception of the day ahead contract traded on ZEE and on TTF. In the case of
the Belgian hub, where 10% of the differences are above 1.8 €/MWh, this is likely the result of the low liquidity of
the contract traded at the exchange. In the case of the Dutch hub, the median absolute gap between OTC and
exchange day ahead price signals has been decreasing over years and was down to less than 1 €cent in the first
half of 2012.
Differences in values between exchange prices and OTC prices may also be due to the fact that while OTC
prices are daily volume-weighted average prices, in some cases from our exchange sources we were only able to
access a Settlement price, that averages only over the trades executed in a given settlement window, shorter
than a whole day. This is the case for TTF EX MA and the German hubs exchange prices. The exchange price
disclosure methodology that focuses on few trades within an end of day window may therefore result in a
different price to that derived from daily average OTC price.
Another reason for small differences in level between exchange and OTC prices may be averaging, whereby the
price of each transaction in a given day is weighted by the corresponding volume: since the distribution of
volumes over the day may differ between the OTC market and the exchange, the daily weighted average price
may differ between OTC and exchange. For example this may happen if in the OTC market there is a transaction
associated with a large volume of gas that is priced differently to the level prevailing on the day at the exchange.

34
Finally differences may be explained by the fact that some of the hubs and exchanges in the time period
examined were not very liquid.
Based on the findings above, it is concluded that arbitrage forces have led the OTC and the exchange prices to
be extremely close, especially when hub trading liquidity is deep.
Given the high correlation between OTC and exchange data and considering the higher OTC traded volumes
relative to exchanges, in the following analysis we mostly refer to OTC evaluation. Given that at hub level, DA
OTC and DA EX express virtually the same price signal, then we assume that results for DA OTC correlation
across hubs should hold true for DA EX as well. Similarly, very good correlation and consistent values for MA
OTC and MA EX leads us to assume that results for MA OTC correlation across hubs should hold true for MA EX
as well.
5.2 Short term trading price correlation
Quantitative analysis (Figure 27) confirms that the correlation between DA OTC prices has been consistently
positive and high for all pairs of hubs since 2007, with the exception of the Italian PSV (having low liquidity and its
own patterns, at least in the earlier years).
Figure 27: OTC DA pair-wise correlation coefficients, 2007-2012
Source: Tankard Parties, author
The majority of the coefficients are above 90% (100% being the highest degree of positive linear relationship).
Over the whole period the two German hubs (GSL, NCG) are the pair that exhibit the highest correlation.
Correlation coefficients between all pairs were above 90% in 2007. Post 2007, when data for the PSV became
available, it is evident that the Italian price is less well aligned when compared to the others, especially in 2010

35
and 201153
. The situation appears to be greatly improved in 2012 though: note for instance the evolution of the
PSV-TTF correlation coefficient over years. In fact, in the first half of 2012 the PSV, although presenting higher
spreads and lower correlation levels compared to all the others, showed a good level of co-movement with the
other Continental Hubs with correlation coefficients above 70%. Surprisingly, in 1H2012 the PSV is less strongly
linked to the neighbouring CEGH than to other Continental Europe hubs.
There is a similar, though not so extreme, situation with the correlation of the Austrian hub to the NW European
hubs. Although performing much better than the PSV, the CEGH appears to be slightly separated from the
others, especially in 2011.
Another finding is that in 2011 the correlation values between NBP and other hubs are lower compared to
previous years; this delinking appears to be temporary however, as strong correlation is restored in the latest
available data.
The correlation coefficients for all the groups of hubs shown in Figure 27 have been above 70%, across all the
years. It is therefore fair to conclude that global correlation has been strong since 2007. In the first half of 2012
the global score is at 88%, as a consequence of CEGH and PSV becoming better aligned to the others.
Figure 28: OTC DA group correlation coefficients, 2007-20121H
Note: ‘WE hubs’ stands for TTF, GSL, NCG and PEG
Source: Tankard Parties, author
The North West Continental Europe hubs (TTF, ZEE, the German and French hubs) are consistently highly
correlated over the whole period: their correlation is always near to or above 95%. When we exclude the Belgian
hub, the Dutch, German and French OTC markets are even more synchronized, however the scores reveal that
ZEE has never been significantly delinked from the other North West Continental hubs, notwithstanding that fact
that it is the only one of these priced in sterling.
Interestingly, the French hubs, which according to Heather (2012) are less developed, showed good price
correlation with the other Continental hubs, possibly because, notwithstanding lower liquidity, they are adjacent
and connected to these markets. However, excluding them does pull correlation scores up in 2012, when their
correlation with other hubs was less direct.
53
We do not take into account 2009 due to few observations for PSV price. The very low level of correlation displayed in 2009
between the Italian and the Austrian hubs (15%), when compared to the higher figures for the two pairs PSV-TTF and CEGH-
TTF (80% and 93% respectively), confirms that it is biased by the scarce liquidity on the two hubs.

36
The Austrian market since 2009 has become progressively more aligned to the North West Continental Europe
hubs and in 1H2012 its exclusion from the group does not lead to a significant improvement in the group score.
It is apparent that the marginal contribution of the NBP to group correlation is negative, as excluding the NBP
from the group improves the group score. However, the impact of NBP exclusion on correlation varies across the
years: in 2011 it is the highest, while in 1H2012 it can be deemed insignificant. This is consistent with the
observation that the NBP in 2011 experienced a temporary delinking (this is further discussed in Section 5.5). It
should be noticed firstly that the NBP’s poor correlation with the Continental group was not the result of exchange
rate dynamics as Zeebrugge prices are also quoted in sterling, but remain highly correlated to TTF over the
whole period.
In conclusion, the strong correlations demonstrated above support the thesis that in Europe, once gas can be
transported easily across borders between developed trading hubs, market forces tend to result in hub prices
moving in tandem54
. The PSV convergence in 2012, following regulatory action which opened up transport
capacity to Northern markets, is a clear example of this. The PEG delinkage in 1H2012, due to physical
congestion between PEG Nord and Peg Sud (this is further discussed in Section 5.5), is another example.
We will now turn to month ahead trading to assess whether similar conclusions can be drawn.
5.3 Longer term trading price correlation
When turning to MA OTC price, the results confirm that correlation is strong and positive for most of the hub pairs
over time, with the exception of PSV (Figure 29).
Figure 29: OTC MA pair-wise correlation coefficients, 2007-20121H
Source: Tankard Parties, author
The PSV-TTF correlation moved down to negative values in the first half of 2012. This is explained by the
movement of Italian prices down towards a new equilibrium level, closer to the other European prices (Figure 30
54
Note that this paper does not address the issue of whether price differences (spreads) between the European hubs are
equalized net of transaction costs. This may be a possible area of future research, however reliably quantifying transaction
costs could be problematic.

37
and Figure 31). While establishing a more consistent level with other European hubs from mid 2012 onwards, the
transition path in early 2012 resulted in poor correlation.
The main reason for the change at PSV is the impact of regulatory measures that opened up the Italian borders,
allowing gas to flow beyond national boundaries. We would expect that from the second half of 2012 onwards
arbitrage forces will result in an equilibrium, with a lower spread to Northern hubs and correlation scores
increasing again.
In general terms the MA price correlation pattern is clearer than the DA pattern, possibly because the overall DA
trend is obscured by short term transient factors. An example is the short term price spike resulting from the
February 2012 crisis55
.
Figure 30: OTC MA prices on PSV and TTF, 20121H (€/MWh)
20
25
30
35
01jan2012 01mar2012 01may2012 01jul2012Date
Source: Tankard Parties, author
55
Henderson and Heather (2012).

38
Figure 31: OTC DA prices on TTF and PSV, 20121H (€/MWh) 2
03
04
05
06
07
0
01jan2012 01mar2012 01may2012 01jul2012Date
Source: Tankard Parties, author
As expected, the correlation between OTC MA prices is similar or slightly increased for most of the hub pairs
when compared to the correlation based on OTC day head prices, in all years except 2012, because longer
dated trading is less dependent on local or transient factors. The most notable exception is the PSV MA contract
in 2012, showing negative scores for the MA contract for the reasons discussed above. Higher correlation on
longer term contract prices does not hold true for PEG and CEGH in 1H2012, possibly due to the low number of
observations (i.e. days in which there is at least one trade).
Figure 32 shows, along with the PSV delinking in 1H2012, that in 2011 NBP month ahead prices do not appear to
experience such a significant drop in correlation with the Continental Europe hubs compared with the OTC DA
analysis. The PSV delinking in the most recent data is more marked than it was using DA. Group scores continue
to be the highest for the North West Continental hubs. The overall ‘global’ score increased from 2009 to 2011
and in 2012, (when excluding the PSV for the reason mentioned above), group correlation coefficients are near
or above 95%.

39
Figure 32: OTC MA Group correlation coefficients, 2007-2012
Note: ‘WE hubs’ stands for TTF, GSL, NCG and PEG
Source: Tankard Parties, author
5.4 Which is the benchmark hub?
For all continental hubs, the link with TTF is generally higher and more stable over the years than the one with
NBP (Figure 33 and Figure 34). TTF appears then to be the best benchmark from this point of view: when
comparing the relationship with the two most mature gas trading hubs, correlation with TTF is higher in all paired
comparisons, both for day ahead and month ahead contracts.
Figure 33: Correlation with TTF and correlation with NBP (OTC DA prices)
Source: Tankard Parties, author
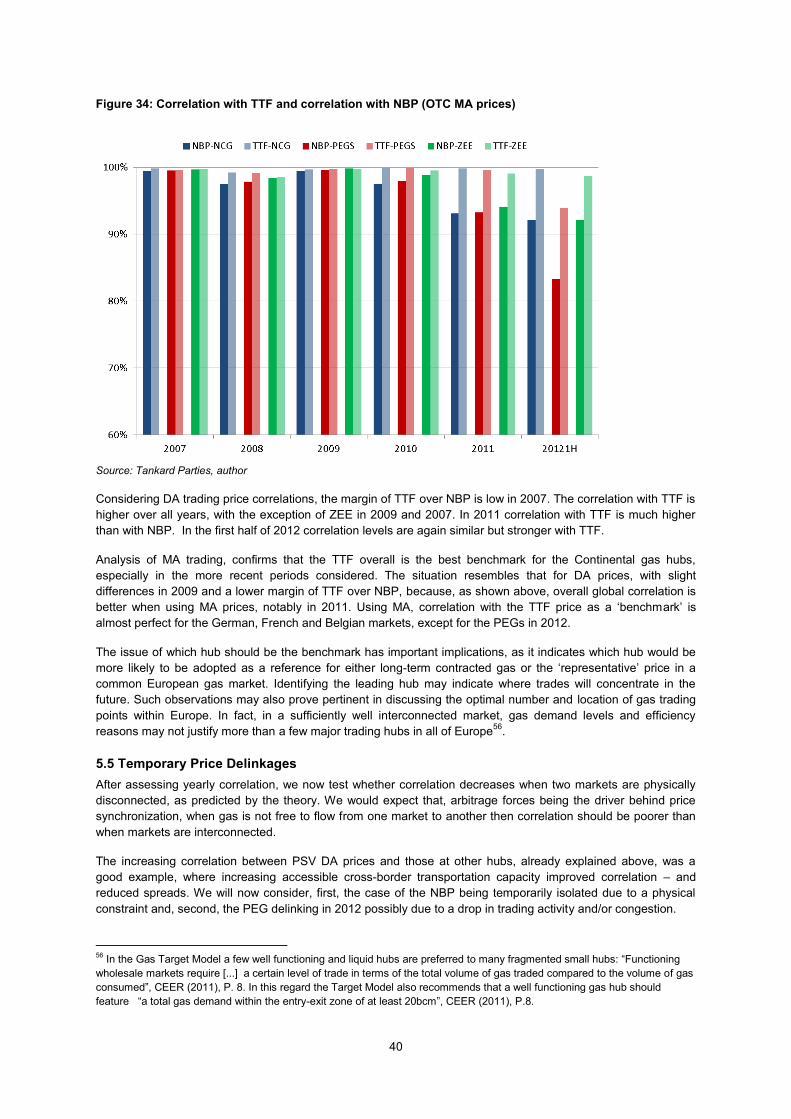
40
Figure 34: Correlation with TTF and correlation with NBP (OTC MA prices)
Source: Tankard Parties, author
Considering DA trading price correlations, the margin of TTF over NBP is low in 2007. The correlation with TTF is
higher over all years, with the exception of ZEE in 2009 and 2007. In 2011 correlation with TTF is much higher
than with NBP. In the first half of 2012 correlation levels are again similar but stronger with TTF.
Analysis of MA trading, confirms that the TTF overall is the best benchmark for the Continental gas hubs,
especially in the more recent periods considered. The situation resembles that for DA prices, with slight
differences in 2009 and a lower margin of TTF over NBP, because, as shown above, overall global correlation is
better when using MA prices, notably in 2011. Using MA, correlation with the TTF price as a ‘benchmark’ is
almost perfect for the German, French and Belgian markets, except for the PEGs in 2012.
The issue of which hub should be the benchmark has important implications, as it indicates which hub would be
more likely to be adopted as a reference for either long-term contracted gas or the ‘representative’ price in a
common European gas market. Identifying the leading hub may indicate where trades will concentrate in the
future. Such observations may also prove pertinent in discussing the optimal number and location of gas trading
points within Europe. In fact, in a sufficiently well interconnected market, gas demand levels and efficiency
reasons may not justify more than a few major trading hubs in all of Europe56
.
5.5 Temporary Price Delinkages
After assessing yearly correlation, we now test whether correlation decreases when two markets are physically
disconnected, as predicted by the theory. We would expect that, arbitrage forces being the driver behind price
synchronization, when gas is not free to flow from one market to another then correlation should be poorer than
when markets are interconnected.
The increasing correlation between PSV DA prices and those at other hubs, already explained above, was a
good example, where increasing accessible cross-border transportation capacity improved correlation – and
reduced spreads. We will now consider, first, the case of the NBP being temporarily isolated due to a physical
constraint and, second, the PEG delinking in 2012 possibly due to a drop in trading activity and/or congestion.
56
In the Gas Target Model a few well functioning and liquid hubs are preferred to many fragmented small hubs: “Functioning
wholesale markets require [...] a certain level of trade in terms of the total volume of gas traded compared to the volume of gas
consumed”, CEER (2011), P. 8. In this regard the Target Model also recommends that a well functioning gas hub should
feature “a total gas demand within the entry-exit zone of at least 20bcm”, CEER (2011), P.8.
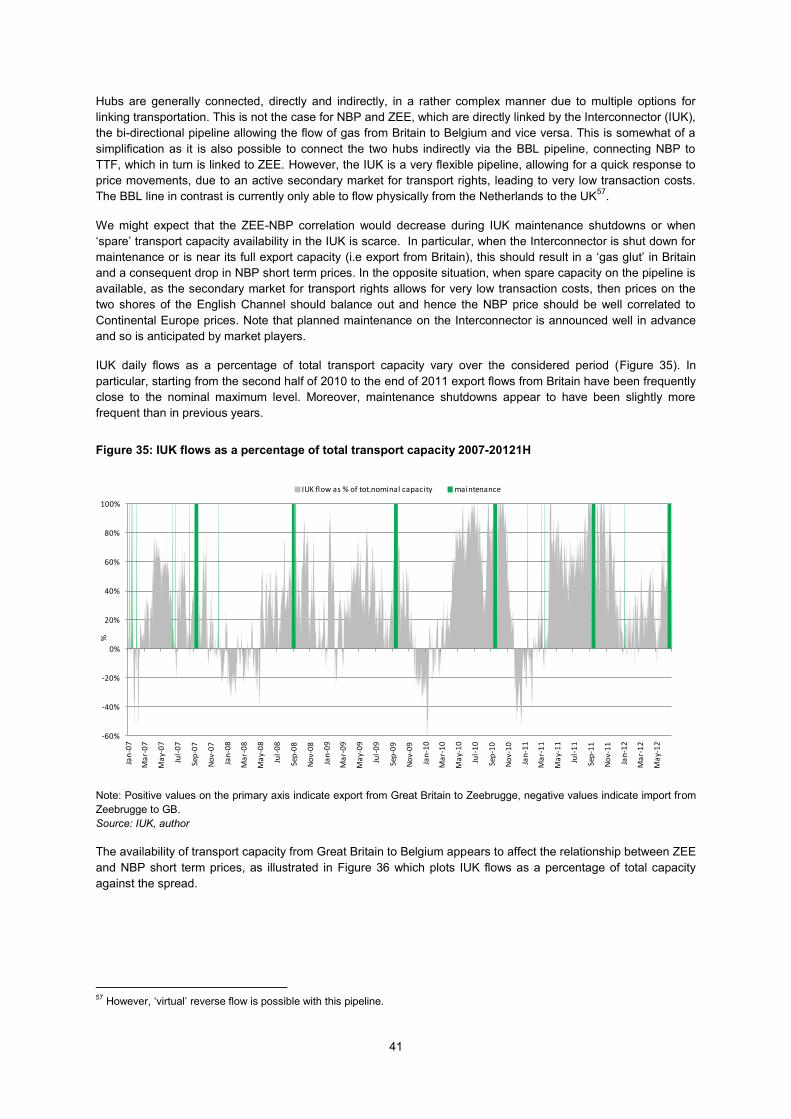
41
Hubs are generally connected, directly and indirectly, in a rather complex manner due to multiple options for
linking transportation. This is not the case for NBP and ZEE, which are directly linked by the Interconnector (IUK),
the bi-directional pipeline allowing the flow of gas from Britain to Belgium and vice versa. This is somewhat of a
simplification as it is also possible to connect the two hubs indirectly via the BBL pipeline, connecting NBP to
TTF, which in turn is linked to ZEE. However, the IUK is a very flexible pipeline, allowing for a quick response to
price movements, due to an active secondary market for transport rights, leading to very low transaction costs.
The BBL line in contrast is currently only able to flow physically from the Netherlands to the UK57
.
We might expect that the ZEE-NBP correlation would decrease during IUK maintenance shutdowns or when
‘spare’ transport capacity availability in the IUK is scarce. In particular, when the Interconnector is shut down for
maintenance or is near its full export capacity (i.e export from Britain), this should result in a ‘gas glut’ in Britain
and a consequent drop in NBP short term prices. In the opposite situation, when spare capacity on the pipeline is
available, as the secondary market for transport rights allows for very low transaction costs, then prices on the
two shores of the English Channel should balance out and hence the NBP price should be well correlated to
Continental Europe prices. Note that planned maintenance on the Interconnector is announced well in advance
and so is anticipated by market players.
IUK daily flows as a percentage of total transport capacity vary over the considered period (Figure 35). In
particular, starting from the second half of 2010 to the end of 2011 export flows from Britain have been frequently
close to the nominal maximum level. Moreover, maintenance shutdowns appear to have been slightly more
frequent than in previous years.
Figure 35: IUK flows as a percentage of total transport capacity 2007-20121H
-60%
-40%
-20%
0%
20%
40%
60%
80%
100%
Jan
-07
Ma
r-0
7
Ma
y-0
7
Jul-
07
Sep
-07
No
v-0
7
Jan
-08
Ma
r-0
8
Ma
y-0
8
Jul-
08
Sep
-08
No
v-0
8
Jan
-09
Ma
r-0
9
Ma
y-0
9
Jul-
09
Sep
-09
No
v-0
9
Jan
-10
Ma
r-1
0
Ma
y-1
0
Jul-
10
Sep
-10
No
v-1
0
Jan
-11
Ma
r-1
1
Ma
y-1
1
Jul-
11
Sep
-11
No
v-1
1
Jan
-12
Ma
r-1
2
Ma
y-1
2
%
IUK flow as % of tot.nominal capacity maintenance
Note: Positive values on the primary axis indicate export from Great Britain to Zeebrugge, negative values indicate import from
Zeebrugge to GB.
Source: IUK, author
The availability of transport capacity from Great Britain to Belgium appears to affect the relationship between ZEE
and NBP short term prices, as illustrated in Figure 36 which plots IUK flows as a percentage of total capacity
against the spread.
57
However, ‘virtual’ reverse flow is possible with this pipeline.

42
Figure 36: ZEE-NBP spread against IUK flows as a percentage of total capacity by year -.
50
.51
-.5
0.5
1
0 5 10 0 5 10 0 5 10
2007 2008 2009
2010 2011 2012
flo
w/c
ap
acity %
ZEE-NBP euro/MWhGraphs by year
Source: Tankard Parties, IUK, author
By visual inspection we can say that when no gas flows across the two countries (i.e. dots fall on the X axis in the
Figure), the UK price is lower and hence the spread higher than zero. Flows near to nominal maximum capacity
enlarge the spread in 2011.
There appears to be a positive linear relationship between the rate of utilization of IUK export capacity to Belgium
and the spread between ZEE and NBP: the higher the utilization rate of the export capacity, the lower the NBP
price compared to ZEE.
The striking reaction of the spread to maintenance is evident in Figure 37.
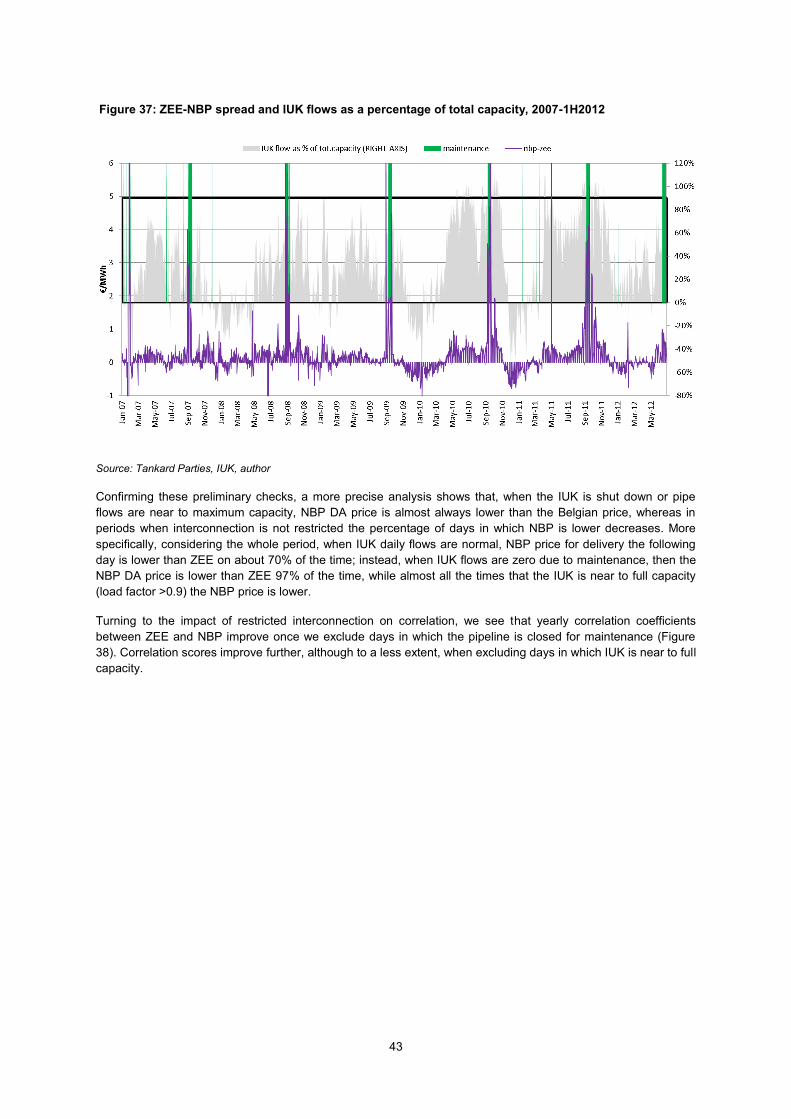
43
Figure 37: ZEE-NBP spread and IUK flows as a percentage of total capacity, 2007-1H2012
Source: Tankard Parties, IUK, author
Confirming these preliminary checks, a more precise analysis shows that, when the IUK is shut down or pipe
flows are near to maximum capacity, NBP DA price is almost always lower than the Belgian price, whereas in
periods when interconnection is not restricted the percentage of days in which NBP is lower decreases. More
specifically, considering the whole period, when IUK daily flows are normal, NBP price for delivery the following
day is lower than ZEE on about 70% of the time; instead, when IUK flows are zero due to maintenance, then the
NBP DA price is lower than ZEE 97% of the time, while almost all the times that the IUK is near to full capacity
(load factor >0.9) the NBP price is lower.
Turning to the impact of restricted interconnection on correlation, we see that yearly correlation coefficients
between ZEE and NBP improve once we exclude days in which the pipeline is closed for maintenance (Figure
38). Correlation scores improve further, although to a less extent, when excluding days in which IUK is near to full
capacity.
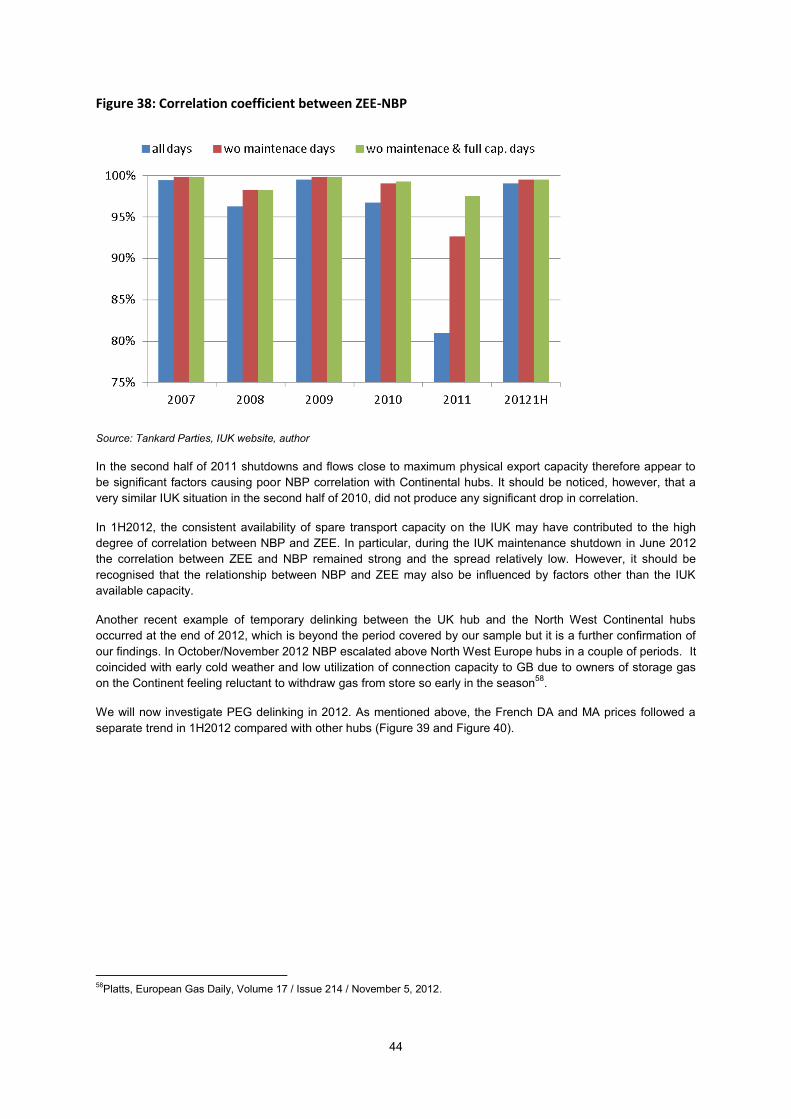
44
Figure 38: Correlation coefficient between ZEE-NBP
Source: Tankard Parties, IUK website, author
In the second half of 2011 shutdowns and flows close to maximum physical export capacity therefore appear to
be significant factors causing poor NBP correlation with Continental hubs. It should be noticed, however, that a
very similar IUK situation in the second half of 2010, did not produce any significant drop in correlation.
In 1H2012, the consistent availability of spare transport capacity on the IUK may have contributed to the high
degree of correlation between NBP and ZEE. In particular, during the IUK maintenance shutdown in June 2012
the correlation between ZEE and NBP remained strong and the spread relatively low. However, it should be
recognised that the relationship between NBP and ZEE may also be influenced by factors other than the IUK
available capacity.
Another recent example of temporary delinking between the UK hub and the North West Continental hubs
occurred at the end of 2012, which is beyond the period covered by our sample but it is a further confirmation of
our findings. In October/November 2012 NBP escalated above North West Europe hubs in a couple of periods. It
coincided with early cold weather and low utilization of connection capacity to GB due to owners of storage gas
on the Continent feeling reluctant to withdraw gas from store so early in the season58
.
We will now investigate PEG delinking in 2012. As mentioned above, the French DA and MA prices followed a
separate trend in 1H2012 compared with other hubs (Figure 39 and Figure 40).
58
Platts, European Gas Daily, Volume 17 / Issue 214 / November 5, 2012.

45
Figure 39: OTC DA prices on PEG and TTF, 2012 (€/MWh) 2
02
53
03
54
04
5
01jan2012 01mar2012 01may2012 01jul2012Date
Source: Tankard Parties, author
Figure 40: OTC MA prices on PEG and TTF, 2012 (€/MWh)
21
22
23
24
25
26
01jan2012 01mar2012 01may2012 01jul2012Date
Source: Tankard Parties, author
High PEG price volatility was the reason behind the lower correlation of West European hubs in 20121H.
Our PEG series includes OTC trades on French hubs, namely Peg North, Peg South and Peg TIGF. From 2007
up to 20121Q Peg North and Peg South (Peg TIGF represents marginal volumes in our data set and for this
reason it is not shown in Figures 41 & 42) have moved in tandem showing fairly similar price levels, despite Peg
North being more liquid and the MA contract very rarely traded on the Peg South (Figure 41 and Figure 42).

46
Figure 41: PEG S, PEG N and PEG S-PEG N spread (OTC DA) (€/MWh)
01
02
03
04
0
01jan2007 01jan2008 01jan2009 01jan2010 01jan2011 01jan2012Date
Source: Tankard Parties, author
Figure 42: PEG S, PEG N and PEG S-PEG N spread (OTC MA) (€/MWh)
01
02
03
04
0
01jan2007 01jan2008 01jan2009 01jan2010 01jan2011 01jan2012Date
Source: Tankard Parties, author
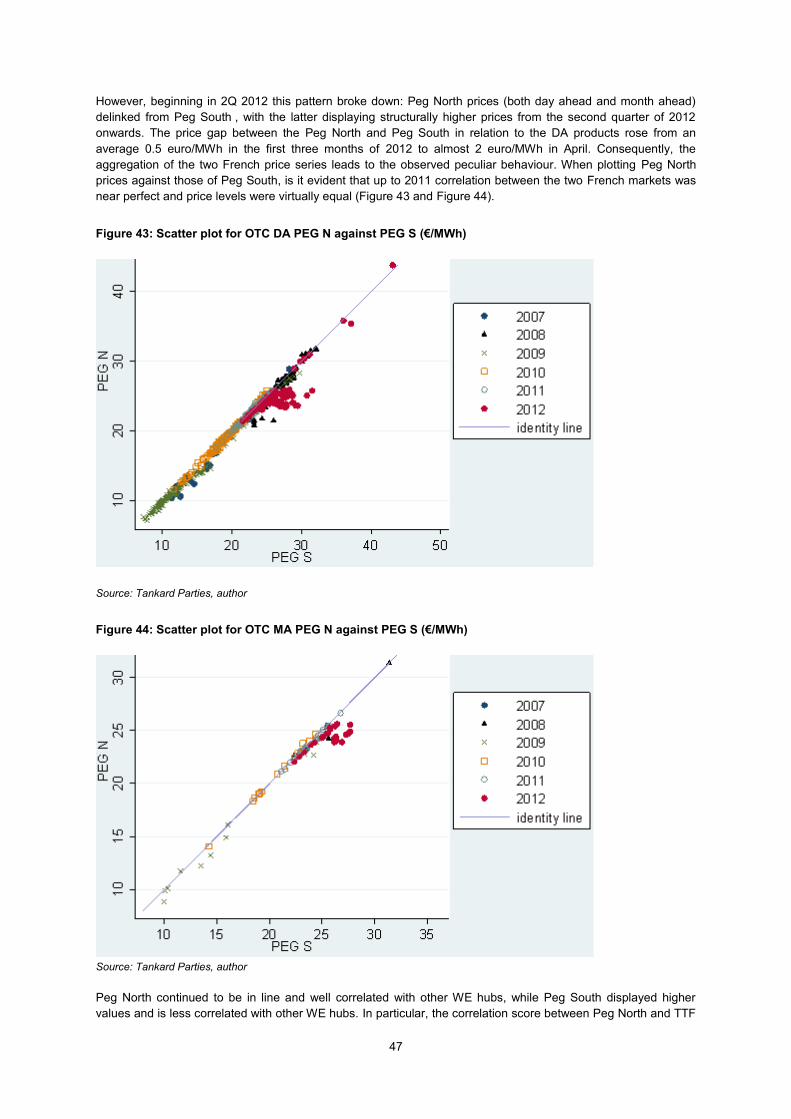
47
However, beginning in 2Q 2012 this pattern broke down: Peg North prices (both day ahead and month ahead)
delinked from Peg South , with the latter displaying structurally higher prices from the second quarter of 2012
onwards. The price gap between the Peg North and Peg South in relation to the DA products rose from an
average 0.5 euro/MWh in the first three months of 2012 to almost 2 euro/MWh in April. Consequently, the
aggregation of the two French price series leads to the observed peculiar behaviour. When plotting Peg North
prices against those of Peg South, is it evident that up to 2011 correlation between the two French markets was
near perfect and price levels were virtually equal (Figure 43 and Figure 44).
Figure 43: Scatter plot for OTC DA PEG N against PEG S (€/MWh)
Source: Tankard Parties, author
Figure 44: Scatter plot for OTC MA PEG N against PEG S (€/MWh)
Source: Tankard Parties, author
Peg North continued to be in line and well correlated with other WE hubs, while Peg South displayed higher
values and is less correlated with other WE hubs. In particular, the correlation score between Peg North and TTF
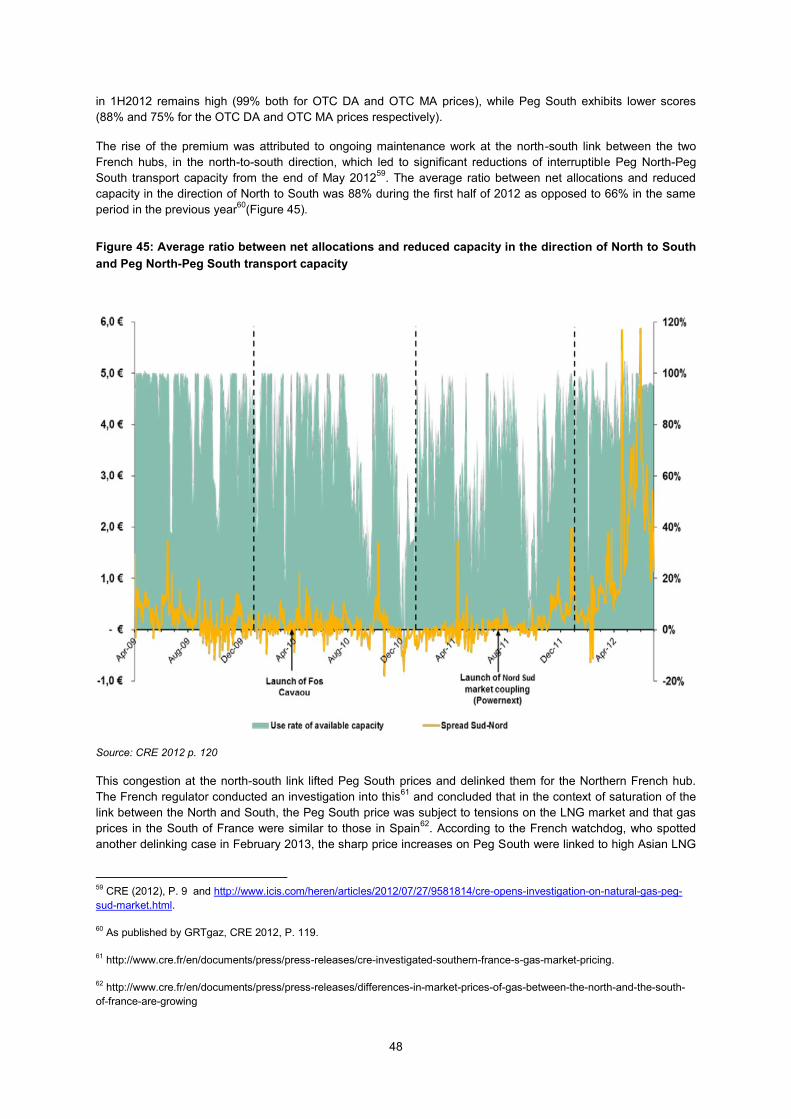
48
in 1H2012 remains high (99% both for OTC DA and OTC MA prices), while Peg South exhibits lower scores
(88% and 75% for the OTC DA and OTC MA prices respectively).
The rise of the premium was attributed to ongoing maintenance work at the north-south link between the two
French hubs, in the north-to-south direction, which led to significant reductions of interruptible Peg North-Peg
South transport capacity from the end of May 201259
. The average ratio between net allocations and reduced
capacity in the direction of North to South was 88% during the first half of 2012 as opposed to 66% in the same
period in the previous year60
(Figure 45).
Figure 45: Average ratio between net allocations and reduced capacity in the direction of North to South
and Peg North-Peg South transport capacity
Source: CRE 2012 p. 120
This congestion at the north-south link lifted Peg South prices and delinked them for the Northern French hub.
The French regulator conducted an investigation into this61
and concluded that in the context of saturation of the
link between the North and South, the Peg South price was subject to tensions on the LNG market and that gas
prices in the South of France were similar to those in Spain62
. According to the French watchdog, who spotted
another delinking case in February 2013, the sharp price increases on Peg South were linked to high Asian LNG
59
CRE (2012), P. 9 and http://www.icis.com/heren/articles/2012/07/27/9581814/cre-opens-investigation-on-natural-gas-peg-
sud-market.html.
60 As published by GRTgaz, CRE 2012, P. 119.
61 http://www.cre.fr/en/documents/press/press-releases/cre-investigated-southern-france-s-gas-market-pricing.
62 http://www.cre.fr/en/documents/press/press-releases/differences-in-market-prices-of-gas-between-the-north-and-the-south-
of-france-are-growing

49
prices, reduced gas supply from Algeria and Nigeria, and the cancellation of some LNG deliveries to Southern
France.
Additionally, the first half of 2012 breaks the positive trend in PEG trading volumes compared to previous years,
with a decline in trades63
.
63
CRE (2012), P.8.
50
6. Conclusions
Underpinned by new and extensive empirical evidence, this paper examined a key metric to assess the reliability
of hub price signals as well as their integration i.e. price correlation between hubs. The analysis of such price
correlations suggests that European gas hubs are already part of the same integrated market and indeed can
increasingly be regarded as providing a reliable price reference for gas in Europe.
In fact, although European gas hubs are characterised by very different levels of liquidity, price correlation across
hubs is strong and has been increasing over time, with hubs previously not well correlated moving progressively
into better alignment with each other. This holds both for short term trading (day ahead) and longer term trading
(month ahead). West European hubs are more closely correlated to TTF than to NBP. Additionally, the OTC
markets and the exchanges are well correlated and express the same price signal, further corroborating the
argument for integration.
As predicted by the theory, we verified that correlation decreases when two markets are physically disconnected,
by looking at two study cases: the NBP delinking during IUK maintenance shutdown and physical congestion and
the PEG misalignment due to physical congestion. Similarly, PSV correlation to the other hubs has improved due
to the implemening of open access transportation measures. Delinkages of prices can be deemed as temporary
and dependent on transient shocks to supply or demand.
We therefore conclude that the European gas prices considered in this analysis are already part of the same
integrated market for gas. Segmentation across national markets appears to have been overcome. Based on
this, one might argue that EU integration policies have been successful, and also that further policy measures
might not be needed in this regard.
Price correlation also suggests that European gas hubs are already expressing a competitive market price
reference and that a necessary condition for efficient pricing has already been met. Based on these findings one
might argue that hubs are suited to provide the new market benchmark for pricing natural gas within Europe.

51
Appendix 1: Data creation
Raw data from brokers (specifically the Tankard Parties) and exchange websites were assembled and sampled
to obtain streams of daily historical price data and related total daily traded volumes for the selected traded
contracts, building up a database of prices and volumes prevailing at the main European gas trading hubs. The
following notes detail some features of the creation of this dataset.
The dataset has separate daily price series for exchange traded and OTC traded products, to check for any
difference when comparing broadly equivalent contracts. Note that exchange cleared OTC transactions were
excluded (so called “given up for clearing” OTC trades or “OTC broker give up”) from OTC trades, as although
they are recorded by brokers these trades effectively occurred via exchanges.
Computation of daily average prices
The daily price was computed as the volume-weighted average of the prices of the transactions occurring in a
day.
However, this average may be computed averaging over either:
(1) prices of trades executed within a restricted time period (the so called “settlement window”) at the end of the
trading day (obtaining an End of Day Price also known as Settlement Price) or
(2) all the orders executed within the whole trading day (obtaining a Daily Average Price).
We chose a Daily Weighted Average Price rather than a Settlement price. It is worth noticing that the latter is
usually considered as a price reference by Price Reporting Agencies and settlement prices are published by
exchanges (EEX for instance).
However, the choice should not impact on the results in terms of correlation, if we assume that in a given day
trading transactions executed in the last half hour are not significantly different on average from the rest of the
trades executed during that day. By means of example, using data for the NBP month-ahead contract traded on
ICE from January 2007 to July 2012, which report both Weighted Average Price and End of Day Price, it turns
out that the two variables are very similar with the exception of a few days, especially in the beginning of 2009,
(an especially volatile period), the variation being always less than 5% of the price.
Selected hubs
The market hubs considered correspond to those extensively described in Heather (2012) and refer to existing
gas hubs as separated entities (with the exception of the French PEGs). Although they currently exist as
separated hubs, all transactions at the French hubs were combined into one total.
Before 2009 transactions ascribed to Gaspool (GPL) and NCG correspond to the hubs that were subsequently
merged to form GPL and NCG respectively.
Points of delivery were grouped into hubs as follows:
Table 4: Delivery points associated with each hub
NBP TTF CEGH ZEE PSV PEGS GASPOOL NCG
NBP TTF G + 44.4 BAUMGARTEN Zeebrugge Hub PSV PEG NORD_H BEB_VEP-H EGT_VP_MID_H GAS
TTF Hi Cal 51.6 BAUMGARTEN MS 2 PEG Est BEB_VEP-L EGT_VP_NORTH_H GAS
BAUMGARTEN MS 3 PEG Sud GASPOOL EGT_VP_SOUTH_H GAS
BAUMGARTEN ITAB PEG ouest ONTRAS_VP EGT_VP-H
Baumgarten (TAG) PEG GSO EGT_VP-L
Baumgarten (WAG) PEG-TIGF EGT_VP-MID-H
ITAB (Baumgarten) EGT_VP-NORTH-H
EGT_VP-SOUTH-H
NCG
NCG L
52
Unit of measurement and conversion factor
All price data is in €/MWh and volumes in MWh. NBP and ZEE prices, originally expressed in pence/therm, were
converted to €/MWh assuming a conversion factor of 29.3071 kilowatt hours/therm or 34.121415 therms/MWh,
using the daily average euro/ GB sterling exchange rate as published by OANDA64
.
Identification of month ahead product
As the month ahead contract may not be explicitly identified in the raw data, when necessary the following
assumption is made: trading for the month ahead contract ceases on the last business day of the month.
Detailed list of sources for exchange data
Exchange NBP month ahead
These data are based on ICE data from 1 Jan 1997 to 13 July 2012 (price quoted in pence/therm, volumes in
1,000 therms). These are Weighted Average Prices.
Exchange TTF day ahead
These data are based on APX ENDEX TTF All Day Index data from 2 January 2006 to 15 Jan 2012 and based
on APX TTF Day-Ahead Index from 17 Jan to 30 June 2012 (prices quoted in €/MWh, volumes in MWh).
We consider the price only when it corresponds to an actual trade (i.e. corresponding total daily volumes are
greater than zero). The index refers to a daily average price, rather than to a Closing or End of Day price.
The APX TTF All-day Index is a volume-weighted average price of all single day trades on TTF executed
between 06:00 CET and 18:00 CET on the day prior to settlement (for example, if the index is to be calculated for
4th May, eligible trades will be those made on 3rd May). If there are no trades on TTF within the time period
specified above, a default procedure is employed to generate a default index value, for the day in question.
On 16 January 2012 APX-ENDEX ceased publication of the APX TTF All-day Index and replaced it with the APX
TTF Day-Ahead Index. The APX TTF Day-Ahead Index is calculated using a different computation method, and
is a volume-weighted average price of all orders which are executed on the gas day before the day of delivery
and consists of two indices:
The APX TTF Next-Day Index for next-day delivery on working days: This index is the volume-weighted average
price of all TTF Day contracts which are concluded on Monday through Friday for delivery on the next working
day. The APX TTF Day-Ahead Index for Monday is based on the trades concluded on the Friday before.
The APX TTF Weekend Index for delivery on Saturday and Sunday: This index is the volume-weighted average
price of all TTF Day and TTF Weekend contracts which are concluded on Friday for delivery on Saturday and/or
Sunday.
Although, during the considered period, ICE exchange offered contracts for TTF, and EEX on 30 May 2011
started to offer 10 MW and 1MW next day contracts for TTF, we did not consider ICE and EEX quotations for
TTF contracts.
Exchange TTF month ahead
These data are based on APX ENDEX data (prices quoted in €/MWh, volumes in MWh).
The price series for the TTF month ahead contract quoted by Endex refers to End of Day prices: there are
settlement windows when the daily reference price is computed and these windows should reflect trades during
the whole day. When unusual spikes occur during the settlement window checking procedures are employed.
Daily settlement prices whose corresponding total daily volume is zero were not considered.
64 http://www.oanda.com/currency/historical-rates/

53
Exchange ZEE day ahead
These data are based on APX ENDEX All Day Index Zeebrugge data from 1 January 2006 to 16 July 2012
(prices quoted in €/MWh, volumes in MWh), retrieved from http://www.apxendex.com/index.php?id=90. The
index methodology is described here: http://www.apxendex.com/index.php?id=446.
We consider the price only when it corresponds to an actual transaction (i.e. corresponding total daily volumes
are greater than zero).
The index refers to a daily average price, rather than to a Closing or End of Day price.
Exchange CEGH day ahead
These data are based on CEGH Gas exchange data from 11 Dec 2009 to 13 July 2012 (prices quoted in€/MWh,
volumes in MWh).65
We consider the price only when it corresponds to an actual transaction (i.e. corresponding
total daily volumes are greater than zero). As the day-ahead contract is not identified in CEGH exchange data we
consider all the trades whose delivery day is the day after the trading day. Raw data provide a daily price based
on all deals of the day as a volume weighted average price.
Exchange CEGH month ahead
These data are based on CEGH Gas exchange data from 10 Dec 2010 to 15 Jul 2012 for the contract “GBBM
1.FM” (prices quoted in€/MWh, volumes in MWh) 66
. We consider the price only when it corresponds to an actual
trading transaction (i.e. corresponding total daily volumes are greater than zero). Raw data provide a daily price
based on all deals of the day as a volume weighted average price.
Exchange NCG and GPL day ahead
Data for German hubs are based on EEX data (prices quoted in €/MWh, volume in MWh)67
. Data for NCG started
to be available on 1 October 2007, GSL data from 1 July 2007. Prices are Settlement prices and the settlement
window is 5-5:15 pm.
More specifically:
until 29 May 2011 inclusive, the series for the two German hubs refer to settlement prices for the “10
MW contract” whose delivery day is the day after the trading day, respectively for NCG and GSL
from 30 May 2011 onwards, the series for the German hubs refer to volume-weighted averages over
settlement prices for contracts “next day 10 MW” and “next day 1 MW”, respectively for NCG and GSL,
provided that the delivery day is the day after the trading day68
.
Since 30 May 2011 EEX has published two different settlement prices, one for the “1MW contract” and the other
for the “10 MW contract”. We take into account the volume-weighted average of the two.
65
On December 11, 2009 Central European Gas Hub AG (CEGH), European Commodity Clearing AG (ECC) and Wiener
Börse AG (WBAG) launched a Spot Market: CEGH Gas Exchange. We retrieved CEGH historical price and volume data from
the website in July 2012. CEGH Market Support & Services team offered a weekly exchange newsletter data service for all
people interested and this service included historic daily price and volume data concerning trades with delivery at CEGH. The
service was free of charge. At the time of writing, CEGH has stopped publishing historic data on its website. CEGH now only
publishes price data for the last 2 months (http://www.cegh.at/index.php?id=116). Older historic data will be available at a later
stage again on a fee basis, in accordance with the new fee schedule of the Vienna Stock Exchange, which is the license holder
for the CEGH Gas Exchange markets. Volumes only are shown online for the last week at
http://www.cegh.at/index.php?id=114.
66 See previous footnote.
67 EEX historical price and volume data are available on a fee basis. EEX publishes every day on its website daily price and
volumes for the traded contracts.
68 Note that some contracts are classified as next day even if the delivery date does not coincide with the day after the trading
day. For the sake of simplicity took into account only the contracts whose delivery day is the day after the trading day.

54
EEX has been offering NCG 10 MW contracts for continuous trading since 1 October 2007, while the GSL 10
MW contract started being offered for continuous trading from 1 July 2007. On 15 July 2009 EEX also started
auctions with lot sizes of 1 MW; hence after 15 July 2009 and before 30 May 2011, EEX distinguished between
10 MW contracts for continuous trading and 1 MW contracts for auctions. The 1 MW contracts concluded up to
30 May 2011 have not been considered in this analysis, as they were sold through auctions rather than through
“pure” exchange trading.
From 30 May 2011, EEX enabled physical trading in gas products on the EEX Spot Market 24 hours a day, 7
days a week, and introduced 1 MW contracts in the spot markets for both GSL and NCG. On 30 May 2011 EEX
also launched TTF 10 MW and 1 MW contracts (not considered in this analysis). While EEX continued to publish
settlement prices for both 10 MW and 1 MW contracts, a Daily Reference Price was launched as well.
Exchange NCG and GSL month ahead
Data for German hubs are based on EEX data (prices quoted in €/MWh, volume in MWh69
. Data for NCG and
GSL started to be available from the end of 2007. Prices are End of Day prices.
We used the EEX contracts “G0BM” and “G1BM”, respectively for NCG and GSL, provided that the delivery
month is the month after the trading day.
Exchange PEG day ahead
These data are based on Powernext exchange data from 26 Nov 2008 to 13 July 2012 (prices quoted in €/MWh,
volumes in MWh)70
. As the Powernext website provides historical data on all the trades executed each day on
Powernext, we computed daily volume-weighted average prices based on this information.
Exchange PEG month ahead
These data are based on Powernext exchange data from 26 Nov 2008 (prices quoted in €/MWh, volumes in
MWh) 71
.
As the Powernext website provides historical data on all the trades executed each day on Powernext, we
computed daily volume-weighted average prices and total daily volume based on this information.
Exchange month ahead ZEE
In the dataset there are no data for exchange traded month ahead contracts for delivery at ZEE. As Zeebrugge is
a physical hub, it does not do month ahead. The new ZTP, set up in September 2012, may have month ahead
contracts in the future, but ZTP currently provides only day ahead and within day contracts (i.e. only spot).
Exchange NBP day ahead
ICE (currently ICE ENDEX after the merger in 2013) did not cover spot trading in continental Europe in the period
covered by this study, neither day ahead nor within day: ICE covered only futures with delivery at NBP. However,
in the same period, APX-Endex (currently ICE ENDEX after the merger in 2013) instead covered spot in the UK:
APX Endex was the assigned market operator for the On-the-day Commodity Market and also offered a suite of
physical NBP Prompt Gas products including NBP Day-Ahead. However, while OCM was liquid over the whole
period, almost no Day-ahead volumes were traded in most months.
69
EEX historical price and volume data are available on a fee basis. EEX publishes every day on its website daily price and
volumes for the traded contracts.
70 Powernext data, including the comprehensive record of all the trades concluded on the spot and future market, are free to
download on the website
http://www.powernext.com/#sk;tp=app;n=market;f=listMarketTable;t=layout/gasSpot;fp=system_name:gasSpot;lang=en_US;m
=Market_Data.
71 See previous note.
55
Exchange month ahead and day ahead PSV
In the dataset there are no data for daily prices and total daily volumes for exchange traded month ahead and
day ahead for PSV, due to the poor liquidity of the Italian gas exchange.
In Italy, in addition to the OTC market, there are currently four recently created organized market places to trade
gas for delivery at PSV: PB-Gas (the balancing market that actually concerns gas traded at storage sites, not on
the hub), MGP-Gas (exchange for day-ahead trades), MI-Gas (exchange for within-day trades), P-Gas
(exchange for forward trades)72
. The balancing market PB-Gas started in December 2011 and has a good
liquidity, mostly due to trades between the TSO Snam Rete Gas and shippers for the physical balancing of the
network; on the contrary, the liquidity of P-Gas, MGP-Gas and MI-Gas has been very poor so far. The physical
exchange P-gas started in Italy in 2010, P-gas comprises three segments73
that were created to allow
participants to fulfil their obligation to sell a proportion of their gas to third parties. These translate into explicit
supply obligations and price constraints (the selling party is hence forced to sell this gas on Pgas). Since
December 2010 GME has organised and managed a natural gas spot exchange (MGP-GAS and MI-GAS),
where day ahead and within day products can be traded. However the day ahead product has a low liquidity
(0.14 TWh in 2011 and only 0.13 TWh in 2012). A futures exchange for gas in Italy, operated by GME, was
launched in September 2013.
72
GME (2011).
73 Royalties (started on 11 August 2010), Imports (started on 10 May 2010) and ex Legislative Decree 130/10 (started in May
2012 (Source: GME (2011))

56
Appendix 2: Additional methodological notes
The Pearson Correlation coefficient (r) is used to measure the strength of the association (linear relationship)
between two variables. It is obtained by dividing the covariance of the two variables by the product of their
standard deviations.
It ranges between -1 and 1 (here we use -100% and +100% as extremes): the closer to -1, the stronger the
negative linear relationship; the closer to 1, the stronger the positive linear relationship; the closer to 0, the
weaker the linear relationship.
Note that in our analysis we considered the sample Pearson correlation coefficient. Using statistical inference,
and making some assumptions, it is possible to construct the confidence interval around r that has a given
probability of containing ρ, the Pearson correlation coefficient for the population the sample is a part of, that is the
ideal set of all the trading transactions for the contract we are focusing on.
When interpreting the size of a correlation, it is common to square the correlation coefficient r. When the
correlation is squared (r2), we get the coefficient of determination, a measure of how much of the variability in one
variable (in one price series) can be "explained by" variation in the other.
Note that r measures the non-linearity and direction of a linear relationship, but not the slope of that relationship,
nor nonlinear relationships. Correlation between two variables does not imply a causal effect.
The shortcomings of the Pearson correlation coefficient are: high responsiveness to outlying points and
significance dependent on the number of observations matched, in term of dates, between the two series; that is
dependencies tend to be stronger if viewed over a wider range of values.
When looking at more than two variables, the Correlation matrix is commonly used to describe correlation among
M variables. It is a square symmetrical MxM matrix with the (ij)th element equal to the correlation coefficient rij
between the (i)th and the (j)th variable. The diagonal elements (correlations of variables with themselves) are
always equal to 1.
When considering descriptive statistical tools, other measurements for the assessment of correlation are rank
correlation coefficient, such as Spearman's rank correlation coefficient and Kendall's rank correlation coefficient.
When turning to more advanced econometric tools, following the existing literature, correlation between time
series can be assessed using co-integration tests, such as the single equation Engle-Granger test74
and the
multivariate test of Johansen75
.
74
Engle and Granger (1987).
75 Johansen (1991).

57
Appendix 3: Robustness test
We performed additional tests on correlation to check the robustness of our results.
The presence of serial correlation, that is the dependence of today’s price on yesterday's price, may produce
artificially high correlation between prices76
. As serial correlation for the individual price series should be
reasonably high (the price of today indeed is influenced by yesterday's price), we correlate the percentage
change in the prices of different hubs obtaining a measure for volatility correlation. In the existing literature
another common approach to exclude the effect of serial correlation is the first difference method that simply
consider the absolute change in prices from t to t+1.
The computation of correlation metrics referring to the daily relative change in price, rather than the price level,
confirmed the findings from assessment of price levels (Figures 46-49).
76 Doane and Spulber (1994) and Stigler and Sherwin (1985)
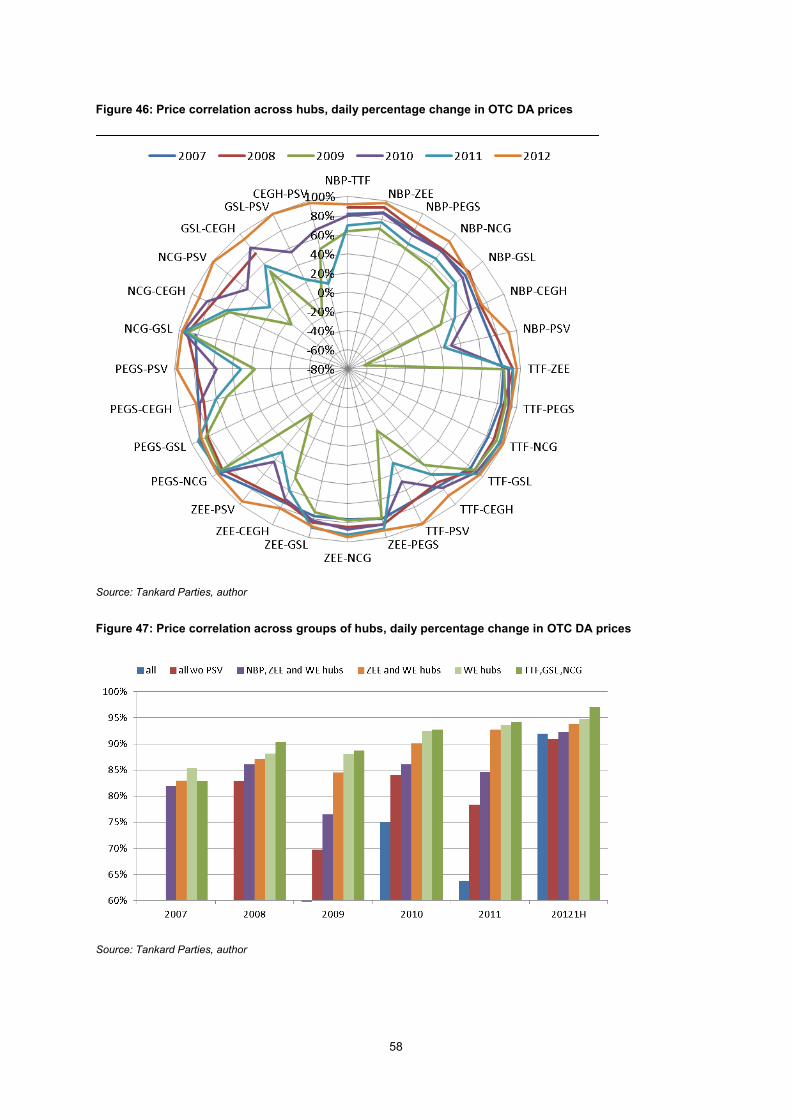
58
Figure 46: Price correlation across hubs, daily percentage change in OTC DA prices
Source: Tankard Parties, author
Figure 47: Price correlation across groups of hubs, daily percentage change in OTC DA prices
Source: Tankard Parties, author

59
Figure 48: Price correlation across hubs, daily percentage change in OTC MA prices
Source: Tankard Parties, author
Figure 49: Price correlation across groups of hubs, daily percentage change in OTC MA prices
Source: Tankard Parties, author
60
Glossary
Bcm: One billion cubic metres.
Box-plot: A box-plot is a way of summarizing a set of data measured on an interval scale. It is often used in
exploratory data analysis. It is a type of graph which is used to show the shape of the distribution, its central
value, and variability. Box plots have a main rectangular body (the box itself) and lines extending vertically from
the box (so called whiskers). The bottom and top of the box are the first and third quartiles, and the band inside
the box is the median; the ends of the whiskers represent the upper and lower adjacent values: the largest value
smaller or equal to upper quartile + 1.5 IQR (where IQR is the interquartile range, a measure of statistical
dispersion, being equal to the difference between the upper and lower quartiles, IQR = Q3 − Q1) and the smallest
value greater or equal to the lower quartile - 1.5 IQR. Any points more extreme then the upper and lower adjacent
values are represented as dots. The length of the box represents the IQR and helps indicate the degree of
dispersion (volatility) in the data: the more stretched the box is, the more variable prices are within the year. The
length of the whiskers is another measure of dispersion; while dots identify outliers, i.e. isolated price peaks or
troughs that do not fit the general trend.
Broker: a party that intermediates and facilitates bilateral contracts to be concluded between a buyer and a
seller.
CEGH: Central Europe Gas Hub
Co-integration analysis: econometric technique developed for the analysis of time series.
Contract settlement: resolution of a contract at its expiry. A contract may be settled through physical delivery,
by cash settlement or by settling the payment and “giving up the volume” to an exchange, that is by tendering the
quantity of gas on an exchange platform for whatever price it can be sold for.
Correlation: (see Pearson Product-Moment Correlation coefficient)
Day ahead (DA) contract/product: contract for the purchase or sale of gas to be delivered the day after the
trading date
Delivery/net physical delivery: the moment when a player makes a nomination to the system operator, who in
turn uses this input to compute the total volume to be injected/withdrawn into the grid. Nomination is made before
gas has to be injected/withdrawn in the grid. In the UK nomination has to be made for gas to be
injected/withdrawn into the grid the following day (day d). A player nomination is computed by netting off all the
traded volumes relating to the day ahead.
Exchange trade: anonymous and regulated trade whereby the buyer and the seller of gas have the exchange
operator as a central counterparty operating as a clearing house.
Financial trade: trade which is settled without the actual delivery of gas but rather through a cash payment,
normally of the difference between the agreed price and the outturn spot price.
Forward gas contract: contract for the purchase or sale of gas to be delivered on a future agreed date (delivery
date).
Gross traded volumes (traded volumes): the total gas amounts that are traded on each hub which are usually
a multiple of the physical quantity that is actually delivered on the grid. Traded volumes can exceed consumed
physical volumes in a commodity market as quantities can be bought and sold many times prior to delivery.
GSL: Gaspool, gas hub based in Germany.
H-gas: High-calorific gas (also called H-gas or high gas) is the highest quality natural gas due to its high methane
content (between 87% and 99%).
HHV: The higher heating value (HHV: also known as the gross calorific value or gross energy) of a fuel is defined
as the amount of heat released by a specified quantity (initially at 25 °C) once it is combusted and the products
have returned to a temperature of 25 °C. It thus includes the latent heat of condensation of water in the
combustion products.
61
Hub (gas hub): a virtual or physical location within the grid where the exchange of gas volumes takes place. In
fact a gas hub is a market for gas, where the commodity is traded on a standardized basis between market
participants.In this paper each hub represents a different price area.
Interconnector (IUK): the bi-directional pipeline allowing the flow of gas from Britain to Belgium and vice versa.
LEBA volume report: regular monthly volume report covering the main gas, power, coal and emission markets,
published by LEBA. LEBA volume data are available from January 2011.
LEBA: the London Energy Brokers’ Association, is the industry association representing the FSA regulated
wholesale market brokers in the over the counter (OTC) and the exchange traded UK and liberalised European
energy markets. The major products that they deal in include crude oil and refined petroleum products, gas,
electricity and emissions.
L-gas: Low-calorific gas (L-gas or low gas) is natural gas with a lower methane content of between 80% and
87%.
Month ahead (MA) or front month contract/product: contract for the purchase or sale of gas to be delivered in
the month after the trading date.
MWh: A unit of energy equivalent to a Megawatt of power for the duration of one hour.
NBP: National Balancing Point, gas hub based in Great Britain.
NCG: Net Connect Germany, gas hub based in Germany.
OTC (over the counter) trades: bilateral non-regulated trade however involving standardized physical and
financial deals. Such trades are based on standard agreements defining the point of delivery for gas along with
other technical and legal terms. They can be for standard volumes of clip sizes of gas and multiples thereof.
Pearson Product-Moment Correlation coefficient (Pearson coefficient, r): statistical metric which measures
the strength of the linear relationship (linear correlation) between two data series. The correlation coefficient
always takes a value between -1 and 1, with 1 or -1 indicating perfect correlation (all points would lie along a
straight line in this case). A positive correlation indicates a positive association between the variables (increasing
values in one variable correspond to increasing values in the other variable), while a negative correlation
indicates a negative association between the variables (increasing values in one variable correspond to
decreasing values in the other variable). A correlation value close to 0 indicates no association between the
variables.
PEG: Points d’Echange de Gaz including Peg Nord (Peg North), Peg Sud (Peg South) and Peg TIGF hubs,
based in France.
Physical trade: trade which is settled at expiry by the actual delivery of gas.
Price correlation: when prices move closely in parallel over time.
Price delinkage: period of low correlation.
PSV: Punto di Scambio Virtuale, the Italian gas hub.
Relative law of one price: in a competitive market the price of a homogeneous good should tend towards
uniformity, allowances being made for transportation and other transaction costs.
Scatter plot: useful summary of a set of bivariate data (two variables), usually drawn before working out a linear
correlation coefficient or fitting a regression line. It is a mathematical diagram using Cartesian coordinates plotting
one variable against the other. It gives a good visual picture of the relationship between the two variables, and
aids the interpretation of the correlation coefficient or regression model. Each unit contributes one point to the
scatterplot, on which points are plotted but not joined. The resulting pattern indicates the type and strength of the
relationship between the two variables.

62
Tankard Parties: Tankard is an industry initiative created and developed by ICAP Energy Limited (ICAP), Marex
Spectron Group (Marex Spectron) and Tullett Prebon Group Limited (Tullett Prebon).
TTF: Title Transfer Facility, gas hub based in the Netherlands,
ZEE: Zeebrugge, gas hub based in Belgium.
63
Bibliography
Alterman (2012): Alerman, Sofya, Natural Gas Price Volatility in the UK and North America, NG 60, OIES,
February 2012. http://www.oxfordenergy.org/2012/02/natural-gas-price-volatility-in-the-uk-and-north-america/
Asche et al. (2013): Asche, F., Misund, B., Sikveland, M. (2013) ‘The relationship between spot and contract gas
prices in Europe’, Energy Economics, 38, pp. 212–217.
Asche, F., Osmundsen, P., Tveteras, R. (2000). ‘Market integration for natural gas in Europe?’ International
Journal of Global Energy Issues 16, pp. 300–312.
Asche, F., Osmundsen, P., Tveteras, R. (2002). ‘European market integration for gas? Volume flexibility and
political risk’ Energy Economics, 24, pp. 249– 265.
CEER (2011): CEER Vision for a European Gas Target Model. Conclusions Paper, Ref: C11-GWG-82-03, 1
December 2011. Available at http://www.energy-
regulators.eu/portal/page/portal/EER_HOME/EER_PUBLICATIONS/CEER_PAPERS/Gas/Tab/C11-GWG-82-
03_GTM%20vision_Final.pdf
CRE (2012) The functioning of the electricity, CO2 and natural gas wholesale markets in 2011-2012, November
2012 available at: http://www.cre.fr/en/documents/publications/thematic-reports/%28annee%29/2012
Doane and Spulber (1994) : Doane, J. M. and Spulber D. F. (1994). ‘Open access and the evolution of the U.S.
spot market for natural gas’ Journal of Law and Economics, Vol. 37, No. 2, pp. 477-517.
Engle and Granger (1987): Engle, R.F., and Granger C.W.J., (1987). ‘Co-integration and error correction:
representation, estimation and testing’ Econometrica, 55, pp. 251-276.
GME (2011): GME Annual Report 2011
http://www.mercatoelettrico.org/en/MenuBiblioteca/documenti/20120711RelazioneAnnuale2011_en.pdf
Growitsch et al. (2010): Growitsch, C. , Stronzik, M., and Nepal, R. (2010). ‘Price convergence and information
efficiency in German natural gas markets’, WIK Discussion Paper No. 333, February.
Harmsen and Jepma (2011): Harmsen, R. and Jepma C. ‘North West European gas market: integrated
already’, European Energy Review, 27 January 2011
Heather (2010): Heather, Patrick, ‘The Evolution and Functioning of the Traded Gas Market in Britain’, , NG 44,
OIES, 2010. http://www.oxfordenergy.org/pdfs/NG44.pdf
Heather 2012: Continental European Gas Hubs: are they fit for purpose?, Patrick Heather, NG 63, OIES, June
2012. http://www.oxfordenergy.org/2012/06/continental-european-gas-hubs-are-they-fit-for-purpose/
Henderson and Heather (2012): Henderson,J and Heather,P, Oxford Energy Comment “Lessons from the
February 2012 European gas “crisis”, April 2012. http://www.oxfordenergy.org/wpcms/wp-
content/uploads/2012/04/Lessons-from-the-February-2012-gas-crisis.pdf.
Jackson (2011): Jackson S.L., “Research Methods and Statistics: A Critical Thinking Approach”, 4th
Edition
(2011), Wadsworth Publishing Company
Johansen (1991): Johansen, S. ‘Estimation and hypothesis testing of cointegration vectors in Gaussian
autoregressive models’ Econometrica, 59, 1551-1580.
Kuper and Mulder (2013): Kuper, G., and Mulder, M. ‘Cross-border infrastructure constraints, regulatory
measures and economic integration of the Dutch – German gas market’, Research Institute SOM report, Faculty
of Economics & Business, University of Groningen (preliminary draft here:
http://europeangashub.com/custom/domain_1/extra_files/attach_179.pdf)
Neumann and Cullmann (2012): Neumann, A., and Cullmann, A, ‘What's the story with natural gas markets in
Europe? Empirical evidence from spot trade data’, European Energy Market (EEM), 2012 9th International
Conference on the, Date of Conference: 10-12 May 2012.

64
Neumann et al. (2006): Neumann, A., Siliverstovs, B., and Hirschhausen, C.V, ‘Convergence of European spot
market prices for natural gas? A real-time analysis of market integration using the Kalman filter’, Applied
Economics Letters 13(11), 727-732.
Siliverstovsa, B., L’He´garetb, G., Neumann, A., Von Hirschhausen, C. (2005) ‘International market integration for
natural gas? A cointegration analysis of prices in Europe, North America and Japan’ Energy Economics, 27, pp.
603– 615.
Stern and Rogers (2011): Stern, Jonathan and Rogers, Howard, ‘The Transition to Hub-Based Gas Pricing in
Continental Europe’, NG 49, OIES, 2011. http://www.oxfordenergy.org/wpcms/wp-
content/uploads/2011/03/NG49.pdf
Stigler and Sherwin (1985): Stigler, G. J., and Sherwin, R. A, ‘The Extent of the Market’ Journal of Law and
Economics 28, pp. 555-585.


