

EVALUATING RENEWABLE ENERGY OPTIONS
FOR SMALL ISLANDS USING EMERGY METHODOLOGY:
A CASE STUDY OF COCONUT BIODIESEL IN THE FIJI ISLANDS
BY
KRISHNA RAGHAVAN
A THESIS PRESENTED TO
UNIVERSITY OF PRINCE EDWARD ISLAND
IN PARTIAL FULFULLMENT OF THE REQUIREMENTS FOR
DEGREE OF MASTER OF ARTS IN ISLAND STUDIES
2014

University of Prince Edward Island
Faculty of Arts
Charlottetown
CERTIFICATION OF THESIS WORK
We, the undersigned, certify that Mr. Krishna Raghavan, candidate for the degree of
Master of Arts (Island Studies) at the University of Prince Edward Island, Canada, has presented
a thesis, in partial fulfillment of the degree requirements, with the following title: “Evaluating
Renewable Energy Options for Small Islands Using Emergy Methodology: A Case Study of
Coconut Biodiesel in the Fiji Islands”, that the thesis is acceptable in form and content, and that
a satisfactory knowledge of the field covered by the thesis was demonstrated by the candidate
through an oral examination held on April 22, 2014.
Examiners:
Supervisor
___________________________________
Dr. Palanisamy Nagarajan
Committee member
___________________________________
Dr. Irene Novaczek
External examiner
___________________________________
Dr. Gilles Vaitilingom
Date: April 22, 2014
PERMISSION TO USE GRADUATE THESIS
Title of Thesis:“Evaluating Renewable Energy Options for Small Islands Using Emergy
Methodology: A Case Study of Coconut Biodiesel in the Fiji Islands”
Name of Author: Mr. Krishna Raghavan
Faculty: Arts
Department/Discipline: Island Studies
Degree: Master of Arts
Year: 2014
Name of Supervisor(s): Dr. Palanisamy Nagarajan
Members of Supervisory Committee: Dr. Irene Novaczek
In presenting this thesis in partial fulfilment of the requirements for a graduate degree from the
University of Prince Edward Island, the author has agreed that the Robertson Library, University
of Prince Edward Island, may make this thesis freely available for inspection and gives
permission to add an electronic version of the thesis to the Digital Repository at the University
of Prince Edward Island. Moreover the author further agrees that permission for extensive
copying of this thesis for scholarly purposes may be granted by the professor or professors who
supervised the author’s thesis work, or, in their absence, by the Chair of the Department or the
Dean of the Faculty in which the author’s thesis work was done. It is understood that any
copying or publication or use of this thesis or parts thereof for financial gain shall not be
allowed without the author’s written permission. It is also understood that due recognition
shall be given to the author and to the University of Prince Edward Island in any scholarly use
which may be made of any material in the author’s thesis.
Signature: ___________________________
Address: Island Studies, University of Prince Edward Island, 550 University Drive,
Charlottetown, PE Canada C1A 4P3
Date: ____April 25, 2014 __________

Dedication
In loving memory of my parents
Lakshmi Krishnaswamy and
Nadathoor Raghavachari Krishnaswamy
who gave so much to educate us

iv
ABSTRACT
The Pacific Island Countries including the Fiji Islands are heavily dependent on imported petroleum fuels
for their energy needs. This is a major cause of environmental vulnerability as well as economic
vulnerability due to high and volatile crude oil prices. A combination of Demand Side Management
(DSM) to reduce energy consumption and optimize usage, and Renewable Energy Technologies (RET) to
substitute fossil fuels can reduce their vulnerability. DSM consists of Smart Grids, Energy Efficiency and
Storage, while RETs substitute fossil fuels by harnessing solar, wind, small hydro, biomass, geothermal
and ocean energies. Comparative costs of electricity from RETs show that most of them are cheaper
than the typical price of electricity in Pacific island countries.
Nearly half of Fiji’s electricity is generated using petroleum fuels that can be substituted by biodiesel
produced from locally grown coconuts. To evaluate the sustainability of coconut biodiesel, two different
Environmental Accounting methods have been used: i) Emergy Analysis, and ii) Embodied Energy
Analysis. Emergy Analysis is a holistic methodology that integrates all major inputs from the human
economy and those coming ‘free’ from the environment, to evaluate complex systems. Emergy
Performance Indicators for coconut biodiesel are: i) Emergy Yield Ratio is 1.32 indicating a low ability to
exploit local resources efficiently; ii) Environmental Loading Ratio is 8.57 implying that biodiesel
production causes significant environmental or ecosystem stress; and iii) Emergy Index of Sustainability
is 0.15 indicating a low contribution to the economy per unit of environmental loading and a very high
degree of environmental stress per unit of Emergy yield. Embodied Energy Analysis is a complimentary
methodology that accounts for only the commercial energy (in kgs oil equivalent) required directly or
indirectly to provide all the inputs (goods and services) for the entire biodiesel production process.
Embodied Energy Performance Indicators are: i) Energy Return on Energy Invested is 2.47 which means
that it is not worth the effort in energetic terms; and ii) Carbon dioxide Emissions during the production
of coconut biodiesel is 1.38 kg CO2 per kg biodiesel showing that biodiesel is not climate neutral.
This thesis adds to the growing body of knowledge that uses Emergy Analysis to evaluate sustainability
of biofuels and other renewable energy options in a holistic manner. This is the first time in reported
literature that Emergy Analysis has been used to determine the sustainability of coconut biodiesel. The
Emergy and Embodied Energy performance indicators clearly show that coconut biodiesel is not a
sustainable alternate source of energy for the Fiji Islands.

v
ACKNOWLEDGEMENTS
Many thanks to Dr. and Mrs. Meincke for the Dr Peter and Mrs. Donna Meincke Scholarship
that supported the field work for this research in the Fiji Islands. Thanks also to the Faculty of
Arts, the MAIS program and the Graduate Students Association for providing financial
assistance to attend international conferences where the results of this research were
presented and discussed.
I am grateful to my thesis supervisor Dr. Palanisamy Nagarajan, Emeritus Professor of
Economics and Island Studies Teaching Fellow, for introducing us to the concept of Emergy, for
encouraging me to undertake research in this fascinating subject and for his stimulating ideas.
I wish to thank Dr. Jim Randall, Coordinator of the MAIS program, for his quiet support and
encouragement throughout the writing of this thesis.
Dr. Godfrey Baldaccchino, Canada Research Chair in Island Studies, was instrumental in my
joining the MAIS program and a source of inspiration to all students of island studies.
It has always been interesting and enjoyable to exchange ideas with Dr. Irene Novaczek,
Director of the Institute for Island Studies.
Discussions with the students of the MAIS program, both in and out of the classroom, was
highly educative and good fun – thanks guys.
Many of my family and friends gave me inspiration and encouragement for this work. They are
too numerous to list here but I would specially like to thank Jalaja, Jayshree, Nayanthara,
Satyapriya, Priyanka, Brij Bala, Ranjit, Robert Hellier, Jan de Jongh and Devender Rana.

vi
TABLE OF CONTENTS
ABSTRACT IV
LIST OF TABLES VIII
LIST OF FIGURES IX
1 INTRODUCTION 1
1.1 STATEMENT OF THE PROBLEM 1
1.2 OBJECTIVES 1
1.3 JUSTIFICATION OF THE PROBLEM STATEMENT 1
1.3.1 Energy is essential for development 2
1.3.2 Growth in Energy demand 4
1.3.3 Role of petroleum fuels 9
1.3.4 Vulnerability of small island states 13
1.3.5 What are the alternatives to petroleum fuels? 18
1.3.6 Which alternate energy source is the best? 19
1.4 ENERGY SUSTAINABILITY FRAMEWORK 22
1.4.1 Demand Side Management 22
1.4.2 Renewable Energy Technologies for Islands 23
1.5 INTRODUCTION TO EMERGY AND EMBODIED ENERGY 31
1.6 LITREATURE REVIEW 33
2 EMERGY ANALYSIS METHODOLOGY 42
2.1 COCONUT BIODIESEL AS AN ALTERNATIVE FUEL FOR POWER GENERATION IN FIJI 42
2.1.1 Rationale 42
2.1.2 Site Description: Fiji Islands 43
2.1.3 Power generation in Fiji 45
2.1.4 Coconut production in Fiji 46
2.2 EMERGY ANALYSIS 47
2.2.1 Emergy System Diagram 48
2.2.2 Emergy Evaluation Table 50
2.2.3 Performance Indicators 51
2.3 EMBODIED ENERGY ANALYSIS 55

vii
3 RESULTS 57
3.1 EMERGY ANALYSIS 57
3.1.1 Data for Emergy Analysis 57
3.1.2 Emergy System Diagram 59
3.1.3 Emergy Evaluation Table 61
3.1.4 Emergy Performance Indicators 64
3.2 EMBODIED ENERGY ANALYSIS 65
3.2.1 Embodied Energy Performance Indicators 67
3.3 SUMMARY OF RESULTS 68
4 DISCUSSION AND CONCLUSIONS 69
4.1 EMERGY ANALYSIS 69
4.1.1 Transformity 69
4.1.2 Percent Renewable Energy 73
4.1.3 Emergy Yield Ratio 73
4.1.4 Environmental Loading Ratio 74
4.1.5 Emergy Index of Sustainability 74
4.2 EMBODIED ENERGY ANALYSIS 75
4.2.1 Embodied Energy of Biodiesel and its Inputs 75
4.2.2 Energy Return on Energy Invested 76
4.2.3 Carbon Dioxide Emissions 77
4.3 COMPARATIVE COSTS 77
4.4 SUPPORTIVE ENERGY POLICY ON SMALL ISLANDS 80
4.4.1 Overarching Considerations 80
4.4.2 Local Benefits 82
4.5 CONCLUSIONS AND RECOMMENDATIONS FOR FUTURE WORK 85
4.5.1 Conclusions 85
4.5.2 Recommendations for Future Work 86
5 REFERENCES 89
6 APPENDIX 103
viii
LIST OF TABLES
Table 1 Fiji’s Final Energy Consumption in 2006 .................................................................... 6
Table 2 Fiji’s Primary Energy Supply (KTOE) in 2006 .............................................................. 7
Table 3 Relative Value of Oil imports: Pacific Islands and Low Income Asia ...................... 12
Table 4 Categorization of Countries based on Oil-Price Vulnerability Index ....................... 18
Table 5 Life cycle EROEI for Fossil Fuels and Renewable Energy ......................................... 20
Table 6 Applications of Solar Thermal and Photovoltaics .................................................... 24
Table 7 Classification of Wind Turbine Generators .............................................................. 25
Table 8 Classification of Hydropower schemes .................................................................... 26
Table 9 Bioenergy Conversion Technologies and Uses ........................................................ 27
Table 10 Ocean Energy Conversion – Types and Techniques ................................................ 28
Table 11 Renewable Fuels used in Transport sector (Raghavan, 2003) ................................. 29
Table 12 Seawater Desalination Processes (Raghavan, 2003) ............................................... 31
Table 13 Coconut Production in Pacific Island Countries in 2007 (Krishna et al., 2009) ....... 43
Table 14 Power Generation in the Fiji Islands (Fiji Electricity Authority [FEA], 2011) ........... 45
Table 15 Emergy Evaluation Table for SPV Wafer Production Sub-system ........................... 51
Table 16 Emergy Performance Indicators for Solar Thermal and Photo Voltaic ................... 54
Table 17 Transformity of Solar and Fossil Fuel technologies for Heat and Electricity ......... 55
Table 18 Emergy Analysis for Biodiesel Production from Coconuts ...................................... 61
Table 19 Summary of Emergy Analysis for Coconut Biodiesel ............................................... 64
Table 20 Performance Indicators for Coconut Biodiesel ........................................................ 64
Table 21 Embodied Energy Analysis for Biodiesel Production from Coconuts ...................... 65
Table 22 Transformity Increase at each Stage of Biodiesel Production ................................. 69
Table 23 Performance Indicators of Biofuels and Fossil Fuels ............................................... 71
Table 24 Typical Yields of Oilseed Crops ................................................................................ 72
Table 25 Embodied Energy of Inputs for Biodiesel Production .............................................. 75
Table 26 Capital Costs and Levelised Cost of Electricity for Renewable Power ..................... 78
Table 27 Technologies Suitable for Local Manufacture in Pacific Island Countries .............. 83

ix
Table 28 Production of Mature Coconuts ............................................................................ 103
Table 29 Production of Copra from Mature Coconuts ........................................................ 104
Table 30 Production of Coconut Oil (CNO) from Copra ....................................................... 105
Table 31 Production of Biodiesel from Coconut Oil ............................................................. 106
Table 32 Net Profits in Production of Biodiesel ................................................................... 107
Table 33 Total Value Added for Intermediate Products ....................................................... 108
LIST OF FIGURES
Figure 1 Primary Energy Mix in the Pacific, 2006 .................................................................... 5
Figure 2 Primary Energy Supply in the Pacific, 1990–2006 ..................................................... 5
Figure 3 Fiji’s Final Energy Consumption by Type, 1992–2006 ............................................... 7
Figure 4 Fiji’s Primary Energy Supply by Source in 2006 ......................................................... 8
Figure 5 Fiji’s Primary Energy Supply by Source, 1992 – 2006 ................................................ 8
Figure 6 Growth in GDP, TPES, and TFEC, 1992–2006 ............................................................. 9
Figure 7 Historical Prices for Crude Petroleum Oil, 2001-2013 ............................................. 11
Figure 8 Gross Electricity Generation by Source for Main Grids in Pacific Islands in 2010 ... 42
Figure 9 Power Generation by the Fiji Electricity Authority, 2002 – 2011 ............................ 45
Figure 10 Copra and Coconut oil production in the Fiji Islands ............................................... 46
Figure 11 Emergy Systems Symbols ......................................................................................... 48
Figure 12 System Diagram for Electricity Production from SPV modules ............................... 49
Figure 13 System Diagram for Production of PV silicon wafers .............................................. 50
Figure 14 Systems Diagram with Flows used in Performance Indicator Ratios ...................... 52
Figure 15 Production Chain for Coconut Biodiesel .................................................................. 58
Figure 16 Emergy System Diagram for Production of Coconut Biodiesel ............................... 59
Figure 17 Transformity Increase at each Stage of Biodiesel Production ................................. 70
Figure 18 Typical Capital Cost Ranges for Renewable Energy Technologies ........................... 79
x
Figure 19 Price of Renewable Power (USD/kWh) Compared to Typical Prices of Electricity in
Electricity in Pacific Islands and OECD countries ..................................................... 79
Figure 20 Cost Break-down for Production of Mature Coconuts .......................................... 103
Figure 21 Cost Break-down for Production of Copra............................................................. 104
Figure 22 Cost Break-down for Production of Coconut Oil ................................................... 105
Figure 23 Cost Break-down for Production of Biodiesel from Coconut Oil ........................... 106
Figure 24 Profits in the Stages of Production of Biodiesel .................................................... 107
Figure 25 Percent Profits in Biodiesel Value Chain ................................................................ 107
Figure 26 Break-down of Value Addition in Production of Biodiesel .................................... 108
Figure 27 Total Value Addition in Production of Biodiesel .................................................... 108

1
1 INTRODUCTION
1.1 STATEMENT OF THE PROBLEM
The problem is stated according to the following logical progression:
1. Energy is essential for development.
2. Energy demand is growing.
3. Most of the energy used in small island developing states (SIDS) comes from imported
petroleum fuels.
4. Most of the SIDS are very vulnerable due to dependency on imported petroleum fuels.
5. What are the alternatives to petroleum fuels?
6. Which is the best alternate energy source?
1.2 OBJECTIVES
The main objective of this study is to identify a methodology for evaluating renewable energy
options for small islands in a holistic manner.
The second objective is to apply the methodology to assess the sustainability of biodiesel
produced from coconuts in the Fiji Islands.
Social and other parameters, that are essential for the success of renewable energy
interventions on small islands, will also be discussed in this thesis.
1.3 JUSTIFICATION OF THE PROBLEM STATEMENT
The focus of this thesis is a case study on the Fiji islands, one of the Pacific island countries.
Therefore, the problem statement is now explained using information and data specific for the
Pacific island countries and for the Fiji Islands.

2
1.3.1 Energy is essential for development
Worldwide, around 1.6 billion people do not have access to electricity, including over a billion
people in the Asia-Pacific region (UNDP, 2007). Energy services1 play a crucial role in the
development process, particularly for the economic, environmental and social well-being of the
poor. They are essential for providing social services such as health and primary education, and
an improved quality of life. Energy services have a multiplier effect on safe drinking water,
sanitation, health, education, transport and telecommunications; they also create and increase
the productivity of income-generating activities in agriculture, industry, and tertiary sectors.
Moreover, they have positive impacts on gender inequities and the environment (Modi et al.,
2005; UNDP, 2007).
The provision of energy is an essential prerequisite for poverty/hardship reduction. Increased
access to energy services is particularly necessary in the Pacific Island Countries (PICs) where
poverty/hardship is closely linked to the limited access to basic services, opportunities and
adequate resources (UNDP, 2007).
Millennium Development Goals
The Millennium Development Goals (MDGs) are a set of eight time-bound and measurable
goals and targets for combating poverty, hunger, illitreacy, gender inequality, disease, and
environmental degradation. At the United Nations Millennium Summit in September 2000,
world leaders pledged to achieve the Millennium Development Goals by 2015, including the
overarching goal of cutting poverty in half.
The eight MDGs are (Modi et al., 2005; UNDP, 2005; United Nations, 2013; UNDP, 2013):
1. Eradicate extreme poverty and hunger
2. Achieve universal primary education
1 Energy services refer to services that are provided by fuels, electricity, and mechanical power, including lighting,
heating for cooking and space heating, water pumping, grinding, and power for transport.

3
3. Promote gender equality and empower women
4. Reduce child mortality
5. Improve maternal health
6. Combat HIV/AIDS, malaria, and other diseases
7. Ensure environmental sustainability
8. Develop a global partnership for development
In 2002 the United Nations Secretary-General commissioned the Millennium Project to develop
a concrete action plan for the world to achieve the Millennium Development Goals and to
reverse the grinding poverty, hunger and disease affecting billions of people. The Project's work
was carried out by ten thematic task forces comprised of more than 250 experts from around
the world headed by the renowned American economist Professor Jeffrey Sachs, who
presented their final recommendations in 2005 (http://www.unmillenniumproject.org/).
Role of Energy in achieving the MDGs
At the World Summit for Sustainable Development in Johannesburg in 2002, it was recognized
that affordable and sustainable modern energy services (mainly electricity and clean cooking
fuels) are a necessity for countries to meet their Millennium Development Goals, and are
essential for the economic, environmental and social well-being of the poor (UNDP, 2007).
Even though there is no MDG specifically on energy, UNDP proposes in ‘Energizing the
Millennium Development Goals - A Guide to Energy’s Role in Reducing Poverty’ (UNDP, 2005)
that access to energy services should be treated as an integrated part of MDG strategies since it
is an important instrument in helping promote economic growth, social equality, and
environmental sustainability. This guide, designed to help development practitioners, gives an
overview of the most relevant issues concerning the nexus between development and energy,
and provides suggestions and examples on how to address energy as a part of national efforts
to reach the MDGs.

4
Modi et al. (2005) specifically address the role of energy services in meeting the MDGs,
especially in poor countries that are lagging behind in their efforts to achieve these
development goals. By analysing all the linkages between the MDGs and energy, Modi et al.
argue that much greater quality and quantity of energy services are required to meet the MDGs
and that energy services are essential for both social and economic development. To scale up
energy services, different approaches are proposed for rural and urban areas, and the impor-
tance of associating women with the provision of modern energy services is highlighted. Finally,
they provide ten key priority energy interventions for national governments.
The report of the UN Millennium Project underscores the strong links between energy services
and achieving the MDG outcomes. All ten task forces of the Millennium Project found that
energy services are essential inputs. The report of the Millennium Project highlights the
linkages between energy and all the MDGs and recommends that much greater quality and
quantity of energy services have to be provided to meet the MDGs (Modi et al., 2005;
http://www.unmillenniumproject.org/).
1.3.2 Growth in Energy demand
Energy demand has been growing steadily in the Pacific island countries including Fiji. It is met
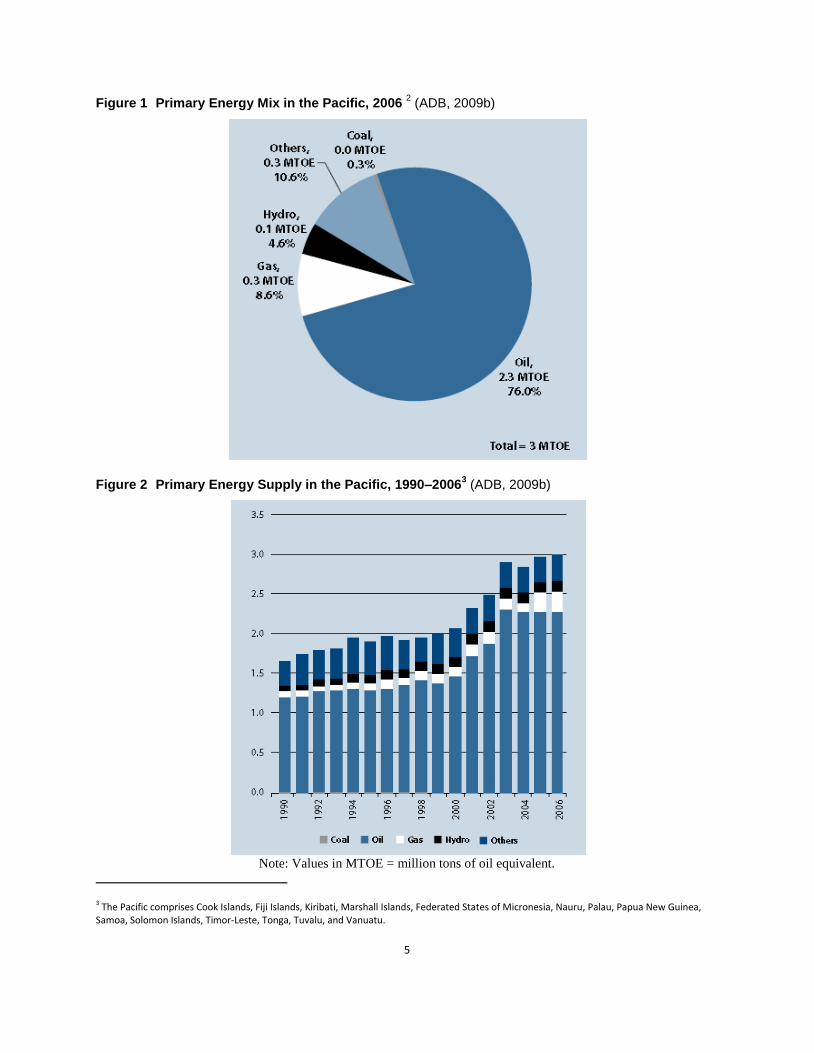
through procurement of oil (76.0% of the energy mix in 2006) and other energy, mainly biomass
(10.6%), gas (8.6%), hydro (4.6%) and coal (0.3%) (Figure 1)(Asian Development Bank [ADB],
2009b).
Pacific Island Countries
During the period 1990 to 2006, the Total Primary Energy Supply (TPES) in the Pacific grew at
3.8% per annum, increasing from 1.7 MTOE2 in 1990 to 3.0 MTOE in 2006 (Figure 2). Natural
gas, which is used only in Papua New Guinea, had an annual growth rate of 8.3%, while oil was
second with a growth rate of 4.1% per annum (ADB, 2009b).
2 MTOE = million tons of oil equivalent.
5
Figure 1 Primary Energy Mix in the Pacific, 2006 2 (ADB, 2009b)
Figure 2 Primary Energy Supply in the Pacific, 1990–20063 (ADB, 2009b)
Note: Values in MTOE = million tons of oil equivalent.
3 The Pacific comprises Cook Islands, Fiji Islands, Kiribati, Marshall Islands, Federated States of Micronesia, Nauru, Palau, Papua New Guinea, Samoa, Solomon Islands, Timor-Leste, Tonga, Tuvalu, and Vanuatu.

6
Fiji Islands
Fiji’s total final energy consumption (TFEC) grew at an average rate of 6.0% per annum from
238 thousand tons of oil equivalent (KTOE) in 1992 to 537 KTOE in 2006, with a maximum of
650 KTOE in 2004. During the earlier half of this period 1992 to 2000, TFEC grew somewhat
slowly at 2.5% per annum, but the average annual growth rate of TFEC increased more than
four times to 10.9% during the second half, 2000 to 2006, even though economic growth was
only 2.0% per annum during the latter period (Figures 3 and 6) (ADB, 2009b).
The dominant types of energy consumed are oil (85% of the total in 2006) and electricity (12%),
followed by coal and biomass (Table 1). From 1992 to 2006, the consumption of oil grew at an
average 6.7% per annum, while electricity grew at 4.9% per annum (ADB, 2009b).
Table 1 Fiji’s Final Energy Consumption in 2006 4 (ADB, 2009b)
ITEM AMOUNT (KTOE) % OF TOTAL
Industry 186 35%
Transport 247 46%
Other Sectors 104 19%
TOTAL FEC 537 100%
Coal 8 1%
Oil 457 85%
Gas 0 0%
Electricity 63 12%
Others 8 1%
Fiji’s total primary energy supply (TPES) in 2006 was dominated by oil (65.0% of the total) and
biomass (26.3% of total) (Table 2, Figure 4). During the period 1992 to 2006, Fiji’s TPES grew at
2.5% per annum. Oil’s share in TPES increased from 40.2% in 1992 to 65.0% in 2006 at an
4 KTOE = Thousand Tons of Oil Equivalent; FEC = Final Energy Consumption.

7
average annual growth rate of 6.1%, and all the oil is imported. During the same period,
biomass decreased by 2.3% per annum to 26.3% in 2006, and hydropower increased from 6.1%
in 1992 to 7.6% in 2006 (Figures 5 and 6) (ADB, 2009b).
Figure 3 Fiji’s Final Energy Consumption by Type, 1992–2006 4 (ADB, 2009b)
Table 2 Fiji’s Primary Energy Supply (KTOE)5 in 2006 (ADB, 2009b)
SOURCE AMOUNT
(KTOE) % of Total
Coal 8 1.1%
Oil 503 65.0%
Hydro 0 7.6%
Gas 59 0%
Others 203 26.3%
TOTAL PES 774 100%
5 KTOE = thousand tons of oil equivalent; PES = primary energy supply.

8
Figure 4 Fiji’s Primary Energy Supply by Source in 2006 6 (ADB, 2009b)
Figure 5 Fiji’s Primary Energy Supply by Source, 1992 – 2006 (ADB, 2009b)
6 TPES = total primary energy supply.

9
Indices of growth of TFEC, TPES and GDP from 1992 to 2006 are compared in Figure 6. During
this period, the GDP of the Fiji Islands’ economy grew steadily at an average annual rate of 2.6%
while the population grew at an average annual rate of 0.9%, resulting in a 27% increase in per
capita income ($2,296 in 2006 at constant 2000 prices) (ADB, 2009b).
Figure 6 Growth in GDP, TPES, and TFEC, 1992–2006 7 (ADB, 2009b)
1.3.3 Role of petroleum fuels
At present, most Small Island Developing States (SIDs) are highly dependent on imported
petroleum products such as diesel, gasoline, propane and kerosene for their energy needs
(United Nations General Assembly, 1994; Alliance of Small Island States, 2005; United Nations
Development Program, 2012). The vital role of oil in the economic development and
macroeconomic stability of Pacific Island Countries (PICs) is highlighted by the Asian
Development Bank in ‘Taking Control of Oil - Managing Dependence on Petroleum Fuels in the
7 GDP = gross domestic product; TFEC = total final energy consumption; TPES = total primary energy supply.

10
Pacific’ (ADB, 2009a). This study finds that PICs are extraordinarily dependent on oil,
particularly diesel, which makes them highly vulnerable to rising oil prices. The main findings
are that the key to energy security and reduced vulnerability is to diversify energy supply,
demand-side management, increase the efficiency of existing energy supplies and develop new
fuel and electricity sources that are renewable or use cheaper fossil fuels.
Accurate and up-to-date data on fuel imports and usage by sector for the Pacific islands region
are difficult to obtain (ADB, 2009a). Petroleum is responsible for more than 80 per cent of
energy generation in the Pacific. Liquid petroleum fuels, particularly diesel, kerosene and
gasoline are a source of energy, especially for power generation (25% of oil use) and
transportation (75% of oil use) (Pacific Islands Forum Secretariat, 2011).
The wide fluctuations in petroleum fuel prices can be seen in Figure 7. A steady upward
movement increased average crude oil prices from below 20 US$/barrel in January 2002 to over
130 US$/barrel in June-July 2008 (World Bank, 2013). Such high oil prices are a supply shock
that make sound macroeconomic policy management difficult by increasing inflation, reducing
growth and weakening balance of payments. Compared to 39 other developing countries, all
seven Pacific island countries including Fiji were among the 10 most vulnerable to international
oil price rises (ADB, 2009a).
Pacific Island Countries are separated from each other and from the rest of the world by vast
distances, and this makes transport very important for staying connected. The impacts of
volatile oil prices include (ADB, 2009a):
Decrease in the usage of land, sea and air transport;
Reductions in economic opportunities, output by businesses and income for households
due to less and more expensive transport;
Reduced disposable income due to the increase in the proportion of fuel costs.

11
Figure 7 Historical Prices for Crude Petroleum Oil, 2001-2013 (World Bank, 2013)
An escalating demand for oil is forecast in the Pacific Island Countries based on the prevailing
structure of energy consumption, and this is no longer sustainable as the era of cheap oil has
apparently come to an end. The Pacific Island Countries have to move away from the current
dependence on oil by harnessing alternate locally available energy sources so as to avoid the
adverse effects of volatile world oil prices that inhibit prospects for sustained economic growth
and development in the Pacific region (ADB, 2009a).
Value of oil imports of 13 Pacific Island Countries and 7 Low income Asian countries for 5 years
(2005-2009) are given as percentages of the GDP, of imports and of exports in Table 3. During
this period, annual oil imports of Fiji showed a high of 21.5% of the GDP in 2008, when the
value of oil imports equalled 28.9% of the total imports and 39.7% of the total exports of goods
and services (International Monetary Fund, 2010).
0
20
40
60
80
100
120
140
Crude oil, average (US$/barrel)

12
Table 3 Relative Value of Oil imports: Pacific Islands and Low Income Asia (International Monetary Fund, 2010)
1. From Asian Development Outlook database-imports and exports of goods only. 2. Excludes Cook Islands, Nauru and Tuvalu as data on services trade is unavailable.
VALUE of OIL IMPORTS as
% of IMPORTS of goods & services % of GDP % of EXPORTS of goods & services
2005 2006 2007 2008 2009 2005 2006 2007 2008 2009 2005 2006 2007 2008 2009
PACIFIC ISLAND COUNTRIES
Cook Is lands1 9.1 21.5 18.4 27.2 31.4 4.0 11.5 9.7 20.0 28.8 140.
9
591.7 377.5 982.0 2070.1
Fiji Is lands 23.6 27.5 27.7 28.9 21.2 15.
4
19.0 17.5 21.5 12.6 29.0 38.1 36.2 39.7 26.6
Kiribati 13.3 21.6 18.5 - - 15.
1
18.8 16.3 - - 98.6 175.9 156.8 - -
Marshall Islands ,
Rep. of
- - - - - - - - - - - - - - -
Micronesia, Fed. St. 11.0 13.3 13.2 14.7 9.2 9.4 11.3 11.4 13.8 7.8 58.7 72.6 63.1 67.2 37.7
Nauru1 4.5 - - - - 4.5 - - - - 30.8 - - - -
Palau 31.7 38.1 39.0 - - 18.
7
23.8 19.5 24.3 0.0 33.2 45.9 36.8 - -
Papua New Guinea 4.9 4.5 4.4 5.1 3.3 3.4 2.9 3.3 3.1 2.1 4.5 3.4 4.0 4.0 3.3
Samoa 13.8 14.1 15.0 17.2 17.9 7.6 8.6 9.2 9.2 9.4 23.9 25.7 28.1 28.3 30.1
Solomon Is lands 24.8 23.2 21.5 22.6 17.7 10.
4
12.3 12.1 13.1 8.3 30.9 34.6 33.1 35.0 24.7
Tonga 21.6 24.4 25.2 29.6 28.4 11.
6
12.5 12.7 15.4 15.1 79.1 100.1 99.8 109.5 103.1
Tuvalu1 21.7 - - - - 12.
6
- - - - 4553.
6
- - - -
Vanuatu 8.2 8.9 14.5 14.0 14.3 4.1 4.2 6.7 7.7 6.9 9.5 10.3 16.9 17.9 15.9 LOW INCOME ASIA
Bangladesh 11.0 11.3 10.9 10.9 11.3 2.7 2.9 3.0 3.0
+ 2.9 15.1 15.1 15.2 15.1 15.6
Cambodia 18.5 20.4 21.5 27.0 24.2 13.
4
15.5 15.7 18.4 14.4 20.9 22.5 24.1 34.1 28.9
Lao 12.0 12.6 13.9 14.5 7.2 5.9 5.9 7.4 7.9 3.6 17.4 15.5 19.5 20.9 10.8
Mongolia 19.2 22.5 23.2 25.4 14.8 13.
1
13.4 14.2 18.8 9.2 20.4 20.8 22.2 32.2 16.7
Nepal 14.9 16.8 13.4 14.7 10.2 4.5 5.1 4.6 4.6 3.6 30.5 39.1 33.2 38.3 28.5
Sri Lanka 16.4 17.8 19.6 21.6 17.2 6.8 7.3 7.7 8.5 4.9 20.9 24.3 26.5 33.2 21.8
Vietnam 12.0 11.9 11.0 13.5 9.4 8.9 9.3 10.2 12.6 7.3 12.9 12.6 13.3 16.2 10.8
AVERAGE – PICs2 17.0 19.5 19.9 18.9 16.0 10.6 12.6 12.1 13.5 7.8 40.8 56.3 52.8 43.1 34.5
AVERAGE - Low
Income Asia 14.9 16.2 16.2 18.2 13.5 7.9 8.5 9.0 10.5 6.6 19.7 21.4 22.0 27.1 19.0

13
1.3.4 Vulnerability of small island states
International Declarations
The vulnerability of small island states due to dependency on imported petroleum fuels
has been a matter of serious concern to the Alliance of Small Island States8 (Alliance of
Small Island States, 2013). This concern has been clearly affirmed in various
international declarations adopted by the Small Island Developing States (SIDS) over the
last twenty years (United Nations General Assembly, 1994; Alliance of Small Island
States, 2005; United Nations Development Program, 2012).
The UN Conference on Environment and Development held in June 1992 in Rio de
Janeiro, Brazil, adopted Agenda 21, a comprehensive programme of action for
sustainable development (United Nations Environment Program [UNEP], 1992b).
Chapter 17 of Agenda 21 brought international attention to the
special challenges to planning for and implementing sustainable development on
small island states, because they are ecologically fragile and vulnerable, and their
small size, limited resources, geographic dispersion and isolation from markets,
place them at a disadvantage economically and prevent economies of scale.
(UNEP, 1992b, chapter 17, para. 17.123)
To promote international and regional cooperation and coordination, Agenda 21 called
for the convening of a global conference on the sustainable development of SIDS.
The Global Conference on the Sustainable Development of Small Island Developing
States was held in Bridgetown, Barbados during 25 April to 6 May, 1994. Chapter VII of
the comprehensive Programme of Action for the Sustainable Development of Small
Island Developing States, also called the Barbados Programme of Action (United Nations
General Assembly [UNGA], 1994), which deals with Energy Resources states that “Small
8 The 39 member Alliance of Small Island States (AOSIS) consists of 15 small island states in the Pacific
Ocean, 19 in the Atlantic Ocean and connected seas, and 5 in the Indian Ocean (Alliance of Small Island States, 2013).

14
Island Developing States are currently heavily dependent on imported petroleum
products, largely for transport and electricity generation, energy often accounting for
more than 12 per cent of imports” (UNGA, 1994, chapter VII, para. 35). During the
period 2005-2009, the average ‘oil imports as a percentage of total imports’ for the 13
Pacific SIDS varied from 16.0 % to 19.9%, and for the Fiji Islands it varied from 21.2% to
28.9% (Table 3) (International Monetary Fund, 2010).
Ten years after the landmark 1994 Barbados conference, the International Meeting to
Review the Implementation of the Program of Action for the Sustainable Development
of Small Island Developing States was held at Port Louis, Mauritius in January 2005. The
Mauritius Strategy for the further Implementation of the Program of Action for the
Sustainable Development of Small Island Developing States states in Chapter VII, Energy
Resources that “energy dependence is a major source of economic vulnerability for
many small island developing States”, and many remote and rural small island
developing States communities have little or no access to modern and affordable energy
services (Alliance of Small Island States, 2005; Chapter VII).
The next major small island states gathering was Achieving Sustainable Energy for All in
SIDS – Challenges, Opportunities, Commitments organized by the Alliance of Small Island
States in Bridgetown, Barbados on 7-8 May 2012. This Ministerial Conference was
focused on sustainable energy and adopted the Barbados Declaration on Achieving
Sustainable Energy for All in Small Island Developing States which states that the
Ministers
remain deeply concerned that most SIDS are highly dependent on imported oil
and other fossil fuels for transport and electricity generation, and this is a major
source of economic vulnerability for SIDS. This leaves SIDS highly exposed to oil-
price volatility. The increasing cost of imported fossil fuels represent a major
impediment to the achievement of sustainable development and poverty
eradication in SIDS, as scarce financial resources are diverted from efforts to
promote social and economic development and ensure environmental protection.

15
Furthermore, many remote and rural SIDS communities have little or no access to
modern and affordable energy services. (UNDP, 2012, p. 1, para. 6)
Vulnerability of SIDS
An analysis of challenges and opportunities faced by SIDS that was carried out by the
United Nations Environment Program in 2012 found that dependence on imported
petroleum is a major source of vulnerability for many SIDS and one of the main
challenges in their pursuit of energy security and poverty reduction (United Nations
Environment Program, 2012). This study also found that:
High and rising oil prices cause severe imbalances in trade, and fuel imports are a
heavy drain on limited national financial resources.
Prices of petroleum products in SIDS are much higher than in other countries and
prices of petroleum fuels in the Pacific SIDS are typically 200–300% higher than
international values.
Volatility of the global oil market together with fluctuations in supply and
demand magnify the difficulties faced by SIDS economies in obtaining foreign
exchange to pay for imported energy resources (ibid.).
In Macroeconomic Impacts of Energy Prices in the Pacific, the International Monetary
Fund (2010) reviews the macroeconomic impacts and policy implications of energy
consumption and prices for oil importing PICs. This study finds that energy prices,
especially oil, have a huge impact on the small open economies of the PICs, and
concludes that energy policy measures that reduce the reliance on imported fossil fuel
will contribute to macroeconomic growth, stability and aid poverty reduction.
Overcoming Vulnerability To Rising Oil Prices - Options for Asia and the Pacific is a study
by the United Nations Development Program (UNDP, 2007b) that looks at the effects of
rising oil prices especially on the poor, and the macro-economic impact and national
vulnerability to oil prices. Several actions that can reduce oil price vulnerability at the
national level are proposed including fuel diversification by using renewable energy.
Policies to address oil price shocks and peak oil prices have been prioritized in this study.

16
SIDS are vulnerable not only to the economic impacts but also to the environmental
impacts of imported petroleum fuels. Petroleum products are transported long
distances to islands and stocks need to be stored before usage, both of which can be
causes of environmental problems. Numerous oil spills from broken or damaged tankers
near coastal regions have caused immense damage to marine ecosystems, and to
aquatic and bird life (NOAA, 1992). Unloading, storage and re-loading of oil at island
terminals can also lead to oil spills on land or sea for various reasons (Crowfoot, 2012).
Moreover, greenhouse gas emissions from the use of fossil fuels is one of the primary
causes of global warming and climate change (Intergovernmental Panel on Climate
Change [IPCC], 2007a), the harmful effects of which include sea level rise and an
increasing frequency of extreme climate events (IPCC, 2007b).
Limitations imposed by environmental concerns are also important in the production of
intermediate energy carriers such as electricity and heat from oil and gas, and these
limitations are easy to understand and accept qualitatively. However, environmental
impacts can be very difficult to analyze quantitatively in a manner that allows us to
evaluate, compare and rank several energy production options in order to select the
best one.
Oil Price Vulnerability Index
In general vulnerability is defined as the degree to which a system (human or
natural) is susceptible to, or unable to cope with, adverse effects of an event.
The three commonly accepted aspects of vulnerability are hazards, resistance
and damage. The hazards are basically environmental (or external) variables,
which are not under the control of a given country and they are the resultant
outcomes of international events. The resistance is derived out of economic
variables basically representing the fundamental strength of the economy. The
damage is the acquired vulnerability over a period of time represented by social
variables captured through level of human development. A vulnerability index
for a country capturing the influences of all these variables would be a useful

17
tool for many purposes like identifying specific problems, devising defense
mechanisms, evolving strategic alternatives and planning for the future
eventualities. (Balachandra & Mongia, 2007, p. 2)
.
The UNDP Regional Energy Program for Poverty Reduction based in Bangkok developed
a composite oil-price vulnerability index (OPVI) for 24 countries of the Asia-Pacific region
including 6 SIDS (Fiji, Maldives, Papua New Guinea, Samoa, Solomon Islands and
Vanuatu) using the following method. A set of 15 variables that influence the oil price
vulnerability level of a country were identified by the UNDP team who then grouped
these variables under two categories (Balachandra & Mongia, 2007):
1. Economy-related variables - Real GDP growth rate, GDP per capita, Balance of
payments - current account, Budget balance, Import cover, Share of net oil fuel
subsidy/tax revenue in GDP, Contribution of food and beverages to inflation,
Trade as % of GDP, Gini Index and Human Development Index.
2. Energy-related variables - Oil intensity of GDP, Oil import dependence, Share of
oil in primary energy consumption, Oil reserves to production ratio and Share of
transport in oil consumption (ibid.).
However, after using logical reasoning and statistical analysis to eliminate dependent
variables and double counting, Balachandra & Mongia selected the following 8 variables
for detailed study:
1. Real GDP growth rate
2. GDP per capita
3. Balance of payments-current account
4. Budget balance
5. Import cover
6. Oil intensity of GDP
7. Oil import dependence
8. Share of oil in primary energy consumption.

18
The OVPI of the 24 countries was calculated by Balachandra & Mongia using Principal
Component Analysis with weighted factor scores. They then ranked and categorized the
countries under low, medium and high vulnerability to oil prices (Table 4).
Table 4 Categorization of Countries based on Oil-Price Vulnerability Index (Balachandra & Mongia, 2007)
Low OPVI Iran, China, Malaysia
Medium OPVI
SIDS: Papua New Guinea.
OTHER COUNTRIES: Bhutan, India Indonesia, Thailand,
Mongolia, Vietnam, Myanmar
High OPVI
SIDS: Fiji, Samoa, Solomon Islands, Vanuatu, Maldives.
OTHER COUNTRIES: Philippines, Afghanistan, Nepal,
Bangladesh, Pakistan, Lao PDR, Sri Lanka, Cambodia
Five out of the six SIDS (Fiji, Samoa, Solomon Islands, Vanuatu and Maldives) are highly
vulnerable to oil prices. Papua New Guinea is the only SIDS that has a medium OVPI due
to its petroleum reserves and very low per capita energy consumption9. Four SIDS in the
Pacific are among the seven most vulnerable countries out of the 24 Asia-Pacific
countries ranked in order of vulnerability (Balachandra & Mongia, 2007).
The Pacific island countries are among countries that are most vulnerable to increases in
oil prices in the Asia-Pacific region (UNDP, 2007b). Even though Fiji is blessed with
hydropower resources (unlike some other Pacific island countries), only 50 percent of
Fiji’s electricity generation mix in 2010 came from hydropower; the remaining 50
percent was produced from diesel and heavy fuel oil (Fiji Electricity Authority, 2011). Fiji
spent 684 million US$ on oil imports in 2008 and the value of this equalled 39.7% of
exports and 21.5% of the GDP (International Monetary Fund, 2010; Fiji Bureau of
Statistics, 2014).
1.3.5 What are the alternatives to petroleum fuels?
Alternative energy sources that can reduce or eliminate the usage of fossil fuels are:
9 Less than 10% of the population of Papua New Guinea have access to electricity (UNDP, 2007a)

19
Solar energy
Wind power
Hydro power
Biomass and Biofuels
Geothermal power
Ocean energy (tidal power, wave energy, ocean thermal energy).
For best effect, using alternate energy sources has to go together with demand side
management practises that reduce energy consumption and optimise energy usage.
1.3.6 Which alternate energy source is the best?
Issues in Sustainability
Sustainability of energy production (electricity, heat, etc.) from fossil fuels (coal, natural
gas, diesel, gasoline, etc.) or from renewable energy sources (solar, wind, hydro,
biomass, etc.) is difficult to measure. It is often assumed in a qualitative manner that if
electricity is generated from a renewable energy source then it must be more
sustainable than electricity generated from fossil fuels. However, this is not always true
because we have to account for net energy as well as renewability in order to measure
sustainability (Brown & Ulgiati, 1997).
Another common assumption is that renewable energy sources that release less
greenhouse gases such as carbon dioxide are more sustainable than fossil fuels that
release more greenhouse gases. Greenhouse gases are related to environmental
concerns about global warming. However, we should not rely only on carbon dioxide
emissions to measure sustainability since net energy and use of environmental services
may be far more destructive and threatening to human well being in the long run than
the effects of carbon dioxide released (Brown & Ulgiati, 2002).
Net energy, also known as Energy Return on Energy Invested (EROEI), is the ratio of
energy out to energy in which tells us how much more energy is produced than is
required to develop and operate the system. EROEI evaluations of biofuels show that, in
20
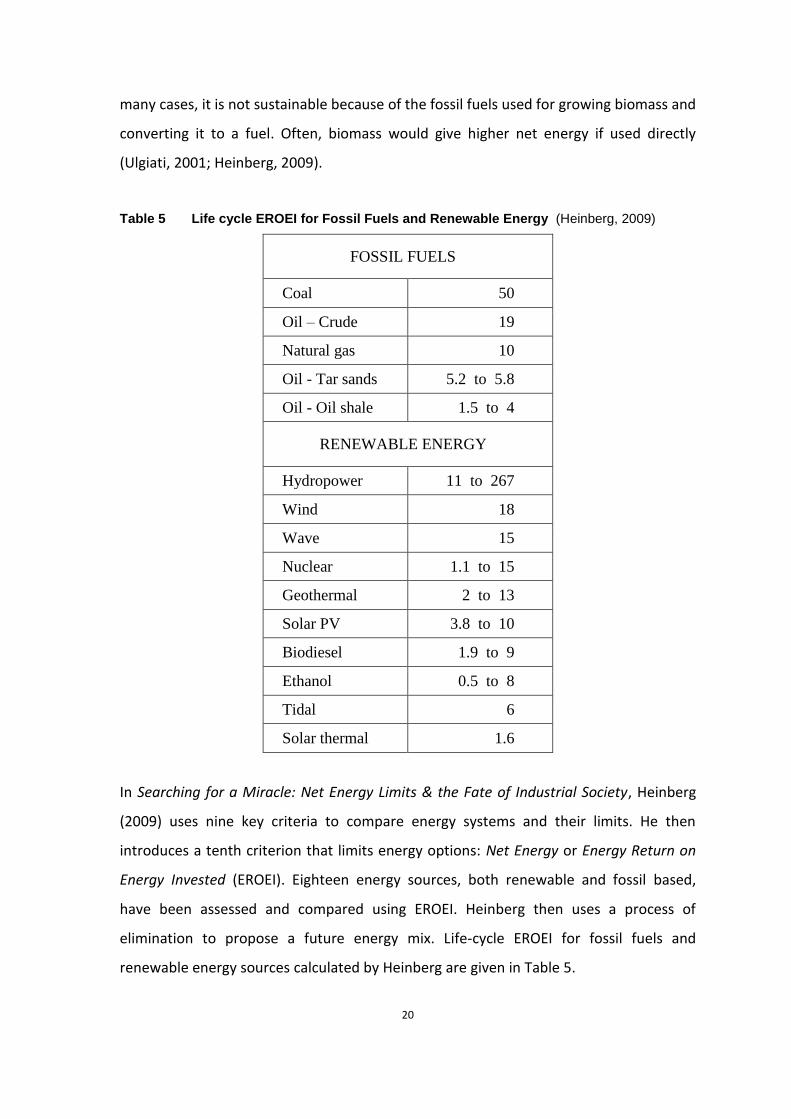
many cases, it is not sustainable because of the fossil fuels used for growing biomass and
converting it to a fuel. Often, biomass would give higher net energy if used directly
(Ulgiati, 2001; Heinberg, 2009).
Table 5 Life cycle EROEI for Fossil Fuels and Renewable Energy (Heinberg, 2009)
FOSSIL FUELS
Coal 50
Oil – Crude 19
Natural gas 10
Oil - Tar sands 5.2 to 5.8
Oil - Oil shale 1.5 to 4
RENEWABLE ENERGY
Hydropower 11 to 267
Wind 18
Wave 15
Nuclear 1.1 to 15
Geothermal 2 to 13
Solar PV 3.8 to 10
Biodiesel 1.9 to 9
Ethanol 0.5 to 8
Tidal 6
Solar thermal 1.6
In Searching for a Miracle: Net Energy Limits & the Fate of Industrial Society, Heinberg
(2009) uses nine key criteria to compare energy systems and their limits. He then
introduces a tenth criterion that limits energy options: Net Energy or Energy Return on
Energy Invested (EROEI). Eighteen energy sources, both renewable and fossil based,
have been assessed and compared using EROEI. Heinberg then uses a process of
elimination to propose a future energy mix. Life-cycle EROEI for fossil fuels and
renewable energy sources calculated by Heinberg are given in Table 5.
21
Fossil fuels in general have EROEI of more than 10 except in the case of oil from tar
sands and shale. The EROEI of coal at 50 explains why it is still widely used for electricity
production in the USA, China and India. Crude oil has an EROEI of 19 — much lower than
the EROEI of 100 that prevailed in the early days of petroleum exploration (around a
century ago) when oil wells were easy to access. Amongst the renewable energies,
hydropower has the highest EROEI ranging from 11 to 267, and wind power is rated 18.
Other renewable energies listed by Heinberg tend to have lower EROEI, except some
geothermal power plants that can reach 13. Wave power has a high EROEI of 15 but this
technology is just crossing the stage from research to commercial development, with no
significant practical capacity so far.
Biofuels have some of the lowest energy returns and some ethanol production
processes can have an EROEI very close to 1. This means that the energy required to
produce one litre of ethanol is nearly equal to the energy in one litre of fuel ethanol
produced. Therefore, ethanol production does not make any net global contribution to
the economic process, though it may still be produced for geopolitical reasons and
supported by substantial financial subsidies, as in the USA for corn ethanol (Taylor,
2009). It is important to remember that an energy source with a high EROEI may have
negative environmental impacts that cost society more than its net economic yield.
These costs are not factored into Heinberg’s calculations.
Therefore, a holistic evaluation and comparison of various energy supply options has to
take into account net energy yield as well as environmental impacts. Emergy Analysis,
that gives us Emergy based Performance Indicators, provides a tool that takes into
account all these factors. The Emergy Index of Sustainability considers both the
resource's economic contribution and its environmental impact and is therefore able to
evaluate and compare energy supply options in a holistic manner (Brown & Ulgiati,
1997). A second approach, the Embodied Energy Analysis, gives us the EROEI together
with life cycle carbon dioxide emissions (Brown & Herendeen, 1996). These indices will
be discussed in detail in Sections 2.2 and 2.3.

22
1.4 ENERGY SUSTAINABILITY FRAMEWORK
The key elements of an Energy Sustainability Framework for small islands can be
grouped under:
1. Renewable Energy Technologies 2. Demand Side Management.
The focus of this thesis is on evaluating Renewable Energy (RE) options. RE technologies
that can be used on small islands will be described under the following categories:
1. Solar energy 2. Wind power 3. Hydro power 4. Bio-energy 5. Ocean energy 6. RE for transport 7. RE for water.
However, the substitution of fossil fuels by RE technologies has to be supported by
Demand Side Management (DSM) practises to reduce energy consumption and optimise
energy usage.
1.4.1 Demand Side Management
Demand Side Management (DSM) for the isolated electric grids found on islands
essentially consists of three components (Eurelectric, 2012):
a) Smart Grids
Smart grids are intelligent electrical networks that can balance supply and demand. They
enable demand side participation by allowing customers to manage and adjust their
electricity consumption in response to real-time price signals that change according to
network peak loads. The main intention is to shift customer loads from peak load hours
to off-peak hours when the power generation system is underutilized. This is done by
using ‘time of day’ tariffs with high prices during the network peak, so that educated
customers can reduce the cost of their energy by reducing their peak energy
consumption. Moreover, a central control system can turn off heating and cooling loads

23
during the network peak hours. Smart grids lower power generation costs by improving
asset utilization and generation efficiency, and by reducing capital investment required
only for peak generation (ibid.).
b) Energy Efficiency
There are several ways of improving energy efficiency and managing the growth of
system demand (Eurelectric, 2012):
Electrical Appliances - Energy efficiency information on products can assist
customers to choose efficient electrical appliances that can achieve significant
energy savings.
Heat Pumps - Heat pump technology, which uses low-grade heat of the earth or
water bodies, can give considerable savings in energy used for heating and
cooling.
Building Regulations - New building materials and climate friendly designs are
fairly low cost methods of making buildings more energy efficient and reducing
their energy needs.
c) Storage
Energy storage is a key enabling technology that can fulfil several functions in isolated
power systems found on islands such as peak shaving, stabilising intermittent
production, quality of electricity, continuity of service, voltage control and frequency
control (ibid.).
1.4.2 Renewable Energy Technologies for Islands
To produce electricity and heat, the main renewable energy (RE) resources on islands
that can be used to substitute fossil fuels are solar, wind, hydro, biomass, geothermal
and ocean energies. In addition, two applications that need unique considerations will
be described: a) RE for transport, and b) RE for water.

24
Solar Energy
Solar thermal devices produce heat whereas photovoltaic cells produce electricity;
concentrators can be used for both. The main applications of solar thermal and solar PV
are given in Table 6. Solar photovoltaic (SPV) was one of the most expensive renewable
energy options for electrification but significant cost reductions have lowered SPV panel
prices dramatically over the last three decades. Moreover, off-grid SPV systems require
a battery bank for storage; this is around one-third of the system cost and has to be
replaced every 5 to 8 years. SPV is very reliable for small amounts of power for niche
applications like off-grid lighting, telecommunications, etc., but its high cost rules it out
for powering small and medium scale industries or for grid-tie applications without
substantial subsidies. These subsidies are given in the form of feed-in tariff programs in
Germany and the province of Ontario in Canada, or as equipment grants as in USA
(Mabee et al., 2012).
Table 6 Applications of Solar Thermal and Photovoltaics
SOLAR THERMAL SOLAR PHOTOVOLTAIC
Water Heaters Lanterns
Cookers Home Lighting Systems
Driers Power Plants
Space heating Pumps
Desalination (MSF, VC) Desalination (ED, RO)
Solar ponds
Furnaces, Crematoriums
Concentrating Solar Power (CSP)
CSP uses mirrors or lenses to concentrate the sun’s rays to heat a fluid and produce
steam. The steam drives a turbine and generates power in the same way as conventional
power plants. In order to generate electricity after sunset or on cloudy days, CSP
systems can have heat storage. This improves the economic viability by producing

25
dispatchable electricity and facilitating grid integration. There are two types of CSP
plants (IRENA, 2012e):
Line-focusing systems have single-axis tracking systems. They include Parabolic
Trough and Linear Fresnel plants.
Point-focusing systems have two-axis tracking systems and much higher
concentration factors. They include Solar Dish systems and Solar Tower plants.
Wind power
The types of wind generators, their applications and capacities are classified in Table 7.
Table 7 Classification of Wind Turbine Generators (Raghavan, 2003)
SIZE CAPACITY APPLICATION GENERATOR
Small < 50 kW Stand Alone, Off-grid Permanent Magnet alternator
Medium 50 - 500 kW Wind-Diesel Induction (asynchronous),
Multi-pole
Large 0.5 – 5 MW Grid Connected Induction, Multi-pole
Small and medium sized wind turbines have good application possibilities on islands with
sufficient wind speeds for pumping water and generating electricity. Small wind turbine
generators for off-grid, stand-alone applications can easily be combined with solar
photovoltaic arrays to give wind-solar hybrid systems that normally incorporate a
voltage control system, battery bank and inverter. Medium sized wind turbines (50 -
250 kW) can be used in wind-diesel hybrid systems to reduce diesel fuel consumption on
islands with diesel power plants. Tilt-up towers make it easy to install and maintain
these wind turbines without a crane, and this is ideal on islands with limited
infrastructure. Large grid connected wind turbines require very good roads, large cranes
and a strong electricity grid; these conditions are not often found on small islands
(Raghavan, 2003).
Hydro power
Hydro power plants can be classified according to their sizes as shown in Table 8. Hydro
power is cheap and is available for 24 hours a day without battery storage. Power in the

26
daytime can be used for small industries and in the night for lights, etc. This is an
important consideration for islands where employment opportunities and income
generation from the productive uses of the energy in the daytime forms an essential
part of the development process.
Table 8 Classification of Hydropower schemes (Harvey et al., 2009)
NAME SIZE
RANGE UNITS
Pico hydro < 5 kW
Micro hydro 5 – 100 kW
Mini hydro 0.1 – 3 MW
Small hydro 3 – 15 MW
Large hydro > 15 MW
There are three types of hydro electric schemes (Harvey et al., 2009):
1. Run-of-the-river hydro is the most environment friendly type. It takes water from
a stream or river and puts it back into the river after the power plant; therefore it
does not need a dam.
2. Hydro schemes with storage can store enough water to cover fluctuations in the
stream flow over a day (diurnal), over a season (seasonal) or over a year (annual).
Big dams or reservoirs are best avoided since the lakes of large dams submerge
huge areas of land causing large-scale displacement of population in addition to
environmental impacts.
3. Pumped Hydro in which an elevated storage is used to store water pumped using
an intermittent source like wind power, so that it can be used during peak loads.
An existing power plant powered by water from a high level storage like a lake
can make this option financially attractive (ibid.).
Bio-energy
Biomass resources, bioenergy conversion technologies and usage are summarized in
Table 9.

27
Table 9 Bioenergy Conversion Technologies and Uses
TECHNOLOGY BIOMASS RESOURCE USAGE
Biofuels
Sugarcane, Grains, Sugar beet for Ethanol
Oil Seeds for Pure Plant Oils
Plant Oils for Biodiesel
Automobile engines
Power generation
Combustion Wood
Agricultural residues
Heat
Steam (electricity)
Biomass Gasifier
(Producer gas)
Wood chips, sawdust
Agricultural residues- straw, rice husk,
groundnut shells, etc.
Thermal
Shaft Power
Electricity
Anaerobic Digester
(Biogas)
Animal wastes from farms
Human wastes
Sewage wastes
Municipal Solid Waste – landfills
Cooking & Heating
Lights
Shaft Power
Electricity
In a biomass gasifier, combustion takes place under a controlled supply of air resulting in
a fuel gas called producer gas (carbon monoxide and hydrogen). Bio-degradable biomass
such as animal and human wastes can be processed in an anaerobic digester in the
presence of methanogenic bacteria to produce biogas which is a mixture of methane
and carbon dioxide. Both gases can be used for heating and cooking. They can also
substitute diesel, gasoline or natural gas for power generation.
Geothermal
Geothermal energy uses the immense heat stored within the earth. It is commonly
found in regions with volcanic activity and harnesses the earth’s heat energy stored in
rock and in trapped vapour or liquids, such as water or brines. Geothermal energy can
be used for heating and for generating electricity; it can also be used for cooling.
Temperatures over 100oC are required for electricity generation, but a wider range of
temperatures can be used for heating applications that include space and water heating
for buildings, swimming pools, greenhouses, aquaculture and industrial processes.
Adsorption chillers can use the heat to provide space cooling (International Energy
Agency [IEA], 2011).

28
In order to use geothermal energy in a sustainable way, the rate of heat removal has to
be lower than the rate at which heat is replenished from within the earth. If the rate of
heat extraction is maintained below the maximum sustainable production level,
constant energy production from the system is possible for 100 to 300 years (IEA, 2011).
The potential for geothermal power in the Caribbean islands has been estimated to be
10,000 MW (Brophy & Poux, 2013). In the Pacific islands, the geothermal potential of
Papua New Guinea has been estimated to be 3,000 to 4,000 MW (McCoy-West et al.,
2011), while the potentials of Fiji, Solomon Islands and Tonga have been estimated to be
50 MW each (Asmundsson, 2008).
Low grade heat from shallow depths under the earth or from large water bodies can also
be harnessed by Ground Source Heat Pumps to heat and cool buildings. Such heat
pumps are also referred to as Geothermal in some parts of the world.
Ocean energy
Three main types of energy can be harnessed for power from the ocean waters:
a) Tidal Power; b) Wave Power; and c) OTEC - Ocean Thermal Energy Conversion. The
different techniques used to convert these types of ocean energy are listed in Table 10.
Table 10 Ocean Energy Conversion – Types and Techniques
TIDAL WAVE OTEC
Tidal Stream Generator
Tidal Barrage (can
increase silting)
Oscillating Water
Column
Over topping
Floats, Pitching, Rolling
Open cycle (working
fluid)
Closed cycle (sea water)
Hybrid
Tidal power uses a dam with reversible hydro turbines that are turned by tidal waters
flowing both ways. Wave power devices capture the energy of waves in open water.
OTEC uses the temperature difference between the top of the ocean and the layer 30 to
40 metres below the surface to evaporate sea water or a working fluid that drives a

29
turbine-generator. Tidal power is a proven technology, but both wave power and OTEC
technologies are still in the research and pilot demonstration stage, with some projects
in the early stages of commercialization (http://www.oceanenergycouncil.com/).
RE for Transport
The transport sector is more difficult to convert to renewable fuels than production of
heat and electricity. Renewable energy fuels commonly used in the transportation
sector are given in Table 11 together with their sources and how they are used.
Table 11 Renewable Fuels used in Transport sector (Raghavan, 2003)
FUEL SOURCE USAGE REMARKS
Ethanol
• Fermentation and
distillation of juices of
sugarcane, sugarbeet.
• Feedstock preparation is
necessary for starchy (corn,
potato) and cellulosic
materials (wood, grass).
• Substitute gasoline
in spark ignition
engines.
• Substitute diesel in
compression ignition
engines (additive is
necessary).
• Used in Brazil for
over 30 years.
• Used in Sweden for
buses for over 20
years.
Pure
plant oil
• Pressing Oil Seeds such
as rape seed, cotton seed,
coconuts, jathropa,
pongamia, etc.
• Substitute diesel in
compression ignition
engines (no additive
is necessary).
• Local production
and usage increases
self-sufficiency.
• Diesel engine has
to be adapted.
Biodiesel
• Esterification of Plant
oils.
• Substitute diesel in
engines for transport
& power generation.
• No adaptation
required in diesel
engines.
• Present distribution
infrastructure can be
used.
Hydrogen
• Electrolysis of water
using electricity produced
by wind, solar or other RE
sources.
• Fuel cells +
electric car
• Direct combustion
in gas engines.
• Not yet
commercialized
• No Supply &
Distribution
infrastructure.

30
FUEL SOURCE USAGE REMARKS
Producer
gas
• Gasification of biomass
such as wood, coconut
shells, grass, etc.
Substitutes upto
• 85% diesel in a
compression ignition
engine, or
• 100% gasoline in
spark ignition engine
• 15-20% diesel fuel
required for ignition.
• Gas has to be
purified and
compressed for
storage on vehicles.
Biogas
• Anaerobic digestion of
biodegradables wastes
(sewage, animal & human
wastes),
( same as above ) ( same as above )
Electric
cars
• Electricity to charge
batteries must come from
RE sources.
• Electric motors
drive wheels.
• Limited distances.
• Expensive &
batteries last only 3-4
years.
Liquid fuels from biomass fall broadly under two categories: alcohols and plant oils.
Biodiesel is made from plant oil by an esterification process. Pure plant oil and biodiesel
can be used only in compression ignition (diesel) engines, whereas ethanol can be used
in both spark ignition (gasoline) engines as well as compression ignition (diesel) engines.
Biogas and producer gas can be used in compression ignition engines in a dual-fuel
mode to substitute upto 85% of diesel fuel, whereas 100% gas can be used in a spark
ignition (gasoline or natural gas) engine. The gases can be purified and compressed for
use in automobiles.
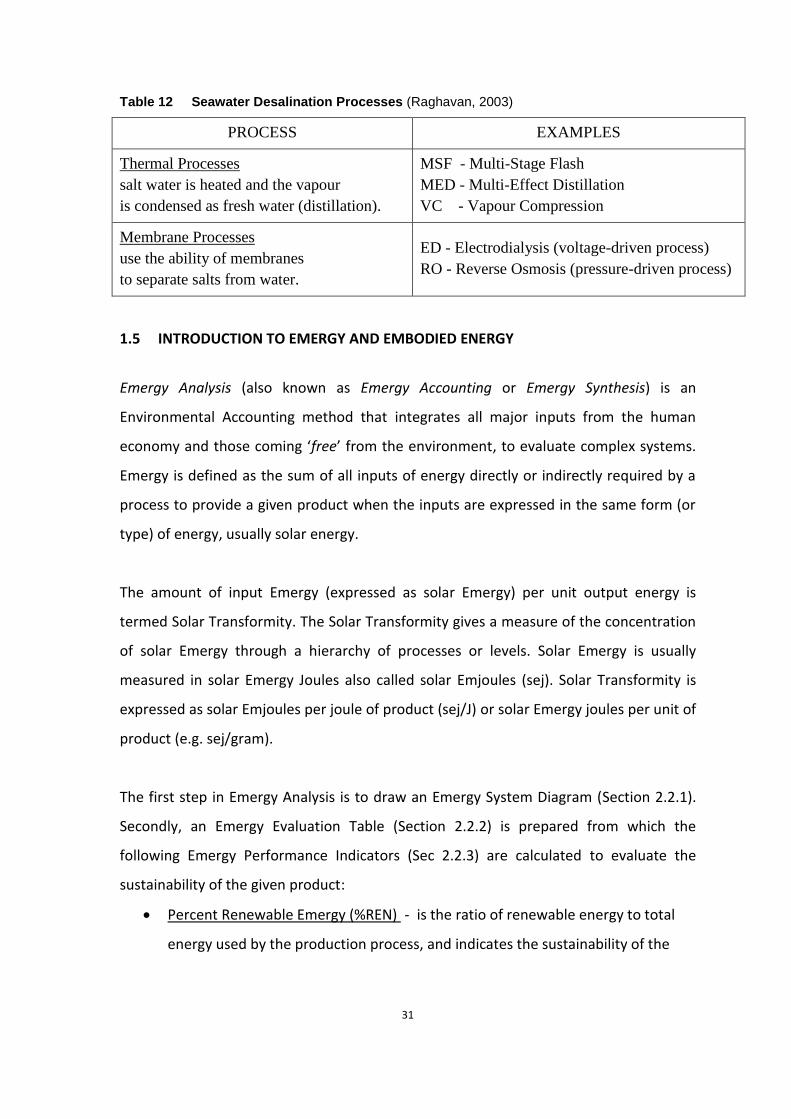
RE for Water
Table 12 shows the main seawater desalination techniques that are based on distillation
or membrane processes. In most cases, the equipment used for desalination is the same
equipment used on big ships or on conventional sources of power supply on the
mainland. Low-cost, appropriate technologies like solar stills can distil water directly
using solar radiation. While solar stills are good for small-scale, local production of
water, they are rarely used for large desalination plants because they require large areas
of land.
31
Table 12 Seawater Desalination Processes (Raghavan, 2003)
PROCESS EXAMPLES
Thermal Processes
salt water is heated and the vapour
is condensed as fresh water (distillation).
MSF - Multi-Stage Flash
MED - Multi-Effect Distillation
VC - Vapour Compression
Membrane Processes
use the ability of membranes
to separate salts from water.
ED - Electrodialysis (voltage-driven process)
RO - Reverse Osmosis (pressure-driven process)
1.5 INTRODUCTION TO EMERGY AND EMBODIED ENERGY
Emergy Analysis (also known as Emergy Accounting or Emergy Synthesis) is an
Environmental Accounting method that integrates all major inputs from the human
economy and those coming ‘free’ from the environment, to evaluate complex systems.
Emergy is defined as the sum of all inputs of energy directly or indirectly required by a
process to provide a given product when the inputs are expressed in the same form (or
type) of energy, usually solar energy.
The amount of input Emergy (expressed as solar Emergy) per unit output energy is
termed Solar Transformity. The Solar Transformity gives a measure of the concentration
of solar Emergy through a hierarchy of processes or levels. Solar Emergy is usually
measured in solar Emergy Joules also called solar Emjoules (sej). Solar Transformity is
expressed as solar Emjoules per joule of product (sej/J) or solar Emergy joules per unit of
product (e.g. sej/gram).
The first step in Emergy Analysis is to draw an Emergy System Diagram (Section 2.2.1).
Secondly, an Emergy Evaluation Table (Section 2.2.2) is prepared from which the
following Emergy Performance Indicators (Sec 2.2.3) are calculated to evaluate the
sustainability of the given product:
Percent Renewable Emergy (%REN) - is the ratio of renewable energy to total
energy used by the production process, and indicates the sustainability of the

32
process. An energy supply option must have a high %REN to be sustainable in
the long term.
Emergy Yield Ratio (EYR) - is the ratio of the Emergy of the process output to
the Emergy of the inputs purchased from outside the system boundary. EYR is
a measure of how well the process is able to exploit local resources to provide
net benefits to society.
Environmental Loading Ratio (ELR) - is the ratio of non-renewable and
purchased Emergy to free renewable Emergy. ELR expresses the use of
environmental services by a system and is a measure of ecosystem stress due to
the entire production process for the energy supply option (i.e. coconut biodiesel
in this case study).
Emergy Index of Sustainability (EIS) - is the ratio of Emergy Yield Ratio to
Environmental Loading Ratio, i.e. EYR/ELR. The EIS is a measure of the
contribution of the energy supply option to the economy per unit of
environmental loading.
Embodied Energy Analysis (EEA) considers only the commercial energy required directly
or indirectly to provide all the inputs (goods and services) for the entire biodiesel
production process (Section 2.3). The Energy Return on Energy Invested (EROEI)
calculated by the EEA is a number that gives the Joules of biodiesel produced (Energy
Return) from using one Joule of input energy (Energy Invested). The carbon dioxide
(CO2) emissions during the production of biodiesel are then estimated by multiplying the
total Embodied Energy of biodiesel in ‘kg oil equivalent’ by the CO2 emissions per kg of
petroleum oil.
In comparisons of energy systems, the most sustainable on the long term will have
highest %REN, EYR, EIS and EROEI, and the lowest ELR and CO2 emissions.

33
1.6 LITREATURE REVIEW
The newly created International Renewable Energy Agency (IRENA) based in the United
Arab Emirates has carried out a series of excellent studies on renewable energy
resources and technologies as well as regional assessments and country profiles:
1. Renewable Power Generation Costs in 2012: An Overview (IRENA, 2013)
2. Renewable Power Generation Costs - Summary for Policy Makers (IRENA, 2012a)
3. Policy Challenges for Renewable Energy Deployment in Pacific Island Countries
and Territories (IRENA, 2012b)
4. Renewable Energy Country Profiles: Pacific (IRENA, 2012c)
5. Electricity Storage and Renewables for Island Power - A Guide for Decision
Makers (IRENA, 2012d)
6. Concentrating solar power (IRENA, 2012e)
7. Biomass for Power Generation (IRENA, 2012f)
8. Hydropower (IRENA, 2012g)
9. Solar Photovoltaics (IRENA, 2012h)
10. Wind Power (IRENA, 2012i)
These reports are based on a comprehensive analysis of around 8,000 medium to
large-scale commissioned or proposed renewable power generation projects from a
range of data sources. IRENA highlights that for off-grid power supply, renewables are
already the default economic solution. For new grid supply and grid extension,
renewables are increasingly becoming the most competitive option.
100% Renewable Energy Islands in Tuvalu, Fiji and Tonga (Raghavan, 2003) is a case
study of eleven islands in three Pacific island countries that proposes a plan for making
them totally free of fossil fuels. All the renewable energy resources have been evaluated
and appropriate technologies are then proposed so that the heat and electricity
requirements of these eleven islands can come solely from renewables. Action Plan for
Providing 100% of the Energy Requirements of Lakshadweep Islands from RES (Raghavan
& Kishore, 2001) is a similar study for seven inhabited islands of the Lakshadweep
archipelago in the Arabian Sea.

34
A comprehensive coverage of all aspects of the planning and implementation of micro-
hydro power generation and distribution for developing countries is found in Micro-
Hydro Design Manual (Harvey et al., 2009). This manual covers the design of the overall
micro-hydro power scheme including site assessment, as well as design and data for all
components of the scheme. Case studies from many developing countries highlight
potential problems during implementation at remote sites and how to overcome them.
Key findings in the International Energy Agency’s Technology Roadmap - Geothermal
Heat and Power (International Energy Agency, 2011) include the status and prospects
for geothermal heat and electricity, required policy framework and research &
development priorities. The roadmap then proposes seven key actions required over the
next ten years to tap the full potential of geothermal resources. McCoy-West et al.
(2011) studied 20 Pacific Island nations and territories and short-listed eight having high
and moderate potential for future pre-feasibility geoscientific exploration, risk
evaluation (for resource capacity, hazard and financial modeling), and assessment for
small (including off-grid) plant development.
Beginning in the 1950s, Prof. H.T. Odum recognized the principles of energy quality as an
outgrowth of his investigations and simulation modelling of ecosystems of humans and
nature. This led to the first formal recognition of energy quality in 1971 in his book
Environment, Power and Society (Odum, 1971). In this book, Odum introduced the
Energy Systems Language — a visual mathematics tool that provides an overview of the
energy system studied — and developed the concept of ecological engineering.
Moreover, he explored the interrelationships of energy and environment, and their
importance to the well-being of humanity and the planet. Odum was working on the
final revision of the manuscript of the second edition of Environment, Power and Society
when he passed away in 2002. The manuscript was finalised and published by his wife
Elizabeth Odum and his colleagues Mark Brown and Dan Campbell as Environment
Power and Society for the 21st Century – The Hierarchy of Energy (Odum, 2007). In this
edition, Odum included the concepts of Emergy and Transformity.

35
From 1971, Odum’s thinking evolved for twenty five years, and in 1996 he published his
comprehensive treatise on Emergy as a measure of real wealth in Environmental
Accounting: Emergy and Environmental Policy Making (Odum, 1996). Odum describes in
detail the basic principles of Emergy Analysis and all its major applications, and provides
a rational approach to evaluating commodities, services and environmental goods.
Chapter 1 introduces the lens of systems overview, and its use to evaluate Emergy.
Chapter 2 contains the scientific basis of the Emergy concept in the natural energy
hierarchy of the universe. Chapter 3 estimates the Emergy budget of the earth. Chapter
4 relates Emergy and money. Chapter 5 summarizes the procedure for making an
Emergy evaluation table. Then several chapters show how to use Emergy to evaluate
environments, minerals, waters, primary energy sources, economic developments,
nations and international trade. Chapter 13, concerning the time dimension, considers
how Emergy oscillates according to scales of size and time. Chapter 14 contains
comparisons with other approaches and responses to criticisms, and Chapter 15
suggests areas for fruitful applications to policy.
Data required for Emergy computations have been published in a series of five folios:
Folio #1: Introduction and Global Budget (Odum et al., 2000)
Folio #2: Emergy of Global Processes (Odum, 2000)
Folio #3 - Emergy of Ecosystems (Brown & Bardi, 2001)
Folio #4 - Emergy of Florida Agriculture (Brandt-Williams, 2002)
Folio #5 - Emergy of Landforms (Kangas, 2002).
A complementary methodology is Embodied Energy Analysis which measures Energy
Return on Energy Invested (EROEI) and carbon dioxide (CO2) emissions. Brown & Ulgiati
(2004) compare the two approaches. They present a brief synopsis of the Emergy
Analysis methodology in Emergy Analysis and Environmental Accounting and use
several case studies of energy conversion systems (oil plant, wind, geothermal, OTEC10,
hydropower) to illustrate the critical difference between Emergy Analysis and Embodied
10
Ocean Thermal Energy Conversion

36
Energy Analysis. In Embodied Energy Analysis and EMERGY analysis: a comparative view,
Brown & Herendeen (1996) give details of the Emergy accounting procedures and
discuss differences and similarities between Embodied Energy Analysis and Emergy
Analysis by using the two approaches to analyze the same systems. In Energy analysis
and EMERGY analysis—a comparison, Herendeen (2004) gives a detailed comparison of
the two accounting procedures.
In Sustainable Biomass Production: A Comparison between Gross Energy Requirement
and Emergy Synthesis Methods, Franzese et al. (2009) compare two cropping systems
(corn production in Italy and willow production in Sweden) by means of the parallel
application of both methods. Because corn production is more energy intensive than
growing willow trees, they found that the EROEI (Energy Return on Energy Invested) of
corn (3.82) is only one-fifth the EROEI of willow (19.50). The energy intensive nature of
corn production is also reflected in the transformity of corn (7.34E+04 seJ/J) being more
than four times that of willow (1.62E+04 seJ/J).
Brown & Ulgiati (2002) use Emergy and Embodied Energy Accounting techniques to
compare six power generating systems in Emergy Evaluations and Environmental
Loading of Electricity Production Systems: three renewable (geothermal, hydroelectric,
wind) and three fossil fired (natural gas, oil, coal thermal). They found that:
1. The renewable power plants had the highest %REN (percent renewable energy)
— wind (86.61), geothermal (69.67), and hydro (68.84) — but the fossil fuel
plants all had %REN of less than 10%. Brown & Ulgiati note that fossil thermal
power plants have a non-negligible fraction of renewable inputs (6.56% to 8.79%)
because of vital renewable inputs to power plant activity such as the oxygen
supply to the combustion process, which is renewed by solar radiation driving
the photosynthesis of green plants. Other renewable inputs to power plant
activity include cooling water from the river or sea, and wind needed for
dispersal of smoke and other airborne contaminants.
2. Emergy Yield Ratio (EYR) varied from a high of 7.6 for hydroelectric generation to
the lowest rating of 4.2 for the oil fired thermal plant. The low EYR of the

37
geothermal system (4.81) indicates a high emergy content of the resources
invested from outside.
3. Environmental Loading Ratio (ELR) of the oil fired plant (14.24) and the coal plant
(11.37) were found to be very high whereas the renewable energy systems had
lower and therefore more desirable ELRs, all less than 1.0.
4. Emergy Index of Sustainability (EIS) of the wind power plant (48.30) is the highest
followed by the hydroelectric plant (16.90) and the geothermal plant (11.05). All
the fossil fuel plants had EIS less than 1.0.
5. The renewable power plants — hydroelectric (23.81)and geothermal (20.83) —
have the highest and therefore most desirable EROEI, whereas the fossil fired
plants have the lowest — methane plant (0.36) and coal plant (0.25).
6. As expected, they found high CO2 emissions from the fossil fired power plants —
coal (1109 g CO2 /kWh), oil (923 g CO2/kWh ) and methane (759 g CO2/kWh) —
compared to renewable energy power plants hydropower (12 g CO2/kWh) and
wind (36 g CO2/kWh). However, the geothermal power plant (655 g CO2/kWh)
has high CO2 emissions due to the carbon dioxide in deep aquifer waters that are
used as the steam source and then vented to the atmosphere through cooling
towers.
To evaluate the environmental impact of biodiesel production from soybean in Brazil,
Cavalett & Ortega (2010) have used environmental impact indicators from Emergy
Analysis (EA), and Embodied Energy Analysis (EEA) in Integrated environmental
assessment of biodiesel production from soybean in Brazil. The EEA gave an energy
return of 2.48 J of biodiesel per Joule of fossil fuel invested, and carbon dioxide
emissions of 0.86 kg of CO2 per litre of biodiesel. The EA found that the Transformity of
biodiesel (solar emergy in solar emjoules (seJ) per joule of product) is 3.90E+05 seJ/J 11,
EYR is 1.62 and %REN is 31%. Taking into consideration all the performance indicators,
Cavalett & Ortega conclude that in spite of a possible contribution to reducing CO2
emissions, soybean biodiesel is not a viable alternative to petroleum diesel.
11
Numbers in this study are given in the scientific notation. 3.90E+05 seJ/J = 3.90 x 105 = 390,000 seJ/J
38
In Critical Analysis of the Swedish Biofuel Policy using Emergy Synthesis, Cavalett &
Rydberg (2010) use Emergy Analysis to analyse biofuels promoted by Swedish energy
policies. They evaluated three different biofuels in Sweden: Ethanol from wheat
(Transformity = 9.19E+04 seJ/J, %REN = 12%, EYR = 1.15); Methanol from willow
(Transformity = 6.06E+04 seJ/J, %REN = 10%, EYR = 1.11) and Biodiesel from rapeseed
(Transformity = 13.6E+04 seJ/J, %REN = 11%, EYR = 1.27). They also evaluated ethanol
production in Brazil from sugarcane (Transformity = 7.07E+04 seJ/J, %REN = 19%, EYR =
1.38) because it is promoted by the Swedish Government. Their main findings are: a)
Ethanol from sugarcane in Brazil has a lower Transformity and a higher %REN than
biofuels produced in Sweden; and b) All three biofuels are heavily dependent on non-
renewable resources and have higher Transformities than fossil fuels. Cavalett &
Rydberg conclude that none of the analyzed biofuels can be considered a sustainable
substitute for fossil fuels due to their very low Emergy Yield Ratio and low %REN.
Jarméus (2013) uses Emergy Analysis to compare the production of biodiesel with biogas
from algae, in his Master’s thesis on Emergy Analysis of Biodiesel and Biogas Production
from Baltic Sea Macro Algae. His evaluation included all processes from harvesting of
the algae, transport of the algae to the processing plants, and processing of the algae to
biodiesel or biogas. He found the Transformity for biogas (9.12E+04 seJ/J) to be an order
of magnitude lower than the transformity for biodiesel (5.04E+05 seJ/J). However,
Jarméus found that the emergy performance indicators for biodiesel were better than
for biogas. The Emergy Yield Ratio for biodiesel (6.44) was found to be higher than
biogas (3.66), the Environmental Loading Ratio for biodiesel (0.184) was lower than
biogas (494); and the Percent Renewable Energy for biodiesel (84%) is higher than
biogas (67%).
Paoli et al. (2008) used Emergy Analysis to compare two different solar technologies in
Solar power: An approach to transformity evaluation. Solar thermal collectors for heat
were found to be a much more sustainable way of using solar energy when compared to
solar photovoltaics for electricity because they have a lower Transformity, a higher

39
Percent Renewable Energy, a higher Emergy Yield Ratio and a lower Environmental
Loading Ratio.
Brown & Ulgiati (1997) provide a reference set of indices based on Emergy for the
evaluation of eco-technological processes and whole economies in Emergy-based
indices and ratios to evaluate sustainability: monitoring economies and technology
toward environmentally sound innovation. They stress indices such as Emergy yield
ratio, environmental loading ratio and Emergy investment ratio, and then define a new
index: the Emergy sustainability index. The Emergy indices are shown to be
functions of renewable, non-renewable and purchased Emergy inflows. The
usefulness of the indices is demonstrated for several ecological engineering
activities (including oil spill restoration, land reclamation and wastewater recycle
through wetlands), several production systems and several national economies.
Raghavan (2005) evaluates the major biomass resources in small island countries in
Biofuels in Small Island Developing States, and describes the technologies that can be
used to harness this renewable resource. The percentage of power generation that can
be substituted by power from biofuels is also given. Biofuels from Coconuts (Raghavan,
2010) evaluates the potential for power generation from all parts of the coconut palm in
the major coconut growing countries, and provides technical details of the biofuels
technologies. Developing a Biofuels Industry in Fiji is a Cabinet Strategy Paper prepared
for the Government of the Fiji Islands by Binger et al. (2005) that studies the two major
biomass resources of Fiji (coconuts and sugarcane) and proposes a phased action plan to
develop a biofuels industry in the Fiji Islands.
In Biofuel from Coconut Resources in Rotuma - A Feasibility Study on the Establishment
of an Electrification Scheme using local Energy Resources, Zieroth et al. (2007) use GIS12
to assess the coconut resource on the island of Rotuma in the Fiji Islands and provide a
detailed description of the techno-economic feasibility of substituting biofuel for diesel
power generation all over the island. Of the total coconut production of 7.5 million nuts
12
Geographical Information System

40
per annum on the island of Rotuma, they found that 5 million nuts could be harvested.
After allowing for traditional local consumption (1.5 million nuts) they estimated 3.5
million nuts to be available for coconut oil (CNO) production. Zieroth et al. calculated
that the potential CNO production (690,000 litres) represents a diesel equivalent of
approximately 635,000 litres, which is more than three times Rotuma’s estimated
annual diesel fuel consumption of 184,000 litres. Moreover, they expect that the
production of CNO on the island could be significantly increased through a coconut palm
rehabilitation program that would include replanting and refurbishment of old
plantations.
ERIA (2010) carried out a sustainability assessment of four biomass resources being
developed on a large scale in East Asia, in Sustainability Assessment of Biomass Energy
Utilisation in Selected East Asian Countries. The four biomass resources assessed in this
study are: a) Biodiesel from Jatropha in India; b) Biodiesel from Jatropha in Indonesia;
c) Bioethanol from Cassava in Thailand; and d) Biodiesel from Coconut in the
Philippines. To assess the sustainability of biofuel production, ERIA used Greenhouse
Gas Emissions (GHGs) as an indicator of environmental impacts, total value added (TVA)
as an indicator of economic impacts, and Human Development Index (HDI) as an
indicator of social impacts. ERIA’s main findings in this study are:
1. For production of biodiesel from coconuts in the Philippines, copra production
has the highest net profit, whereas biodiesel production has the lowest net
profit. The use of coconut biodiesel to replace petroleum diesel in the Philippines
results in emissions reduction of 2.8 tons CO2 per ha per year. The majority (66%)
of coconut farmers in the Philippines as well as a majority of employees in the
biodiesel plant noticed an improvement in their living conditions due to the
production of coconut biodiesel.
2. Jatropha production in India is not economically viable because the cost incurred
during the cultivation stage is much higher than the revenue generated. Both
TVA and net profit are quite attractive for the biodiesel production stage, as long
as the Jatropha oil seeds are available at a reasonable price.

41
3. Indonesian farmers cultivating Jatropha for biodiesel benefit only a little from the
cultivation stage, but utilization of Jatropha waste for producing biogas increased
their earnings significantly.
4. Economic assessment of the bioethanol production process in Thailand indicates
that it is economically viable. In spite of a lower social development than
employees at the biorefinery complex, sugarcane farmers benefit from contract
farming for the sugar-ethanol plant because it provides an assured source of
annual income.
The ERIA study provides an excellent economic assessment of the biofuels studied.
However, it does not evaluate all the environmental impacts of the biofuels
production process. Even while calculating life cycle greenhouse gas emissions, the
ERIA study does not consider emissions associated with manufacturing of machines
and vehicles, constructing irrigation structures, buildings, infrastructures, etc. as well
as manual labour for new planting, pruning, harvesting, machine operating, driving,
etc. On the other hand, the Emergy analysis carried out in this study evaluates all the
environmental impacts in a comprehensive manner by taking into account all direct
and indirect inputs to the entire biofuel production process.

42
2 EMERGY ANALYSIS METHODOLOGY
2.1 COCONUT BIODIESEL AS AN ALTERNATIVE FUEL FOR POWER GENERATION IN FIJI
2.1.1 Rationale
Diesel and heavy fuel oil are widely used in the Pacific Island Countries (PICs) for power
generation. In 2010, about 80% of the primary energy consumption in PICs came from
oil. About 75% of the oil consumed is used for transportation and more than 20% is used
for electricity generation (Figure 8) (IRENA, 2012b).
Figure 8 Gross Electricity Generation by Source for Main Grids in Pacific Islands in 2010 (IRENA, 2012b)
On the other hand, most Pacific islands have abundant resources of coconuts from
which coconut oil can be produced (Table 13). The coconut oil can be transformed by a
process called esterification into biodiesel that can be used as a direct substitute for
diesel fuel (Krishna et al., 2009; Raghavan, 2005).13
13 Most of the properties of coconut oil and diesel fuel are similar but coconut oil is more viscous than
diesel and its combustion characteristics are different from those of diesel. Unless the diesel engine is modified properly for use with pure coconut oil, long term testing on the direct use of coconut oil as a
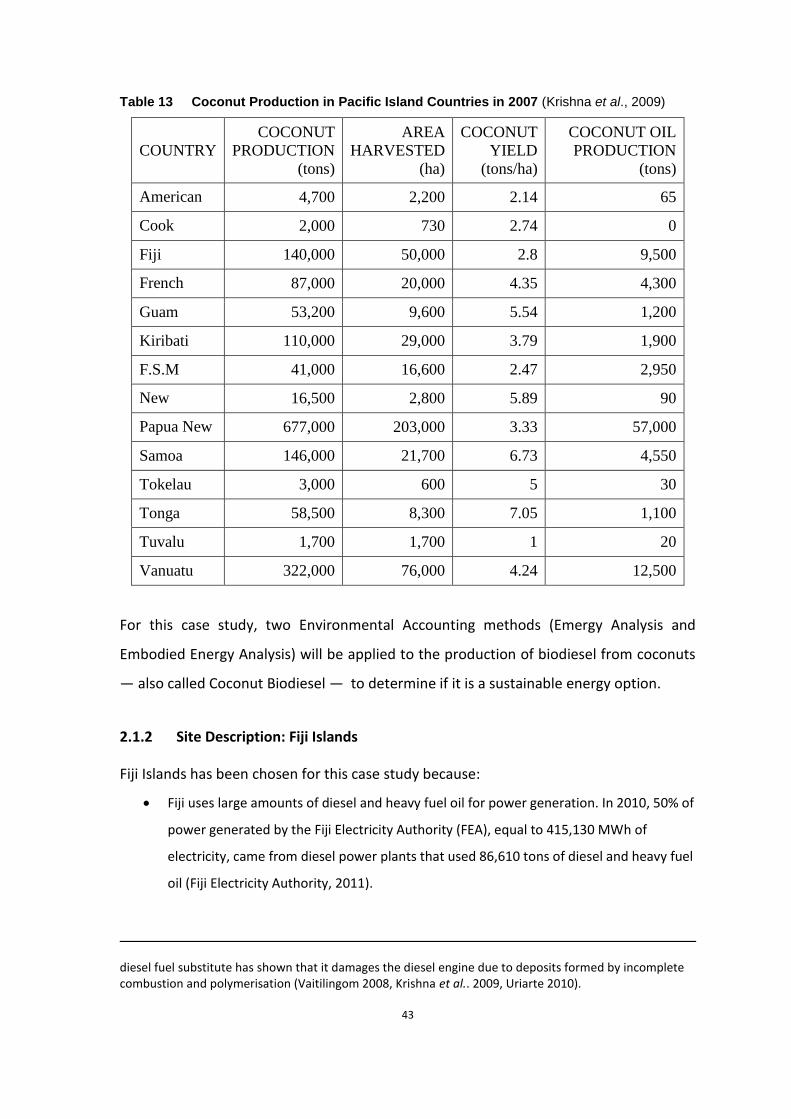
43
Table 13 Coconut Production in Pacific Island Countries in 2007 (Krishna et al., 2009)
COUNTRY
COCONUT
PRODUCTION
(tons)
AREA
HARVESTED
(ha)
COCONUT
YIELD
(tons/ha)
COCONUT OIL
PRODUCTION
(tons)
American
Samoa 4,700 2,200 2.14 65
Cook
Islands 2,000 730 2.74 0
Fiji 140,000 50,000 2.8 9,500
French
Polynesia 87,000 20,000 4.35 4,300
Guam 53,200 9,600 5.54 1,200
Kiribati 110,000 29,000 3.79 1,900
F.S.M 41,000 16,600 2.47 2,950
New
Caledonia 16,500 2,800 5.89 90
Papua New
Guinea 677,000 203,000 3.33 57,000
Samoa 146,000 21,700 6.73 4,550
Tokelau 3,000 600 5 30
Tonga 58,500 8,300 7.05 1,100
Tuvalu 1,700 1,700 1 20
Vanuatu 322,000 76,000 4.24 12,500
For this case study, two Environmental Accounting methods (Emergy Analysis and
Embodied Energy Analysis) will be applied to the production of biodiesel from coconuts
— also called Coconut Biodiesel — to determine if it is a sustainable energy option.
2.1.2 Site Description: Fiji Islands
Fiji Islands has been chosen for this case study because:
Fiji uses large amounts of diesel and heavy fuel oil for power generation. In 2010, 50% of
power generated by the Fiji Electricity Authority (FEA), equal to 415,130 MWh of
electricity, came from diesel power plants that used 86,610 tons of diesel and heavy fuel
oil (Fiji Electricity Authority, 2011).
diesel fuel substitute has shown that it damages the diesel engine due to deposits formed by incomplete combustion and polymerisation (Vaitilingom 2008, Krishna et al.. 2009, Uriarte 2010).

44
Fiji has abundant coconut resources. Biodiesel made from locally produced coconut oil
could potentially replace about 20% of Fiji’s entire diesel consumption (Cloin, 2006).
Reliable data for diesel fuel used for power generation and for coconut production is
available.
Fiji Islands has a Biofuels Development Program for substituting imported petroleum
fuels with locally produced biofuels, including biodiesel from coconut oil (Binger et al.,
2005). The National Energy Policy of the Fiji Islands aims at 90% renewables for the
electricity sector by 2015 (59% from hydropower, 30% from biomass and 1% from
windpower) (Nakavulevu, 2011).
The Fiji archipelago, lying between 16 and 20 degrees south of the equator, consists of
332 islands, mostly volcanic in origin, of which only 105 islands are inhabited. The land
area of the Fiji Islands is 18,333 km2 and its Exclusive Economic Zone is 1.26 million km2.
The two largest islands comprise 87% of the total land area: Viti Levu (10, 390 km2) and
Vanua Levu (5,538 km2). The maximum height above sea level is 1,324 metres (South
Pacific Applied Geoscience Commission [SOPAC], 2002). The population in 2010 was
861,000, 94% of whom live on the two main islands of Viti Levu and Vanua Levu (IRENA,
2012c).
The climate is tropical oceanic with tempering influences from the prevalent southeast
trade winds. Average rainfall in the wet, windward sides of the islands is 2,625
mm/annum (World Bank, 2014b) but the rainfall in the drier, leeward sides can be as
low as 440 mm/annum. The mean annual temperature is 28°C. The main natural hazards
are cyclones, storm surges, coastal flooding, river flooding, drought, earthquakes,
landslides, tsunami and volcanic eruptions (SOPAC, 2002).
The GDP in 2012 was 3.9 billion US$ with a per capita GDP of 4,459 US$ per annum
(World Bank, 2014a). The economic base is diverse with a strong tourism sector plus
sugar, agriculture, garment and mining industries. Exports include sugar, garments, gold,
coconut products, tropical fruits, root crops, vegetables, tobacco, fish, and timber
products (SOPAC, 2002).
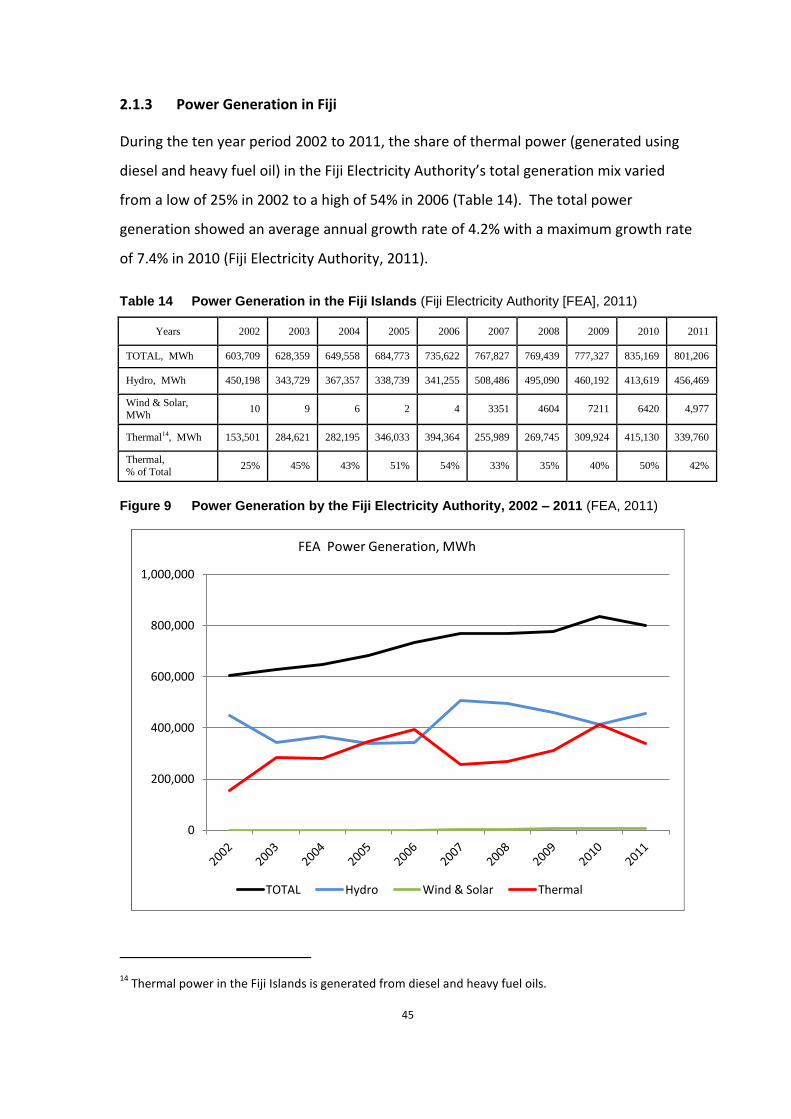
45
2.1.3 Power Generation in Fiji
During the ten year period 2002 to 2011, the share of thermal power (generated using
diesel and heavy fuel oil) in the Fiji Electricity Authority’s total generation mix varied
from a low of 25% in 2002 to a high of 54% in 2006 (Table 14). The total power
generation showed an average annual growth rate of 4.2% with a maximum growth rate
of 7.4% in 2010 (Fiji Electricity Authority, 2011).
Table 14 Power Generation in the Fiji Islands (Fiji Electricity Authority [FEA], 2011)
Years 2002 2003 2004 2005 2006 2007 2008 2009 2010 2011
TOTAL, MWh 603,709 628,359 649,558 684,773 735,622 767,827 769,439 777,327 835,169 801,206
Hydro, MWh 450,198 343,729 367,357 338,739 341,255 508,486 495,090 460,192 413,619 456,469
Wind & Solar,
MWh 10 9 6 2 4 3351 4604 7211 6420 4,977
Thermal14, MWh 153,501 284,621 282,195 346,033 394,364 255,989 269,745 309,924 415,130 339,760
Thermal,
% of Total 25% 45% 43% 51% 54% 33% 35% 40% 50% 42%
Figure 9 Power Generation by the Fiji Electricity Authority, 2002 – 2011 (FEA, 2011)
14
Thermal power in the Fiji Islands is generated from diesel and heavy fuel oils.
0
200,000
400,000
600,000
800,000
1,000,000
FEA Power Generation, MWh
TOTAL Hydro Wind & Solar Thermal

46
Over 90% of FEA’s hydropower generation comes from the 80 MW Monasavu hydel
project. The annual rainfall that fills the Monasavu reservoir determines the maximum
quantity of hydropower that can be generated during that year. After using all the
available hydropower, FEA then generates enough thermal power to meet the loads.
The quantity of thermal power generated is therefore inversely proportional to the
hydropower generated (Figure 9) (Binger et al., 2005).
2.1.4 Coconut production in Fiji
Over the last 35 years, there has been a decline in production of copra and coconut oil
as shown in Figure 10. During the period 1977 to 2011, copra production in the Fiji
Islands fell from a maximum of 30,600 tons/yr in 1977 to less than 6,500 tons/yr in 2010,
while the production of coconut oil fell from 18,500 tons/yr in 1977 to 4,765 tons/yr in
2011 (Fiji Bureau of Statistics, 2012). However, the potential for coconut oil production
is higher since significant quantities of coconuts are not harvested on many of the
islands in Fiji (Zieroth et al., 2007).
Figure 10 Copra and Coconut oil production in the Fiji Islands (Fiji Bureau of Statistics, 2012)
0
5,000
10,000
15,000
20,000
25,000
30,000
35,000
Copra and Coconut Oil production (tons/yr)
Copra Coconut Oil
47
The Fiji National Agricultural Census (2009) gives the plantation area under coconuts as
15,009 ha15. Taking a conservative yield of 3 tons copra per ha, and an oil extraction of
600 litres of coconut oil per ton of copra, the potential coconut oil production is 27
million litres per annum (Singh, 2012). This quantity of coconut oil is equivalent to 23.5
million litres of diesel fuel16.
2.2 EMERGY ANALYSIS
While comparing the sustainability of energy sources in order to select the best option,
it is necessary to take into account quantitatively all the energy inputs as well as the
environmental services that are used. Emergy Analysis (also known as Emergy
Accounting or Emergy Synthesis) is an Environmental Accounting method that integrates
all major inputs from the human economy and those coming ‘free’ from the
environment, to evaluate complex systems. Emergy theory was developed over a period
of nearly 30 years by Professor H.T. Odum and his colleagues in the University of Florida
at Gainesville to evaluate complex systems holistically. The principles of Emergy theory
and its applications are described clearly in Odum’s landmark book Environmental
Accounting: Emergy and Environmental Policy Making (Odum, 1996).
Emergy is defined as the sum of all inputs of energy directly or indirectly required
by a process to provide a given product when the inputs are expressed in the
same form (or type) of energy, usually solar energy. Most often, inputs to a
process are the result of another process (or a chain of processes), in which
energy has been concentrated and upgraded. Thus Emergy is derived by
summing all inputs (expressed in equivalent energy of a single form; such as solar
energy) used in the chain of processes that yielded the output in question. On a
unit basis, one joule or gram of a given output is produced by dissipating a given
amount of solar equivalent energy. The amount of input Emergy (expressed as
solar Emergy) per unit output energy is termed, ‘solar transformity’. The solar
15
hectares 16
The energy content of one litre of coconut oil is equal to 0.87 litres of diesel fuel (Binger et al., 2005).
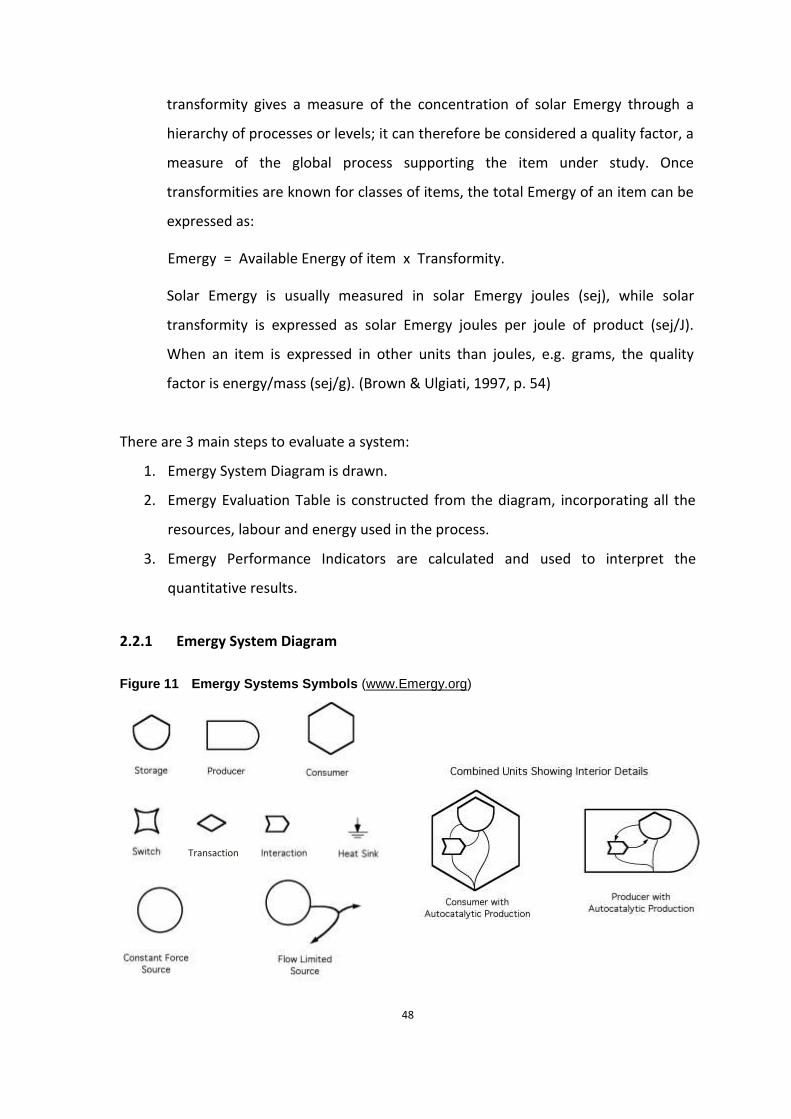
48
transformity gives a measure of the concentration of solar Emergy through a
hierarchy of processes or levels; it can therefore be considered a quality factor, a
measure of the global process supporting the item under study. Once
transformities are known for classes of items, the total Emergy of an item can be
expressed as:
Emergy = Available Energy of item x Transformity.
Solar Emergy is usually measured in solar Emergy joules (sej), while solar
transformity is expressed as solar Emergy joules per joule of product (sej/J).
When an item is expressed in other units than joules, e.g. grams, the quality
factor is energy/mass (sej/g). (Brown & Ulgiati, 1997, p. 54)
There are 3 main steps to evaluate a system:
1. Emergy System Diagram is drawn.
2. Emergy Evaluation Table is constructed from the diagram, incorporating all the
resources, labour and energy used in the process.
3. Emergy Performance Indicators are calculated and used to interpret the
quantitative results.
2.2.1 Emergy System Diagram
Figure 11 Emergy Systems Symbols (www.Emergy.org)
Transaction

49
Basic symbols used in an Emergy systems diagram (Source, Storage, Interaction, etc.) are
shown in Figure 11. These symbols are used to form increasingly complex symbols like
Producer and Consumer. In this way, highly complex ecological systems can be
represented by around 20 symbols, making it easy to understand interactions between
major components of the ecosystem (www.Emergy.org).
Figure 12 shows a system diagram for the production of solar photovoltaic (PV) panels.
There are three sub-systems in the production of PV panels: a) Wafer Production,
b) Module Assemblage, and c) Assemblage, Installation and Maintenance. The final
product of the rectangular system boundary is electricity shown on the right. Outside
the rectangular system boundary are the circles that are sources for inputs used by the
solar PV panels. On the left are the free inputs from the environment such as sunlight
and water. On the top are the labour and material inputs such as fuels, electricity,
manpower, for which transactions (diamond shape) are required, mostly financial.
Figure 12 System Diagram for Electricity Production from SPV modules (Paoli et al., 2008)
In order to keep a system diagram from getting too complex, sub-systems are shown as
boxes. Another system diagram is drawn for each sub-system where the details are
shown. The system diagram of the Wafer Production sub-system is shown in Figure 13.
Quartz /sand is shown as a non-renewable storage which is mined to provide the silicon

50
raw material for the wafers. The final product of this system is shown on the right as
silicon wafers which is also the product of Wafer Production sub-system of Figure 12.
Figure 13 System Diagram for Production of PV silicon wafers (Paoli et al., 2008)
2.2.2 Emergy Evaluation Table
Table 15 shows the Emergy evaluation table for production of silicon wafers according to
the system diagram shown in Figure 13 (Paoli et al., 2008).
Column-C lists all the inputs that go into the process, and Column-B gives the source
of the inputs:
o Sun light is a free renewable input, so it is 100%R;
o Quartz /silica sand is a free non-renewable input, so it is 100%N;
o Coke, charcoal, etc. are purchased outright from the main economy, so 100%F;
Column-D gives the ‘Quantity per panel’ of each input used in the production of one
panel.
Column-E gives the ‘Transformity’ of each input. Transformity values may be
available from past work in the literature; otherwise they have to be estimated or
calculated.
Column-F is the ‘Emergy per panel’ calculated as the product of D x E.

51
Column-G is the ‘Empower per panel’. This is the Emergy per panel per year. The
lifetime of the panels is 20 years, so this is F / 20.
Column-H is the ‘Empower per plant”. The plant consists of 215 panels, so this is G x
215.
Table 15 Emergy Evaluation Table for SPV Wafer Production Sub-system (Paoli et al., 2008)
A B C D E F G H
ITEM QUANTITY PER PANEL
TRANSFORMITY (sej / unit of
quantity)
EMERGY PER PANEL
(sej / panel)
EMPOWER PER PANEL (sej / panel
/year)
EMPOWER PER PLANT (sej / plant
/year)
T0 100%R Sun 6.58E+10 1 6.58E+10 3.29E+09 7.08E+11
1 100%N Quartz/
silica sand
2.84E+03 1.00E+09 2.84E+12 1.42E+11 3.06E+13
2 100%F Coke 1.11E+07 4.00E+04 4.43E+11 2.22E+10 4.76E+12
3 100%F Charcoal 2.41E+07 1.06E+05 2.56E+12 1.28E+11 2.75E+13
4 100%F Graphite 1.30E+02 3.15E+09 4.09E+11 2.04E+10 4.39E+12
6 100%F Poly-
ethylene
6.36E−01 5.87E+09 3.73E+09 1.87E+08 4.01E+10
7 100%F HCl 5.99E+02 3.64E+09 2.18E+12 1.09E+11 2.34E+13
8 100%F NaOH 5.80E+00 1.90E+09 1.10E+10 5.51E+08 1.18E+11
9 100%F H2 SO4 4.30E+00 3.64E+09 1.57E+10 7.83E+08 1.68E+11
10 100%F POCl3 6.00E−02 1.01E+09 6.06E+07 3.03E+06 6.51E+08
11 100%F HF 1.10E+00 9.89E+08 1.09E+09 5.44E+07 1.17E+10
12 100%F CF4 7.00E−02 1.01E+09 7.07E+07 3.54E+06 7.60E+08
13 100%F Ag/Al
paste
6.00E−01 1.69E+10 1.01E+10 5.07E+08 1.09E+11
14 100%F Natural
gas
1.22E+08 4.80E+04 5.84E+12 2.92E+11 6.28E+13
15 100%F Electricity 7.49E+08 1.74E+05 1.30E+14 6.51E+12 1.40E+15
T1 TOTAL 1.57E+15
Note: Numbers in this study are given in the scientific notation. 6.58E+05 = 6.58 x 105 = 658,000
2.2.3 Performance Indicators
Performance indicators are calculated from the Emergy flows of the systems diagram
shown in Figure 14. Emergy flows are grouped under:
N free non-renewable resource EMERGY from local environment; e.g. coal, natural gas.

52
R free renewable EMERGY of environmental inputs, e.g. sun, wind, rain.
F is the purchased goods and services, e.g. human services, machinery, fertilizers.
Y is the yield from the production process, e.g. electricity, heat.
Figure 14 Systems Diagram with Flows used in Performance Indicator Ratios (Brown & Ulgiati, 2004)
The key performance indicators are derived from the flows according to the following
equations:
Yield: Y = R + N + F
% Renewable Energy: %REN = R / Y
Emergy Yield Ratio: EYR = Y / F
Environmental Loading Ratio: ELR = (F + N) / R
Emergy Index of Sustainability: EIS = EYR / ELR
The performance indicators allow us to evaluate and compare the overall sustainability
of the various energy supply options (Brown & Ulgiati, 1997).
Percent Renewable Emergy: %REN
%REN is the ratio of renewable energy to total energy used by the production process,
and indicates the sustainability of the process. %REN is an indicator that relates
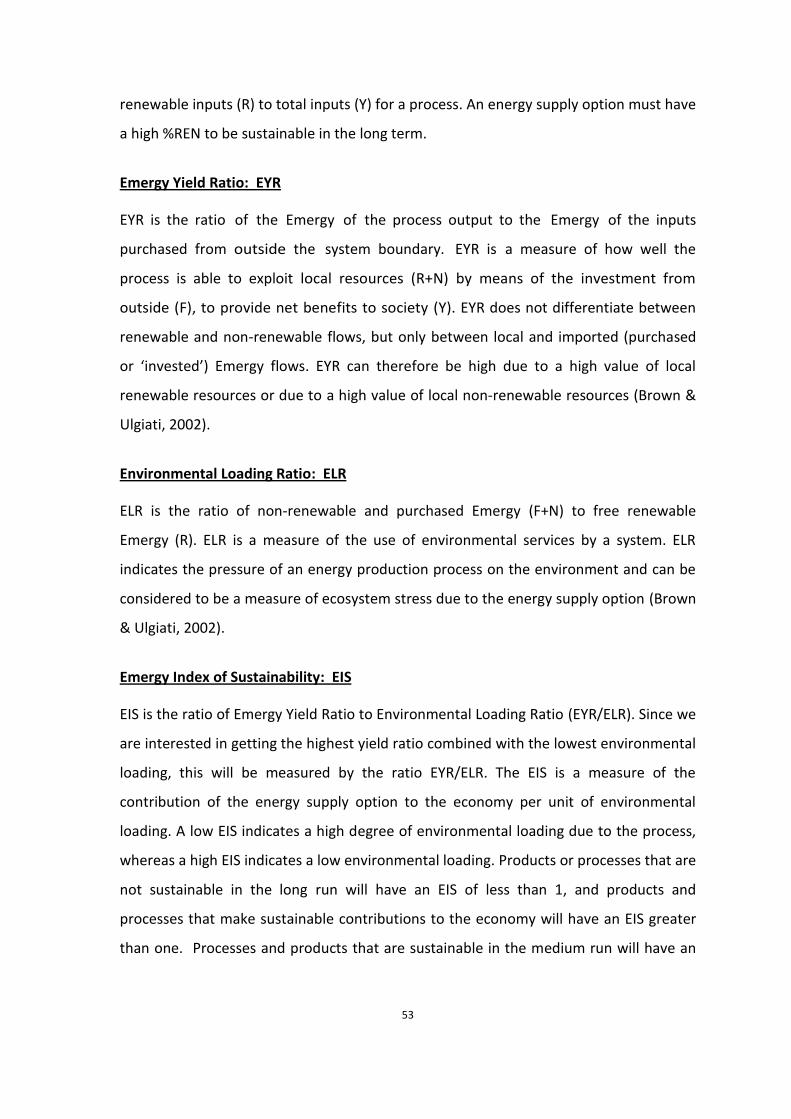
53
renewable inputs (R) to total inputs (Y) for a process. An energy supply option must have
a high %REN to be sustainable in the long term.
Emergy Yield Ratio: EYR
EYR is the ratio of the Emergy of the process output to the Emergy of the inputs
purchased from outside the system boundary. EYR is a measure of how well the
process is able to exploit local resources (R+N) by means of the investment from
outside (F), to provide net benefits to society (Y). EYR does not differentiate between
renewable and non-renewable flows, but only between local and imported (purchased
or ‘invested’) Emergy flows. EYR can therefore be high due to a high value of local
renewable resources or due to a high value of local non-renewable resources (Brown &
Ulgiati, 2002).
Environmental Loading Ratio: ELR
ELR is the ratio of non-renewable and purchased Emergy (F+N) to free renewable
Emergy (R). ELR is a measure of the use of environmental services by a system. ELR
indicates the pressure of an energy production process on the environment and can be
considered to be a measure of ecosystem stress due to the energy supply option (Brown
& Ulgiati, 2002).
Emergy Index of Sustainability: EIS
EIS is the ratio of Emergy Yield Ratio to Environmental Loading Ratio (EYR/ELR). Since we
are interested in getting the highest yield ratio combined with the lowest environmental
loading, this will be measured by the ratio EYR/ELR. The EIS is a measure of the
contribution of the energy supply option to the economy per unit of environmental
loading. A low EIS indicates a high degree of environmental loading due to the process,
whereas a high EIS indicates a low environmental loading. Products or processes that are
not sustainable in the long run will have an EIS of less than 1, and products and
processes that make sustainable contributions to the economy will have an EIS greater
than one. Processes and products that are sustainable in the medium run will have an

54
EIS between 1.0 and 5.0, and an EIS greater than 5.0 indicates long range sustainability
(Brown & Ulgiati, 2002).
Solar Energy for Heat and Electricity
This example illustrates the use of emergy performance indicators by Paoli et al. (2008)
for comparing solar thermal collectors for heating water with solar photovoltaics panels
for producing electricity. They have also compared the transformities of solar energy
with fossil fuels for producing heat and electricity.
Paoli et al. found that the Emergy Yield Ratio (EYR) for Solar Thermal (1.19) is only a little
more than the EYR for Solar Photovoltaic (1.03) (Table 16). However, the Environmental
Loading Ratio (ELR) for Solar Photovoltaic (48.93) is nearly nine times the ELR for Solar
Thermal (5.54). Consequently, the Emergy Index of Sustainability (EIS) for Solar Thermal
(0.21) is ten times the EIS for Solar Photovoltaic (0.02). It should be noted that the
quality of energy is different for heat and electricity and this is shown by the
Transformity of electricity produced by Solar Photovoltaic panels (8.92E+04) which is
more than four times the transformity of heat produced by Solar Thermal collectors
(1.58E+04) (Table 15)(Paoli et al., 2008).
Table 16 Emergy Performance Indicators for Solar Thermal and Photo Voltaic Technologies (Paoli et al., 2008)
INDICATOR
SOLAR
THERMAL
(for heat)
SOLAR
PHOTOVOLTAIC
(for electricity)
%REN 0.15 0.02
EYR 1.19 1.03
ELR 5.54 48.93
EIS 0.21 0.02
Transformity (sej/J) 15,800
(Heat)
89,200
(Electricity)
Paoli et al. have also compared the transformities of solar energy with fossil fuels for
both heat and electricity (Table 17). Both solar technologies are more efficient than their

55
fossil fuel alternatives. Solar heating is three times more efficient than methane, while
solar electricity is nearly twice as efficient as coal thermal.
Table 17 Transformity (sej/J) of Solar and Fossil Fuel technologies for Heat and Electricity (Paoli et al., 2008)
SOLAR
technologies
FOSSIL FUEL
technologies
HEAT 15,800 48,000 (methane)
ELECTRICITY 89,200 170,000 (coal thermal)
2.3 EMBODIED ENERGY ANALYSIS
Emergy Analysis does not calculate the Net Energy, also called Energy Return on Energy
Invested (EROEI), which is one of the important indicators for evaluating the
sustainability of biodiesel or any other energy supply option. EROEI is derived from the
quantity of commercial energy inputs that are required, directly or indirectly, during the
entire biodiesel production process, including the agricultural and industrial phases. The
environmental accounting method used to determine the EROEI is called the Embodied
Energy Analysis (EEA) which looks at the gross energy requirement of the analysed
system.
While applying the EEA method, the IFIAS17 convention is followed in which only non-
renewable (fossil) fuels are counted directly, whereas renewable inputs and free
environmental inputs such as rain, topsoil, etc. are not counted. Since Emergy Analysis
counts all inputs including direct renewables and free environmental services, the EEA
complements the Emergy Analysis by providing additional performance indicators that
give further insights into the sustainability of the analyzed process.
17 International Federation of Institutes for Advanced Study

56
Embodied Energy Calculation
EEA accounts for the commercial energy required directly or indirectly to provide all the
inputs (goods and services) for the entire biodiesel production process (Brown &
Herendeen, 1996; Cavalett & Ortega, 2010).
In the EEA method, all materials and energy inputs used in the biodiesel production
process are multiplied by their own individual oil equivalent factors (in kg oil equivalent
per unit) to give the oil equivalent of each input (in kgs oil equivalent). The oil
equivalents of all the inputs are summed up to give the Total Embodied Energy that is
required to produce biodiesel (in kgs oil equivalent). The Total Embodied Energy is then
multiplied by the standard calorific value of oil fuel (4.186E+07 Joules per kg) to give the
Gross Energy Requirement (GER) to produce one kg of biodiesel (in Joules per kg
biodiesel). The energy content of one kg of biodiesel produced (in Joules per kg
biodiesel) is divided by the GER to give the Energy Return on Energy Invested (EROEI).
The EROEI is therefore a number that gives the Joules of biodiesel produced for every
one Joule of gross energy required by the production process.
Carbon Dioxide Emissions
The carbon dioxide (CO2) emissions during the production of biodiesel are estimated by
multiplying the Total Embodied Energy of biodiesel (in kg oil equivalent) by the
stoichiometric CO2 emissions of petroleum oil (3.2 kg CO2 per kg oil).

57
3 RESULTS
3.1 EMERGY ANALYSIS
Emergy Analysis has been carried out for the production of Coconut Biodiesel. The
biodiesel can be used as a fuel in standard diesel generating sets instead of the
petroleum diesel that is normally used on the islands. Performance Indicators of
biodiesel, based on the Emergy analysis, are then used to determine its sustainability in
a holistic manner.
3.1.1 Data for Emergy Analysis
The production chain for biodiesel production from coconuts is shown in Figure 15. The
main steps are:
1. Production of Mature Coconuts
2. Production of Copra from Mature Coconuts (by drying the kernel)
3. Production of Coconut Oil from Copra (by expelling oil and refining crude oil)
4. Production of Biodiesel from Coconut Oil (by esterification process).
Step #1 is the agricultural phase, and Steps #2, #3 and #4 are the industrial phase.
Financial data for these four steps in the production of coconut biodiesel is given in the
Appendix:
Break-down of costs and returns are given in Tables 28 to 31, and Figures 20
to 23.
Net profits are given in Table 32, and Figures 24 and 25.
Value added by intermediate products are given in Table 33, and Figures 26
and 27.

58
Figure 15 Production Chain for Coconut Biodiesel
MATURE COCONUT
DEHUSKED COCONUT
67% of mature nut
COCONUT HUSK
33% of mature nut
COPRA
33% of dehusked nut
COCONUT SHELL
22.4% of dehusked nut
CRUDE COCONUT OIL
61.5% of copra
COPRA MEAL
32% of copra
FATTY ACID
4.9% of crude oil
GLYCERIN
12.5% of refined oil
ACID OIL
0.55% of refined oil
BIODIESEL – CME
100% of refined oil
REFINED COCONUT
OIL
92.5% of crude oil

59
3.1.2 Emergy System Diagram
The system diagram for production of coconut biodiesel is shown in Figure 16.
Figure 16 Emergy System Diagram for Production of Coconut Biodiesel
The symbols in the system diagram are:
1. Big Rectangular Box (thick line) defines the system boundary.
2. Small Rectangular Boxes show Conversion processes within the system such as
Copra Production, Oil Extraction and Biodiesel Conversion.
3. Circles show all external inputs coming into the system from outside the system
boundary (both renewable and non-renewable).
4. Tanks show storages within the system such as Soil, Material Assets, Financial
Assets ($).
5. Bullet shows a production process, in this case production of coconuts.
6. Solid Lines with Arrowheads show the flow of materials.
7. Dashed Lines with Arrowheads show the flow of money ($).
8. Solid Lines with Arrowheads emerging on the right side show of the system
boundary are the outputs of the system.
9. Diamonds show financial transactions for purchase of materials, labour and
services.

60
Goods & Machinery goes into the storage Assets from where it is used for the various
operations. Assets also has the money storage marked $ which is used to store revenues
from sales and to pay for Labour and Services.
There are four main processes in the production of biodiesel:
1. Coconut Production - including harvesting of mature coconuts.
2. Copra Production – to dry the coconut kernel.
3. Oil Extraction – to produce refined coconut oil from copra.
4. Biodiesel Conversion – to produce biodiesel from coconut oil by the esterification
process.
For coconut production, the main renewable inputs are shown on the left of the
diagram:
1. Sun - provides solar radiation for photosynthesis.
2. Wind - helps in evapo-transpiration.
3. Rain - provides water for the coconut palms. Some rain is evapo-transpired by the plants
while the remainder goes as surface runoff.
4. Geological Processes - provide the soil for the plants to grow.
In addition, the coconut plantation needs the following non-renewable inputs:
1. Fuels and Fertilizer - for plant nutrition and for harvesting the coconuts.
2. Goods and Machinery - for cultivation and for harvesting.
3. Labour and Services - to carry out the required tasks.
The Copra Production, Oil Extraction and Biodiesel Conversion processes require only
non-renewable inputs:
1. Fuels.
2. Goods and Machinery.
3. Labour and Services.

61
3.1.3 Emergy Evaluation Table
The Emergy Evaluation Table given below (Table 18) has been prepared according to the
methodology given in Section 2.2.2.
Table 18 Emergy Analysis for Biodiesel Production from Coconuts
# ITEM UNITS AMOUNT
(ha-1 yr-1)18
SPECIFIC
EMERGY
(seJ unit-1)
REF. FOR
SPECIFIC
EMERGY
EMERGY
(seJ ha-1 yr-1)
COCONUT PRODUCTION
Renewable inputs
1 Sunlight J 7.19E+13 1.00E+00 [1] 7.19E+13
2 Rain water (chemical potential) J 6.48E+10 3.06E+04 [2] 1.98E+15
3 Earth cycle J 3.00E+10 1.02E+04 [2] 3.06E+14
Non-renewable inputs
4 Organic matter in topsoil used up J 2.53E+10 1.24E+05 [2] 3.14E+15
5 Fertilizer g 2.15E+05 6.38E+09 [2] 1.37E+15
6 Pesticides g 3.58E+04 2.49E+10 [3] 8.92E+14
7 Diesel J 6.67E+09 1.11E+05 [4] 7.40E+14
8 Steel for Agricultural machinery g 1.36E+04 1.13E+10 [3] 1.54E+14
9 Human labour years 1.21E-01 6.32E+16 [5] 7.62E+15
10 Annual services US$ 2.44E+02 5.26E+12 [5] 1.29E+15
Products and by-products
11 Coconuts produced kg 2.19E+04 8.03E+11 [6] 1.76E+16
J 2.45E+11 7.17E+04 [6] 1.76E+16
COCONUT TRANSPORT
Non-renewable inputs
12 Steel for machinery kg 1.53E+01 1.13E+13 [4] 1.73E+14
13 Diesel J 1.46E+09 1.11E+05 [4] 1.62E+14
14 Labour yrs 3.98E-03 1.07E+16 [4] 4.26E+13
15 Annual services USD 1.80E+01 5.26E+12 [6] 9.46E+13
Products and by-products
16 Coconuts transported kg 2.19E+04 8.25E+11 [6] 1.80E+16
J 2.45E+11 7.36E+04 [6] 1.80E+16
COPRA PRODUCTION and OIL EXTRACTION
Non-renewable inputs
17 Steel for machinery kg 3.65E-01 1.13E+13 [4] 4.13E+12
18 Cement in plant construction kg 3.55E-01 3.47E+12 [4] 1.23E+12
19 Iron in plant construction kg 1.45E-02 1.13E+13 [4] 1.64E+11
20 Diesel J 2.89E+09 1.11E+05 [4] 3.21E+14
21 Electricity J 3.92E+08 2.77E+05 [7] 1.09E+14
22 Process and cooling water J 1.30E+07 4.28E+05 [8] 5.56E+12
23 Chemicals kg 7.00E+00 6.08E+12 [7] 4.26E+13
18
Numbers in this study are given in the scientific notation; e.g. 6.58E+05 = 6.58 x 105 = 658,000

62
# ITEM UNITS AMOUNT
(ha-1 yr-1)18
SPECIFIC
EMERGY
(seJ unit-1)
REF. FOR
SPECIFIC
EMERGY
EMERGY
(seJ ha-1 yr-1)
24 Labour yrs 3.82E-04 1.07E+16 [4] 4.09E+12
25 Annual services USD 2.11E+02 5.26E+12 [6] 1.11E+15
Products and by-products
26 Oil kg 2.26E+03 8.68E+12 [9] 1.96E+16
J 8.52E+10 2.30E+05 [9] 1.96E+16
27 Oil Cake kg 1.39E+03
J 2.17E+10
BIODIESEL CONVERSION
Non-renewable inputs
28 Steel for machinery kg 5.19E+00 1.13E+13 [4] 5.87E+13
29 Cement in plant construction kg 1.51E+00 3.47E+12 [4] 5.22E+12
30 Iron in plant construction kg 3.13E-02 1.13E+13 [4] 3.53E+11
31 Diesel J 5.42E+09 1.11E+05 [4] 6.01E+14
32 Methanol J 6.79E+09 1.89E+05 [6] 1.28E+15
33 Catalyst kg 2.42E+01 2.48E+13 [4] 5.99E+14
34 Electricity J 7.19E+06 2.77E+05 [7] 1.99E+12
35 Water J 5.73E+06 4.28E+05 [10] 2.45E+12
36 Labour yrs 7.99E-04 1.07E+16 [4] 8.55E+12
37 Annual services USD 7.10E+01 5.26E+12 [6] 3.73E+14
Products and by-products
38 Biodiesel kg 2.66E+03 8.48E+12 [9] 2.26E+16
J 8.52E+10 2.65E+05 [9] 2.26E+16
39 Glycerin kg 1.96E+02
40 Soap stock kg 1.21E+02
BIODIESEL TRANSPORT
Non-renewable inputs
41 Steel for machinery kg 1.86E+00 1.13E+13 [4] 2.11E+13
42 Diesel J 1.78E+08 1.11E+05 [4] 1.97E+13
43 Labour yrs 4.84E-04 1.07E+16 [4] 5.18E+12
44 Annual services USD 2.19E+00 5.26E+12 [6] 1.15E+13
Products and by-products
45 Biodiesel produced kg 2.66E+03 8.50E+12 [9] 2.26E+16
J 8.52E+10 2.65E+05 [9] 2.26E+16
References for Specific Emergy:
[1] Definition.
[2] Bargigli & Ulgiati (2003).
[3] Lapp (1991).
[4] Brown & Ulgiati (2004).
[5] Ulgiati (2003)
[6] Cavalett & Ortega (2010).
[7] Odum (1996).
[8] Bastianoni et al.. (2001).
[9] Calculated by author.
[10] Bastianoni & Marchettini (2000).
Notes for Table 18
1. Item#1: Transformity of Sunlight = 1 by definition. Global solar insolation incident on a
horizontal surface for Fiji (Latitude 18 deg S, Longitude 175 deg E) = 5.47 kWh/m^2/day (NASA,

63
2014). Albedo of coconut palm plantations taken equal to oil palm plantations = 8.8% (Caiazzo et
al., 2014). Annual energy of Sunlight = (Average total annual insolation kWh/m^2/day)(365
days/yr)(3.6E6 J/kWh)(1E4 m2/ha)(1 – albedo) = (5.47 kWh/m^2/day)(365 days/yr)(3.6E6
J/kWh)(1E4 m2/ha)(1 – 0.088) = 7.19E13 J/ha/yr.
2. Item#2: Rain, chemical potential energy = (area)(rainfall)(% evapotrans)(Gibbs free energy) =
(10,000 m2/ha)(2.62 m)(0.50)(1000 kg/m
3)(4.94E+3 J/kg) = 6.48E10 J/ha/yr.
3. Item#3: Transformity for organic soil 7.38 E4 sej/J (Odum, 1996) corrected by factor of 1.68
(Odum et al., 2000). Soil erosion rate in mature coconut palm plantation taken equal to mature oil
palm plantations, estimated at 28 tons/ha/yr (Hartemink, 2006) with 0.04% organics in soil. The
energy content in organic soil is 5.4 kcal/g (Ulgiati et al., 1992). The energy of soil used =
(area)(erosion rate)(% organic)(5.4 kcal/g)(4186 J/kcal) = (10,000 m2/ha)(28,000
kg/ha/yr)(0.04)(5.4)(4186) =2.53E10 J/ha/yr.
4. Item#5-10: Non-renewable inputs for ‘Coconut Production’ (Items 5-10) have been derived from
values given in Tables 28 – 33.
5. Item#11, 16: Energy Contents of Whole Coconut = 11.2 MJ/kg coconut (after Raghavan, 2010).
6. Item#12-15: Weight of Coconuts transported to Oil Mill has been estimated from the quantity of
copra (dried coconut kernel): Average weight of one mature coconut = 1.2 kg which gives 0.2 kg
of dried copra (Raghavan 2010). Weight of mature coconuts transported = (1.2/0.2) = 6 x Weight
of copra processed = 6 x (2,260/62%) = 21,871 kgs/ha. Average distance for Round Trip = 300
kms (from field work).
7. Item#17-25: Non-renewable inputs for ‘Oil Extraction’ have been derived from values given in
Cavalett & Ortega (2010) for production of oil from soya bean, since the same Oil Mill can be
used for both oil seeds. However, the capacities of the Oil Mill for processing coconuts from a 1
hectare plantation have been determined by taking the following multiplication factors:
Soya Oil extraction = 18% of oil seed (Cavalett & Ortega, 2010);
Coconut Oil extraction = 62% of copra (Tinytech, 2014);
Scale-up Ratio for Oil Mill capacity: kgs Copra / kgs Soybean
= (2,260/510)/(62%/18%) = 1.29
8. Item#26: Energy Content of Coconut Oil = 37.7 MJ/kg (Raghavan, 2010).
9. Item#27: Energy Content of Oil Cake = 15.7 MJ/kg (Raghavan, 2010).
10. Item#28-45: Non-renewable inputs for ‘Biodiesel Conversion’ and ‘Biodiesel Transport’ have
been derived from values given in Cavalett & Ortega (2010) for production of biodiesel from
soybean, since the same Biodiesel Plant can be used for esterification of both soybean oil and
coconut oil. However, the capacities of the Biodiesel Plant for processing coconuts from a 1
hectare plantation have been determined by taking the following multiplication factors:
Soya Oil from 1 ha = 510 kgs (Cavalett & Ortega, 2010);
Coconut Oil from 1 ha = 2,260 kgs (Uriarte, 2010);
Scale-up Ratio for Biodiesel Plant capacity: Coconut Oil / Soybean Oil
= 2,260/510 = 4.44.
11. Item#10, 15, 25, 37, 44 (Specific Emergy for Annual Services): Emergy/Money Ratio has been
calculated according to the method of Odum (1996). Emergy/ Money Ratio for Fiji in 1983 =
1.49E13 sej/$, taken equal to Dominica, a Small Island Developing State with a similar level of
development (Odum, 1996). GDP of Fiji in 1983 = 1.12E9 US$/yr, GDP in 2010 = 3.17E9 $/yr
(http://www.indexmundi.com/facts/fiji/gdp). Fiji’s Oil Imports in 2010 = 6.36E8 $/yr
(International Monetary Fund, 2010). Emergy/ Money Ratio for Fiji in 2010 = (1.49E13 x 1.12E9
+ 6.36E8) / 3.17E9 = 5.26E12 sej/$.
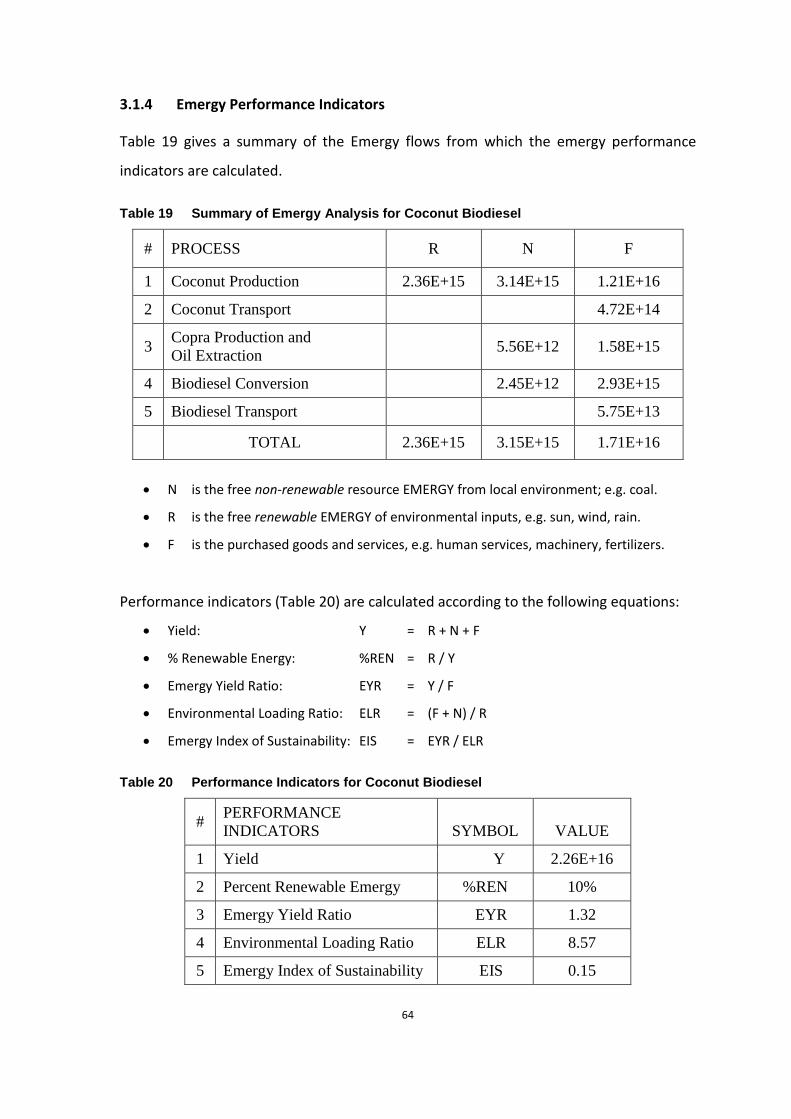
64
3.1.4 Emergy Performance Indicators
Table 19 gives a summary of the Emergy flows from which the emergy performance
indicators are calculated.
Table 19 Summary of Emergy Analysis for Coconut Biodiesel
# PROCESS R N F
1 Coconut Production 2.36E+15 3.14E+15 1.21E+16
2 Coconut Transport
4.72E+14
3 Copra Production and
Oil Extraction 5.56E+12 1.58E+15
4 Biodiesel Conversion
2.45E+12 2.93E+15
5 Biodiesel Transport
5.75E+13
TOTAL 2.36E+15 3.15E+15 1.71E+16
N is the free non-renewable resource EMERGY from local environment; e.g. coal.
R is the free renewable EMERGY of environmental inputs, e.g. sun, wind, rain.
F is the purchased goods and services, e.g. human services, machinery, fertilizers.
Performance indicators (Table 20) are calculated according to the following equations:
Yield: Y = R + N + F
% Renewable Energy: %REN = R / Y
Emergy Yield Ratio: EYR = Y / F
Environmental Loading Ratio: ELR = (F + N) / R
Emergy Index of Sustainability: EIS = EYR / ELR
Table 20 Performance Indicators for Coconut Biodiesel
# PERFORMANCE
INDICATORS SYMBOL VALUE
1 Yield Y 2.26E+16
2 Percent Renewable Emergy %REN 10%
3 Emergy Yield Ratio EYR 1.32
4 Environmental Loading Ratio ELR 8.57
5 Emergy Index of Sustainability EIS 0.15

65
3.2 EMBODIED ENERGY ANALYSIS
Embodied Energy Analysis (EEA) has been carried out according to the methodology
explained in Section 2.3. Commercial energy required directly or indirectly for making
goods or services are accounted for as fossil oil equivalent. Human labour, services and
free environmental resources (rain, topsoil, etc.) are not accounted for in the EEA (Table
21).
Table 21 Embodied Energy Analysis for Biodiesel Production from Coconuts
# ITEM UNITS
AMOUNT (unit ha-1
yr-1)19
OIL EQUIV. PER UNIT
(kg oil
unit-1)
REF. FOR
OIL
EQUIV.
EMBODIED ENERGY
(kg Oil
Equivalent)
EMBODIED
ENERGY (Joules)
CARBON
DIOXIDE
EMISSIONS
(kg CO2)
COCONUT PRODUCTION
Renewable inputs
1 Sunlight J 7.19E+13
2 Rain water J 6.48E+10
3 Earth cycle J 3.00E+10
Non-renewable inputs
4 Topsoil used up J 2.53E+10
5 Fertilizer kg 2.15E+02 1.77 [1] 3.81E+02 1.64E+10 1.22E+03
6 Pesticides kg 3.58E+01 1.27 [1] 4.55E+01 1.96E+09 1.46E+02
7 Diesel kg 1.55E+02 1.10 [1] 1.70E+02 7.34E+09 5.45E+02
8 Steel kg 1.36E+01 1.65 [1] 2.24E+01 9.67E+08 7.18E+01
9 Human labour yrs 1.21E-01
10 Annual services US$ 2.44E+02
Products and by-products
11 Coconuts produced kg 2.19E+04
J 2.45E+11
COCONUT TRANSPORT
Non-renewable inputs
12 Steel kg 1.53E+01 1.65 [1] 2.52E+01 1.09E+09 8.07E+01
13 Diesel kg 3.38E+01 1.10 [1] 3.72E+01 1.60E+09 1.19E+02
14 Labour yrs 3.98E-03
15 Annual services USD 1.80E+01
Products and by-products
16 Coconuts
transported
kg 2.19E+04
J 2.45E+11
COPRA PRODUCTION and OIL EXTRACTION
Non-renewable inputs
17 Steel kg 3.65E-01 1.65 [1] 6.03E-01 2.60E+07 1.93E+00
18 Cement kg 3.55E-01 0.07 [1] 2.49E-02 1.07E+06 7.95E-02
19 Iron kg 1.45E-02 0.02 [2] 2.91E-04 1.25E+04 9.30E-04
19
Numbers in this study are given in the scientific notation; e.g., 6.58E+05 = 6.58 x 105 = 658,000

66
# ITEM UNITS
AMOUNT (unit ha-1
yr-1)19
OIL EQUIV.
PER UNIT
(kg oil
unit-1)
REF.
FOR
OIL EQUIV.
EMBODIED
ENERGY
(kg Oil
Equivalent)
EMBODIED
ENERGY (Joules)
CARBON DIOXIDE
EMISSIONS
(kg CO2)
20 Diesel kg 6.72E+01 1.10 [1] 7.39E+01 3.18E+09 2.36E+02
21 Electricity J 3.92E+08 7.17E-08 [1] 2.81E+01 1.21E+09 9.00E+01
22 Water kg 2.63E+03 1.43E-04 [3] 3.76E-01 1.62E+07 1.20E+00
23 Chemicals kg 7.00E+00 1.27 [1] 8.89E+00 3.83E+08 2.84E+01
24 Labour yrs 3.82E-04
25 Annual services USD 2.11E+02
Products and by-products
26 Oil kg 2.26E+03
J 8.52E+10
27 Oil Cake kg 1.39E+03
J 2.17E+10
BIODIESEL CONVERSION
Non-renewable inputs
28 Steel kg 5.19E+00 1.65 [1] 8.57E+00 3.69E+08 2.74E+01
29 Cement kg 1.51E+00 0.07 [1] 1.05E-01 4.54E+06 3.37E-01
30 Iron kg 3.13E-02 0.02 [2] 6.25E-04 2.69E+04 2.00E-03
31 Diesel kg 1.26E+02 1.10 [1] 1.38E+02 5.96E+09 4.42E+02
32 Methanol kg 3.45E+02 0.60 [4] 2.07E+02 8.92E+09 6.62E+02
33 Catalyst kg 2.42E+01 n.a.
34 Electricity J 7.19E+06 7.17E-08 [1] 5.16E-01 2.22E+07 1.65E+00
35 Water kg 1.16E+03 1.43E-04 [3] 1.66E-01 7.15E+06 5.31E-01
36 Labour yrs 7.99E-04
37 Annual services USD 7.10E+01
Products and by-products
38 Biodiesel kg 2.66E+03
J 8.52E+10
39 Glycerin kg 1.96E+02
40 Soap stock kg 1.21E+02
BIODIESEL TRANSPORT
Non-renewable inputs
41 Steel kg 1.86E+00 1.65 [1] 3.08E+00 1.33E+08 9.85E+00
42 Diesel kg 4.12E+00 1.10 [1] 4.53E+00 1.95E+08 1.45E+01
43 Labour yrs 4.84E-04
44 Annual services USD 2.19E+00
Products and by-products
45 Biodiesel produced kg 2.66E+03 0.43 [5] 1.15E+03 4.94E+10 3.67E+03
J 8.52E+10
TOTAL
1.15E+03 4.94E+10 3.67E+03
References for Oil Equivalent:
[1] Biondi et al. (1989); taken from
Cavalett and Ortega (2010).
[2] Boustead and Hancock (1979).
[3] Smil (1991).
[4] Ulgiati (2001).
[5] Calculated by author.

67
3.2.1 Embodied Energy Performance Indicators
Embodied Energy of Biodiesel
For producing coconut biodiesel:
Total Embodied Energy Demand = 1.15E+03 kg Oil Equivalent;
Quantity of Biodiesel produced = 2.66 E+03 kgs;
Embodied Energy of Biodiesel = 1.15E3 / 2.66E3
= 0.43 kg Oil Equivalent / kg Biodiesel;
Energy Return on Energy Invested (EROEI)
In the agricultural and industrial phases of the biodiesel production process, fossil oil is
used directly as diesel fuel or indirectly the oil goes into producing the other inputs such
as electricity, fertiliser, methanol, steel, cement, etc. The total energy invested is
calculated by the Embodied Energy Analysis as 1.15E+03 kg oil equivalent per hectare.
The returns from one hectare are 2,660 kgs of biodiesel and 1,390 kgs of oil cake.20 The
Energy Return on Energy Invested (EROEI) has been calculated as follows:
Energy Return:
Energy content of 2,660 kgs of biodiesel = 2,660 x 37.8 MJ/kg = 1.01E11 J
Energy content of 1,390 kgs of oil cake = 1,390 x 15.7 MJ/kg = 2.17E10 J
Total energy content of products = 1.22E11 J
Energy Invested:
Energy content of 1.15E3 kg oil equivalent = 1.15E3 x 4.31E7 = 4.94E10 J
Energy Return on Energy Invested = 1.22E11 / 4.94E10 = 2.47
Carbon Dioxide Emissions
Total CO2 Emissions = 3.67E+03 kgs CO2 / ha;
Quantity of Biodiesel produced = 2.66 E+03 kgs;
20 Large scale biodiesel production has led to the over production of glycerin that has lowered its market
value to a level that it can be considered as an industrial waste (Cavalett & Ortega, 2010). Therefore, it has not been considered as a co-product.

68
Specific CO2 Emission = 3.67E3 / 2.66E3
= 1.38 kg CO2 / kg biodiesel.
= 36 g CO2 / MJ biodiesel.
3.3 SUMMARY OF RESULTS
To analyse the sustainability of coconut biodiesel in a holistic manner, two different
Environmental Accounting methods have been used: i) Emergy Analysis and
ii) Embodied Energy Analysis.
Emergy Analysis gives the following results:
1. Transformity of coconut biodiesel is 2.65E+05 sej/J, of which 37% is from diesel fuel
and another 37% from fertilizer and pesticides.
2. Percent Renewable Energy is 10%, so 90% is from non-renewable energy sources.
3. Emergy Yield Ratio is 1.32, indicating a low ability to exploit local resources
efficiently.
4. Environmental Loading Ratio is 8.57, implying that biodiesel production causes
significant environmental or ecosystem stress.
5. Emergy Index of Sustainability is 0.15, indicating a low contribution to the economy
per unit of environmental loading and a very high degree of environmental stress per
unit of emergy yield.
Embodied Energy Analysis gives the following results:
1. Energy Returned on Energy Invested is 2.47, which means that it is not worth the
effort in energetic terms.
2. Carbon dioxide Emissions due to the direct and indirect use of fossil fuels during the
production of coconut biodiesel is 1.38 kg CO2 per kg biodiesel or 36 g CO2 per MJ of
energy delivered, showing that biodiesel is not a carbon neutral fuel.
3. To produce biodiesel without using fossil fuels, an additional 68% biodiesel has to be
produced which will be used to substitute fossil fuels for the production process.

69
4 DISCUSSION AND CONCLUSIONS
This thesis has presented information on the alternatives Pacific Island Countries have
with respect to energy technologies, and has provided and demonstrated an approach
for analysing the potential of a specific energy source — coconut biodiesel — for
replacing expensive and unsustainable fossil fuels.
4.1 EMERGY ANALYSIS
4.1.1 Transformity
The transformity of a fuel is a useful yardstick for choosing the better alternative. If the
transformity of a fuel is lower, that means that the total amount of solar energy in sej
(solar emjoules) that went into the fuel is less and therefore the process of producing
the fuel in its final form is more efficient. The transformity of oil extracted from coconuts
is 2.30E+05 sej/J, whereas the transformity of biodiesel produced from the coconut oil is
greater, i.e. 2.65E+05 sej/J. The increase in transformity at each of the four main steps in
the production of coconut biodiesel is given in Table 22, in comparison with soybean
biodiesel. The share of additional transformity attributed to each process is shown in
Figure 17.
Table 22 Transformity Increase at each Stage of Biodiesel Production
(Source: a) Calculated by author; b) Cavalett and Ortega, 2010)
a) Coconut biodiesel b) Soybean Biodiesel
# Process
Additional
Transformity
(sej/J)
% of
Total
Additional
Transformity
(sej/J)
% of
Total
1 Crop Production:
Coconut / Soybean 7.17E+04 27% 1.01E+05 26%
2 Oil Extraction 1.57E+05 59% 2.39E+05 61%
3 Biodiesel Conversion 3.43E+04 13% 4.90E+04 13%
4 Transport 2.60E+03 1% 1.00E+03 0.3%
TOTAL 2.65E+05
3.90E+05

70
Figure 17 Transformity Increase at each Stage of Biodiesel Production
In the production of coconut biodiesel, oil extraction (including copra production)
contributes more than half the increased transformity. The agricultural phase, i.e.
production of coconuts, is the second highest. The biodiesel conversion process itself
contributes a modest increase in transformity while transportation contributes only 1%.
A comparison with production of biodiesel from soybeans (Table 22) shows almost the
same transformity increases from the four processes. This clearly indicates that nearly
three-quarters of the increase in transformity is due to the flows of Emergy that support
the industrial processes of copra production, oil extraction and biodiesel conversion; the
remaining one-quarter supports the agricultural phase.
In Table 23, the transformities of the most widely used fossils fuels and biofuels are
compared to that of coconut oil and biodiesel. The table also gives the key Emergy
Performance Indicators of these fuels.
The transformity of all biofuels are higher than fossil fuels such as coal (6.71E+04),
natural gas (8.05E+04), crude oil (9.06E+04), and motor fuels (1.11E+05) evaluated by
Odum (1996). This is because natural processes have taken millions of years to form
fossil fuels whereas all biofuels are grown by using a less efficient process of
Crop Production
Coconut, 27%
Oil Extraction, 59%
Biodiesel Conversion,
13%
Transport, 1%

71
photosynthesis over a very much shorter time period. The higher transformity of
biofuels is also because biofuel crops have a higher demand for direct and indirect
environmental support, and because of inputs to the industrial processes of copra
production, oil extraction and biodiesel conversion.
Table 23 Performance Indicators of Biofuels and Fossil Fuels (Sources: given below Table)
# ITEM TRANSFORMITY
(sej / J)21
EYR %REN ELR EIS
THIS STUDY
1 Coconut Oil 2.30E+05
2 Coconut biodiesel 2.65E+05 1.32 10% 8.57 0.15
FOSSIL FUELS
3 Coal 6.71E+04 10.5
4 Natural Gas 8.05E+04 10.3
5 Crude Oil 9.06E+04 3.2 - 11.1
6 Diesel, Gasoline 1.11E+05
BIOFUELS
7 Soybean Oil 3.40E+05
8 Sunflower Oil 2.78E+05
9 Sunflower Biodiesel 2.31E+05
10 Soybean Biodiesel 3.90E+05 1.62 30% 2.26 0.72
11 Rapeseed Biodiesel 1.36E+05 1.27 11% 8.23 0.15
12 Sugarcane Ethanol 7.07E+04 1.38 19% 4.30 0.32
13 Sugarcane Ethanol 1.86E+05
to 3.15E+05
14 Ethanol from Corn 1.89E+05
15 Ethanol from Wheat 9.19E+04 1.15 12% 7.05 0.16
16 Methanol from Willow 6.06E+04 1.11 10% 8.80 0.13
17 Biodiesel from Algae 5.04E+05 6.44 84% 0.18 35.0
18 Biogas from Algae 9.12E+04 3.66 67% 0.49 7.4
21
Numbers in this study are given in the scientific notation; e.g., 6.58E+05 = 6.58 x 105 = 658,000

72
Sources for Item#:
1. Calculated by author
2. Calculated by author
3. Odum, 1996; Odum et al., 200022
4. Odum, 1996; Odum et al., 200022
5. Odum, 1996; Odum et al., 2000 22
6. Odum, 1996; Odum et al., 2000 22
7. Cavalett & Ortega, 2010
8. Bastianoni et al.., 2008
9. Giampietro & Ulgiati, 2005
10. Cavalett & Ortega, 2010
11. Cavalett & Rydberg, 2010
12. Cavalett & Rydberg, 2010
13. Giampietro & Ulgiati, 2005
14. Giampietro & Ulgiati, 2005
15. Cavalett & Rydberg, 2010
16. Cavalett & Rydberg, 2010
17. Jarméus, 2013
18. Jarméus, 2013
The transformity of ethanol from various feedstocks (wheat, corn, sugarcane) varies
between 9.19E+04 and 3.15E+05. The transformity of coconut biodiesel calculated in
this study (2.65E+05) is higher than rapeseed biodiesel (1.36E+05)(Cavalett & Rydberg,
2010) and sunflower biodiesel (2.31E+05)(Giampietro & Ulgiati, 2005) but is lower than
soybean biodiesel (3.90E+05)(Cavalett & Ortega, 2010). The yield of coconut oil per
hectare is more than five times the yield of soybean oil (Table 24), so one can expect the
environmental support for one litre of coconut oil to be less than for one litre of soybean
oil. This may explain why the transformity of coconut biodiesel is higher. However, the
yields of rapeseed and sunflower are also much lower than coconut but their
transformities are also lower, so there are other factors that are not so evident. Rain is
the largest renewable input for the coconut palm as well as other biofuel crops (Cavalett
& Ortega, 2010), and the high rainfall in Fiji (2,625 mm/yr) could be one of the factors
behind the higher transformity of coconut oil.
Table 24 Typical Yields of Oilseed Crops (Uriarte, 2010)
CROP LITRES OIL
per hectare
Soybean 446
Sunflowers 952
Rapeseed 1,190
Coconut 2,689
Oil Palm 5,950
22
Transformities given by Odum (1996) have been scaled up by a factor of 1.68 = 15.83E24 / 9.44E24, based on a recalculation of the Global Emergy Base of Reference done by Odum et al. (2000).

73
4.1.2 Percent Renewable Energy
The Percent Renewable Energy (%REN) of coconut biodiesel is only 10.4%. This is very
close to values obtained by Cavalett & Rydberg (2011) for rapeseed biodiesel (11%),
ethanol from wheat (12%) and methanol from willow (10%). This means that nearly 90%
of the resources used in producing these biofuels are non-renewable. The production of
oil crops and their conversion to biofuels depend on fossil fuels for energy, fertiliser,
chemicals and other materials.
Ethanol from sugarcane shows a higher %REN of 19% probably because all the heat and
electricity required for producing sugar and ethanol comes from burning bagasse, which
is a by-product of the sugarcane itself.23
In order to produce biodiesel in a more sustainable way, methods to increase the
renewability of the agricultural and industrial processes have to be found. Nevertheless,
the renewability of biofuels is far better than fossil fuels, which are considered totally
non-renewable because they are used at a much faster rate than the millions of years
required by nature to replenish them.
4.1.3 Emergy Yield Ratio
The Emergy Yield Ratio (EYR) is a measure of how efficiently the fuel production process
exploits local resources and contributes to the main economy. The EYR of coconut
biodiesel is 1.32 and this is comparable to other biofuels (1.1 to 1.5)(Cavalett & Rydberg,
2011). The EYR for fossil fuels ranges from 3 to 11 (Odum, 1996). Biofuels therefore
have a low ability to exploit and deliver local resources in the form of liquid motor fuels
such as biodiesel and ethanol.
Ethanol from sugarcane has a higher EYR value than ethanol from wheat, indicating a
higher ability to utilise local resources and a lesser dependence on external inputs. This
23 Sugarcane juice is squeezed out of the stalks in sugar mills. The fibrous part of the stalk left over after
the juice has been squeezed out is called bagasse. It is burned in co-generation plants to produce heat and electricity required at the sugar mill, and the excess electricity is sold (Binger et al., 2005).

74
is partly because the ethanol from sugarcane production utilises sugarcane bagasse for
all its energy needs. Brazilian sugarcane also uses cheap labour intensively (Cavalett &
Rydberg, 2011).
4.1.4 Environmental Loading Ratio
The Environmental Loading Ratio (ELR) for coconut biodiesel is found to be 8.57. This is
similar to evaluations by Cavalett & Rydberg (2011) for rapeseed biodiesel (8.23),
ethanol from wheat (7.05) and methanol from willow (8.80), but is higher than the ELR
of ethanol from sugarcane (4.30) also obtained by Cavalett & Rydberg (2011) and
biodiesel from soybean (2.26) obtained by Cavalett & Ortega (2010). The high ELR of
coconut biodiesel and other biofuels is due to a high ratio of non-renewable and
imported Emergy use to renewable Emergy use. This indicates that the whole biodiesel
production chain causes significant pressure on the environment and a great deal of
ecosystem stress.
4.1.5 Emergy Index of Sustainability
The Emergy Index of Sustainability (EIS) for biodiesel in this study is 0.15. Such a low EIS
has also been obtained by Cavalett & Rydberg (2011) for biodiesel from rapeseed (0.15),
ethanol from wheat (0.16) and methanol from willow (0.13). The low EIS is due to a low
value of the Emergy Yield Ratio combined with a high value of the Environmental
Loading Ratio. This indicates that the potential contribution of the biodiesel production
process to the economy per unit of environmental loading is very low. A low EIS can also
been seen as a high degree of environmental loading or ecosystem stress per unit of
Emergy yield from the use of local resources to produce biodiesel.
Even though Cavalett & Ortega (2010) have not provided a value for EIS, their values for
EYR (1.62) and ELR (2.26) were used to calculate the EIS for soybean biodiesel to be 0.72.
This is much higher than the EIS for coconut biodiesel obtained in this study (0.15). It is
not clear why, for soybean biodiesel, Cavalett & Ortega (2010) have obtained higher
values of EIS (0.72) and %REN (30%), and a lower value of ELR (2.26) than this study.
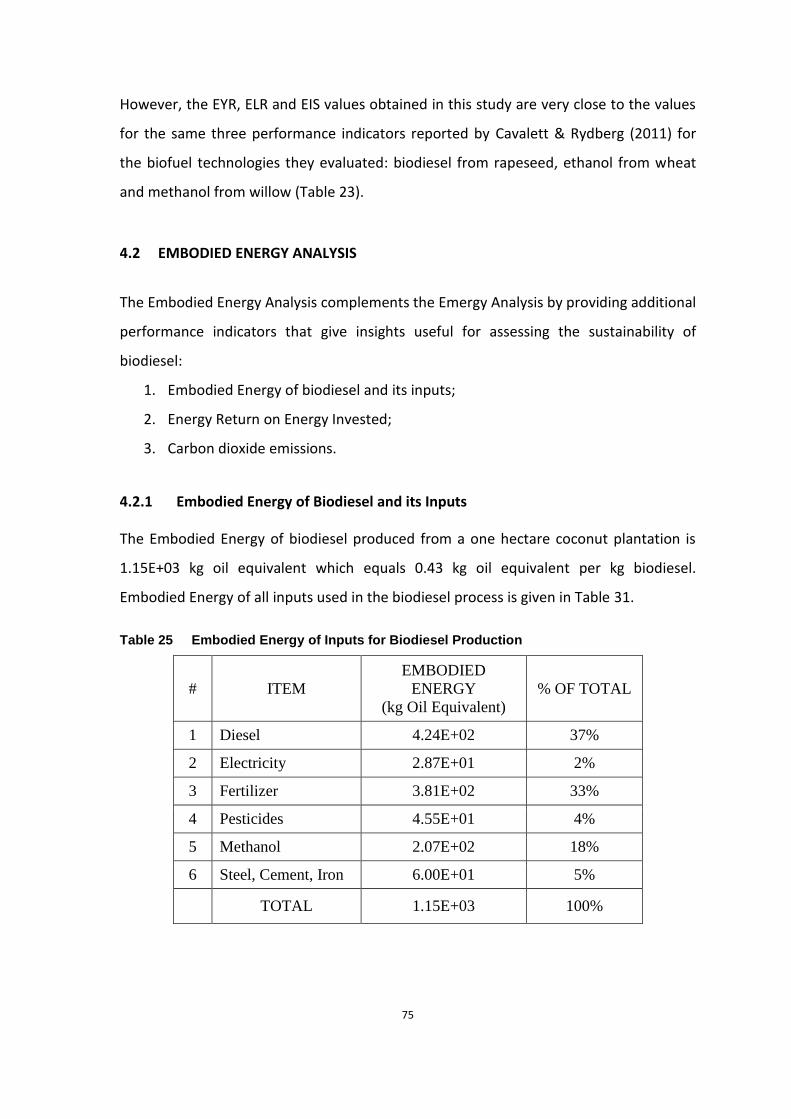
75
However, the EYR, ELR and EIS values obtained in this study are very close to the values
for the same three performance indicators reported by Cavalett & Rydberg (2011) for
the biofuel technologies they evaluated: biodiesel from rapeseed, ethanol from wheat
and methanol from willow (Table 23).
4.2 EMBODIED ENERGY ANALYSIS
The Embodied Energy Analysis complements the Emergy Analysis by providing additional
performance indicators that give insights useful for assessing the sustainability of
biodiesel:
1. Embodied Energy of biodiesel and its inputs;
2. Energy Return on Energy Invested;
3. Carbon dioxide emissions.
4.2.1 Embodied Energy of Biodiesel and its Inputs
The Embodied Energy of biodiesel produced from a one hectare coconut plantation is
1.15E+03 kg oil equivalent which equals 0.43 kg oil equivalent per kg biodiesel.
Embodied Energy of all inputs used in the biodiesel process is given in Table 31.
Table 25 Embodied Energy of Inputs for Biodiesel Production
# ITEM
EMBODIED
ENERGY
(kg Oil Equivalent)
% OF TOTAL
1 Diesel 4.24E+02 37%
2 Electricity 2.87E+01 2%
3 Fertilizer 3.81E+02 33%
4 Pesticides 4.55E+01 4%
5 Methanol 2.07E+02 18%
6 Steel, Cement, Iron 6.00E+01 5%
TOTAL 1.15E+03 100%

76
Diesel fuel accounts for 37% of the Embodied Energy in biodiesel, while fertilizer (33%)
and pesticides (4%) together account for another 37%. The third major contribution is by
methanol (18%). Steel, cement and iron used in plant construction and transportation
form 5% of the Embodied Energy in biodiesel, and electricity is only 2%.
4.2.2 Energy Return on Energy Invested
The Energy Return on Energy Invested (EROEI) for coconut biodiesel is 2.47. This is
almost the same as the EROEI for soybean biodiesel (2.48) obtained by Cavalett &
Ortega (2010). Heinberg (2009) reports that EROEI of soybean biodiesel from soybean
varies from a low of 1.93 to a high of 3.5, while the highest EROEI for biodiesel is 9
produced from palm oil. This could be because the yield of palm oil (5,950 L/ha) is the
highest of all biofuel crops. The yield of palm oil is more than twice that of coconut oil
(2,689 L/ha), more than five times that of rapeseed oil (1,190 L/ha) and more than ten
times that of soybean oil (446 L/ha) (Table 24).
The EROEI of ethanol from corn in the USA lies between 1 and 1.25, whereas ethanol
from sugarcane in Brazil has an EROEI between 8 and 10 (Heinberg, 2009). However, all
the biofuels are much lower than the EROEI of fossil fuels with coal at 50, crude oil at 19
and natural gas at 10. The EROEI for syncrude oil from tar sands found in Alberta and
Venezuela has been estimated between 5.2 and 5.8.
Giampietro & Mayumi (2009) suggest that an EROEl below 3.0 is not worth the effort in
energetic terms. Heinberg (2009) also rules out both biodiesel and ethanol as
alternatives to fossil fuels not only because of their low EROEI but also because of limits
to land and water required for their large scale production.
Instead of using fossil fuel, it is possible to use a part of the biodiesel produced to
provide the energy requirements of the biodiesel production process. Since the EROEI of
biodiesel is 2.47, only 1.47 litres of biodiesel will be available as the final product
because the remaining 1.0 litre has to be used as energy for the process. In other words,

77
for every one litre of biodiesel product, another 0.68 litres (= 1/1.47) of biodiesel has to
be produced to supply the energy for the production process. This would mean that the
land area and all the process equipment has to be scaled up by 68% to make the process
independent of external energy sources. This in turn will increase the environmental
loading and ecosystem stress by 68%.
4.2.3 Carbon Dioxide Emissions
Carbon dioxide (CO2) emitted as a result of the production of coconut biodiesel is 3.7
tons CO2 per hectare of coconut plantation, 1.38 kg CO2 per kg biodiesel burned, and 36
g CO2 per MJ of energy delivered. In comparison, production and use of petroleum diesel
would release around 100 g CO2 per MJ of energy delivered (Cavalett & Ortega, 2010).
Therefore, the use of coconut biodiesel releases 64% less greenhouse gases than the use
of petroleum-based diesel fuel.
Even though all the carbon dioxide released by burning biodiesel has been captured by
the coconut plant from the atmosphere, biodiesel cannot be called a net zero emitter of
greenhouse gases or climate neutral because of the CO2 released by fossil fuels used
directly or indirectly during the production process. In addition, production of biofuels
releases nitrous oxide gas whose global warming potential is more than 300 times that
of carbon dioxide (Crutzen et al., 2007). Crutzen et al. have estimated that any cooling
due to fossil fuel savings from the use of biodiesel and bioethanol would be nullified by
the additional global warming due to nitrous oxide emissions.
4.3 COMPARATIVE COSTS
The typical range of capital costs for Renewable Energy Technologies (RETs) are given in
Table 26 and Figure 18. Levelised Cost of Electricity24 (USD/kWh) from RETs for Pacific
24 Levelized Cost of Electricity (LCOE) is the unit cost of electricity generation (in $/kWh) over the life of a
power plant. LCOE reflects all costs needed to build and operate a power plant over its economic life, normalized over the total net electricity generated.

78
island countries is given in Table 26 and Figure 19. While the price of fossil fuel power in
the OECD25 countries ranges from 5 to 10 US cents/kWh, typical electricity prices on
islands are much higher and range from 20 to 55 US cents/kWh (Figure 19). The high
power tariff on islands is largely due to the use of diesel power plants; diesel generation
costs can be as high as 2.00 USD/kWh in remote, small-scale applications.
Table 26 Capital Costs and Levelised Cost of Electricity for Renewable Energy Power Generation (IRENA, 2013)
# TECHNOLOGY CAPITAL COST
(USD/kW)
LEVELISED COST OF
ENERGY (USD/kWh)
1 Small Hydropower 1,300 – 5,000 0.03 - 0.07
2 Large Hydropower 1,050 – 4,215 0.03 - 0.06
3 Biomass 660 – 1,860 0.05 - 0.06
4 Gasification 2,140 – 5,700
5 Anaerobic Digester 2,570 – 6,100
6 Geothermal 2,000 - 5,900 0.05 - 0.09
7 Onshore Wind 1,500 – 2,200 0.08 - 0.12
8 Offshore Wind 4,000 – 4,500
9 Utility-scale Solar PV 1,720 – 2,160 0.15 - 0.31
10 Residential Solar PV 3,100 – 3,400
11 CSP - parabolic trough 3,500 - 4,600 0.14 - 0.36
12 CSP - solar towers 6,300 – 10,500 0.17 - 0.29
13 Typical Island Electricity
Prices
0.20 - 0.55
25 The Organisation for Economic Co-operation and Development (OECD) consists of 34 member countries
that include many of the world’s most advanced countries but also emerging countries like Mexico, Chile and Turkey.
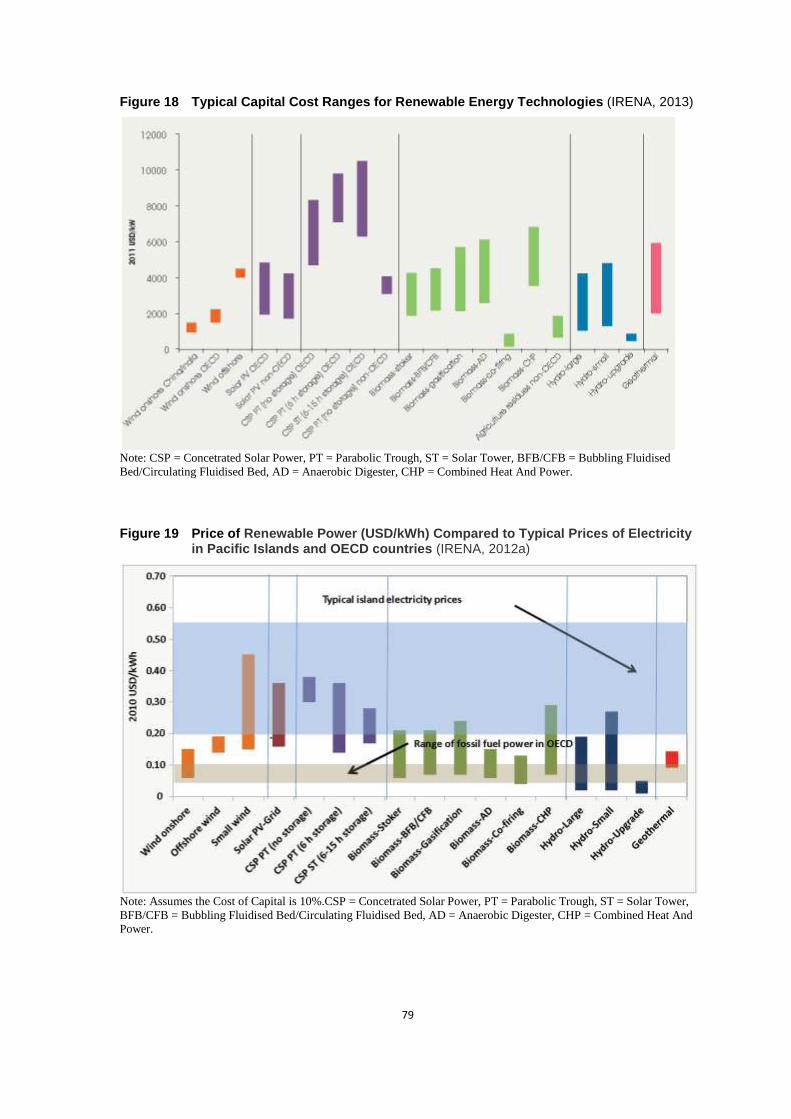
79
Figure 18 Typical Capital Cost Ranges for Renewable Energy Technologies (IRENA, 2013)
Note: CSP = Concetrated Solar Power, PT = Parabolic Trough, ST = Solar Tower, BFB/CFB = Bubbling Fluidised
Bed/Circulating Fluidised Bed, AD = Anaerobic Digester, CHP = Combined Heat And Power.
Figure 19 Price of Renewable Power (USD/kWh) Compared to Typical Prices of Electricity in Pacific Islands and OECD countries (IRENA, 2012a)
Note: Assumes the Cost of Capital is 10%.CSP = Concetrated Solar Power, PT = Parabolic Trough, ST = Solar Tower,
BFB/CFB = Bubbling Fluidised Bed/Circulating Fluidised Bed, AD = Anaerobic Digester, CHP = Combined Heat And
Power.
80
Because of the high price of electricity on Pacific Islands (0.20 – 0.55 USD/kWh), the cost
of electricity generated from biomass, hydropower and geothermal generation
technologies are cheaper than power from fossil fuels and therefore financially viable. If
the wind and solar resources are good, then wind generators and solar photovoltaics are
also cost competitive and financially viable.
4.4 SUPPORTIVE ENERGY POLICY ON SMALL ISLANDS
4.4.1 Overarching Considerations
There are several overarching considerations that should be incorporated into the
planning of a sustainable energy supply on islands. The human resources often include a
strong sense of place and community – valuable resources for collective action.
Focussed efforts to engage the local population will encourage a sense of involvement in
the projects and help islanders feel empowered to improve their own future. Moreover,
the developmental benefits of the energy project should improve quality of life on the
islands in an equitable and practical way. My experience with energy projects in SIDS
has taught me that when planning a sustainable energy supply for islands, there are
some important considerations:
Community involvement
A community involvement approach from the early stages of the project may be better
than a top-down approach in which an external agency (governmental or non-
governmental) pre-determines the parameters of the project. Public education is an
important step. The island community should be made aware of the benefits of energy
efficiency measures and renewable energy technologies. In order to encourage the local
enthusiasm for an energy project, the environmental and economic benefits and
drawbacks of available energy sources should be explained and discussed at public
meetings.

81
It is very important to recognize the realities of life and work in a small island context,
and to give due consideration to the real needs and priorities of the people. The
community should be given a say in how the quality of their lives could be improved and
what is required to do it, thereby giving them the self-confidence to help themselves.
The success of the energy project can be further ensured through community
participation in the installation, operation and maintenance of energy infrastructure, so
that they feel a sense of ownership in the project and have an incentive to take good
care of the energy system.
Technical Maturity
To ensure successful projects, only mature technologies should be used on islands.
Technologies that are still under development should not be considered because solving
teething problems in remote locations is difficult and expensive. Only those options that
are fully commercialised and well proven under field conditions should be selected.
Reliability is more important than efficiency
People on small islands have no hinterland of alternative resources to draw upon. When
a system fails the results may literally spell life or death. A very important consideration
is therefore the reliability of the equipment and of the energy system as a whole.
Extended warranties should be negotiated with the manufacturers and suppliers. It is far
better to have a reliable system than to have a more efficient system that is less reliable.
Suitability to local conditions
System design and equipment selection has to take into consideration the limited
infrastructure, human resources and geographical scale of many small islands, such as
the maximum capacity of roads and bridges, and handling capacity of the ports.
Equipment should be able to operate successfully over its entire lifetime in the harsh
tropical marine environment found on most Pacific islands. Equipment with a successful
track record of long term operation in similar conditions is preferable.

82
Ease of Installation, Operation & Maintenance
Technical skills will develop over time, but at the early stages, equipment has to be easy
to install, operate and maintain under local island conditions. High capacity cranes may
not be available on the islands to lift and install heavy equipment such as large wind
turbines. Smaller wind turbines and alternate installation techniques such as tilt-up
towers can be used instead. This will make it possible to lower the wind turbine towers
before the devastating cyclonic storms that hit the Pacific island countries once every
few years.
4.4.2 Local Benefits
Capacity-Building and Training
Capacity building of in-country manpower is essential so that they can handle the whole
project cycle including energy planning, production, distribution and usage. Training in
installation, operation and maintenance of the equipment may be imparted at
manufacturers’ facilities, on existing RE project sites and/or during installation of the
systems. Project management capabilities may have to be built up or up-graded.
Capacity building is an on-going process because new skills may be required or new
employees trained.
Technology Transfer and Local Manufacture
Table 27 gives a list of RE technologies that are suitable for local manufacture in Pacific
Island Countries. Local manufacturing creates jobs, benefits the local economy and
makes the island countries more self sufficient. Although some manufacturing can be
carried out in existing mechanical workshops, additional machinery and training may be
necessary.
A technology transfer arrangement with the supplier should include training in
manufacturing processes, installation, operation and maintenance, as well as quality
assurance. For production volumes to be financially viable, exports to regional and
international markets may be necessary.

83
Table 27 Technologies Suitable for Local Manufacture in Pacific Island Countries (Raghavan, 2003)
ENERGY RESOURCE TECHNOLOGIES
Hydro power Cross-flow turbines
Pelton turbines
Biomass
Biogas plants
Gasifiers
Plant Oil production & usage
Wind energy Wind Electric Generators
Mechanical Windpumps
Solar energy
Heaters
Driers
Cookers
Solar Photo Voltaic module
assembly
Productive Uses of Energy for Income Generation
The quality of life on the islands can be improved by utilising the RE power supply for
productive activities in the daytime. Such income generating activities include sawmills,
oil mills, weaving, handicrafts, and processing of locally available produce. Utilization of
power in the daytime will increase the capacity utilization factor of the RE power plant,
thereby improving its financial viability.
To facilitate the rapid growth of small and medium scale enterprises (SMEs), business
development skills of the local entrepreneurs may need to be upgraded in several key
areas:
1. Preparation of business plans
2. Loan applications
3. Small enterprise management
4. Equipment selection and procurement
5. Marketing.

84
One of the major challenges faced by the governments of the Fiji Islands and other
Pacific Island Countries is the continuing migration of islanders from the smaller outer
islands to larger islands, and from rural areas to towns, especially national capitals. The
predominantly rural society of the Fiji Islands is likely to be transformed into a
predominantly urban society within 20 years (Russell 2009). On islands worldwide, this
trend has negative impacts on cultural survival, retention of important traditional
knowledge and food security, and stresses urban infrastructure and services (Novaczek
et al., 2001). By providing employment opportunities on the smaller islands, energy
projects may raise the income levels and quality of life of the people, thereby reducing
their migration to the larger islands and urban centres. Health and educational facilities
on the islands can be significantly improved by providing a reliable power supply to
schools and hospitals.

85
4.5 CONCLUSIONS AND RECOMMENDATIONS FOR FUTURE WORK
4.5.1 Conclusions
A holistic evaluation of coconut biodiesel using Emergy analysis and Embodied Energy
Analysis clearly indicates that this renewable energy resource is not a sustainable
alternative to fossil fuels. The Environmental Loading Ratio (8.57) of coconut biodiesel is
very high and the Emergy Index of Sustainability (0.15) is very low. Moreover, biodiesel
is not carbon neutral because the production process emits 1.38 tons CO2 per ton of
biodiesel (36 g CO2 per MJ of biodiesel). From a holistic perspective, biofuels are not the
answer to the search for sustainable alternatives to fossil fuels.
The idea that renewable energy can solve the whole problem of sustainability and
sustainable development is not valid. In the hype surrounding ‘green’ renewable energy
as the solution to all our energy problems, perhaps we are missing something. It is
necessary to take a step backwards and recognise that the root cause of the
vulnerability of small island countries is the increasingly high dependence on energy in
their development and economic growth paradigms. There is no magic bullet in the form
of renewable energy or biofuels that will satisfy this ever growing hunger for energy.
What is required is a shift in the development paradigm that can delink the natural
human urge towards a better quality of life and happiness from the energy intensive
strategies that are currently being pursued.
After all, when European explorers first discovered Polynesia barely three centuries ago,
they found that the Pacific islanders were some of the happiest people in the world,
living a low energy lifestyle without using any fossil fuels. The highly energy-intensive
lifestyle of people in the developed countries, based primarily on fossil fuels, is slowly
destroying our planet. A different development pattern that is based on less energy
usage is necessary. The whole issue of sustainable energy has to be revisited.
86
Ecologists Howard T. Odum and Elisabeth C. Odum, in their groundbreaking book
Prosperous Way Down (Odum & Odum, 2001) describe the undesirable
consequences of our current, unsustainable path, and lay the foundation for
avoiding a crash in the human economy and human civilization. Odum & Odum
point out that most populations of organisms, including many human civilizations,
have taken the natural, efficient path of apocalyptic downfall. But they also
demonstrate how, with some thought and foresight, we can pursue an alternative
path: They show us a prosperous way down from the world’s economic peak. . . .
Odum & Odum provide myriad specific solutions for the impending descent,
ranging from reorganization of cities to restoration of waters and from ubiquitous
transmission of knowledge to universal appreciation for alternative lifestyles (i.e.
those that are not based on procreation and conspicuous consumption).
(McPherson, 2005, p. 118)
“There has been a growing consensus that the collapse of Easter Island is an alarming
example of the dependence of human societies on their environment and of the
devastating consequences of irreversibly damaging that environment” (Nagarajan, 2006,
p. 297). “The people of Rapa Nui (Easter Island) disappeared leaving only their
monuments as an example to the world of what happens when culture cannot downsize
to fit its environmental production” (Odum, 2007, p. 393). Unless our civilisation takes
timely action, our fragile earth island could very well meet a dreadful fate similar to that of
Rapa Nui.
4.5.2 Recommendations for Future Work
It is essential to get off fossil fuels. Since some level of energy is required, other local
energy resources have to be studied and compared to find alternatives that are more
sustainable than coconut biodiesel. These could be other, more sustainable ways of
using coconuts for power generation, or other renewable energy resources. It is
therefore recommended that a thorough Emergy analysis and Embodied Energy Analysis
should be carried out for the following alternate methods of generating power, so that

87
their sustainability can be compared with the use of coconut biodiesel and petroleum
diesel:
1. The husk & shell of coconuts, which are by-products, can be burned in a biomass
gasifier. The fuel gas from the biomass gasifier (called producer gas) can be used
to generate electricity in a gas engine generator or a diesel engine generator26.
The transformity of shell & husk will be lower than that of coconut biodiesel but
the additional transformity of the biomass gasifier has to be accounted.
2. Pure coconut oil can be used as fuel in a diesel engine instead of converting the
oil to biodiesel. The advantages of using pure coconut oil as a fuel are: a)
coconut oil is cheaper than coconut biodiesel because of the additional cost of
biodiesel conversion; and b) chemicals (alcohol and catalyst) are not necessary.
However, coconut oil is more viscous than petroleum diesel and its combustion
properties are different. To prevent damage to the diesel engine, the use of
coconut oil will require proper engine adaption / modification that will depend
on the type of engine (direct injection or indirect injection) and the usage
(stationary engine for power generation or automotive engine for transport). The
transformity of coconut oil is lower than that of coconut biodiesel, but the
emergy of the materials and labour required for engine modification have to be
accounted.
Similarly, the oil and biodiesel from other biofuels crops such as Jatropha should
be evaluated using Emergy Analysis.
3. Sustainability of technologies that harness other renewable energy resources in
small islands need to be studied, such as solar, wind, wave power, ocean thermal
energy conversion (OTEC) and geothermal. Some technologies have very useful
26 A gas engine generator has spark ignition; it can therefore operate on 100% producer gas. A diesel
engine generator has compression ignition; therefore it can operate only on around 80% producer gas, because it needs around 20% diesel fuel to ignite the fuel air mixture (Raghavan, 2010).

88
co-products that have a high value on many small islands. For example, in
addition to electricity, OTEC produces fresh drinking water that is scarce on some
islands and has to be imported using tankers. OTEC also brings in nutrient rich
ocean water that can be used for aqua-culture. The profitability as well as the
sustainability issues of the by-products have to be accounted.

89
5 REFERENCES
Asian Development Bank [ADB]. (2009a). Taking Control of Oil - Managing Dependence
on Petroleum Fuels in the Pacific. Pacific Studies Series. Asian Development Bank.
Manila, Philippines.
Asian Development Bank [ADB]. (2009b). Energy Statistics in Asia and the Pacific (1990–
2006). Asian Development Bank. Manila, Philippines.
Alliance of Small Island States. (2005). Mauritius Strategy for the further Implementation
of the Program of Action for the Sustainable Development of Small Island
Developing States. United Nations General Assembly: A/CONF.207/CRP.7.
Alliance of Small Island States. 2013. http://aosis.org/members/. Retrieved on 18 March
2013.
Ásmundsson, R. K. (2008). South Pacific Islands - Geothermal energy for electricity
production. Icelandic International Development Agency. Reyjavik. Iceland. ÍSOR-
2008/032.
Balachandra, P. & Mongia, N. (2007). Oil Price Vulnerability Index (OPVI) for the
Developing Countries of Asia and the Pacific. Summary Paper. Bangkok: UNDP
Regional Centre, Regional Energy Program for Poverty Reduction.
Bargigli, S. & Ulgiati, S. (2003). Emergy and life-cycle assessment of steel production.
Proceedings of the Second Biennial Emergy Evaluation and Research Conference.
Gainesville, Florida.
Bastianoni, S. & Marchettini, N. (2000). The problem of co-production in environmental
accounting by Emergy analysis. Ecological Modelling, 129, 187–93.
90
Bastianoni, S., Marchettini, N., Panzieri, M., & Tiezzi, E. (2001). Sustainability assessment
of a farm in the Chianti area (Italy). Journal of Cleaner Production, 9, 365-73.
Bastianoni, S., Coppola, F., Tiezzi, E., Colacevich, A., Borghini, F., & Focardi, S. (2008).
Biofuel potential production from the Orbetello lagoon macroalgae: a
comparison with sunflower feedstock. Biomass and Bioenergy, 32(7), 619-28.
Binger, A., Raghavan, K. & Ronneberg, E. (2005). Developing a Biofuels Industry in Fiji.
Cabinet Strategy Paper, Government of the Fiji Islands. Suva, Fiji Islands.
Biondi, P., Panaro, V., & Pellizzi, G. (1989). Le richieste di energia del sistema agricolo
italiano. In: CNR, Consiglio Nazionale delle Ricerche, Progetto Finalizzato
Energetica, Sottoprogetto Biomasse. Editors. Agricoltura; 1989. Roma, Italia.
Report LB-20.
Boustead, I., & Hancock, G. F. (1979). Handbook of industrial energy analysis. England:
Ellis Horwood.
United Nations General Assembly. (1994). Barbados Programme of Action. Report of the
Global Conference on the Sustainable Development of Small Island Developing
States. Bridgetown, Barbados, 25 April-6 May 1994. United Nations General
Assembly: A/CONF.167/9. October 1994.
Brandt-Williams, S. L. (2002). Folio #4 - Emergy of Florida Agriculture (2nd printing).
Handbook of Emergy Evaluation: A compendium of data for Emergy computation
issued in a series of folios. Center for Environmental Policy, Univ. of Florida,
Gainesville. August 2001, Revised September 2002.
Brophy, P. & Poux, B. (2013). Status of Geothermal Development in the Islands of the
Caribbean. GRC Annual Meeting 2013 - International Session. Las Vegas, Nevada.
September 30, 2013.

91
Brown, M. T. (2009). www.Emergy.org. Retrieved on 15 December 2013.
Brown, M. T., & Bardi, E. (2001). Folio #3 - Emergy of Ecosystems. Handbook of Emergy
Evaluation: A compendium of data for Emergy computation issued in a series of
folios. Center for Environmental Policy, Univ. of Florida, Gainesville. July 2001.
Brown, M. T., Cohen, M. J., & Sweeney, S. (2009). Predicting national sustainability: The
convergence of energetic, economic and environmental realities. Ecological
Modelling, 220 (23), 3424-3438.
Brown, M. T., & Herendeen, R. A. (1996). Embodied Energy Analysis and EMERGY
analysis: a Comparative View. Ecological Economics, 19, 219-235.
Brown, M. T., & Ulgiati, S. (1997). Emergy-Based Indices and Ratios to Evaluate
Sustainability: Monitoring Economies and Technology toward Environmentally
Sound Innovation. Ecological Engineering, 9, 51-69.
Brown, M. T., & Ulgiati, S. (2002). Emergy Evaluations and Environmental Loading of
Electricity Production Systems. The Journal of Cleaner Production, 10, 321-334.
Brown, M.T., & Ulgiati, S. (2004). Emergy analysis and environmental accounting.
Encyclopedia of Energy, 2, 329-354.
Caiazzo, F., Malina, R., Staples, M. D., Wolfe, P. J., Yim, S. H. L., & Barrett, S. R. H. (2014).
Quantifying the Climate Impacts of Albedo Changes due to Biofuel Production: a
Comparison with Biogeochemical Effects. Environmental Research Letters, 9,
10pp. doi:10.1088/1748-9326/9/2/024015.
Cavalett, O., & Ortega, E. (2010). Integrated Environmental Assessment of Biodiesel
Production from Soybean in Brazil. Journal of Cleaner Production, 18, 55-70.

92
Cavalett, O., & Rydberg, T. (2010). Critical Analysis of the Swedish Biofuel Policy using
Emergy Synthesis. Proceedings from the Sixth Biennial Emergy Conference.
Gainesville, Florida. 175-183.
Cloin, J. (2006). Overview of Regional Biofuel Activities. SOPAC Annual Session STAR
Paper. South Pacific Applied Geoscience Commission (SOPAC), Suva, Fiji Islands.
Crowfoot, B. (2012). New Worries about Oil Terminal Risks on St. Eustatius Island.
Ecology Global Network. Retrieved from:
http://www.ecology.com/2012/01/02/oil-terminal-risks-st-eustatius/
Crutzen, P. J., Mosier, A. R., Smith, K. A., & Winiwarter, W. (2007). N2O Release from
Agro-Biofuel Production Negates Global Warming Reduction by Replacing Fossil
Fuels. Atmospheric Chemistry and Physics Discussions, 7, 11191-11205.
ERIA. (2010). Sustainability Assessment of Biomass Energy Utilisation in Selected East
Asian Countries. ERIA Research Project Report 2009, No. 12. Economic Research
Institute for ASEAN and East Asia (ERIA). Jakarta, Indonesia.
Eurelectric. (2012). EU islands: Towards a sustainable energy future. The Union of the
Electricity Industry (EURELECTRIC). Dépôt légal: D/2012/12.105/24.
Fiji Electricity Authority. (2011). Annual Report 2011. Fiji Electricity Authority. Suva, Fiji
Islands.
Felix, E., & Tilley, D. R. (2009). Integrated energy, environmental and financial analysis of
ethanol production from cellulosic switchgrass. Energy, 34 (4), 410-436.
Fiji Bureau of Statistics. (2012). Key Statistics. Fiji Bureau of Statistics. Suva, Fiji Islands.

93
Fiji Bureau of Statistics. (2014). Fiji National Accounts. Fiji Bureau of Statistics. Suva, Fiji
Islands. http://www.statsfiji.gov.fj / index.php/economic/45-economic-
statistics/national-accounts/100-fiji-national-accounts-summary-table. Retrieved
on 8 March 2014.
Fiji National Agricultural Census, 2009. Report on the Fiji National Agricultural Census
2009. Department of Agriculture, Economic Planning and Statistics Division. Suva,
Fiji Islands.
Franzese, P. P., Rydberg, T., Russo, G. F., & Ulgiati, S. (2009). Sustainable Biomass
Production: A Comparison between Gross Energy Requirement and Emergy
Synthesis Methods. Ecological Indicators, 9 (5), 959-970.
Giampietro, M., & Mayumi, K. (2009). The Biofuel Delusion - The Fallacy of Large-Scale
Agro-biofuel Production. London: Earthscan.
Giampietro, M., & Ulgiati, S. (2005). Integrated Assessment of Large-Scale Biofuels.
Critical Reviews in Plant Sciences, 24, 1-20.
Hagen, D. (1995). Coconut Biomass Energy Resources: Overview. Proceedings of the
UNIDO – APCC Interregional Workshop on “The Use of Coconut Industry Waste
for Energy”. Bali, Indonesia. 6-19 November 1995.
Hartemink, A. E. (2006). Soil Erosion: Perennial Crop Plantations. Encyclopedia of Soil
Science, 1613-1617. Wageningen, Netherlands: ISRIC–World Soil Information.
doi: 10.1081/E-ESS-120041234.
Harvey, A., Brown, A., Hettiarachi, P., & Inversin, A. (2009). Micro-Hydro Design Manual.
Schumacher Center for Technology and Development. Warwickshire, U.K.:
Practical Action Publishing.

94
Heinberg, R. (2009). Searching for a Miracle: “Net Energy” Limits & the Fate of Industrial
Society. False Solution Series #4. International Forum on Globalization and the
Post Carbon Institute. Retrieved from:
http://www.ifg.org/pdf/Searching%20for%20a%20Miracle_web10nov09.pdf
Herendeen, R.A. (2004). Energy analysis and EMERGY analysis—a Comparison. Ecological
Modelling, 178, 227-237.
International Energy Agency. (2011). Technology Roadmap - Geothermal Heat and
Power. International Energy Agency (IEA), Sustainable Energy Policy and
Technology Directorate. Paris, France. Retrieved from:
http://www.iea.org/publications/freepublications/publication/Geothermal_Road
map.pdf.
International Monetary Fund. (2010). Macroeconomic Impacts of Energy Prices in the
Pacific. PFTAC Regional Papers. International Monetary Fund, Pacific Financial
Technical Assistance Centre. Suva, Fiji Islands.
Intergovernmental Panel on Climate Change. (2007a). Climate Change 2007: The
Physical Science Basis. IPCC Fourth Assessment Report (AR4). Retrieved from:
http://www.ipcc.ch/publications_and_data/publications_ipcc_fourth_assessmen
t_report_wg1_report_the_physical_science_basis.htm
Intergovernmental Panel on Climate Change. (2007b). Climate Change 2007: Impacts,
Adaptation and Vulnerability. Intergovernmental Panel on Climate Change. IPCC
Fourth Assessment Report (AR4). Retrieved from:
http://www.ipcc.ch/publications_and_data/publications_ipcc_fourth_assessmen
t_report_wg2_report_impacts_adaptation_and_vulnerability.htm
International Renewable Energy Agency [IRENA]. (2012a). Summary for Policy Makers:
Renewable Power Generation Costs. IRENA. United Arab Emirates.

95
IRENA. (2012b). Policy Challenges for Renewable Energy Deployment in Pacific Island
Countries and Territories: IRENA Policy Brief. International Renewable Energy
Agency (IRENA). United Arab Emirates.
IRENA. (2012c). Renewable Energy Country Profiles: Pacific. International Renewable
Energy Agency (IRENA). United Arab Emirates.
IRENA. (2012d). Electricity Storage and Renewables for Island Power - A Guide for
Decision Makers. International Renewable Energy Agency (IRENA). United Arab
Emirates.
IRENA. (2012e). Concentrating solar power. Renewable Energy Technologies: Cost
Analysis Series. International Renewable Energy Agency (IRENA). United Arab
Emirates.
IRENA. (2012f). Biomass for Power Generation. Renewable Energy Technologies: Cost
Analysis Series. International Renewable Energy Agency (IRENA). United Arab
Emirates.
IRENA. (2012g). Hydropower. Renewable Energy Technologies: Cost Analysis Series.
International Renewable Energy Agency (IRENA). United Arab Emirates.
IRENA. (2012h). Solar Photovoltaics. Renewable Energy Technologies: Cost Analysis
Series. International Renewable Energy Agency (IRENA). United Arab Emirates.
IRENA. (2012i). Wind Power. Renewable Energy Technologies: Cost Analysis Series.
International Renewable Energy Agency (IRENA). United Arab Emirates.
IRENA. (2013). Renewable Power Generation Costs in 2012: An Overview. International
Renewable Energy Agency (IRENA). United Arab Emirates.
96
Jarméus, C. (2013). Emergy Analysis of Biodiesel and Biogas Production from Baltic Sea
Macro Algae. Master of Science Thesis. Industrial Ecology, Royal Institute of
Technology. Stockholm, Sweden.
Kangas, P. C. (2002). Folio #5 - Emergy of Landforms. Handbook of Emergy Evaluation: A
compendium of data for Emergy computation issued in a series of folios. Center
for Environmental Policy, Univ. of Florida, Gainesville. July 2002.
Krishna, I., Bukarau, L., Fairbairn, P., & Mario, R. (2009). Potential for Liquid Biofuels in
Fiji. SOPAC Miscellaneous Report 677. South Pacific Applied Geoscience
Commission (SOPAC). Suva, Fiji Islands.
Lapp, C. W. (1991). Emergy Analysis of the Nuclear Power System in the United States.
Master of Science Thesis. University of Florida, Gainesville.
Mabee, W. E., Mannion, J., & Carpenter, T. (2012). Comparing the Feed-in Tariff
Incentives for Renewable Electricity in Ontario and Germany. Energy Policy, 40,
480-489.
McCoy-West, A. J., Milicich, S., Robinson, T., Bignall, G., & Harvey, C. C. (2011).
Geothermal Resources in the Pacific Islands: The Potential of Power Generation
to Benefit Indigenous Communities. Proceedings of the Thirty-Sixth Workshop on
Geothermal Reservoir Engineering. Stanford University, Stanford, California.
January 31 - February 2, 2011. SGP-TR-191.
McPherson, G. R. (2005). Killing the Natives: Has the American Dream Become a
Nightmare? Pittsburg: Dorrance Publishing.
Modi, V., McDade, S., Lallement, D., & Saghir, J. (2005). Energy Services for the Millennium
Development Goals. The UN Millennium Project. The World Bank/ESMAP and the United
Nations Development Program.

97
Nagarajan, P. (2006). Collapse of Easter Island, Lessons for Sustainability of Small Islands.
Journal of Developing Societies, 22(3), 287-301.
Nakavulevu, P. (2011). Promoting Renewable Energy Policies in Fiji. Presentation at
Accelerated Renewable Energy Deployment on Islands with Emphasis on the
Pacific Islands. Sydney, Australia. 26-28 October 2011. Retrieved from:
http://www.irena.org/DocumentDownloads/events/Workshop_Accelerated_Ren
ewable_Energy_Deployment/Session7/S7_2IRENA-RenewableEnergy-Fiji-
Final.pdf
NASA. (2014). Atmospheric Science Data Center, NASA Langley Research Center.
http://eosweb.larc.nasa.gov/cgi-bin/sse/sse.cgi. Retrieved on March 5, 2014.
National Oceanic and Atmospheric Administration. (1992). Oil spills Case Histories: 1967-
1991, Summaries of Significant U.S. and International Spills. Report No. HMRAD
92-11. NOAA/Hazardous Materials Response and Assessment Division, Seattle,
Washington. Retrieved from:
http://archive.orr.noaa.gov/book_shelf/26_spilldb.pdf
Novaczek, I., Harkes, I. H. T., Sopacua, J., & Tatuhey, M. D. D. (2001). An Institutional
Analysis of Sasi Laut in Maluku, Indonesia. International Center for Living Aquatic
Resources Management (ICLARM), Technical Report 59.
Odum, H. T. (1971). Environment, Power and Society. New York: John Wiley and Sons.
Odum, H. T. (1996). Environmental Accounting: Emergy and Environmental Policy
Making. New York: John Wiley and Sons.
Odum, H. T. (2000). Folio #2: Emergy of global Processes. Handbook of Emergy
Evaluation: A compendium of data for Emergy computation issued in a series of
folios. Center for Environmental Policy, Univ. of Florida, Gainesville.

98
Odum, H. T. (2007). Environment Power and Society for the 21st Century. New York:
University of Columbia Press.
Odum, H. T., Brown, M. T., & Brandt-Williams, S. L. (2000). Folio #1: Introduction and
global budget. Handbook of Emergy Evaluation: A compendium of data for
Emergy computation issued in a series of folios. Center for Environmental Policy,
Univ. of Florida, Gainesville.
Odum, H. T., & Odum, E. C. (2001). The Prosperous Way Down. Boulder, CO: University
Press of Colorado.
Paoli,C., Vassallo, P., & Fabiano, M. (2008). Solar Power: an Approach to Transformity
Evaluation. Ecological Engineering, 34, 191-206.
Pacific Islands Forum Secretariat. (2011). The Second International Food and Fuel Price
Shock and Forum Island Countries’ Economies. Out of Session Paper for the
Forum Economic Ministers’ Meeting at Apia, Samoa. 19-21 July 2011.
Raghavan, K. (2003). 100% Renewable Energy Islands in Tuvalu, Fiji and Tonga. A Case
Study. United Nations Department for Economic and Social Affairs, Small Islands
Developing States. New York.
Raghavan, K. (2005). Biofuels in Small Island Developing States. A Working Paper for
UNDP Capacity Building mission for preparation of a Cabinet Strategy Paper on
“Development of a Biofuels Industry in the Fiji Islands”.
Raghavan, K. (2010). Biofuels from Coconuts. FACT Foundation. Wageningnen,
Netherlands. Retrieved from: http://fact-foundation.com/library/bioenergy-
feedstock/fruit-waste/biofuels-coconuts.

99
Raghavan, K., & Kishore, V. V. N. (2001). Action Plan for Providing 100% of the Energy
Requirements of Lakshadweep Islands from RES. Proceedings of the
International Conference on Renewable Energies for Islands - Towards 100% RES
Supply. Crete, Greece, 14-16 June 2001.
Russell, L. (2009). Poverty, Climate Change And Health In Pacific Island Countries - Issues
To Consider In Discussion, Debate And Policy Development. Menzies Foundation.
Melbourne, Australia.
Singh, A. (2012). Biofuels and Fiji’s roadmap to energy self-sufficiency. Biofuels, 3 (3),
269-284.
Smil, V. (1991). General energetics. New York: John Wiley & Sons.
South Pacific Applied Geoscience Commission. (2002). Fiji Country Profile. South Pacific
Applied Geoscience Commission (SOPAC). Suva, Fiji Islands.
Taylor, J. (2009). An Economic Critique of Corn-Ethanol Subsidies. Federal Reserve Bank
of St. Louis. Regional Economic Development, 5(1), 78-97. Retrieved from:
http://object.cato.org/sites/cato.org/files/articles/jerrytaylor_aneconomiccritiqu
eofcornethanolsubsidies_2009.pdf.
Tinytech. (2014). http://www.tinytechindia.com/oil.htm. Retrieved on 7 March 2014.
Uriarte, F. A. (2010). Biofuels from Plant Oils. ASEAN Foundation. Jakarta, Indonesia.
Ulgiati, S. A. (2001). Comprehensive energy and economic assessment of biofuels: when
‘‘green’’ is not enough. Critical Reviews in Plant Sciences, 20(1), 71-106.

100
Ulgiati, S. (2003). Emergy Analysis of Italy in the years 1984, 1989, 1991, 1995, and 2000.
Unpublished manuscript. Energy and Environment Research Unit, Department of
Chemistry, University of Siena, Italy.
Ulgiati,S., & Brown, M. T. (2002). Quantifying the Environmental Support for Dilution and
Abatement of Process Emissions - The Case of Electricity Production. Journal of
Cleaner Production, 10, 335-348.
United Nations, 2013. http://www.un.org/millenniumgoals/. Retrieved on 6 December
2013.
United Nations Development Program [UNDP]. (2005). Energizing the Millennium
Development Goals - A Guide to Energy’s Role in Reducing Poverty. Bangkok:
UNDP Regional Centre, Regional Energy Program for Poverty Reduction.
UNDP. (2007a). Energy and Poverty in the Pacific Island Countries– Challenges and the
Way Forward. Bangkok: UNDP Regional Centre, Regional Energy Program for
Poverty Reduction.
UNDP. (2007b). Overcoming Vulnerability to Rising Oil Prices - Options for Asia and the
Pacific. Bangkok: UNDP Regional Centre, Regional Energy Program for Poverty
Reduction.
UNDP. (2012). Barbados Declaration on Achieving Sustainable Energy for All in Small
Island Developing States (SIDS). AOSIS Ministerial Conference on Achieving
Sustainable Energy for All in SIDS – Challenges, Opportunities, Commitments.
Bridgetown, Barbados. 7-8 May 2012. Retrieved from:
http://www.sustainableenergyforall.org/news /item/73-barbados-declaration.
UNDP. (2013). http://www.undp.org/content/undp/en/home/mdgoverview/. Retrieved
on 6 December 2013.

101
United Nations Environment Program. (1992a). http://islands.unep.ch/da21c17g.htm.
Retrieved on 6 December 2013.
United Nations Environment Program. (1992b). Agenda 21. United Nations Conference
on Environment & Development. Rio de Janerio, Brazil. 3-14 June 1992. Retrieved
from: http://sustainabledevelopment.un.org/content/
documents/Agenda21.pdf.
United Nations General Assembly. (1994). Report of the Global Conference on the
Sustainable Development of Small Island Developing States (Annex-II).
Bridgetown, Barbados. 25 April-6 May 1994. United Nations General Assembly:
A/CONF.167/9. October 1994.
United Nations. (1994). Program of Action for the Sustainable Development of Small
Island Developing States. Report of the Global Conference on the Sustainable
Development of Small Island Developing States. Bridgetown, Barbados. 25 April-6
May 1994. United Nations: A/CONF.167/9.
Vaitilingom, G. (2008). Coconut Biofuel Training – Coconut Oil as Fuel for Diesel Engine.
SOPAC and Fiji Department of Energy. Suva, Fiji Islands. 16-17 April 2008.
World Bank. (2013). World Bank Global Economic Monitor, Commodity Price Monitor.
http://data.worldbank.org/data-catalog/global-economic-monitor. Retrieved on
5 December 2013.
World Bank. (2014a). http://data.worldbank.org/country/fiji. Retrieved on 27 February
2014.
World Bank. (2014b). Climate Change Knowledge Portal. http://sdwebx.worldbank.org/
climateportal/index.cfm?page=country_historical_climate&ThisRegion=Australia
&ThisCCode=FJI. Retrieved on 7 March 2014.

102
Zieroth, G., Gaunavinaka, L., & Forstreuter, W. (2007). Biofuel from Coconut Resources in
Rotuma - A Feasibility Study on the Establishment of an Electrification Scheme
using local Energy Resources. South Pacific Applied Geoscience Commission
(SOPAC). Suva, Fiji Islands.

103
6 APPENDIX
Financial data for the agricultural and industrial phases in the production of coconut
biodiesel is given in the following tables and figures:
Break-down of costs and returns are in Tables 28 to 31, and Figures 20 to 23.
Net profits are given in Table 32, and Figures 24 and 25.
Value added by intermediate products are in Table 33, and Figures 26 and 27.
Table 28 Production of Mature Coconuts (Compiled from data in ERIA, 2010)
ITEMS QUANTITY COST
% of Total Quantity Units USD / ha
Fertilizer, Chemicals 1 bag /yr 26 8%
Weeding, Fertilizing, Maintenance 12 person days /yr 66 21%
Harvesting, Dehusking, Hauling 8 harvests /yr 177 55%
Transportation, Delivery 8,000 nuts 53 16%
TOTAL COST of Dehusked Nuts
322 100%
NOTES:
For a one hectare plantation.
8 harvests per year (once every 45 days)
Average yield = 10 nuts /tree /harvest
Average weight of whole nut = 1.2 kgs
Dehusked nut = 67% by weight of whole nut
Figure 20 Cost Break-down for Production of Mature Coconuts (ERIA, 2010)
Fertilizer, Chemicals 8%
Weeding, Fertilizing,
Maintenance 21%
Harvesting, Dehusking, Hauling
55%
Transportation, Delivery
16%

104
Table 29 Production of Copra from Mature Coconuts (Compiled from data in ERIA, 2010)
COSTS
ITEMS QUANTITY COST
% of Total Quantity Units USD / ha
Mature Dehusked Coconut Input 6,432 kgs /ha 639 89%
Labour 6 person days 40 6%
Transportation 2,123 kgs /ha 13 2%
Overheads -fees, taxes, sales, admin.
22 3%
TOTAL COST of Copra 2,123 kgs /ha 714 100%
RETURNS
Selling Price of Copra 2,123 kgs /ha 1,030
PROFIT from sales of COPRA
317 92%
Byproduct: Coconut Shell 1,441 kgs /ha
Less - Shell used as fuel 1,000 kgs /ha
PROFIT from sales of SHELL 441
29 8%
TOTAL PROFIT
346 100%
NOTES:
For a one hectare plantation.
Average copra yield = 33% by weight of dehusked nut
Coconut Shell yield = 22.4% by weight of dehusked nut
Figure 21 Cost Break-down for Production of Copra (ERIA, 2010)
Mature Dehusked Coconut Input
89%
Labour 6%
Transportation 2%
Overheads 3%
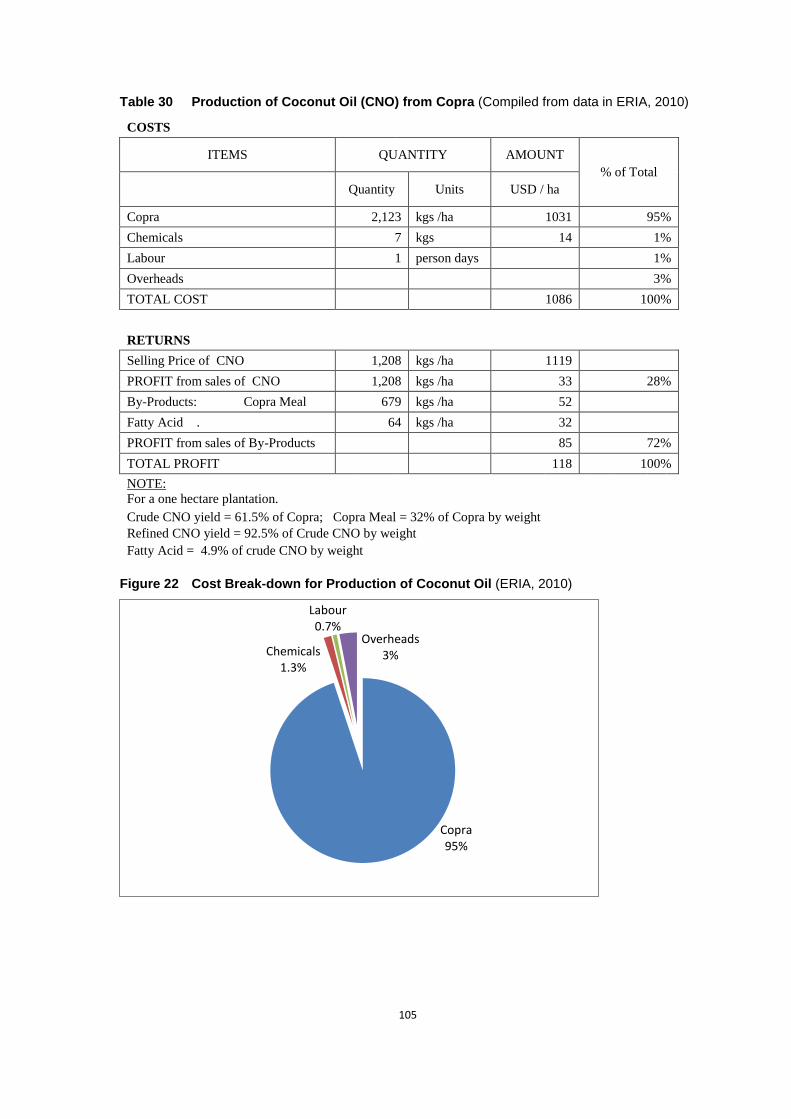
105
Table 30 Production of Coconut Oil (CNO) from Copra (Compiled from data in ERIA, 2010)
COSTS
ITEMS QUANTITY AMOUNT
% of Total
Quantity Units USD / ha
Copra 2,123 kgs /ha 1031 95%
Chemicals 7 kgs 14 1%
Labour 1 person days 1%
Overheads 3%
TOTAL COST 1086 100%
RETURNS
Selling Price of CNO 1,208 kgs /ha 1119
PROFIT from sales of CNO 1,208 kgs /ha 33 28%
By-Products: Copra Meal 679 kgs /ha 52
Fatty Acid . 64 kgs /ha 32
PROFIT from sales of By-Products 85 72%
TOTAL PROFIT 118 100%
NOTE:
For a one hectare plantation.
Crude CNO yield = 61.5% of Copra; Copra Meal = 32% of Copra by weight
Refined CNO yield = 92.5% of Crude CNO by weight
Fatty Acid = 4.9% of crude CNO by weight
Figure 22 Cost Break-down for Production of Coconut Oil (ERIA, 2010)
Copra 95%
Chemicals 1.3%
Labour 0.7%
Overheads 3%

106
Table 31 Production of Biodiesel from Coconut Oil (Compiled from data in ERIA, 2010)
COSTS
ITEMS QUANTITY AMOUNT % of Total
Quantity Units USD / ha
Coconut Oil 1,208 kgs /ha
@ 0.915 kg /litre 1,320 litres /ha 1,119 88%
Methanol, 14.5% 191 litres 80 6%
Catalyst, 0.67% 8.8 litres 7 1%
Labour 1.76 person days 14 1%
Overheads 1,320 litres /ha 58 5%
TOTAL COST 1,278 100%
RETURNS
Selling Price of Biodiesel 1,320 litres /ha 1,282
Profit from sales of Biodiesel 1,320 litres /ha 4 11%
By-Products: Glycerin, 12.5% 151 litres 27 85%
Acid oil, 0.55% 6.6 litres 1 4%
Profit from sales of By-Products 28 89%
TOTAL PROFIT 31 100%
NOTE: For a one hectare plantation.
Figure 23 Cost Break-down for Production of Biodiesel from Coconut Oil (ERIA, 2010)
Refined CNO 87%
Methanol & Catalyst
7%
Labour 1% Overheads
5%

107
Table 32 Net Profits in Production of Biodiesel (Compiled from data in ERIA, 2010)
PRODUCT NET PROFIT
BY-PRODUCT
SALES TOTAL PROFIT
USD /ha USD /ha USD /ha
Dehusked Nut 343 - 343
Copra 317 29 346
Coconut Oil - CNO 33 85 118
Biodiesel 4 28 31
TOTAL 697 142 839
NOTE: For a one hectare plantation.
Figure 24 Profits in the Stages of Production of Biodiesel (USD /ha) (ERIA, 2010)
Figure 25 Percent Profits in Biodiesel Value Chain (ERIA, 2010)
-
50
100
150
200
250
300
350
400
Dehusked Nut Copra Refined CNO Biodiesel (CME)
By - Product
Main Product
Dehusked Nut 41%
Copra 41%
Refined CNO 14%
Biodiesel 4%

108
Table 33 Total Value Added for Intermediate Products (Compiled from data in ERIA, 2010)
PRODUCT
TOTAL
PROFIT
WAGES
PAID
TAX
REVENUE
TOTAL
VALUE ADDED
% of
Total
USD /ha USD /ha USD /ha USD /ha %
Dehusked Nut 343 243 exempted 586 45%
Copra 346 40 121 507 39%
Refined CNO 118 8 41 167 13%
Biodiesel 31 14 11 56 4%
TOTAL 839 304 173 1316 100%
NOTE: For a one hectare plantation.
Figure 26 Break-down of Value Addition in Production of Biodiesel (USD/ha) (ERIA, 2010)
Figure 27 Total Value Addition in Production of Biodiesel (ERIA, 2010)
-
100
200
300
400
500
600
700
Dehusked Nut Copra Refined CNO Biodiesel (CME)
Tax Revenue
Wages Paid
Total Profit
Dehusked Nut 45%
Copra 38%
Refined CNO 13%
Biodiesel 4%


