
Evaporative Cooler As an Air Inlet Treatment Of Gas Turbine
By
Mohd Eazaq Farommi Bin Hamat (6763)
Dissertation submitted in partial fulfilment of
the requirements for the
Bachelor of Engineering (Hons)
(Mechanical Engineering)
JUNE 2008
Universiti Teknologi PETRONAS Bandar Seri Iskandar 31750 Tronoh Perak Darul Ridzuan
brought to you by COREView metadata, citation and similar papers at core.ac.uk
provided by UTPedia
CERTIFICATION OF APPROVAL
Evaporative Cooler As an Air Inlet Treatment
Of Gas Turbine
by
Mohd Eazaq Farommi Bin Hamat (6763)
A project dissertation submitted to the
Mechanical Engineering Programme
Universiti Teknologi PETRONAS
in partial fulfilment of the requirement for the
BACHELOR OF ENGINEERING (Hons)
(MECHANICAL ENGINEERING)
Approved by, _____________________ (Mr. Rahmat Iskandar Khairul Shazi Shaarani)
UNIVERSITI TEKNOLOGI PETRONAS
TRONOH, PERAK
June 2008

CERTIFICATION OF ORIGINALITY
This is to certify that I am responsible for the work submitted in this project, that the
original work is my own except as specified in the references and acknowledgements,
and that the original work contained herein have not been undertaken or done by
unspecified sources or persons.
___________________________________ MOHD EAZAQ FAROMMI BIN HAMAT
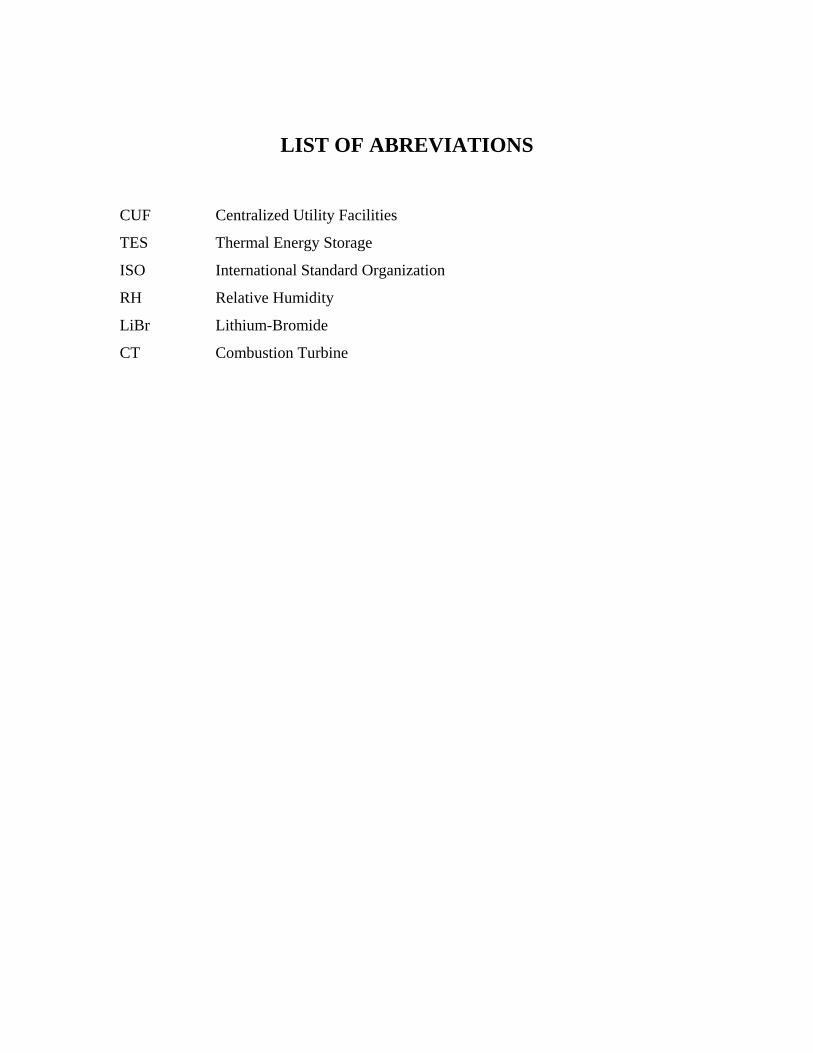
LIST OF ABREVIATIONS
CUF Centralized Utility Facilities
TES Thermal Energy Storage
ISO International Standard Organization
RH Relative Humidity
LiBr Lithium-Bromide
CT Combustion Turbine
TABLE OF CONTENT
LIST OF FIGURES . . . . . . . iv
LIST OF TABLES . . . . . . . v
ABSTRACT . . . . . . . vi
ACKNOWLEGDEMENT . . . . . . . vii
CHAPTER 1: INTRODUCTION . . . . . 1
1.1 Background Of Study 1 1.2 Problem Statement 2 1.3 Objective & Scope Of Study 2
CHAPTER 2: LITERATURE REVIEW . . . . 3
2.1 Gas Turbine Theory 3 2.2 Air Inlet Cooling 7 2.3 Mechanical Chiller Systems 8 2.4 Absorption Chiller Systems 9 2.5 Fogging Systems 10 2.6 Evaporative Cooler Systems 11
CHAPTER 3: PROJECT WORKS & METHODOLOGY . 15
3.1 Fabrication Process 15 3.2 Experimental Set up 20
CHAPTER 4: RESULTS & DISCUSSION . . . 23
4.1 Comparison of Air Inlet Cooling 23
4.2 Psychometric Chart and Air Characteristics 26
4.3 Effectiveness Measurement 28
4.4 Experiment 29
4.5 Result 30
4.6 Evaporation Rate 33
4.7 Output Recovery 35
4.8 Discussion 36
ii

CHAPTER 5: CONCLUSION&RECOMMANDATION . . 38
REFERENCES . . . . . . . . 39
iii
LIST OF FIGURES
Figure 2.1 Simple-cycle, single-shaft gas turbine 3
Figure 2.2 Simple-cycle, two-shaft gas turbine 5
Figure 2.3 Brayton Cycle 5
Figure 2.4 Combine Cycle 6
Figure 2.5 Effect of ambient temperature 7
Figure 2.6 Schematic diagram for mechanical chiller system 9
Figure 2.7 Schematic diagram of absorption chiller system 10
Figure 2.8 Schematic diagram of fog inlet air cooling system 11
Figure 2.9 Schematic diagram of evaporative cooling 12
Figure 2.10 Evaporative cooler system 13
Figure 2.11 Close up aspenpad media 14
Figure 2.12 Aspenpad holder 14
Figure 2.13 Close up rigid media pad 14
Figure 2.14 Rigid media in its holder 14
Figure 3.1 Diagram of the basic design of the prototype 15
Figure 3.2 Dimension of cooler pad 16
Figure 3.3 Cooler pad 17
Figure 3.4 Cooler casing 17
Figure 3.5 Engineering drawing of the evaporative cooler 18
Figure 3.6 Dimension of the evaporative cooler 19
Figure 3.7 Experimental set up 20
Figure 4.1 Psychrometric chart 27
Figure 4.2 Properties of moist air on psychrometric chart 28
Figure 4.3 Schematic diagram how water distribution system to the cooler
pad 29
Figure 4.4 Relationship between temperature and time 31
Figure 4.5 Cooler effectiveness and temperature gradient relationship 32
Figure 4.6 Reservoir tank dimension 33
Figure 4.7 The evaporative cooler forecast chart 37
iv
LIST OF TABLES
Table 3.1 Apparatus for fabrication 16
Table 3.2 Apparatus of the experiment 21
Table 3.3 Specification of the Anemometer 21
Table 4.1 Qualitative analysis of air inlet cooling technologies 23
Table 4.2 Quantitative analysis of air inlet cooling technologies 24
Table 4.3 Capital cost comparisons of inlet cooling systems 25
Table 4.4 Major contributor of O&M 26
Table 4.5 The Wet Bulb Temperature 30
Table 4.6 Temperature gradient and cooler effectiveness 31
Table 4.7 Power output recovery 35
v
ABSTRACT
This author is studying the air inlet treatment of gas turbine. This is due to the problem of
lower efficiency of gas turbine when deal with the hot and dry air. This problem also
rises in the CUF Kertih, Terengganu power plant. The gas turbine cannot achieve the
maximum power output. The performance of a gas turbine varies significantly with
ambient air temperature. As the air temperature rises, its density decreases, resulting in
reduced mass flow through the compressor and turbine, thereby causing a corresponding
reduction in turbine output. Actually, nowadays many technologies are used in the world
regarding the cooling air inlet gas turbines. They have proved that this kind air treatment
can increase the power output capacity. In this project, author will be studying on existing
technologies out there used in the industry and discuss the most common technologies
used. Make some analysis and comparison of each technology. The selected system is
evaporative cooler. Evaporative cooler is the most widely used technology in the world in
order increase the power output of the gas turbine. This is the most cost effective
technology being used in the power plants. In fact, in hot and humid regions, it often isn’t
possible to accomplish more than about -9 to -12°C of cooling. The experiment was
carried out with the evaporative cooler prototype in order to make some data analysis.
The result show that evaporative cooler reduced the inlet temperature hence increased the
power output of gas turbine.
vi

ACKNOWLEDGEMENT
In the name of ALLAH, Most Gracious Merciful, alhamdulillah, His willing has made it
possible for me to complete my Final Year Project, and resilience and good health given
to me end up with this dissertation. Sincere gratitude to my supervisor, Mr. Rahmat
Iskandar Khairul Shazi Shaarani, for his guidance, inspiration and support through the
course of this project. In addition, his patience and encouragement from the beginning of
my involvement in this project under title Evaporative Cooler as an Air Inlet Treatment
of Gas Turbine. Also my utmost gratitude goes to all individuals who helping me
including lab technicians, Mr. Jailani for his support, my friends for their encouragement
along the project period. My heartfelt gratification also goes to all the authors of journals
which are related to this project for their information in order to complete this project.
Finally, special thanks for others that involved direct or indirectly in my project, without
them this project will not be as successful as it is.
vii
CHAPTER 1
INTRODUCTION
1.1 BACKGROUND OF STUDY
Nowadays the gas turbine is a major player in the huge power generation market. As [1]
said, the first gas in production for electrical power generation was introduced by Brown
Boverif Switzerland in 1937. Almost all electrical power on earth is produced with a
turbine of some type. A turbine is a rotary engine that extracts energy from a fluid flow.
Very high efficiency turbine about 40% of the thermal energy, with the rest exhausted as
waste heat. There are many different kind of turbine available. Some common ones are
gas turbine, steam turbine, wind turbine, and locomotive turbine. It has been an issue on
how to increase the efficiency of a turbine based on the factors that affects its
performance.
There are currently 6 nos. of gas turbine in Centralized Utility Facilities Kertih
Terengganu. Five of them operate simultaneously and one remains off as back up. Gas
turbine engines are sometimes referred to as turbine engines. Such engines usually
feature an inlet, fan, compressor, combustor and nozzle in addition to one or more
turbines. Theoretically, each gas turbine in the plant is able to produce about 36MW of
power. However due to some factor effecting the power production of the gas turbine, it
is almost impossible to achieve the output power of about 36MW.
1
1.2 PROBLEM STATEMENT
1.2.1 Problem identification
Nowadays gas turbine are installed in many places from desert to coastal, tropical, arctic,
agricultural, oil fields, etc[2]. Problem occurs when gas turbine air inlet temperature is
high. It will affect the performance of gas turbine itself. Gas turbine cannot maximize the
power output because of the high air inlet temperature. With our local climate of wet and
dry throughout the year, it is impossible to keep constantly low air inlet temperature
naturally.
1.2.2 Significance of the project
There are several improvement methods to reduce the air inlet temperature. These
methods have their own advantages and limitations according the specified places. For
instance evaporative cooler is a good way to reduce the air intake temperature. So this
project will study the characteristic of the evaporative cooler.
1.3 OBJECTIVE & SCOPES OF STUDY
In order to complete this project within the time limit, several objectives for this study
have been identified and listed such as below:
1. Study on the effects of air intake temperature to the gas turbine generator
performance.
2. Identification of most common possible solution to the problem
3. Design a simple test rig to test the principle of evaporative cooler using media
pad.
4. Calculation to predict the impact of evaporative coolers on gas turbine
performance.
2
CHAPTER 2
LITERATURE REVIEW
2.1 Gas Turbine Theory
2.1.1 Gas Turbine Cycles.
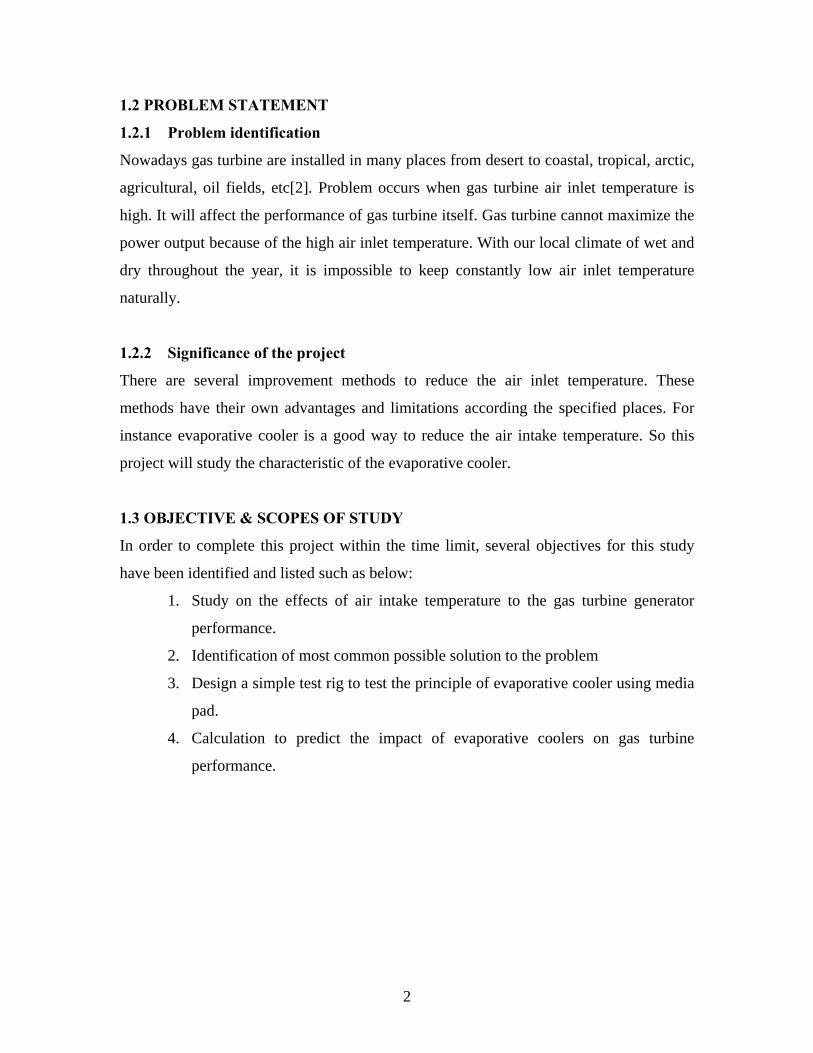
A schematic diagram for a simple-cycle, singleshaft gas turbine is shown in Figure 2.1.
Air enters the axial flow compressor at point 1 at ambient conditions. Since these
conditions vary from day to day and from location to location, it is convenient to consider
some standard conditions for comparative purposes. The standard conditions used by the
gas turbine industry are 59 F/15 C, 14.7 psia/1.013 bar and 60% relative humidity, which
are established by the International Standards Organization (ISO) and frequently referred
to as ISO conditions[2,3,7,8,9].
Figure 2.1: Simple-cycle, single-shaft gas turbine [5]
Air entering the compressor at point 1 is compressed to some higher pressure. No heat is
added; however, compression raises the air temperature so that the air at the discharge of
the compressor is at a higher temperature and pressure. Upon leaving the compressor, air
enters the combustion system at point 2, where fuel is injected and combustion occurs.
The combustion process occurs at essentially constant pressure. Although high local
temperatures are reached within the primary combustion zone, the combustion system is
designed to provide mixing, burning, dilution and cooling. Thus, by the time the
3
combustion mixture leaves the combustion system and enters the turbine at point 3, it is
at a mixed average temperature.
In the turbine section of the gas turbine, the energy of the hot gases is converted into
work. This conversion actually takes place in two steps. In the nozzle section of the
turbine, the hot gases are expanded and a portion of the thermal energy is converted into
kinetic energy. In the subsequent bucket section of the turbine, a portion of the kinetic
energy is transferred to the rotating buckets and converted to work. Some of the work
developed by the turbine is used to drive the compressor, and the remainder is available
for useful work at the output flange of the gas turbine. Typically, more than 50% of the
work developed by the turbine sections is used to power the axial flow compressor [5].
As shown in Figure 2.1, single-shaft gas turbines are configured in one continuous shaft
and, therefore, all stages operate at the same speed. These units are typically used for
generatordrive applications where significant speed variation is not required.
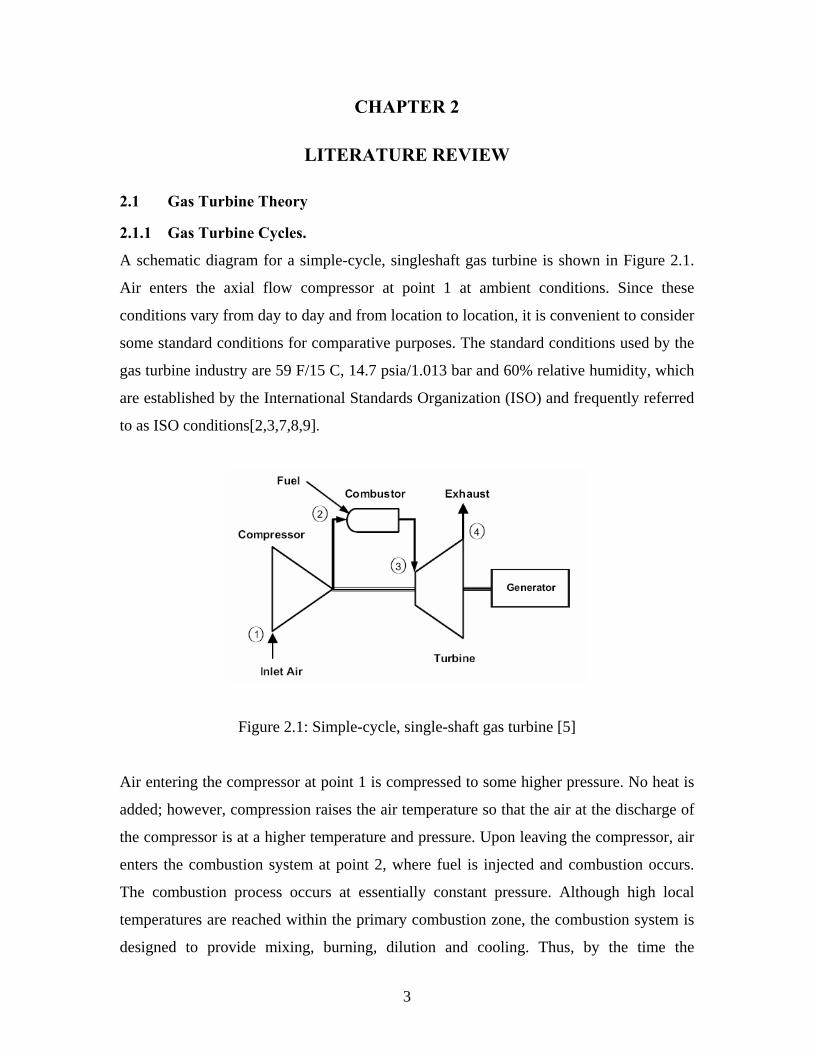
A schematic diagram for a simple-cycle, twoshaft gas turbine is shown in Figure 2.2. The
low-pressure or power turbine rotor is mechanically separate from the high-pressure
turbine and compressor rotor. The low pressure rotor is said to be aerodynamically
coupled. This unique feature allows the power turbine to be operated at a range of speeds
and makes two shaft gas turbines ideally suited for variable speed applications. All of the
work developed by the power turbine is available to drive the load equipment since the
work developed by the high-pressure turbine supplies all the necessary energy to drive
the compressor. On two-shaft machines the starting requirements for the gas turbine load
train are reduced because the load equipment is mechanically separate from the high-
pressure turbine.
4
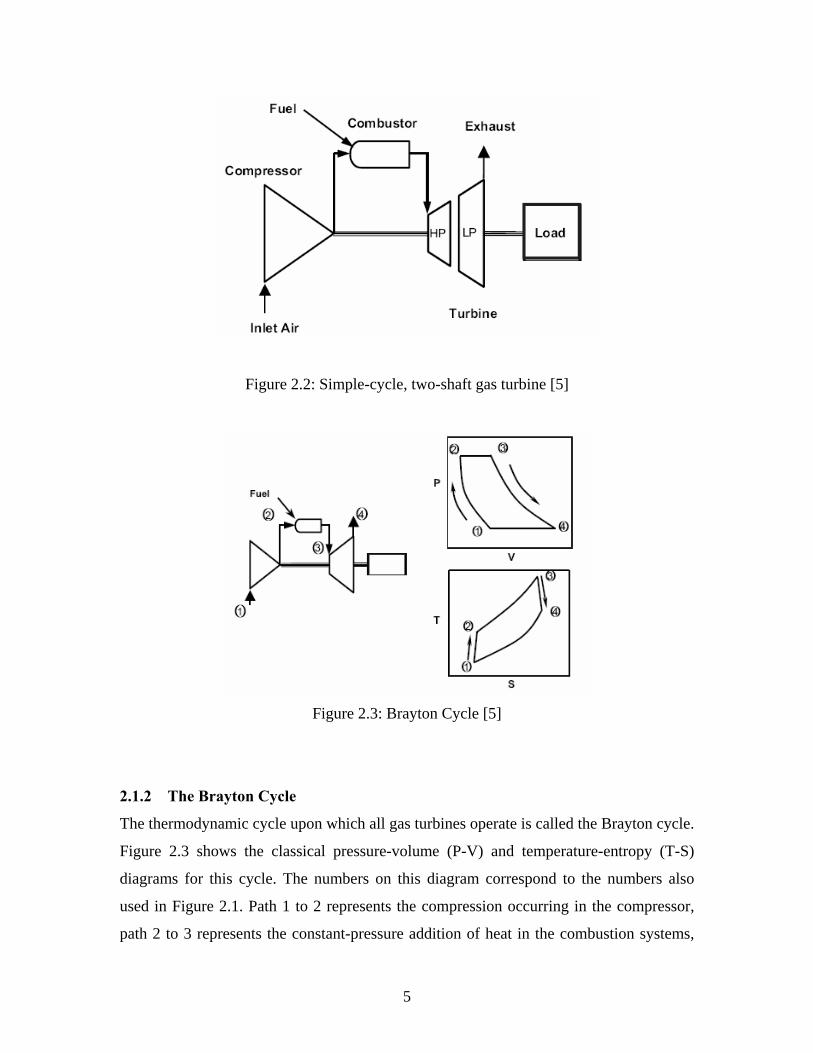
Figure 2.2: Simple-cycle, two-shaft gas turbine [5]
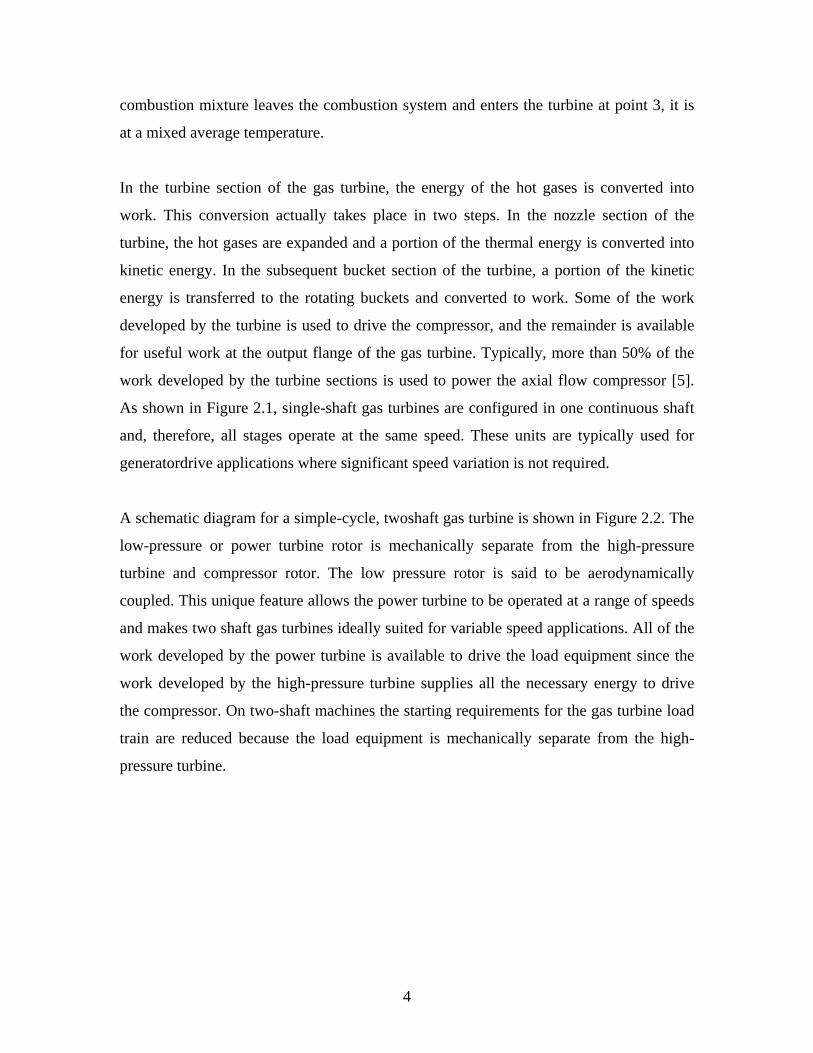
Figure 2.3: Brayton Cycle [5]
2.1.2 The Brayton Cycle
The thermodynamic cycle upon which all gas turbines operate is called the Brayton cycle.
Figure 2.3 shows the classical pressure-volume (P-V) and temperature-entropy (T-S)
diagrams for this cycle. The numbers on this diagram correspond to the numbers also
used in Figure 2.1. Path 1 to 2 represents the compression occurring in the compressor,
path 2 to 3 represents the constant-pressure addition of heat in the combustion systems,
5
and path 3 to 4 represents the expansion occurring in the turbine. The path from 4 back to
1 on the Brayton cycle diagrams indicates a constant-pressure cooling process. In the gas
turbine, this cooling is done by the atmosphere, which provides fresh, cool air at point 1
on a continuous basis in exchange for the hot gases exhausted to the atmosphere at point
4. The actual cycle is an “open” rather than “closed” cycle, as indicated.
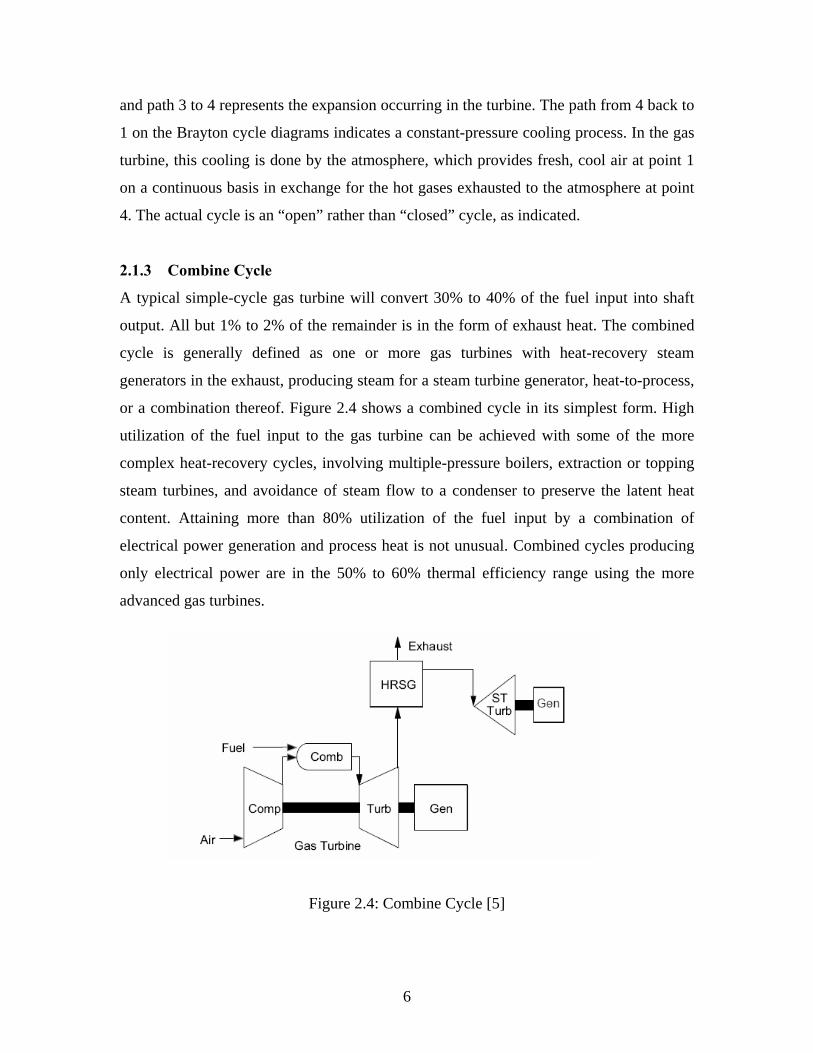
2.1.3 Combine Cycle
A typical simple-cycle gas turbine will convert 30% to 40% of the fuel input into shaft
output. All but 1% to 2% of the remainder is in the form of exhaust heat. The combined
cycle is generally defined as one or more gas turbines with heat-recovery steam
generators in the exhaust, producing steam for a steam turbine generator, heat-to-process,
or a combination thereof. Figure 2.4 shows a combined cycle in its simplest form. High
utilization of the fuel input to the gas turbine can be achieved with some of the more
complex heat-recovery cycles, involving multiple-pressure boilers, extraction or topping
steam turbines, and avoidance of steam flow to a condenser to preserve the latent heat
content. Attaining more than 80% utilization of the fuel input by a combination of
electrical power generation and process heat is not unusual. Combined cycles producing
only electrical power are in the 50% to 60% thermal efficiency range using the more
advanced gas turbines.
Figure 2.4: Combine Cycle [5]
6
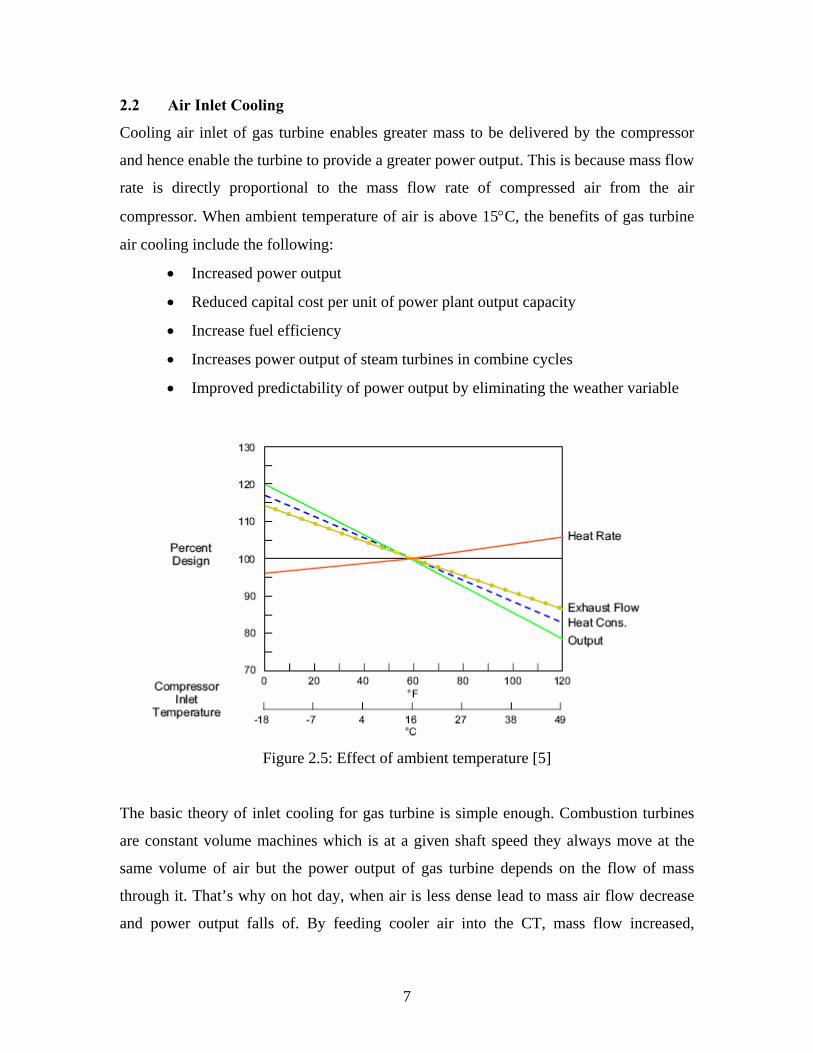
2.2 Air Inlet Cooling
Cooling air inlet of gas turbine enables greater mass to be delivered by the compressor
and hence enable the turbine to provide a greater power output. This is because mass flow
rate is directly proportional to the mass flow rate of compressed air from the air
compressor. When ambient temperature of air is above 15°C, the benefits of gas turbine
air cooling include the following:
• Increased power output
• Reduced capital cost per unit of power plant output capacity
• Increase fuel efficiency
• Increases power output of steam turbines in combine cycles
• Improved predictability of power output by eliminating the weather variable
Figure 2.5: Effect of ambient temperature [5]
The basic theory of inlet cooling for gas turbine is simple enough. Combustion turbines
are constant volume machines which is at a given shaft speed they always move at the
same volume of air but the power output of gas turbine depends on the flow of mass
through it. That’s why on hot day, when air is less dense lead to mass air flow decrease
and power output falls of. By feeding cooler air into the CT, mass flow increased,
7
resulting good advantages as stated above. Another factor is the power consumed by the
CT’s compressor. The work required to compress air directly proportional to the
temperature of the air, so reducing the inlet air temperature reduces the work of
compressor and there is more work available at the power turbine output shaft.
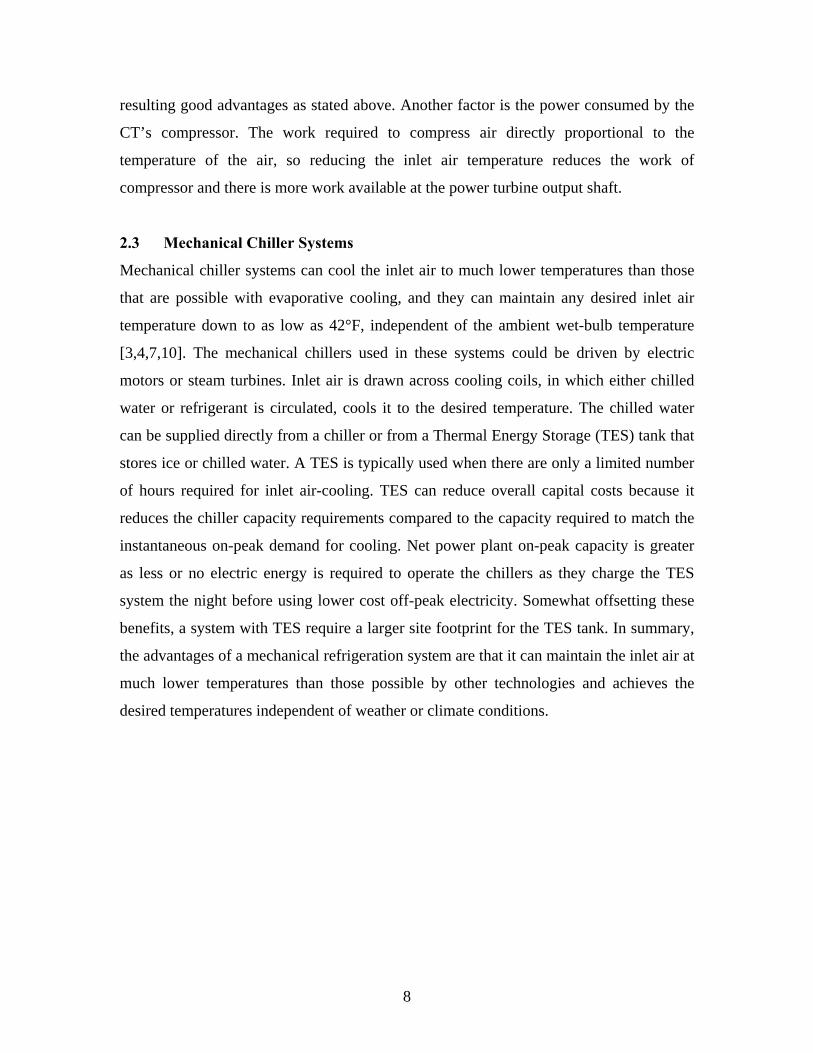
2.3 Mechanical Chiller Systems
Mechanical chiller systems can cool the inlet air to much lower temperatures than those
that are possible with evaporative cooling, and they can maintain any desired inlet air
temperature down to as low as 42°F, independent of the ambient wet-bulb temperature
[3,4,7,10]. The mechanical chillers used in these systems could be driven by electric
motors or steam turbines. Inlet air is drawn across cooling coils, in which either chilled
water or refrigerant is circulated, cools it to the desired temperature. The chilled water
can be supplied directly from a chiller or from a Thermal Energy Storage (TES) tank that
stores ice or chilled water. A TES is typically used when there are only a limited number
of hours required for inlet air-cooling. TES can reduce overall capital costs because it
reduces the chiller capacity requirements compared to the capacity required to match the
instantaneous on-peak demand for cooling. Net power plant on-peak capacity is greater
as less or no electric energy is required to operate the chillers as they charge the TES
system the night before using lower cost off-peak electricity. Somewhat offsetting these
benefits, a system with TES require a larger site footprint for the TES tank. In summary,
the advantages of a mechanical refrigeration system are that it can maintain the inlet air at
much lower temperatures than those possible by other technologies and achieves the
desired temperatures independent of weather or climate conditions.
8
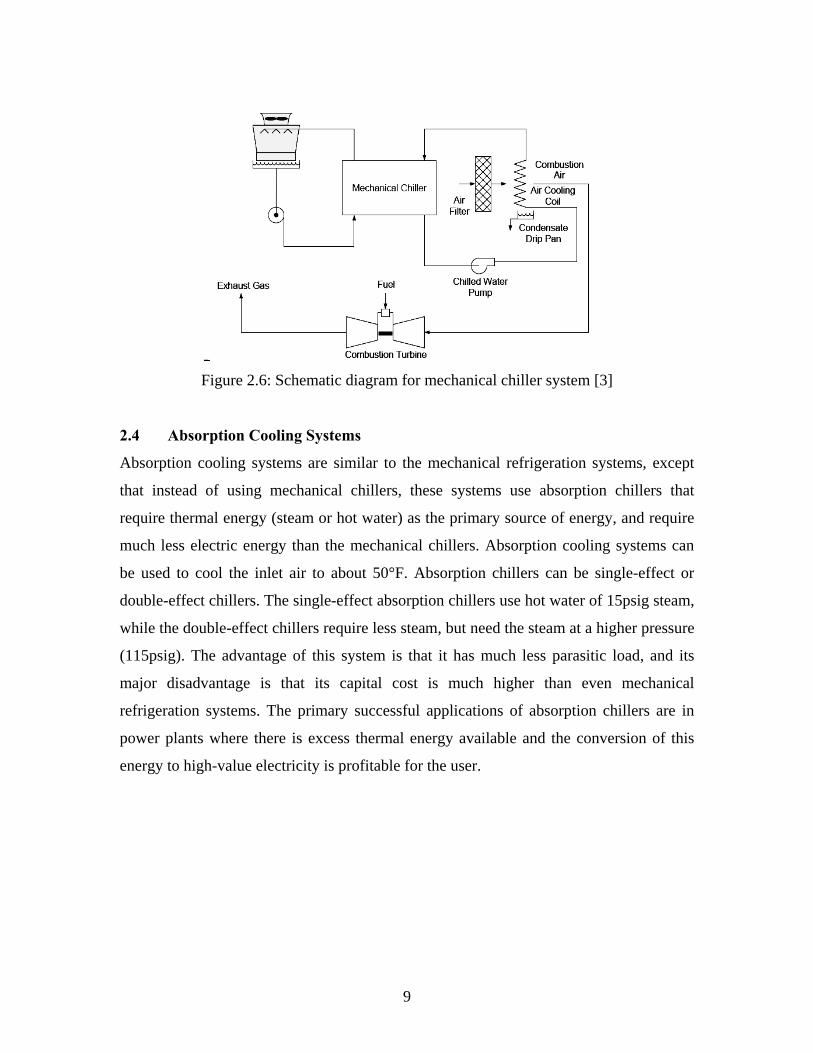
Figure 2.6: Schematic diagram for mechanical chiller system [3]
2.4 Absorption Cooling Systems
Absorption cooling systems are similar to the mechanical refrigeration systems, except
that instead of using mechanical chillers, these systems use absorption chillers that
require thermal energy (steam or hot water) as the primary source of energy, and require
much less electric energy than the mechanical chillers. Absorption cooling systems can
be used to cool the inlet air to about 50°F. Absorption chillers can be single-effect or
double-effect chillers. The single-effect absorption chillers use hot water of 15psig steam,
while the double-effect chillers require less steam, but need the steam at a higher pressure
(115psig). The advantage of this system is that it has much less parasitic load, and its
major disadvantage is that its capital cost is much higher than even mechanical
refrigeration systems. The primary successful applications of absorption chillers are in
power plants where there is excess thermal energy available and the conversion of this
energy to high-value electricity is profitable for the user.
9
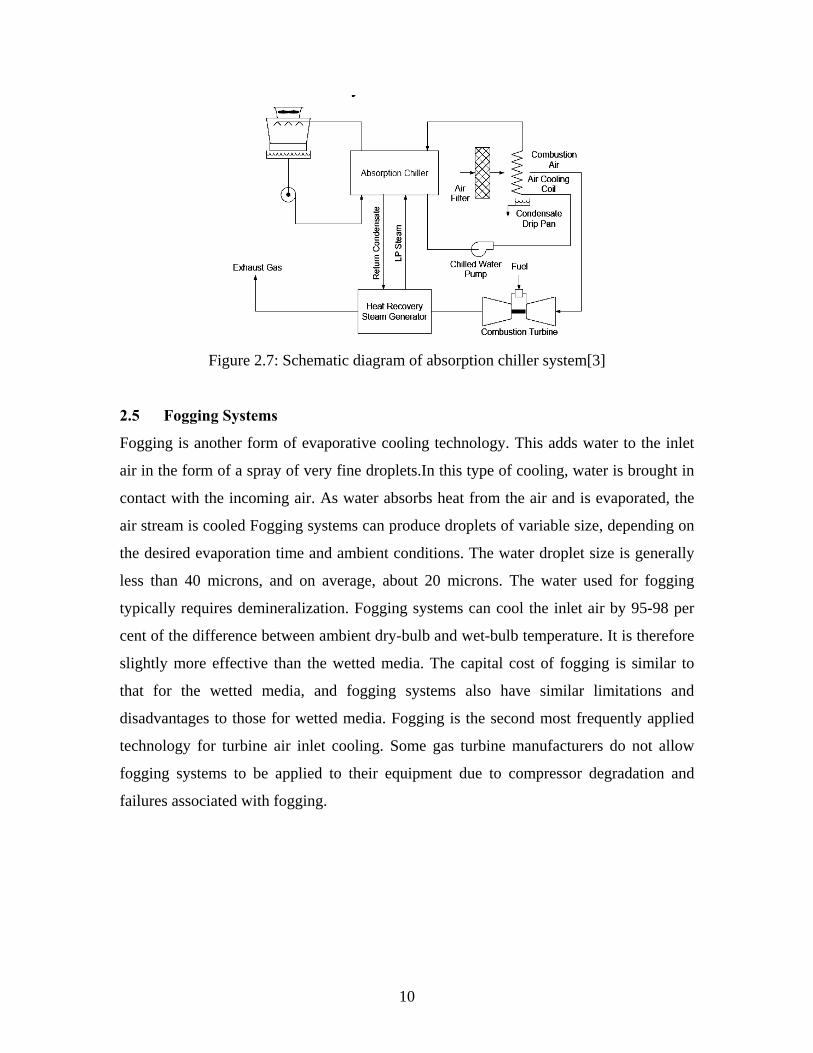
Figure 2.7: Schematic diagram of absorption chiller system[3]
2.5 Fogging Systems
Fogging is another form of evaporative cooling technology. This adds water to the inlet
air in the form of a spray of very fine droplets.In this type of cooling, water is brought in
contact with the incoming air. As water absorbs heat from the air and is evaporated, the
air stream is cooled Fogging systems can produce droplets of variable size, depending on
the desired evaporation time and ambient conditions. The water droplet size is generally
less than 40 microns, and on average, about 20 microns. The water used for fogging
typically requires demineralization. Fogging systems can cool the inlet air by 95-98 per
cent of the difference between ambient dry-bulb and wet-bulb temperature. It is therefore
slightly more effective than the wetted media. The capital cost of fogging is similar to
that for the wetted media, and fogging systems also have similar limitations and
disadvantages to those for wetted media. Fogging is the second most frequently applied
technology for turbine air inlet cooling. Some gas turbine manufacturers do not allow
fogging systems to be applied to their equipment due to compressor degradation and
failures associated with fogging.
10
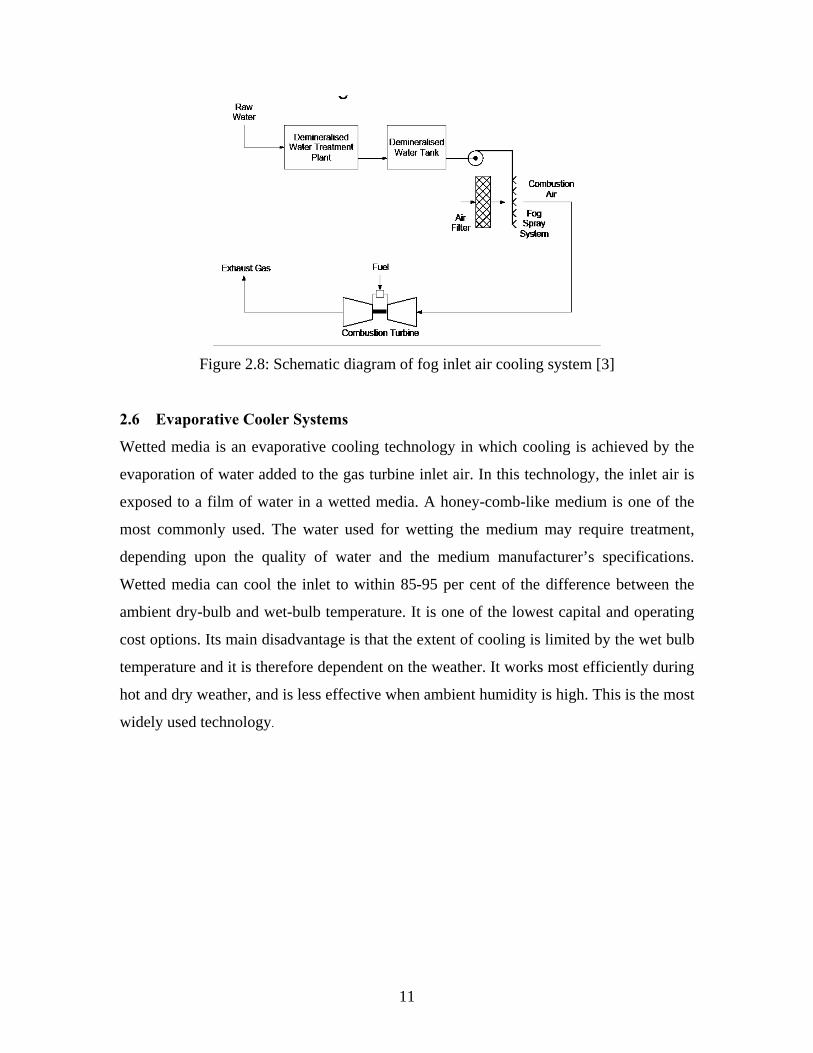
Figure 2.8: Schematic diagram of fog inlet air cooling system [3]
2.6 Evaporative Cooler Systems
Wetted media is an evaporative cooling technology in which cooling is achieved by the
evaporation of water added to the gas turbine inlet air. In this technology, the inlet air is
exposed to a film of water in a wetted media. A honey-comb-like medium is one of the
most commonly used. The water used for wetting the medium may require treatment,
depending upon the quality of water and the medium manufacturer’s specifications.
Wetted media can cool the inlet to within 85-95 per cent of the difference between the
ambient dry-bulb and wet-bulb temperature. It is one of the lowest capital and operating
cost options. Its main disadvantage is that the extent of cooling is limited by the wet bulb
temperature and it is therefore dependent on the weather. It works most efficiently during
hot and dry weather, and is less effective when ambient humidity is high. This is the most
widely used technology.
11
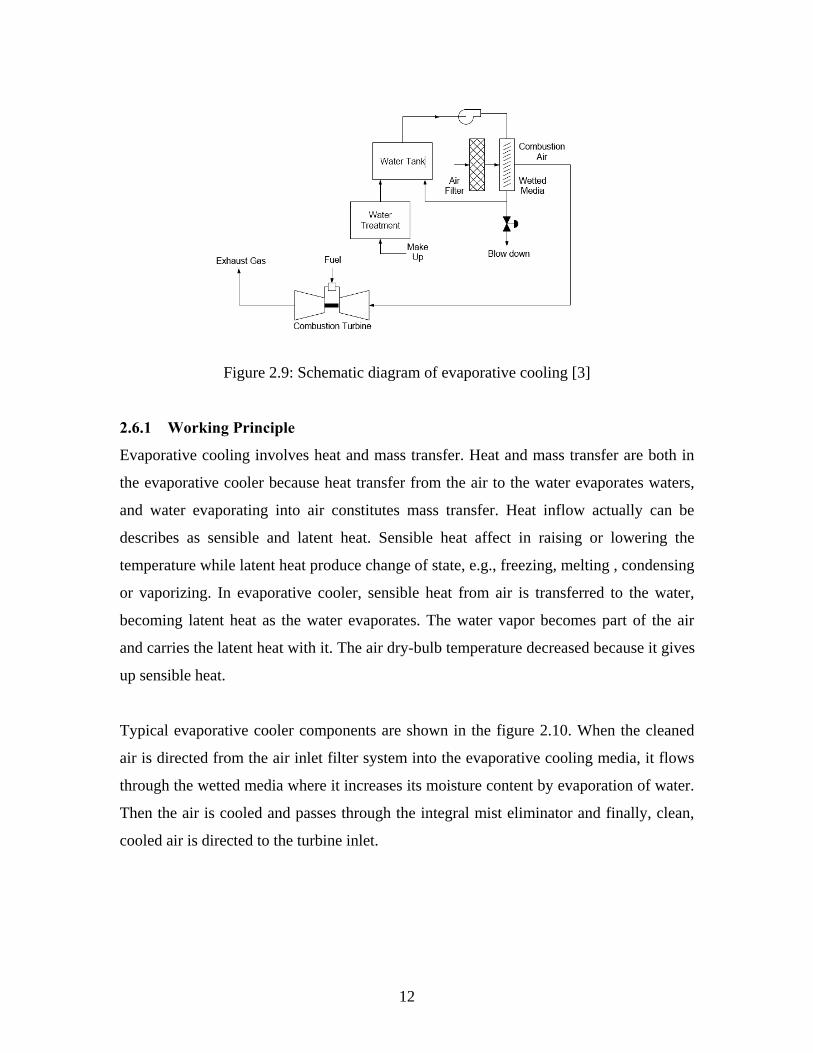
Figure 2.9: Schematic diagram of evaporative cooling [3]
2.6.1 Working Principle
Evaporative cooling involves heat and mass transfer. Heat and mass transfer are both in
the evaporative cooler because heat transfer from the air to the water evaporates waters,
and water evaporating into air constitutes mass transfer. Heat inflow actually can be
describes as sensible and latent heat. Sensible heat affect in raising or lowering the
temperature while latent heat produce change of state, e.g., freezing, melting , condensing
or vaporizing. In evaporative cooler, sensible heat from air is transferred to the water,
becoming latent heat as the water evaporates. The water vapor becomes part of the air
and carries the latent heat with it. The air dry-bulb temperature decreased because it gives
up sensible heat.
Typical evaporative cooler components are shown in the figure 2.10. When the cleaned
air is directed from the air inlet filter system into the evaporative cooling media, it flows
through the wetted media where it increases its moisture content by evaporation of water.
Then the air is cooled and passes through the integral mist eliminator and finally, clean,
cooled air is directed to the turbine inlet.
12
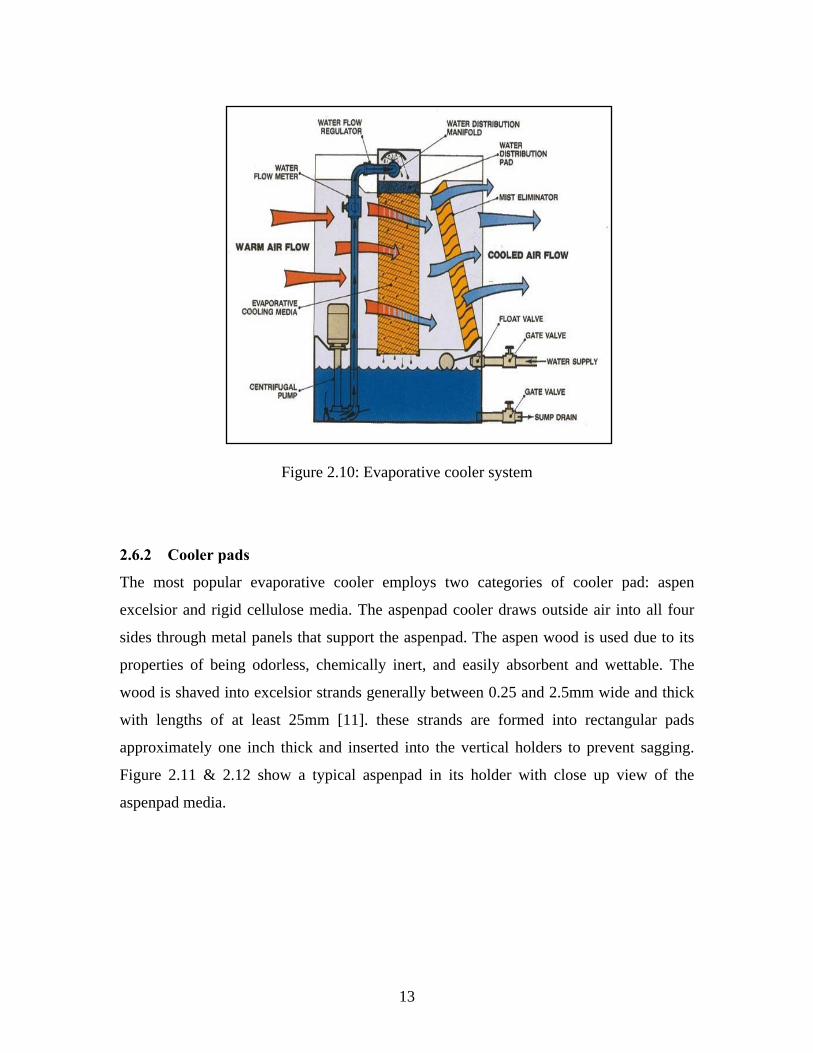
Figure 2.10: Evaporative cooler system
2.6.2 Cooler pads
The most popular evaporative cooler employs two categories of cooler pad: aspen
excelsior and rigid cellulose media. The aspenpad cooler draws outside air into all four
sides through metal panels that support the aspenpad. The aspen wood is used due to its
properties of being odorless, chemically inert, and easily absorbent and wettable. The
wood is shaved into excelsior strands generally between 0.25 and 2.5mm wide and thick
with lengths of at least 25mm [11]. these strands are formed into rectangular pads
approximately one inch thick and inserted into the vertical holders to prevent sagging.
Figure 2.11 & 2.12 show a typical aspenpad in its holder with close up view of the
aspenpad media.
13
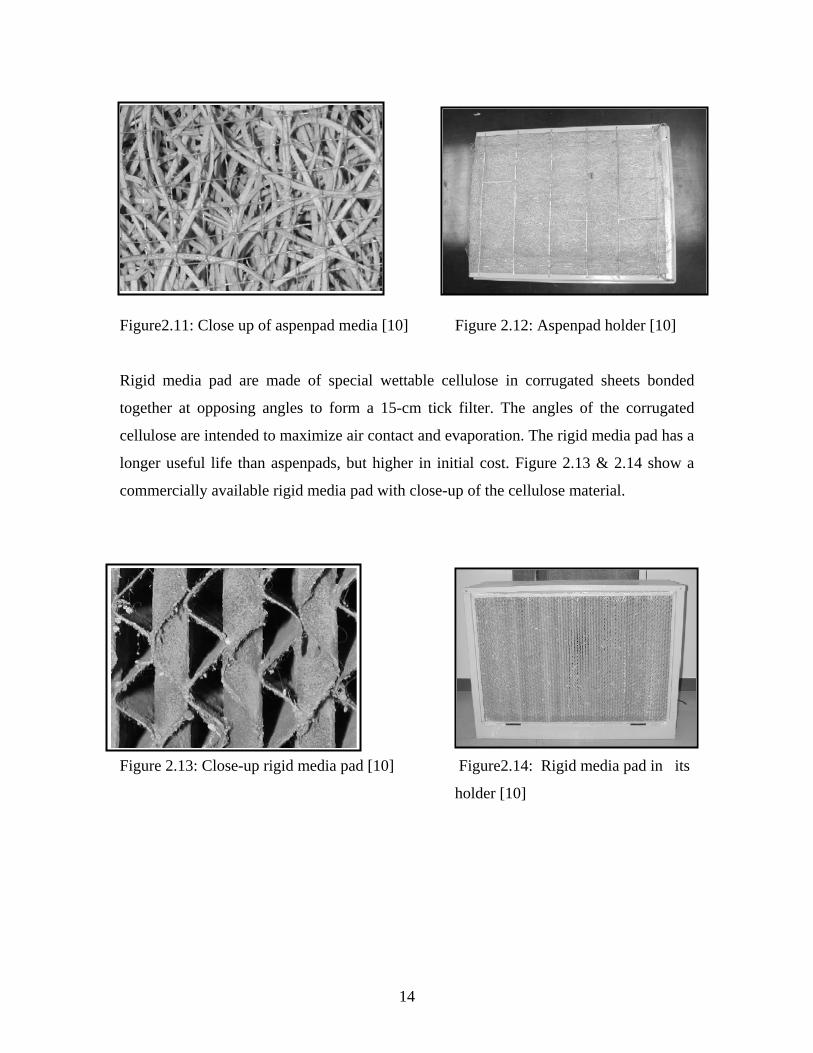
Figure2.11: Close up of aspenpad media [10] Figure 2.12: Aspenpad holder [10]
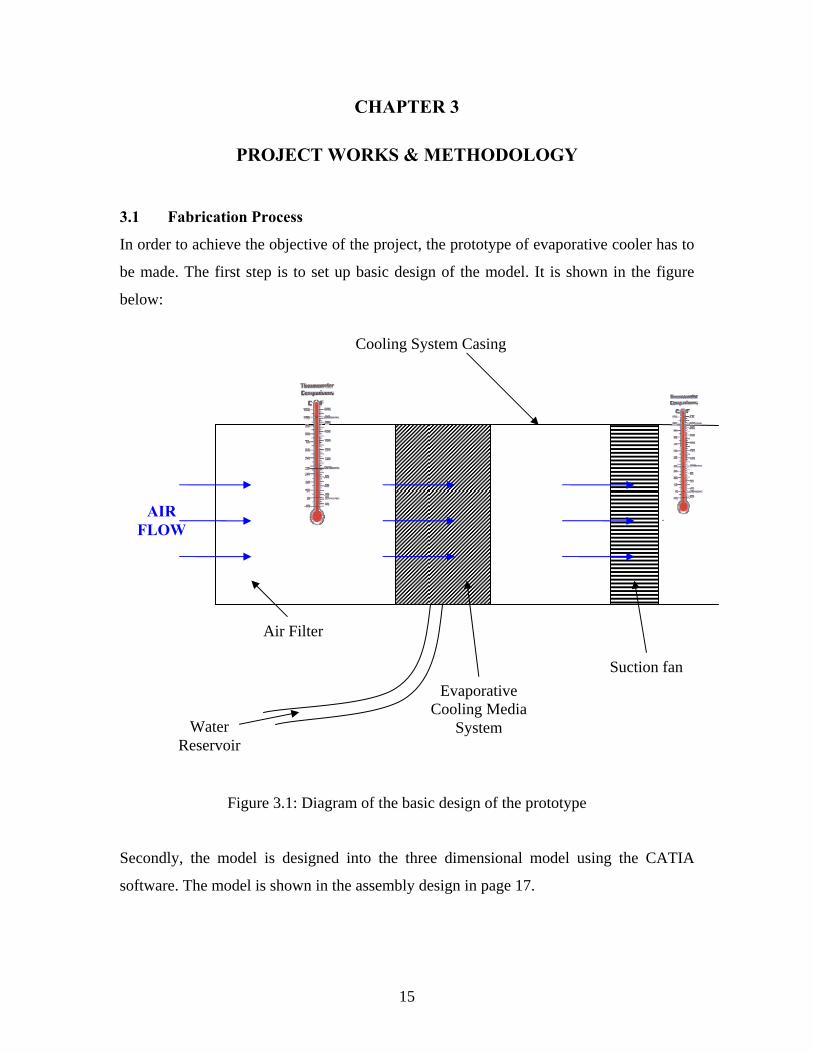
Rigid media pad are made of special wettable cellulose in corrugated sheets bonded
together at opposing angles to form a 15-cm tick filter. The angles of the corrugated
cellulose are intended to maximize air contact and evaporation. The rigid media pad has a
longer useful life than aspenpads, but higher in initial cost. Figure 2.13 & 2.14 show a
commercially available rigid media pad with close-up of the cellulose material.
Figure 2.13: Close-up rigid media pad [10] Figure2.14: Rigid media pad in its
holder [10]
14
CHAPTER 3
PROJECT WORKS & METHODOLOGY
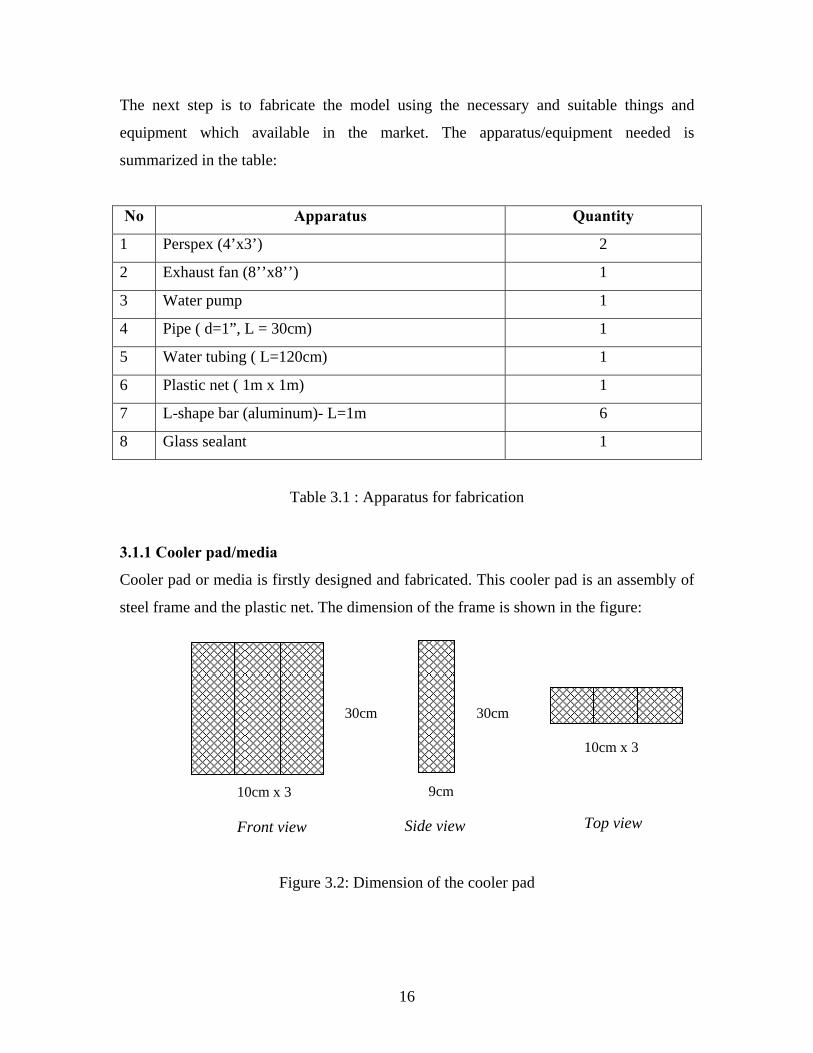
3.1 Fabrication Process
In order to achieve the objective of the project, the prototype of evaporative cooler has to
be made. The first step is to set up basic design of the model. It is shown in the figure
below:
Water Reservoir
Evaporative Cooling Media
System
Suction fan
Air Filter
Cooling System Casing
AIR FLOW
Figure 3.1: Diagram of the basic design of the prototype
Secondly, the model is designed into the three dimensional model using the CATIA
software. The model is shown in the assembly design in page 17.
15
The next step is to fabricate the model using the necessary and suitable things and
equipment which available in the market. The apparatus/equipment needed is
summarized in the table:
No Apparatus Quantity
1 Perspex (4’x3’) 2
2 Exhaust fan (8’’x8’’) 1
3 Water pump 1
4 Pipe ( d=1”, L = 30cm) 1
5 Water tubing ( L=120cm) 1
6 Plastic net ( 1m x 1m) 1
7 L-shape bar (aluminum)- L=1m 6
8 Glass sealant 1
Table 3.1 : Apparatus for fabrication
3.1.1 Cooler pad/media
Cooler pad or media is firstly designed and fabricated. This cooler pad is an assembly of
steel frame and the plastic net. The dimension of the frame is shown in the figure:
30cm 30cm
10cm x 3
Side view
9cm 10cm x 3
Front view
Top view
Figure 3.2: Dimension of the cooler pad
16
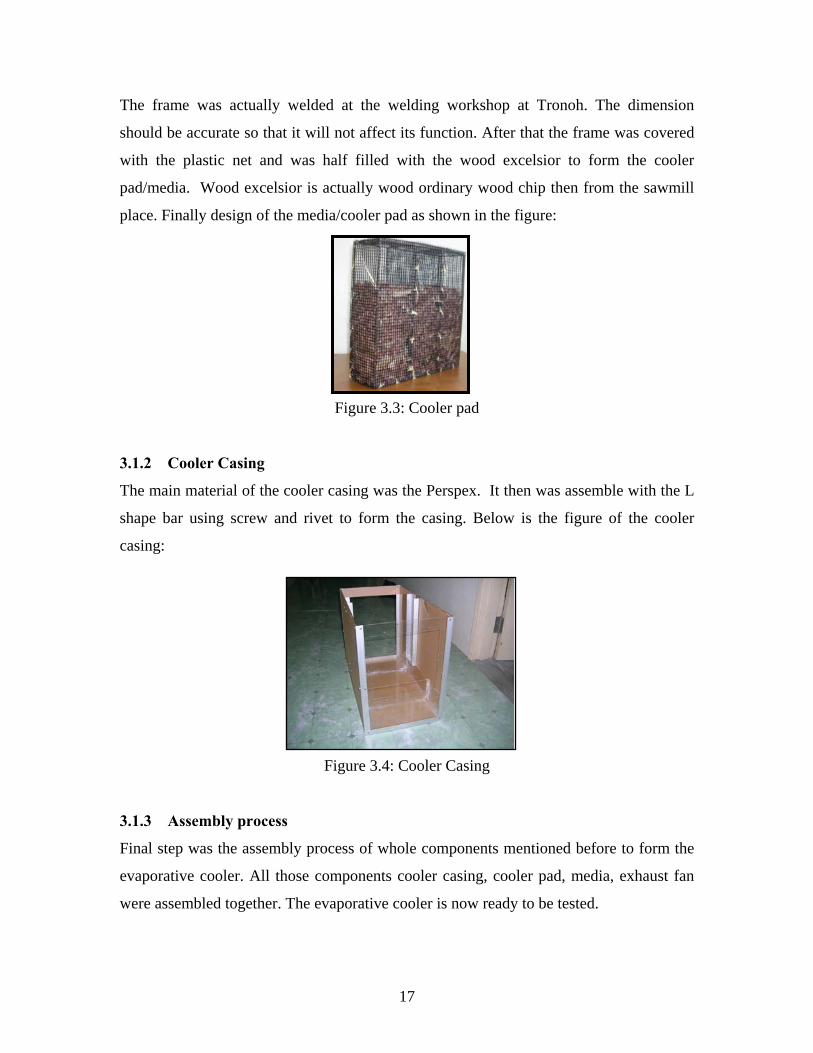
The frame was actually welded at the welding workshop at Tronoh. The dimension
should be accurate so that it will not affect its function. After that the frame was covered
with the plastic net and was half filled with the wood excelsior to form the cooler
pad/media. Wood excelsior is actually wood ordinary wood chip then from the sawmill
place. Finally design of the media/cooler pad as shown in the figure:
Figure 3.3: Cooler pad
3.1.2 Cooler Casing
The main material of the cooler casing was the Perspex. It then was assemble with the L
shape bar using screw and rivet to form the casing. Below is the figure of the cooler
casing:
Figure 3.4: Cooler Casing
3.1.3 Assembly process
Final step was the assembly process of whole components mentioned before to form the
evaporative cooler. All those components cooler casing, cooler pad, media, exhaust fan
were assembled together. The evaporative cooler is now ready to be tested.
17
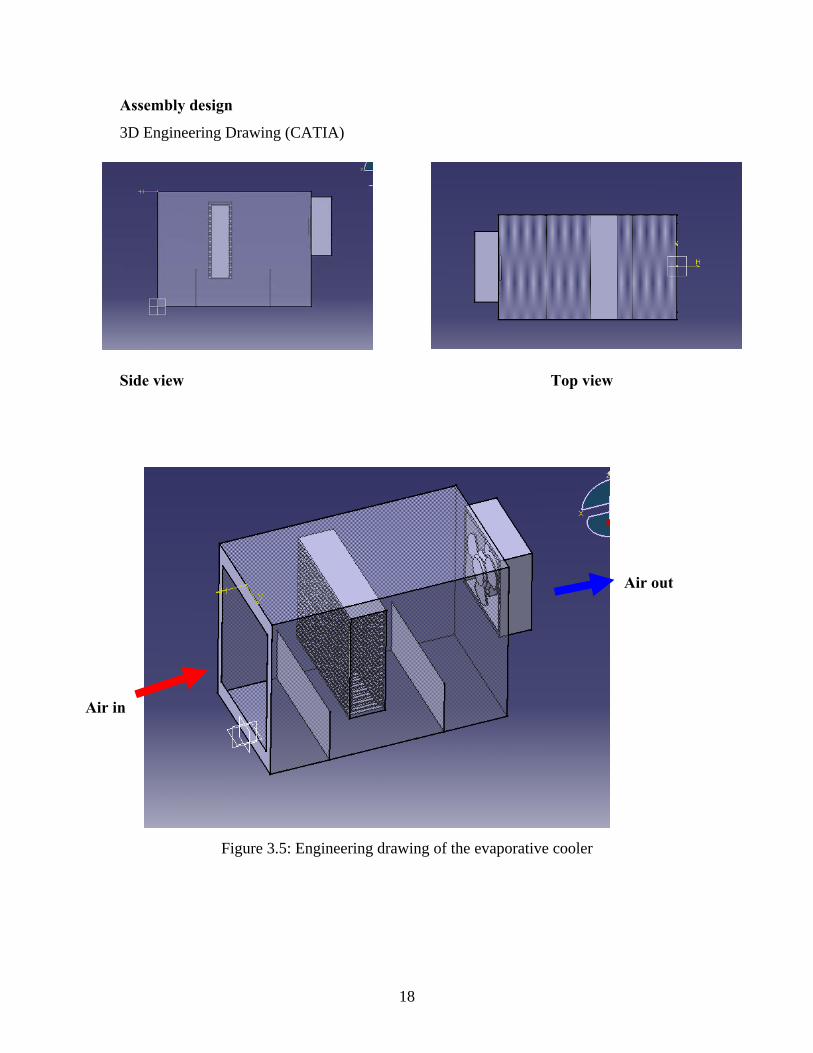
Assembly design
3D Engineering Drawing (CATIA)
ide view Top view
S
Air out
Air in
Figure 3.5: Engineering drawing of the evaporative cooler
18
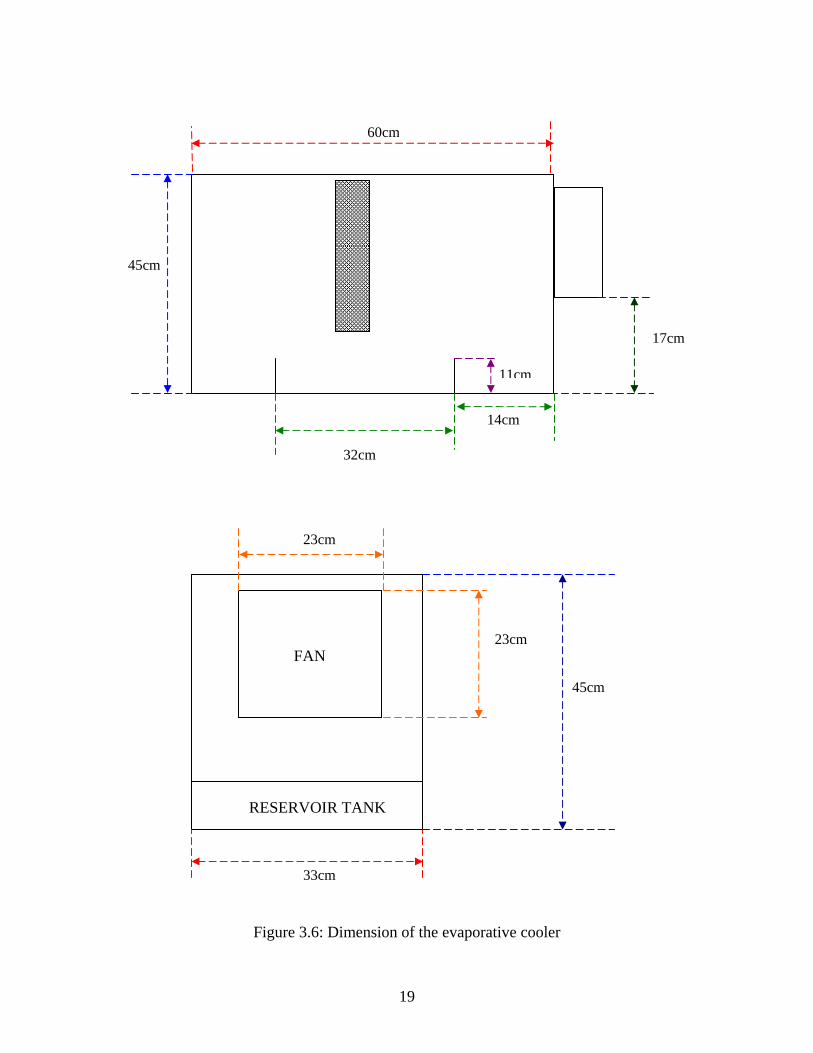
60cm
45cm
17cm
11cm
Figure 3.6: Dimension of the evaporative cooler
32cm
14cm
23cm
23cm
45cm
FAN
33cm
RESERVOIR TANK
19
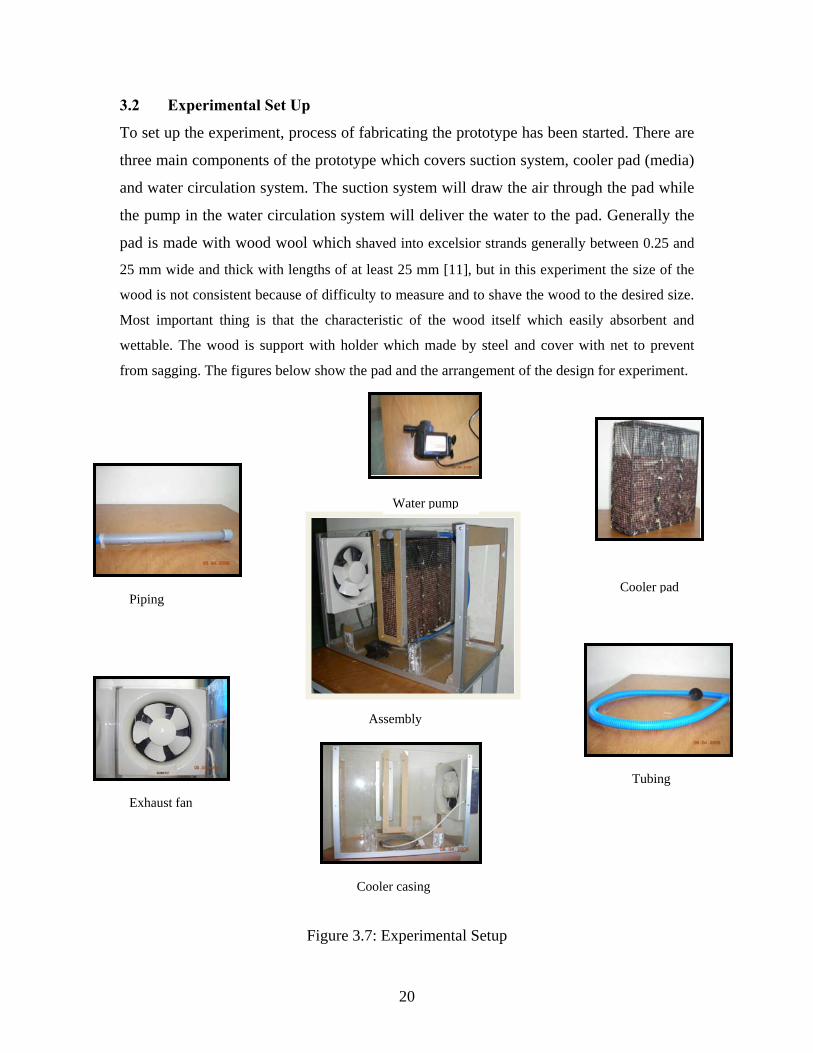
3.2 Experimental Set Up
o set up the experi ting the prototype has been started. There are
ree main components of the prototype which covers suction system, cooler pad (media)
nd water rculation system. The suction syst will draw the air through the pad while
e pump in the water circu ystem will deliver the water to the pad. Generally the
ad is made with wood wool which shaved into excelsior strands generally between 0.25 and
25 mm wide and thick riment the size of the
is difficulty to measure and to shave the wood to the desired size.
T ment, process of fabrica
th
a ci em
th lation s
p
with lengths of at least 25 mm [11], but in this expe
wood not consistent because of
Most important thing is that the characteristic of the wood itself which easily absorbent and
wettable. The wood is support with holder which made by steel and cover with net to prevent
from sagging. The figures below show the pad and the arrangement of the design for experiment.
Figure 3.7: Experimental Setup
Water pump
Cooler padPiping
Assembly
Tubing
Exhaust fan
Cooler casing
20
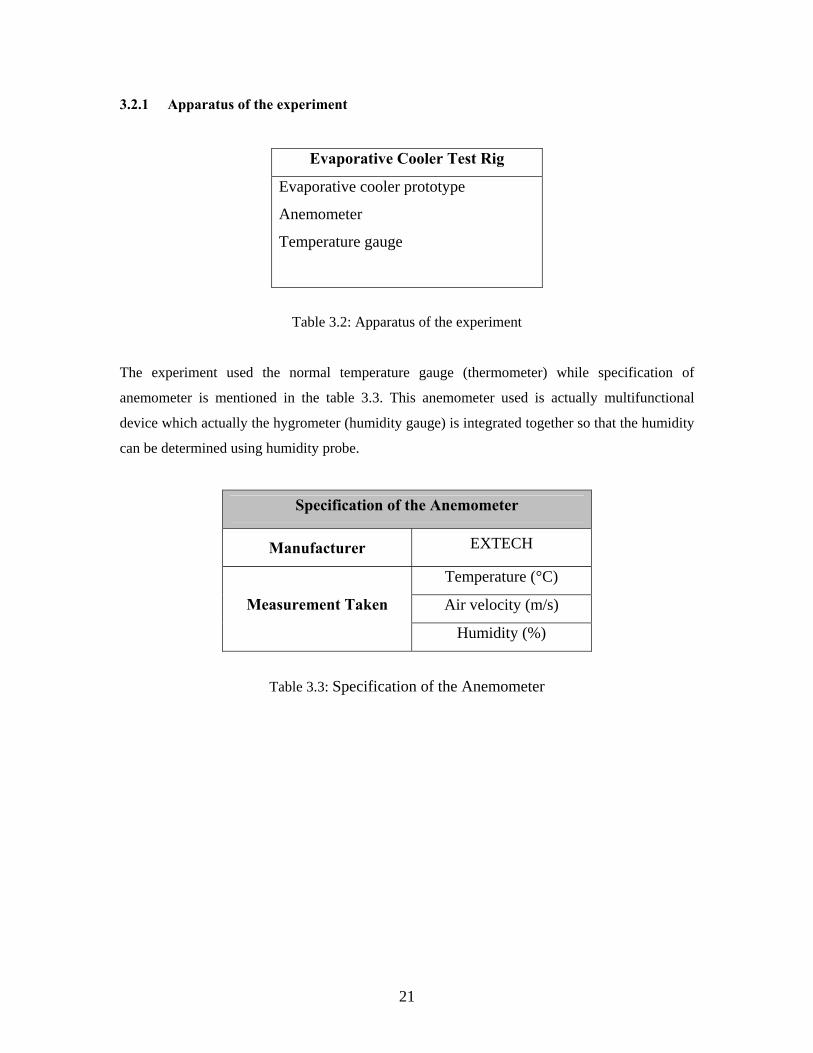
3.2.1 Apparatus of the experiment
Evaporative Cooler Test Rig
Evaporative cooler prototype
Anemomete
Temperature gauge
r
Table 3.2: Apparatus of the experiment
The experiment used the hermometer) while specification of
anemometer is mentioned in the table 3.3. This anemometer used is actually multifunctional
device which actually the h auge) is integrated together so that the humidity
can be determined using humidity probe.
normal temperature gauge (t
ygrometer (humidity g
Specification of the Anemometer
Manufacturer EXTECH
Temperature (°C)
Air velocity (m/s) Measurement Taken
Humidity (%)
Tab
le 3.3: Specification of the Anemometer
21
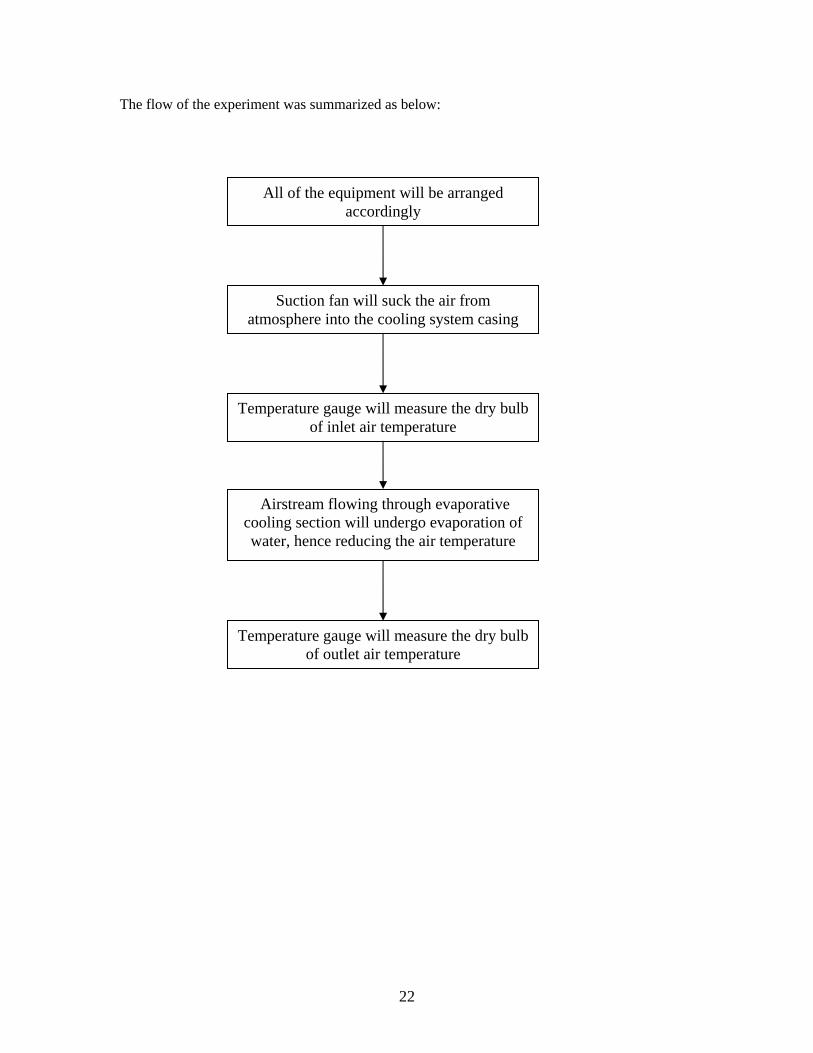
The flow of the experiment was summarized as below:
All of the equipment will be arranged accordingly
Suction fan will suck the aiatmosphere into the cooling system
r from casing
Temperature gauge will measure the dry bulb of inlet air temperature
Airstream flowing through evaporative cooling section will undergo evaporation of water, hence reducing the air temperature
Temperature gauge will measure the dry bulb of outlet air temperature
22
CHAPTER 4
RESULTS & DISCUSSIONS
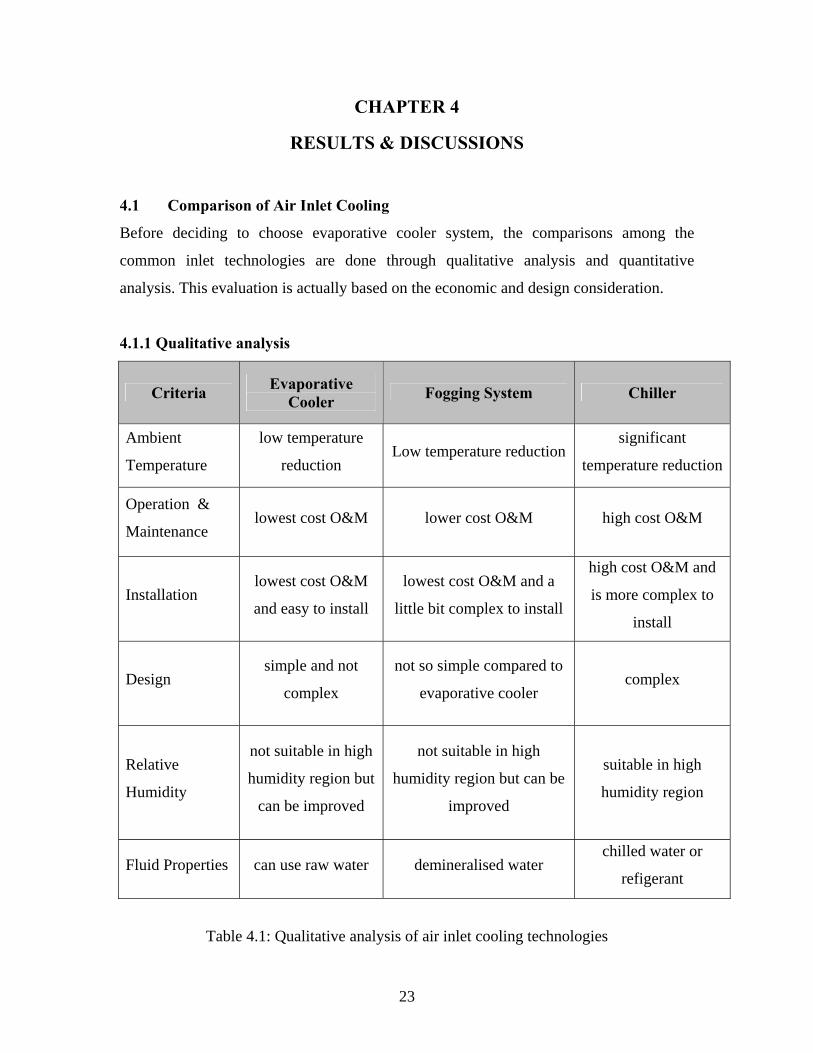
.1 Comparison of Air Inlet Cooling
efore deciding to choose evaporative cooler system, the comparisons among the
ommon inlet technologies are done through qualitative analysis and quantitative
analysis. This evaluation is actually based on the economic and design consideration.
4.1.1 Qualitative analysis
4
B
c
Evaporative Criteria Fogging System Chiller Cooler
Ambient
Temperature
low temperature
reduction Low temperature reduction
significant
temperature reduction
Operation & lowest cost O&M lower cost O&M high cost O&M
Maintenance
Instlowest cost O&M
and easy to install
low a
little bit complex to install
high cost O&M and
is mo x to allation est cost O&M and
re comple
install
Design sim t
complex
not so simple compared to
evaporative cooler complex
ple and no
Relative not suitable in high
h
not suitable in high
h Humidity
umidity region but
can be improved
umidity region but can be
improved
suitable in high
humidity region
Fluid Properties can use raw water chilled water or
demineralised water refigerant
Table 4.1: Qualitative analysis of air inlet cooling technologies
23
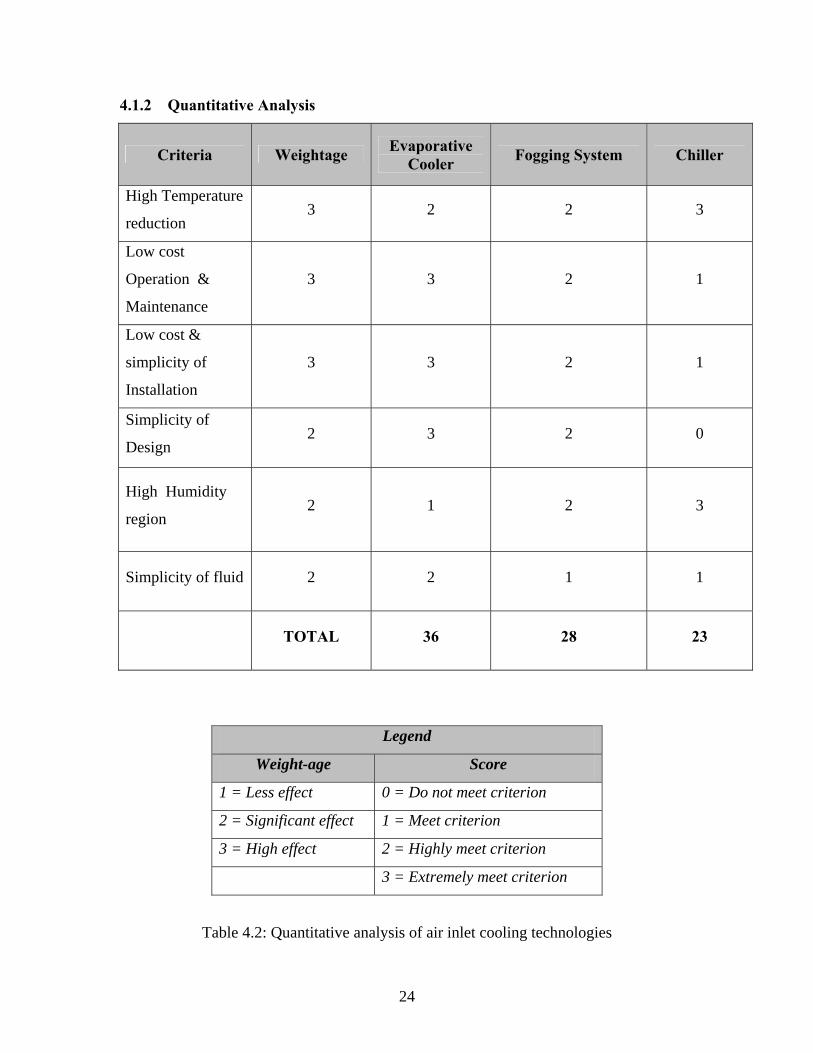
4.1.2 Quantitative Analysis
Criteria Weightage Evaporative Cooler Fogging System Chiller
High Temperature 3 2 2
reduction 3
Low cost
Maintenanc
3 3 2 1 Operation &
e
Low cost &
simplicity of
Insta
3 3 2 1
llation
Simplicity of
Design 2 3 2 0
High Hum
region
idity 2 1 2 3
Simplicity of fluid 2 2 1 1
TOTAL 36 28 23
Legend
Weight-age Score
1 = Less effect 0 = Do not meet criterion
2 = Significant effect 1 = Meet criterion
3 = High effect 2 = Highly meet criterion
3 = Extremely meet criterion
Table 4.2: Quantitative analysis of air inlet cooling technologies
24
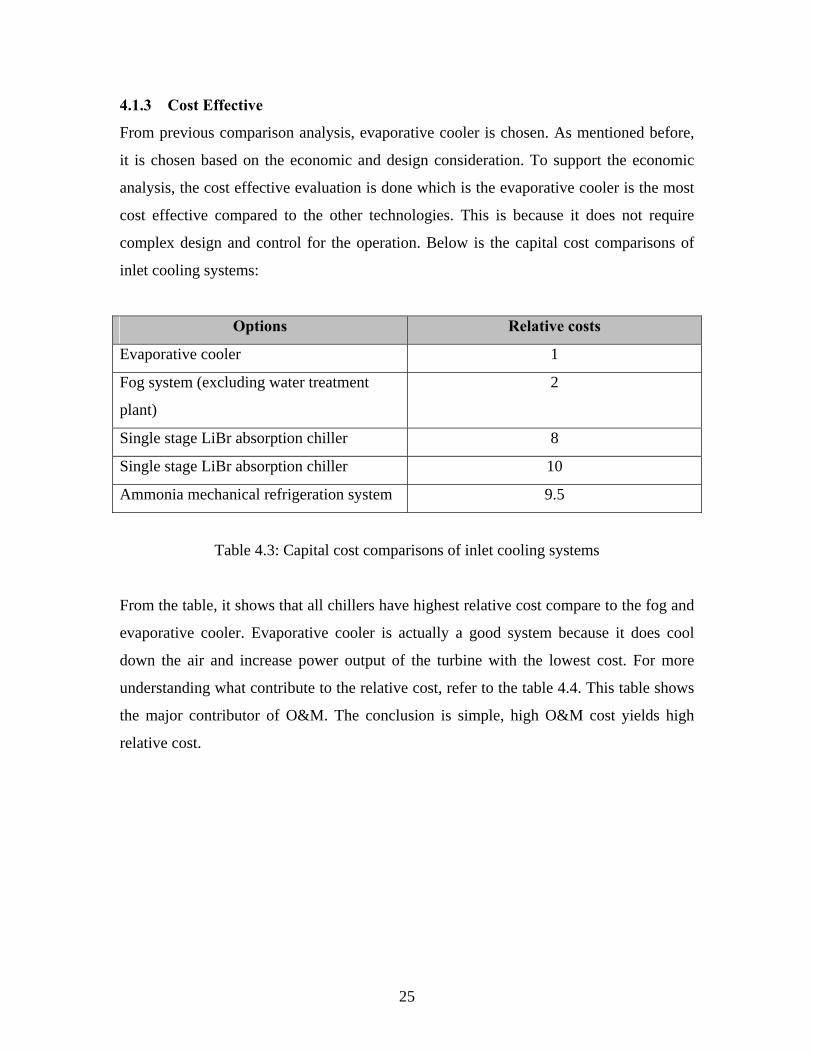
4.1.3 Cost Effective
From previous comp is, evaporative cooler is chosen. As mentioned before,
it is chosen based on the economic and support the economic
analysis, the co is aporative cooler is the most
cost effective other te e it does not require
complex design and control for the ope st comparisons of
let cooling systems:
arison analys
design consideration. To
st effective evaluation done which is the ev
compared to the chnologies. This is becaus
ration. Below is the capital co
in
Options Relative costs
Evaporative cooler 1
Fog system (excluding water treatment
plant)
2
Single stage LiBr absorption chiller 8
Single stage LiBr absorption chiller 10
Ammonia mechanical refrigeration system 9.5
Ta apital cost comparisons of inlet c
have highest relative cost compare to the fog and
tive cooler. Evaporative cooler is actually a good system because it does cool
tput of the turbine with the lowest cost. For more
relative cost, refer to the tab 4. This table shows
usion is simple, high
lative cost.
ble 4.3: C ooling systems
From the table, it shows that all chillers
evapora
down the air and increase power ou
understanding what contribute to the le 4.
the major contributor of O&M. The concl O&M cost yields high
re
25
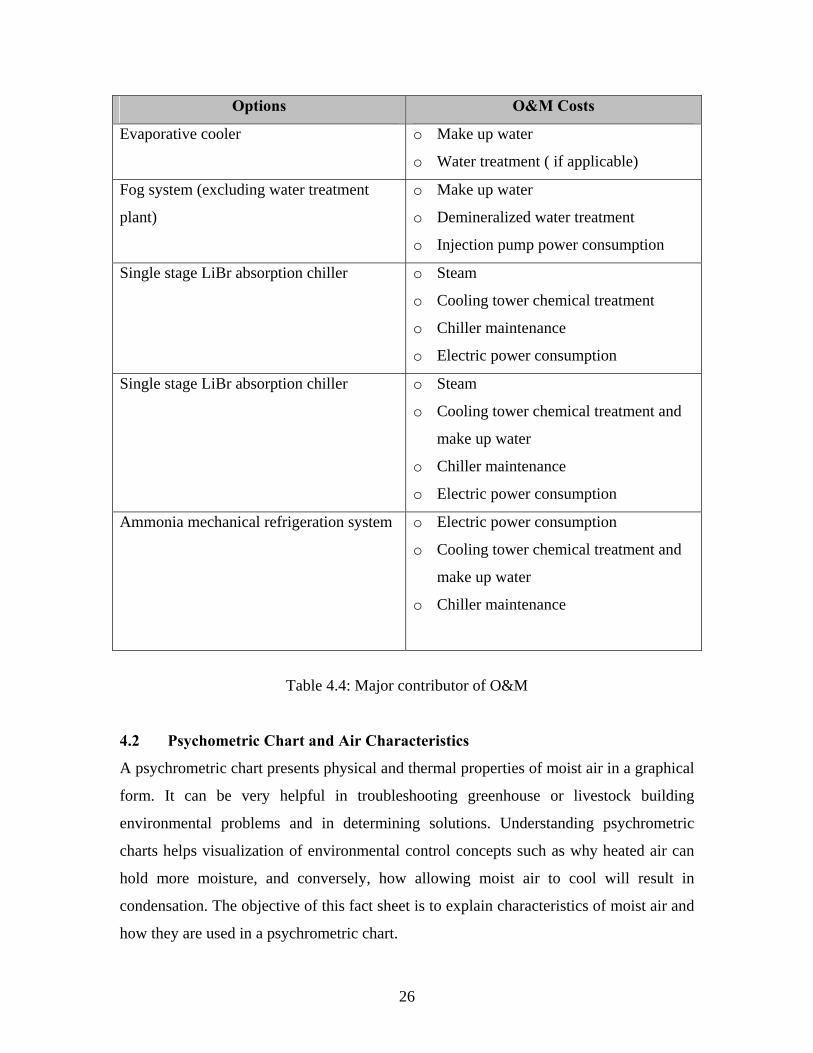
Options O&M Costs
Evaporative cooler o Make up water
o Water treatment ( if applicable)
Fog system (excluding water treatment
lant)
o Make up water
o Demineralized water treatment
o Injection pump power consumption
p
Single stage LiBr absorption chiller o Steam
o Cooling tower chemical treatment
o Chiller maintenance
o Electric pow n er consumptio
Single stage LiBr absorption chiller
t and
o Steam
o Cooling tower chemical treatmen
make up water
o Chiller maintenance
o Electric power consumption
Ammonia mechanical refrigeration system power consumption
nd
o Electric
o Cooling tower chemical treatment a
make up water
o Chiller maintenance
Table 4.4: Major contri
4.2 Psychometric Chart and Air Chara
t graphical
form. It can be very helpful in troubles
environmental problems and in determining solutions. Understanding psychrometric
charts helps visualization of environmental c hy heated air can
hold more moisture, and conversely, how allowing moist air to cool will result in
ondensation. The objective of this fact sheet is to explain characteristics of moist air and
how they are used in a ps
butor of O&M
cteristics
A psychrometric chart presents physical and hermal properties of moist air in a
hooting greenhouse or livestock building
ontrol concepts such as w
c
ychrometric chart.
26
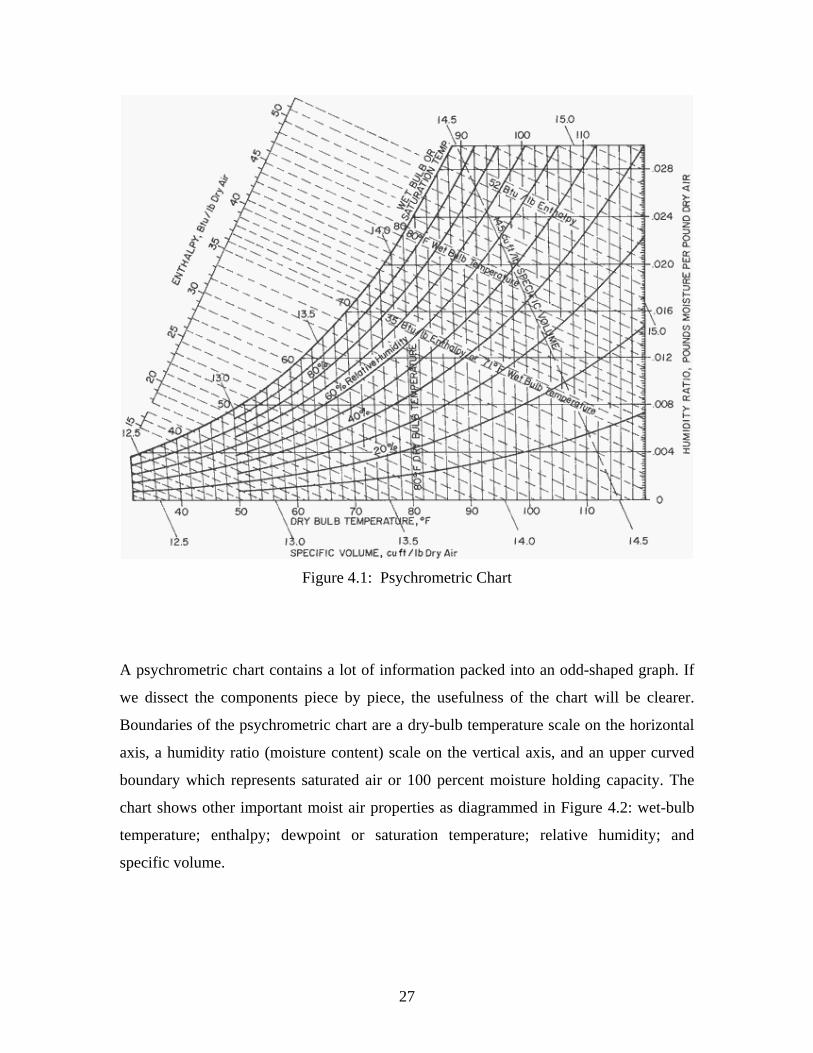
Figure 4.1: Psychrometric Chart
A psychrometric chart contains a lot of information packed into an odd-shaped graph. If
we dissect the components piece by piece, the usefulness of the chart will be clearer.
Boundaries of the psychrometric chart are a dry-bulb temperature scale on the horizontal
axis, a humidity ratio (moisture content) scale on the vertical axis, and an upper curved
boundary which represents saturated air or 100 percent moisture holding capacity. The
chart shows other important moist air properties as diagrammed in Figure 4.2: wet-bulb
temperature; enthalpy; dew e; relative humidity; and
specific volume.
point or saturation temperatur
27
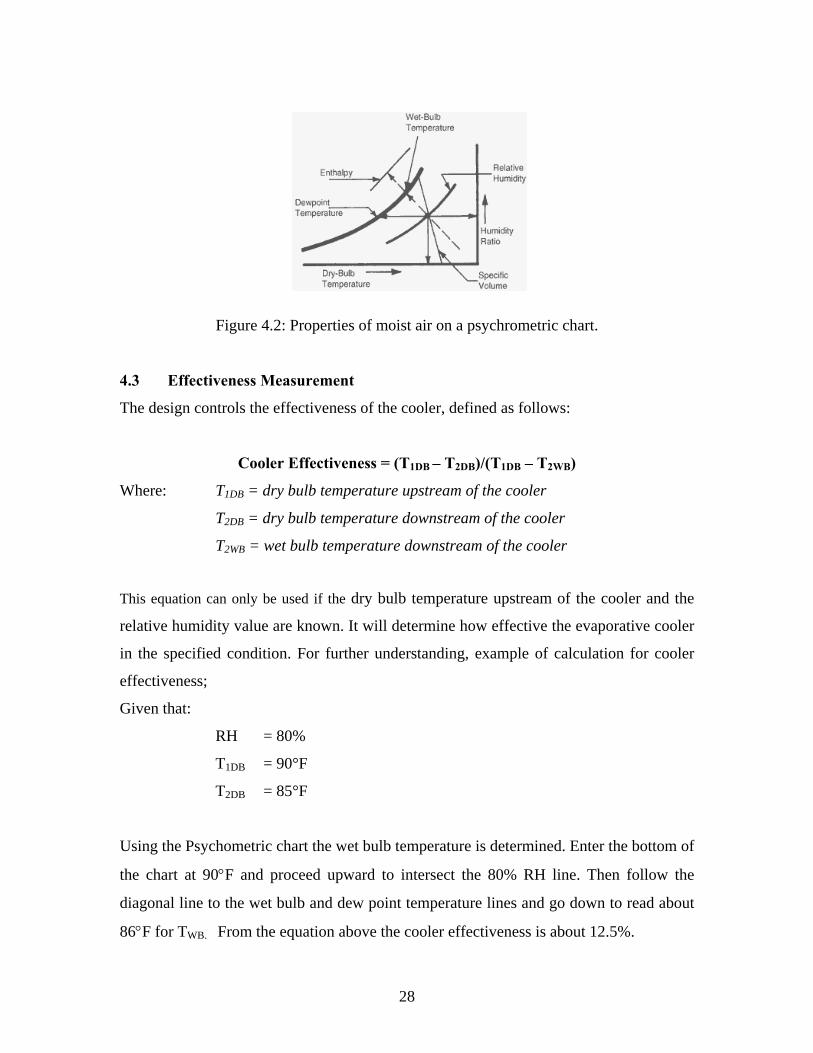
Figure 4.2: Properties of moist air on a psychrometric chart.
4.3 Effectiveness Measurement
he design controls the ef
– T2WB)
Where: T1DB
T2DB
T2WB
This equation c ooler and the
lative humidity value are known. It will determine how effective the evaporative cooler
r understanding, example of calculation for cooler
iven that:
RH
sing the Psychometric chart the wet bulb temperature is determined. Enter the bottom of
86°F for TWB. From the equation above the cooler effectiveness is about 12.5%.
T fectiveness of the cooler, defined as follows:
Cooler Effectiveness = (T1DB – T2DB)/(T1DB
= dry bulb temperature upstream of the cooler
= dry bulb temperature downstream of the cooler
= wet bulb temperature downstream of the cooler
an only be used if the dry bulb temperature upstream of the c
re
in the specified condition. For furthe
effectiveness;
G
= 80%
T1DB = 90°F
T2DB = 85°F
U
the chart at 90°F and proceed upward to intersect the 80% RH line. Then follow the
diagonal line to the wet bulb and dew point temperature lines and go down to read about
28
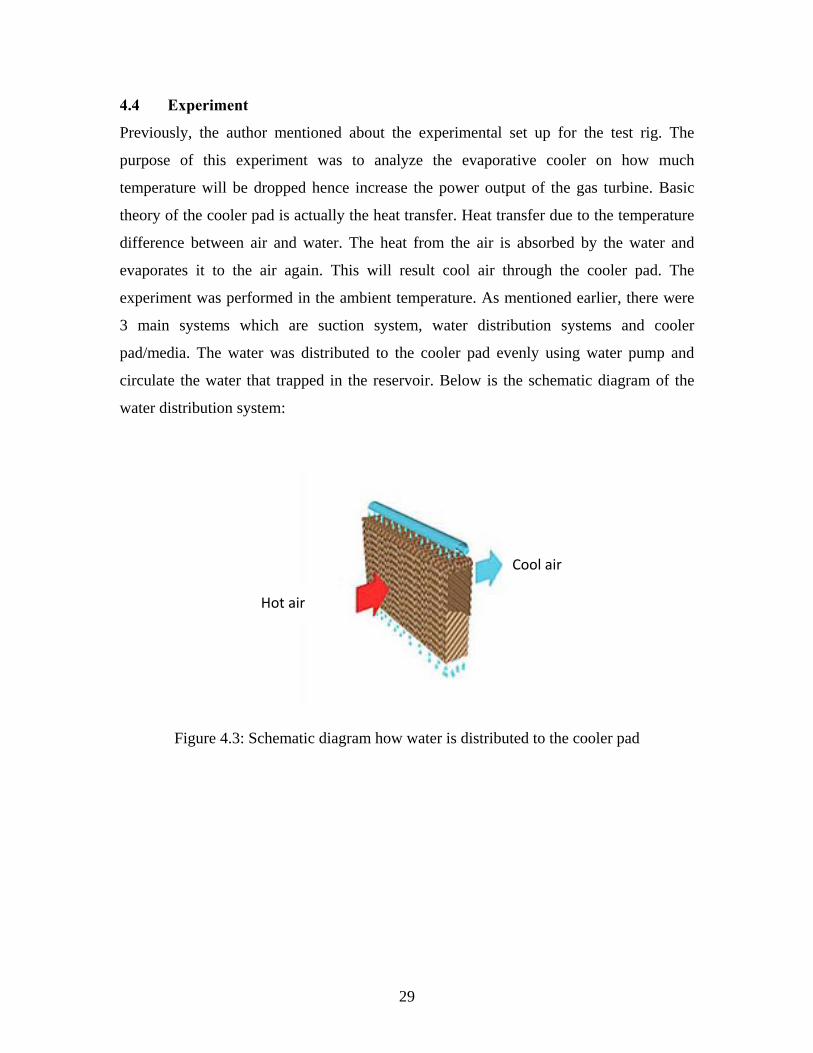
4.4 Experiment
Previously, the author mentioned about the experimental set up for the test rig. The
th experiment was to analyze the evaporative cooler on how much
temperature w ce increase the power output of the gas turbine. Basic
lly the heat transfer. Heat transfer due to the temperature
ater. The heat from the air is absorbed by the water and
vaporates it to the air again. This will result cool air through the cooler pad. The
of the
tem:
Figure 4.3: Schematic diagram how water is distributed to the cooler pad
purpose of is
ill be dropped hen
theory of the cooler pad is actua
difference between air and w
e
experiment was performed in the ambient temperature. As mentioned earlier, there were
3 main systems which are suction system, water distribution systems and cooler
pad/media. The water was distributed to the cooler pad evenly using water pump and
circulate the water that trapped in the reservoir. Below is the schematic diagram
water distribution sys
Hot air
Cool air
29
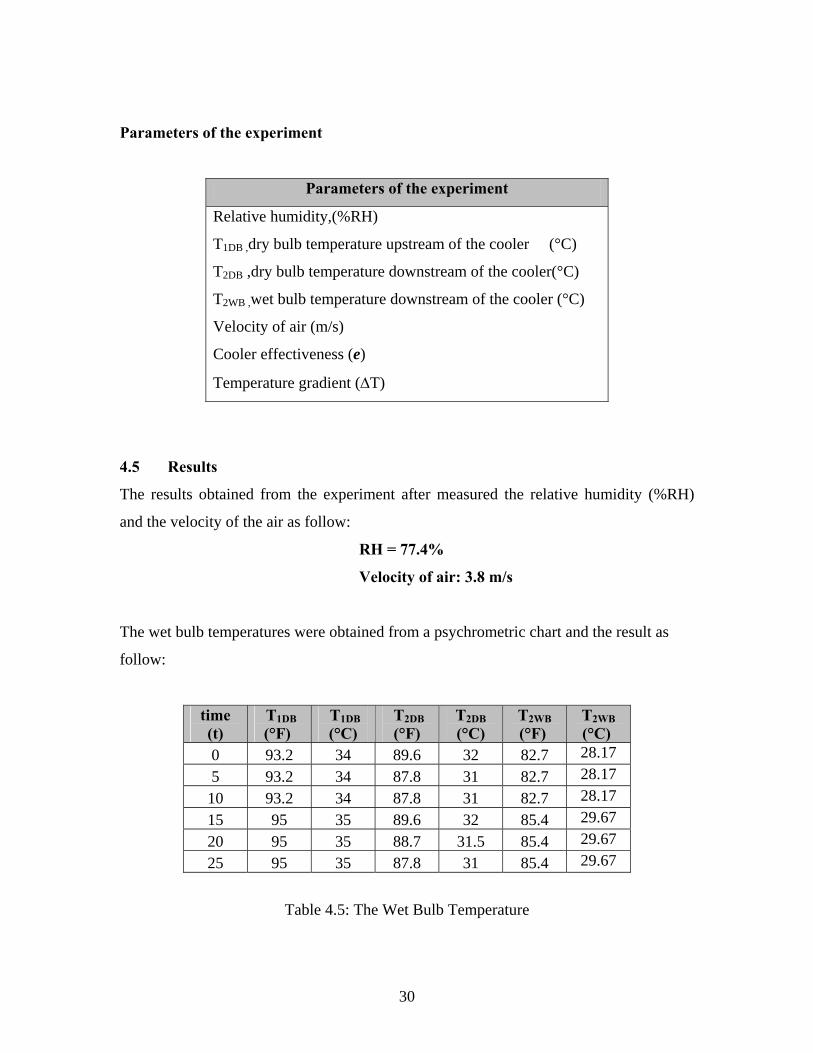
Parameters of the experiment
Parameters of the experiment
Relative humidity,(%RH)
T1DB ,dry bulb temperature upstream of the cooler (°C)
T2DB ,dry bulb temperature downstream of the cooler(°C)
T2WB ,wet bulb temperature downstream of the cooler (°C)
Velocity of air (m/s)
Cooler effectiveness (e)
Temperature gradient (ΔT)
4.5 Results
The results obtained from t e relative humidity (%RH)
and the veloci
The wet bulb t ined from a psychrometric chart and the result as
follow:
he experiment after measured th
ty of the air as follow:
RH = 77.4%
Velocity of air: 3.8 m/s
emperatures were obta
time (t)
T1DB (°F)
T1DB (°C)
T2DB (°F)
T2DB (°C)
T2WB T2WB (°F) (°C)
0 93.2 34 89.6 32 82.7 28.17 93.2 34 87.8 31 82.7 28.17 5
10 93.2 34 87.8 31 82.7 28.17 15 95 35 89.6 32 85.4 29.67 20 95 35 31.5 85.4 29.67 88.7 25 95 35 87.8 31 85.4 29.67
Table 4.5: The Wet Bulb Temperature
30
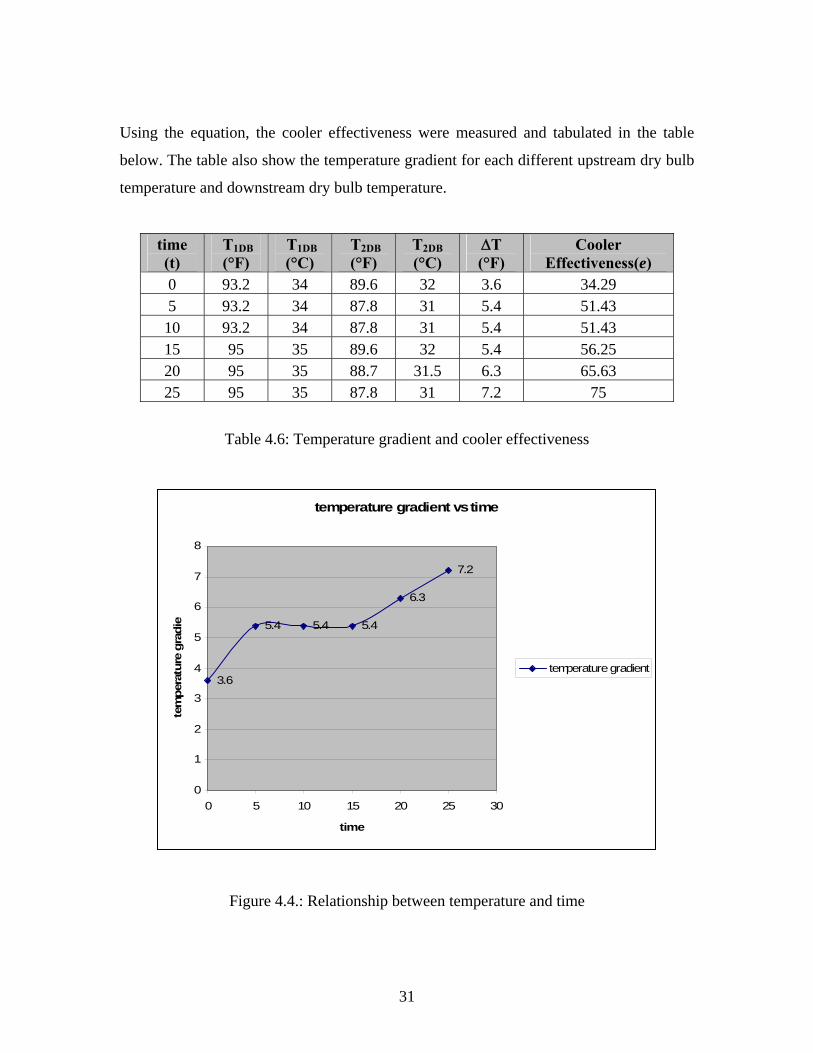
Using the equation, the cooler effectiveness were measured and tabulated in the table
elow. The table also show the temperature gradient for each different upstream dry bulb
temperature and downstream dry bulb tem re.
b
peratu
time (t)
T1DB (°F)
T1DB (°C)
T2DB (°F)
T2DB (°C)
ΔT (°
Cooler F) Effec s(e) tivenes
0 .2 4 .6 2 .6 93 3 89 3 3 34.29 5 .2 4 .8 1 4 93 3 87 3 5. 51.43 10 .2 4 .8 1 .4 93 3 87 3 5 51.43 15 95 35 56.25 89.6 32 5.4 20 95 35 65.63 88.7 31.5 6.3 25 95 75 35 87.8 31 7.2
Table 4.6: Temperature gradient and cooler effectiveness
temperature gradient vs time
3.6
5.4 5.4 5.4
6.3
7.2
0
1
2
3
4
5
6
7
8
0 5 10 15 20 25 30
time
tem
pera
ture
gra
dien
temper entature gradi
Figure 4.4.: Relationship between temperature and time
31
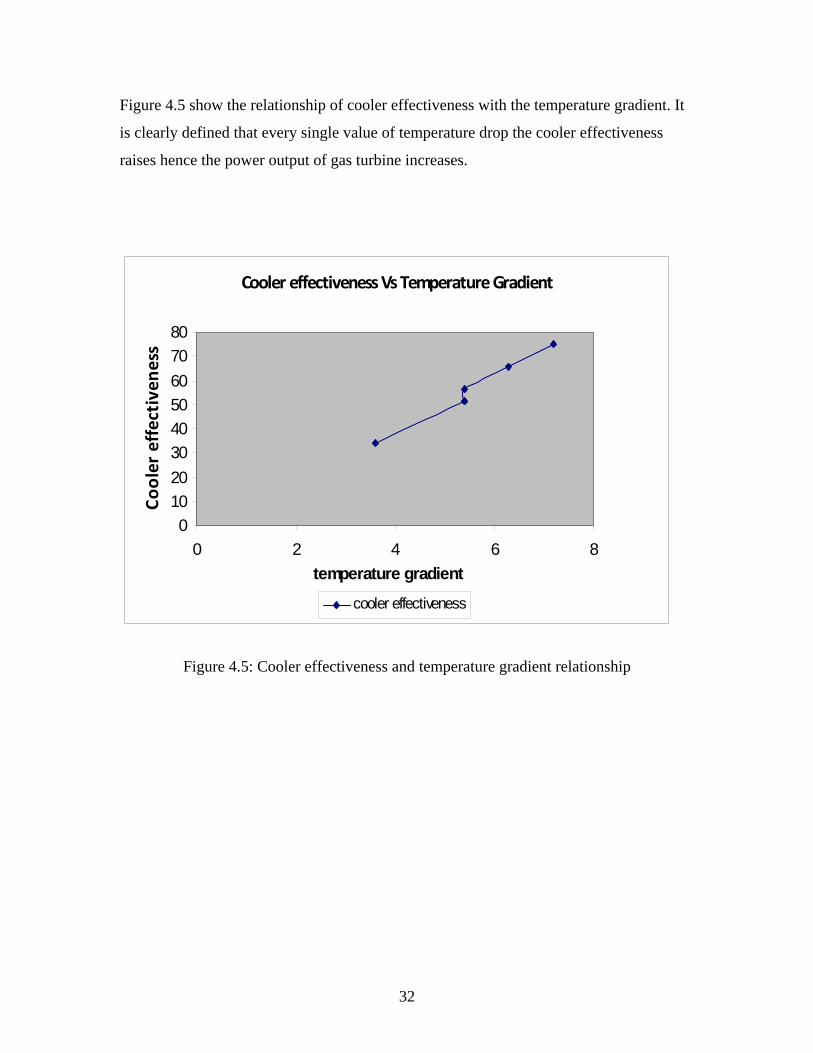
Figure 4.5 show the relationship of cooler effectiveness with the temperature gradient. It
is clearly defined that every single value of temperature drop the cooler effectiveness
raises hence the power output of gas turbine increases.
Figure 4.5: Cooler effectiveness and temperature gradient relationship
Cooler effectiveness Vs Temperature Gradient
01020304050607080
0 2 4 6 8
Cooler effectivene
ss
temperature gradient
cooler effectiveness
32
4.6 Evaporation rate
how
tate. After steady state achieved, the reading was taken as follows:
Evaporation rate also was taken into consideration in this experiment. This will s
how much in kg/min water has been evaporated. The calculation involved the basic
equation of density which:
Density = mass/volume
Where,
Density = density of water (kg/m3)
Mass = mass of water (kq)
Volume = volume of water (m3)
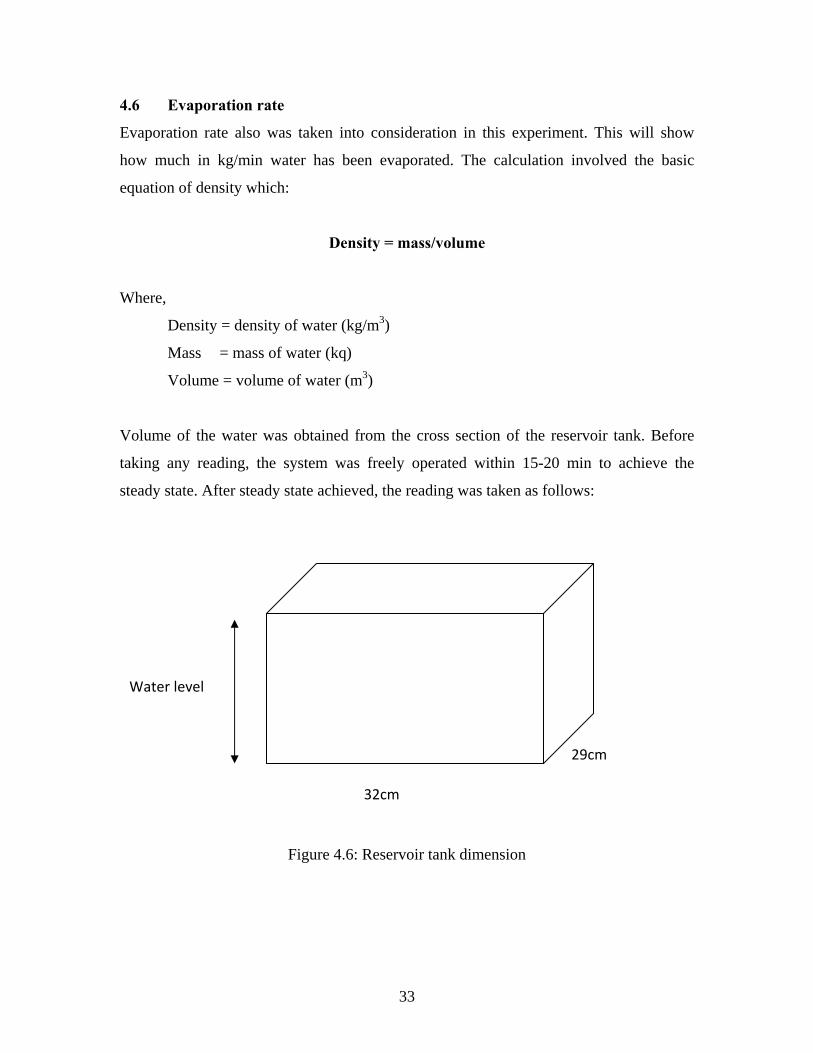
Volume of the water was obtained from the cross section of the reservoir tank. Before
taking any reading, the system was freely operated within 15-20 min to achieve the
steady s
Water level
32cm
29cm
Figure 4.6: Reservoir tank dimension
33
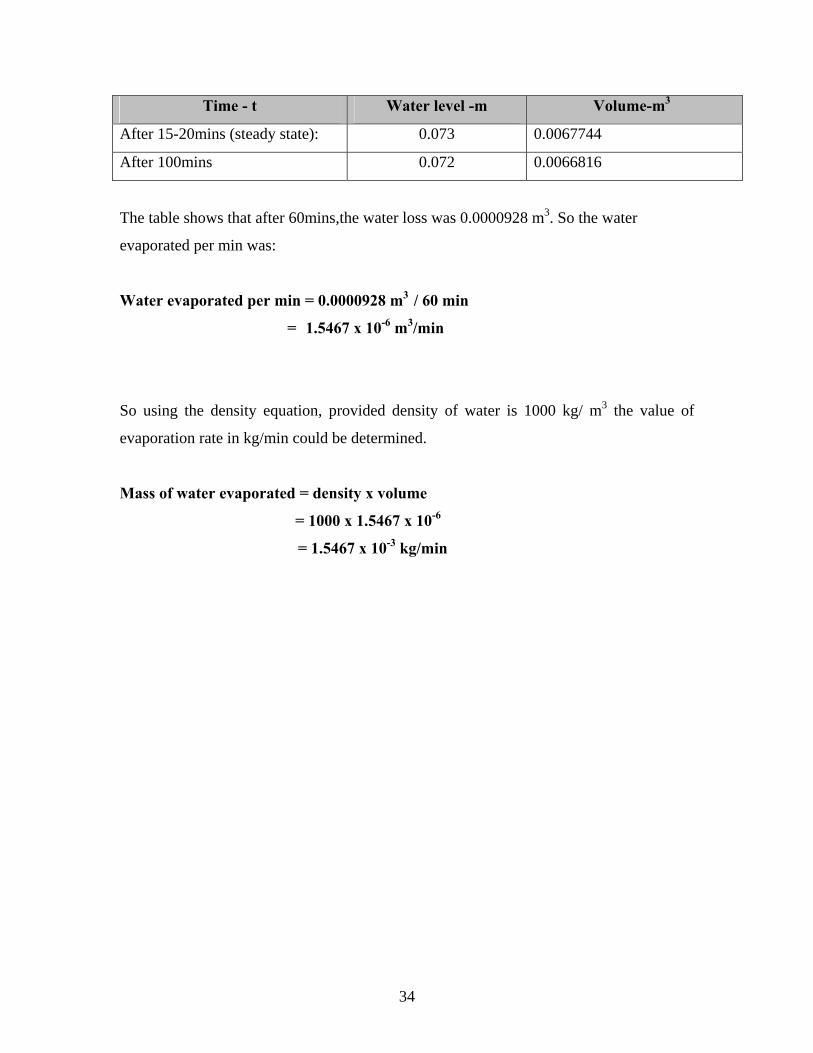
Time - t Water level -m Volume-m3
After 15-20mins (steady state): 0.073 0.0067744
After 100mins 0.072 0.0066816
The tab water loss was 0.0000928 m3. So the water
evapora
o using the density equation, provided density of water is 1000 kg/ m3 the value of
evaporation rate in kg/min could be determined.
Mass of water evaporated = density x volume
= 1000 x 1.5467 x 10-6
= 1.5467 x 10⁻³ kg/min
le shows that after 60mins,the
ted per min was:
Water evaporated per min = 0.0000928 m3 / 60 min
= 1.5467 x 10⁻⁶ m3/min
S
34
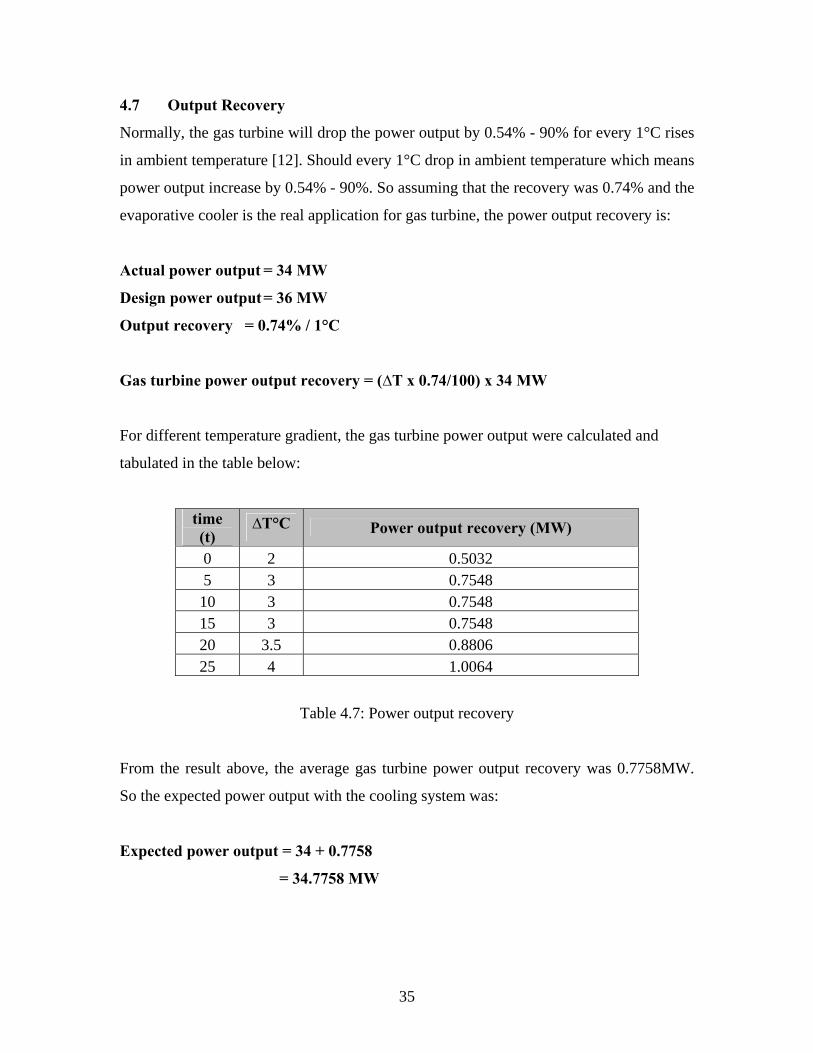
4.7 Output Recovery
Normally, the gas turbine will drop the power output by 0.54% - 90% for every 1°C rises
ambient temperature [12]. Should every 1°C drop in ambient temperature which means
t the recovery was 0.74% and the
ine, the power output recovery is:
ctual power output = 34 MW
4/100) x 34 MW
wer output were calculated and
bulated in the table below:
in
power output increase by 0.54% - 90%. So assuming tha
evaporative cooler is the real application for gas turb
A
Design power output = 36 MW
Output recovery = 0.74% / 1°C
Gas turbine power output recovery = (∆T x 0.7
For different temperature gradient, the gas turbine po
ta
time ∆T°C Power output recovery (MW) (t) 0 2 0.5032 5 3 0.7548 10 3 0.7548 15 3 0.7548 20 3.5 0.8806 25 4 1.0064
Table 4.7: Power output recovery
rom the result above, the average gas turbine power output recovery was 0.7758MW.
o the expected power output with the cooling system was:
+ 0.7758
F
S
Expected power output = 34
= 34.7758 MW
35
4.8 Discussion
Referring to the result mentioned before, the system managed to decrease the air outlet
mperature maximum 7.2°F. The power output can be achieved about 34.7758 MW after
terature review, in hot and humid region evaporative
han that. It can decrease the temperature up to 10-15°F.
s which cause the performance of the system. It
volves the weather condition, surface area of the cooler pad, water flow rate and so on.
.8.1 Weather condition
and
vaporative cooler performs well as its application in the
iddle East country. For the high relative humidity region, usually there is another
technology elp rative coo dessicant-based
evaporative cooling sy . it can be used to absorb the idity before the air is
passed to the evaporative cooler. Absorption of water by dessicant causes the dry bulb
temperature of the air to increase. Then, the air is cooled by using and evaporation based
system. Addition of dessicant-based system improves capabilities of the evaporative
cooler making it suitable even for hot and humid c essicant wheels are normally
ade of adsorptive material such as silica gel, activated alumina, lithium chloride,
lithium bromide, etc.
ot ideal and inefficient. This
recast varies with the temperature and dew point changes.
te
cooling system. Based on the li
cooler can actually results more t
Actually, there were some reason
in
4
Weather condition plays important role for evaporative cooler performance. For hot
dry climate condition, the e
M
to h evapo ler perform well. It is called
stem air hum
limate. D
m
The Figure 4.7 shows the evaporative cooler performance forecast chart. It shows the
conditions to the evaporative cooler whether works well, n
fo
36
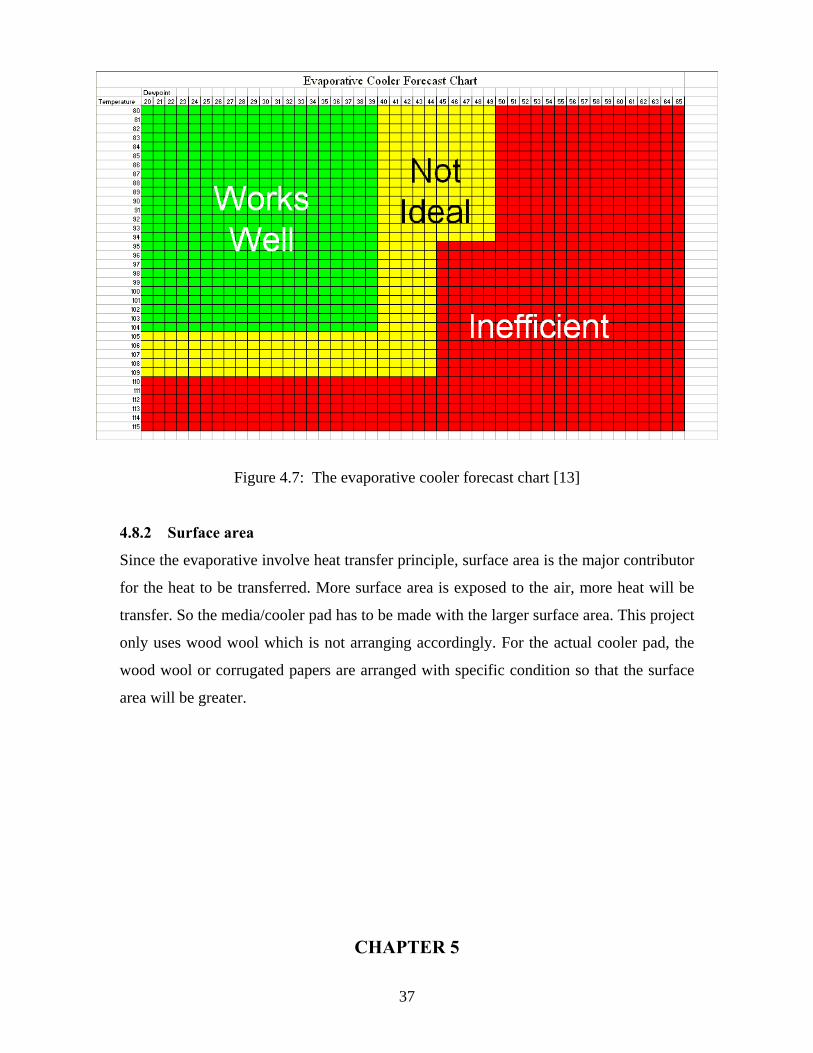
Figure 4.7: The evaporative cooler forecast chart [13]
4.8.2 Surface area
Since the evaporative involve heat transfer principle, surface area is the major contributor
ual cooler pad, the
ith specific condition so that the surface
CHAPTER 5
for the heat to be transferred. More surface area is exposed to the air, more heat will be
transfer. So the media/cooler pad has to be made with the larger surface area. This project
only uses wood wool which is not arranging accordingly. For the act
wood wool or corrugated papers are arranged w
area will be greater.
37
CONCLUSION & RECOMMENDATIONS
5.1 CONCLUSIONS
Gas turbine generator performance varies significantly with the different weather
condition. With high hot and dry climate region, the performance decrease. Hence the
power output of the gas turbine decline. The most common solution is cooling the air
intake temperature. This application widely used in the industrial nowadays. The
application such as fogging, evaporative cooler and chillers are the most common one
applied in any industry in the world. All those applications have their advantages and
limitations which were discussed in this project. Based on design parameter and
economic consideration, evaporative cooler is the best option. From this project it shows
that, the evaporative cooler works slightly well whereas it can reduce the temperature up
to 7.2°F. Besides adient rises. So,
ll of this actually can increase the power output of the gas turbine. From the calculation
prototype is the real application, the power output is improved
ood.
. Analyse the effect of the orientation of the cooler pad placement, because the
technology available placed the cooler pad perpendicular to the air flow.
. Try to increase the surface area of the cooler pad contact to the air.
. Calculation amount of evaporated / °C drop in temperature.
the cooler effectiveness increase when temperature gr
a
conducted, assuming the
to 34.7758 MW. The objective of this project finally achieved.
5.2 RECOMMENDATIONS
1. Analyse the effect of different types of cooler pad such as sponge and cloth and
different type of w
2
3
4
38
REFERENCES
] Philip P. Walsh, Paul Fletcher. “Gas Turbine Performance” Second Edition
] Tony Giampolo, MSME, PE, “The Gas Turbine Handbook Principles and Practices”
ng a media
evaporative cooler. Energy Conversion and management 2007; 1055-1064
] Amir Abbas Zadpoor, Ali Hamedani Golshan. Performance of gas turbine cycle
2
[8] stion
in
2001.
] E. Kakaras, A. Doukelis, S. Karesllas. Compressor Intake-Air Cooling In Gas Turbine
Plants. Energy 2004 ; 2347-2358
[1
[2
2nd Edition
[3] Bob Omidvar. Gas turbine inlet air cooling system, the 3rd annual Australian Gas
turbine Conference ,6th - 7th December 2001 Melbourne Australia
[4] Donaldson, Cooling inlet air improves turbine output, Choose Evaporative Cooler
Or Chiller Coils To Create Higher Mass-Flow Rate
[5] Frank J. Brooks, “GE Gas Turbine Performance Characteristics”, GE Power System
Schenectady, NY
[6] R. Hosseini, A. Beshkani , M. Soltani. Performance improvement of gas turbine of
Fars (Iran) combined cycle power plant by intake cooling usi
[7
by using a desiccant – based evaporative cooling system. Energy 2006; 2652-
664
Punwani V, Pierson T, Bagley JW, Ryan WA. A hybrid system for combu
turbine inlet air cooling at the Capine Clear Lake Cogeneration Plant
Pasadena. Texas, ASHRAE winter meeting, Atlanta, January
[9
39

[10] Sanjeev Jolly, Joseph Nitzken, Donald Sheperd, “Evaluation of Combustion Turbine
Inlet Air Cooling Systems” presented at Power-Gen Asia, New Delhi, India
,September 29-October 1, 1998.
tudy Of
he Impact Of Evaporative Coolers On Indoor PM Concentrations”. Atmospheric
2] Meher-Homji, C.B. and Mee, T.R., 1999, “Gas Turbine Power Augmentation by
,
[11] Helmut Paschold, Wen-Whai Li, Hugo Morales, John Walto,”Laboratory S
T
Environment 37 (2003) 1075–1086
[1
Fogging of Inlet Air,” Proceedings of the 28th Turbomachinery Symposium, Houston
TX, Sept
[13] Forecast chart for evaporative cooler
<http://www.azcentral.com/weather/monsoon/>
40


