
Prepared for the Long Island Index
by HR&A Advisors, Inc. and Parsons Brinckerhoff
April 10, 2014
The Economic and Fiscal Impacts of the Long Island Rail Road Main Line Third Track

Transportation Investment and the Future of Long Island 3
The Economic and Fiscal Impacts of Third Track on Long Island 20

HR&A Advisors, Inc. The Economic and Fiscal Impacts of LIRR Third Track | 3
Transportation Investment and the Future of Long Island
HR&A Advisors, Inc. The Economic and Fiscal Impacts of LIRR Third Track | 4
The Long Island Index commissioned HR&A Advisors, Inc. and Parsons Brinkerhoff to study the economic and fiscal impacts of the Third Track project.
HR&A Advisors, Inc. (“HR&A”) is a leading economic development consulting firm that specializes in conducting economic and fiscal impact studies on behalf of clients in the public and private sectors. HR&A has measured the economic and fiscal impacts of a diverse array of projects, places, and policies, including Access to the Region’s Core (ARC), the extension of LIRR to Lower Manhattan, The High Line, Times Square, and the New York State Film Production Credit. Parsons Brinkerhoff, Inc. (“PB”) is a global planning and engineering firm with a leading practice in transportation forecasting, nationally and in the New York metropolitan region. PB developed the original 28-county regional Best Practices Model for the New York Metropolitan Transportation Council, and has performed all updates of the model, and has applied it for numerous travel forecasting studies in the region, including those for the Port Authority of New York and New Jersey and the Metropolitan Transportation Authority.

HR&A Advisors, Inc. The Economic and Fiscal Impacts of LIRR Third Track | 5
For much of the 20th century, investments in transportation infrastructure created the conditions for Long Island’s rapid growth and development.
1890 – 1920 1895: LIRR extended to Montauk 1898: LIRR extended to Port Washington 1910: LIRR to Penn Station opens
128,000 new residents
1920 – 1950 1927: Northern State Pkwy opens 1927: LIRR electrification extended to Port Washington 1934: Southern State Pkwy opens
713,000 new residents 1,650,000 new residents
1950 – 1980 1950-1980: LIRR Babylon Branch grade crossing elimination 1970: LIRR electrification extended to Huntington 1958-1972: Long Is Expwy opens
Source: HR&A Advisors; US Census Bureau; Historical Population of Long Island Communities 1790-1980, Long Island Regional Planning Board, August 1982; Images from: untappedcities.com; vanderbiltcupraces.com; thehousinghour.com.

HR&A Advisors, Inc. The Economic and Fiscal Impacts of LIRR Third Track | 6
However, over the last three decades, growth on Long Island has slowed significantly.
1980 – 2010
230,000 new residents
Source: HR&A Advisors; US Census Bureau; Historical Population of Long Island Communities 1790-1980, Long Island Regional Planning Board, August 1982; Image from wikimedia.com.
• The Hudson Valley is comprised of Dutchess, Orange, Putnam, Rockland, Sullivan, Ulster, and Westchester counties.
• Northern New Jersey is comprised of Bergen, Essex, Hudson, Hunterdon, Mercer, Middlesex, Monmouth, Morris, Ocean, Passaic, Somerset, Sussex, Union, and Warren counties.
1980-2010 Population Growth Rate
8.8%
15.7%
18.7% 18.6%
0%
5%
10%
15%
20%
Long Island New YorkCity
HudsonValley
NorthernNew Jersey
2.84 M 8.19 M 2.29 M 6.95 M 2010
Population

HR&A Advisors, Inc. The Economic and Fiscal Impacts of LIRR Third Track | 7
Long Island’s stagnant growth derives from macroeconomic shifts and the maintenance of local policies that are out of step with national trends.
Long Island’s economic underperformance is due to structural changes in the local economy, outmoded land-use policies that have limited housing choice, a decline in the supply of young workers, and constraints in Long Island’s transportation network. These factors interact with and reinforce each other.
Declining Young Adult Population
Decline of Defense Industry
Constrained Transit Service
Limited Housing Choices

HR&A Advisors, Inc. The Economic and Fiscal Impacts of LIRR Third Track | 8
Over the last two decades, job growth on Long Island been sluggish, in stark contrast to the revival experienced by New York City.
Jobs Added, 1970 – 2010
Source: US Bureau of Economic Analysis
458,000
257,000
(172,000)
700,000
-300,000
-150,000
0
150,000
300,000
450,000
600,000
750,000
Long Island New York City
1970 – 1990 1990 – 2010

HR&A Advisors, Inc. The Economic and Fiscal Impacts of LIRR Third Track | 9
Reduced defense spending at the end of the Cold War eliminated 60% of defense industry jobs on Long Island; service jobs have filled the gap.
22,500 jobs 1986
550 jobs 2013
Northrop Grumman Employment on Long Island
Source: “A New Vision for Long Island’s Economy,” Long Island Regional Economic Development Council, 2011; Wall Street Journal Image: scoutingny.com
Service sector jobs are filling the gap left behind by the shrinkage of the aerospace and defense industry. These jobs tend to pay lower salaries and offer fewer opportunities for career advancement to Long Island residents.
HR&A Advisors, Inc. The Economic and Fiscal Impacts of LIRR Third Track | 10
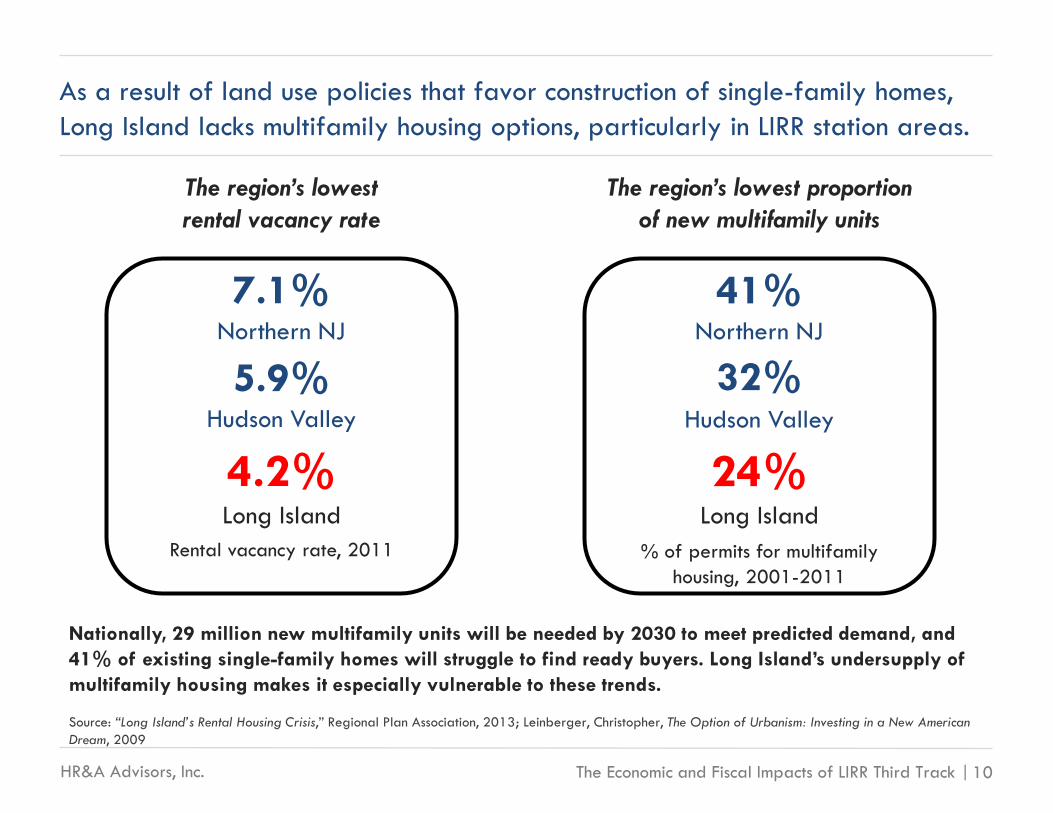
As a result of land use policies that favor construction of single-family homes, Long Island lacks multifamily housing options, particularly in LIRR station areas.
41% Northern NJ
32% Hudson Valley
24% Long Island
% of permits for multifamily housing, 2001-2011
The region’s lowest proportion of new multifamily units
7.1% Northern NJ
5.9% Hudson Valley
4.2% Long Island
Rental vacancy rate, 2011
The region’s lowest rental vacancy rate
Nationally, 29 million new multifamily units will be needed by 2030 to meet predicted demand, and 41% of existing single-family homes will struggle to find ready buyers. Long Island’s undersupply of multifamily housing makes it especially vulnerable to these trends.
Source: “Long Island’s Rental Housing Crisis,” Regional Plan Association, 2013; Leinberger, Christopher, The Option of Urbanism: Investing in a New American Dream, 2009

HR&A Advisors, Inc. The Economic and Fiscal Impacts of LIRR Third Track | 11
The acute loss of productive young workers and their families is among the most concerning aspects of Long Island’s slow growth.
2%
Population aged 25-34
Percentage Change in Population Aged 25-44 from 2000 to 2010
Population aged 35-44
New York City
Long Island
9%
13% 18%
Source: US Census Bureau

HR&A Advisors, Inc. The Economic and Fiscal Impacts of LIRR Third Track | 12
Long Island’s economy critically depends on continued investment in the LIRR.
Source: How the Long Island Rail Road Could Shape The Next Economy, Regional Plan Association / Long Island Index, January 2013. Image: HBarrison, Flickr.
In 2011, 25% of personal income for Long Island residents was earned at jobs in New York City, a total of $26 billion dollars.
One-third of Long Islanders that work in New York City commute daily on the LIRR.
It would require 10 new highway lanes to carry the equivalent number of daily riders to Penn Station.

HR&A Advisors, Inc. The Economic and Fiscal Impacts of LIRR Third Track | 13
Deferred capacity investments on the Long Island Rail Road limit Long Island’s growth.
Due to constraints in track capacity…
• City-bound peak-hour service on several branch lines is at maximum capacity.
• LIRR service is less reliable* than
NJTransit or Metro-North due to limited operational flexibility.
• There are gaps of up to 70 minutes in daily reverse-commute service to many Long Island employment centers.
The absence of reliable eastbound train service to Long Island during peak commute times greatly reduces the feasibility of reverse commuting to Long Island. The gap in service prevents many New York metro area workers who rely on transit from working on Long Island, even though their skills may be well-aligned with the needs of Long Island businesses.
* Reliability measured by on-time performance using most recent indicators from MTA Long Island Rail Road, MTA Metro-North Railroad, and NJTransit. Source: How the Long Island Rail Road Could Shape The Next Economy, Long Island Index / RPA, January 2013; HR&A Advisors. Image: Joe Shlabotnik, Flickr

HR&A Advisors, Inc. The Economic and Fiscal Impacts of LIRR Third Track | 14
Third Track would position Long Island for sustained economic growth by making it a more attractive place to live and do business.
By increasing regional mobility, Third Track would revitalize Long Island’s job market by attracting high-quality professional services and tech jobs, stem the outflow of young workers, generate new tax revenues, and encourage the provision of new transit-oriented housing that contributes to the revitalization of Long Island’s station areas. These changes would position Long Island to succeed in the knowledge economy.
Increased Mobility
New Jobs & Tax Revenue
Increased Population
New Housing Options

HR&A Advisors, Inc. The Economic and Fiscal Impacts of LIRR Third Track | 15
Investments in Metro-North capacity have enabled Westchester County employment centers to benefit from high levels of reverse peak service.
28 miles from Midtown
Total Eastbound Service from Manhattan, 6-10 am:
8 trains (no service between 7:00 am and 8:15 am)
Hicksville White Plains
30 miles from Midtown
Total Northbound Service from Manhattan, 6-10 am:
18 trains (7 trains between 7:00 am and 8:15 am)
MNR constructed Harlem Line Third Track from 2002-2004
LIRR has not invested in a comparable project
White Plains
Hicksville
Source: CoStar; MTA Long Island Rail Road; MTA Metro-North Railroad; How the Long Island Rail Road Could Shape The Next Economy, Long Island Index / RPA, January 2013; HR&A Advisors. Images: Joe Shlabotnik, Flickr; iridetheharlemline.com.
Grand Central Station Penn Station
83,000 SF of new development, 2000-2010
32,000 SF of new development, 2000-2010

HR&A Advisors, Inc. The Economic and Fiscal Impacts of LIRR Third Track | 16
The Third Track project would add an additional track to a 9.8 mile segment of the LIRR Main Line between Floral Park and Hicksville.
The Third Track increases capacity for the Port Jefferson Branch, Montauk Branch, Ronkonkoma Branch, and Oyster Bay Branch.
The Third Track achieves the full benefits of East Side Access.
The Third Track would improve reliability throughout the entire LIRR network.
LIRR Main Line
The Third Track would allow significant levels of reverse peak and intra-Island service to Main Line stations.
Source: Metropolitan Transportation Authority; Regional Plan Association

HR&A Advisors, Inc. The Economic and Fiscal Impacts of LIRR Third Track | 17
Third Track would effectively expand and improve the Long Island workforce by providing a viable reverse-commute service.
“A larger effective labor market makes it easier for enterprises to find the skills they need, and for workers to find the jobs they want.”
Prud’homme & Lee, 1998
• Poor transportation access to Long Island hinders the region’s economic growth for several reasons:
• Reduces labor catchment areas and the size of business markets
• Increases logistics costs
• Reduces employee productivity
• Expanding the size of the workforce available to Long Island firms results in a better match between the needs of these firms and workers’ skills, driving greater productivity.
Source: “Where the Jobs Are: Employer Access to Labor by Transit,” Tomer, Metropolitan Policy Program at Brookings, 2012; “Size, Sprawl, Speed and the Efficiency of Cities,” Rémy Prud’homme & Chang-Woon Lee, Observatoire de l'Économie et des Institutions Locales, 1998.

HR&A Advisors, Inc. The Economic and Fiscal Impacts of LIRR Third Track | 18
Third Track would also enhance the suitability of station areas for TOD, creating live/work nodes that meet the needs of new economy firms and workers.
• An expansive academic literature documents the productivity benefits generated by urban agglomeration, as close proximity encourages knowledge spillovers and innovation that make firms and workers more productive.
• Denser employment nodes are the locus of the knowledge economy, where increased interactions result in new ideas, products, and technologies that drive productivity gains and economic growth.
• Transit-oriented development opportunities catalyzed by Third Track would facilitate the creation of such employment nodes and match the living and working preferences of young workers that Long Island struggles to retain.
Doubling employment density
6% Increase in productivity
Ciccone and Hall, 1996
Source: “Productivity and the Density of Economic Activity,” Ciccone and Hall, The American Economic Review, 1996.

Transportation Investment and the Future of Long Island 3
The Economic and Fiscal Impacts of Third Track on Long Island 20

HR&A Advisors, Inc. The Economic and Fiscal Impacts of LIRR Third Track | 20
The Economic and Fiscal Impacts of Third Track on Long Island

HR&A Advisors, Inc. The Economic and Fiscal Impacts of LIRR Third Track | 21
Parsons Brinckerhoff used the NYMTC Best Practices Model to measure the future performance of the regional transportation network with and without Third Track.
• The New York Best Practices Model (NYBPM) includes representation of virtually all existing public and private transportation services in the 28-county New York metropolitan region, as well as all future planned major highway and transit improvements. It is used to estimate user demand and performance of these regional transportation systems for baseline and alternative planning scenarios, while accounting for regionally adopted forecasts of population, employment and other key measures of regional demographic and economic change. The model accounts for other future improvements to the LIRR network, including East Side Access and the Ronkonkoma Double Track.
• Based on the higher level of service enabled by Third Track, PB quantified the following transportation outputs, which were translated into economic impacts by HR&A:
• Time savings accruing to existing passengers
• Increases in ridership
• Improvements in the accessibility of workers to Long Island employers

HR&A Advisors, Inc. The Economic and Fiscal Impacts of LIRR Third Track | 22
PB constructed three scenarios using the BPM: A current scenario (2010), a 2035 scenario without Third Track, and a 2035 scenario with Third Track.
Source: Parsons Brinckerhoff
2010 Service • Based on NYMTC 2010 Build Scenario 2035 No-Build Scenario • Based on NYMTC 2035 Build Scenario • Includes East Side Access, Ronkonkoma Double Track, Second Avenue Subway,
and the 7 Train Extension
2035 Third Track Scenario • Based on NYMTC 2035 Build Scenario • Includes East Side Access, Ronkonkoma Double Track, Second Avenue Subway,
and the 7 Train Extension • Includes 17 additional AM trains enabled by Third Track
HR&A Advisors, Inc. The Economic and Fiscal Impacts of LIRR Third Track | 23
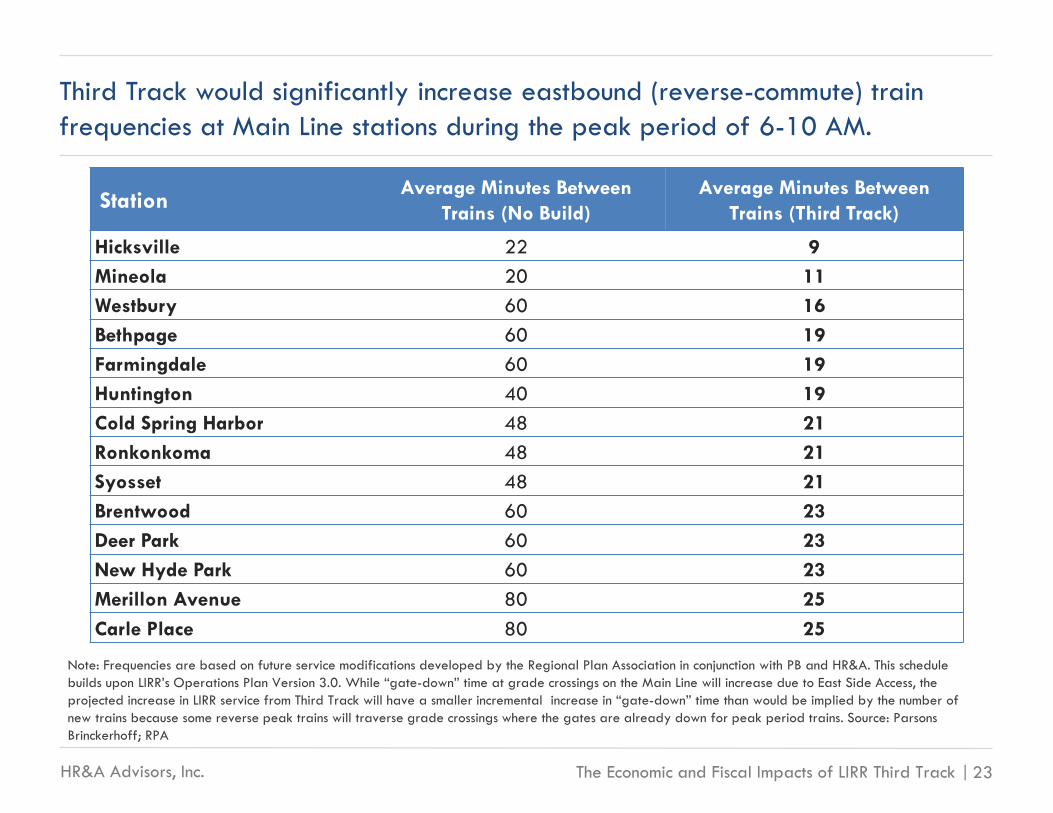
Third Track would significantly increase eastbound (reverse-commute) train frequencies at Main Line stations during the peak period of 6-10 AM.
Note: Frequencies are based on future service modifications developed by the Regional Plan Association in conjunction with PB and HR&A. This schedule builds upon LIRR’s Operations Plan Version 3.0. While “gate-down” time at grade crossings on the Main Line will increase due to East Side Access, the projected increase in LIRR service from Third Track will have a smaller incremental increase in “gate-down” time than would be implied by the number of new trains because some reverse peak trains will traverse grade crossings where the gates are already down for peak period trains. Source: Parsons Brinckerhoff; RPA
Station Average Minutes Between Trains (No Build)
Average Minutes Between Trains (Third Track)
Hicksville 22 9 Mineola 20 11 Westbury 60 16 Bethpage 60 19 Farmingdale 60 19 Huntington 40 19 Cold Spring Harbor 48 21 Ronkonkoma 48 21 Syosset 48 21 Brentwood 60 23 Deer Park 60 23 New Hyde Park 60 23 Merillon Avenue 80 25 Carle Place 80 25

HR&A Advisors, Inc. The Economic and Fiscal Impacts of LIRR Third Track | 24
HR&A used the REMI Policy Insight Model to estimate the impacts of Third Track on all aspects of the Long Island economy between 2020 and 2050.
• Developed by Regional Economic Models, Inc., the Policy Insight Model is frequently employed by Federal, State, and local governments, economic development and transportation authorities, and private clients to measure the impacts of regional economic changes. Clients include the New York City Economic Development Corporation (NYCEDC), Empire State Development Corporation (ESDC), New York State Energy Research and Development Authority (NYSERDA), and the departments of transportation of 10 states.
• As a dynamic econometric model, the Policy Insight Model is particularly adept at modeling the long-term impacts of infrastructure investments that fundamentally alter underlying economic relationships between economic output, factors of production, prices, and demographic factors.
• HR&A considered only the net new economic and fiscal impacts of the construction and operation of Third Track, meaning but for the existence of Third Track, these impacts would not have occurred on Long Island.

HR&A Advisors, Inc. The Economic and Fiscal Impacts of LIRR Third Track | 25
By applying transportation outputs from the BPM to the REMI Policy Insight Model, HR&A estimated economic benefits owing to Third Track.
Transportation Model
NYMTC BPM
Economic Model REMI Policy
Insight
Economic Impacts
Fiscal
Impacts

HR&A Advisors, Inc. The Economic and Fiscal Impacts of LIRR Third Track | 26
HR&A reports key economic and fiscal impacts owing to the Third Track project.
Economic Impacts
• New jobs
• Increased personal income
• Increased Gross Regional Product (GRP)
• Increase in population
Fiscal Impacts
• Increase in county sales tax revenue
• Increase in county property tax revenue

HR&A Advisors, Inc. The Economic and Fiscal Impacts of LIRR Third Track | 27
Enhanced productivity from better matches between employers and workers
Third Track would generate both one-time construction impacts and ongoing impacts from operation.
Spending on new infrastructure
ONE-TIME IMPACT: Construction Period of 2020-2024
Construction
ONGOING IMPACT: Operational Period (Benefits Measured 2025-2050)
Improved Access to Workforce
Time savings due to more frequent and reliable service and new visitor spending
Economic gains from close proximity between firms
Ridership Benefits from Better Service
Benefits of Denser Employment Nodes

HR&A Advisors, Inc. The Economic and Fiscal Impacts of LIRR Third Track | 28
The economic impacts of Third Track’s construction would accrue from 2020 to 2024.
Spending on new infrastructure Construction
Improved Access to Workforce
Ridership Benefits from Better Service
Benefits of Denser Employment
Nodes
ONE-TIME IMPACT: Construction Period of 2020-2024
ONGOING IMPACT: Operational Period (Benefits Measured 2025-2050)

HR&A Advisors, Inc. The Economic and Fiscal Impacts of LIRR Third Track | 29
The construction of Third Track would represent a $1.2 Billion investment in the Long Island economy over a five-year period.
Spending on new infrastructure ONE-TIME IMPACT Construction
• 100% of the above construction costs are estimated to be spent in Long Island.
• Rolling stock purchases, land acquisition costs, and new rail yard construction are excluded from the above estimate.
Element Total
Station Improvements and Re-Configuration $100 Million
New Track, Power, and Signals (Miles) $900 Million
Subtotal $1 Billion
Contingency $200 Million
Total $1.2 Billion
Note: All dollar amounts are in 2013 dollars. Source: Long Island Rail Road

HR&A Advisors, Inc. The Economic and Fiscal Impacts of LIRR Third Track | 30
One-Time Construction Impacts: Constructing Third Track would produce gains for construction workers and contractors hit hard by the Great Recession.
Economic Impacts During Construction (2020-2024)*
2,250 Average Annual
Jobs (2020-2024)
$910 Million Cumulative
Personal Income
$910 Million Cumulative GRP
Note: The construction timeframe is estimated. Depending on the LIRR’s capital program cycle and construction schedule the timeframe could be longer. All dollar amounts are in 2013 dollars. Outputs reflect total growth over period 2020-2024. Source: HR&A Advisors; REMI

HR&A Advisors, Inc. The Economic and Fiscal Impacts of LIRR Third Track | 31
The economic impacts of Third Track’s operations would begin to accrue in 2025 when the track is assumed to be operational.
Spending on new infrastructure Construction
Improved Access to Workforce
Ridership Benefits from Better Service
Benefits of Denser Employment
Nodes
ONE-TIME IMPACT: Construction Period of 2020-2024
ONGOING IMPACT: Operational Period (Benefits Measured 2025-2050)

HR&A Advisors, Inc. The Economic and Fiscal Impacts of LIRR Third Track | 32
In estimating the ongoing economic impact of Third Track, HR&A included the amplifying effect of transit-oriented development policies.
Amplification of Growth Due to TOD
Growth Generated by Third Track Service
2035 No Build
2035 Third Track Build
Baseline Forecasted Economic Growth
Total Estimated
Growth due to Third Track
The analysis assumed six station areas in Nassau County and four station areas in Suffolk County could accommodate TOD, facilitating additional economic growth by locating more residents and workers precisely where they can most benefit from increased service.

HR&A Advisors, Inc. The Economic and Fiscal Impacts of LIRR Third Track | 33
Total ongoing benefits of Third Track for Long Island derive from improved workforce access, better LIRR service, and the amplifying effect of TOD.
Benefits of Third Track for
Long Island
Better LIRR Service
• Improved frequency • Improved reliability • Increased ridership
Improved Workforce
Access and Rider Benefits
• Workforce access to Long Island jobs • Rider time savings • New spending on Long Island
Transit-Oriented
Development
• Residential and commercial development in station areas amplifies the benefits of Third Track
Total Benefits of Third Track

HR&A Advisors, Inc. The Economic and Fiscal Impacts of LIRR Third Track | 34
Third Track would effectively increase the workforce available to Long Island businesses by making reverse commuting viable.
Enhanced productivity from better matches between employers and workers
ONGOING IMPACT Improved Access to Workforce
• Higher eastbound service frequencies will make employment on Long Island a viable option for non-Long Island residents who would not currently consider working on Long Island.
• PB’s transportation model estimates that Long Island firms would achieve a significant improvement on their current access to labor, as measured by an index taking into account accessibility by all modes. This improvement is translated into productivity gains by the REMI Policy Insight Model.
• Greater productivity strengthens Long Island’s economy and expands its capacity for future growth, resulting in significant long term increases in job creation, gross regional product, and population.

HR&A Advisors, Inc. The Economic and Fiscal Impacts of LIRR Third Track | 35
Illustrative Example of How Improved Access to Workforce Positions Long Island for Further Economic Growth
Oracle, a software firm, has offices near to Mineola’s LIRR station. They need talented Java developers.
Phil is a Java developer enjoying the car-free life in Manhattan. His skills would be
perfect for Oracle.
The additional local spending by these workers and their contributions to Oracle create Long Island jobs.
Without Third Track, the gaps in LIRR morning service dissuade Phil from
applying to Oracle.
Phil is intrigued by Oracle’s job posting. But he only considers transit-friendly jobs.
Phil checks the LIRR Schedule.
With Third Track, Phil would have a fast
and flexible commute on the LIRR to Mineola.
Some of the new workers hired commute from NYC on the LIRR, others already live on Long Island, and still others relocate to Long Island.
Phil applies for the job; Oracle hires him. He develops a great product, which spurs further hiring.
Oracle adds a job posting to a website for regional technology jobs.

HR&A Advisors, Inc. The Economic and Fiscal Impacts of LIRR Third Track | 36
The increased density of employment on Long Island encouraged by TOD would enhance the productivity of Long Island firms.
Economic gains from close proximity between firms ONGOING IMPACT Benefits of Denser
Employment Nodes
• Implementing Third Track would encourage employment growth on Long Island by making it a more attractive place to do business. HR&A estimates that employment density on Long Island would increase by 2.6% if TOD policies encouraged this growth to occur in station areas.
• Based on the findings of a literature review, this increase in density is translated into a significant Long Island-wide multi-factor productivity gain for the local economy.
• As with the increase in labor access, greater productivity results in significant long term increases in job creation, economic output, and population.

HR&A Advisors, Inc. The Economic and Fiscal Impacts of LIRR Third Track | 37
Travel time savings and increased ridership stimulate Long Island’s economy by improving quality of life, reducing business costs, and promoting spending.
Time savings due to more frequent and reliable service ONGOING IMPACT Ridership Benefits
from Better Service
Daily time saved by current
LIRR riders
Hourly value of
LIRR riders’ time
250 weekdays per year
Time value saved per
year
• The value of commuter time savings for Long Island-bound workers is represented in the REMI Policy Insight Model as a cost savings to Long Island businesses. The value of time savings for passengers originating in Long Island is represented as non-pecuniary amenity that enhances Long Island’s quality of life.

HR&A Advisors, Inc. The Economic and Fiscal Impacts of LIRR Third Track | 38
The availability of more frequent reverse commuter trains will attract more tourist dollars to Long Island.
New visitor spending on Long Island ONGOING IMPACT Ridership Benefits
from Better Service
New leisure trips to
Long Island
Average spending per trip
Total additional spending
• New visitor spending on Long Island owing to an increase in the number of Long Island-bound leisure riders is represented in the REMI Policy Insight Model through an increase in the nonresident visitor spending pattern.
HR&A Advisors, Inc. The Economic and Fiscal Impacts of LIRR Third Track | 39
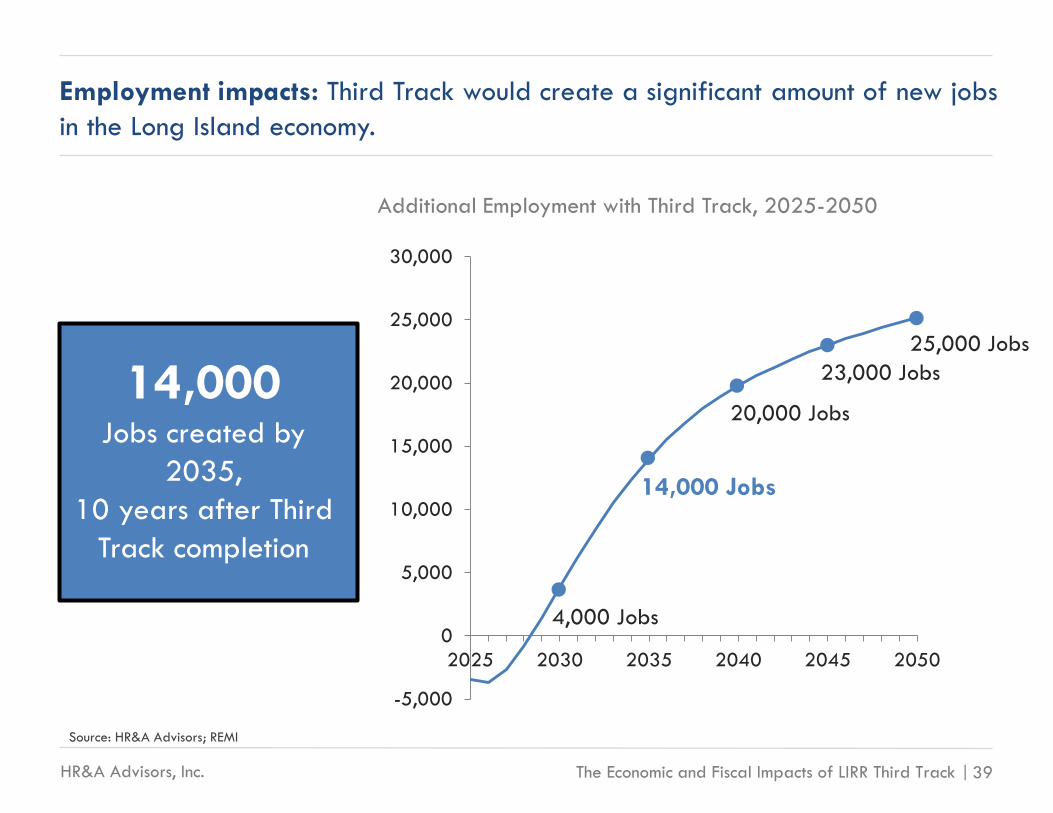
Employment impacts: Third Track would create a significant amount of new jobs in the Long Island economy.
Source: HR&A Advisors; REMI
14,000 Jobs created by
2035, 10 years after Third
Track completion
$3.0 Billion personal income
Additional Employment with Third Track, 2025-2050
-5,000
0
5,000
10,000
15,000
20,000
25,000
30,000
2025 2030 2035 2040 2045 2050
4,000 Jobs
14,000 Jobs
20,000 Jobs
23,000 Jobs 25,000 Jobs

HR&A Advisors, Inc. The Economic and Fiscal Impacts of LIRR Third Track | 40
The 14,000 jobs that Third Track would create by the year 2035 would present employment opportunities for workers with diverse skills and educational backgrounds. These net new jobs would accelerate Long Island’s economic revitalization.
Sectoral employment impacts: Third Track would create jobs throughout the Long Island economy.
Selected Sectors Jobs Created by 2035
Professional and Business Services and Information 4,400
Education, Health Services, and Government 2,900
Real Estate and Financial Activities 2,700
Trade, Transportation, and Utilities 1,600
Leisure and Hospitality 1,200
Other Services 800
Construction and Manufacturing 400
*Jobs include both full and part time jobs. Source: HR&A Advisors; REMI

HR&A Advisors, Inc. The Economic and Fiscal Impacts of LIRR Third Track | 41
GRP and personal income impacts: Third Track would significantly boost the economy of Long Island for decades to come.
$5.6 Billion GRP in 2035,
10 years after Third Track completion
$3.0 Billion personal income in
2035, 10 years after Third Track completion
Note: All dollar amounts are in 2013 dollars. Source: HR&A Advisors; REMI
$0
$2
$4
$6
$8
$10
2025 2030 2035 2040 2045 2050
$ Bi
llion
Additional GRP with Third Track, 2025-2050
$5.6 B
$3.3 B
$7.1 B $8.2 B
$9.2 B
$0
$2
$4
$6
$8
2025 2030 2035 2040 2045 2050
$ Bi
llion
Additional Personal Income with Third Track, 2025-2050
$1.4 B
$3.0 B
$4.4 B
$5.5 B
$6.6 B

HR&A Advisors, Inc. The Economic and Fiscal Impacts of LIRR Third Track | 42
0
10,000
20,000
30,000
40,000
50,000
60,000
70,000
80,000
2025 2030 2035 2040 2045 2050
Population impacts: The economic growth and improved quality of life catalyzed by Third Track would attract new residents to Long Island.
Additional Population with Third Track, 2025-2050
35,400 New residents by
2035, 10 years after Third
Track completion
15,300 Residents
35,400 Residents
53,400 Residents
67,500 Residents
77,700 Residents
Source: HR&A Advisors; REMI

HR&A Advisors, Inc. The Economic and Fiscal Impacts of LIRR Third Track | 43
Age cohorts: Third Track would help revitalize Long Island by helping to stem the outflow of young workers and their families.
Of the 35,400 new residents present on Long Island by 2035, 39% would be in the 25-44 year old age cohort, compared to only 20% of Long Island’s total forecasted 2035 population.
Age Cohorts of Long Island Population in 2035: Residents Attracted By Third Track vs. Total Population
38% 21%
39%
20%
23%
60%
0%
20%
40%
60%
80%
100%
New Residents Total Population
Aged 45+
Aged 25-44
Aged 0-24
Source: HR&A Advisors; REMI

HR&A Advisors, Inc. The Economic and Fiscal Impacts of LIRR Third Track | 44
Note: All dollar amounts are in 2013 dollars. Source: HR&A Advisors; REMI
Without policies that facilitate transit-oriented development in station areas, the total economic benefits of Third Track are reduced by nearly half.
14,000 jobs
created by 2035
35,400 new
residents by 2035
$5.6 B GRP in 2035
$3.0 B income
in 2035
7,300 jobs
created by 2035
18,600 new
residents by 2035
$2.9 B GRP in 2035
$1.6 B income
in 2035
Third Track with TOD Third Track Without TOD

HR&A Advisors, Inc. The Economic and Fiscal Impacts of LIRR Third Track | 45
HR&A estimated fiscal impacts based upon the employment and population impacts generated by the REMI Policy Insight Model.
• Sales tax revenues to Long Island were estimated based on the historical ratio between personal income and sales tax revenues to Nassau and Suffolk Counties.
• In 2011, this ratio was $1.30 of sales tax revenue for every $100 of personal income. • This ratio is applied to the REMI Policy Insight model’s estimate of new personal income
generated to measure incremental tax revenues owing to Third Track.
• Property tax revenues were estimated based on the value of the spaces needed to house new residents and workers.
• Based on the number of new households and jobs projected by the economic analysis, HR&A estimated the total number of residential units and commercial square footage that would need to be developed in Nassau and Suffolk Counties.
• HR&A estimated the market value of this new property based on recent residential and commercial transaction data.
• Finally, HR&A assumed this new property would be taxed at the current millage rates, based on full market value, for Nassau and Suffolk Counties.

HR&A Advisors, Inc. The Economic and Fiscal Impacts of LIRR Third Track | 46
$0
$50
$100
$150
$200
$250
2025 2030 2035 2040 2045 2050$0
$20
$40
$60
$80
$100
2025 2030 2035 2040 2045 2050
Fiscal impacts: Third Track would generate substantial additional local tax revenues for Long Island.
$ M
illio
n
Additional Sales Tax Revenue with Third Track, 2025-2050
$40 M
$18 M
$57 M
$71 M
$86 M
$ M
illio
n
Additional Property Tax Revenue with Third Track, 2025-2050
$43 M
$103 M
$155 M
$194 M $222 M
Note: All dollar amounts are in 2013 dollars. Property tax revenue includes all county, town, village, school district, and special district taxes. Source: HR&A Advisors; REMI; New York State Department of Taxation and Finance
$40 million annual sales tax revenue in 2035, 10 years after Third
Track completion
$103 million Annual property tax
revenue in 2035, 10 years after Third Track completion

HR&A Advisors, Inc. The Economic and Fiscal Impacts of LIRR Third Track | 47
Note: All dollar amounts are in 2013 dollars. Source: HR&A Advisors; REMI; New York State Department of Taxation and Finance
In sum, Third Track is an essential investment in the future of Long Island that will generate substantial economic and fiscal benefits for Long Island.
14,000 jobs
created by 2035
35,400 new
residents by 2035
$5.6 B GRP in 2035
$3.0 B income
in 2035
$103 million additional annual
property tax revenue in 2035
$40 million additional annual sales
tax revenue in 2035
Economic Impacts Fiscal Impacts

HR&A Advisors, Inc. The Economic and Fiscal Impacts of LIRR Third Track | 48
Long Term Benefits: Third Track would generate a significant payoff for Long Island.
Note: The investment and GRP figures presented are the net present values (NPVs) of the stream of investment payments and GRP generated. The NPV calculations assume a 3% discount rate. All dollar amounts are in 2013 dollars. Source: HR&A Advisors; REMI
$1.1 Billion An initial capital investment of:
produces benefits of:
$7.7 Billion GRP + 4,000 Jobs by 2030
$36.3 Billion GRP + 20,000 Jobs by 2040
$67.9 Billion GRP + 25,000 Jobs by 2050


