

I
I I I I I I I I I I I I I I I I
I
~~!!~ t~~ ~ .i>. ~
iiiiiiiiiiiiiiiiiiiiiiiiiiiiiiiiiiiiiiiiiiiiiiiiiiiiiiiiiiiiiiiiiiiiiiiiiiiiiiiiiiiiiiiiiiiiiiiiiiiiiiiiiiiiiiiiiiiiiiiiiiiiiiiiiiiii_ ~ '.L j • • _ ~ §; liiiiiiiiiiiiiiiiiiiiiiiiii =a \",. ~:: ./*J
EXPER IMENTAL AND ANALYTICAL q'p~(?~A
lUU096 k
7Z2~
(s r.ell~tJ
FORCE DEFORMATION CURVES ' ...
FOR BO LTED DOUBLE ANGLE
CONNECTIONS
Prepared for
American Institute of S teel Construction 400 North Michigan Avenue
Chicago, Illinois 606"
by
J Russell Blew i tt
and Ralph M. Ri c hard
of
The Department of Civil Engineering and Engineering Mechan ics
THE UNIVERSITY OF ARIZONA Tucson, Arizona 85721
1984

~rl ('-cd I't":;~'/'" j)..A ki \) .} c Af.? ,;.. ;t~
J-"ttVl"JjtvJ dtu«~A • Un v .... ity/ of Arizona frt ~ { 7.
College of Engoneerlng J t77t1 Depanment of CIvIl Engoneenng <- c:::. '1 . If! and Engineering Mechanics \
,
Tucson, Anzona 8572 1 (602) 621-2266
I<..-\'B !..
A Proud llti!\Qnllll\
Mr . Nest Iwankiw
---'')-~''#~) v'.0. )Q,h~ Assistant Director of Engineering ~erican Institute of Steel Construction . Inc . 400 N. Michigan Avenue Chicago. ILLINOIS 60611
Dear Nestor :
- <:-r:. -' I
Enclosed are three (3) copies of my report entitled. "Experimental and Analytical Force Deformation Curves for Bolted Double Angle Connections. " This report is to supercede the earlier report by Re i da r Bjorhovde entitled. "Strength and Behavior of Connections Elements . " In your review of the 8jorhovde report (letter to Bjorhovde dated August 17. 1983) you recommended that Bjorhovde .ake a shear test as discus sed at a Project Task Porce meeting in the Spring of 1983 because his shear test was not accurately designed. You further recommended u shear test configuration designed by Mr . William Milek .
Because the results of this research strongly impac ts on ay gusse t plate design studies . I have reviewed the Bjorhovde test speci a ns and reported results . The followi ng iteas were either inadequately or incorrectly reported:
1) Certain of the angle tension tests with 1/ 4 " and 5 / 16" plates were not representative . The specimens failed by tear- out of the top of the plate in the loading fixture (see Figure 4 . 1a ) .
2) The compression tests were incorrectly designed with a singl e bolt . Moreover. the WT section in several of these tests buckled just above the angles . Both of these re sulted in incorrect deforaa tion readings .
3) As indicated above. the shear test was incorr ect ly des igned and run .
4) The stiffness and strength parameters K. Kp . n. and Ro of the Richard Equation were not synthesized and reported in a usef ul way .
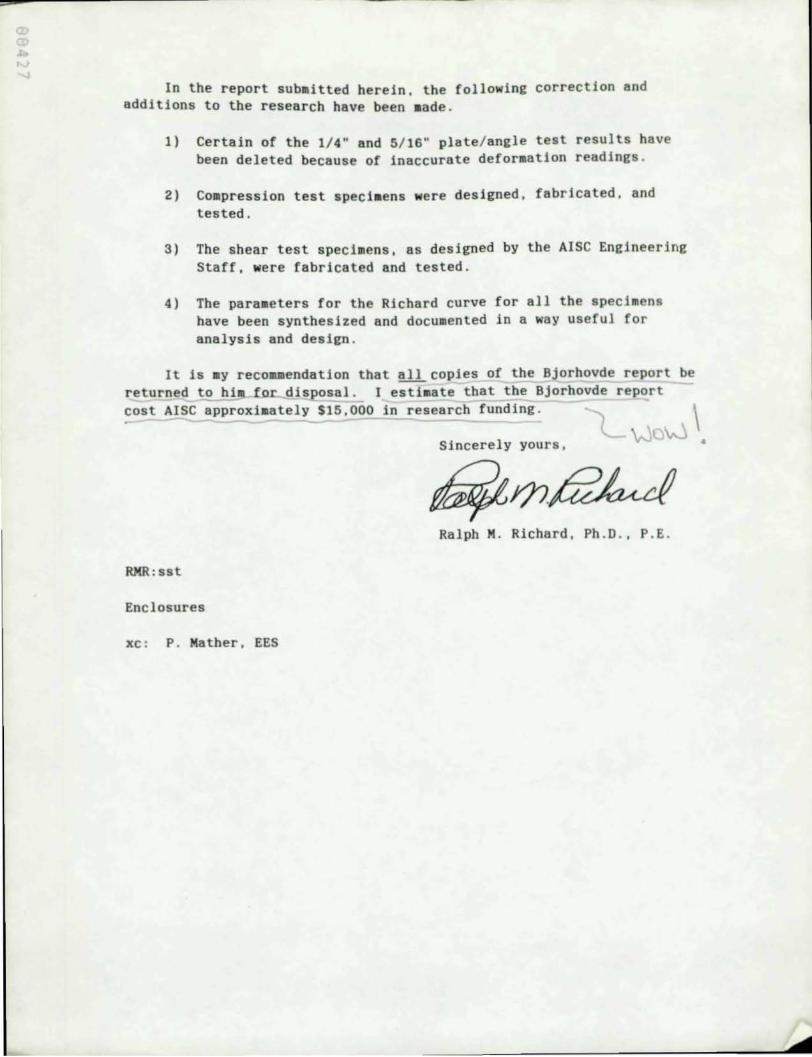
In the report submitted herein. the following correction and additions to the research have been made .
1) Certain of the 1/4" and 5/16" plate/angle test results have been deleted because of inaccurate deformation readings .
2) Compression test specimens were designed. fabricated. and tested .
3) The shear test specimens. as designed by the AISC Engineering Staff. were fabricated and tested.
4) The parameters for the Richard curve for all the specimens have been synthesized and documented in a way useful for analysis and design.
It is my recommendation that all copies of the Bjorhovde report be returned to bim dis osal . I estimate that the Bjorhovde report cost AISC approximately $15.000 in research f unding . -
Sincerely yours.
Ralph M. Richard. Ph . D . . P. E.
RMR : sst
Enclosures
xc : P. Mather. EES
s1

I; IV 0>
I I 1 I I I I 1 I I I I I I I I I I

I I I I I I I I I I I I I I I I I
Section
1
2
3
4
5
TABLE OF COR'IEIITS
LIST OF ILLUSTRATIONS
LIST OF TABLES
INTRODUCTION
BACKGROUND AND SCOPE
TEST SPECIMENS AND PROCEDURES
3.1 3.2 3.3
Test Configurations Specimen Assembly Testing Procedure •
FORCE-DEFORMATION RELATIONSHIPS
4.1 The Richard Equation 4 . 2 Connection Deformation 4 . 3 Curve Fitting Technique 4.4 Determination of the Elastic Stiffness 4.5 Tension Test Results and Conclusions 4.6 Compression Teat Results and Conclusions 4.7 Shear Test Results and Conclusions
SUMMARY AND CONCLUSIONS . . . . . . . . . APPENDICES:
A. The Richard Equation B. References . . . . . •
11
Page
iii
vi
1
2
3
3 4 5
6
6 7 7 8
12 15 16
18
69 70

I ~ w (!)
I I LIST OF ILLUSTRATIONS (continued)
I 17 Tension Tests: 2-1/4 Inch Gage, 3/8 Inch Angle, and 3/8 Inch Plate · • · · · · · · · · · · · · · · 38
I 18 Tension Tests: 2-1/4 Inch Gage, 3/8 Inch Angle,
and 1/4 Inch Plate · · · · · · · · · · · · · · · · · · 39
19 Tension Tests: 2-1/4 Inch Gage, 1/4 Inch Angle,
I and 1/2 Inch Plate • · · · • · · · · · · · · · · · · · 40
20 Tension Tests: 2-1/4 Inch Gage, 1/4 Inch Angle,
I and 3/8 Inch Plate · • · • · • · · · • · · · · · · 41
21 Tension Tests: 2-1/4 Inch Gage, 1/4 Inch Angle,
I and 1/4 Inch Plage · · · · · · · · · · · · · · · · · · · 42
22 Tension Tests: 1-3/4 Inch Gage, 1/2 Inch Angle, and 1/2 Inch Plate · · · · • · • · · · · · · · • · 43
I 23 Tension Tests: 1-3/4 Inch Gage, 1/2 Inch Angle, and 3/8 Inch Plate • · · · • · · · · · · · · · · · · · 44
I 24 Tension Tests: 1-3/4 Inch Gage, 3/8 Inch Angle, and 1/2 Inch Plate · · · · • · · · · · · · · • · · · · • 45
I 25 Tension Tests: 1-3/4 Inch Gage, 3/8 Inch Angle, and 3/8 Inch Plate · · · · · · · · · · · · · · · · 46
I 26 Tension Tests: 1-3/4 Inch Gage, 1/4 Inch Angle, and 1/2 Inch Plate · · · · · · · · · · · · · · · · · · 47
I 27 Tension Tests: 1-3/4 Inch Gage, 1/4 Inch Angle, and 3/8 Inch Plate · · · · · · · · · · · · · · · • · · · 48
I 28 Tension Tests: 1-3/4 Inch Gage, 1/4 Inch Angle,
and 1/4 Inch Plate · · · · · · · · · · · · · · · · · · · 49
I I I I iv
I

I ~
I I I I I I I I I I I I I I I I I I
vi -
Figure
1
2
3
4
5
6
7
8
9
10
11
12
13
14
15
16
LIST OF ILLUSTRATIONS
Loading on Double Framing Angles
Tension Test Configuration • • •
Compression Test Configuration - Front View
Compression Test Configuration - Side View
Sbear Test Configuration - Front View
Sbear Test Configuration - Bottom View
Typical Ricbard Curve witb Richard Equation Parameters
Angle Performance for Stiffness
Tension Specimens after Testing
Tension Tests: 3 Inch Gage, 1/2 Inch Angle
Tension Tests: 3 lncb Gage, 1/2 lncb Angle, and 3/8 Inch Plate ............. .
Tension Tests: 3 Incb Gage, 3/8 Incb Angle, and 1/2 Incb Plate • • • • • • • • • •
Tension Tests: 3 Incb Gage, 3/8 Incb Angle, and 3/8 Inch Plate . • .• ••••••••
. . . . . . . . . . . . . . . . . . . . . . .
Tension Tests: 2-1/4 Incb Gage, 1/2 Incb Angle, and 1/2 Inch Plate • • • • • • • • . . • • . • • • . .
Tension Tests: 2-1/4 Incb Gage, 1/2 Incb Angle, and 3/8 Inch Plate ....•..•.............
Tension Tests: 2-1/4 Incb Gage, 3/8 Incb Angle, and 1/2 Inch Plate . . . . • .. , •.........
iii
Page
22
23
24
25
26
27
28
29
30
31
32
33
34
35
36
37

I I I I I I I I I I I I I I I I I I
29
30
31
32
33
34
35
36
37
38
39
40
41
42
43
LIST OF ILLUSTRATIONS (continued)
Tension Tests: 3 Inch Cage and 1/2 Inch Angle
Tension Tests: 3 Inch Cage and 3/8 Inch Angle •
Tension Tests : 2-1/4 Inch Cage and 1/2 Inch Angle
Tension Testa : 2-1/4 Inch Cage and 3/8 Inch Angle
Tension Tests: 2-1/4 Inch Cage and 1/4 Inch Angle
Tension Tests: 1-3/4 Inch Cage and 1/2 Inch Angle
Tension Tests: 1-3/4 Inch Cage and 3/8 Inch Angle
Tension Tests : 1-3/4 Inch Cage and 3/8 Inch Angle
Kg for Tension as a Function of Cage Length for V rious Angle Thicknesses • • · • · • · · · · • · Ro for Tension as a Function of Cage Length for Various Angle Thicknesses · · · · Compression Specimens after Testing
Compression Tests: 3/8 Inch Tee, 3/8 Inch Angles, and 3/4 Inch A325 Bolts · · · · • · · · · · · Compression Tests : 3/ 8 Inch Tee, 3/8 Inch Angles, and 3/4 Inch A325 Bolts
Shear Specimens after Testing
Shear Test : 1/2 Inch Tee, 3/8 Inch Angles, and 7/8 Inch A325 Bolts · · · · · · · · · ·
v
50
51
52
53
54
55
56
57
· • · · • 58
59
60
· · · · · 61
62
63
· · • · · 64

I ~ ...,
I I I Table
1
I 1a
I 2
3
I 4
I 5
I I I I I I I I I I I
LIST OF TABLRS
Geometry of Tension Test Specimens • • •
Geometry of Compression and Shear Tests
Tension Test Richard Equation Parameters
Recommended Richard Equation Parameters for Tension
Compression Test Richard Equation Parameters
Shear Test Richard Equation Parameters • • •
vi
Page
65
65
66
67
68
68

1. llITRODUCTIOli
I The accurate prediction of connection deformation under loading is
I one of the most important aspects involved in the analysis of structural
I connections. The development of design criteria for standard connections
is the final objective of the detailed series of finite element analyses of
I gusset plate framing connection. currently under way at the University of
Arizona. Force distributions in connections of various configuration.
I under ultimate loading conditions are being compiled by means of the
I nonlinear finite element program, IliELAS [1]. Using a method unique to
INELAS, the force-deformation characteristics of the connection elements,
I obtained from laboratory tests and def ined by the Riehard equation, are
used in the finite element analysis.
I One of the most popular framing connections for structural members
I is the double angle connection. Due to the anisotropic behavior of this
connection, the finite element model must simulate the action of tensile,
I compressive, and shear forces as shown in Figure 1. Test data from t he
University of Illinois [2] and the work of Crawford and Kulak [3] have
I provided strength and stiffness properties needed to formulate the Richard
I curve parameters for a limited number of double angle framing connections.
In order to define the force-deformation relationships for a wider range of
I angle and connecting plate thicknesses and gage lengths than provided by
these studies, additional testing of double angles has been conducted here
I at the University of Arizona [4] . This report recompiles the results .Qf.
I these tests along with the analytical Richard equation paramet er s.
I 1
I

I ~ w
I I I I I I I I I I I I I I I I I I
Additionally, the results of correctly modeled compression and shea r t est s
are reported.
2. BACXGI.OUND AJD) SCOPE
In all of the tests performed (tension, compression, and she a r),
there are four variables in connection geometry of primary importance.
These are: gage length (g), angle thickness (t a ), connecting plate
thickness (t p), and the bolt diameter (db). The results of nineteen
tension tests, two compression tests, and one shear test are presented
herein.
The large number of tension tests were performed for the following
reasons. First, the tension specimen results were expected to be highly
dependent upon the gage length, so three gage lengths were investigated.
Second, it was shown in the University of Illinois study (2) that similar
angle tests, with a small gage length, will respond almost identically in
tension and compression at low magnitudes of load. That is, a part i al
knowledge of the compressive response can be obtained from the tens i on
tests. Finally, the accurate representation of double angles subject to
tensile loading is a more complex, and a more critical aspect of connect i on
analysis.
The compression and shear tests reported herein ~ made ~
replace those in Reference!. The previous compression tests used only a
single bolt and gave inconsistent results. Moreover. the authors of this
report observed that the excessive height of the WT section, used as the
connecting plate, combined with the single bolt configuration, gave r esults
2

I which inc luded the ef fect s of a) p late buckling and b) p la te rotati on.
I In order to eliminate these effects, the new compression tests consisted of
a two bolt connection with a WT section connecting plate that extended
I above the vertical angle legs by less than 1/2 inch . The design of the
I shear test specimen was discussed with the engineering staff of the
American Institute of Steel Construction. That recommended test
I conf iguration is shown in Figures 4 and 5.
The objective of this study was to define the force-deformation
I characteristics for a wide range of double angle connection geometries. To
I accomplish this it is crucial to determine what factors of the geometry
dominate the response of a given connection. Once the relative effect each
I component of a conne ction has on the inelastic response was determined,
generalized force- deformation curves or semi- empirical relationships were
I developed which define the inelastic response as a function of the
I connection geometry. The ability to predict analytically the force
distribution in complex connections is dependent on providing sufficiently
I accurate force-deformation relationships for the finite elements of the
mathematical model.
I I
3. TESTIK DETAILS AIIJl PIlOCl!DURES
3 . 1 Test Configur a t i ons
I The conf igurations of each tes t specimen are shown in Figures 1
I through 6. The dimensions of each component snd the diameter of the bolts
used for all of the specimens are given in Table 1. The combination of
I I 3
I

I I I I I I I I I I I I I I I I I I
used for all of the specimens are given in Table 1. The combination of
anglea and plate thicknesses, gage lengths, and bolt diameters were based
upon those generally encountered in practice.
The tension specimens consisted of combinations of 1/4,3/8, and
1/2 inch angle and connecting plate thicknesses, with gage lengths of
1-3/4, 2-1/4, and 3 inches. The vertical legs of all the tension specimens
were 5 inches. The compression specimens consisted of 3/8 inch angle, with
one specimen using a 1/2 inch connecting plate with 7/8 inch diameter A325X
bolts and the other using a 3/8 inch plate with 3/4 inch diameter A325X
bolts. The shear test specimen consisted of 3/8 inch angles, a 1/2 inch
connecting plate and 7/8 inch diameter A325X bolts.
The connecting plates used in the tension tests were flat plates
with two bolt holes through the top to provide a means of applying the
tensile load. The compression and shear test connecting plates were WT
sections to accommodate compression loading in the testing machine.
The tension and compression tests both used the common three-inch
pitch, which was also used in the finite element connection models. The
shear test specimen had a two-inch pitch, w~th a 1-1/2 inch edge distance
in order to insure adequate ductility under ultimate loading. Additional
details of the tension specimens, as well as complete details of he
compression and shear specimens are shown in Figures 1 through 6.
3.2 Specimen Assembly
The specimena were assembled in the laboratory and the bolts were
pretensioned in the following manner. All bolts were first hand-tightened
4

and the components of the specimen were aligned. Next, the bolt s were
I tightened with an eighteen-inch spud wrench. 801ts in opposing locations
were tightened in a two-cycle rotation to insure a relatively uniform
I clamping of the specimen elements. The tension specimens were bolted to a
I rigid base plate, 1-1/2 inches thick, which was securely fastened to the
base of the testing machine. The connecting plate between the two angles
I was then fastened to the top loading head. The compression and shear
specimens were placed directly on the base of the testing machine and were
I loaded by a spherical bearing head. The tension specimens were pre loaded
I to five kips and the compression and shear specimens to ten kips. This was
done to insure that all bolts were in full bearing contact with the
I elements of the specimen. While under the action of the respective
preloads, all bolts were then tightened in a two-cycle rotation by the
I one-half-turn-of-the-nut method. A careful sequence of tightening was
I followed to insure full contact between the plates due to bolt pretens i on.
The preload was then removed and the test specimen was fitted with t he
I appropriate gages.
I 3.3 Testing Procedure
The dial gages used provided accuracy of up to 0.0001 inches. The
I tension specimens were fitted with two gages as shown in Figure 2, and the
I readings were averaged. It is noted that the placement of the gages is
such that the deformation in the connecting plate, due to the bearing of
I the top two bolts, did not affect the readings. In an actual connect ion
this connecting plate would be a continuous beam web or gusset plate. The
I I 5
I

I ~ w
I I I I I I I I I I I I I I I I I I
recorded the deform a tion of the specimen by measuring the change in
distance between the top spherical loading head and the support base of the
testing machine.
For all of the configurations. three identical specimens we re
assembled and tested. Eight of the tension test specimens and the sh_ar
test specimen provided useful data for only two of the three tested. This
was due to loading head and dial gage difficulties in the tension t est
specimen and a cracked weldment in one of the shear test specimens.
All of the tests were conducted at the same slow rate of load i ng
(about 0.03 inches per minute) on a Tinius Olsen 200 kip universal screw
drive testi,ng machine. Each test was performed by two experienced research
assistants to insur e accurate results.
4. FOII.CIt-DUORIIATIOH Il.ELATI ORSIUPS
4.1 The Richard Curve
A typical RiChard Curve is shown in Figure 7. The four parameters
defining the shape of the curve are K. K R d N p. o. an • The pa rameter K is
the initial slope of the curve which represents the initial or elasti c
stiffness of the specimen. The value Kp is the final slope of the curve
and represents the final or plastic stiffness. An asymptote to the curv"
at a slope equal to Kp will intercept the vertical axis at the value Ro•
called the reference load. Finally. the value N. called the Rich a rd
parameter. defines the sharpness of the transition between the two portions
6

I ~
I I I I I I I I I I I I I I I I I I
of the curve defined by K and Kp' A more detailed presentation of the
Richard equation is included in Appendix A.
4 . 2 Connection Deformat ions
One of the questions addressed here is how much of the force
deformation curve must be provided to adequately access the connection
behavior. Based on displacement data from the finite element analyses of
gusset plate framing connections [5], which was in turn supported by actual
full scale testing at the University of Alber t a , the authors concluded that
it was suff ic ient to represent, analytically, def orma t ions up to
approximately three- to five-tenths of an inch. Although the ultimate
strength of the specimen may not have been reached, combined tensile,
compressive and shear deformations of this magnitude are adequate to assess
the ultimate strength of the entire connection. It is noted that the point
of termination of the curve has no effect on the finite element analysis,
since the solution is dependent only on that portion of the curve
corresponding to the computed displacements at the ultimate load of the
connection. However, for the purposes of this study, a correlation between
connection geometry and the Richard equation parameters was made by
applying a consistent maximum range of deformation.
4.3 Curve Fitting Technique
The Richard curve parameters presented in this report were obtained
by a least squares curve fitting routine. The program XYPLOT (Williams,
1982) contains the subroutine RCFIT (Gillett and Hormby, 1978), which gives
the least squares Richard curve fit and provides the corresponding Richard
7

I ~
I I I I I I I I
...
I I I I I I I I I I
equation parameters for a given set of data points. The plotting of th e
Curves was done on a CalComp 1051 plotter from commands generated by
XYPLOT. The coordinates of the data points to be fitted along with the
elastic stiffness. K, are input to program XYPLOT.
4.4 Determination of the Ela8tic Stiffness
In order to achieve a successful curve fit, the elastic stiffness
had to be calculated beforehand as a function of the connection geomet ry.
As indicated previously, it was anticipated that the tension and
compression specimens should have basically the same elastic stiffness
given a 8mall gage length. Also. since there was a large number of tension
tests performed, any analytical or semi-empirical equation for the elastic
stiffness would have significant experimental confirmation. Accordingly,
the initial effort was made to develop a definition of the elastic
stiffness for the tension test results.
In the tension specimens there are four significant variables
contributing to the elastic stiffness: the angle thickness (ta), the plate
thickness (t p ), the gage length (g), and the bolt diameter (db).
Attempting to formulate a strictly analytical result for the elastic
stiffness is beyond the scope of this study. However, in general, the
total elastic stiffness may be given as:
1
~ 1
- - + K a
1
I),L + 1
~ + 1
K g
8

I I I I I I I I I I I I I I I I I I
where:
K • The elastic stiffness of the angles a
KPL • The elastic stiffness of the plate
Kb • The elastic stiffness of the bolts
Kg • The elastic stiffness contribution of the outstanding angle legs
The elastic stiffness due to the flexing of the outstanding legs of
the angles can be approximated by modeling the horizontal leg of the angle,
from the heel to the center line of the bolt hole, as a beam of length L,
fixed at both ends, as shown in Figure 8. This yields the following result
for the two angles:
• (2)
The gage length is L, and a three-inch pitch is assumed. If the elastic
modulus E is taken as 30,000 ksi, Eqn. 2 becomes the elastic stiffness, lC.r, of the tension specimen,
t
KT • 18 * 104 (-1) 3 kips/in (3) g
where:
tl • The thicknes s of the angle leg in inches
g • The gage length in inches
9

w
I I I I I I I I I I I I I I I I I I
since KPL, a nd Kb are at le ast an order- of-ma gn i tud e l a r ger th an Kg as
discu s sed below. The values of KT for each spe c i me n, rounded to t h e
nearest 50 kips/inch, were input as the initial stiffnes ses for the tension
test force-deformation curves. As shown in the curves of Figures 10
through 28, the experimental data supports this result extremely well.
Although Eqn. 3 provides an accurate value of the elas t ic
stiffness, a further argument is presented to support its use. First, the
elastic stiffness of a single plate connection (KPL) is easily an order-of
magnitude greater than that provided by Eqn. 4 (Richard, Gillett, Kriegh,
and Lewis, 1980). Secondly, the elastic stiffness of the A325 bolts in
shear or tension (Kb) is also much greater than th e values of KT as
obtained from Eqn. 3 (Crawford and Kulak, 1971) and (Fisber and Struik,
1974) [3,8]. Finally, it is noted that the additional stiffne ss
contribution of the vertical leg of the angles (Ka) is considered to be
incorporated into KPL' It is, tberefore, concluded that due to the nature
of Eqn. I, tbe two stiffnesses, KpL and Kb would lower tbe value of KT by
an insignificant amount and may be ignored.
The results obtained above, combined with the observation that the
tensile and compressive elastic stiffnesses would be essentially equal, led
to the following conclusion: Regardless of tbe actual gage length, t be
elastic stiffness of the compression curves can be defined from Eqn. 3 by
using a gage length of 1-3/4 inches. Tbe value of KC was tben doubled to
account for the six-inch-wide angle with two bolts that was used in t be
compression tests. This yields the following equation for tbe elas t ic
stiffness of tbe compress i on specimens:
10

I~
I I I I I I I I I I I I I I I I I I
Equation 4 was used to calculate the value of KC for the compression test
force-deformation curves shown in Figures 40 and 41. Since the angle
thickness (tl) in both of tbe compression test specimens was 3/8 inch, the
value of KC _ 3550 kips/incb, is obtained from Eqn. 4 and used in botb
curves. It is apparent that the data from the compression teata supports
this result.
Tbe elastic stiffness of the shear specimen was determined in a
similar manner. Tbat is, the connection was expected to have a similar
initial response, regardless of the manner of loading. Accordingly, the
value of KC from Eq~ 4 was multiplied by a factor of 2, to account for the
use of four angles in tbe sbear specimens versus two in the compression
specimens. This value was then reduced by one-sixth to account for the use
of five-inch-wide angles in the shear test compared to six-inch-wide angle
in the compression tests. This yielded a value of KS - 5~0 kips/inch for
the elastic stiffness of the sbear test specimen. Tbis value of KS was
used as the elastic stiffness of the shear test force-deformation curve
shown in Fig. 44. It is noted that this value is somewbat higher than tbe
test results indicate. The reason for this was apparent upon observation
of the specimen behavior during loading. It was observed that the legs of
the angles perpendicular to tbe connecting plate bad undergone a
significant amount of rotation in the early stages of loading until a
somewhat shifted seating of the bolts was achieved. This rotation led to
11

I CD
I I I I I I I I I I I I I I I I I I
an increased rate of deformation which resulted in the apparent decrease in
the elastic stiffness. Since this rotation would not exist in an actual
connection it is asserted that this reduction in initial stiffness would
be negligible in a typical connectio~ Therefore, an elastic stiffness of
K - 5900 kips/inch is recommended as the appropriate value for this double
angle specimen loaded in shear.
4 . 5 Tension Test Reaults and Conclusions
Tvo different modes of deformation occurred in the tension teat
specimens. The first occurred as a result of the gage length, where the
heels of the angles "dished" up as they separated from the base plate, a
distortion indicated by the dashed lines in Fig . 8 and seen in the act al
test specimens in Fig . 9. The second occurred as a result of bearing
stresses around the bolt boles. In the majority of tests, a combination of
these tvo effects contributed to essentially all deformation of th~
specimen. The tested tension specimens are shown in Fig. 9.
Tbe elastic stiffness for eacb tension test was calculated from
Eqn. 3 and the data for deformations of 0.3 to 0.5 inches was used tv
generate the curves presented in Figures 10 through 28. A summary of tbe
Richard curve parameters for each of the tension specimen geometries is
presented in Table 2.
Certain reasoning used in obtaining the curve parameters follows.
For example, the tbicker tbe plate or angle, or the shorter the gage
length, the stiffer and stronger the connection should become (i.e., K, Kp,
and Ro sbould increase as ta and tp increase. or as g decreases). Also. it
12

I I I I I I I I I I I I I I I I I
was ~easoned that the Richa~d pa~am ete r, N, should follow some consist en .
patte~n . When these concepts were applied to the data for the t ension
tests, the Richa~d equation parameters conve~ged on those values given in
Table 2. In effect, the data from nea~ly fifty individual tension tests
p~ovided mutually supporting and consistent ~esults .
A review of the pa~amete~s of the tension test curves indicates
that the magnitudes of Ro, Kp, and N a~e virtually independent of t he
connecting plate thickness. It is noted that the testa of 1/2 and 3/8 inch
angles with the two smalle~ gage lengths did yield slightly different
results for diffe~ent plate thickness. and in fact, all of the curves have
diffe~ent values of N. Howeve~. these variations in magnitude, when used
for analyses in p~og~am lHELAS, ~esulted in lite~ally no difference in t he
force distributions for gU88et plate f~aming connections. It is the~eby
concluded that the force-defo~mation cu~ves for double angle framing
connections loaded in tension a~e essentially independent of the connecting
plate thickness. The curves obtained by applying this conclusion a~e
p~esented in Figures 29 th~ough 36. The values of the Richa~d curve
parameters in these figu~es we~e obtained by averaging the values iu
Table 2. The paramete~s for the eight combinations of gage length and
angle thickness, independent of the connecting plate thickness, are listed
in Table 3.
In order to apply this ~e,ult to a still wider ~ange of connection
geomet~ies, curves ~epresenting the two Richa~d equation parameters, Kp and
Ro we~e plotted as a function of the gage length fo~ each of the test ed
angle thicknesses. These curves a~e shown in Figu~es 37 and 38. The solid
13

I I I I I I I I I I I I I I I I I I
lines represent the experimentally obtained results. while the dotted lines
are interpolated (or extrapolated) values for other typical angle sizes.
It is noted that the Ro curves given in Figure 38 show a virtua 11y
linear relationship between Ro and g. Accordingly, the following equations
are recommended for Ro in kips.
Ro4 - 16 . 0 - 4.0g (5)
Ro5 - 32.0 - 8.4g (6)
Ro6 - 52.2 - 14.2g (7)
Ro7 - 63.0-16 . 0g (8)
Ro8 - 72 . 1 - 17.5g ( 9)
Ro9 - 81 . 4 - 19.2g ( to)
RolO - 90 . 6 - 20.8g ( III
The subscript s of R indicate tue number of sixteenths of an inch of angle o
thickness used in the double angle connection. These parameter values
apply to a three-inch element of the double angle with bolts for the
standard three-inch pitch . Note that these values of Ro. as well as the
values of Kp obtained from Figures 37 and 38, are based upon fical
deformations of about 1/2 inch. The values obtained provide the tensile
response of a typical double angle connection whiCh, when combined with
appropriate compressive and shear force-deformation characteristics. define
14

I I I I I I I I I I I I I I I I I I
the inelas tic response of a double angle connection in a gusset plate or
beam to column framing connection.
4.6 Compression Test Result. and Conclusions
The deformations of the compression specimens were primarily
a result of bearing deformations at the bolt holes. It is noted that only
in the compression specimen with the 7/8 inch A.325X bolts did the bolt ..
show any visible signs of shear-related distress. However. this mioi1llal
bolt shear deformation was apparent at a load of approximately 180 kips.
Since the magnitude of loading for a deformation of about 0.3 inches was
only 160 kips. the effects of bolt deformation are generally negligible.
The tested compression specimens are shown in Figure 39.
The elastic stiffness obtained from Eqn. 4 was used in program
XYPLOT along with the experimental data to yield the Richard curves at
Figures 41 and 42. The Richard equation parameters from the two curves ar~
given in Table 4. These comprusion test results lead to the following
relationship between the Richard equation parameters. First. the elastic
stiffness. K, and the Richard parameter, N, are virtually unaffected by the
increase in the connecting plate thickness. Second, the values of th~
final stiffness, Kp ' and the reference load Ro increase in dir l!ct
proportion to the increase in connecting plate thickness. That is, when
the connecting plate thickness was increased by 25%, the values of Kp and
Ro also increased by 25%. It is noted that in both of th e compression
specimens the connecting plates represented the controlling thickness for
bearing failure . Therefore, if the preceding observation is used to
15

I I I I I I I I I I I I I I I I I I
predict the inelastic response of a particular connection where the double
angle thickness may be the critical factor. care should be taken when
proportioning the magnitudes of Kp and Ro. For the purposes of def ining
the force-deformation characteristics supplied to the finite element
program INELAS. the following definitions of the Richard equation
parameters are recommended for each three-inch element of the double angle
connection.
----
where:
---
1.2
142 *
138 *
t
( ~ )
t ( -.S. )
8
kips/in
kips
kips/in
The thickness of the angle leg in inches
The thickness of the connecting plate in inches
The thickness of the connection in bearing. in number of sixteenths of an inch (t p or two times t l • whichever is smaller)
4.7 Shear Test Result. and Conclusions
(12)
(13)
( L4)
(15)
Most of the distortion in the shear test specimens was in th~
connecting plate at the location of the bolt holes. One of the tested
shear specimens is shown in Figure 42. The Richard curve for the shear
16

I ~
I I I I I I I I I
C)
I I I I I I I I I
test is shovn in Figure 43, and the Richard equation parameters a r e given
in Table 5.
As mentioned in Section 4.4, the angles in the shear test underwent
rotation in the plane perpendicular to the connecting plate. The effect of
this rotation lowered the experimental elastic shear stiffness of the
specimen significantly. In a typicsl gusset connection, this rotation
would be essentially zero. Therefore, the lower experimental value of K
determined from this two-bolt teat would not be an accurate property of the
typical connection. Accordingly, the value of KS given in Section 4.4. ia
considered appropriate.
In addition to the bearing deformations in the connecting plate, it
was also observed that the heels of the four angles parallel to t h~
co nnecting plate exhibited SOme minor "dishing" at the bottom of the
specimen. Although this secondary deformation introduced added flexibility
to the specimen, it is impossible to quantify it from the recorded data.
Even though this effect vould not exist in the typical, deeper connection,
no attempt is made here to account for the additional stiffness due to the
depth of the connection [8). Therefore, the folloving conc lusions
regarding Kp and Ra may be considered conservative.
Based on a comparison of the shear and compression tests vith the
same angle, connecting plate, and bolt sizes (Figures 40 and 43), it is
seen that the experimental values of Kp and Ro are very nearly the same in
both tests. However. the shear specimen represents a geometry five-thir ds
the size of the compression test. Therefore, the values of Kp and Ro
def ining the inelastic shear charact eristics wou ld be three-f ifths of the
17
\

I I I I I I I I I I I I I I I I I I
values given for compression. This yields t h e f ollow i ng r ec ommended
definitions of th e Richard equa tion parameters f or a three- i nch leng t h of
a bolted double angle connection loaded in shear.
KS - 18 * 104 ( -.l. )3 kips/in (16) 1. 75
NS - 0 . 9 (17)
t RoS - 85 * ( c ) kips (18 )
8
t KpS ~ 83 * ( c ) kips/in (19)
8
The value of K is th~ same as that given for compression, and the values of
Kp and Ro are three-fifths of those recommended for compression. The valu ..
of N is the value obtained from the least squares Richard curve fit to the
shear test data.
As already noted, these definitions of the inelastic response of
the connection in shear act in combination with the t ensile and compres s ive
effects to give the inelastic response of the entire connection.
5. SUKHAKI AID CONCLUSIONS
The results of this study hsve yielded sem i-empiricsl curvea and
equations defining the Richard equation parameters for bolted, double ang le
connections as a function of connection geometry. This study is based on
the results of physical testing of double angle connections conducted li t
the University of Arizona. The primary app l ication of these expe rimental
18

I ~ VI
I I I I I I I I I I I I I I I I I I
and analytical Richard curves will be their use in the finite element
analysis of gusse t plate framing connections.
The following conclusions are considered significant :
1. The inelastic response of a bolted double angle connection loaded in tension is generally independent of the thickness of the connecting plate.
2. The elastic response (i.e. elastic stiffness) of a bolted double angle connection is virtually identical for tension. compression and shear. given a small gage length (less than 1-3/4 inches)
3. The inelastic strength in kips and stiffness in kips per inch (R and KP) of a bolted double angle connection loaded in co~pression is directly proportional to the least thicknes s of the connection (i.e. the thickness of the connecting plate or two times the thickne ss of the angles).
4. For a three-inch element of a double angle framing connection loaded in tension. the reference load (Ro) in kips as a function of the connection geometry may be summarized as follows:
t KT - 18 * 104 [-l]3 kips/in (20) g
Ro4 = 16.0 - 4 .0g (21)
Ro5 - 32.0 - 8.4g (22)
Ro6 a 52.2 - 14.2g (23)
Ro7 - 63.0 - 16.0g (24)
Ro8 - 72.1 - 17.5g (25)
Ro9 - 81.4 - 19.2g (26 )
RolO - 90.6 - 20.8g (27)
19

I I I I I I I I I I I I I I I I I I
where:
a The thickness of the angle l eg in i nches
g - The gage length in inches
and the subscripts of Ro indicate the number of sixteenths of an inch of
angles thickness. The appropriate values of Nand Kp must be determined
from those presented in Table 3 and Figure 37, respectively.
where:
5. For a three-inch element of a double angle connection loaded in compression, The Richard equation parameters as a function of the connection geometry are:
KC 18 * 104 t l 3 kip / in - ( 1. 75 )
NC • 1.2
t
(28)
(29)
RoC 142 * ( c ) kips (30) - 8"
KpC -
tl -tp •
t
138 * ( c ) kips 8
The thickness of the angle leg
The thickness of the connecting plate in inches
The critical thickness of the connection in bearing, in number of sixteenths of an inch (either tp or two times tl, whichever is less).
6. For a three-inch element of a double angle connection loaded in shear. the Richard equation parameters are:
20
(3 1)

I ~
I I I I I I I I I I I I I I I I I I
" .::.
KS -NS =
RoS -KpS =
where the variables
18 * 104 t1 ( 1. 75
)3 kips/in (32)
0 .9 (33)
t 85 * ( ...£ ) kips (3 4) 8
t
83 * ( ...£ ) 8
kips/in (3 5)
t l • and tc are as defined above.
21

I ~
I I I I I I I I I I I I I I I I I I
Vl V1
FIGURE 1 - LOADING OF DOUBLE FRAMING ANGLES

Ig:
I I I I I I I I I I I I I I I I I I
(J\
-+ I
I , ,.I L,
FRONT VIEW
r
- -
r r-
-~. I_I-
1 1 2" ( 1 j i .:\
I I I I I I I L, ,.J L,- ,.
I L 9
SIDE VIE'II
FIGURE 2 - TENSION TEST CONFIGURATIONS

I I I I I I I I
I I
I I I I I I I I I
~ 11:." ----',-1--1. - 3" ----...1.>-- 11:." ~
FIGURE 3 - COMPRESSION TEST CONFIGURATION
( FRONT VIEW)
2"

ct>
I ~ V1 en
I I I I I I I I I I I I I I I I I I
(
/ 1"\
r-- -- I- -
--- - I-- -
FIGURE 4 - COMPRESSION TEST CONFIGURATION
( SIDE VIEW)
'-
( / -,-
'\

I : ..,.
I I I I I I I I 1 1 I I I I I I I I
CD
r-~-------r------~-.. ~ '4- + I 1"" -~-- 'i- + + _Itf--=--I--f---- ~f--- 2"
_ ~ -_ -~ _ -4L 4-_ : r - -~ _ ~- -, y -y l ~ -- W'
II I I .J
,. / I / / /. I I" 211 l~ " l~" 2 '1 1"
FIGURE 5 - SHEAR TEST CONFIGURATION
( FRONT VIEW )
-'-
/

I ~
I I I I I I I I I I I I I I I I I I
C> C1J
-
-
f- -- f--~ - r- - --f-- - --
I I I I ; V r I
I I I I I I I I I I
I I
I- -- f- - -- ~ - - .-
t- - --
FI GURE 6 - SHEAR TEST CONFIGURATION
( BOTTOM VIEW )
2 00
r-
BOO
l-
200

I I I I I I I I I I I I I I I I I I
o ~ ...J
30
25
20
10
o 0.0 0.1 0.2 0.3 0.4
DEFORMATION (INCHES)
FIGURE 7 - TYPICAL RICHARD CURVE
WITH RICHARD EQUATION PARAMETERS
0.5

I I I I I I I I I I I I I I I I I
, I
"
-
~ I I • i-h
I I I
I
'- -,
"' " -" , " -"
FIGURE 8 - ANGLE PERFORMANCE FOR STIFFNESS

I I I I I I I I I I I I I I I I I I
FIGURE 9 - TENSION SPECIMENS AFTER TESTING

I ~
I I I I I I I I I I I I I I I I I I
(7)
.t.
en 14.
30
25
20
x: 15
o a: o ...J
10
O ~--__ ~--~--~~--~--__ ~--~--0.0 0.1 0.2 0.3 0.4
DEFORMRTION (INCHES)
FIGURE 10 - TENSION TESTS: 3 INCH GAGE
\/2 INCH RNGLE RNO \/2 INCH PLRTE
0.5

. ~
I I
• I I
• • I
• • • • •
en V1
I. I
• I
• •
Cl a:
35
30
25
20
:3 15
10
5
I!l
R, = 20.
N = 1.20
K = 850.
Kp = 22.
O ~--~---,~ __ ~~~ __ --~,--__ --~--__ --~ 0 .0 0.1 0.2 0.3 0.4
DEFORMATION (INCHES]
FIGURE 11 - TENSION TESTS: 3 INCH GAGE
1/2 INCH RNGLE ANO 3/8 INCH PLRTE
0 .5

I I I I I I I I I I I I I I I I I I
Cl a:
14
12
10
8
:3 6
4
R. = 10 .
N = 1.50
2 K = 350.
Kp = 12 .
O ~~--~~~-.--~~ __ ~~--~ __ ~~ 0 .00 0.05 0.10 0.15 0.20 0.25 0.30 0.35
DEFORMATION (INCHES)
FIGURE 12 - TENSION TESTS: 12 INCH GAGE
3/8 INCH ANGLE AND 1/2 INCH PLATE

I ~
I I I I I I I I I I I I I I I I I I
'" .....
<n a.. -x
o a:
14
12
10
8
:3 6
4
R, = 10.
N = 2.50
2 K = 350.
Kp = 12.
O ~~--~~--~~~--~~~--~~ __ ,--,--0.00 0 .05 0.10 0.15 0 .20 0.25 0.30 0 .35
OEFORMRTION (INCHES)
FIGURE 13 - TENSION TESTS : 3 INCH GAGE
3/8 INCH RNGLE RNO 3/8 INCH PLRTE

I ~
I I I I I I I I I I I I I I I I I I
0-
II) Q.. -~ 0 a: 0 -'
so
40
I!I 30 all
Il!)
20
R. :: 34. 10 N :: 0.70
K :: 2000.
kp :: 24 .
O ~ __ --~~~--~~ __ --~ __ ~--__ ~ 0.0 0.1 0.2 0.3 0.4 0 .5
DEFORMATION (INCHES)
FIGURE 14 - TENSION TESTS: 2-1/4 INCH GAGE
1/2 INCH ANGLE AND t/2 INCH PLATE
0 .6

I ~ (]. U>
I I 40
I C!)
I!l 35
I I 30 C!)
C!)
I I!l
25 C!)
I en a..
I -:.:: 20 Cl a:
I 0 .....J
15
I I 10 R. :: 29 .
N :: 0.80
I K :: 2000. 5
I K,. :: 22.
I 0 0.0 0.1 0.2 0.3 0.4 0.5
I DEFORMATION ( INCHES)
FIGURE 15 - TENSION TESTS : 2-1/4 INCH GflGE:
I 112 INCH ANGLE AND 3/8 INCH PLATE
I I

I : "oJ (II
1 1 1 1 1 1 1 1 1 1 1 1 1 1 1 1 1 1
(J) 0... -X
Cl a:
35
30
25
20
g 15
10
5
R. = 20.
N = 0.90
K = 850.
K" = 20.
O ~~~--~~---r--~~--~~~~~ 0 .0 0 .1 0 .2 0 .3 0 .4 0.5 0 .6
DEFORMATION (INCHES)
FIGURE 16 - TENSION TESTS : 2-1/4 INCH GAGE
3/8 INCH ANGLE RND 1/2 INCH PLATE
0.7

I I I I I I I I I I I I I I I I I I
-
en a.. -:.:: 0 a: 0 ...J
30
25
20
4 I!l
15
10
O ~~~---r~-r~~~~~~~~~~ 0.00 0 .05 O.LO 0 . L5 0.20 0.25 0.30 0.35 0.40
DEFORMATION (INCHES)
FIGURE L7 - TENSION TESTS: 2-L/4 INCH GAGE
3/8 INCH ANGlE ANO 3/8 INCH PLATE

I I I I I I I I I I I I I I I I I I
UJ Il..
30
25
20
~ 15 c::l a: o -.J
10
R. = 19 .
N = 1.50 5
K = 850.
Kp = 18.
o ~ __ ~ __ ~ __ ~ __ ~ __ ~ __ ~ __ ~ __ ~ 0 .00 0.05 0.10 0.15 0 .20 0 .25 0 .30 0.35 0 . 40
oEFORMRTION (INCHES)
FIGURE 18 - TENSION TESTS : 2-1/4 INCH GRGE
3/8 INCH RNGlE RNo 1/ 4 INCH PLRTE

I ~
I I I I I I I I I I I I I I I I I I
w
o a: a ...J
10
8
6
4 t!II
R, :: 7 .
2 N :: 2 .30
K :: 250.
Kp :: 11.
O ~--__ --~~--~--~--~--~~~~--~ 0 .00 0.05 0.10 0 . 15 0.20 0.25
OEFORMAT[ON ([NCHESJ
FIGURE 19 - TENSION TESTS : 2-1/4 INCH GAGE
1/4 INCH ANGLE AND 1/2 INCH PLATE

I I I I I I I I I I I I I I I I I I
o m a... -lI:: CJ a: 0 ...J
10
8
6
C!)
4 I!I
R, = 7. 2 N = 2.40
K = 250.
Kp = lL.
O ~--~~--~~--~--~~--~ __ ~ 0.00 0 .05 0 . 10 0 . 15 0 .20
OEFORMATION (INCHES)
FIGURE 20 - TENSION TESTS : 2-1/4 INCH GAGE
1/4 INCH ANGlE AND 3/8 INCH PLATE
0 .25

I ~ ...... V1
I I I I I I I I I I I I I I I I I I
o a: o -'
10
8
6
4
(!) I!l
R. = 7. 2 N = 2.80
K = 250 .
Kp = 11.
O ~~~.-~~~~~~~~~~~.-~ 0 .00 0.02 0.04 0.06 0 .08 0.10 0.12 0 . 14 0.16 0.18
OEFORMRTION (INCHES)
FIC~RE 21 - TENSION TESTS : 2-1/4 INCH GAGE
1/4 INCH RNGlE AND 1/4 INCH PLATE

I ~ J
I I I I I I I I I I I I I I I I I I
Cl a: o ....J
50
40
" u
" " u
"" 30 . ,
'"
20 \!)
R. = 46.
10 N = 0.80
K = 4200.
Kp = 32.
O ~--~-T--~--~-'--~-----T--~~ 0.00 0.05 0.10 0 . 15 0.20
DEFORMATION (INCHES)
FIGURE 22 - TENSION TESTS : 1-3/4 INCH GAGE
1/2 INCH ANGlE AND 1/2 INCH PLATE
0.25

I I I I I I I I I I I I I I I I I I
en a.. -:.::: Cl
~ ...J
50
40 I!I
30
20 I!l!)
R. = 36. 10 N = 1.30
K = 4200.
Kp = 29.
O ~--~~~--~r-~~--~ __ ~~~ 0.00 0.02 0.04 0.06 0 .08 0.10 0.12 0.14
DEFORMATION (INCHES)
FIGURE 23 - TENSION TESTS: 1-3/4 INCH GAGE
1/2 INCH ANGLE AND 3/6 INCH PLATE

I I I I I I I I I I I I I I I I I I
o a: o -I
50
40
30 I!]
fa I!]
•
20
A
10
AI!]
41!]
41
R.
N
K
Kp
= 29 .
= 0.90
= 1800 .
= 28.
O ~--~~I--~--~~--~--~~--~--~~~ 0.0 0.1 0 .2 0.3 0.4 0.5
OEFORMATION (INCHES)
FIGURE 24 - TENSION TESTS: 1-3/4 INCH GAGE
3/8 INCH RNGLE RND 112 INCH PLRTE
0.6


I : 0> (t)
1 1 20 A I!H !)
1 • !!l C!I
• !!l C!I
I C!I
• C!I!!l
1 15 <!I!l
1 • <!I!l
• (WI
1 • I]!)
til !!lC!l
I Q.. -x: 10 0 a:
1 0 ~
1 1 5 R, = 9 .
1 N :: 3.70
K = 550 .
1 Kp = :Z4 .
1 0 0.0 0.1 0 .2 0.3 0.4 0.5
1 DEFORMATION ( INCHES)
FIGURE 26 - TENSION TESTS : 1-3/4 INCH GAGE
I 1/4 INCH AJGlE AND 112 INCH PLATE
I I

I ~ c., -
I I 25
I I I!l. \!)
20 t!I. \!)
I \!)
I \!)
I 15 • \!)
(f)
I Q..
• \!) -x: I!l .\!)
0
I a: 0 -J
10
I I R. = 9.
5 N = 3.80 I K = 550.
I Kp = 24 .
I 0 0.0 0.1 0 .2 0 .3 0.4 0.5 0.6
I DEFORMATION (INCHES)
FIGURE 27 - TENSION TESTS: 1-3/4 INCH GAGE
I 1/4 INCH ANGlE AND 3/8 INCH PLATE
I I

I I I I I I I I I I I I I I I I I I
en a.. -:.:: 0 a: 0 ...J
20
15
10
5
0.0
•
.. 41
R, = 9.
N = 3.90
K = 550.
Kp = 24.
0.1 0.2 0.3 0.4
DEFORMATION (INCHES)
FIGURE 28 - TENSION TESTS: 1-3/4 INCH GAGE
1/4 INCH ANGLE AND 1/4 INCH PLATE
0.5

I ~ 0>
I'" I 1 I I I I I I I I I I I I I I I
(IJ Cl.. -
30
25
20
x: 15 o a: o ....J
10
0.0
«
0.1
I!I
0.2 0.3
)(. ..<!)
X • ..<!) I!I
)( + . "<!) I!I
C!) I!I
0 .4 0.5 DEFORMATION (INCHES)
FIGURE 29 - TENSION TESTS: 3 INCH GAGE
1/2 INCH ANGlE

' I ~ ~
I I 14
I I 12
I 10 I!I
I I 8
(J)
I ll.. -X
0
I a: 0 6 ~
I 4
I R. = 10.
I N = 2.00
2 K = 350.
I KI' = 12.
I 0 I
0.00 0.05 0.10 0.15 0.20 0.25 0.30 0.35
I DEFORMATION (INCHES)
FIGURE 30 - TENSION TESTS : 3 INCH GAGE
I 3/8 INCH ANGlE
I •
I

I ~
I I I I I I I I I I I I I I I I I I
\It
UJ <>. -:.:: 0 a: 0 ...J
50
40
30
20
10
0.0
•
0.1
IE I!lIa
a • e l!!
.1!II!l • e + . ., +
4(1!I + ee l!! +
+ +
+ +
R. = 32.
N = 0.70
K = 2000.
Kp = 23.
0 .2 0 .3 0.4
DEFORMATION (INCHES) 0 .5
FIGURE 31 - TENSION TESTS: 2-1/4 INCH GAGE
1/2 INCH ANGLE
0.6

I ~ Q> Ql
I I 30
I I 25
I .. I ..
20 lII!I41
I If)
I <l..
x: 15 0
I a: 0 -'
I 10
I R. = 19.
I N = 1.20 5
K = 850.
I Kp = 20.
I 0 0.0 0.1 0.2 0.3 0 .4 0 .5
I DEFORMATION ( INCHES)
FIGURE 32 - TENSION TESTS : 2-114 INCH GAGE
I 3/8 INCH ANGlE
I I

I I I I I I I I I I I I I I I I I I
rn Il.. -"'" 0 a: CJ -.J
10
8
6
4 •
R. = 7 . 2 N = 2 .50
K = 250.
Kp = 11.
O ~--~~--~--r-~--~--~~--~~ o .00 0 .05 0.10 O. 15 0 .20
DEFORMATION (INCHES)
FIGURE 33 - TENSION TESTS: 2-1 / 4 INCH GAGE
1/4 INCH ANGLE
0.25

I ~
I I I I I I I I I I I I I I I I I I
00 00
'" a.. -:.c:
0 a: 0 -l
50
40
I!I ~
30
20
R, = 42. 10 N = 1.00
K = 4200.
Kp = 31.
O ~~~~~~~~~~~~~~~~'-~I~~ 0 .000 .020.040.060 .080.100.120 . 140 .160 . 18
DEFORMATION (INCHES)
FIGURE 34 - TENSION TESTS: 1-3/4 INCH GAGE
112 INCH ANGlE

I g c <D
I I 40
I .. .. C!I
I 35 ,. +x x
I ~ x 30 x
I I
25
en
I a.. ~ 20 0
I a: 0 -'
I 15
I 10 R. = 28.
I N = 0.90
K = 1800. 5
I Kp = 27.
I 0 0.00 0 .05 0.10 0 . 15 0.20 0.25 0 .30 0.35
I OEFORMATION (INCHES)
FIGURE 35 - TENSION TESTS: 1-3/4 INCH GAGE
I 3/8 INCH ANGLE
I I

I ~ <D (J)
I I 20 ~(!)
I +
I x (!)
I 15
I • • E
.CDo:
I .. <n ., ~(!)
I a... -:.:: 10 0
I ~ ...J
I I 5 R, = 9.
I N = 3.80
K = 550.
I K,. = 24.
I 0 0 .0 0.1 0.2 0.3 0.4 0.5
I DEFORMATION ( INCHES J
FIGURE 36 - TENSION TESTS: 1-3/4 INCH GAGE:
I 1/4 INCH ANGLE
I I

I I I I I I I I I I I I I I I I I I
-
:I: u z -en Q.. -:.::
'" :.::
40
35
30
25
20
15
10
5
o
5/8 INCH ANGlE
9/16 INCH ANGlE
112 INCH ANGlE
7/16 INCH ANGlE
3/8 I NCH ANGlE
5/16 INCH ANGlE
1/. INCH ANGlE
1.0 1.5 2.0 2.5 3.0 3.5 4.0
GAGE LENGTH (INCHES)
FIGURE 37 - Kp FOR TENSION AS A FUNCTION OF THE
GAGE LENGTH FOR VARIOUS ANGLE THICKNESSES

I I I I I I I I I I I I I I I I I I
·oJ
en 0-
x:
55
50
45
40
35
30
Q!O 25
20
15
10
5
o 1.0 1 .5 2 .0 2.5 3.0
5/8 INCH ANGLE
9/16 INCH ANGLE
112 INCH ANGLE
7/16 INCH ANGLE
3/8 INCH ANGLE
5/16 INCH ANGlE
1/" INCH ANGLE
3.5 4.0
GAGE LENGTH (INCHES)
FIGURE 38 - R FOR TENSION AS A FUNCTION OF THE o
GAGE LENGTH FOR VARIOUS ANGLE THICKNESSES

I ~
I I I I I I I I I I I I I I I I I I
<D W
.. II
-~--- -----
FIGURE 39 - COMPRESSION SPECIMENS
AFTER TESTING
•

I ~ I.D
I I I I I I I I I I I I I I I I I I
U"l Q.. -:.: Cl a: 0 ...J
160
140
120
100
80
60
40
20
e
• • • •
R. = 1SO.
N = 1.20
K = 3550.
K,. = 135.
O ~--~--~I~~--~--~--~--~--~--~--~ 0.00 0.05 0.10 0.15 0.20
DEFORMATION (INCHES)
FIGURE 40 - COMPRESSION TEST: 1/2 INCH TEE
3/8 INCH ANGLES AND 7/8 INCH A325 80LTS
0.25

I I I I I I I I I I I I I I I I
[I I
en Il..
120
100
80
::.::: 60 o a: a ...J
40
20
R. = 100.
N = 1.20
K = 3550.
K,. = 105.
o ~--~--~~--~--~--~--~~--~--~ 0 .00 0.05 0 . 10 0.15 0.20
DEFORMATION (INCHES)
FIGURE 41 - COMPRESSION TEST: 3/ 8 INCH TEE
3/8 INCH ANGLES AND 3 / 4 INCH A325 BOLTS
0. 25

I ~ o
I I I I I I I I I I I I I I I I I I
FIGURE 42 - SHEAR SPECIMEN AFTER TESTING

(XI
I ~ iD
I I I I I I I I I I I I I I I I I I
180
160
140
120
en 100 Il... -x:
o a: o -'
80
60
40
20
R. = 160 .
N = 0.90
K = 5900.
Kp = 130.
O ~--~--~--~ __ ~~ __ ~ __ ~ __ ~I __ ~ __ ~
0.00 0 .05 0.10 0.15 0.20
OEFORMATfON (fNCHES)
FfGURE 43 - SHEAR TEST: 1/2 fNCH TEE
3/ 8 fNCH ANGlES AND 7/ 8 fNCH A325 BOLTS
0. 25

I I I I I I I I I I I I I I
Table 1. Geometry of the Tension Tests (Dimensions in Inches).
------------------------------------------------------------._-----------------Test : Gage L~ngth : Angle Thi.:k:l~sS : Pla1;e Thickness: Iiol : Dlamete ,.
------------------------------------------------------------ ------------------T1 3 1/2 112 3/4
T2 3 1/2 3/8 3 / 4
T3 3 3/8 1/2 3/4
T4 3 3/8 3/8 3/4
T5 2-1/4 1/2 112 3/4
T6 2-1/4 1/2 3/8 3/4
T7 2-1/4 3/8 112 3/4
T8 2-1/4 3/8 3/4
T9 2-1/4 3/8 1/4 3/4
T1D 2-1/4 1/4 1/2 3/4
T1l 2-1/4 114 3 / 9 3/4
T12 2-1/4 114 1/4 3/4
T13 1-3/4 1/2 112 3/4
T14 1-3/4 1/2 3 / 8 3/4 ---.----------------------.---------------------------------.-------------------. I
T15 1-3/4 3/8 112 3/4
T16 1-3/4 3/8 3 / 8 3/4
T17 1-3/4 114 1/2 3/4
T18 1-3/4 114 3/8 3/4
T19 1-3/4 114 114 3/4
Table la o Geometry of Compression and Shear
I Tests (Di mensions in Inches) .
------------------------------------------------------------------------------Test Angle Thickne s s Plate Th ickne~s Bolt Oia metl!"
I ------------------------------------------------------------------------------C1 3/8 1/2 7 / 8
--------------------------------------------------- --------- ------.------------
I C2 3/8 3i8 3 / 4
------------------------------------------------------------------ ------------81 3/8 1/2 7/8
------------------------------------------------------------------------------
I 65

I I T@st :
Tabl e 2. Tension Tes t Ri chard Equation Parameters (Units in Kips and Inches ) .
Elastic Sti ffness Plastic Stiffness K
R~f@rence Lo a d R
p o
Ri chard Parameter
N
I ------------------------------------------------------------------------------T1 850 22 20 1. :)
T2 850 22 20 1. 2 I ------------------------------------------------------------------------------T3 350 12 10 1. 5
I __ ~~ __________ ::~ ____________________ 12 _________________ :~ ______________ :~: ____ _
T5 2000 24 34 O. 7
I T6 2000 22 29 O. B
T7 850 20 20 O. 9 I ------------------------------------------------------------------------------T8 850 20 19 1. 2
I T9 850 18 19 1.5
TlO : 250 11 7 2 . 3
I --~~~-~-------;;~------------------~~------------------;--------------;~~-----Tl2 : 250 11 7 2 . 8
I ------------------------------------------------------------------------------T13 : 4200 32 46 0 . 8
I --~:~-~------~:~~------------------:~-----------------:~--------------:~:----Tl5 : 1800 28 29 O. 9
I Tl6 : 1800 26 26 0 . 9
Tl 7 : 550 24 9 3 . 7
I --~~~-~-------;;~------------------;~------------------~--------------;~~-----
I --~:~-~-------::~------------------:~------------------~--------------:~~----I I 66
I

------------------easea
Gage Length
3
3
2-1/4
Table 3. Recommended Richard Equation Parameters for Tension (Units in Kips and Inches).
Angle Thickness K K R p o
1/2 850 22 20
3/8 350 12 10
1/2 2000 23 32
1. 1
2. 0
O. 7 ---------------------------------------------------~---------------------------
2-114 3/8 850 20 19 1.2
2-114 1/4 250 11 7 2 . 5
1-3/4 1/2 4200 31 42 1.0
1-3/4 3/8 1800 27 28 0 . 9
1-3/4 1/4 550 24 9 3 . 8

I ~ ~ -
I I 1 1 1 Table 4. Compression Test Richard Equation Parameters
(Units in Kips and Inches).
I------~-~~~~;~~-~;~~;~~~~-~-~~~~;~~-~;~;;~~~~-~-~~;~;~~~:-~:~~-~--~~~;~;~------Test : K : ;:. : R : Parameter
I I P I 0 I N
1-------------------------------------------------------------------------------C 1: 3550 : 135 : ~ 50 : 1. :2
-------------------------------------------------------------------------------
1 1 I
Table 5. Shear Test Richard Equation Parameters (Units in Kips and Inches).
-------------------------------------------------------------------------------
1 : Elastic Stiffnes5 : Plastic Stiffness : Reference Load : Richard Test : K : ~ : R I Parameter
p IoN
I-~;--~--------;;~~-------~--------;;~--------~-----~~~-------~----~~;---------------------------------------------------------------------------------------
1 I I I I
68

I I I I I I I I I I I I I I I I I
APPEllDIX A
nm IUCIWID EQUATION
The Richard Equation, developed by Richard and Abbott, 1975 is t he
elastic-plastic, stress-strain formula defining the force-deformat i on
curves presented in this report. The Richard Equation is a continuous
analytical expression that describes the relationship between the strength
and stiffness of the system in question as follows:
where:
R
R o
N
R
-
-
-
1 = + x
p
K x 6. 1
1 + R
o
Load
Deformation
Intersection of a line asymptotic to the curve at a slope equal to Kp
The sharpness of the transition in slope from K to Kp
The plastic stiffness, or final slope of the curve
(K - Kr)' where K is the elastic stiffness, or the initia s l ope of the curve
69

I ~ w
I I I I I I I I I I I I I I I I I I
1.
2 .
3.
4.
5.
APPERDIX B
Richard. R. M •• "User's Manual for Nonlinear Finite Element Analysis Program INELAS." Department of Civil Engineering and Engineering Mechanics. The University of Arizona. Tucson. Arizona. 1968 (Updated 1984) •
Lewitt. C. W •• Chesson. E. and Munse. W. K •• "Restraint Characteristics of Flexible Riveted and Bolted Beam-to-Column Connections." Structural Research Series Report No. 296. University of Illinois. March 1966.
Crawford. S. F. and Kulak. G. L • • Connections." Journal of the Structural
"Eccentrically Loaded Bolted Division. ASCE. March 1971.
Irish. D. J •• "Strength of Connection Elements." M.S. Thesis. Department of Civil Engineering and Engineering Mechanics. Univers ity of Arizona. Tucson. Arizona. 1983 .
Rabern. D. A • • "Stress Strain and Force Distributions in Gusset Plate Connections." M. S. Thesis. Department of Civil Engineering and Engineering Mechanics. University of Arizona. Tucson. Arizona. 1983.
6. Richard. R. M • • Gillett. P. E •• Kriegh. J. D •• and Lewis. B.A •• "The Analysis and Design of Single Plate Framing Connection .... AISC Engineering Journal. No.2. 1980.
7. Fisher. J. W. and Struik. J . B. A.. "Guide to Design Criteria for Bolted Riveted Structural Joints." John Wiley and Son.. New York. New York. 1974.
8. Bamm. K. R. and Richard. R. M •• "The Analysis and Behavior fo Deep Bolted Angle Connection .... M. S. Thesis. Department of Civil Engineering and Engineering Mechanics. University of Arizona. Tucoon. Arizona. 1984.
70

I ~ en
I ~
I I I I I I I I .. I I I I I I I I

I I I I I I I I , I I I I I I I I I I

I I I I I I I I I
I I I
I I I
![Production of Aromatic Compounds by Metabolically ... · template]), AR-G84 (mtlA::FRT-Km-FRT-T7p-ipdC [pARO136 used as thetemplate]),AR-G85(mtlA::FRT-Km-FRT-T7p-ldhA[pARO133used](https://static.documents.pub/doc/80x56/605bd06165e40005573dff83/production-of-aromatic-compounds-by-metabolically-template-ar-g84-mtlafrt-km-frt-t7p-ipdc.jpg)


