

Applied Energy 106 (2013) 365–376
Contents lists available at SciVerse ScienceDirect
Applied Energy
journal homepage: www.elsevier .com/locate /apenergy
Experimental evaluation of a real time energy management system forstand-alone microgrids in day-ahead markets
0306-2619/$ - see front matter � 2013 Elsevier Ltd. All rights reserved.http://dx.doi.org/10.1016/j.apenergy.2013.02.018
⇑ Corresponding author. Tel.: +34 933562615; fax: +34 933563802.E-mail address: [email protected] (M. Marzband).
Mousa Marzband a,⇑, Andreas Sumper a,b, Albert Ruiz-Álvarez a, José Luis Domínguez-García a,Bogdan Tomoiaga c
a Catalonia Institute for Energy Research (IREC), Jardins de les Dones de Negre 1, 08930 Sant Adrià de Besòs, Barcelona, Spainb Centre d’Innovació Tecnològica en Convertidors Estàtics i Accionaments (CITCEA-UPC), Departament d’Enginyeria Elèctrica, EU d’Enginyeria Tècnica Industrial de Barcelona,Universitat Politècnica de Catalunya (UPC), C. Comte d’Urgell, 187, Pl. 2. 08036 Barcelona, Spainc Technical University of Cluj-Napoca, No. 28, Memorandumului st., 400114 Cluj-Napoca, Romania
h i g h l i g h t s
" An energy management system software has been proposed in experimental Microgrid." Local Energy Market has been presented for islanded Microgrids in Day Ahead Market." Simulation and experimental results demonstrate a reduction in generated power cost.
a r t i c l e i n f o
Article history:Received 16 October 2012Received in revised form 7 January 2013Accepted 4 February 2013
Keywords:Day-ahead marketEnergy management systemLocal energy marketSingle side auctionMicrogrid
a b s t r a c t
A Microgrid (MG) Energy Management System (EMS) is a vital supervisory control to make decisionsregarding the best use of the electric power generation resources and storage devices within this MG. Thispaper presents an operational architecture for Real Time Operation (RTO) of an islanded MG. This archi-tecture considers two different parts including Central Control Unit (CCU) and MG Testbed. CCU imple-ments an EMS based on Local Energy Market (LEM) to control a MG. In order to reach this objective, thisunit executes Day Ahead Scheduling (DAS) and Real Time Scheduling (RTS). Regarding DAS, a ModifiedConventional EMS (MCEMS) based on LEM (MCEMS�LEM) algorithm has been proposed to find out hourlypower set-points of Distributed Energy Resources (DERs) and customers. LEM is also presented inMCEMS�LEM to obtain the best purchasing price in Day-Ahead Market (DAM), as well as to maximizethe utilization of existing DER. With regard to RTS, it must update and feedback the power set-pointsof DER by considering the results of DAS. The presented architecture is flexible and could be used for dif-ferent configurations of MGs also in different scenarios. Simulations and experimental evaluations havebeen carried out using real data to test the performance and accuracy of the MG testbed. This paper aimsto operate the MG in islanded mode, ensuring uninterruptable power supply services and reducing theglobal cost of generated power. Results demonstrate the effectiveness of the proposed algorithm andshow a reduction in the generated power cost by almost 8.5%.
� 2013 Elsevier Ltd. All rights reserved.
1. Introduction
MG can significantly improve the efficiency of energy produc-tion to maintain the balance between power generation and loaddemand mostly at the distribution level. It is also desired to obtainmeasurable reduction in environmental emissions and increasedpower quality through MGs. EMS helps to coordinate such func-
tions. Various configurations for EMS with different algorithmsand different MG structures have been presented in literature [1,2].
Effective energy management can provide the necessary opti-mal and sustainable energy supply with the maximum ability. Fur-thermore, given the intermittent nature of renewable energyresources, EMS should be able to find the best solution to supplyconsumers quickly and continuously, i.e., every minute or few min-utes. In general, gradient-based optimal EMSs are slow to be usedfor real-time energy management problem. As a result, recent re-search in this area has been focused on the off-line application ofintelligent methods for energy utilization in the hybrid energy

Nomenclature
AcronymsDAM Day-Ahead MarketDER Distributed Energy ResourcesDSP Digital Signal ProcessingEGP Excess Generated PowerES Energy StorageEMS Energy Management SystemsEWH Electric Water HeaterIREC Catalonia Institute for Energy ResearchLEM Local Energy MarketMCP Market Clearing PriceMCEMS Modified Conventional EMSMG MicrogridMT MicroturbinePV PhotovoltaicES,c ES during Charging ModeES,d ES during Discharging ModeSOC State-of-ChargeSSA Single-Sided AuctionTRP Total required powerTGP Total generation power
WT Wind Turbine
VariablespA the supply bids by A (€/kW h) A 2 {WT,PV,ESd and MT}kMCP
t MCP at each time t using MCEMS algorithm (€/kW h)k0MCP
t MCP if MT always on during a day (€/kW h)PC
t available power of C in MCEMS�LEM (kW)ePCt active power from C emulator (kW)
C 2 {WT,PV,MT,ES,ESc,ESd,EWH,TRP,TGP and EGP}Pn
t uncontrollable load demand at each time step (kW)ePnt active power from Load demand emulator (kW)
PReqt difference between the produced power by renewable
resources and the consumed power by load demand(kW)
Qj;bt the quantity produced by generation unit j in step b at
time t, in (kW h)QTRE
t the total required energy by costumers (kW h)QTGE
t the total generated energy by micro-sources (kW h)SOCt battery SOC (%)Dt energy management time step
366 M. Marzband et al. / Applied Energy 106 (2013) 365–376
systems, e.g. [3,4]. Only few other studies have been reported withlimited simulation evaluations for real-time management inspecific applications [5,6]. This paper has focused on real timeimplementation of EMS with additional constraints for batteryoperation and its life time extension. Real time operation havebeen investigated in literature [7,5,8] but these algorithms havenever been tested in real experimental MGs.
In this work, an MCEMS for a low voltage stand-alone MG isproposed to determine the best dispatch of an aggregated groupof DGs with the ultimate goal to obtain MCP under various scenar-ios for ES. This algorithm has been intended to significantly im-prove the efficiency of energy production and delivery as well asto maintain the balance between power generation and load de-mand, to optimize the energy utilization and to enhance energysustainability. Furthermore, generator owners keeps the right ongeneration and consumption pattern and try to maximize its eco-nomical profit. Under this assumption, LEM is proposed in orderto obtain the best purchasing price as well as to maximize theuse of the existing DER. Furthermore, the well-established LEMstructure has also been compared the results obtained using thisalgorithm to another one. It is also applied for real time applicationusing a proposed architecture which can achieve EMS objectives ina few seconds. The proposed architecture can be easily applied toany configuration of MG system with various characteristics. Then,it has been validated in IREC’s MG testbed. Primary frequency con-trol is not addressed in this paper.
As reported in literature, some MG test systems have beenimplemented around the world [9–13]. These systems allow test-ing different components [14–17], control strategies [18–24],topologies for communication between micro-sources [25], storagetechnologies [26] and the used standards in MGs [27]. IREC’s MGtestbed has also been developed at IREC which has been justifiedand utilized in different studies at this center. The effectivenessof the performance of this testbed is also verified in different pro-jects [28–32].
The novelties and contributions of this paper are listed asfollows:
� To propose fast, flexible and extendable RTO architecture tocoordinate DAS and RTS; Moreover, to improve ES operationconsidering two extra operation modes for the ES includingOver Charging Protection Mode and Over Discharging Protec-tion Mode.� Experimental testing and validation of proposed algorithm in a
real MG based on power emulators.
The paper is organized as follows. Section 2 describes the prob-lem formulation, which covers EMS and LEM mathematical imple-mentation. The proposed real time operational architecture forboth simulation and experimental evaluations is presented in Sec-tion 3 which divided to different subsections to explain about theproposed algorithms and Testbed configuration. Application of thisarchitecture to test systems is demonstrated in Section 4. Section 5presents simulation and experimental results and discusses aboutit. Finally, the paper is concluded in Section 6.
2. Problem formulation
2.1. MCEMS unit mathematical implementation
In this paper, an MCEMS unit is proposed to dispatch power setpoints in a MG comprises PV, WT, MT and ES systems. The pro-posed unit is illustrated by a Pseudo-code in Algorithm 1. In thisunit, when the sum of the produced power by the PV and WT ismore than the load demand, and the battery is not in Fully ChargedMode, the battery bank can be operated in two operation modes(i.e. Charging and Over Charging Protection Modes). Likewise, thedischarge process can be used in the case when the power gener-ated by the hybrid system does not meet the load demand com-pletely. In this case, ES can also work in two operation modesnamely Discharging and Over Discharging Protection Modes duringDischarging Mode. The highlighted areas in Algorithm 1 are one ofthe novelties of this paper. Each of operation modes have been pre-sented in detail in [33].

Fig. 1. Step-wise energy and offer price by micro-source and demand in MG.
Wholesales energy price
Hourly forcastingfor PV and WT
Hourly forcasting for load demand
Active power setpoints to
generators andcustomers
Real Time Scheduler
Central Control Unit (CCU)
Day-Ahead Scheduler
MGPower real data of emulators
PV WT ES MTt t t t
n EWHt t
P ,P ,P ,P ,
P and P
PV WT ES MTt t t t
n EWHt t
P ,P ,P ,P ,
P and P
LEMMCEMS—
Fig. 2. RTO architecture of a MG.
M. Marzband et al. / Applied Energy 106 (2013) 365–376 367
Algorithm 1. MCEMS UNIT
Require: PV, WT and load demand profile of the MG, theinitial SOC of ES and the characteristic of system ascontained in Table 1
1: Initialization2: for i 0:24 do
PReqt ¼ PWT
t þ PPVt
� �� Pn
t
� �; ð1Þ
3: if PReqt P 0 then
4: if SOCt P SOC then5: Go to Fully Charged Mode6: Power set-points updated by RTS7: Exit the for loop
8: else if PReqt P PES;c then
PESt ¼ PES;c; ð2Þ
PEWHt ¼ PReq
t � PESt
� �; ð3Þ
9: if VESt P VES then
10: Go to Over Charging Protection Mode Powerset-points updated by RTS Exit the for loop
11: else12: Go to Charging Mode13: Power set-points updated by RTS14: Exit the for loop15: end if16: end if
17: else if SOCt 6 SOC then18: Go to Fully Discharged Mode19: Power set-points updated by RTS20: Exit the for loop21: else
PReqt ¼ PReq
t
��� ���; ð4Þ
22: if PReqt P PES;d then
PESt ¼ PES;d; ð5Þ
PMTt ¼ PReq
t � PESt
� �; ð6Þ
23: end if
24: if VESt 6 VES then
25: Go to Over Discharging Protection Mode Power set-points updated by RTS Exit the for loop
26: else27: Go to Discharging Mode28: Power set-points updated by RTS29: Exit the for loop30: end if31: end if32: end for
33: return PESt ; P
MTt ; PEWH
t and PESt
2.2. LEM unit mathematical implementation
In deregulated markets, auction is the most common pricingmechanism used to match both active power demand and active

Yes
No
Set parameters
MCEMS unit
LEM unit
T[h] = T[h] + [h]
T > 24[h]
End
Start
RTS
Fig. 3. The proposed MCEMS�LEM algorithm flowchart.
368 M. Marzband et al. / Applied Energy 106 (2013) 365–376
power supply. The interrelated concept considered in this paper isDAM. In DAM, each generation unit submits energy offers to theMG operator while load representatives submit load declarationsfor each trading interval. Supply offers and load declarations canbe either ‘‘priced’’, in the form of a set of price-quantity (€/kW h–kW h) pairs, or ‘‘non-priced’’, in the form of quantity (kW h) or of-fers (bids) only. MG operator processes supply offers and the load
Table 1Configuration parameters for each unit.
Parameter Symbol Value
ES systemVoltage (V) VES
t24
Nominal Ah capacity at +25 �C NES 84Fully charged voltage (V) VES 26Cut-off discharge voltage (V) VES 21
Maximum continuous charge current (A) IES;c 34Maximum continuous discharge current (A) IES;d 160Maximum battery power during charging mode (kW) PES;c 0.816Maximum battery power during discharging mode (kW) PES;d 3.84Maximum delivered power by converter (kW) PES 4Initial SOC at T (%) SOCI 50Maximum SOC (%) SOC 80
Minimum SOC (%) SOC 20
Initial stored energy in battery (kWh) EESI
1
Maximum stored energy in ES (kWh) EES 1.6Minimum stored energy in ES (kWh) EES 0.403
Total capacity of ES (kWh) EESTot
2
Charge efficiency factor (%) gc 96
PV systemMaximum instantaneous power for PV (kW) PPV 6Minimum instantaneous power for PV (kW) PPV 0
WECS systemMaximum instantaneous power for WECS (kW) PWT 8Minimum instantaneous power for WECS (kW) PWT 0.45
MT systemMaximum instantaneous power (kW) PMT 12Minimum instantaneous power (kW) PMT 3.6
EWH systemMaximum EWH power (kW) PEWH 5Minimum EWH power (kW) PEWH 0
declarations. Then, it computes the MCP that clears the market andthe trading volume [34–36].
The proposed LEM allows MG operator to maximize profit bymanipulating the generation and consumption patterns. In orderto work with LEM, wholesales energy prices, TRP and TGP mustbe cleared at each iteration.
TRP includes the load demand, ES during charging and EWHpower. It can be achieved as follows
PTRPt ¼ Pn
t þ PES;ct þ PEWH
t : ð7Þ
Otherwise, TGP includes the produced power by WT, PV, MTand ES during discharging. It can be obtained by
PTGPt ¼ PWT
t þ PPVt þ PES;d
t þ PMTt : ð8Þ
The presented LEM ignores the demand side bidding, since onlySSA market is considered. SSA is a mechanism in which there areonly potential buyers or sellers, but not both at the same time. Inthis system, auction goes to the highest bidder. Energy offers aresorted in the form of increasing stepwise functions consisting ofup to four price (€/kW h–kW h)-quantity (kW h) pairs as shownin Fig. 1. In this study, two possibilities are considered for theMCP calculation. The first possibility is when QTRE
t 6 QTGEt . As a re-
sult MCP will be the intersection between quantity demand lineand the offer (Fig. 1a). The covered demand is shown within theshaded area in Fig. 1. The second possibility is QTRE
t P QTGEt
(Fig. 1b). In this case, some customer loads, equal to the unmetpower, have to be shed to cope with the current situation. Thus,MCP will be calculated as the maximum proposed offer by gener-ation units. MCP calculation is done by Algorithm 2.
Algorithm 2. LEM UNIT
Require: Wholesales energy prices, the number of generationunit (n) and total generation and consumers energy of theMG.
1: Stop 02: i 13: while Stop = 0 do
4: if QTREt 6
Pik¼1Qj;k
t then
kMCPt ¼ pj;k
t ; ð9ÞStop 1
5: else if i P n then
kMCPt ¼ pj;n
t ; ð10ÞStop 1
6: else7: i i + 18: end if9: end while10: return kMCP
t
3. RTO architecture
The RTO architecture proposed in this study is shown in Fig. 2.This architecture is composed of CCU and MG Testbed. Both partsare explained in following subsections.

SCADA
PVemulator
ESemulator
WECSemulator
Loademulator
EWHemulator
MTemulator
CCU
Fig. 4. System configuration of IREC’s MG.
M. Marzband et al. / Applied Energy 106 (2013) 365–376 369
3.1. CCU
CCU is composed of two sub-units, namely DAS and RTS. DAS iscarried out for arranging the short term generation schedule usingMCEMS�LEM algorithm. RTS sends calculated power by DAS.
3.1.1. DASMCEMS�LEM is proposed in DAS for generation scheduling and
local market management. MCEMS�LEM for low-voltage MG isshown in Fig. 3. The algorithm starts by setting of parametersincluding wholesales energy prices, PV, WT and load demand pro-files, the initial SOC of ES and system parameters listed in Table 1.Then, MCEMS unit estimates MT generated power, consumedpower by EWH, the SOC of ES and it’s power and finally PTRP
t . After-wards, the available generated energy of micro-sources is sorted
Microgridpower
analyzer
CCU
Three-phso
Fig. 5. Experime
with respect to their offers in ascending order. Eventually, theMCP will be determined in the SSA market using LEM unit. As a re-sult the share of each generation unit and storage device is fixed forload demand balancing. This loop runs only once a day to obtaingeneration and customer schedules for the following day. Thefunctions of MCEMS and LEM units are explained in the followingsubsections.
3.1.1.1. MCEMS unit. The main goal of MCEMS unit is to ensure thatthe customer demand is met at all times. Summarily, objectives ofMCEMS unit are identified as follows:
� To maximize utilization of the available renewable resources.� To maximize battery life by monitoring and controlling both
SOC and charge/discharge process.
Poweranalyzer
iSocket
ase voltage urces
ntal setup.

iSocket iSocket iSocket iSocket iSocket iSocket
Fig. 6. The schematic diagram of control system in IREC’s MG.
370 M. Marzband et al. / Applied Energy 106 (2013) 365–376
� To maximize the average of available stored energy in the bat-tery, improving system reliability.� To use the excess available WT and PV to supply a useful dump
load when the battery is fully charged in order to increase sys-tem efficiency.
3.1.1.2. LEM unit. As mentioned in Section 2.2, each generation unitnotifies the LEM unit about its available energy and its offer. Theseenergies are sorted with respect to their offers in ascending order.The next step is to send related information, PTRP
t , to customers.With the ordered list of producers, the crossing point with the ver-tical line indicates the required quantity that represents the MCP.Consequently, all offers located to the left of this point are selectedas MG’s power sources. The formulation of this unit is as presentedin Section 2.2.
3.1.2. RTSAll generation units and consumers are planned in order to re-
ceive power setpoints which already has been stored in the DASincluding PWT
t ; PPVt and Pn
t then sending out the calculated setpointsfrom the MCEMS�LEM including PEWH
t ; PMTt and PES
t to the RTS, asshown in Fig. 2. This procedure needs to be very fast to be consid-ered as real-time.
3.2. IREC’s MG
IREC has developed a utility-connected low voltage MG basedon peer-to-peer and plug-and-play concepts [28,29]. This MG in-cludes generation and consumption units. Some of these unitsare commercial equipments and some others are emulators whichcan be programmed to behave as power devices.
In this study, six emulators have been used to validate the algo-rithm presented in Section 3. An emulator is a power electronic de-vice that is capable to emulate the behavior of different powersystem elements (e.g. generators and loads) by injecting and
observing power. Emulators make possible to test different scenar-ios without having to wait for appropriate weather conditions.Figs. 4 and 5 show the experimental setup.
The experimental platform is composed of three main systems:
� Control system.� Power system.� Communication system.
3.2.1. Control systemSome operations of the MG control system are time-critical (e.g.
a unit emergency disconnection). For this reason, it is preferrableto split the control system in a layered architecture, and to decen-tralize and reorganize control tasks among these layers. This studyproposes a two interconnected layer architecture (Fig. 6):
� The CCU layer.� The iSocket layer.
Each emulator has a dedicated iSocket. iSockets are intelligentelectronic devices performing tasks that precise a very fast time re-sponse and that imply a high information exchange with powerequipment, such as:
� To command active power setpoints to emulators.� To deal with alarms and events in order to guarantee electrical
security.� To aggregate relevant information from the emulator and make
it visible to CCU.
On the other hand, the CCU layer is just responsible for loadflow. At this layer, one single computer executes the MCEMS�LEM
algorithm previously presented.Moreover, a commercial SCADA has been used to validate re-
sults from the CCU. This SCADA neither is part of the CCU nor

yyn5 kVA
DC
AC
AC
DC
Pout
Pin
(a) Generation emulators (b) Load emulators
Public grid400V // 50Hz
yyn5 kVA
DC
AC
AC
DC
Pin
Pout
Public grid400V // 50Hz
Fig. 7. Single line diagram of the MG’s testbed in IREC.
M. Marzband et al. / Applied Energy 106 (2013) 365–376 371
has any decision power. It just retrieves measurements from com-mercial meters installed in the emulators.
3.2.2. Power systemThe six emulators have been programmed to behave as:
� Generation unitsThe different types of generation including WT, PV, ES and MThave been emulated using the real experimental profile.� Consumption units
The real behavior of different types of consumption such ascontrollable (for instance EWH) and non-controllable loaddemand using the experimental profile measured in a realgrid.
PV
6 kW
WT
8 KW
ES
PES,c = 0.816 kW
PES,d = 3.84 kW
1
Fig. 8. Configuration of t
� Energy storage unitA storage system has been emulated which can be acted as abattery or other storage devices [26].
Each emulator is composed of two identical three-phase voltagesources in back-to-back configuration, allowing bidirectionalpower flow. When emulating a generation unit or a storage unitin Discharging Mode, power flows from the lower voltage sourceto the upper one (Fig. 7a). When emulating a consumption unitor a storage device in Charging Mode, power flows from the uppervoltage source to the lower one (Fig. 7b).
3.2.3. Communication systemCommunications among the CCU and iSockets are according to
IEC 61850 ([37]). iSockets communicate with emulators via CAN asshown in Fig. 6. The procedures to implement communication sys-tem has been explained in details in our previous study [28–32],hence, they are not repeated in the present work.
4. Application to test grid
The stand-alone MG system is shown in Fig. 8. The full detailsabout this system has been presented in previous paper [33]. IREC’sMG has been configured as PV, WT, MT, ES, EWH and load demandemulators. Emulators run for the system with real life data sum-marized in Table 1. Due to cabinet limited power (maximum5 kV A) firstly all of the calculated data in Section 3.1.2 usingMCEMS�LEM algorithm have been scaled down to the maximumpower then for more visibility, the real data have been extracted.
Lithium–ion batteries were emulated as energy storage in thisstudy [38]. The battery model emulated in this simulation is SYNE-RION 24 M, with the parameters presented in the Table 1. Winddata used was obtained from online records from the weather sta-tion at Museu de Badalona, Badalona (Spain); affiliated with theGeneralitat de Catalunya Weather Network. The hourly averagewind speed data recorded at a height of 6 m was chosen for the24-h simulation study [39]. The output power of the WT corre-sponding to the wind speed profile presented in ([40]) and also realdata of WT emulator are shown in Fig. 9a.
The solar data, such as the global and direct normal irradiancewere obtained from the online records of the Manresa, Barcelona(Spain), affiliated with IREC [41]. PV output and real data of the re-lated emulator are also shown in Fig. 9b.
Load demand profile was also obtained from [42]. The demandprofile and real data of the related emulator are shown in Fig. 10.
Simulation and experimental studies are carried out for a typi-cal day.
The supply bids by generation units are also shown in Table (2).
MT
2 KW
EWH
5 KW
Load
15.5 KW
he proposed system.

00:00 05:00 10:00 15:00 20:00
1
2
3
4
5
6
7
8
Time [h]
The
pro
duce
d po
wer
[kW
]
00:00 05:00 10:00 15:00 20:000
1
2
3
4
5
6
Time [h]
The
pro
duce
d po
wer
[kW
]
10:00 10:30 11:00 11:30 12:00 12:30 13:00 13:30 14:00 14:30 15:005.4
5.5
5.6
5.7
5.8
5.9
Time [h]
The
pro
duce
d po
wer
[kW
]
Fig. 9. Comparison of renewable resources set point profiles (solid curve) and measured value (dotted curve) during 24 h system work.
372 M. Marzband et al. / Applied Energy 106 (2013) 365–376
5. Simulation and experimental results and discussion
5.1. MCEMS unit outputs
Fig. 11 shows SOC of the battery for six operation mode includ-ing Charging Mode, Discharging Mode, Over Charging ProtectionMode, Over Discharging Protection Mode, Fully Charged Modeand Fully Discharged Mode. All these cases are explained in [33]in detail and therefore not treated in this paper. Meanwhile, the
initial SOC is assumed to be SOCI in order to show charge/dischargepattern clearly.
The battery power profile is shown in Fig. 12. This figure alsoshows the comparison of the calculated set points due in simula-tion and the real values obtained from emulators by CCU. The smalldifference between the two waveforms is due to the fact that theexperimental waveform is gotten directly from DSP. As seen in thisfigure, in the time intervals 01:30, 02:00, 04:00, 05:00 and 13:30–17:00, MG system can raise the battery charging.
00:00 05:00 10:00 15:00 20:000
5
10
15
Time [h]
The
con
sum
ed p
ower
[kW
]
10:00 10:30 11:00 11:30 12:00 12:30 13:00 13:30 14:00 14:30 15:00
8.4
8.6
8.8
9
9.2
9.4
9.6
9.8
10
Time [h]T
he c
onsu
med
pow
er [
kW]
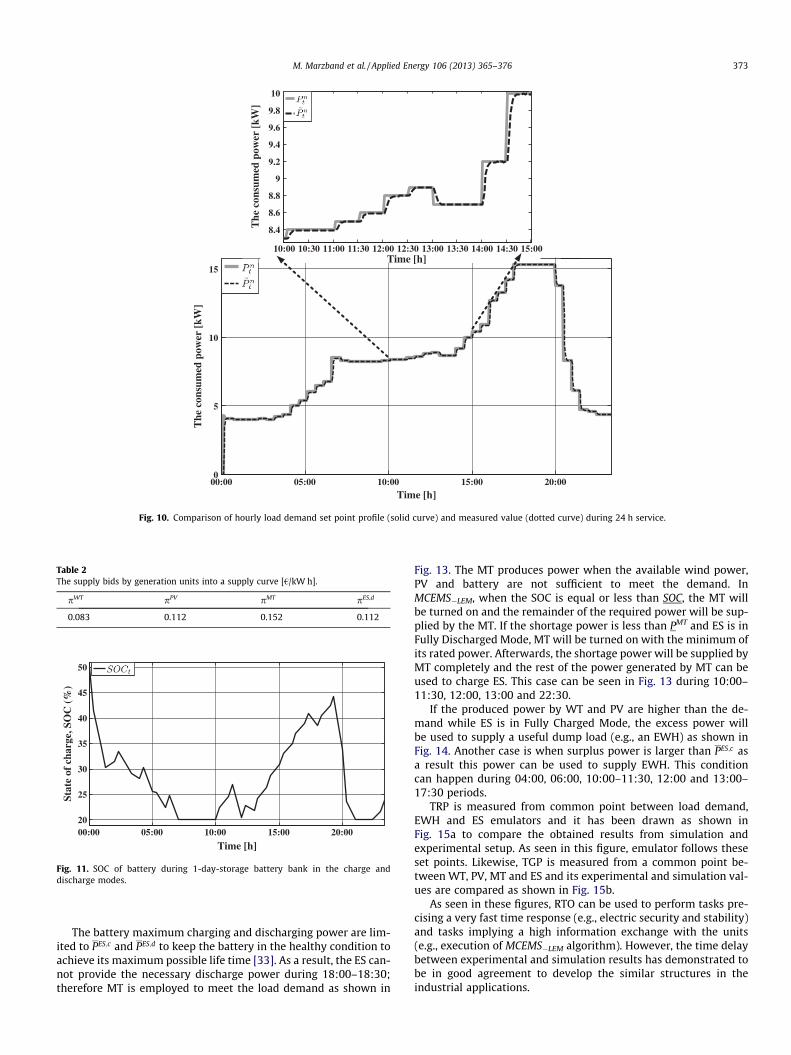
Fig. 10. Comparison of hourly load demand set point profile (solid curve) and measured value (dotted curve) during 24 h service.
Table 2The supply bids by generation units into a supply curve [€/kW h].
pWT pPV pMT pES,d
0.083 0.112 0.152 0.112
00:00 05:00 10:00 15:00 20:0020
25
30
35
40
45
50
Time [h]
Stat
e of
cha
rge,
SO
C (
%)
Fig. 11. SOC of battery during 1-day-storage battery bank in the charge anddischarge modes.
M. Marzband et al. / Applied Energy 106 (2013) 365–376 373
The battery maximum charging and discharging power are lim-ited to PES;c and PES;d to keep the battery in the healthy condition toachieve its maximum possible life time [33]. As a result, the ES can-not provide the necessary discharge power during 18:00–18:30;therefore MT is employed to meet the load demand as shown in
Fig. 13. The MT produces power when the available wind power,PV and battery are not sufficient to meet the demand. InMCEMS�LEM, when the SOC is equal or less than SOC, the MT willbe turned on and the remainder of the required power will be sup-plied by the MT. If the shortage power is less than PMT and ES is inFully Discharged Mode, MT will be turned on with the minimum ofits rated power. Afterwards, the shortage power will be supplied byMT completely and the rest of the power generated by MT can beused to charge ES. This case can be seen in Fig. 13 during 10:00–11:30, 12:00, 13:00 and 22:30.
If the produced power by WT and PV are higher than the de-mand while ES is in Fully Charged Mode, the excess power willbe used to supply a useful dump load (e.g., an EWH) as shown inFig. 14. Another case is when surplus power is larger than PES;c asa result this power can be used to supply EWH. This conditioncan happen during 04:00, 06:00, 10:00–11:30, 12:00 and 13:00–17:30 periods.
TRP is measured from common point between load demand,EWH and ES emulators and it has been drawn as shown inFig. 15a to compare the obtained results from simulation andexperimental setup. As seen in this figure, emulator follows theseset points. Likewise, TGP is measured from a common point be-tween WT, PV, MT and ES and its experimental and simulation val-ues are compared as shown in Fig. 15b.
As seen in these figures, RTO can be used to perform tasks pre-cising a very fast time response (e.g., electric security and stability)and tasks implying a high information exchange with the units(e.g., execution of MCEMS�LEM algorithm). However, the time delaybetween experimental and simulation results has demonstrated tobe in good agreement to develop the similar structures in theindustrial applications.

00:00 05:00 10:00 15:00 20:00-4
-3.5
-3
-2.5
-2
-1.5
-1
-0.5
0
0.5
1
1.5
Time [h]
The
pro
duce
d po
wer
[kW
]
10:00 10:30 11:00 11:30 12:00 12:30 13:00 13:30 14:00 14:30-2
-1.5
-1
-0.5
0
0.5
1
Time [h]15:00
The
pro
duce
d po
wer
[kW
]
Fig. 12. Case study battery power (simulation output (solid curve) and measured value (dotted curve)).
00:00 05:00 10:00 15:00 20:000
2
4
6
8
10
12
Time [h]
The
pro
duce
d po
wer
[kW
]
Fig. 13. Comparsion of hourly MT produced power set point profile (solid curve)and measured value (dotted curve) during 24 h service.
374 M. Marzband et al. / Applied Energy 106 (2013) 365–376
The total load and generation profile (simulation output) usedto validate the algorithm are shown in Fig. 16. All shown and usedpowers are active powers. As seen in this figure, the explainedstand-alone hybrid system can meet all the power demands bythe load during normal operation.
5.2. LEM unit output
The market price of WT is usually significantly lower thanthe market price of the other micro-sources; as a result theWT is the preferred dispatch power in this MG and the full
available power is assumed to be always generated. Fig. 17depicts the calculated results of the local market algorithmapplied to the MG using the proposed algorithm in Section 2.2.As seen in the figure, MCP can be obtained at eachiteration.
The amount of participation of micro-sources changes duringthe day. The participation of the proposed prices by WT and ESin the market is equal to 50% from midnight to the morning.However, from morning to noon, when PV starts to generatepower, its offer can be accepted during 10:00–11:30 and its par-ticipation in the LEM is around 34%. The proposed price by MTwill be accepted during 06:00–10:00 and its offer will be ac-cepted around 67% during this period. From noon until evening,the offer of WT and PV will be accepted and their participationsin the market are 42% and 58%, respectively. The proposed offerby these devices plays no significant role in the market clearingduring 18:00–23:30 periods but the offers of ES and MT havebeen accepted during this period. The offers of the MT unit showthe biggest role in the LEM around evening. The offered prices ofMT unit have been accepted around 92% in the evening whilethe offers of ES have just been accepted around 8% during thisperiod.
In order to show the capability of the proposed approach,simulation has been repeated for the same system when MTalways on and generates at least the minimum of its ratedpower. As seen in the Fig. 17, although kMCP
t sometimes is big-ger than k0MCP
t (i.e. during 00:00–01:30, 02:30, 04:30, 05:30,11:30 and 19:30–20:30), the total cost of generationunits has been significantly reduced (around 8.5%) during aday.

00:00 05:00 10:00 15:00 20:000
0.5
1
1.5
2
2.5
3
3.5
Time [h]
The
con
sum
ed p
ower
[kW
]
10:00 10:30 11:00 11:30 12:00 12:30 13:00 13:30 14:00 14:30 15:000
0.5
1
1.5
2
2.5
3
3.5
Time [h]
The
con
sum
ed p
ower
[kW
]
Fig. 14. The hourly EWH consumed power during 24 h service (measured value (dotted curve) and simulation output (solid curve) calculated by the EMS.
00:00 05:00 10:00 15:00 20:001
1.5
2
2.5
3
3.5
4
Time [h]
The
con
sum
ed p
ower
[kW
]
05:00 10:00 15:00 20:000.5
1
1.5
2
2.5
3
3.5
4
4.5
Time [h]
The
pro
duce
d po
wer
[kW
]
Fig. 15. Hourly total load consumption and power production during the day (setpoint values (solid curve) and experimental measurement (dotted curve)).
00:00 05:00 10:00 15:00 20:004
6
8
10
12
14
Time [h]
The
pro
duce
d &
con
sum
ed p
ower
[kW
]
Fig. 16. Hourly total load consumption and power production during the day.
00:00 05:00 10:00 15:00 20:000
0.5
1
1.5
2
2.5
3
3.5
4
Time [h]
Mar
ket
clea
ring
pri
ce [
/kW
h]
Fig. 17. MCP during 24 service of system.
M. Marzband et al. / Applied Energy 106 (2013) 365–376 375

376 M. Marzband et al. / Applied Energy 106 (2013) 365–376
6. Conclusions
This paper has presented a MCEMS�LEM for stand-alone MGsincorporating different renewable energy resources and storageunits based on two market indicators: single ownership and LEM.The LEM proposed has been designed to obtain the best purchasingprice in a DAM, as well as to increase the utilization of the existingDER. Simulation results on a four generation unit test system forpresented MCEMS�LEM has demonstrated that it is capable tolocate a global solution of the related MCP problem.MCEMS�LEM
has been developed and verified by experimental setup. Real lifeexperimental data obtained from IREC has been used to test theperformance and accuracy of MCEMS�LEM. It is applied to IREC’sMG to demonstrate a real time MCEMS�LEM into a MG. The studiesscenarios have demonstrated fast response of emulators in sendingset-points through CCU, flexibility of control modes and the abilityof island operation in an autonomous manner. The results obtainedin laboratory have demonstrated to be in good agreement withsimulation results. Moreover, the use of the proposed LEM haveled to a reduction of the total cost of power generation (8.5%approximately).
Acknowledgments
This research was supported by EIT and KIC-InnoEnergy underthe projects KIC-ASS (30-2011-IP26-KIC ASS) and EVCITY (28-2011-IP24-EVCity) and by the European Regional DevelopmentFunds (ERDF, ‘‘FEDER Programa Competitivitat de Catalunya2007–2013’’).
For the last author, this work was supported by the project‘‘Development and support of multidisciplinary postdoctoral pro-grammes in major technical areas of national strategy of Re-search-Development-Innovation’’ 4D-POSTDOC, Contract No.POSDRU/89/1.5/S/52603, project co-funded by the European SocialFund through Sectoral Operational Programme Human ResourcesDevelopment 2007–2013.
References
[1] Obara S, Kawai M, Kawae O, Morizane Y. Operational planning of anindependent microgrid containing tidal power generators, SOFCs, andphotovoltaics. Appl Energy 2012(0):1–15.
[2] Ren H, Gao W. A MILP model for integrated plan and evaluation of distributedenergy systems. Appl Energy 2010;87(3):1001–14.
[3] Miranda V, Hang PS. Economic dispatch model with fuzzy wind constraintsand attitudes of dispatchers. IEEE Trans Power Syst 2005;20(4):2143–5.
[4] Hetzer J, Yu D, Bhattarai K. An economic dispatch model incorporating windpower. IEEE Trans Energy Convers 2008;23(2):603–11.
[5] Pourmousavi SA, Nehrir MH, Colson CM, Wang C. Real-time energymanagement of a stand-alone hybrid wind-microturbine energy systemusing particle swarm optimization. IEEE Trans Sustainable Energy2010;1(3):193–201.
[6] Hernandez-Aramburo C, Green T, Mugniot N. Fuel consumption minimizationof a microgrid. IEEE Trans Ind Appl 2005;41(3):673–81.
[7] Caisheng W, Colson C, Nehrir M, Jian L. Power management of a stand-alonehybrid wind-microturbine distributed generation system. In: Powerelectronics and machines in wind applications (PEMWAs); 2009. p. 1–7.
[8] Logenthiran T, Srinivasan D, Khambadkone A, Aung H. Multiagent system forreal-time operation of a microgrid in real-time digital simulator. IEEE TransSmart Grid 2012;3(2):925–33.
[9] Lidula N, Rajapakse A. Microgrids research: a review of experimentalmicrogrids and test systems. Renew Sustainable Energy Rev2011;15(1):186–202.
[10] Hatziargyriou N, Asano H, Iravani R, Marnay C. Microgrids. IEEE Power EnergyMag 2007;5(4):78–94.
[11] Kariniotakis G. Field tests on actual microgrids overview. Paris(France): Microgrids, Novel Architectures for Future Power Systems; 2010.
[12] Kroposki B, Lasseter R, Ise T, Morozumi S, Papatlianassiou S, Hatziargyriou N.Making microgrids work. IEEE Power Energy Mag 2008;6(3):40–53.
[13] Lasseter RH, Eto JH, Schenkman B, Stevens J, Vollkommer H, Klapp D, et al.CERTS microgrid laboratory test bed. IEEE Trans Power Delivery2011;26(1):325–32.
[14] Ackermann T, Andersson G, Soder L. Distributed generation: a definition. ElectrPower Syst Res 2001;57(3):195–204.
[15] Pepermans G, Driesen J, Haeseldonckx D, Belmans R, Dhaeseleer W.Distributed generation: definition, benefits and issues. Energy Policy2005;33(6):787–98.
[16] Lasseter R, Akhil A, Marnay C. The CERTS microgrid concept, white paper onintegration of distributed energy resources. Tech. rep., CERTS, Canada; October2003.
[17] Braun M, Degner T, Vandenbergh M. Laboratory DG grid. Tech. rep.; March2006. <http://www.iset.uni-kassel.de/dispower_static/documents/del63.pdf>.
[18] Hossain M, Saha T, Mithulananthan N, Pota H. Robust control strategy for PVsystem integration in distribution systems. Appl Energy 2012;99(0):355–62.
[19] Logenthiran T, Srinivasan D, Khambadkone A, Aung HN. Multiagent system forreal-time operation of a microgrid in real-time digital simulator. IEEE TransSmart Grid 2012;3(2):925–33.
[20] Vachirasricirikul S, Ngamroo I. Robust controller design of heat pump andplug-in hybrid electric vehicle for frequency control in a smart microgridbased on specified-structure mixed h2/h1 control technique. Appl Energy2011;88(11):3860–8.
[21] Dimeas A, Hatziargyriou N. Operation of a multiagent system for microgridcontrol. IEEE Trans Power Syst 2005;20(3):1447–55.
[22] Katiraei F, Iravani R, Hatziargyriou N, Dimeas A. Microgrids management. IEEEPower Energy Mag 2008;6(3):54–65.
[23] Eto J, Lasseter R, Schenkman B, Stevens J. CERTS microgrid laboratory test bed.Tech. rep.; July 2009.
[24] Tsikalakis A, Hatziargyriou N. Centralized control for optimizing microgridsoperation. IEEE Trans Energy Convers 2008;23(1):241–8.
[25] Schwaegerl C, Schwan M. Action plan towards standardised communicationinterfaces. Tech. rep.; October 2003.
[26] Díaz-González F, Sumper A, Gomis-Bellmunt O, Robles R. A review of energystorage technologies for wind power applications. Renew Sustainable EnergyRev 2012;16(4):2154–71.
[27] Kroposki B, Pink C, Basso T, Deblasio R. Microgrid standards and technologydevelopment. In: IEEE power engineering society general meeting; 2007. p. 1–4.
[28] Ruiz-Álvarez A, Colet-Subirachs A, Álvarez-Cuevas Figuerola F, Gomis-Bellmunt O, Sudriá-Andreu A. Operation of a utility connected microgridusing an IEC 61850-based multi-level management system. IEEE Trans SmartGrid 2012;3(2):858–65.
[29] Colet-Subirachs A, Ruiz-Álvarez A, Gomis-Bellmunt O, Álvarez-Cuevas-Figuerola F, Sudriá-Andreu A. Centralized and distributed active and reactivepower control of a utility connected microgrid using IEC 61850. IEEE Syst J2012;6(1):58–67.
[30] Ruiz-Álvarez A, Colet-Subirachs A, Gomis-Bellmunt O, Sudriá-Andreu A.Design, management and comissioning of a utility connected microgridbased on IEC 61850. In: Innovative smart grid technologies conferenceEurope (ISGT Europe), Gothenburg, Sweden; 2010. p. 1–7.
[31] Colet-Subirachs A, Ruiz-Álvarez A, Gomis-Bellmunt O, Álvarez-Cuevas-Figuerola F, Sudriá-Andreu A. Control of a utility connected microgrid. In:Innovative smart grid technologies conference Europe (ISGT Europe),Gothenburg, Sweden; 2010. p. 1–7.
[32] Roman-Barri M, Cairo-Molins I, Sumper A, Sudriá-Andreu A. Experience on theimplementation of a microgrid project in barcelona. In: Innovative smart gridtechnologies conference Europe (ISGT Europe), Gothenburg, Sweden; 2010. p.1–7.
[33] Marzband M, Sumper A, Chindris� M, Tomoiaga B. Energy management systemof hybrid microgrid with energy storage. In: The international word energysystem conference (WESC), Suceava, Romania; 2012.
[34] Bakirtzis A, Ziogos N, Tellidou A, Bakirtzis G. Electricity producer offeringstrategies in day-ahead energy market with step-wise offers. IEEE Trans PowerSyst 2007;22(4):1804–18.
[35] Hogan W. Multiple market-clearing prices, electricity market design and pricemanipulation. Electr J 2012;25:18–32.
[36] Nogueira T, Vale A, Vale Z. An electricity day-ahead market simulation model.In: International conference on renewable energy and power quality (ICREPQ),Bilbao, Spain; 2003.
[37] IEC 61850 communication networks and systems for power utility automationpart 7-420: Basic communication structure–distributed energy resourceslogical nodes (2009-03).
[38] Lithium–ion (li–ion) battery system. <http://www.saftbatteries.com/Technologies/Lithium/Liion/>.
[39] Renewable energy concepts. <http://www.renewable-energy-concepts.com/wind-energy/wind-basics/wind-power.html>.
[40] Estacions automátiques (XEMA). <http://www.meteo.cat/xema/AppJava/SeleccioPerComarca.do>.
[41] European photovoltaic solar energy conference and exhibition. <http://www.eupvsec-proceedings.com/>.
[42] Day-ahead energy market. <http://www.pjm.com/markets-and-operations/energy/day-ahead.aspx>.


