Explaining the Diffusion of Web-Based CommunicationTechnology among Congressional Officeslowast
Kevin M Esterling(Corresponding Author)
Associate ProfessorDepartment of Political Science
UCndashRiversidekevinesterlingucredu
David MJ LazerAssociate Professor of Political Science
and Computer ScienceNortheastern University
davelazergmailcom
Michael A NebloAssistant Professor
Department of Political ScienceOhio State University
neblo1osuedu
August 2 2010
lowastPrepared for presentation at the Annual Meetings of the American Political Science Associa-tion Washington DC September 2-5 2010 We presented earlier versions of this paper at theMidwest Political Science Association Annual Meeting Chicago Ill April 22 2010 at the AnnualMeetings of the American Political Science Association Toronto Canada September 2-5 2009and at the Conference on Empirical Legal Studies University of Southern California July 2010This project is funded by a grant from the Digital Government Program of the NSF (award num-ber IIS-0429452) We gratefully acknowledge the intellectual contributions from our colleagues atthe Congressional Management Foundation (CMF) especially Collin Burden Nicole Folk-CooperKathy Goldschmidt and Tim Hysom We thank Caroline Tolbert Barbara Trish and Paul Zak for
Abstract
Legislative websites are increasingly important in the practice of representation Do legisla-tive offices learn website design practices from each other Using data from the 2006 and2007 official homepages of members of the US House of Representatives we test whetherweb design features diffuse among offices through congressional state delegations Usingnonlinear conditional autoregressive models and a new method for identifying causal spatialnetwork diffusion we find that web design practices are driven in part by communicationwithin state delegations Website features do not appear to diffuse through institutionalchannels such as cosponsorship networks or networks defined by ideological proximity Theresults suggest that congressional offices are purposeful in designing the content of legislativewebsites but not in the underlying technology and that this facet of institutional designappears to be driven by the electoral connection rather than substantive policy motivations
very helpful comments Any opinions findings and conclusions or recommendations expressed inthis material are those of the authors and do not necessarily reflect the views of the NSF or CMF
1 Introduction
The practice of representation is central to any legislatorrsquos responsibilities both normatively
(Pitkin 1967) and empirically (Fenno 1978) The relatively recent development of Internet-
based communication technologies has the potential to transform the way legislators engage
in the practice of representation (Druckman Hennessy Kifer and Parkin 2009 Druckman
Kifer and Parkin 2007) As with technological innovation in any occupational field legis-
lators must learn how to adopt and implement these new communication technologies In
this paper we examine whether this learning occurs among members of the US House of
Representatives focusing on the extent of diffusion of website design features among repre-
sentativesrsquo official homepages
A vast array of studies in other organizational settings highlights the critical role that
informal networks play in the adoption of innovations (Rogers 1976) Further there is a
substantial literature on the important role networks play within the Washington system
(Carpenter Esterling and Lazer 1998 2003 2004 Heinz Laumann Nelson and Salisbury
1993 Laumann and Knoke 1984) as well as some research on interconnections among state
legislators (Arnold Dean and Al 2000 Caldeira and Patterson 1987) There has been
little research on the informal mechanisms of the diffusion of technical innovations in the
congressional system however ndash a system that includes not just 440 members and delegates
in the House of Representatives and 100 Senators but many thousands of staff members as
well More generally there is very little research on the informal networks among members of
the congressional system and the impact of those networks on the decisions of Congressional
offices (for exceptions see Baughman 2006 Fowler 2006)
It is well known within the literature on Congress that members often discuss legislative
issues and procedures with other members from their state delegation (eg Padgett 1990
Truman 1956) We therefore expect that a member will be more (less) likely to adopt new
website design features if other members of her state delegation have (have not) adopted the
practices We investiage whether technology diffusion occurs through informal communica-
Esterling Lazer amp Neblo Website Diffusion in State Delegations 2
tion networks defined by membership in state delegations
A major inferential issue in testing the effects of spatial diffusion or diffusion among
physically proximate units is to distinguish a causal diffusion process from a process driven
simply by unmeasured confounding variables that are spatially correlated with the commu-
nication network (see Lazer 2001) As we describe below we are able to identify the causal
effect of state delegation networks on technology diffusion by exploiting the ignorable1 state
boundaries that define the state delegation communication network Using data on the web-
site designs of neighboring congressional districts some of which are across state lines we
are able to control for unobserved confounding variables and so we can identify the causal
effect of membership in a state delegation on website design
Our results suggest that the state delegation informal networks play a perceptible role
in the diffusion of website design among congressional offices The dependence we observe
however involves content rather than the underlying technology of the websites Website
design features do not appear to diffuse through institutional channels such as cosponsor-
ship networks or networks defined by ideological proximity To the extent it exists then
the diffusion of legislative website design appears to be driven by electoral connections to
geographic constituencies rather than by substantive policy motivations
2 State Delegations and the Diffusion of Website Com-
munication Technology
The role of social networks is probably the single most studied driver of the diffusion of
innovations (Coleman Katz and et al 1957 Hagerstrand 1967 Ryan and Gross 1943)
Learning through observing othersrsquo experiences lowers the ambiguity and perceived risk as-
sociated with an innovation (Galaskiewicz and Burt 1991 Haunschild and Milner 1997
Valente 1995) Further the behaviors of others creates a normative environment A be-
havior is legitimate because others who are similarly situated are doing it inducing mimetic
1Ignorability in this context requires that the conditional distributions of unobserved variables are notaffected by where the state boundary line is drawn We test for this ignorability below
Esterling Lazer amp Neblo Website Diffusion in State Delegations 3
isomorphism (DiMaggio and Powell 1983)
Social network research has found that strong or ldquohigh bandwidthrdquo relationships ndash those
based on personal familiarity trust and high frequency ndash are especially important for the
exchange of complex tacit or confidential knowledge (Hansen 1999) A number of stud-
ies in the social networks literature show for example that physical co-location increases
job related communication in work groups because proximity tends to drive and facilitate
regularized communication (den Bulte and Moenaert 1998) Co-location or spatial prox-
imity itself will not lead to an increased communication they are just prerequisites for
higher exposure more frequent informal occasions where people meet in the hallways or
other social areas within office buildings These meetings in turn increase the probability
of informal communication regarding successful technology practices (Allen 1978 Festinger
1950 Kraut Egido and et al 1990 Monge Rothman and et al 1985 Rice and Aydin
1991 Zahn 1991) Walkerrsquos (1969) classic study of the diffusion of innovations among the
American states shows that diffusion tends to occur more regularly among adjacent states
which he took to proxy for more regular communication among state-level policy activists
(see also Mintrom 1997)
In the present case the adoption of website design is largely public all Member web sites
are public The logic and experience underlying particular decisions is private however and
this private information is unevenly distributed The role of informal advice networks (who
asks whom for advice regarding their web sites) and attention networks (who pays attention
to whom) are likely fairly powerful with respect to Members of Congress Thus for example
it might require repeated interactions and high levels of familiarity between two chiefs of staff
from Membersrsquo offices to effectively transfer the knowledge about implementation challenges
with respect to particular web-based practices
In this paper we test whether diffusion of website design occurs through state delegations
Scholars have long recognized (Deckard 1972 Kessel 1964 Padgett 1990 Truman 1956) the
tendency of members from the same state to meet and discuss policy and process legislative
Esterling Lazer amp Neblo Website Diffusion in State Delegations 4
issues At the state level Caldeira and Patterson (1987) find similar patterns of friendship
among Iowa state legislators with districts closer together Arnold et al (2000) purport2 to
demonstrate that friendship ties among Ohio state legislators causes members to more often
vote on the same side of issues holding other causes of membersrsquo vote similarity constant
As we mention above there has been very little research on the potential influence of
social networks within the US Congress3 To motivate our causal analysis and to justify our
focus on state delegation networks we make use of a small survey we conducted in winter
2007 of the Congressional staff in charge of the membersrsquo official websites Out of 440 offices
surveyed we received 100 responses (23 percent)4
In the survey we asked respondents ldquoAmong other Members of Congressrsquo websites
are there ones that stand out to you as especially good If yes which do you think are
particularly goodrdquo Fifty two websites were named some multiple times Of those 52 86
percent were within the same party and (when combined with 11 responses indicating the
state delegation) 60 percent were within the same state delegation5
We used these data and random effect logit regression to estimate the change in the
probability that one membersrsquo staff would mention another memberrsquos website For covari-
ates we use Same party indicating both the ldquomentionerrdquo and ldquomentioneerdquo are in the same
party Same state indicating both are in the same state delegation the difference in first
dimension DW-Nominate scores (httpwwwvoteviewcom) and the number of cosponsor-
ships common between both members We grouped the random effect on the mentionee
to control for any additional unobserved (confounding) variables that tend to increase the
2Unfortunately their results are questionable because their OLS analysis is vulnerable to the criticismsof spuriousness that we describe below In short the non-random assignment of nodes to network locationsraises inferential problems that are very common in studies of social network analysis
3Notable exceptions include Baughman (2006) who shows how informal staff communication amongmembers who have overlapping committee assignments reduces the transaction costs for writing and ne-gotiating legislation and Fowler and Cho (2010) who examine the effects of co-sponsorship networks onlegislative productivity see also Fowler (2006)
4We use these analyses not as inferential findings but instead as a summary of but what a large numberof staff reported to us regarding their own interpersonal attention networks We offer a formal inferentialtest in the next section
5We also asked about who the Member was friends with with similar results of 90 ldquofriendsrdquo named 87percent were same party and 44 percent were same state
Esterling Lazer amp Neblo Website Diffusion in State Delegations 5
overall probability a mentionee website is mentioned
The logistic regression confirms that state delegation was a powerful predictor that one
office would name another (p = 0045) The difference in DW-Nominate scores capturing
ideological distance has a negative point estimate as one would expect but the estimate
is not significant (p = 0711) The effect of sharing cosponsorships which may indicate
an institutional collegiality between two offices also has no discernable effect (p = 0830)
Taken together these findings indicate that staffers themselves at least in the aggregate
believe they learn from the practices of others in their own state delegation but perhaps
not through other institutional channels such as cosponsor networks or networks defined by
ideological proximity We next describe a formal test for identifying a causal effect of state
delegation social networks on technology diffusion
Also important were whether both offices were from the same party (p = 0030) However
in the network analysis that we present below we cannot distinguish party as a social network
from party as an institution since parties are both formal and informal organizations6 To
capture any change in probability of website design practices due to the legislative parties
we simply include a dummy party variable in the statistical model Including this dummy
variable is equivalent (in the limit as sample size within both parties increase) to modeling
the social network dependence within partiesNote that the presence or absence of a party
effect does not imply the presence or absence of party effects of within-party diffusion For
example if some website feature diffuses within both parties equally the effect of party
would appear to be zero
6One could imagine creating an adjacency matrix where the off diagonal cells equal one if the row andcolumn member are in the same party and a zero if not and substituting this matrix for say the stateadjacency matrix Since networks partition the chamber into two distinct sets of members the random effectvariable si at the limit (as the number of members increases in size) will only take on two values equal to thepropensity of all party members to have the item or feature This random effect then is perfectly collinearwith the party variable Modeling the party using an indicator variable as we do or as a social networkyield identical results (although on a different scale)
Esterling Lazer amp Neblo Website Diffusion in State Delegations 6
3 Identifying the Causal Effect of Spatially-Defined Net-
works
The major inferential issue in testing hypotheses about diffusion among geographically-
proximate units involves distinguishing a diffusion process from mere spatial heterogeneity
where omitted confounding variables exist that are correlated with spatial network patterns
(Congdon 2003 274 Lazer 2001) If the websites of the members of a state delegation are
all likely to have a given characteristic and websites in another state are unlikely to we
wish to be able to test whether this correlation is due to a causal diffusion process or due
to a spurious dependence where many members of a state delegation may happen to share
an unobserved causal variable
Using conditional autoregressive (CAR) models (Congdon 2003 278-282) we are able to
control for spatial heterogeneity by exploiting data from several members whose congressional
districts are adjacent to each other If spatially confounding variables exist they would most
likely be evident in these localized networks since adjacent congressional districts share
more similarities than districts in opposite ends of a state For example the California
45th district (including the desert cities of Palm Springs and Indio) shares more similarities
with the Arizona 7th district (parts of Yuma Maricopa and Pima desert counties) than with
the California 6th district (wine country Marin and Sonoma counties) Evidence is lent in
support of the causal effect of state delegation networks on diffusion if membersrsquo web design
practices are observed to be dependent within networks defined by state delegation after
having controlled for district-level spatial heterogeneity
One can see the logic of this approach to controlling for unobserved local level confounding
variables in figure 1 This figure takes congressional district D = 6 as the ldquosubjectrdquo district
(the estimator of course repeats the analysis for all 438 districts in the dataset) D is in
state X and is directly adjacent to seven other districts O = 3 4 5 7 also in state X
and C = 11 13 14 that are in states Y and Z A = O cup C is the full set of adjacent
districts The state delegation for state X is composed of districts S = 1 2 9 and
Esterling Lazer amp Neblo Website Diffusion in State Delegations 7
1
2
3
4
5
6
7
8 9
10 11 12
13
14
15
The Logic of the Natural Experiment
District to be analyzed 6Treatment districts 1289Control districts 111314Treatment and Control Overlap 3457Not Used
State X
State Y
Sta
te Z
Figure 1 How the Model Conditions on District-Level Confounding Variables
in this delegation only T = 1 2 8 9 are not adjacent to D Assume that the adjacent
districts A have the most similar values on unobserved variables to D7
The statistical estimator uses the outcome data from the districts in A to hold constant
unobserved district-level variables and at the same time estimates the effect of being in set
S So for example consider the effect of being in delegation S on whether or not a member
7An analogy to an imaginary experimental design may help The set C sub A serves as a true controlgroup analogous to a ldquopretreatmentrdquo condition since these districts are not in S The set T = SO is theexposure to the treatment analogous to a ldquopost treatmentrdquo condition The set O = A cap S are only partialcontrols since in this region the treatment condition (being in the set S) and the control condition (being inset A) overlap
Esterling Lazer amp Neblo Website Diffusion in State Delegations 8
chooses to have a blog on her official webpage The model dynamically estimates 1) p(A)
equal to the average propensity of the districts in A to have a blog on their web pages 2)
p(S) equal to the average propensity of the districts in S to have a blog on their web pages
and 3) holding p(A) constant the model estimates the effect of p(S) on the propensity for
D to have a blog on her website8 One can think of this approach as similar to a random
effect model where the adjacent districts in A serve as ldquorepeated observationsrdquo for district
D and the districts in S represent exposure to a causal variable of interest The districts in
S and in A necessarily have some overlap (their intersection is only null if there is only one
congressional district in a state since T = O = empty) the greater the overlap the fewer districts
in T and hence the more conservative is the random effect estimate for the causal effect of
interest Thus the model gets the most purchase from districts that lie on a state border
(294 out of 438 districts lie on a border or about 67 percent of districts)
The persuasiveness of this quasi-experimental approach depends on the ignorability of
state boundaries for unobserved spatially distributed confounding variables Ignorability
requires that the conditional distributions of any unobserved causal variables across districts
that are geographically proximate but on either side of the state line are similar For
example this assumption holds that residents in Calumet City Illinois (IL-2 in southeast
Chicago) are similar to those who live in nearby Gary Indiana (IN-1) and members that
serve in each each of these districts share similar qualities One would also expect that each
of these will differ demographically and politically from those in New Albany Indiana (IN-9
near Louisville)
We can test for the ignorability of state boundaries using aggregate district level census
data If state borders are ignorable then variables constructed from aggregate census data
should be balanced between districts that are on either side of the state border among
those that are adjacent to a district that lies on a border That is census data should be
balanced between the districts in O and C across all border congressional districts At the
8As we describe below p(A) and p(S) are the posterior distribution of these propensities and so themodel accounts for the full distributions of each not simply their point estimates
Esterling Lazer amp Neblo Website Diffusion in State Delegations 9
same time one would not expect census data to be balanced between districts in C and
those in T We test balance only among the 242 districts that lie adjacent to a border and
that are in a state large enough to have districts that are within the state but not adjacent
(55 percent of districts in the sample meet these conditions) For covariates we use current
census data on district median income the percent of the district residents that are college
educated in the service employment sector the blue collar sector the white collar sector
under 18 over 64 Black and the percent voting for Kerry in the 2004 general election
In addition the attributes of the members from these districts also should be ignorable
For the member attribute variables we use the number of terms each has served and the
first and second dimension DW-Nominate score (see wwwvoteviewcom) Using the omnibus
balance test statistic of Hansen and Bowers 2008 we cannot reject the hypothesis of balance
between O and C (p = 0307) but we can reject the hypothesis of balance between C and
T (p lt 00001) That the districts are balanced at the local level justifies using adjacent
districts as ldquorepeated observationsrdquo in a random effect model as a method to hold constant
district-level unobservable variables and so to identify the causal effect of the networks
themselves
4 Data
Within the US House of Representatives congressional offices are 440 (including nonvot-
ing delegates) small functionally identical public organizations with a set of policy and
procedural outputs (Hedlund 1984 Salisbury and Shepsle 1981) This enables a large N
statistical study of innovation adoption Web technology was changing rapidly in this time
period and so we do not offer this analysis as a journalistic account of contemporary web
practices Instead we argue that examining the dynamics of web practices is useful as a case
study of how legislators adapt to technology at a time when the objective technology itself
is in flux (Bimber 2003 8)
Esterling Lazer amp Neblo Website Diffusion in State Delegations 10
In this section we describe our measures of website design features how we created the
district adjacency and state delegation matrices and control variables (Druckman et al
2007 Esterling Lazer and Neblo 2005) that may be important drivers of website quality
41 Outcome variables
The dependent variables we use for this analysis are drawn from the 2006 and 2007 Congres-
sional Management Foundation (CMF) coding of the official web site for each member of
Congress In the summers of 2006 and 2007 CMF coded each official website based on nearly
100 operational criteria CMF trained teams of coders who accessed and coded each official
website based on nearly 100 operational criteria (see Druckman et al 2007 Johnson 2004
Owen Davis and Strickler 1999 Stromer-Galley 2000) CMF identified and defined the
criteria using a number of sources regarding best practice standards for legislative websites
specifically by asking focus groups of citizens to spend time on a sample of sites interviews
and surveys with office staff and citizens and by conducting web industry research (Burden
and Hysom 2007 Owen et al 1999)
The descriptive statistics for the coded variables are listed in table 1 separately for
the 2006 and 2007 panels The coding for the 21 variables we use for this study and the
instructions given to the coders are listed in appendix table 4 The appendix also reports
on our analysis of intercoder reliability and the validity of the coding rules
The dataset includes four items that measure the quality of issue information on each
site These are coder ratings of the quality of information regarding national issues state and
local issues and issues of special importance to the member and the presence of rationales
that help explain the memberrsquos voting decisions
We use seven items to measure the overall quality of constituency services on the web-
site These include codersrsquo rating of the quality of casework FAQ answers the presence
of information on how to initiate casework with the memberrsquos office whether the website
includes an online casework initiation form and the presence of links to federal agencies
Esterling Lazer amp Neblo Website Diffusion in State Delegations 11
Table 1 Descriptive Statistics
2006 2007Mean SD Mean SD
National Issues 046 050 044 050Memberrsquos Issues 053 050 052 050StateLocal Issues 037 048 040 049Vote Rationales 059 049 076 043Casework FAQs 049 050 059 049Casework Initiation 048 050 061 049Casework Form 068 047 074 044Agency Links 051 050 065 048Link to FirstGov 045 050 053 050Grant Info 079 040 085 036Info about District Resources 033 047 025 043Video 036 048 054 050Audio 016 037 020 040Text Only 007 026 005 021Blog 005 022 011 031RSS Feed 010 029 024 043Podcast 004 020 007 026Navigationdagger 350 088 337 092Readabilitydagger 320 083 335 088Timelinessdagger 314 091 281 101daggerThese items are subjective coder ratings on a 0 to 5 scaleSee table 4 (appendix) for specifics on each itemNumber of incumbents in 2006 = 439 Number of returning in-cumbents in 2007 = 385
and to FirstGovgov (now wwwusagov) and information about local district resources and
services
For items measuring the technical quality of each website we include measures of whether
or not the site contains video audio has a text only option a blog an RSS feed and podcast
capabilities The final three items measure general technical properties of the website design
its navigability its readability its organization and its timeliness each measured on a five
point scale
Esterling Lazer amp Neblo Website Diffusion in State Delegations 12
42 Network Adjacency Data
We expect that the diffusion of the quality of membersrsquo websites will depend to some extent
on informal social communication within the Congress Following the discussion above in
this paper we measure informal networks by memberships in state delegations To construct
this network variable we constructed a matrix with rows representing members columns
with labels identical to the rows cells [i j] equal to one if members in row i and column j
are in the same state and cells equal to zero if members i and j are in different states9 The
diagonal of this matrix is a zero vector Our random effect model also requires a matrix of
district adjacencies This matrix is similar to the state delegation matrix with the exception
that the cells are equal to one if two membersrsquo districts are adjacent and zero otherwise10
For the spatial statistical models we describe below it is possible for the precision of
estimated correlation parameters to be a function of the average density of the adjacency
matrix where the average density is the total number of ones divided by the number of
matrix cells The average density of the state delegation adjacency matrix is 0042 while
the average density of the district adjacency matrix is 0023 To test the robustness of
our results below to variation in network density we constructed a supplemented district
adjacency matrix that equals one if two districts are either adjacent to each other or are
within one district of each other (ie on a two step path) The average density of this
supplemented district adjacency matrix is 0064 Thus the two district adjacency matrices
create density bounds below and above the state delegation density In the models below we
9The model requires each member to be connected to at least one other member to avoid dividing byzero To accommodate this we assign the few members from states with a single congressional districtto an adjacent state that is most similar It is worth noting that the USGS data from which the districtadjacencies are constructed include non-voting delegates from DC Puerto Rico and the Virgin Islandsbut for some reason not the ones from Guam and American Samoa Thus our effective sample is 438 (435regular members plus three non-voting delegates)
10Generating the matrix of district adjacencies takes some doing We downloaded the GIS shapefileof congressional districts for the 109th Congress from the USGS National Atlas website Unfortunatelythis shape file does not represent districts but instead represents smaller polygons that when aggregatedreconstruct a congressional district and obviously adjacencies among these polygons are not of any use forthis analysis Aggregating the data up to the district level turned out to be a very complex task requiringover a hundred lines of R code The R script to do this is available from the authors on request
Esterling Lazer amp Neblo Website Diffusion in State Delegations 13
find little difference in the estimates (or their precision) for district adjacency across these
two distance measures so below to simplify the discussion we only present the results on the
former single-step adjacency matrix
For comparison we also estimate the model below substituting an adjacency matrix
constructed from cosponsorship data (Fowler 2006) The labels of the cosponsorship matrix
are identical to those of the district and state delegation matrices with zero on the diagonal
and off diagonal elements of the ith row equal to one if member i and member j were frequent
cosponsors where ldquofrequentrdquo is more than one standard deviation above the mean number of
irsquos cosponsorships with all members We also estimate the model substituting an adjacency
matrix where the off diagonal elements are one if member i and member j are close to
each other in DW-Nominate space (httpwwwvoteviewcom) We define two members as
ldquocloserdquo in DW-Nominate space by first squaring the deviation between member i and all other
members and then selecting the subset members that are in the lowest 125 percentile in
distance from member i11
43 Control variables
We hold constant two variables that previous work (eg Esterling et al 2005) found to have
an effect on the quality of legislative websites Members who have longer terms in office tend
to make less effective use of website technology12 To control for this we include a measure
that equals one if the member is a Freshmen in 2006 and zero otherwise (mean 0096
standard deviation 0295) In addition the institutional context within Congress also can
create advantages and disadvantages for members to undertake new initiatives We control
for the memberrsquos political party by including a variable that equals one if the member is a
11We chose the 125 percentile as this kept the density of this adjacency matrix similar to that of the otheradjacency matrices
12Members gain greater electoral security with longer tenure in office due to the well-known incumbentadvantages (Jacobson 1987 26) Members with longer tenures in office have fewer incentives to seek out in-novative ways to interact with constituents through their websites than those with shorter tenures Memberswith longer tenures also are more likely to have well-established ways of communicating with constituents(Arnold 2004) and thus are unlikely to place much effort in this new form of legislative communication
Esterling Lazer amp Neblo Website Diffusion in State Delegations 14
Republican (the majority party in 2006) and zero otherwise (mean 0533 standard deviation
0499)
5 Estimation
We hypothesize that a memberrsquos use of website design features depends on the propensity of
other members in her state delegation to also adopt those features and these other members
themselves are in the same estimation sample Because of this stochastic dependence among
membersrsquo websites using ordinary probit to examine the relationship between a memberrsquos
adoption practices and the average of the outcomes of the individuals that person interacts
with would result in an estimate of social influence that would be biased upwards The
statistical literature on geographically connected processes has devised techniques to study
spatial inter-dependencies in a way that appropriately accounts for these reciprocal effects
(Anselin 1988 Cliff and Ord 1981 Doreian 1980) For this paper we estimate network
dependence with a conditionally autoregressive (CAR) model (Congdon 2003 chapter 7)
using Bayesian MCMC sampling to simulate a posterior distribution of all model parameters
The basic model is
Esterling Lazer amp Neblo Website Diffusion in State Delegations 15
Oi sim Categorical(pi15)pi1 = 1minus qi1pi2 = qi1 minus qi2pi3 = qi2 minus qi3pi4 = qi3 minus qi4pi5 = qi4
logit(qi1) = b1 middot Freshman1i + b2 middotRepublican2i + ai + si minus κ1logit(qi2) = b1 middot Freshman1i + b2 middotRepublican2i + ai + si minus κ2logit(qi3) = b1 middot Freshman1i + b2 middotRepublican2i + ai + si minus κ3logit(qi4) = b1 middot Freshman1i + b2 middotRepublican2i + ai + si minus κ4
ai sim φ(ai 1)
ai = ρa middotsumNai
k=1(Waik)(Nai)Waik isin aj j is adjacent to iNai = aj j has an adjacent district to isi sim φ(si 1)
si = ρs middotsumNsi
k=1(Wsik)(Nsi)Wsik isin
Oprimej j is in the same state delegation as i
Nsi = sj j is in the same state delegation as i
1 le i le N
ρa sim Uniform(0 1)ρs sim Uniform(minus100 100)b1 sim φ(00 10E-5)b2 sim φ(00 10E-5)κ1 sim φ(minus1 01)C(minus5 k2)κ2 sim φ(-05 01)C(k1 k3)κ3 sim φ(05 01)C(k2 k4)κ4 sim φ(1 01)C(k3 5)
We estimate the model separately for each dependent variable Oi listed in table 1 The
set of equations contained within the outermost bracket give the model likelihood for a five
category ordered dependent variable the dichotomous outcome variables are also ordered so
for these items we use the same equation but estimate only one threshold The conditional
probability of each outcome is taken to be a function of the two fixed effect control variables
Term and Republican their estimated coefficients b a category-specific threshold κj and
the two random intercepts ai and si
In the model ai is a random effect that captures local-level unobservables and si is
a random effect that captures dependence in each outcome variable among members of a
state delegation holding ai constant Inference for the social network effects are based on the
Esterling Lazer amp Neblo Website Diffusion in State Delegations 16
parameter ρs which is given a diffuse prior13 ρs is the effect of a change in the propensity of a
memberrsquos website to have a design feature (Oi) associated with the propensity of the websites
of those that are in the memberrsquos state delegation to have the feature or characteristic
Because we control for district level heterogeneity via ai ρs captures the causal dependence
among the websites of members within a state delegation The random intercept ai is
assumed to have a normal prior with mean a function of the random intercepts of the
memberrsquos district adjacency set (this is known as a CAR prior Congdon (see 2003 chapter
7)) The random intercept si is assumed to have a normal prior with mean a function of
the outcomes (Oprimei) of the memberrsquos state delegation
We estimate this model in four ways
1 Assuming the relevant state delegation network for member i contains all other mem-
bers in her state
2 Assuming that the relevant state delegation network for member i contains only other
members in her state that are of the same party or same state copartisans For the
few members with no copartisans in the state we assume that the full state delegation
is the relevant network
3 Substituting the adjacency matrix constructed from cosponsorship data (described
above) for the state adjacnecy matrix For this model we omit ai from the outcome
equation If ρs in this model is positive we cannot distinguish between a causal
diffusion within the cosponsorships network and latent dependence due to omitted
local level variables If ρs is not positive then we can conclude there is no evidence of
dependence causal or otherwise within cosponsorship networks14
4 Using the same models as in 3 but this time substituting the DW-Nominate adjacency
13We use a uniform on [-100100] distribution for the prior We constrain the prior for ρa to be positiveand informative uniform on [01] to ensure it captures local level dependence
14To improve convergence we use an informative uniform on [-11] prior This should have no effect onthe results since we only care about the existence of dependence in these models not the magnitude
Esterling Lazer amp Neblo Website Diffusion in State Delegations 17
matrix The same caveats regarding causality apply to this model that apply to model
3 above
We estimate all four of these models first assuming cross sectional dependence modeling
member irsquos propensity to have the website feature in the 2006 data as a function of other
membersrsquo propensity to have the same feature in 2006 Oi = O2006i and Oprimej = O2006
j We
then consider over time dependence modeling member irsquos propensity to have the feature in
2007 as a function of other membersrsquo propensity to have the feature in 2006 Oi = O2007i
and Oprimej = O2006j An election intervened between the 2006 and 2007 panels We set the
2007 outcomes of 2006 incumbents who did not return in 2007 to missing and impute their
2007 outcomes under missing at random conditional on the fixed and random effect variables
using the method of Tanner and Wong (1987)
For estimation we use the MCMC Gibbs sampler in WinBUGS (Spiegelhalter Thomas
Best and Gilks 1996) We assume diffuse priors for b to minimize the influence of the
prior parameter distributions on the posteriors We sample three chains and initialize each
chain with overdispersed starting values The chains show extremely good mixing using the
Brooks-Gelman-Rubin diagnostic (Gelman and Rubin 1992) Below we present summaries
of the marginal posterior distributions of the model parameters
6 Findings
One advantage of Bayesian estimation is that the results are reported in full marginal dis-
tributions rather than as summaries of distributions in the form of point estimates and
standard errors Thus one can evaluate the significance of parameter estimates by com-
paring their posterior distributions without relying on strict (frequentist) hypothesis tests
The results for models for the cross sectional (2006) analysis are in table 2 The cell entries
indicate the probability of dependence for each outcome variable among members of a state
delegation holding constant local level unobserved variables That is each cell gives the
Esterling Lazer amp Neblo Website Diffusion in State Delegations 18
density of the posterior probability distribution of the ρ parameter that lies above zero
The bottom row of table 2 indicates the number of items that have at least a 90 percent
probability of dependence within each network Notice that by this criteria dependence is
most likely within the same state network (dependence for nine items) and this dependence
is not amplified when the state delegation is restricted only to co-partisans (dependence for
only five items) There appears to be dependence within state delegations among a wide
range of items including those measuring issue representation (material on iational issues
The memberrsquos priority issues and her vote rationales) constituent needs (help with casework
initiation) and the technical qualities of the websites themselves (audio a text only feature)
and the general technical qualities of websites (navigability readability and timeliness)
Figure 2 depicts the magnitude of the diffusion effects for six of the items for which
diffusion was present in 2006 The dark line in each graph shows how the estimated change
in probability that member i adopts a design element changes as the proportion of her
state delegation who also adopt that element increases (the light lines are random draws of
parameter sets from the full posterior distribution and hence depict the uncertainty for each
conditional probability similar to a confidence interval) The ldquorugrdquo in each figure shows the
actual range of the proportion across state delegations so estimates beyond the rug are out
of sample
The top four graphs in figure 2 indicate diffusion effects for quality of website content such
as issue positions vote rationales and casework FAQs For these measures a one indicates
the website was judged by the coder as having good quality and specific content on each of
the dimensions The probability of a member has high quality content when everyone else in
the state had low quality content ranges from about 02 to about 04 For the national issues
memberrsquos issues and casework FAQs items the actual proportion of the state delegations
with high quality content varies from zero to one (or close to one) Varying this proportion
increases the propensity to have good quality national issue content by about 60 percent
memberrsquos issues by about 20 percent and casework FAQs by about 40 percent where each
Esterling Lazer amp Neblo Website Diffusion in State Delegations 19
Table 2 Probability of Diffusion in State Delegations 2006 Cross Sectional Analysis
Same State Same State Cosponsorship IdeologicalCopartisan Network Proximity
National Issues 0999lowast 100lowast 0655 0138Memberrsquos Issues 0943lowast 0925lowast 0394 0396StateLocal Issues 0003 0009 0391 0406Vote Rationale 0981lowast 0581 0557 0435Constituent FAQs 0058 0870 0387 0376Casework Initiation 0991lowast 0549 0366 0165Casework Form 0013 0305 0532 0682Agency Links 0002 0011 0298 0543Link to FirstGov 0113 0048 0196 0330Grant Info 0811 0715 0466 0843Info on District Resources 0081 0863 0287 0397Video 0010 0543 0645 0838Audio 0915lowast 0959lowast 0754 0627Text Only 0933lowast 0519 0492 0471Blog 0740 0142 0517 0503RSS Feed 0065 0288 0518 0717Podcast 0531 0350 0508 0573Navigation 0986lowast 0902lowast 0561 0135Readability 0930lowast 0826 0372 0375Timeliness 0953lowast 0904lowast 0544 0277Number of items p gt 075 10 8 1 2Number of items p gt 090 9 5 0 0
N = 438 lowastp(ρs gt 0) gt 090
of these differences is statistically significant In the sample only about half of the state
delegations had vote rationale content on their websites but extrapolating outside of the
sample indicates the diffusion effect is about the same magnitude as for the other content
items
The bottom two graphs depict two elements of website technology that show positive
diffusion In contrast to the four content items the probability that a member has audio or
text only technology on their websites if no one else in their delegation has the technology
is essentially zero The range of the actual proportion of state delegation who also adopt
these technologies varies only from zero to about half Within this range the propensity for
Esterling Lazer amp Neblo Website Diffusion in State Delegations 20
a member to adopt one of these communication technologies increases but only impercep-
tibly15 In comparing these to the first four graphs it is apparent that most of the diffusion
within state delegations centers on content rather than on the underlying communication
technology of the website
Returning to table 2 the entries in the second column indicate that dependence within the
state delegation does not seem to be heavily conditioned on partisanship The probability of
diffusion is constant whether or not one takes into account partisanship within the delegation
This finding is consistent with Truman (1956 1034) who notes that partisan divides are
relatively absent in discussions among members of a state delegation In addition it is likely
staff rather than a member who actually develop and support the website and it may be
that staff are less partisan-driven than members at least when interacting with staff from
the same state
No dependence is evident within the cosponsorship network or within the network defined
by ideological proximity The second to last row indicates this pattern does not change when
one relaxes the criteria to only a 75 percent probability These findings suggest that most
of the social influence within the institution is within state delegations as a whole perhaps
as true today as it was in the time of (Truman 1956) That geographic state delegation
networks appear to matter more than DC-based legislative networks such as copsonsorship
or ideological distance is perhaps to be expected The main purpose of the website is for the
member to represent herself to her constituents and representation in the US Congress is
geographic based rather than issue or ideologically based
Table 3 gives the results for the over time (2006 to 2007) analysis Notice that the results
change very little from table 2 This indicates that diffusion within state delegations does
not have a strong lag Indeed much of the dependence in the over time analysis is likely due
to the path dependence within individual sites Once a website adopts a given feature it is
unlikely to remove that feature
15The ρs parameter in each case is statistically signficant but only because the impact of state delegationis only to move a member from a zero probability to something slightly larger than zero
Esterling Lazer amp Neblo Website Diffusion in State Delegations 21
00 02 04 06 08 10
00
04
08
National Issues (Content)
Proportion of State Delegation
Pro
babi
lity
00 02 04 06 08 10
00
04
08
Members Issues (Content)
Proportion of State Delegation
Pro
babi
lity
00 02 04 06 08 10
00
04
08
Vote Rationales (Content)
Proportion of State Delegation
Pro
babi
lity
00 02 04 06 08 10
00
04
08
Casework FAQs (Content)
Proportion of State Delegation
Pro
babi
lity
00 02 04 06 08 10
00
04
08
Audio (Technology)
Proportion of State Delegation
Pro
babi
lity
00 02 04 06 08 10
00
04
08
Text Only (Technology)
Proportion of State Delegation
Pro
babi
lity
Figure 2 Diffusion Effects
The dark line shows the expected probability that a given memberrsquos website will have thedesign feature conditional on the proportion of her state delegation that also has the featureThe light lines give the range of uncertainty for these estimates The rug on the domain axisindicates in-sample variation for each item
Esterling Lazer amp Neblo Website Diffusion in State Delegations 22
Table 3 Probability of Diffusion in State Delegations 2006 to 2007 Over Time Analysis
Same State Same State Cosponsorship IdeologicalCopartisan Network Proximity
National Issues 0997lowast 100lowast 0570 0267Memberrsquos Issues 0975lowast 0980lowast 0498 0502StateLocal Issues 0435 0189 0357 0330Vote Rationale 0800 0762 0378 0623Constituent FAQs 0764 0994lowast 0383 0391Casework Initiation 0774 0724 0496 0385Casework Form 0282 0556 0480 0769Agency Links 0961lowast 0890 0451 0362Link to FirstGov 0851 0165 0486 0609Grant Info 0832 0468 0455 0679Info on District Resources 0917lowast 0835 0516 0451Video 0100 0749 0696 0665Audio 0637 0939lowast 0553 0676Text Only 0987lowast 0715 0491 0458Blog 0986lowast 0825 0573 0556RSS Feed 0073 0459 0557 0531Podcast 0752 0771 0424 0540Navigation 0960lowast 0821 0359 0374Readability 0531 0813 0426 0215Timeliness 0693 0666 0739 0741Number of items p gt 075 12 12 0 2Number of items p gt 090 7 4 0 0
N = 438 lowastp(ρs gt 0) gt 090
Recall that ρa captures any dependence that may occur among adjacent congressional
districts If we observe dependence at this level the model cannot distinguish dependence
that might come from causal diffusion processes among the offices in adjacent districts and
a spurious dependence that might come from unobserved confounding variables that vary
geographically The absence of dependence at this level however indicated by a ρa with
probability mass near zero can rule out diffusion as well as the presence of any district level
variables that determine the content or quality of websites We find little to no evidence
of dependence at the district level For example in the 2006 cross section out of the 21
regressions of the first column of table 2 none of the ρa parameters have a greater than 90
Esterling Lazer amp Neblo Website Diffusion in State Delegations 23
percent chance of exceeding the mean of the prior distribution (05) and only three have
greater than a 75 percent greater than the prior mean (only the items casework form link to
FirstGov and Video) or what one would expect to observe simply from random variation
These findings regarding local-level dependence reinforce those from other studies that
find relatively few district-level observed variables that are predictive of website quality
(Adler Gent and Overmeyer 1998 591 Cooper 2004 352 Druckman et al 2007 Druckman
et al 2009 17 Ferber Foltz and Pugliese 2005 147) The lack of all dependence at this level
demonstrates the absence of unobserved causal variables This independence is not especially
surprising Citizens in all districts whether agricultural or industrial rich or poor liberal or
conservative care about maintaining accountability and make demands for member services
The results show that all members face uniform incentives driving the quality of websites
and any variation in website quality (as well as responsiveness to social network diffusion)
is likely idiosyncratic in the memberrsquos own interest in web technology along with exposure
to such idiosyncrasies in her state delegation
Finally the model also includes a fixed effect dummy variable equal to one if the mem-
ber is a Republican and zero otherwise Descriptively we find that Republicans are more
likely to have a number of the items on their website including a rationale for their votes
constituent FAQs a casework form audio and a text only feature Democrats did not have
a statistically higher propensity on any of the items There are any of a number of reasons
for this difference between the parties One set of explanations focus on parties as formal
organizations including a stronger interest among the party leaders in the quality of rank
and file websites (Adler et al 1998 586) or a difference in the propensity of Republicans
and Democrats to take an interest in electronic representation or the effect of minority party
status Alternatively one could consider parties to be themselves informal social networks
networks in which web design practices may diffuse And indeed as we show in section 2
the offices themselves are most likely to name same-party websites as ldquoespecially goodrdquo
The model cannot distinguish explanations based on parties as organizations from parties
Esterling Lazer amp Neblo Website Diffusion in State Delegations 24
as social networks however for reasons we discuss in footnote 6 We are able to test whether
the extent of diffusion within state delegations differs between the two parties To test this
we re-estimate the model of column one of table 2 changing the likelihood function slightly
so that ρs is estimated separately for each party16 We find only only one (out of 21) of
the difference in the ρ parameters for each party were significantly different or about what
one would expect by chance In addition the point estimates for the ρ parameter for each
party show no consistent pattern sometimes ρ is higher for Democrats and sometimes for
Republicans
Overall we find little support for differential party effects either parties as organizations
or parties that organize informal communication among members Such a finding does not
rule out the presence of within-party diffusion and indeed as we note in our descriptive
analyses in section 2 the offices themselves suggest otherwise Instead we suspect that
website design diffuses equally well within each political party
The outcome equation also includes a fixed effect variable indicating whether the member
was a freshman in 2006 This variable also shows little explanatory power and inconsistent
results among the point estimates with one set of exceptions Freshmen websites were
significantly more likely to be rated highly for navigability readability and timeliness These
three variables capture the codersrsquo qualitative sense of the technical merits of a website That
freshmen are rated higher on these dimensions suggests that websites have a bit of a slicker
design when they are recently created from scratch
7 Discussion
The above analyses provide insight into the pathways of innovation within Congress We find
a significant possibility of diffusion within state delegations across a variety of measures of
legislative website quality At the same time we find little evidence of diffusion in networks
16We modify the right hand side of the equation for si as ρsrepub middotsumNsi
k=1(Wsik)(Nsi) times Republican +
ρsdem middotsumNsi
k=1(Wsik)(Nsi)times (1minusRepublican)
Esterling Lazer amp Neblo Website Diffusion in State Delegations 25
defined by substantive policy concerns cosponsorship networks and networks defined by
ideological proximity In addition we find that much of the diffusion is centered on website
content such as issue content and content focused on constituent casework rather than
the communication technology itself That state delegation drives website content suggests
that much of the motivation to develop and improve these legislative websites is driven by
accountability in the electoral connection to local interests At the same time however we do
not detect any geographically distributed district-level variables that drive website content
Instead the quality of a legislative website appears to be idiosyncratic across members
Taken together this suggests that the need for high quality content relevant to legislative
accountability appears to be mostly a normative understanding among members in a state
delegation rather than a reflection of any variation among localities in demand for good
quality websites This cohesion in a ldquosmall grouprdquo is consistent with previous research on
social network effects within state delegations (Deckard 1972 Kessel 1964 Padgett 1990
Truman 1956)
We find that the underlying communication technology for these websites such as the
presence of blogs podcasts RSS feeds video and the like is neither driven by district
level variables nor by diffusion we also observe low marginal levels of adoption of various
technologies That offices are not self-reflective regarding this technology suggests that
website technology is a mere afterthought at best That communication technology exists
does not necessarily imply that legislators have the capacity or incentives to adopt them for
democratic governance (as in Bimber 2003 Druckman et al 2007 Fountain 2001)
8 Conclusion
These results that much of the communication regarding representation occur within state
delegations and this gives some insight into how Congress practices democratic representa-
tion In addition the results suggest the presence to some degree of deliberation among
Esterling Lazer amp Neblo Website Diffusion in State Delegations 26
members on the design of the institution itself To some extent offices appear to be pur-
posefully learning best practices regarding website content from each other
Finally we note that the methods used in this paper to net out the effects of local level
unobservables are general and could be applied to net out a wide range of confounding
variables in any test of behavioral hypotheses in any district-based legislature We show
how to leverage spatial representation in a random effect framework for estimating causal
effects whenever adjacent districts can serve as repeated observations to control for local-
level unobservables
References
Adler E S C E Gent and C B Overmeyer (1998) The home style homepage Leg-islator use of the world wide web for constituency contact Legislative Studies Quar-terly XXIII (Nov) 585ndash595
Allen T J (1978) Managing the Flow of Technology Technology Transfer and the Dissem-ination of Technological Information within the RampD Organization Cambridge MassMIT Press
Anselin L (1988) Spatial Econometrics Methods and Models Boston Mass KluwerAcademic
Arnold L W R Dean and E Al (2000) Friendship and votes The impact of interpersonalties on legislative decision making State and Local Government Review 32 142ndash147
Arnold R D (2004) Congress the Press and Political Accountability Princeton NJPrinceton University Press
Baughman J (2006) Common Ground Committee Politics in the US House of Repre-sentatives Palo Alto Calif Stanford University Press
Bimber B (2003) Information and American Democracy Technology in the Evolution ofPolitical Power New York NY Cambridge University Press
Burden C and T Hysom (2007) 2007 Gold Mouse Report Lessons from the Best WebSites on Capitol Hill Washington DC Congressional Management Foundation
Caldeira G A and S C Patterson (1987) Political friendships in the legislature Journalof Politics 49 953ndash975
Carpenter D P K M Esterling and D M Lazer (1998) The strength of weak ties inlobbying networks Evidence from health care politics in the united state Journal ofTheoretical Politics 10 (Oct) 417ndash444
Esterling Lazer amp Neblo Website Diffusion in State Delegations 27
Carpenter D P K M Esterling and D M Lazer (2003) Information and contact makingin policy networks A model with evidence from the us health policy domain Rationalityand Society 15 (Nov) 411ndash440
Carpenter D P K M Esterling and D M Lazer (2004) Friends brokers and transitivityWho informs whom in washington politics Journal of Politics 66 (Feb) 224ndash246
Cliff A and J Ord (1981) Spatial Processes Models and Applications London Pion
Coleman J S E Katz and et al (1957) The diffusion of an innovation among physiciansSociometry 20 (4) 253ndash270
Congdon P (2003) Applied Bayesian Modelling Hoboken NJ John Wiley amp Sons Ltd
Cooper C A (2004) Internet use in the state legislature A research note Social ScienceComputer Review 22 (Fall) 347ndash354
Deckard B (1972) State party delegations in the us house of representatives ndash a compar-ative study of group cohesion Journal of Politics 34 (Feb) 199ndash222
den Bulte C V and R Moenaert (1998) The effects of rampd team co-location on communi-cation patterns among rampd marketing and manufacturing Management Science 44 (11)S1ndashS18
DiMaggio P J and W W Powell (1983) The iron cage revisited ndash institutional isomorphismand collective rationality in organizational fields American Sociological Review 48 (2)147ndash160
Doreian P (1980) Linear models with spatially distributed data Spatial disturbances orspatial effects Sociological Methods and Research 9 29ndash60
Druckman J N C L Hennessy M J Kifer and M Parkin (2009) Issue engagement oncongressional web sites 2002-2006 Social Science Computer Review 27 (June) 1ndash21
Druckman J N M K Kifer and M Parkin (2007) The technological development ofcongressional candidate websites How and why candidates use web innovations SocialScience Computer Review 25 425ndash442
Esterling K M D M Lazer and M A Neblo (2005) Home (page) style Determinants ofthe quality of house membersrsquo websites International Journal of Electronic GovernmentReserach 1 (2) 50ndash63
Fenno R F (1978) Homestyle House Members in Their Districts Boston Mass LittleBrown and Co
Ferber P F Foltz and R Pugliese (2005) Computer-mediated communication in thearizona legislature Applying media richness theory to member and staff communicationState and Local Government Review 37 (2) 142ndash150
Festinger L (1950) Informal social communication Psychological Review 57 (5) 271ndash282
Esterling Lazer amp Neblo Website Diffusion in State Delegations 28
Fountain J E (2001) Building the Virtual State Information Technology and InstitutionalChange Washington DC Brookings Institution Press
Fowler J H (2006) Legislative cosponsorship networks in the us house and senate SocialNetworks 28 (Oct) 454ndash465
Fowler J H and W K T Cho (2010) Legislative success in a small world Social networkanalysis and the dynamics of congressional legislation Journal of Politics 2 (Jan) 124ndash135
Galaskiewicz J and R S Burt (1991) Interorganizational contagion in corporate philan-thropy Administrative Science Quarterly 36 (1) 88ndash105
Gelman A and D B Rubin (1992) Inference from iterative simulation using multiplesequences Statistical Science 7 (Nov) 434ndash455
Hagerstrand T (1967) Innovation Diffusion as a Spatial Process Chicago Ill Universityof Chicago Press
Hansen B B and J Bowers (2008) Covariate balance in simple stratified and clusteredcomparative studies Statistical Science 23 (2) 219ndash236
Hansen M T (1999) The search-transfer problem The role of weak ties in sharing knowl-edge across organizational units Administrative Science Quarterly 44 (1) 82ndash111
Haunschild P and A Milner (1997) Modes of interorganizational imitation The effects ofoutcome salience and uncertainty Administrative Science Quarterly 42 (3) 472ndash500
Hedlund R D (1984) Organizational attributes of legislatures Structure rules normsresources Legislative Studies Quarterly IX (Feb) 51ndash121
Heinz J P E O Laumann R L Nelson and R H Salisbury (1993) The Hollow CorePrivate Interests in National Policymaking Cambridge Mass Harvard University Press
Jacobson G C (1987) The Politics of Congressional Elections Boston Mass LittleBrown and Co
Johnson D W (2004) Congress Online Bridging the Gap Between Citizens and TheirRepresentatives New York NY Routledge
Kessel J H (1964) The washington congressional delegation Midwest Journal of PoliticalScience 8 (Feb) 1ndash21
Kraut R E C Egido and et al (1990) Intellectual Teamwork Social and TechnologicalFoundations of Cooperative Work (Jolene Galegher Robert E Kraut Carmen Egido ed)Chapter Patterns of Contact and Communication in Scientific Research CollaborationLawrence Erlbaum
Laumann E O and D Knoke (1984) The Organizational State Social Choice in NationalPolicy Domains Madison Wisc University of Wisconsin Press
Esterling Lazer amp Neblo Website Diffusion in State Delegations 29
Lazer D M (2001) Coevolution of network and individual Journal of MathematicalSociology 25 (Jan) 69ndash108
Mintrom M (1997) Policy entrepreneurs and the diffusion of innovation American Journalof Political Science 41 (3) 738ndash770
Monge P L Rothman and et al (1985) The dynamics of organizational proximity Man-agement Science 31 (9) 1129ndash1141
Owen D R Davis and V J Strickler (1999) Congress and the internet The HarvardInternational Journal of PressPolitics 4 (2) 10ndash29
Padgett J F (1990) Social Mobility and Social Structure (Ronald L Breiger ed) ChapterMobility as Control Congressmen through Committees pp 27ndash58 New York NYCambridge University Press
Pitkin H F (1967) The Concept of Representation Berkeley Calif University of CaliforniaPress
Rice R and C Aydin (1991) Attitudes toward new organizational technology Networkproximity as a mechanism for social information processing Administrative Science Quar-terly 36 (2) 219ndash244
Rogers E M (1976) New product adoption and diffusion The Journal of ConsumerResearch 2 (4) 290ndash301
Ryan B and N Gross (1943) The diffusion of hybrid seed corn in two iowa communitiesRural Sociology 8 15ndash24
Salisbury R H and K Shepsle (1981) Us congressman as enterprise Legislative StudiesQuarterly VI (Nov) 559ndash576
Spiegelhalter D A Thomas N Best and W Gilks (1996) Bugs 05 Bayesian inferenceusing gibbs sampling manual (version ii) Technical report MRC Biostatistics Unit
Stromer-Galley J (2000) On-line interaction and why candidates avoid it Journal ofCommunication 50 (Autumn) 111ndash132
Tanner M A and W H Wong (1987) The calculation of posterior distributions by dataaugmentation Journal of the American Statistical Association 82 (398) 528ndash540
Truman D B (1956) State delegations and the structure of party voting in the unitedstate house of representatives American Political Science Review 50 (Dec) 1023ndash1045
Valente T W (1995) Network Models of the Diffusion of Innovations Cresskill NJHampton Press
Walker J L (1969) The diffusion of innovations among the american states AmericanPolitical Science Review 63 (Sept) 880ndash899
Zahn G (1991) Face-to-face communication in an office setting The effects of positionproximity and exposure Communication Research 18 737ndash754
30
Appendices
A Reliability
Because the data come from two different years we must assess intercoder reliability bothwithin each year as well as across the two years There were a total of 8 coders involvedin each year Each CMF coder evaluated ten common web sites in each of the two yearsCoders received extensive training and then evaluated all web sites in a randomized ordernot knowing which ten web sites were the common web sites The error rates within eachyear were very low across the items ranging from as low as 82 percent to as high as 150percent when one would expect about a 50 percent error rate by chance To assess overtime reliability two of the coders happened to participate in each yearrsquos coding effort Inthe 2007 coding we asked these two coders to code an additional ten websites that werearchived from 2006 The error rates never exceeded 20 percent across the items On onlyone item (out of over 100 items) did there appear to be a drift in the standard for evaluationbetween the two years where both coders rated one item (vote rationales) slightly higher in2006 than in 2007 Overall the within year and over time reliability of these data appear tobe good reflecting the extensive training each coder received
B Validity
The analysis of dependence within state delegations helps to net out any spurious dependenceamong geographically-proximate units by holding constant local level variables (via a randomeffect) This method however cannot account for spurious dependence that arises from thecoding process itself In the data collection coders were randomly assigned to evaluatewebsites Because of this idiosyncratic biases of the coders could not drive the state-leveldependence we observe in tables 2 and 3 But it is possible that all coders share some biasor biases in response to observable traits or characteristics of the websites For example itmight not be hard to imagine a group of coders who have say (conscious or subconscious)predispositions that assume northeastern or west coast websites are more sophisticated thansouthern or midwestern websites While these predisopositions should not affect the objectivecodes such as the presence of certain types of links or audio they could affect the subjectiveratings of the quality of the issue content the navigability readability and so on
To address this we developed a test for the presence of these biases We first createdthree factors using objective codes for constituent interest content (constituent FAQs helpwith casework initiation a casework form links to federal agencies link to FirstGovgovgrant information on district resources) to create one quality factor and the objective codesfor the technical features of the website (video audio text only blog rss feed and podcast)to create another factor We regressed these two factors along with indicators for thememberrsquos gender and political party and Census region (NE MW S W) on the moresubjective measures Navigation Timeliness and Readability None out of 18 (6times 3) testswere significant for region gender and political party were not significant at in any equation(although both came close to significance for timeliness)
31
We also regressed these factors and fixed variables on a factor constructed from the issueratings (national issues memberrsquos issues statelocal issues and vote rationales) In thislatter test there were slight differences by region in the rated quality of the websitersquos issuecontent (the midwestern sites were rated as slightly lower than those in the northeast andthe west) but this test is less indicative of bias in the codings since there may indeed bedifferences in issue content among the regions even after netting out the constituent andtechnology factors If biases were to appear in the issue content it would most likely be dueto the coderrsquos own subjective disagreement with the content itself Neither party nor genderwere significant in the issue ratings equation however
32
Tab
le4
Item
Codin
gR
ule
s
Item
Sca
leC
odin
gR
ule
Issu
eFact
or
Item
s
Nat
ional
Issu
es1-
5T
ow
hat
exte
nt
does
the
site
pro
vid
ein
form
atio
nab
out
ma
jor
nat
ional
issu
es(e
g
educa
tion
budge
tta
xes
def
ense
for
eign
affai
rs
hea
lthca
re
wor
kfo
rce
econ
omy
ener
gy
agri
cult
ure
tr
ansp
orta
tion
tr
ade
soci
alse
curi
ty
med
icar
eet
c)
1=N
atio
nal
issu
esar
eon
lyad
dre
ssed
thro
ugh
pre
ssre
leas
esin
the
pre
ssre
leas
ese
ctio
n(i
fa
site
has
apre
ssre
leas
ese
ctio
n
itw
ill
scor
eat
leas
ta
1)
2=N
atio
nal
issu
esar
ead
dre
ssed
thro
ugh
asp
arse
issu
esse
ctio
n(l
ess
than
5nat
ional
(ver
sus
Mem
ber
ordis
tric
tst
ate)
issu
es)
3=T
he
issu
ese
ctio
nco
nta
ins
atle
ast
5nat
ional
issu
esth
atar
ead
dre
ssed
thro
ugh
apar
agra
ph
ortw
oof
nar
rati
veO
Rth
rough
links
tofu
rther
info
rmat
ion
(ie
pre
ssre
leas
es)
4=T
he
issu
ese
ctio
nco
nta
ins
mor
eth
an5
nat
ional
issu
esth
atar
ead
dre
ssed
thro
ugh
apar
agra
ph
ortw
oof
nar
rati
veor
links
tofu
rther
info
rmat
ion
wit
hin
the
site
(ie
pre
ssre
leas
es)
5=T
he
issu
esse
ctio
nco
nta
ins
atle
ast
10nat
ional
issu
esad
dre
ssed
thro
ugh
info
rmat
ive
nar
rati
ves
AN
Dlinks
tofu
rther
info
rmat
ion
onan
do
roff
the
site
(R
ecoded
1minus
3=
04minus
5=
1)
Mem
ber
rsquosIs
-su
es0-
1T
he
site
pro
vid
esis
sue
info
rmat
ion
orfe
ature
s(n
otlinks
tofe
ature
soff
the
site
but
info
r-m
atio
non
the
site
)re
late
dto
issu
esth
eM
emb
eris
acti
veon
T
oco
unt
asm
emb
eris
sues
th
eis
sues
must
be
hig
hligh
ted
inth
ebio
grap
hy
and
mor
ein
form
atio
non
the
hig
hligh
ted
issu
esm
ust
be
avai
lable
inth
eis
sues
leg
isla
tion
sect
ion
Ifth
ere
isno
issu
esse
ctio
n
ther
eca
nnot
be
Mem
ber
rsquosis
sues
onth
esi
te
Sta
teL
oca
lIs
sues
0-1
The
site
pro
vid
esis
sue
info
rmat
ion
orfe
ature
s(n
otge
ner
alin
tere
stbut
issu
e-re
late
d)
rela
ted
tois
sues
ofsp
ecifi
cin
tere
stto
the
dis
tric
tor
stat
eIf
nat
ional
issu
esar
ead
dre
ssed
atth
elo
cal
leve
lit
does
not
count
her
eT
his
ism
ore
for
geniu
inel
ylo
cal
issu
eslike
hig
hw
ays
orlo
cati
on-s
pec
ific
issu
es(Y
ucc
am
ounta
in
nat
ional
par
ks
indis
tric
tst
ate
road
pro
ject
set
c)
Con
tinued
onnex
tpag
e
33
Table
4ndash
conti
nued
from
pre
vio
us
page
Item
Sca
leC
odin
gR
ule
Vot
eR
atio
-nal
es0-
5T
ow
hat
exte
nt
does
the
site
pro
vid
ein
form
atio
nab
out
why
aM
emb
ervo
ted
ace
rtai
nw
ayon
cert
ain
legi
slat
ion
This
info
rmat
ion
mig
ht
be
incl
uded
inth
eis
sues
sect
ion
oras
ase
par
ate
sect
ion
(or
not
atal
l)
Pre
ssre
leas
esan
de-
new
slet
ters
do
not
count
unle
ssth
eyrsquor
efe
ature
don
the
hom
epag
esi
nce
wersquo
relo
okin
gfo
rin
form
atio
nth
atrsquos
easy
tofind
and
acce
sson
line
ItO
NLY
counts
wher
eth
ere
isre
fere
nce
tosp
ecifi
cle
gisl
atio
n(H
R12
34or
asp
ecifi
cbillti
tle)
how
the
Mem
ber
vote
d
AN
Dth
eM
emb
ers
reas
ons
for
voti
ng
that
way
D
iscu
ssin
gbills
the
Mem
ber
intr
oduce
ddoes
not
count
asvo
tera
tion
ale
1=V
ote
rati
onal
esar
ead
dre
ssed
only
thro
ugh
pre
ssre
leas
esor
feat
ure
son
the
hom
epag
e2=
Som
eof
the
issu
ese
ctio
ns
wri
teups
conta
invo
tera
tion
ales
3=
Mos
tof
the
issu
esse
ctio
ns
conta
invo
tera
tion
ales
4=
All
ofth
eis
sues
sect
ions
conta
invo
tera
tion
ales
5=
All
ofth
eis
sues
sect
ions
conta
inhig
hligh
tsof
key
vote
san
dth
eM
emb
errsquos
vote
rati
onal
es
(Rec
oded
0
=0
1minus
5=
1)
Const
ituent
Fact
or
Item
s
Answ
ers
toC
asew
ork
FA
Qs
0-5
To
what
exte
nt
does
the
site
hel
pco
nst
ituen
tsunder
stan
dw
hat
the
office
can
do
for
them
and
how
toge
tan
swer
sto
thei
rques
tion
s(t
his
does
not
hav
eto
be
inth
efo
rmof
ques
tion
and
answ
er)
1=T
he
only
has
aco
nta
ctm
yoffi
cefo
ras
sist
ance
mes
sage
2=
Inth
ese
rvic
esse
ctio
n
the
site
has
aco
nta
ctm
yoffi
cefo
ras
sist
ance
mes
sage
and
links
toag
ency
hom
epag
esor
very
bas
icin
form
atio
n(a
couple
ofse
nta
nce
s)
3=In
the
serv
ices
sect
ion
the
site
pro
vid
eslim
ited
guid
ance
(eg
a
par
agra
ph
onty
pes
ofca
ses
the
office
han
dle
s)
4=In
the
serv
ices
sect
ion
the
site
pro
vid
esse
ctio
ns
onm
ore
than
four
typ
esof
case
wor
kse
rvic
es(e
g
pas
spor
ts
soci
alse
curi
ty
vete
rans
ben
efits
busi
nes
sas
sist
ance
st
uden
tlo
ans
etc
)w
ith
exte
nsi
vein
form
atio
nan
do
rlinks
tosp
ecifi
cin
form
atio
non
agen
cyW
ebsi
tes
5=In
the
serv
ices
sect
ion
the
site
pro
vid
esse
ctio
ns
onm
ore
than
four
typ
esof
case
wor
kse
rvic
esan
din
corp
orat
eslinks
tosp
ecifi
cag
ency
pag
esan
do
rco
nta
ctin
form
atio
nIN
CL
UD
ING
info
rmat
ion
abou
tlo
cal
reso
urc
esfo
ras
sist
ance
(R
ecoded
0minus
2=
03minus
5=
1)
Con
tinued
onnex
tpag
e
34
Table
4ndash
conti
nued
from
pre
vio
us
page
Item
Sca
leC
odin
gR
ule
Guid
ance
onC
asew
ork
Ini-
tiat
ion
0-1
The
site
clea
rly
expla
ins
how
and
why
aco
nst
ituen
tca
nin
itia
tea
case
wor
kre
ques
tN
eeds
togi
veco
nst
ituen
tsat
leas
ta
bit
ofco
nte
xt
abou
thow
the
office
can
hel
p
what
case
wor
kis
an
do
rhow
toop
ena
case
Just
pro
vid
ing
afo
rmdoes
nrsquot
count
Cas
ewor
kF
orm
0-1
The
site
pro
vid
esa
form
(can
be
pdf)
for
const
ituen
tsto
fill
out
toin
itia
tea
case
wor
kre
ques
tT
he
pri
vacy
rele
ase
form
isth
esa
me
thin
gas
aca
sew
ork
form
It
will
usu
ally
be
pro
vid
edin
PD
Fb
ecau
seit
requir
esa
physi
cal
sign
ature
soth
eM
emb
erca
nge
tp
erso
nal
info
rmat
ion
abou
tth
eca
sefr
omth
ere
leva
nt
agen
cy
Age
ncy
Lin
ks
0-1
The
site
pro
vid
eslinks
toag
ency
Web
site
sin
ase
ctio
not
her
than
the
const
ituen
tse
rvic
esse
ctio
n(e
g
alinks
orre
sourc
espag
e)
This
isfo
rlinks
incl
uded
inan
other
sect
ion
Ifth
eyar
ein
cluded
inth
eca
sew
ork
sect
ion
itdoes
not
count
for
this
Lin
kto
Fir
st-
Gov
0-1
The
site
incl
uds
alink
toF
irst
Gov
(the
feder
algo
vern
men
tp
orta
l)
Alink
toF
irst
Gov
for
kid
sdoes
count
Gra
nt
Info
0-1
The
site
pro
vid
esin
form
atio
non
how
toge
tgo
vern
men
tgr
ants
Stu
den
tL
oan
info
does
not
count
Info
rmat
ion
abou
tD
istr
ict
Res
ourc
es
0-1
Inth
ese
rvic
esse
ctio
n
the
site
incl
udes
info
rmat
ion
abou
tlo
cal
reso
urc
esfo
ras
sist
ance
(lin
ks
inth
eth
edis
tric
tst
ate
sect
ion
ora
links
pag
eco
unt
only
ifth
eyar
eto
serv
ices
not
tow
ns
spor
tsve
nues
ed
uca
tion
alin
stit
uti
ons
etc
)L
inks
must
be
tose
rvic
esndash
pla
ces
wher
eth
eco
nst
ituen
tca
nge
thel
p
Bes
tpla
ceis
for
this
tob
ein
cluded
inth
eca
sew
ork
sect
ion
but
OK
ifit
rsquosin
cluded
indis
tric
tse
ctio
n
aslo
ng
asit
rsquosto
SE
RV
ICE
S
Lin
ks
tost
ate
and
loca
lgo
vern
men
ton
lyco
unts
ifit
rsquosto
spec
ific
agen
cies
ve
rus
the
gove
rnor
rsquosoffi
ce
the
stat
ego
vern
men
tp
orta
lor
munic
ipal
pag
es
Tech
nolo
gy
Fact
or
Item
s
Con
tinued
onnex
tpag
e
35
Table
4ndash
conti
nued
from
pre
vio
us
page
Item
Sca
leC
odin
gR
ule
Vid
eo0-
1T
he
site
pro
vid
esvid
eocl
ips
(wel
com
em
essa
ges
do
not
count
ndashth
ink
subst
ance
(floor
spee
ches
co
mm
itte
ehea
rings
et
c)
Audio
0-1
The
site
pro
vid
esau
dio
clip
s(w
elco
me
mes
sage
sdo
not
count
ndashth
ink
subst
ance
(floor
spee
ches
co
mm
itte
ehea
rings
et
c)
Tex
tO
nly
0-1
The
site
allo
ws
opti
onfo
ra
text-
only
scre
enfo
rfa
ster
dow
nlo
adin
g
Blo
g0-
1T
he
site
incl
udes
ablo
g(c
ounts
even
ifit
rsquosnot
are
alblo
gth
atac
cepts
com
men
ts)
RSS
Fee
d0-
1T
he
site
incl
udes
anR
SS
feed
(som
etim
eshar
dto
tell
ndashw
hen
indou
bt
don
rsquotin
clude
it)
Podca
st0-
1T
he
site
incl
udes
ap
odca
st(a
udio
up
dat
esau
tom
atic
ally
sent
tosu
bsc
rib
ers)
Nav
igat
ion
1-5
How
easy
isit
tom
ove
abou
tth
esi
te
Nav
igat
ion
isab
out
mov
emen
tth
rough
the
site
an
dit
incl
udes
link
text
but
not
info
rmat
ion
loca
tion
T
his
isab
out
the
men
us
and
links
Org
aniz
atio
nis
abou
tw
het
her
ornot
info
rmat
ion
isw
her
eyo
uw
ould
exp
ect
itto
be
1=nav
-ig
atio
nis
dep
enden
ton
bac
kbutt
onan
dhom
epag
e(n
onav
igat
ion
bar
)2=
nav
igat
ion
links
are
confu
sing
(lan
guag
edoes
nrsquot
mak
eit
clea
rw
hat
yoursquoll
find)
nav
igat
ion
opti
ons
are
soab
undan
tth
atit
rsquoshar
dto
find
what
yoursquor
elo
okin
gfo
rnav
igat
ion
chan
ges
onev
ery
pag
ean
do
rso
me
ofth
em
ain
nav
igat
ion
links
gooff
site
orto
file
s3=
nav
igat
ion
may
be
clutt
ered
but
itrsquos
clea
rw
hat
yoursquoll
be
gett
ing
atth
eot
her
end
4=it
isea
syto
nav
igat
eth
rough
site
and
easy
tounder
stan
dw
hat
yoursquoll
get
when
you
clic
kon
alink
5=nav
igat
ion
iscl
ear
and
easy
an
dth
esi
tepro
vid
esad
dit
ional
nav
igat
ion
feat
ure
son
mos
tpag
es(s
uch
aslinks
wit
hin
text
(eg
links
tobillte
xt
are
incl
uded
onis
sue
pag
es)
orse
ctio
nor
pag
e-sp
ecifi
cnav
igat
ion
tool
sth
atm
ake
nav
igat
ion
easi
er(e
g
bre
adcr
um
bs
orlinks
toad
dit
ional
rela
ted
info
rmat
ion))
(R
ecoded
1minus
3=
04minus
5=
1)
Con
tinued
onnex
tpag
e
36
Table
4ndash
conti
nued
from
pre
vio
us
page
Item
Sca
leC
odin
gR
ule
Rea
dab
ilit
y1-
5H
owea
syis
itto
read
the
conte
nt
ofth
esi
te
This
isnot
abou
tco
nte
nt
but
abou
tw
het
her
itrsquos
easy
tosc
anpag
es
whet
her
ther
ear
ebullet
shea
der
san
dcl
ear
links
whet
her
the
contr
ast
bet
wee
nth
efo
regr
ound
and
bac
kgr
ound
mak
esth
ete
xt
legi
ble
an
dw
het
her
ther
ear
esh
ort
pag
esan
dpar
agra
phs
Asi
tew
her
eyo
uhav
eto
read
orsc
roll
dow
nte
nsc
reen
son
mos
tpag
esis
not
that
read
able
1=
onm
ost
pag
es
the
contr
ast
bet
wee
nth
ete
xt
and
the
bac
kgr
ound
orch
angi
ng
fonts
and
font
size
sm
ake
the
pag
esdiffi
cult
tore
ad
2=on
man
ypag
es
the
shee
rvo
lum
eof
info
rmat
ion
(eg
re
ally
long
text
orre
ally
long
list
sof
links)
mak
esth
epag
esdiffi
cult
tore
ad
3=ge
ner
ally
th
ein
form
atio
non
the
site
isea
syto
read
4=
gener
ally
th
ein
form
atio
non
the
site
isw
ritt
enfo
rth
eW
eb
wit
hsh
ort
par
agra
phs
bullet
shea
din
gs
inte
rnal
links
etc
that
mak
esit
easy
tore
adan
dsc
anth
rough
5=
the
info
rmat
ion
thro
ugh
out
the
site
isw
ritt
enfo
rth
eW
eb(R
ecoded
1minus
3=
04minus
5=
1)
Org
aniz
atio
n1-
5O
rgan
izat
ion
isab
out
whet
her
ornot
info
rmat
ion
isw
her
eyo
uw
ould
exp
ect
itto
be
orw
het
her
you
hav
eto
hunt
arou
nd
for
it
Mov
emen
tth
rough
the
site
isnav
igat
ion
How
wel
lis
the
site
orga
niz
ed
1=th
esi
teap
pea
rsth
row
nto
geth
erw
ith
no
thou
ght
rhym
eor
reas
on
2=so
me
thou
ght
seem
edto
goin
tohow
the
site
was
orga
niz
ed
but
itis
diffi
cult
tofigu
reou
tth
eor
ganiz
atio
nsc
hem
ean
ddiffi
cult
tofind
the
info
rmat
ion
yoursquor
elo
okin
gfo
r3=
the
site
isor
ganiz
edw
ell
enou
ghth
atyo
uca
nusu
ally
find
what
yoursquor
elo
okin
gfo
rw
ith
only
one
ortw
ofa
lse
star
ts
4=th
esi
teis
orga
niz
edw
ell
enou
ghth
atyo
uca
nusu
ally
find
what
yoursquor
elo
okin
gfo
rw
ithin
thre
ecl
icks
(no
fals
est
arts
)5=
the
site
isor
ganiz
edw
ell
enou
ghth
atyo
uca
nusu
ally
find
what
yoursquor
elo
okin
gfo
rw
ithin
thre
ecl
icks
AN
Dyo
uusu
ally
hav
eac
cess
toad
dit
ional
info
rmat
ion
from
other
sect
ions
ofth
esi
te(t
he
site
iscr
oss-
refe
rence
d)
(Rec
oded
1minus
3=
04minus
5=
1)
Con
tinued
onnex
tpag
e
37
Table
4ndash
conti
nued
from
pre
vio
us
page
Item
Sca
leC
odin
gR
ule
Tim
elin
ess
1-5
How
up
todat
eis
the
site
1=
ever
yth
ing
onth
esi
teis
clea
rly
old
even
pre
ssre
leas
es
2=pre
ssre
leas
esar
eup
todat
e(w
ithin
the
last
mon
th)
and
ever
yth
ing
else
isol
d
3=pre
ssre
leas
esar
eup
todat
ean
dev
eryth
ing
else
isto
oge
ner
icto
tell
the
age
4=pre
ssre
leas
esan
dis
sues
are
up
todat
e(p
ress
wit
hin
the
last
mon
than
dis
sues
obvio
usl
yfr
omth
e10
9th
Con
gres
s)
5=ev
eryth
ing
iscl
earl
yup
todat
ean
dit
iscl
ear
that
the
office
mak
esan
effor
tto
incl
ude
tim
ely
info
rmat
ion
onth
esi
te(R
ecoded
1minus
3=
04minus
5=
1)
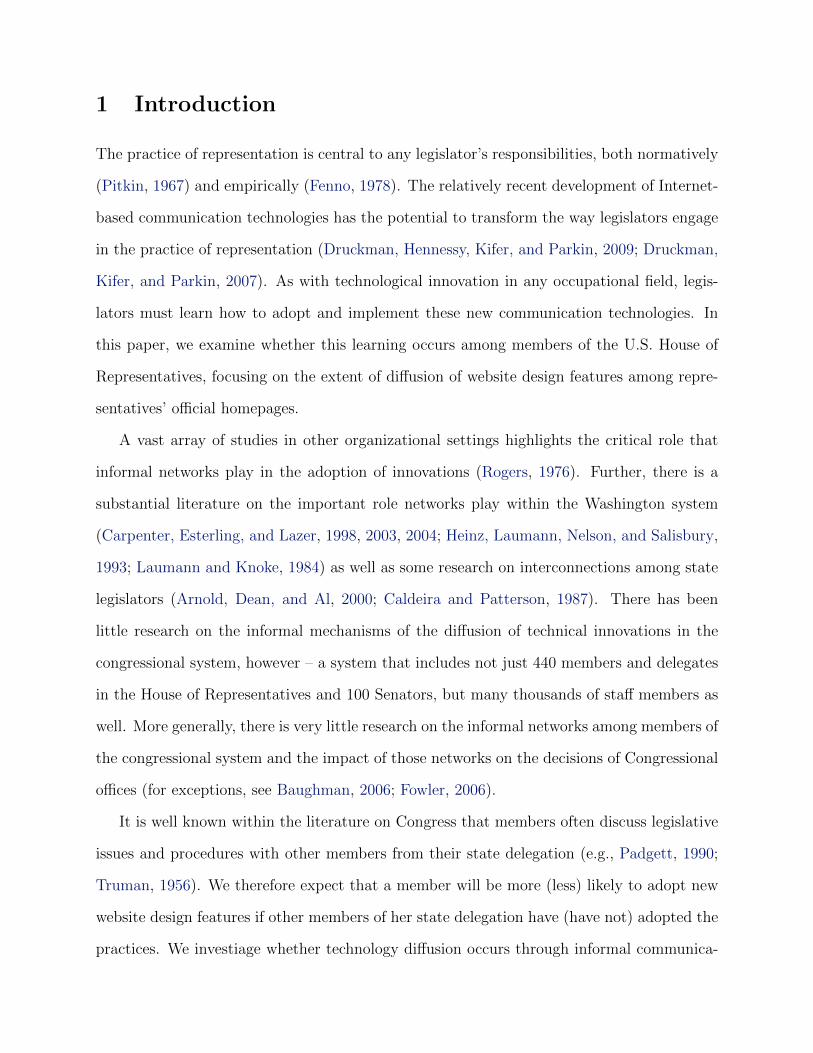
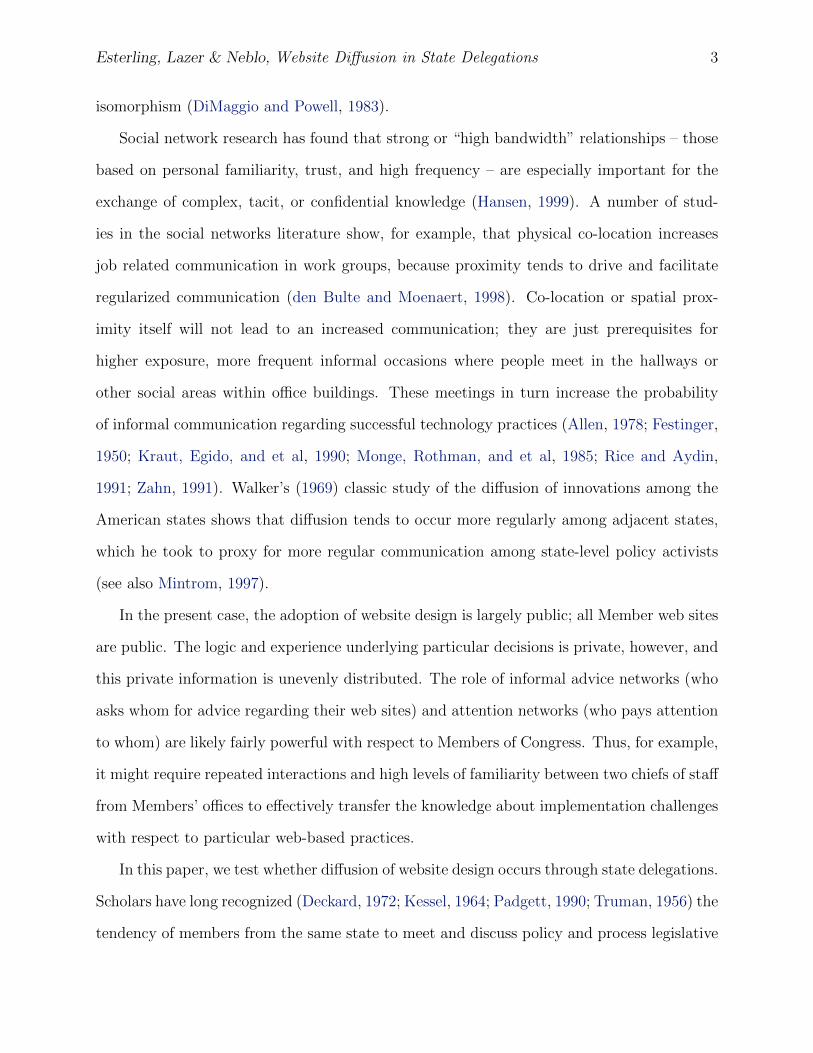
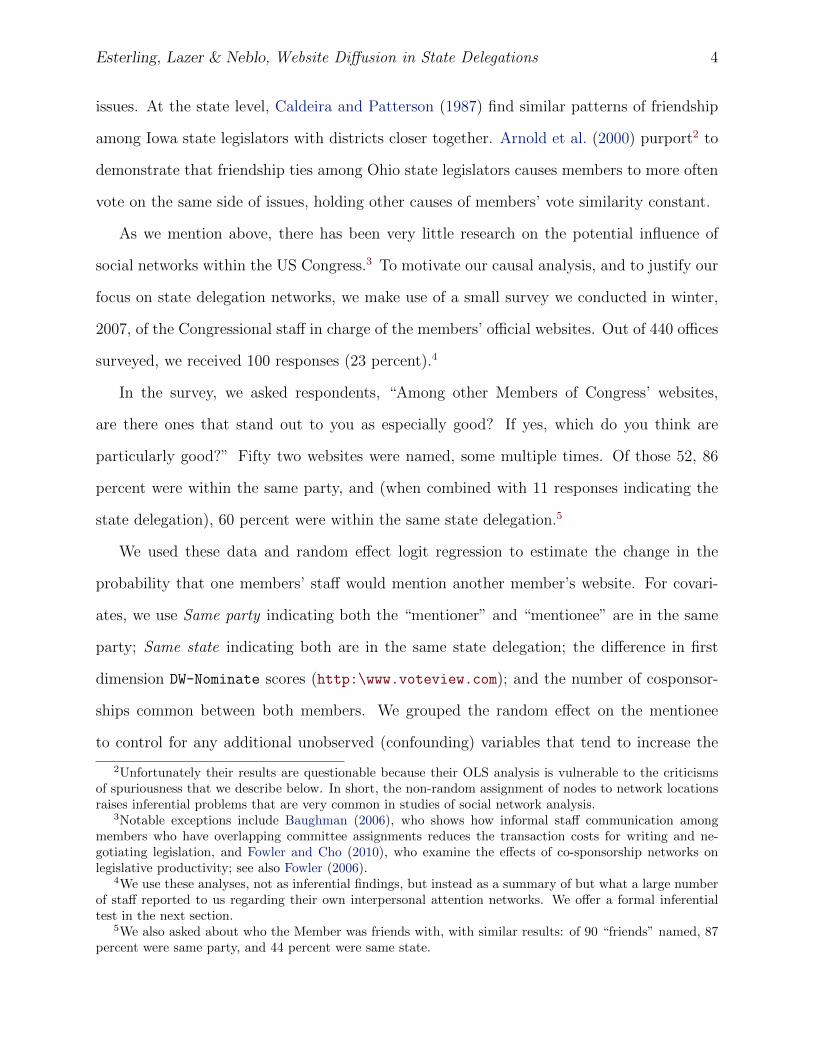