

Exponential Exponential ModelingModeling
Section 3.2aSection 3.2a
Homework: p. 296-297 1-27 oddHomework: p. 296-297 1-27 odd

Let’s start with a whiteboard Let’s start with a whiteboard problem today…problem today…
Determine a formula for the exponential function whose graph isshown below.
(0,3) (4, 1.49)
0xf x f b
000 3f f b 0 3f
44 3 1.49f b
41.49
3b 0.839
3 0.839xf x
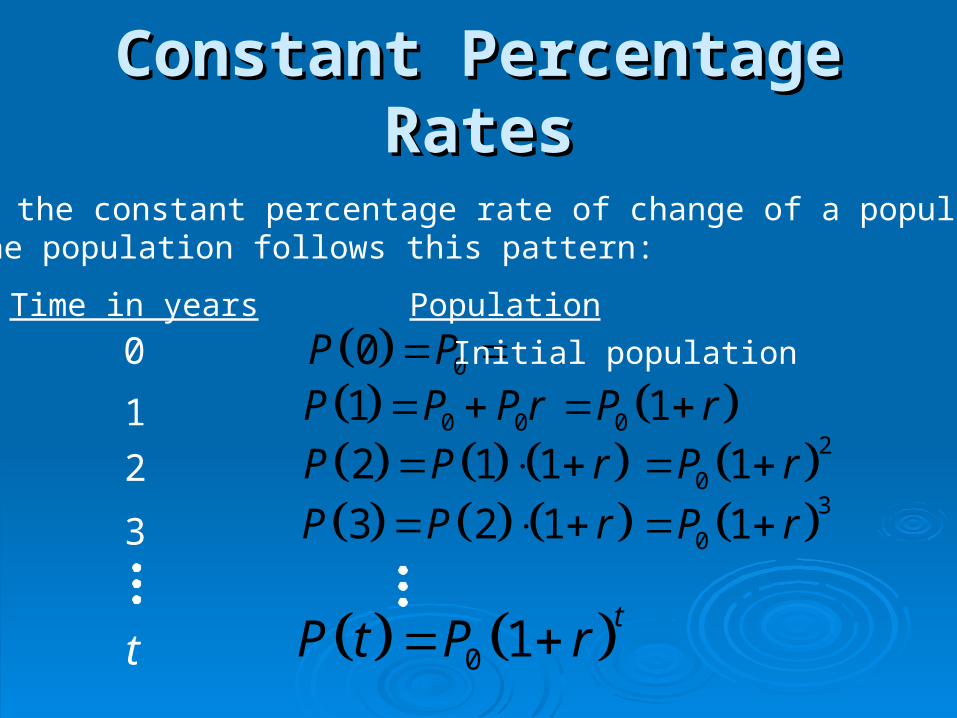
Constant Percentage RatesConstant Percentage Rates
00P P
If r is the constant percentage rate of change of a population,then the population follows this pattern:
Time in years Population
0
1
2
3
t
Initial population
0 01P P P r 0 1P r 2 1 1P P r 20 1P r 3 2 1P P r 30 1P r
0 1t
P t P r

Exponential Population ModelExponential Population Model
If a population P is changing at a constant percentagerate r each year, then
0 1t
P t P r where P is the initial population, r is expressed as adecimal, and t is time in years.
0
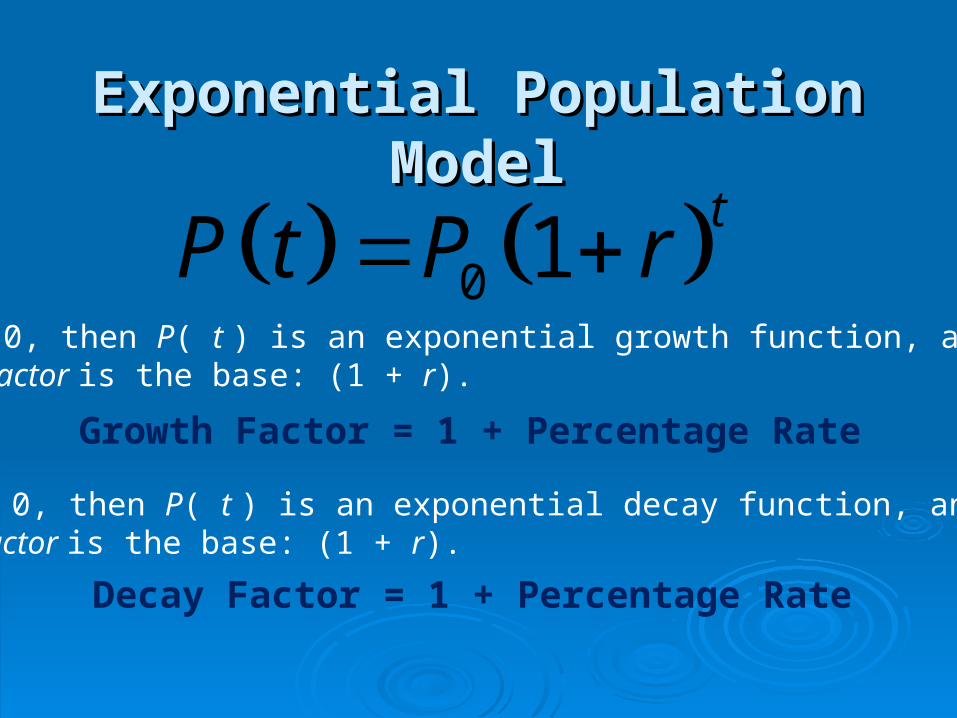
Exponential Population ModelExponential Population Model
If r > 0, then P( t ) is an exponential growth function, and itsgrowth factor is the base: (1 + r).
0 1t
P t P r
Growth Factor = 1 + Percentage Rate
If r < 0, then P( t ) is an exponential decay function, and itsdecay factor is the base: (1 + r).
Decay Factor = 1 + Percentage Rate
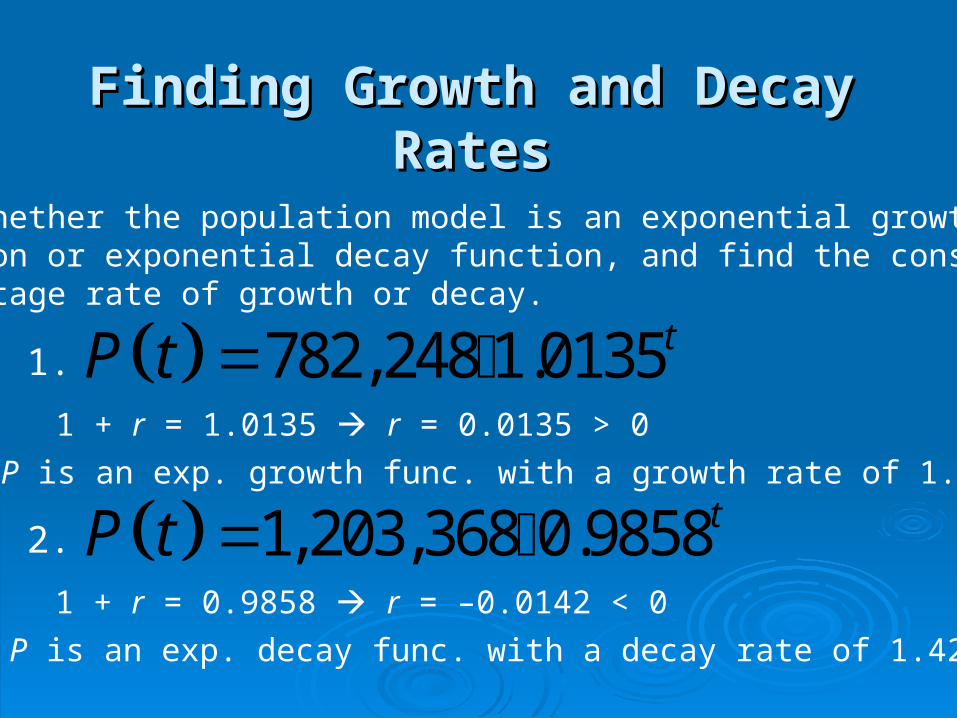
Finding Growth and Decay RatesFinding Growth and Decay Rates
Tell whether the population model is an exponential growthfunction or exponential decay function, and find the constantpercentage rate of growth or decay.
782,248 1.0135tP t 1.
1 + r = 1.0135 r = 0.0135 > 0
P is an exp. growth func. with a growth rate of 1.35%
1,203,368 0.9858tP t 2.
1 + r = 0.9858 r = –0.0142 < 0
P is an exp. decay func. with a decay rate of 1.42%
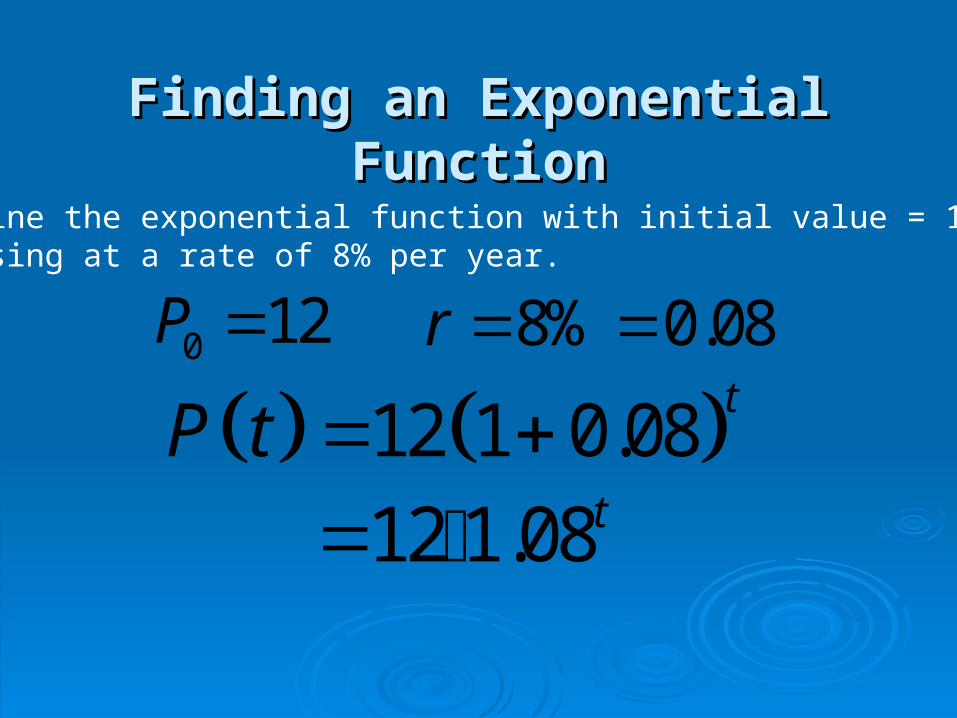
Finding an Exponential FunctionFinding an Exponential Function
Determine the exponential function with initial value = 12,increasing at a rate of 8% per year.
0 12P 8% 0.08r
12 1 0.08t
P t 12 1.08t

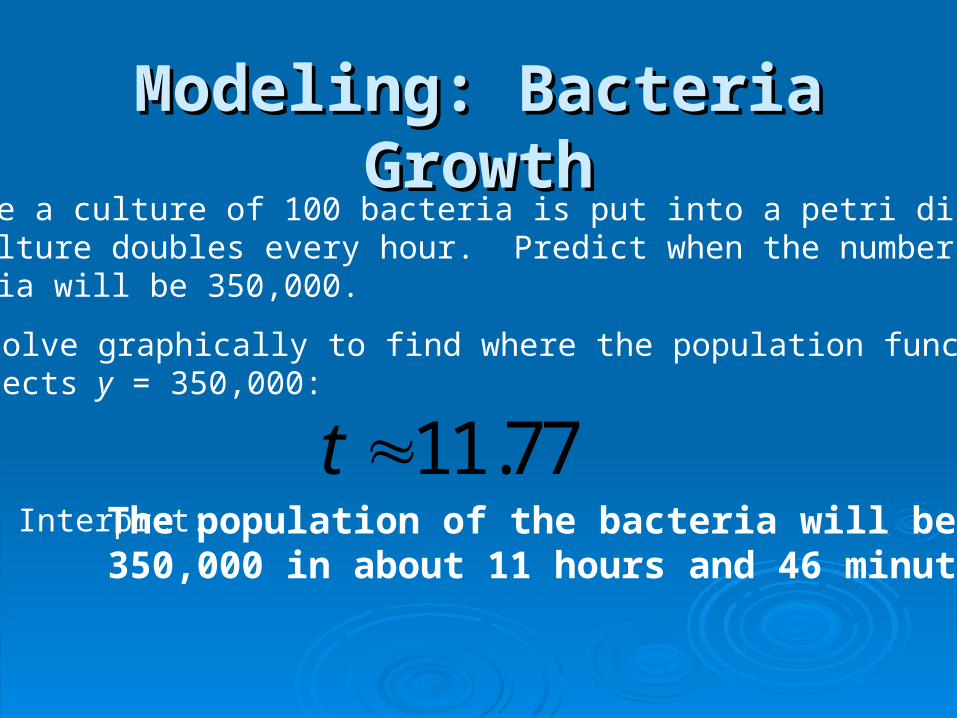
Modeling: Bacteria GrowthModeling: Bacteria GrowthSuppose a culture of 100 bacteria is put into a petri dish andthe culture doubles every hour. Predict when the number ofbacteria will be 350,000.
200 100 2 First, create the model:
Total bacteria after 1 hour:2400 100 2 Total bacteria after 2 hours:
3800 100 2 Total bacteria after 3 hours:
100 2tP t Total bacteria after t hours:
Modeling: Bacteria GrowthModeling: Bacteria GrowthSuppose a culture of 100 bacteria is put into a petri dish andthe culture doubles every hour. Predict when the number ofbacteria will be 350,000.
Now, solve graphically to find where the population functionintersects y = 350,000:
11.77t Interpret: The population of the bacteria will be
350,000 in about 11 hours and 46 minutes
Modeling: Radioactive DecayModeling: Radioactive DecayWhen an element changes from a radioactive state to anon-radioactive state, it loses atoms as a fixed fraction perunit time Exponential Decay!!!
This process is called radioactive decay.
The half-life ofof a substance is the time ittakes for half of a sample of the substanceto change state.
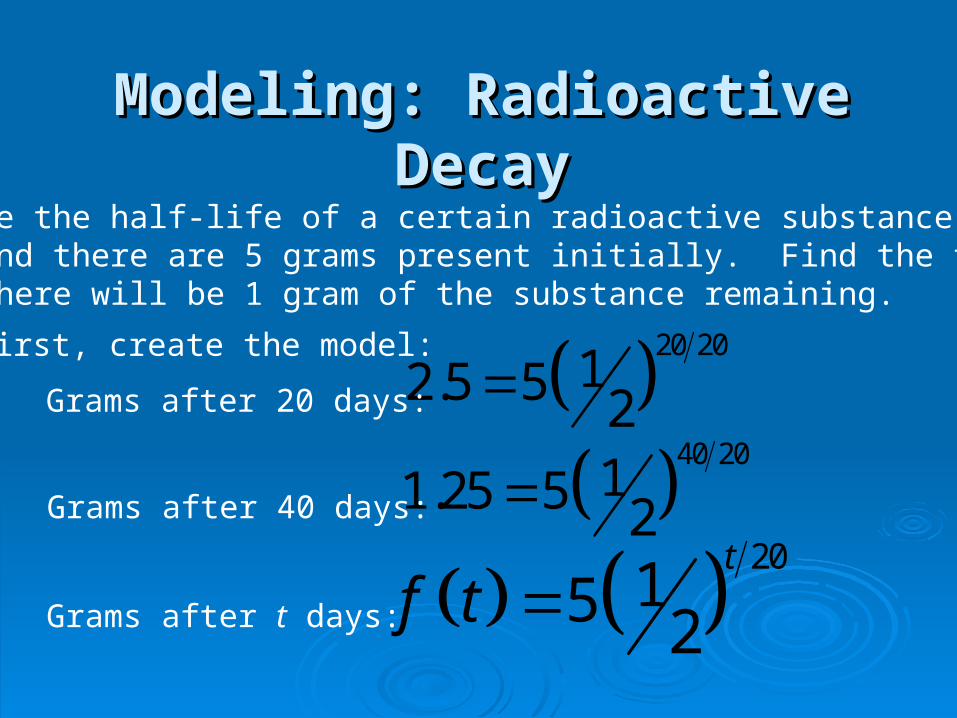
Modeling: Radioactive DecayModeling: Radioactive DecaySuppose the half-life of a certain radioactive substance is 20days and there are 5 grams present initially. Find the timewhen there will be 1 gram of the substance remaining.
20 2012.5 5 2First, create the model:
Grams after 20 days:
2015 2
t
f t Grams after t days:
40 2011.25 5 2Grams after 40 days:
Modeling: Radioactive DecayModeling: Radioactive Decay
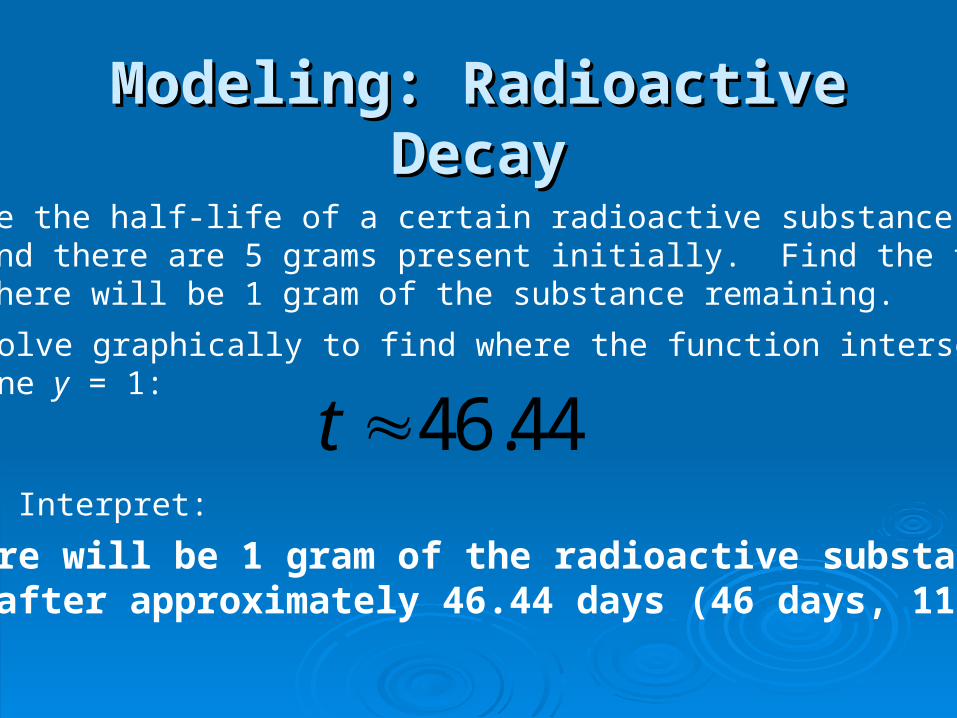
Suppose the half-life of a certain radioactive substance is 20days and there are 5 grams present initially. Find the timewhen there will be 1 gram of the substance remaining.
Now, solve graphically to find where the function intersectsthe line y = 1:
46.44t Interpret:
There will be 1 gram of the radioactive substanceleft after approximately 46.44 days (46 days, 11 hrs)


