

EZ Crisis: A Consensus Narrative
These slides are taken from “Rebooting the Eurozone: Step 1 – agreeing a crisis narrative”, CEPR Policy Insight
No.85by Richard Baldwin, Thorsten Beck, Agnès Bénassy-Quéré, Olivier Blanchard, Giancarlo Corsetti, Paul de Grauwe, Wouter den Haan, Francesco Giavazzi, Daniel Gros, Sebnem Kalemli-Ozcan, Stefano Micossi, Elias Papaioannou, Paolo Pesenti, Christopher Pissarides,
Guido Tabellini and Beatrice Weder di Mauro
Feel free to use, change, and distribute these slides, but please cite CEPR Policy Insight No.85 as the source

Today’s situation: EZ Crisis: a long way from recovery
The Eurozone Crisis is far from finished…
• Lacklustre growth and bleak economic prospects
• “Jobless Europe” for the youth
• Extremist views and nationalistic tendencies
…fragilities and imbalances are still present.
• Non-performing banking loans
• Feedback loops between banks and the sovereign via debt holdings
• Risky interest rate normalization

The causes of the EZ crisis The core reality
EZ crisis as a ‘sudden stop’ crisis
• Abrupt end of capital flows slow growth increased public debt
and deficit public debt crisis
EZ Crisis amplifiers
• No lender of last resort
• No devaluation possibilities
• Vicious feedback cycle between banks and government
• Predominance of banking financing
• Rigid labor and product market

EZ crisis: a consensus narrative Plan of lecture
• Building up problems
• Triggers of the crisis
• Phase one: failed bailouts and contagion
• Phase two: contagion spreads to the core
• Denouement

Building up problems
• Sharp drop in borrowing costs and the disappeared spreads
• Critical intra-EZ imbalance
• Current account deficits
• Investment versus saving
• Competitive imbalance
• Public debt build up (not the driving force!)
• Private debt build up
• EZ banks’ cross-border lending
• Crisis prelude

Sharp drop in borrowing costs and the disappeared spreads
0
2
4
6
8
10
12
14
16
Jan
-19
90
Ap
r-19
91
Jul-
199
2
Oct
-199
3
Jan
-19
95
Ap
r-19
96
Jul-
199
7
Oct
-199
8
Jan
-20
00
Ap
r-20
01
Jul-
200
2
Oct
-200
3
Jan
-20
05
Ap
r-20
06
Jul-
200
7
10 yr gov't bond yields (%)
Greece
Ireland
Italy
Spain
Portugal
Austria
Belgium
France
Germany
Lux'g
NL
Finland
0
2
4
6
8
10
12
14
16
Jan
-19
90
Jan
-19
91
Jan
-19
92
Jan
-19
93
Jan
-19
94
Jan
-19
95
Jan
-19
96
Jan
-19
97
Jan
-19
98
Jan
-19
99
Jan
-20
00
Jan
-20
01
Jan
-20
02
Jan
-20
03
Jan
-20
04
Jan
-20
05
Jan
-20
06
Jan
-20
07
10 yr gov't bond yields (%)
France
Germany
Italy
Japan
UK
US
Source: OECD online database with author’s elaboration.

German long-run interest rates fell in line with global trends
0
2
4
6
8
10
12
14
Jan
-199
0
Oct
-199
0
Jul-
199
1
Ap
r-1
992
Jan
-199
3
Oct
-199
3
Jul-
199
4
Ap
r-1
995
Jan
-199
6
Oct
-199
6
Jul-
199
7
Ap
r-1
998
Jan
-199
9
Oct
-199
9
Jul-
200
0
Ap
r-2
001
Jan
-200
2
Oct
-200
2
Jul-
200
3
Ap
r-2
004
Jan
-200
5
Oct
-200
5
Jul-
200
6
Ap
r-2
007
Jan
-200
8
Oct
-200
8
Jul-
200
9
Ap
r-2
010
Jan
-201
1
Oct
-201
1
Jul-
201
2
Ap
r-2
013
Jan
-201
4
Oct
-201
4
Jul-
201
5
% per annum
Germany
Japan
UK
US
Source: OECD online database with author’s elaboration.

Critical intra-EZ imbalancecurrent account imbalances
Greece
Ireland
Italy
Portugal
Spain
-16
-14
-12
-10
-8
-6
-4
-2
0
2
4
6
199
5
199
6
199
7
199
8
199
9
200
0
200
1
200
2
200
3
200
4
200
5
200
6
200
7
% of own GDP
Germany
Belgium
France
NL
Finland
-4
-2
0
2
4
6
8
10
199
5
199
6
199
7
199
8
199
9
200
0
200
1
200
2
200
3
200
4
200
5
200
6
200
7
% of own GDP
Peripheral EZ members generally ran current deficits while Core members general
ran current account surpluses

Critical intra-EZ imbalanceSaving and investment imbalances
10
13
16
19
22
25
28
31Savings (% of GDP)
Germany
NL
Belgium
France
EZ
10
13
16
19
22
25
28
31
199
5
199
6
199
7
199
8
199
9
200
0
200
1
200
2
200
3
200
4
200
5
200
6
200
7
Savings (% of GDP)
Greece
Ireland
Italy
Portugal
Spain
EZ
16
19
22
25
28
31
199
5
199
6
199
7
199
8
199
9
200
0
200
1
200
2
200
3
200
4
200
5
200
6
200
7
Investment (% of GDP)
Greece
Ireland
Italy
Portugal
Spain
EZ
16
19
22
25
28
31
199
5
199
6
199
7
199
8
199
9
200
0
200
1
200
2
200
3
200
4
200
5
200
6
200
7
Investment (% of GDP)
Germany
NL
Belgium
France
EZ
GIIPS generally saved less and invested more than average while Core EZ nations
generally saved more and invest less the average
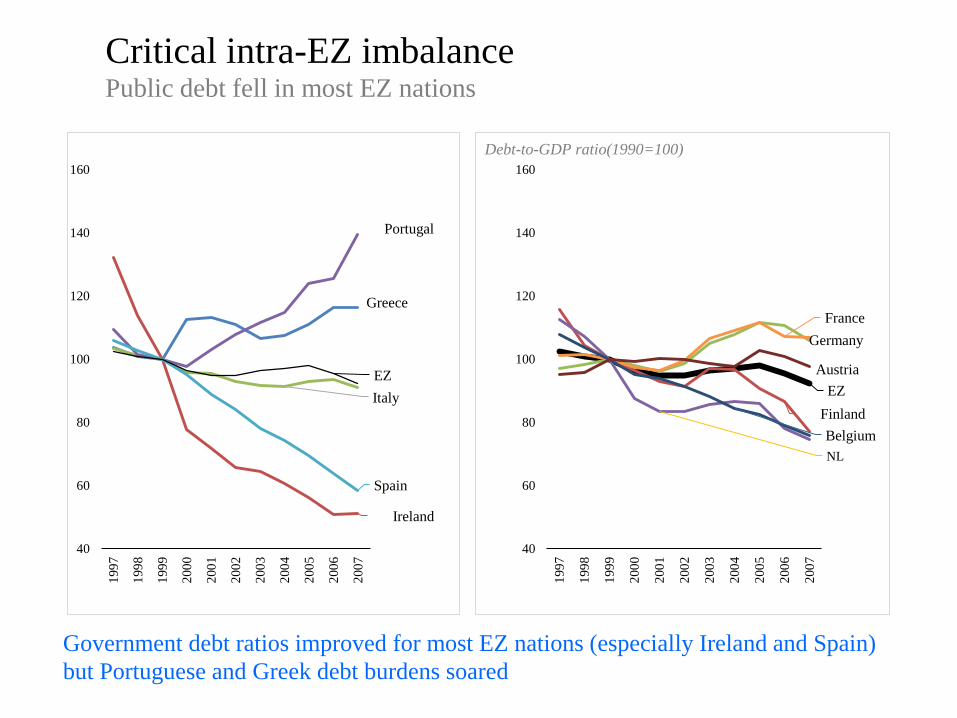
Critical intra-EZ imbalancePublic debt fell in most EZ nations
Government debt ratios improved for most EZ nations (especially Ireland and Spain)
but Portuguese and Greek debt burdens soared
Greece
Ireland
Italy
Portugal
Spain
EZ
40
60
80
100
120
140
160
199
7
199
8
199
9
200
0
200
1
200
2
200
3
200
4
200
5
200
6
200
7
EZ
Finland
Germany
NL
France
Belgium
Austria
40
60
80
100
120
140
160
199
7
199
8
199
9
200
0
200
1
200
2
200
3
200
4
200
5
200
6
200
7
Debt-to-GDP ratio(1990=100)

Critical intra-EZ imbalanceBank debt rose rapidly in some EZ nations
Rapid accumulation of bank debt was a problem especially in Ireland, Spain, Italy and
France
Ireland
Spain
Italy
Greece
Portugal70
90
110
130
150
170
190
210
2000
2001
2002
2003
2004
2005
2006
2007
Total bank assets to GDP
France
Finland
Belgium
Austria
Germany
NL70
90
110
130
150
170
190
210
2000
2001
2002
2003
2004
2005
2006
2007
Total bank assets to GDP

House prices rose in the GIIPS more than in the US
while Germany’s fell
Note: 1999 Q1=100.
Source: OECD online database. House price indices in real terms.

Total landing from core countries’ bank to the periphery
(billion euros)

Prelude and Phase One of the Crisis in EZ Periphery
Greek deficit deceit Greek bailout Irish bailout Portuguese bailout Greece
Ireland
Portugal
0
2
4
6
8
10
12
14
16
18
Sep
-2008
Oct
-20
08
Nov-2
00
8
Dec
-20
08
Jan-2
00
9
Feb
-20
09
Mar
-20
09
Apr-
2009
May
-20
09
Jun-2
009
Jul-
20
09
Aug-2
00
9
Sep
-20
09
Oct
-20
09
Nov
-2009
Dec
-20
09
Jan-2
01
0
Feb
-20
10
Mar
-20
10
Apr-
20
10
May
-20
10
Jun-2
010
Jul-
20
10
Aug-2
01
0
Sep
-20
10
Oct
-20
10
Nov-2
01
0
Dec
-20
10
Jan-2
011
Feb
-20
11
Mar
-20
11
Apr-
20
11
May
-20
11
Jun-2
011
Jul-
20
11
Aug
-2011
Sep
-20
11
Oct
-20
11
Nov-2
01
1
Prelude Phase One
Spreads
Note: The spreads are the difference between national 10-year government bound yields and those of Germany, in
percentage points.
Source: OECD online database with author’s elaboration.

Summary of pre-crisis imbalances
1999 to 2007 (% of own GDP) Bank assets (% of GDP) %
Cumulative current account balance
Cumulative budget deficit
2000 to 2008 increase
(p.p.)Bank assets,
2008Debt-GDP ratio, 2008
Excess inflation
(1999-2007)Portugal -96 -36 44% 262% 72 7.5Greece -84 -47 36% 173% 109 9.9
Spain -60 2 121% 296% 39 9.2Ireland -21 14 464% 783% 43 11.6Italy -8 -26 85% 235% 102 1.8EZ -2 -17 94% 335% 69 0.0France 6 -23 180% 395% 68 -2.9Austria 16 -19 305% 379% 69 -3.2Germany 27 -19 18% 316% 65 -4.8Belgium 47 -5 83% 392% 92 -1.1NL 48 -5 -9% 375% 55 2.8Finland 61 33 101% 197% 33 -4.9Lux'g 98 23 -577% 2367% 14 5.5
Note: ‘Excess’ inflation is the nation’s cumulative inflation rate minus that of the EZ average.
Source: OECD online database with author’s elaboration.

Triggers of the crisis
• October 2009: Greece budget
deficit unmasked
• Six-moth attempt of ‘self rescue’
– failed
• Greece trapped into a public debt
vortex
• Debt loop
• Austerity loop

Phase One: failed bailouts and contagion
• Failed bailouts - Greece’s borrowing cost continued to soar
• Contagion in the periphery
• Public debt vortexes: Portugal
• Bank debt vortexes public debt vortexes: Ireland
Greek deficit deceit Greek bailout Irish bailout Portuguese bailout Greece
Ireland
Portugal
0
2
4
6
8
10
12
14
16
18
Sep
-2008
Oct
-2008
Nov-2
008
Dec
-2008
Jan-2
009
Feb
-2009
Mar
-2009
Apr-
2009
May
-2009
Jun-2
009
Jul-
2009
Aug-2
009
Sep
-2009
Oct
-2009
Nov-2
009
Dec
-2009
Jan-2
010
Feb
-2010
Mar
-2010
Apr-
2010
May
-2010
Jun-2
010
Jul-
2010
Aug-2
010
Sep
-2010
Oct
-2010
Nov-2
010
Dec
-2010
Jan-2
011
Feb
-2011
Mar
-2011
Apr-
2011
May
-2011
Jun-2
011
Jul-
2011
Aug-2
011
Sep
-2011
Oct
-2011
Nov-2
011
Prelude Phase One
Spreads
Figure : Prelude and Phase One of the Crisis in EZ Periphery

Phase Two: contagion spreads to the core
• Mismanagement of the bailouts give rise to a general fear
• Pro-cyclical fiscal tightening further stoking contagion
• Self-feeding panic: Good equilibrium, bad equilibrium

Fiscal policy turned pro-cyclical from 2010
Note: Inspired by Carrot and de Castro (2015) with author’s elaborating using IMF WEO data.

Pro-cyclical fiscal policy, 2010 to 2014
% of own potential GDP
bill EUR % %
2010 to 2014 swing 2010 to 2014 swing Share of EZ swing Share EZ 2014 GDP
Greece 7% 14 4% 2%Ireland 28% 49 14% 2%Italy 2% 28 8% 16%Portugal 9% 17 5% 2%Spain 5% 53 16% 11%EZ 4% 340 100% 100%Austria 1% 2 1% 3%Belgium 0% 2 0% 4%Finland 0% 0 0% 2%France 2% 46 13% 21%Germany 4% 108 32% 29%
Luxembourg 1% 1 0% 0%
Netherlands 2% 15 5% 6%

Phase Two: contagion spreads to the core
Spreads started to rise for Belgium, France and Austria – as well as
Italy and Spain
Greek bailout Irish bailout Portuguese bailout 2nd Greek bailout
Spain
Italy
Belgium
France & Austria
0
1
2
3
4
5
6
7
May
-2010
Jun-2
010
Jul-
2010
Aug-2
010
Sep
-2010
Oct
-2010
Nov-2
010
Dec
-2010
Jan-2
011
Feb
-2011
Mar
-2011
Apr-
2011
May
-2011
Jun-2
011
Jul-
2011
Aug-2
011
Sep
-2011
Oct
-2011
Nov-2
011
Dec
-2011
Jan-2
012
Feb
-2012
Mar
-2012
Apr-
2012
May
-2012
Jun-2
012
Jul-
2012
Aug-2
012
Sep
-2012
Oct
-2012
Nov-2
012
Dec
-2012
Jan-2
013
Feb
-2013
Phase One Phase Two
Spreads

Denouement
• Agreement on Banking Union and the Fiscal compact
• Draghi’s “whatever it takes”
Draghi speech
0
5
10
15
20
25
30
35
40
Jan
-…
Oct
-…
Jul-
…
Ap
r…
Jan
-…
Oct
-…
Jul-
…
Ap
r…
Jan
-…
Oct
-…
Jul-
…
Ap
r…
Jan
-…
Oct
-…
Jul-
…
Ap
r…
Jan
-…
Oct
-…
Jul-
…
Ap
r…
Jan
-…
Oct
-…
Jul-
…
Ap
r…
Jan
-…
Oct
-…
Jul-
…
Ap
r…
Jan
-…
Oct
-…
Jul-
…
Ap
r…
Jan
-…
Oct
-…
Jul-
…
10 yr gov't bond yields (%)
Greece
Ireland
Italy
Spain
Portugal
Austria
Belgium
France
Germany
Lux'g
NL
Finland
Figure: Yields converged again after Draghi’s intervention

Proximate causes, and causes of the causes
Proximate cause
• Sudden stop in inter-EZ lending
• Loss of independent monetary policy after euro adoption
Cause of the cause
• Policy failures that allowed the imbalance to get so large
• Failure to control national debt
• Failure to control excessive bank leverage
• Lack of institutions to absorb shocks at the EZ level
• Failings in real-time crisis management

Concluding remarks
This essay has identified proximate causes, the causes of the proximate
causes of the RZ crisis and provide and crisis narrative.
How we got here…
• Fundamental design flaws of the EMU
…the way ahead
• Lots of suggestions, no consensus
• Both on where to go, and on how
• We need a systematic rethinking how to get Europe working again

The End


