
1
Facebook Reports Fourth Quarter and Full Year 2016 Results
MENLO PARK, Calif. – February 1, 2017 – Facebook, Inc. (NASDAQ: FB) today reported financial results for
the fourth quarter and full year ended December 31, 2016.
"Our mission to connect the world is more important now than ever," said Mark Zuckerberg, Facebook founder
and CEO. "Our business did well in 2016, but we have a lot of work ahead to help bring people together."
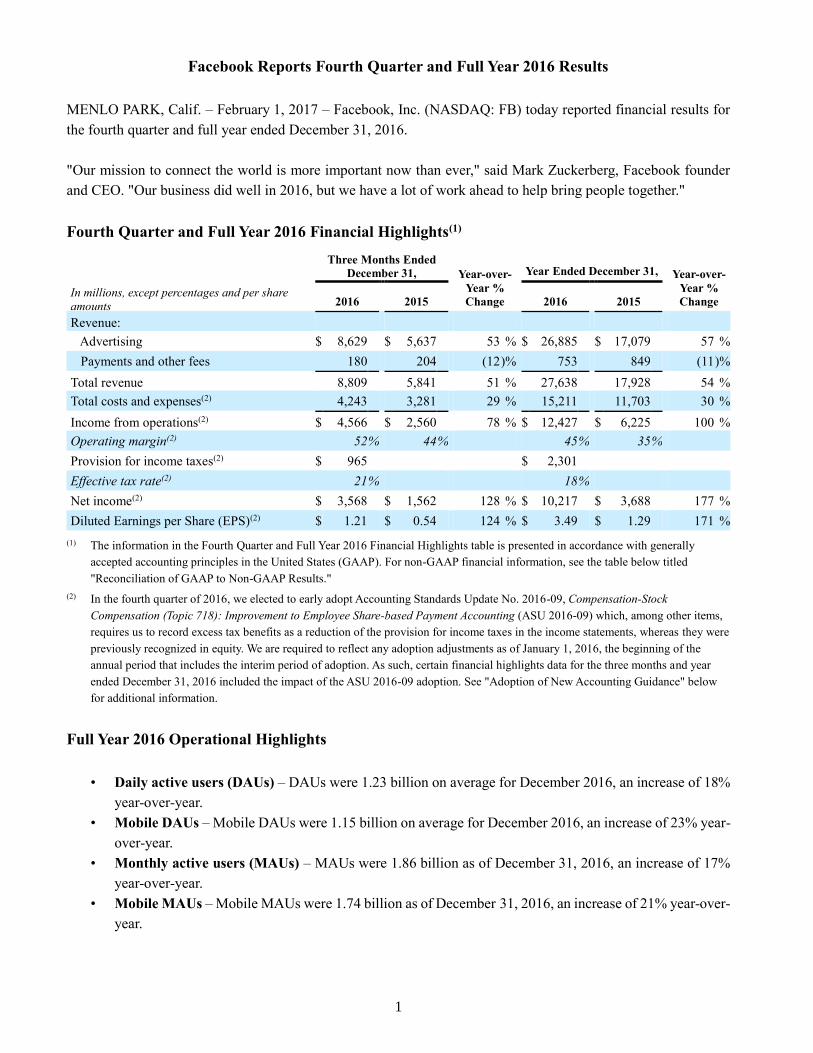
Fourth Quarter and Full Year 2016 Financial Highlights(1)
Three Months Ended
December 31, Year-over-
Year %
Change
Year Ended December 31, Year-over-
Year %
Change In millions, except percentages and per share
amounts 2016 2015 2016 2015
Revenue:
Advertising $ 8,629 $ 5,637 53 % $ 26,885 $ 17,079 57 %
Payments and other fees 180 204 (12 )% 753 849 (11 )%
Total revenue 8,809 5,841 51 % 27,638 17,928 54 %
Total costs and expenses(2) 4,243 3,281 29 % 15,211 11,703 30 %
Income from operations(2) $ 4,566 $ 2,560 78 % $ 12,427 $ 6,225 100 %
Operating margin(2) 52 % 44 % 45 % 35 %
Provision for income taxes(2) $ 965 $ 2,301
Effective tax rate(2) 21 % 18 %
Net income(2) $ 3,568 $ 1,562 128 % $ 10,217 $ 3,688 177 %
Diluted Earnings per Share (EPS)(2) $ 1.21 $ 0.54 124 % $ 3.49 $ 1.29 171 %
(1) The information in the Fourth Quarter and Full Year 2016 Financial Highlights table is presented in accordance with generally
accepted accounting principles in the United States (GAAP). For non-GAAP financial information, see the table below titled
"Reconciliation of GAAP to Non-GAAP Results."
(2) In the fourth quarter of 2016, we elected to early adopt Accounting Standards Update No. 2016-09, Compensation-Stock
Compensation (Topic 718): Improvement to Employee Share-based Payment Accounting (ASU 2016-09) which, among other items,
requires us to record excess tax benefits as a reduction of the provision for income taxes in the income statements, whereas they were
previously recognized in equity. We are required to reflect any adoption adjustments as of January 1, 2016, the beginning of the
annual period that includes the interim period of adoption. As such, certain financial highlights data for the three months and year
ended December 31, 2016 included the impact of the ASU 2016-09 adoption. See "Adoption of New Accounting Guidance" below
for additional information.
Full Year 2016 Operational Highlights
• Daily active users (DAUs) – DAUs were 1.23 billion on average for December 2016, an increase of 18%
year-over-year.
• Mobile DAUs – Mobile DAUs were 1.15 billion on average for December 2016, an increase of 23% year-
over-year.
• Monthly active users (MAUs) – MAUs were 1.86 billion as of December 31, 2016, an increase of 17%
year-over-year.
• Mobile MAUs – Mobile MAUs were 1.74 billion as of December 31, 2016, an increase of 21% year-over-
year.
2
Fourth Quarter and Full Year 2016 Other Financial Highlights
• Mobile advertising revenue – Mobile advertising revenue represented approximately 84% of advertising
revenue for the fourth quarter of 2016, up from approximately 80% of advertising revenue in the fourth
quarter of 2015.
• Capital expenditures – Capital expenditures for the full year 2016 were $4.49 billion.
• Cash and cash equivalents and marketable securities – Cash and cash equivalents and marketable
securities were $29.45 billion at the end of the fourth quarter of 2016.
Adoption of New Accounting Guidance
We elected to early adopt ASU 2016-09 in the fourth quarter of 2016 which addresses, among other items, the
accounting for income taxes and forfeitures, and cash flow presentation of share-based compensation. Upon
adoption, excess tax benefits generated when stock awards vest or settle are no longer recognized in equity but are
instead recognized as a reduction to provision for income taxes. We also elected to account for forfeitures as they
occur, rather than estimate expected forfeitures. Under the new guidance, cash flows related to excess tax benefits
are required to be presented as an operating activity rather than a financing activity. We are required to reflect any
adjustments as of January 1, 2016, the beginning of the annual period that includes the interim period of adoption.
The adoption of ASU 2016-09 resulted in, among other items:
• net cumulative-effect adjustment of $1.67 billion increase to retained earnings as of January 1, 2016,
mostly related to the recognition of the previously unrecognized excess tax benefits, and
• $934 million decrease in our full year 2016 provision for income taxes, or 7% decrease in our full year
2016 effective tax rate, mostly due to the recognition of excess tax benefits for awards that vested or settled
in 2016 as a reduction to our provision for income taxes, whereas they previously were recognized in
equity.
We adopted the aspects of the cash flow presentation retrospectively, and accordingly, to conform to the current
year presentation, we reclassified $566 million and $1.72 billion of excess tax benefits under financing activities
to operating activities for the fourth quarter and full year 2015, respectively. See supplemental earnings slides
available on our investor website as well as our annual report on Form 10-K for the year ended December 31, 2016
to be filed with the SEC for additional detailed information regarding the impact of the early adoption.
3
Webcast and Conference Call Information
Facebook will host a conference call to discuss the results at 2 p.m. PT / 5 p.m. ET today. The live webcast of
Facebook's earnings conference call can be accessed at investor.fb.com, along with the earnings press release,
financial tables and slide presentation. Facebook uses the investor.fb.com and newsroom.fb.com websites as well
as Mark Zuckerberg's Facebook Page (https://www.facebook.com/zuck) as means of disclosing material non-
public information and for complying with its disclosure obligations under Regulation FD.
Following the call, a replay will be available at the same website. A telephonic replay will be available for one
week following the conference call at +1 (404) 537-3406 or +1 (855) 859-2056, conference ID 39092359.
About Facebook
Founded in 2004, Facebook’s mission is to give people the power to share and make the world more open and
connected. People use Facebook to stay connected with friends and family, to discover what’s going on in the
world, and to share and express what matters to them.
Contacts
Investors:
Deborah Crawford
[email protected] / investor.fb.com
Press:
Vanessa Chan
[email protected] / newsroom.fb.com
4
Forward Looking Statements
This press release contains forward-looking statements regarding our future business expectations, which are
subject to the safe harbor provisions of the Private Securities Litigation Reform Act of 1995. These forward-
looking statements are only predictions and may differ materially from actual results due to a variety of factors
including: our ability to retain or increase users and engagement levels; our reliance on advertising revenue; our
dependency on mobile operating systems, networks, and standards that we do not control; risks associated with
new product development and their introduction as well as other new business initiatives; our emphasis on user
growth and engagement and the user experience over short-term financial results; competition; litigation; privacy
and regulatory concerns; risks associated with acquisitions; security breaches; and our ability to manage growth
and geographically-dispersed operations. These and other potential risks and uncertainties that could cause actual
results to differ from the results predicted are more fully detailed under the caption "Risk Factors" in our Quarterly
Report on Form 10-Q filed with the SEC on November 3, 2016, which is available on our Investor Relations
website at investor.fb.com and on the SEC website at www.sec.gov. Additional information will also be set forth
in our Annual Report on Form 10-K for the year ended December 31, 2016. In addition, please note that the date
of this press release is February 1, 2017, and any forward-looking statements contained herein are based on
assumptions that we believe to be reasonable as of this date. We undertake no obligation to update these statements
as a result of new information or future events.
Non-GAAP Financial Measures
To supplement our condensed consolidated financial statements, which are prepared and presented in accordance
with GAAP, we use the following non-GAAP financial measures: revenue excluding foreign exchange effect and
advertising revenue excluding foreign exchange effect; non-GAAP costs and expenses; non-GAAP income from
operations; non-GAAP net income; non-GAAP diluted shares; non-GAAP diluted earnings per share; non-GAAP
operating margin; non-GAAP effective tax rate; and free cash flow. The presentation of these financial measures
is not intended to be considered in isolation or as a substitute for, or superior to, financial information prepared
and presented in accordance with GAAP. Investors are cautioned that there are material limitations associated with
the use of non-GAAP financial measures as an analytical tool. In particular, many of the adjustments to our GAAP
financial measures reflect the exclusion of items, specifically amortization of intangible assets, share-based
compensation expense, and payroll tax related to share-based compensation expense, and the related income tax
effects of the aforementioned exclusions, that are recurring and will be reflected in our financial results for the
foreseeable future. In addition, these measures may be different from non-GAAP financial measures used by other
companies, limiting their usefulness for comparison purposes. We compensate for these limitations by providing
specific information regarding the GAAP amounts excluded from these non-GAAP financial measures.
We believe these non-GAAP financial measures provide investors with useful supplemental information about the
financial performance of our business, enable comparison of financial results between periods where certain items
may vary independent of business performance, and allow for greater transparency with respect to key metrics
used by management in operating our business.
We exclude the following items from one or more of our non-GAAP financial measures:
Amortization of intangible assets. We amortize intangible assets acquired in connection with acquisitions. We
exclude these amortization expenses because we do not believe these expenses are reflective of ongoing operating
results in the period. These amounts arise from our prior acquisitions and have no direct correlation to the operation
of our business.
5
Share-based compensation expense. We exclude share-based compensation expense because we believe that the
non-GAAP financial measures excluding this item provide meaningful supplemental information regarding
operational performance. In particular, because of varying available valuation methodologies, subjective
assumptions and the variety of award types that companies can use under FASB ASC 718, we believe that
providing non-GAAP financial measures that exclude this expense allows investors to make more meaningful
comparisons between our operating results and those of other companies. Accordingly, we believe that excluding
this expense provides investors and management with greater visibility to the underlying performance of our
business operations, facilitates comparison of our results with other periods, and may also facilitate comparison
with the results of other companies in our industry.
Payroll tax expense related to share-based compensation. We exclude payroll tax expense related to share-based
compensation expense because, without excluding these tax expenses, investors would not see the full effect that
excluding share-based compensation expense had on our operating results. These expenses are tied to the exercise
or vesting of underlying equity awards and the price of our common stock at the time of vesting or exercise, which
factors may vary from period to period independent of the operating performance of our business. Similar to share-
based compensation expense, we believe that excluding this payroll tax expense provides investors and
management with greater visibility to the underlying performance of our business operations and facilitates
comparison with other periods as well as the results of other companies.
Income tax effect of amortization of intangible assets, share-based compensation and related payroll tax expenses.
We believe excluding the income tax effect of non-GAAP adjustments assists investors and management in
understanding the tax provision related to those adjustments and provides useful supplemental information
regarding the underlying performance of our business operations.
Foreign exchange effect on revenue. We translated revenue for the three months and year ended December 31,
2016 using the prior year's monthly exchange rates for our settlement currencies other than the U.S. dollar, which
we believe is a useful metric that facilitates comparison to our historical performance.
Purchases of property and equipment. We subtract purchases of property and equipment in our calculation of free
cash flow because we believe that this methodology can provide useful supplemental information to help investors
better understand underlying trends in our business.
For more information on our non-GAAP financial measures and a reconciliation of GAAP to non-GAAP measures,
please see the "Reconciliation of GAAP to Non-GAAP Results" table in this press release.
6
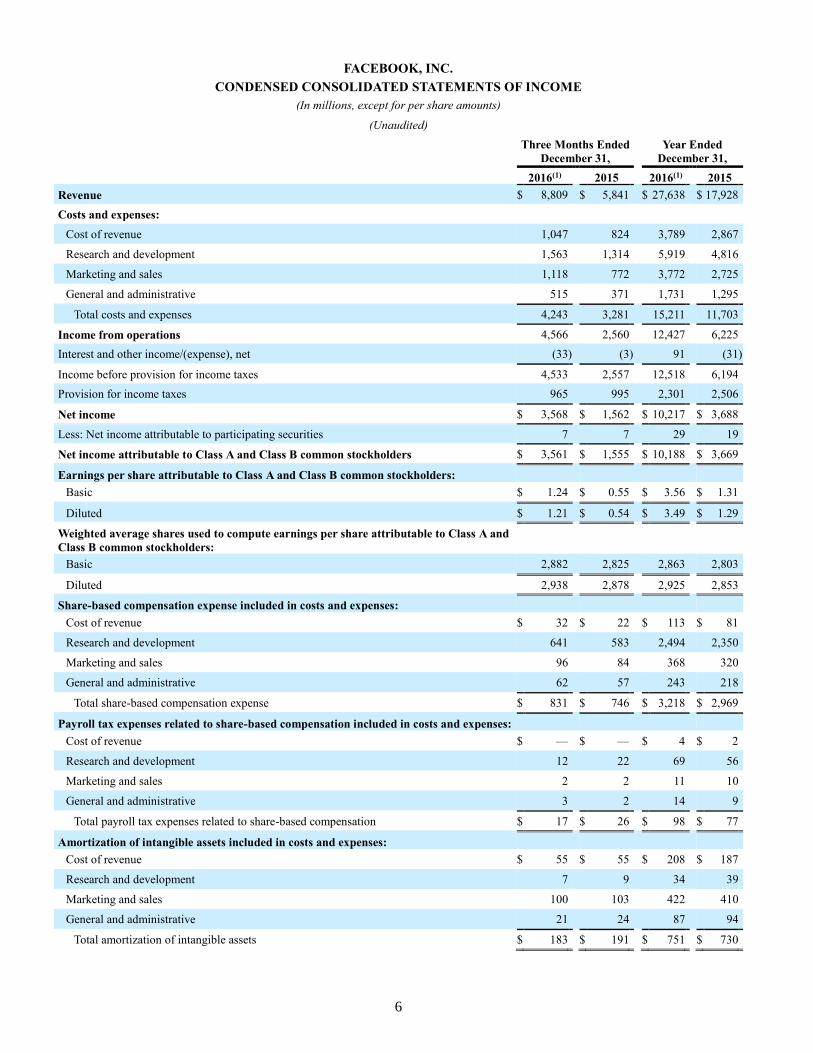
FACEBOOK, INC.
CONDENSED CONSOLIDATED STATEMENTS OF INCOME
(In millions, except for per share amounts)
(Unaudited)
Three Months Ended
December 31, Year Ended
December 31,
2016(1) 2015 2016(1) 2015
Revenue $ 8,809 $ 5,841 $ 27,638 $ 17,928
Costs and expenses:
Cost of revenue 1,047 824 3,789 2,867
Research and development 1,563 1,314 5,919 4,816
Marketing and sales 1,118 772 3,772 2,725
General and administrative 515 371 1,731 1,295
Total costs and expenses 4,243 3,281 15,211 11,703
Income from operations 4,566 2,560 12,427 6,225
Interest and other income/(expense), net (33 ) (3 ) 91 (31 )
Income before provision for income taxes 4,533 2,557 12,518 6,194
Provision for income taxes 965 995 2,301 2,506
Net income $ 3,568 $ 1,562 $ 10,217 $ 3,688
Less: Net income attributable to participating securities 7 7 29 19
Net income attributable to Class A and Class B common stockholders $ 3,561 $ 1,555 $ 10,188 $ 3,669
Earnings per share attributable to Class A and Class B common stockholders:
Basic $ 1.24 $ 0.55 $ 3.56 $ 1.31
Diluted $ 1.21 $ 0.54 $ 3.49 $ 1.29
Weighted average shares used to compute earnings per share attributable to Class A and
Class B common stockholders:
Basic 2,882 2,825 2,863 2,803
Diluted 2,938 2,878 2,925 2,853
Share-based compensation expense included in costs and expenses:
Cost of revenue $ 32 $ 22 $ 113 $ 81
Research and development 641 583 2,494 2,350
Marketing and sales 96 84 368 320
General and administrative 62 57 243 218
Total share-based compensation expense $ 831 $ 746 $ 3,218 $ 2,969
Payroll tax expenses related to share-based compensation included in costs and expenses:
Cost of revenue $ — $ — $ 4 $ 2
Research and development 12 22 69 56
Marketing and sales 2 2 11 10
General and administrative 3 2 14 9
Total payroll tax expenses related to share-based compensation $ 17 $ 26 $ 98 $ 77
Amortization of intangible assets included in costs and expenses:
Cost of revenue $ 55 $ 55 $ 208 $ 187
Research and development 7 9 34 39
Marketing and sales 100 103 422 410
General and administrative 21 24 87 94
Total amortization of intangible assets $ 183 $ 191 $ 751 $ 730

7
(1) We elected to early adopt ASU 2016-09 in the fourth quarter of 2016. The impacts of adoption have been reflected in our condensed consolidated
statements of income for the three months and year ended December 31, 2016. See "Adoption of New Accounting Guidance" above for additional
information.
8
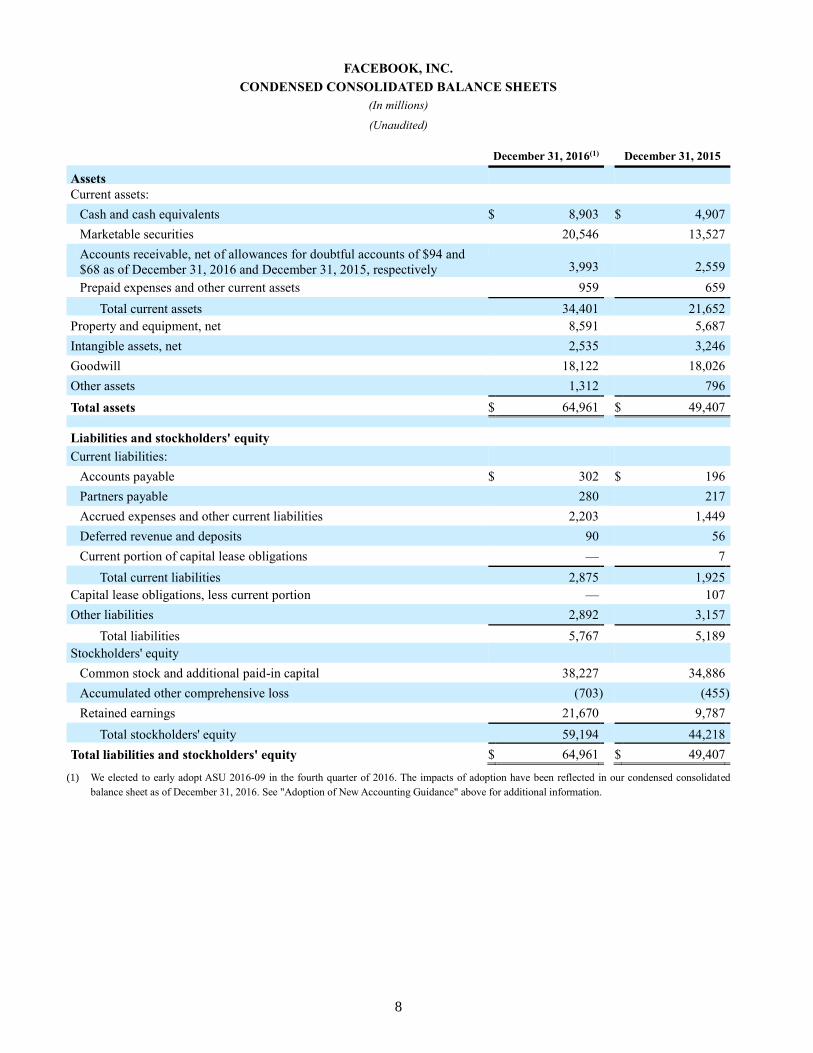
FACEBOOK, INC.
CONDENSED CONSOLIDATED BALANCE SHEETS
(In millions)
(Unaudited)
December 31, 2016(1) December 31, 2015
Assets
Current assets:
Cash and cash equivalents $ 8,903 $ 4,907
Marketable securities 20,546 13,527
Accounts receivable, net of allowances for doubtful accounts of $94 and
$68 as of December 31, 2016 and December 31, 2015, respectively 3,993
2,559
Prepaid expenses and other current assets 959 659
Total current assets 34,401 21,652
Property and equipment, net 8,591 5,687
Intangible assets, net 2,535 3,246
Goodwill 18,122 18,026
Other assets 1,312 796
Total assets $ 64,961 $ 49,407
Liabilities and stockholders' equity
Current liabilities:
Accounts payable $ 302 $ 196
Partners payable 280 217
Accrued expenses and other current liabilities 2,203 1,449
Deferred revenue and deposits 90 56
Current portion of capital lease obligations — 7
Total current liabilities 2,875 1,925
Capital lease obligations, less current portion — 107
Other liabilities 2,892 3,157
Total liabilities 5,767 5,189
Stockholders' equity
Common stock and additional paid-in capital 38,227 34,886
Accumulated other comprehensive loss (703 ) (455 )
Retained earnings 21,670 9,787
Total stockholders' equity 59,194 44,218
Total liabilities and stockholders' equity $ 64,961 $ 49,407
(1) We elected to early adopt ASU 2016-09 in the fourth quarter of 2016. The impacts of adoption have been reflected in our condensed consolidated
balance sheet as of December 31, 2016. See "Adoption of New Accounting Guidance" above for additional information.
9
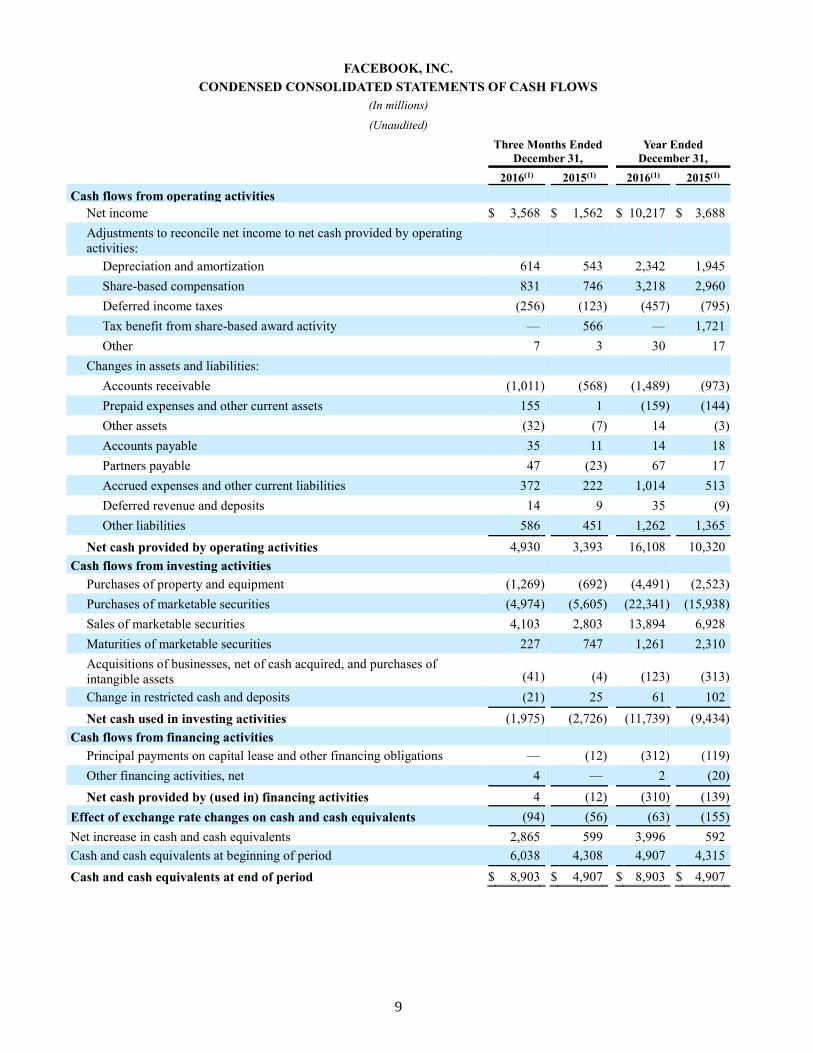
FACEBOOK, INC.
CONDENSED CONSOLIDATED STATEMENTS OF CASH FLOWS
(In millions)
(Unaudited)
Three Months Ended
December 31, Year Ended
December 31,
2016(1) 2015(1) 2016(1) 2015(1)
Cash flows from operating activities
Net income $ 3,568 $ 1,562 $ 10,217 $ 3,688
Adjustments to reconcile net income to net cash provided by operating
activities:
Depreciation and amortization 614 543 2,342 1,945
Share-based compensation 831 746 3,218 2,960
Deferred income taxes (256 ) (123 ) (457 ) (795 )
Tax benefit from share-based award activity — 566 — 1,721
Other 7 3 30 17
Changes in assets and liabilities:
Accounts receivable (1,011 ) (568 ) (1,489 ) (973 )
Prepaid expenses and other current assets 155 1 (159 ) (144 )
Other assets (32 ) (7 ) 14 (3 )
Accounts payable 35 11 14 18
Partners payable 47 (23 ) 67 17
Accrued expenses and other current liabilities 372 222 1,014 513
Deferred revenue and deposits 14 9 35 (9 )
Other liabilities 586 451 1,262 1,365
Net cash provided by operating activities 4,930 3,393 16,108 10,320
Cash flows from investing activities
Purchases of property and equipment (1,269 ) (692 ) (4,491 ) (2,523 )
Purchases of marketable securities (4,974 ) (5,605 ) (22,341 ) (15,938 )
Sales of marketable securities 4,103 2,803 13,894 6,928
Maturities of marketable securities 227 747 1,261 2,310
Acquisitions of businesses, net of cash acquired, and purchases of
intangible assets (41 ) (4 ) (123 ) (313 )
Change in restricted cash and deposits (21 ) 25 61 102
Net cash used in investing activities (1,975 ) (2,726 ) (11,739 ) (9,434 )
Cash flows from financing activities
Principal payments on capital lease and other financing obligations — (12 ) (312 ) (119 )
Other financing activities, net 4 — 2 (20 )
Net cash provided by (used in) financing activities 4 (12 ) (310 ) (139 )
Effect of exchange rate changes on cash and cash equivalents (94 ) (56 ) (63 ) (155 )
Net increase in cash and cash equivalents 2,865 599 3,996 592
Cash and cash equivalents at beginning of period 6,038 4,308 4,907 4,315
Cash and cash equivalents at end of period $ 8,903 $ 4,907 $ 8,903 $ 4,907
10
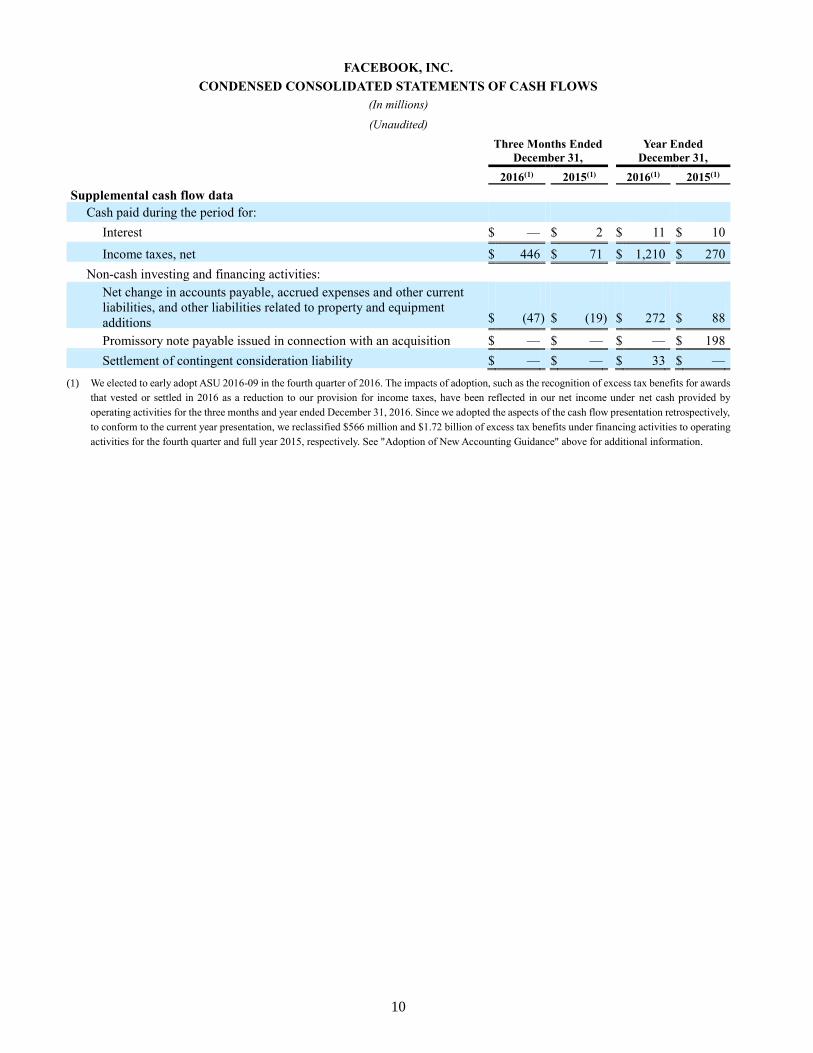
FACEBOOK, INC.
CONDENSED CONSOLIDATED STATEMENTS OF CASH FLOWS
(In millions)
(Unaudited)
Three Months Ended
December 31, Year Ended
December 31,
2016(1) 2015(1) 2016(1) 2015(1)
Supplemental cash flow data
Cash paid during the period for:
Interest $ — $ 2 $ 11 $ 10
Income taxes, net $ 446 $ 71 $ 1,210 $ 270
Non-cash investing and financing activities:
Net change in accounts payable, accrued expenses and other current
liabilities, and other liabilities related to property and equipment
additions $ (47 ) $ (19 ) $ 272
$ 88
Promissory note payable issued in connection with an acquisition $ — $ — $ — $ 198
Settlement of contingent consideration liability $ — $ — $ 33 $ —
(1) We elected to early adopt ASU 2016-09 in the fourth quarter of 2016. The impacts of adoption, such as the recognition of excess tax benefits for awards
that vested or settled in 2016 as a reduction to our provision for income taxes, have been reflected in our net income under net cash provided by
operating activities for the three months and year ended December 31, 2016. Since we adopted the aspects of the cash flow presentation retrospectively,
to conform to the current year presentation, we reclassified $566 million and $1.72 billion of excess tax benefits under financing activities to operating
activities for the fourth quarter and full year 2015, respectively. See "Adoption of New Accounting Guidance" above for additional information.
11
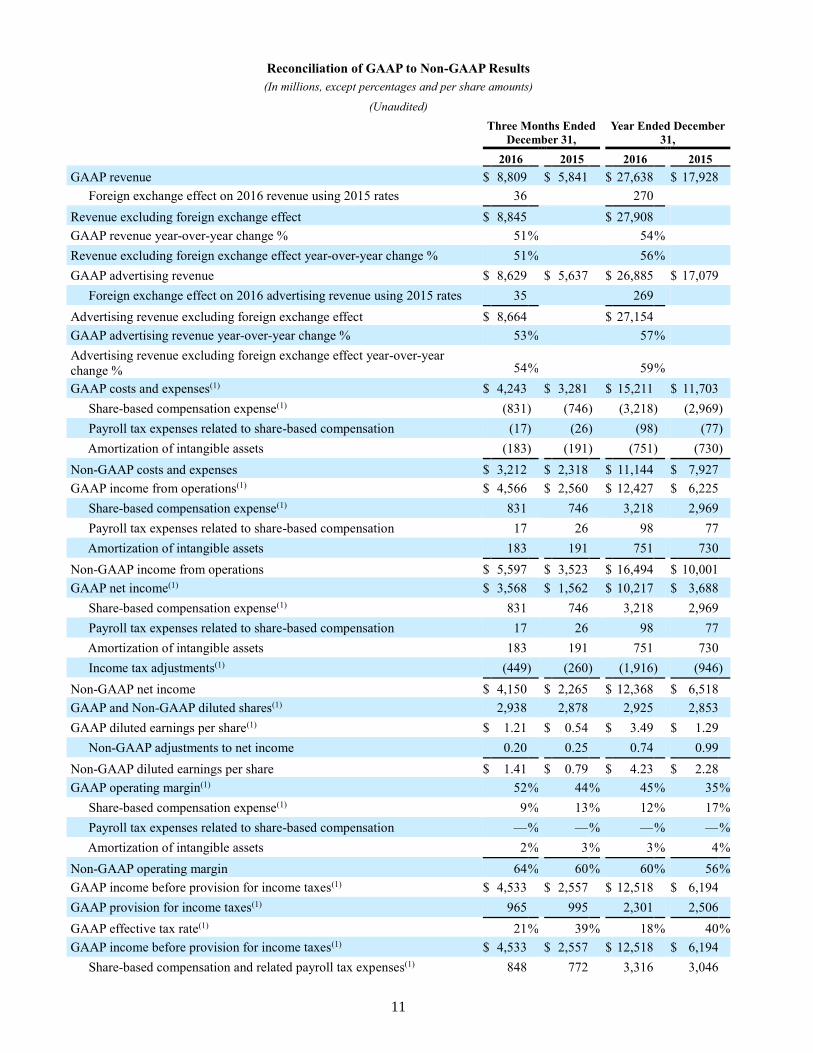
Reconciliation of GAAP to Non-GAAP Results
(In millions, except percentages and per share amounts)
(Unaudited)
Three Months Ended
December 31, Year Ended December
31,
2016 2015 2016 2015
GAAP revenue $ 8,809 $ 5,841 $ 27,638 $ 17,928
Foreign exchange effect on 2016 revenue using 2015 rates 36 270
Revenue excluding foreign exchange effect $ 8,845 $ 27,908
GAAP revenue year-over-year change % 51 % 54 %
Revenue excluding foreign exchange effect year-over-year change % 51 % 56 %
GAAP advertising revenue $ 8,629 $ 5,637 $ 26,885 $ 17,079
Foreign exchange effect on 2016 advertising revenue using 2015 rates 35 269
Advertising revenue excluding foreign exchange effect $ 8,664 $ 27,154
GAAP advertising revenue year-over-year change % 53 % 57 %
Advertising revenue excluding foreign exchange effect year-over-year
change % 54 % 59 %
GAAP costs and expenses(1) $ 4,243 $ 3,281 $ 15,211 $ 11,703
Share-based compensation expense(1) (831 ) (746 ) (3,218 ) (2,969 )
Payroll tax expenses related to share-based compensation (17 ) (26 ) (98 ) (77 )
Amortization of intangible assets (183 ) (191 ) (751 ) (730 )
Non-GAAP costs and expenses $ 3,212 $ 2,318 $ 11,144 $ 7,927
GAAP income from operations(1) $ 4,566 $ 2,560 $ 12,427 $ 6,225
Share-based compensation expense(1) 831 746 3,218 2,969
Payroll tax expenses related to share-based compensation 17 26 98 77
Amortization of intangible assets 183 191 751 730
Non-GAAP income from operations $ 5,597 $ 3,523 $ 16,494 $ 10,001
GAAP net income(1) $ 3,568 $ 1,562 $ 10,217 $ 3,688
Share-based compensation expense(1) 831 746 3,218 2,969
Payroll tax expenses related to share-based compensation 17 26 98 77
Amortization of intangible assets 183 191 751 730
Income tax adjustments(1) (449 ) (260 ) (1,916 ) (946 )
Non-GAAP net income $ 4,150 $ 2,265 $ 12,368 $ 6,518
GAAP and Non-GAAP diluted shares(1) 2,938 2,878 2,925 2,853
GAAP diluted earnings per share(1) $ 1.21 $ 0.54 $ 3.49 $ 1.29
Non-GAAP adjustments to net income 0.20 0.25 0.74 0.99
Non-GAAP diluted earnings per share $ 1.41 $ 0.79 $ 4.23 $ 2.28
GAAP operating margin(1) 52 % 44 % 45 % 35 %
Share-based compensation expense(1) 9 % 13 % 12 % 17 %
Payroll tax expenses related to share-based compensation — % — % — % — %
Amortization of intangible assets 2 % 3 % 3 % 4 %
Non-GAAP operating margin 64 % 60 % 60 % 56 %
GAAP income before provision for income taxes(1) $ 4,533 $ 2,557 $ 12,518 $ 6,194
GAAP provision for income taxes(1) 965 995 2,301 2,506
GAAP effective tax rate(1) 21 % 39 % 18 % 40 %
GAAP income before provision for income taxes(1) $ 4,533 $ 2,557 $ 12,518 $ 6,194
Share-based compensation and related payroll tax expenses(1) 848 772 3,316 3,046
12
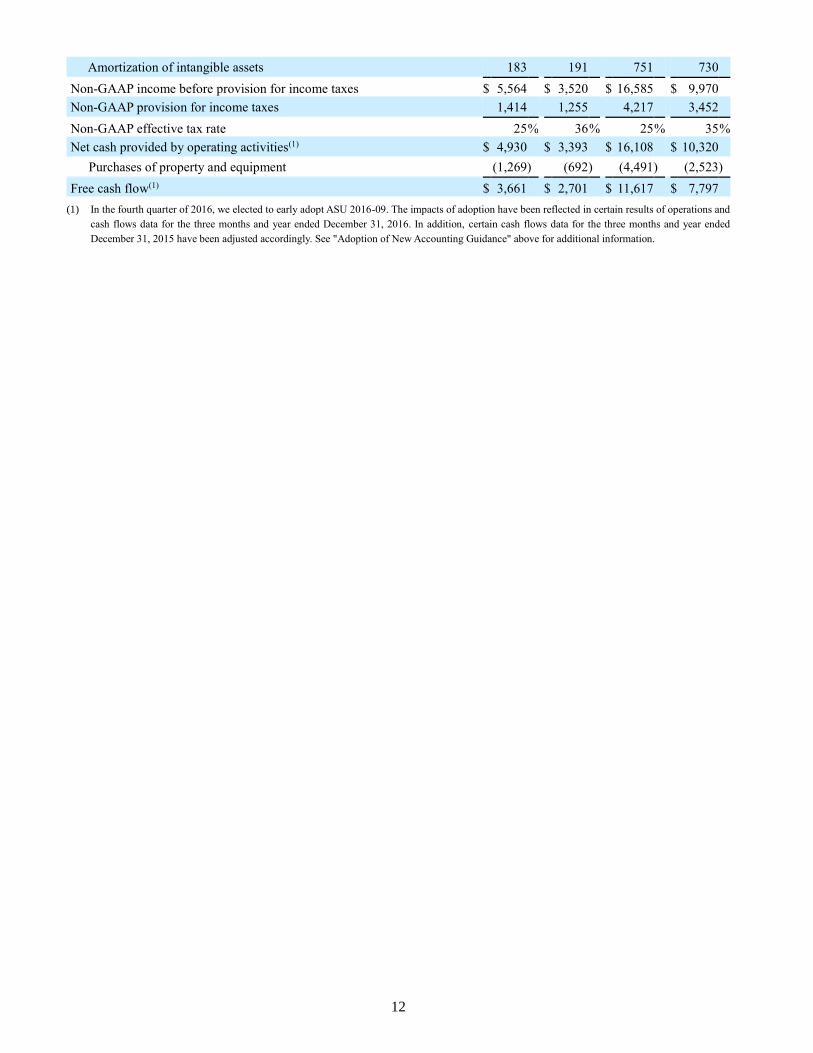
Amortization of intangible assets 183 191 751 730
Non-GAAP income before provision for income taxes $ 5,564 $ 3,520 $ 16,585 $ 9,970
Non-GAAP provision for income taxes 1,414 1,255 4,217 3,452
Non-GAAP effective tax rate 25 % 36 % 25 % 35 %
Net cash provided by operating activities(1) $ 4,930 $ 3,393 $ 16,108 $ 10,320
Purchases of property and equipment (1,269 ) (692 ) (4,491 ) (2,523 )
Free cash flow(1) $ 3,661 $ 2,701 $ 11,617 $ 7,797 (1) In the fourth quarter of 2016, we elected to early adopt ASU 2016-09. The impacts of adoption have been reflected in certain results of operations and
cash flows data for the three months and year ended December 31, 2016. In addition, certain cash flows data for the three months and year ended
December 31, 2015 have been adjusted accordingly. See "Adoption of New Accounting Guidance" above for additional information.


