

Factionalism _oil_Iran_FirstDraft.doc
This Version
02.03.09
Factionalism, oil and economic growth in Iran: where is the curse?
Mohammad Reza Farzanegana , Friedrich Schneiderb
Abstract
This study examines the common wisdom of “natural resource curse” in rentier economy of
Iran. Contrary to existing believe that higher oil rents are harmful for economic growth, we
instead show that increasing political factionalism in an oil economy is a curse for economic
growth. We find a dampening effect of higher symmetry of political power structure on
growth for the case of Iran. For the maximum level of factionalism, one standard deviation
increase in the share of oil rents in the government budget reduces real economic growth by
9% due to rent-seeking efforts.
JEL classification: N55; O13; Q33 Keyword: Natural resource curse; factionalism; rent-seeking; Iran
a Corresponding author: Dresden University of Technology, Department of Economics, Chair in Economics esp. Public Economics, D-01062 Dresden, Germany. Tel: 0049-351- 463-32895, Fax: 0049-351- 463-37052, Email: [email protected] (M.R.Farzanegan).
b Professor of Economics, Department of Economics, Johannes Kepler University of Linz, A-4040 Linz-Auhof, Austria. Tel: 0043-732-2468-8210, Fax: 0043-732-2468 -8209, Email: [email protected] (Dr. Dr.h.c.(mult.) Friedrich Schneider).

Factionalism, oil and economic growth in Iran: where is the curse?
Indeed, in Iran it is practically impossible to get
a clear answer to the simplest of questions:
Who is running this country?
Klein (2002)
1. Introduction
Political power struggles among reformers, conservatives and a dozens of other factions is a
main characteristic of Iran after the Islamic Revolution of 1979. Politicians like businessmen
want to maximize their profit. Oil rents in Iran are the major factor in the calculations of
political factions in their competition for executive power. The question which arises is to
what extent the political factions’ competition shapes the role of oil revenues in the context of
economic growth in Iran. We want to re-visit the natural resource curse hypothesis in a highly
politically factionalized country such as Iran.
Iranian political history observed a significant event in the 1979 when the autocracy of
Pahlavi changed to Islamic Republic. While, in the former system the Shah was the most
powerful and runner of the political and economic system, the later lacks such a dominance
group in its political life. Kenneth Pollack, former director of Persian Gulf affairs at the US
National Security Council, illustrates the situation in factionalized Islamic Republic as
follows: “ There are fourteen dozen different positions on each issue, and it is very difficult to
say with any certainty which of the insiders support which position” (see Klein, 2002). Such
factionalism, of course needs a certain degree of democracy which lacked in the autocracy
system of Pahlavi. The struggle for power is more sever when there is some improvement in
democracy indicators such as Polity for the case of Iran. A clear example is the period of
1997-2004 which associated with governance of reformists and improve of democracy indices
of Iran. Samii (2002) explains the factionalism as a common characteristic of contradictory
policies of the Iranian government. He illustrates the power struggle during presidency of
Khatami as follows: “ Indeed, it is not entirely inaccurate to look at domestic Iranian politics
as a competition between black-hatted hard-liners loyal to Supreme Leader and white hated
reformists loyal to Khatami. Both sides control specific assets, ministries…” . Contemporary
political economy history of Iran shows that economic system had performed superior during

strong autocracies. An example is Iran under Reza Shah from 1921-1940 and under
Mohammad Reza Shah from 1953-1979. Reza Shah carried out significant institutional
changes. The examples are modern army, introduction of new Civil Law and Penal Codes,
setting up an effective bureaucracy, establishment of the first modern university of Tehran
and improving significantly national security. Under his governance Iran succeeded to growth
relatively fast in the late 1930s compare to other countries. The Polity index of Iran for the
late 1930s was -8 which is indicator of nearly full dictatorships. Beginning of the Second
World War and presence of foreign troops in Iran from 1941-1946 forced Reza Shah to
departure from power. The lack of centralized political power provided an opportunity for
participation of different political factions and groups in the political process (Abrahamian,
1982). The political factionalism continued during the prime ministry of Mohammad
Mosadegh which forced the Mohammad Reza Shah to leave the country temporary. Political
instability and factionalism under Mosadegh which intensified by increasing tension with
West over nationalization of oil industry undermined the economic growth significantly. The
Polity index shows reduction of degree of autocracy over the 1940s and early 1950s.
However, the coup of 1953 putted an end on the factionalism and political competition for
power, bringing back a more powerful autocrat to the system. The Iranian economy observed
a persperous period over the period after coup. More specifically, the GDP per capital growth
rate increased at the exception rates of 8% per year from 1963-1976. The non-oil GDP per
capita growth was 8.6% per year (Esfahani and Pesaran, 2008). Esfahani and Pesaran discuss
that one of the main reasons behind this economic success was the concentration power in the
hands of Shah. This politically monopolized system implemented the constructive economic
polices such as the Second Seven Year Plan (1965-1962), limiting the power of landlords
(White Revolution), rapid industrialization and investments in human recourses. The Polity
index of Iran from 1955-1978 was -10, indicating maximum degree of autocracy. Figure 1
shows the trend of per capita GDP and polity index under Autocracy and Islamic Republic
regimes in Iran. The highest records of real per capita GDP and its growth rate observed under
the strong autocracy of Shah. Oil rents in all of these different polities existed and have had
played an important role in the economic system. However, the outcomes of system are
different. Rent-seeking efforts, especially in post-revolutionary factionalized system, have
eroded the effectiveness of oil revenues in economic growth process. Figure 2 also shows the
relative superior performance of autocracy in a term of industrialization and investment
compared to post-revolutionary factionalized system.

-12
-10
-8
-6
-4
-2
0
2
4
800
1,000
1,200
1,400
1,600
1,800
2,000
2,200
2,400
1965 1970 1975 1980 1985 1990 1995 2000 2005
POLITY2 GDPPC
polit
yPer capita G
DP (constant 2000 U
S$)
Figure 1. Per capita GDP of Iran under different polities (1965-2006)
Source: World Bank (2008), Marshall and Jaggers (2005). Growth rates are authors’ calculations using the geometric method.
-12
-10
-8
-6
-4
-2
0
2
4
0
10
20
30
40
50
60
70
80
1965 1970 1975 1980 1985 1990 1995 2000 2005
POLITY2Industry value added in GDPGross fixed capital formation in GDP
polit
y2%
of GD
P
Figure 2. Industry value added and fixed investment of Iran under different polities (1965-
2006).Source: World Bank (2008), Marshall and Jaggers (2005)
The major share of oil exports in total exports of Iran since mid 1970s has linked the fate
Iranian growth to highly volatile energy market. This is the Achilles' heel of political
Autocracy
Revolution &
war
Hashem
i Presidency
Khatam
i
5.41%
-5.35% 3.38%
3 %
Autocracy
Revolution
&w
ar
Hashem
i Presidency
Khatam
i
economy of Iran. What is less observed in empirical case studies of oil economies is
interaction of political power structure with oil rents. The political power structure and
competition of different political factions in a rentier economy1 is a critical issue on the
transformation of resource wealth to curse or blessing. This study focuses on the case of Iran
to investigate the role of natural resource wealth in economic growth, taking into
consideration the development of factionalism and political competition.
The Iranian political environments before and after the Islamic revolution and existence of
significant oil rents in both periods provide a unique opportunity to test Bjorvatn and Selvik
(2008) theoretical predictions empirically (see section 2). To our knowledge, this paper is the
first effort to re-examine the natural resource curse hypothesis taking into consideration the
political power structural changes.
The chapter is organized as follows. In section 2, we discuss the literature on economic
growth of countries under different political systems and natural resource dependency cases.
The main hypotheses, data, and empirical model are presented in section 3. Section 4 presents
the empirical results. Finally, section 5 concludes.
2. Review of literature
This study is related to two branches of researches in the literature. The first is those studies
which aim to analyze the economic growth under autocracy (dominance of one group) and
democracy. The second branch investigates the effects of dependency in natural resources on
the economic growth. The former raises this question that whether autocracies can perform
the more efficient policies to boost economic growth than democracies. This argument that
self-seeking governments which have monopolized corruption and rent-seeking are superior
to disorganized and factionalized polities is discussed by Tullock (1980:27) and Shleifer and
Vishny (1993). In a factionalized polity a person must bribe different groups and individuals
in different organizations to secure a contract or license. The corruption is not predictable in
such countries. Campos et al. (1999) showed that predictability of corruption which is a
characteristic of strong autocracies such a Mohammad Reza Shah in pre-revolution period of
Iran has a positive effect of flow of foreign direct investment. In a factionalized system which
might be just emerged from fall of an autocracy system (e.g. post-revolution of 1997 in Iran) 1 Rentier economies are those in which resource wealth provides a high proportion of government revenue; e.g. a high resource-to-revenue ratio (see Herb 2005:8). Not any kind of resource wealth makes such a rentier state. Usually, oil resource which are geographically concentrates and their extraction is highly capital-intensive and require complex and expensive technology, imposing sever barriers for entrance of private companies in this industry provides flow of rents to coffer of state.
each institution maximizes its revenue independently and extort the investors and
entrepreneurs. Such an independently excessive extortions in a factionalized system will
reduce productive activities and investment in system. In a strong autocracy, there is less, if
any, constraint on principal (e.g., Reza Shah from 1921-1940 and Mohammad Reza Shah
from 1953-1979). In contrast, in a republic system principal is more limited by various
institutions such as constitutions, independent judiciary system, media, private section,
political parties and factions and different lobbies. The principal may owe its existence to
strong lobbies and support of factions and specific layers of society. McChesney (1987: 102)
explains the situation of principal in a factionalized system: The principal is just a “passive
broker among competing private rent-seekers”. “Destructive competition” as mentioned by
Bjorvatn and Selvik (2008) among political factions and lobbies for having a share in
economic rents is costly. Organizing public campaigns, pressing principal through their
shadow institutions and para-government bodies are among such unproductive activities. As
Lambsdorff (2007:86) explains, these rent-seekers do not try to maximize the size of the cake
“but rather to battle for a larger slice of the given cake for oneself”. Increasing the dominance
of one group in the political system may reduce the aforementioned costs in a factionalized
system. Strong autocracy would limit the impact of political factions and lobbies on the
process of decision making. The goal of a strong kleptocrat is to maximize the size of cake
(e.g., economic growth) to have a larger share of its benefits. Therefore, it will oppose the
waste of scare resources by lobbyists and other rent-seekers. McChesney (1997: 153-155)
explains that” these regimes strive for income through extortion, but are able to levy the
burden equally on all private parties”. A strong ruler will monopolize the corruption,
controlling the petty corruption at the level of governmental organization. Rock (2008)
presents some stylized facts about experience of some countries under strong developmentally
oriented rulers compare to those with factionalized systems with more symmetric political
power structure is shown in Rock (2008). He mentions that since 1960, average of real GDP
per capita growth rates in Asia’s authoritarian regimes have been significantly higher (4.6%
p.a.) than in its democratic regimes (3.3% p.a.). Furthermore, South Asian’s long-standing
democracies (such as India and Sri Lanka) have grown much less (2.8% per capita per
year)and had less investment levels (21.3% of GDP)than East Asia strong authoritarian
regimes . The latter group had a growth rate of 5.9% in per capita GDP and investment level
of 31.9% of GDP. He further shows that the annual per capita GDP growth of Indonesia and
Pakistan fell from 4.4% to 2.6% in the former and from 5.9% to 2.6% in the latter during the
rule of democratic ( or more symmetric political power structure) system.

The second branch of literature examines the role of natural resource dependency on
economic growth. The disappointing performance of resource rich economies (especially
point resource such as oil) is resulted to popularity of natural resource curse hypothesis. The
resource curse literature is about the puzzling role of natural resources in economic growth. It
is a common wisdom that those countries rich in natural resources, especially oil, are
suffering from lower economic growth compared to those which do not have such resources
(see Sachs and Warner, 2001). The question is what really causes such disappointing results
from richness in natural resources? Do oil revenues and resources by themselves hinder
economic growth? After all, there is a lack of a globally accepted theory for the natural
resource curse (Sachs and Warner, 2001). The blessing and the curse of oil wealth needs to
be analyzed in a realistic and at the same time practical approach. “To an optimist, the
possession of oil reserves is an unqualified blessing. To a pessimistic, the possession of oil is
a predictable curse. To a realist, oil, as anything else in life, can be blessing or curse, it all
depends what is done with it” (Askari, 2006:8). What is done with oil should be traced
through political economy of oil exporting countries. Indeed, the resource curse puzzle might
be a misleading concept if we take into consideration the political structure of oil economies.
Political factionalism in young and fragile democracies and rent-seeking efforts of these
factions in oil rich economies might be a key for “resource curse” black box.
Recently economists have paid more attention to interactions of institutions with resource
wealth in their analysis of natural resource curse. Most of these studies are cross-country
analyses (e.g., Boschini et al., 2007; Mehlum et al., 2006; Brunnschweiler and Bulte, 2008;
and Iimi, 2007). However, how these institutions influence the relationship between natural
resources and growth is country specific (Bjorvatn and Selvik, 2008). After all, oil rich
economies vary considerably in terms of their institutions, political economy structure,
demographic and social norms which make it difficult to address in cross-country analyses.2
There is another group of economists who undermine the natural resource curse hypothesis
(e.g., Davis, 1995; Manzano and Rigobon, 2001). Manzano and Rigobon re-examined the
period analysis of Sachs and Warner (1997), controlling for indebtedness. The resource curse
2 The approach of this paper is in line with a collection of case studies in Rodrik (2007), shedding light on the
critical role of factionalism for economic growth by studying country specific experiences. “I believe in the need
for both cross-country regressions and detailed country studies. Any cross-country regression giving results that
are not validated by case studies needs to be regarded with suspicion...” (Rodrik, 2007:4).

(lower growth) disappeared. They discussed that the poor performance of resource dependent
economies is less likely because of resource curse but of “debt-overhang”. Davis (1995)
compared the 22 resource rich economies with other resource poor countries during 1970-
1990. He found that the former group was at a higher average level of development than the
latter group over this period. He concluded that the resource curse, if anything, is an exception
rather than a rule. It seems that to be a natural resource rich economy per se does not imply a
slower economic growth.
The theoretical model of Bjorvatn and Selvik (2008) which explains the role of political
power distribution and factionalism on oil-growth nexus has inspired the empirical strategy of
our paper. Their theoretical model predicts that resources are wasted during competition for
rents and the structure of political system or factionalism affects significantly the allocation of
oil rents among entrepreneurs. Indeed, in their model the combination of political power
structure and oil rents is critical for explaining growth. They conclude that given high level of
oil rents, increasing dominance of one political group reduces the welfare loss. This is
because of fall of rent-seeking intensity with asymmetry in political power. Thus, according to
them, higher political competition which reduces dominance of one group in politics of a
rentier economy is not an optimum. They emphasize on the lack of state autonomy after
Islamic Revolution of 1979, in contrast to autocracy of Mohammad Reza Shah, intensified
rent-seeking among different political factions. Such destructive completions for oil rents
have transformed the oil wealth to curse in Iran. They conclude that to improve the economic
performance of Iran, it is necessary to move toward a more autonomous state. Our empirical
study provides some evidence for their theoretical predictions.
3. Empirical model and data
The main hypothesis of this study is that the “oil resources revenues” have a direct positive
effect on economic growth (in contrast to resource curse hypothesis).3 However, the
interaction of political competition and factionalism with oil rents has a negative effect on
economic growth. The final impact of oil rents, therefore, varies with changes in political
factionalism. These hypotheses will be tested by using different factionalism and oil
dependency and abundance variables.
3 The positive role of natural resources in economic growth is discussed by Habakkuk (1962). According to him, one of the main reasons behind the surpassing of England by the United States in the 19th century was the greater natural resource endowment.

3.1. Econometric specification
Following Boschini et al. (2007), the basic specification for our econometric analysis is:
tε)tFactNR(3βtFac2βtNR1βtXαtGrowth +×+++′= (1)
where Growth is the real per capita GDP growth rate, X is a standard vector of control
variables including investment as a ratio of real GDP (Inv_gdp), changes in oil prices (Oil_g;
as a proxy for changes in terms of trade), inflation rate (Inf; as a measure of macroeconomic
instability), real government consumption as a ratio of real GDP (Govex_gdp; a proxy for size
of government distortions in the economy), real per capita GDP growth rate of OECD
countries (OECD_GDPPCG; a proxy for external demand of Iran major trade partners), a
dummy variable for Iran-Iraq war (Wardummy; for period of 1980-1988), and the lag of
dependent variable (Pcgdp_g (-1); to control for the dynamic path of economic growth)4. NR
is a natural resource abundance and dependence.5 The main proxies for oil dependency in this
study are share of oil revenues in total revenues of government (oilrev_trev), share of oil
exports in total exports (oilex_tex), and oil value added in total GDP (oilgdp_tgdp). The proxy
for oil abundance is per capita daily oil production (pcoil_produc). The Fac variable refers to
factionalism and degree of political groups’ competition. NRt×Fact is an interaction term of
oil dependence and /or abundance variable with index of factionalism and ε is the error term
which is assumed to be independent from other regressors.
The model will be estimated with dynamic Ordinary Least Squares (DOLS) and 2SLS
methods. The marginal impact of a unit increase in the oil rent variable on economic growth is
β1+β3Democ. The natural resource curse hypothesis claims that the sign of β1 is negative
(assuming factionalism index zero). Based on theoretical predictions of Bjorvatn and Selvik
(2008), the sign of β3 should be negative. This means that increasing political competition or
factionalism (increasing Fac) and oil rents lead to “destructive competition” and intensive
4 According to Sachs and Warner (2001), it might be difficult to observe the omitted variable affecting growth. Thus, they suggest as a solution, one should control for pervious growth rates in regressions. Based on them, the lagged growth rates would be correlated with the omitted variables and therefore being a proxy for them, too.
5 Besides oil production per capita, we can use oil reserves per capita as a measure of oil abundance. There two measures capture exogenous oil wealth. We use oil production because of its availability for a longer period. Oil dependency, on the other side, captures materialized rents in the government budget. Political factions are more interested in these more tangible rents rather than oil reserves or production.

rent-seeking. Thus, the final effect of oil rents on growth is conditional on the level of
factionalism.
The expected effects of control variables are straightforward. Share of real investment in real
GDP in neoclassical growth model is indicator of saving rates. A higher level of this ratio,
therefore, has a positive effect of growth. Larger size of government consumption in the
economy expected to crowed-out private investment and increases regulatory burden. This
argument is more significant considering the role of state in the Iranian economy. Thus, it
should have a negative effect on growth. Improving terms of trade (export prices/import
prices) which is proxied by growth rate of oil prices is expected to have positive effects on
growth. Since the major export of Iran is oil and refinery products, therefore, this variable is a
valid indicator in fluctuations of terms of trade. We also expect that higher growth in major
trading partners of Iran (OECD region) influence positively economic growth of Iran.
In summary the main hypotheses are as follows:
H1: The direct effect of oil revenues on the real growth rate of Iranian economy is positive,
ceteris paribus.
H2: The final (overall) effect of oil revenues on the real growth rate of Iranian economy
depends on degree of political factionalism and competition. Higher symmetry of political
power (i.e. higher factionalism or lower degree of dominance of one group) besides higher oil
rents has a negative effect on real growth rates. Table 1 shows the hypothesized effects of
independent variables on the real per capita GDP growth rate of the Iranian economy.
Table 1 Hypothesized effects of independent variables Independent variable Expected sign
Natural resource (NR) proxies:
Oil exports / total exports +
Oil revenues / total revenues +
Oil GDP / total GDP +
Per capita oil production per
day
+
Factionalism variables
Van_index +/-
Van_comp +/-
Van_part +/-

Polity +/-
Fac × NR -
Investment /GDP (Inv_gdp) +
Gov_expenditure/ GDP
(Govex_gdp)
-
Inflation (inf) -
Oil price growth (oil_g) +
OECD_gdppcg +
Wardummy -
Lag of dependent var
(Rgdp_g(-1))
+
3.2. Measuring factionalism
Factionalism is not directly observable. Zariski (1960: 33) defined faction as “ any intra-party
combination, clique, or grouping whose members share a sense of common identity and
common purpose and are organized to act collectively – as a distinct bloc within the party –
to achieve their goals”. Beller and Belloni (1978: 419) defined factions as “any relatively
organized group that exists within the context of some other group and which (as a political
faction) competes with rivals for power advantages within the larger group of which it is a
part”. Basedau and Köllner (2005) summarized the main characteristics of political factions.
According to them, faction is any intra-party grouping which exists for a certain period of
time, have an organization, shares common goals and pursuing them actively. Factionalism is
a post-revolutionary characteristic of political economy of Iran.
There are some quantified indices which we can use as proxies for factionalism. We consider
the following variables as indicators of factionalism in Iran:
• Polity2 (Marshall and Jaggers, 2005): Factionalism requires a certain degree of
democracy in a society to emerge. In an autocracy with a strong ruler, there would be
less opportunity, if any, for creation of political factions and parties.6 Polity measures
the level of democracy as a pre-requisite for factionalism. Polity2 scores are between
6 Currently, there are 240 legal political groups, communities, and factions in Iran (see Iranian Ministry of Interior list of political groups, communities or factions at: http://www.moi.ir/Portal/File/ShowFile.aspx?ID=10446318-e7d0-436c-8e57-18dc55b5245d ).

-10 and +10. A +10 refers to “strongly democratic” state and -10 to “strongly
autocratic”. We use this measure as a proxy of factionalism development. There is
another sub-index in polity which measures more directly degree of factionalism
(PARCOMP). However, there is missing information on this variable for some years
of study. This latter variable, however, has a high correlation with polity2.7
• Van_index: This index combines two basic dimensions of democracy – competition
and participation – measured as the percentage of votes not cast for the largest party
(Competition) times the percentage of the population who actually voted in the
election (Participation). This product is divided by 100 to form an index that in
principle could vary from 0 (no democracy) to 100 (full democracy). Higher levels of
this index reflect more competition of factions within political power and participation
of their supporters. This index seems to show better the (a)symmetric degree of
political power.
• Van_comp: This variable portrays the electoral success of smaller parties, that is, the
percentage of votes gained by the smaller parties in parliamentary and/or presidential
elections. The variable is calculated by subtracting from 100 the percentage of votes
won by the largest party (the party which wins most votes) in parliamentary elections
or by the party of the successful candidate in presidential elections. The variable thus
theoretically ranges from 0 (only one party received 100 % of votes) to 100 (each
voter cast a vote for a distinct party).
• Van_part: The percentage of the total population who actually voted in the election.
The group of Van indicators introduced by Vanhanen (2000).
More details on variables and sources are presented in Appendix A. Table 2 shows the
correlation among different proxies of factionalism.
Table 2 Correlation Matrix van_comp van_index van_part polity2 Correlation van_comp 1.000 .939 .581 .665 van_index .939 1.000 .756 .812 van_part .581 .756 1.000 .856 polity2 .665 .812 .856 1.000
7 PARCOMP is Competitiveness of Participation. It is coded as 1 (repressed), 2 (suppressed), 3 (factional), 4 (transitional) and 5 (competitive). Iran under Mohammad Reza Shah, except for period of Mossadegh state, was coded as 1. In the years after revolution was coded 2, except for 1997-2003 which was 3 (factional).

4. Empirical results
The first step before running regressions is checking the time-series properties of the variables
in the model. The most common unit-root tests, namely an augmented Dickey-Fuller (ADF)
and Phipps-Perron (PP) tests have been used. The results show that except for inflation (inf),
growth rate of GDP per capita (pcgdp_g), and growth rate of oil prices (oil_g), and growth
rate of OECD per capita GDP (OECD_gdppcg) which are stationary at level, the other
variables are I (1). Thus, they are entered into regression models after taking the first
difference.8
In order to examine the effects of different natural resource abundance and dependence
variables on the Iranian economic growth and role of factionalism, we set up a dynamic
ordinary least squares (DOLS). In this framework, it is also possible that factionalism and
natural resource related variables affected by economic growth. Thus, the independent
variables may be contemporaneously correlated with error term. To address this problem, we
use 1 to 4 years lags of independent variables as instruments. Usually, there is no significant
correlation between lagged variables and disturbance. Furthermore, there can be another
concern about effect of “oil-rent” specific variables and factionalism which in turn influence
economic growth. In this case, we have still a correct model but it may not be efficient
specification. We can show that this issue is a not a source of concern for our case. The
correlation between “oil-rent” dependency and abundance variables and factionalism
variables are not statistically different from zero.
Tables 3 and 4 show the direct and indirect effects of “oil dependency and abundance” on real
economic growth.9 We have separated these tables by using different natural resource
variables in order to provide more insight on specific differences in interaction of factionalism
(competition) with resource rents.
As it is evident in Tables 3 and 4, even after controlling for the most important variables in
growth literature and interaction effects, we cannot identify a direct negative effect from
higher oil-rents on the economic growth of Iran. The oil rent by itself is not a curse for the 8 Unit-root tests are available upon request.
9 Our main oil dependency variable in this study is Oilrev_trev. The share of oil rents in the annual government budgets is the most relevant variable for study of conditional effects of oil revenues on growth. However, we have presented the results on the basis of other two indicators of oil dependency (e.g., Oil GDP/ GDP and Oil exports / exports). The positive and significant direct effect of oil rent variable on growth remains, however, the negative interaction effects are hardly statistically significant (results are available but not reported here). As we mentioned, for political factions, tangible variable is the amount of petrodollars in the state budget.

economy, but a blessing. It provides necessary resources for financing the process of
economic growth.10 The direct positive effect of natural resource abundance and dependence
variables on real growth rates of Iranian economy undermines the common wisdom of
resource curse which is demonstrated in the cross-country analyses. Nevertheless, the final
effect of oil dependency and abundance depends on the changes of factionalism indicators.
The negative and significant sign of interaction terms (β3) in most specifications show that
increasing political competition and struggle of political groups for power besides increasing
oil rents reduces economic growth. Rent-seeking efforts and directly unproductive activities
aim to capture a part of oil revenues increases inefficiency and consequently waste scarce
resources of economy. It seems at least in short term young democracies which have a fragile
and factional nature in a renteir economy are destructive for the growth. Of course, this
observation does not undermine the long run benefits of higher democracy. The main puzzle
is how a government in an oil economy should manage the transit path from a fragile and
factional democracy to an established one by minimizing the negative side effects on the
economy.
The effects of other control variables are consistent with our expectations and economic
theory. The share of investment in GDP has a positive, significant and stable effect on growth
over different specifications. Larger size of government consumptions in GDP has a negative
and significant effect on growth in most specification, especially in TSLS estimations.
Inflation as an indicator of macroeconomic instability has a statistically significant and
negative effects on growth. The lagged of growth has positive effect on current growth but it
is not statistically significant in most specification. It seems that its effects are reduced by
contribution of other main control variables. Oil price growth rate has positive and significant
effects on growth when we use oil abundance variable. It seems that growth rate of OECD
economies has no significant effect on the Iranian economy, when we control for other
variables. This might be due to lower degree of integration of the Iranian economy in the
global markets. In order to control for the effects of eight years war with Iraq on growth rates,
we included a dummy variable. The effect of war dummy is significantly negative in all
specifications. The Ramsey test indicates that we have not serious problem with omitted
variable bias in most specification. Also based on LM test we can accept that our main
findings are immune against the possible autocorrelation of residuals. The R-squared criteria
10 This positive effect of oil rent is also illustrated by Elhiraika and Hamed (2007) for the case of United Arab Emirate.
shows that a significant portion of changes in the real economic growth of Iran can be
explained by included explanatory variables in specifications.
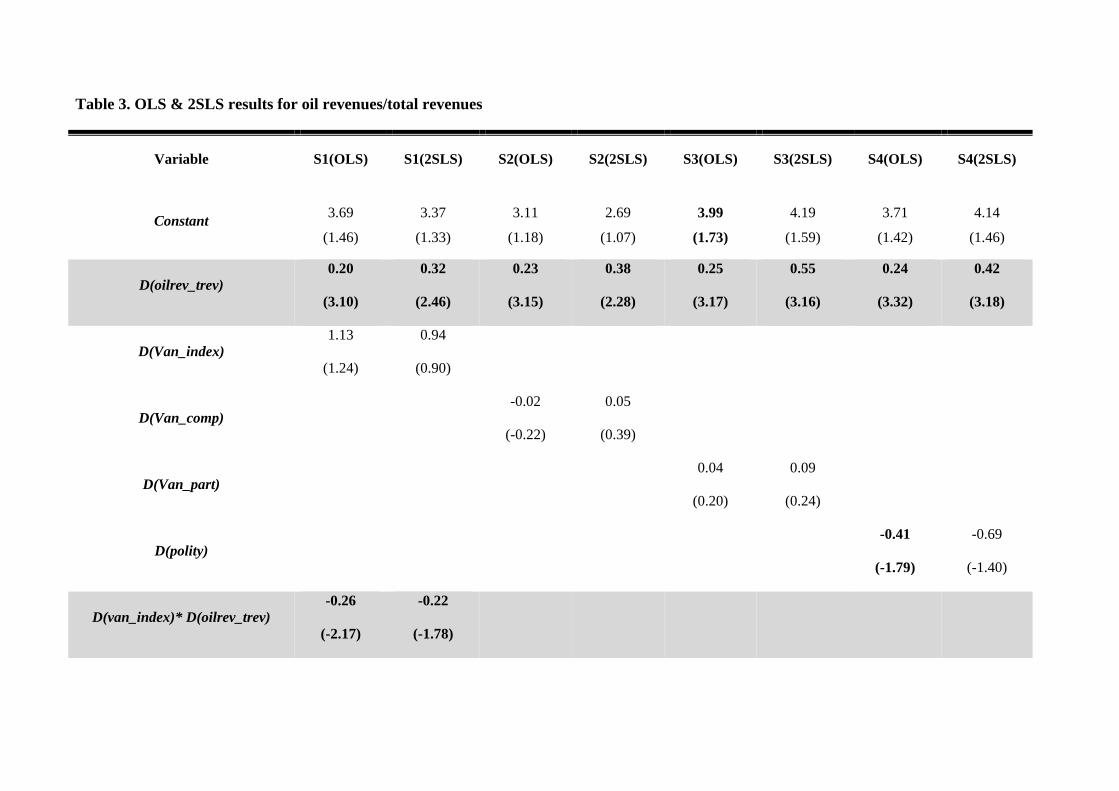
Table 3. OLS & 2SLS results for oil revenues/total revenues
Variable S1(OLS) S1(2SLS) S2(OLS) S2(2SLS) S3(OLS) S3(2SLS) S4(OLS) S4(2SLS)
Constant 3.69
(1.46)
3.37
(1.33)
3.11
(1.18)
2.69
(1.07)
3.99
(1.73)
4.19
(1.59)
3.71
(1.42)
4.14
(1.46)
D(oilrev_trev) 0.20
(3.10)
0.32
(2.46)
0.23
(3.15)
0.38
(2.28)
0.25
(3.17)
0.55
(3.16)
0.24
(3.32)
0.42
(3.18)
D(Van_index) 1.13
(1.24)
0.94
(0.90)
D(Van_comp) -0.02
(-0.22)
0.05
(0.39)
D(Van_part) 0.04
(0.20)
0.09
(0.24)
D(polity) -0.41
(-1.79)
-0.69
(-1.40)
D(van_index)* D(oilrev_trev) -0.26
(-2.17)
-0.22
(-1.78)
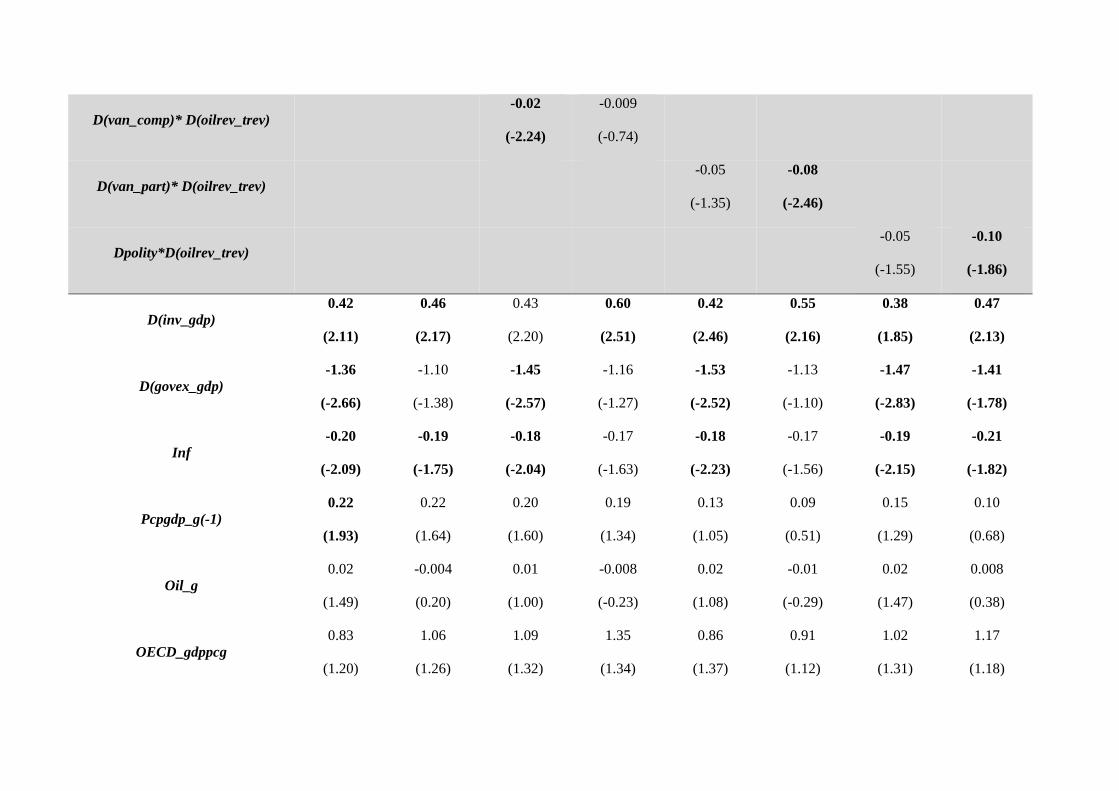
D(van_comp)* D(oilrev_trev) -0.02
(-2.24)
-0.009
(-0.74)
D(van_part)* D(oilrev_trev) -0.05
(-1.35)
-0.08
(-2.46)
Dpolity*D(oilrev_trev) -0.05
(-1.55)
-0.10
(-1.86)
D(inv_gdp) 0.42
(2.11)
0.46
(2.17)
0.43
(2.20)
0.60
(2.51)
0.42
(2.46)
0.55
(2.16)
0.38
(1.85)
0.47
(2.13)
D(govex_gdp) -1.36
(-2.66)
-1.10
(-1.38)
-1.45
(-2.57)
-1.16
(-1.27)
-1.53
(-2.52)
-1.13
(-1.10)
-1.47
(-2.83)
-1.41
(-1.78)
Inf -0.20
(-2.09)
-0.19
(-1.75)
-0.18
(-2.04)
-0.17
(-1.63)
-0.18
(-2.23)
-0.17
(-1.56)
-0.19
(-2.15)
-0.21
(-1.82)
Pcpgdp_g(-1) 0.22
(1.93)
0.22
(1.64)
0.20
(1.60)
0.19
(1.34)
0.13
(1.05)
0.09
(0.51)
0.15
(1.29)
0.10
(0.68)
Oil_g 0.02
(1.49)
-0.004
(0.20)
0.01
(1.00)
-0.008
(-0.23)
0.02
(1.08)
-0.01
(-0.29)
0.02
(1.47)
0.008
(0.38)
OECD_gdppcg 0.83
(1.20)
1.06
(1.26)
1.09
(1.32)
1.35
(1.34)
0.86
(1.37)
0.91
(1.12)
1.02
(1.31)
1.17
(1.18)

Wardummy -4.03
(-1.84)
-4.09
(-1.58)
-5.77
(-2.65)
-5.50
(-1.88)
-6.54
(-4.30)
-5.91
(-2.45)
-6.69
(-3.92)
-6.81
(-2.50)
R2 0.71 0.70 0.68 0.65 0.69 0.59 0.69 0.62
F 7.60 6.34 6.60 5.17 6.74 5.23 6.81 5.48
LM 0.45 0.10 0.47 0.04 0.06 0.009 0.13 0.005
RESET 0.74 0.66 0.97 0.45 0.70 0.99 0.93 0.49
Obs (after adjustments) 41 37 41 37 41 37 41 37
Dependent variable: real per capita GDP growth rate. Period: 1959-2007 (effective sample: 1968-2004); t value within () brackets; Newey-West HAC standard errors &
covariance, LM is Breusch-Godfrey Serial Correlation LM Test (F form, p-value for OLS & Obs*R2, p-value for TSLS) which shows the probability of null hypothesis (no auto-
correlation in residuals) acceptance (p-values larger than 0.05 means acceptance of null hypothesis); RESET is Ramsey test (using powers of the independent variables) for
omitted variables. The p-value of RESET tests the H0: model has no omitted variables (p-values larger than 0.05 means acceptance of null hypothesis (model has no omitted
variables). Instruments consist of 1-4 years lagged values of “oil dependency”, different factionalism proxies, government expenditures /GDP, investment/GDP, and interactions
terms, as well as 2 year lagged values of inflation and oil price growth rate.

Table 4. OLS & 2SLS results for per capita daily oil production
Variable S5(OLS) S5(2SLS) S6(OLS) S6(2SLS) S7(OLS) S7(2SLS) S8(OLS) S8(2SLS)
Constant 3.10
(1.80)
3.40
(1.95)
2.84
(1.59)
3.28
(1.92)
3.57
(2.25)
3.84
(2.14)
2.91
(1.73)
2.69
(1.36)
D(pcoil_produc) 337.8
(6.77)
381.7
(6.70)
384.04
(5.04)
393.7
(5.71)
319.2
(7.97)
321.7
(5.90)
352.4
(5.99)
447.8
(6.31)
D(Van_index) -0.02
(-0.06)
-0.29
(-0.42)
D(Van_comp) -0.06
(-0.80)
-0.14
(-0.95)
D(Van_part) -0.06
(-0.56)
0.26
(0.56)
D(polity) -0.06
(-0.30)
-0.47
(-1.10)
D(van_index)*D(pcoil_produc) -38.77
(-3.28)
-49.26
(-3.13)

D(van_comp)*D(pcoil_produc) -11.31
(-2.60)
-13.22
(-2.71)
D(van_part)*D(pcoil_produc) -12.56
(-3.71)
-7.40
(-0.74)
Dpolity*D(pcoil_produc) -26.7
(-3.09)
-50.6
(-2.64)
D(inv_gdp) 0.60
(4.84)
0.69
(4.69)
0.60
(4.20)
0.56
(2.92)
0.57
(5.78)
0.59
(5.06)
0.59
(5.26)
0.66
(3.51)
D(govex_gdp) -0.36
(-1.03)
-0.70
(-1.26)
-0.38
(-1.05)
-0.71
(-1.24)
-0.51
(-1.43)
-1.32
(-3.11)
-0.28
(-0.81)
-0.42
(-0.49)
Inf -0.08
(-1.37)
-0.09
(-1.42)
-0.07
(-1.33)
-0.10
(-1.69)
-0.09
(-1.77)
-0.12
(-2.14)
-0.07
(-1.33)
-0.06
(-0.88)
Pcpgdp_g(-1) 0.07
(0.96)
0.02
(0.23)
0.07
(0.96)
0.03
(0.30)
0.05
(0.65)
0.02
(0.24)
0.07
(0.95)
0.06
(0.79)
Oil_g 0.02
(3.73)
0,.03
(2.65)
0.02
(3.38)
0.03
(2.41)
0.03
(3.94)
0.04
(4.20)
0.02
(3.44)
0.01
(0.99)
OECD_gdppcg 0.18
(0.36)
0.27
(0.45)
0.30
(0.58)
0.41
(0.65)
0.13
(0.28)
0.30
(0.54)
0.19
(0.40)
0.14
(0.24)

Wardummy -4.10
(-2.89)
-4.56
(-3.13)
-4.64
(-3.20)
-5.30
(-3.17)
-4.31
(-3.39)
-4.98
(-3.88)
-4.33
(-3.16)
-4.02
(-3.08)
R2 0.82 0.81 0.81 0.81 0.82 0.79 0.82 0.77
F 14.66 13.24 14.14 12.77 14.59 11.73 14.66 11
LM 0.11 0.08 0.15 0.23 0.12 0.08 0.08 0.008
RESET 0.23 0.37 0.04 0.20 0.49 0.47 0.12 0.86
Obs (after adjustments) 43 40 43 40 43 40 43 40
Dependent variable: real per capita GDP growth rate. Period: 1959-2007 (effective sample: 1965-2004); t value within () brackets; Newey-West HAC standard errors &
covariance; LM is Breusch-Godfrey Serial Correlation LM Test (F form, p-value for OLS & Obs*R2, p-value for TSLS) which shows the probability of null hypothesis (no auto-
correlation in residuals) acceptance (p-values larger than 0.05 means acceptance of null hypothesis); RESET is Ramsey test (using powers of the independent variables) for
omitted variables. The p-value of RESET tests the H0: model has no omitted variables (p-values larger than 0.05 means acceptance of null hypothesis (model has no omitted
variables). Instruments consist of 1- 4 years lagged values of “oil abundance”, different factionalism proxies, government expenditures /GDP, investment/GDP, and interactions
terms, as well as 2 year lagged values of inflation and oil price growth rate.

Since natural resource dependence variables have different unit of measurement (%) than
natural resource abundance variable (per capita daily production of oil), comparing their
direct and indirect effects may not be very precise. To get a better picture of the size and
interpretation of effects, we calculate the marginal effects of one standard deviation increase
in related natural resource variable at different levels of related factionalism variables on the
real per capita GDP growth. For illustration, we use coefficients in Tables 3 and 4 for
Van_index variable (S1 (2SLS), and S5 (2SLS)). Using Eq. 2, we calculate these marginal
effects.
stdNR)index_Van(pcg_gdp 31 ×+= ββ∆ (2)
where gdp_pcg is the real per capita GDP growth rate, Van_index is maximum, minimum and
mean value of index of factionalism of Vanhanen, and stdNR is a standard deviation change in
different proxies of natural resource abundance (per capital daily oil production) and
dependence (share of oil revenues in total revenues of government). Table 5 presents effect of
a one standard deviation increases in the two natural resource variables, taking into
consideration maximum, minimum and mean value of van_index on real GDP per capita
growth rate.
Table 5 Marginal effects of oil rents on growth (at different levels of political factionalism) D(Oilrev_Trev) D(pcoil_produc)
Mean d(van_index) 2.68 3.78
Maximum d(van_index) -8.98 0.81
Minimum d(van_index) 8.22 5.19
Table 5 shows that increase of one standard deviation in the share of oil revenues in total
revenues of government (oilrev_trev) has a significant dampening effect on the real growth
when we have the maximum level of political factionalism (d(van_index)). In other words,
ceteris paribus, with a maximum level of political factionalism; Iranian real per capital

income growth rate decreases by about -9 11 percent if the shares of oil revenues in total
revenues of state increases by a one standard deviation. By having the minimum level of
political factionalism or higher dominance of one political group, Iranian real per capita
income growth rate increases by about 8 percent, if oilrev_trev increases by a one standard
deviation. This result supports our initial hypothesis, asserting that factionalism and reduction
of dominance of one political group intensifies rent-seeking for oil rents in the government
budget. The share of oil revenues in total revenues of government in annual budgets shows
exactly the available oil rents for political groups. On the other hand, per capita daily oil
production, more or less, shows the abundance of oil resources. Yet we see that by maximum
level of political factionalism, the positive effects of oil abundance on growth are significantly
lower than minimum level of factionalism option. However, it is still positive. In other words,
by having a maximum political factionalism, Iranian real per capita income growth rate
increases just by 0.81 percent, if daily oil production per capita increases by a one standard
deviation. Such a low positive effect could be changed to a more significant rise of about 5
percent if we were in the minimum level of political factionalism (or higher levels of
asymmetry in political power).
5. Conclusion
This paper re-examine the common wisdom of natural resource curse, using Iranian economy
as a case study. The paper discussed that oil rents are not de facto harmful for the economy.
What is detrimental is “destructive competition” within political power structure for these
rents. The pre-revolution monopolized rent-seeking were more growth friendly than the post-
revolution factionalized rent-seeking. Controlling for indirect effects of oil rent on economic
growth through changes of political competition, we conclude that higher levels of symmetry
in political system and bolder competition of different political factions reduce the positive
effects of oil wealth on growth. Balance of power or lack of dominant political group may
foster rent-seeking activities. Thus, the more appropriate political system for the case of Iran
as an oil economy is an autonomous one. Our findings are robust after controlling for possible
endogeneity. The empirical results of this study are in line with Bjorvatn and Selvik (2008)
theoretical predictions.
11 For example, this figure is obtained through specification 1(2SLS) of Table 3: (0.32-0.22*6.1)*8.79= -8.98.

Appendix A
Data description and sources
Variable Description Source
Growth Real per capita GDP growth rate % Central Bank of Iran (2008)
Oilex_tex Share of oil exports in total exports (oil
dependency)
CBI (2008)
Oilrev_trev Share of oil revenues in total revenues of
government (oil dependency)
CBI (2008)
OilGDP_tgdp Share of oil group value added in real GDP CBI (2008)
PCoil_produc Per capita daily oil production (oil
abundance)
EIA (http://www.eia.doe.gov/)
Polity2 Polity2 index, -10: fully non-democratic, 10:
fully democratic
Marshall and Jaggers (2005)
Van_index Index of democracy Vanhanen (2000)
Van_comp Index of political competition Vanhanen (2000)
Van_part Index of participation in elections by people Vanhanen (2000)
Inv_gdp Share of real investment in real GDP CBI (2008)
Govex_gdp Share of real government expenditures in real
GDP
CBI (2008)
Inf CPI inflation CBI (2008)
Oil_g Growth rate of global average oil prices IFS IMF online database
Pcgdp_g (-1) Lag of per capita GDP growth rate
OECD_gdppcg Real growth rate of OECD per capita GDP World Bank (2008)
Wardummy Dummy variable for Iraq-Iran war 1=1980-1988; otherwise 0
References
Abrahamian,E., 1982. Iran Between Two Revolutions. Princeton University Press, Princeton.
Askari, H., 2006. Middle East Oil Exporters: What Happened to Economic Development?
Edward Elgar, Cheltenham.
Basedau, M., Köllner, P., 2005. Factionalism in political parties: an analytical framework for
comparative studies. Working Paper No.12, German Overseas Institute (DÜI),
Hamburg.
Beller, D., Belloni, F., 1978. Party and faction: modes of political competition, in: Belloni, F.,
Beller, D. (Eds.), Factions Politics: Political Parties and Factionalism in
Comparative Perspective. ABC CLIO, Santa Barbara, CA, pp. 417-450.
Bjorvatn, K., Selvik, K., 2008. Destructive competition: factionalism and rent-seeking in Iran.
World Development 36(11), 2314-2324.
Boschini, A.D., Pettersson, J., Roine, J., 2007. Resource curse or not: a question of
appropriability. Scandinavian Journal of Economics 109(3), 593-617.
Brunnschweiler, C.N., Bulte E.H., 2008. The resource curse revisited and revised: A tale of
paradoxes and red herrings. Journal of Environmental Economics and Management
55 (3), 248-264.
Campos,J.E., Lien, D., Pradhan, S., 1999. The impact of corruption on investment: predictability
matters. World Development 27, 1059-1067.
Central Bank of Iran, 2008. The first edition of the CBI time series economic database.
Available at: http://tsd.cbi.ir/IntTSD/EnDisplay/Display.aspx (Access: 06.02.09).
Davis, G., 1995. Learning to love the Dutch disease: evidence from the mineral economies.
World Development 23(1), 1765-1779.

Elhiraika, A.B., Hamed, A.H., 2007. Explaining growth in an oil-dependent economy: the
case of the United Arab Emirates. In: Nugent, J.B., Pesaran, H., (Eds), Explaining
growth in the Middle East. Elsevier, Amsterdam, pp.359-383.
Esfahani, H., Pesaran, H., 2008. Iranian economy in the twentieth century: a global
perspective. CWPE Working Paper No.0815, Cambridge.
Habakkuk, H. J., 1962. American and British technology in the nineteenth century.
Cambridge University Press, Cambridge, MA.
Herb, M., 2005. No taxation without representation? Rents, development and democracy.
Comparative Politics 37 (3), 297-317.
Iimi, A., 2007. Escaping from the resource curse: evidence from Botswana and the rest of the
world. IMF Staff Papers 54(4), 663-699.
IMF, 2009. International Financial Statistics Online Database. Available at:
http://www.imfstatistics.org/
Klein, J. 2002. Shadow Land. New Yorker. (18 February 2002)
Lambsdorff, J.G., 2007. The Institutional Economics of Corruption and Reform Theory, Evidence,
and Policy. Cambridge University Press, Cambridge.
Manzano, O., Rigobon, R., 2001. Resource curse or debt-overhang? NBER Working Paper
No.8390. Cambridge, MA.
Marshall, M.G., Jaggers. K., 2005. Polity IV Project: Political Regime Characteristics and
Transactions, 1800–2002. University of Maryland.
McChesney, F.S., 1987. Rent extraction and rent creation in the economic theory of regulation.
Journal of Legal Studies 16, 101-118.
Mehlum, H., Moene, K. and Torvik, R., 2006. Institutions and resource curse. Economic
Journal 116 (508), 1-20.
Rock, M.T., 2008. Has democracy slowed growth in Asia? World Development.
DOI:10.1016/j.worlddev.2008.09.002
Rodrik, D., 2007. One Economics, Many Recipes: Globalization, Institutions, and Economic
Growth. Princeton University Press, Princeton NJ.
Sachs, J.D., Warner, A.M., 1997. Fundamental sources of long- run growth. American
Economic Review 87(2), 184-188.
Sachs, J.D. and Warner, A.M., 2001. The curse of natural resources. European Economic
Review 45 (4-6), 827-838.
Shleifer, A., Vishny, R.W., 1993. Corruption. The Quarterly Journal of Economics 108, 599-617.
Tullock, G.,1980. Rent Seeking as a Negative-Sum Game, in: Buchanan,J.M.,
Tollison,R.D., Tullock, G. (Eds.). Toward a Theory of the Rent-Seeking Society.
Texas A&M University Press, pp.16-36.
Vanhanen, T., 2000. A new dataset for measuring democracy, 1810-1998. Journal of Peace
Research 37 (2), 251-265.
World Bank, 2008. World development indicators CD-Rom.
Zariski, R., 1960. Party factions and comparative politics: some preliminary observations.
Midwest Journal of Political Science 4, 26-51.


