

By MANGABA DARLINGTON ARNOLD
Volume 23, 2016 ISSN (Print & Online): 2307-4531
© IJSBAR THESIS PUBLICATION
www.gssrr.org
Factors Affecting Effective Selection of Teachers for Promotion to
Management Positions in the Education System:
A Case Study of Mazabuka District.

IJSBAR research papers are currently indexed by:
© IJSBAR THESIS PUBLICATION www.gssrr.org
Copyright © 2016 by MANGABA DARLINGTON ARNOLD
All rights reserved. No part of this thesis may be produced or transmitted in any form or by any
means without written permission of the author. ISSN(online & Print) 2307-4531
The IJSBAR is published and hosted by the Global Society of Scientific Research and Researchers (GSSRR).
Factors Affecting Effective Selection of Teachers for Promotion to Management Positions in the
Education System: A Case Study of Mazabuka District.

FACTORS AFFECTING EFFECTIVE SELECTION OF TEACHERS FOR PROMOTION TO
MANAGEMENT POSITIONS IN THE EDUCATION SYSTEM:
A CASE STUDY OF MAZABUKA DISTRICT.
By
MANGABA DARLINGTON ARNOLD
(Cert. Ed., B.Ed. Agric.)
Information and Communications University
April 2016

FACTORS AFFECTING EFFECTIVE SELECTION OF TEACHERS FOR PROMOTION TO
MANAGEMENT POSITIONS IN THE EDUCATION SYSTEM:
A CASE STUDY OF MAZABUKA DISTRICT.
By
MANGABA DARLINGTON ARNOLD
A Research Proposal Submitted to the School of Education in Partial Fulfilment of the
Requirement for the Contemporary Issues in Education Course.
Information and Communications University
i
Declaration
I, Darlington Arnold Mangaba, hereby declare that the work presented herein is my own and that
it has never been presented for any academic award, either in part or as a whole. However, where
works of others have been included in this compilation, appropriate acknowledgement has been
made.
……………………………………………….
MANGABA DARLINGTON ARNOLD

ii
Certification of the Research Project
We, the undersigned, hereby certify that Darlington Arnold Mangaba, candidate for a Master
of Science in Agriculture with Education, has presented before us a research thesis in
Contemporary Issues in Education with the title:
FACTORS AFFECTING EFFECTIVE RECRUITMENT, SELECTION AND APPOINTMENT
OF STAFF FOR PROMOTION IN THE EDUCATION SYSTEM:
A CASE STUDY OF MAZABUKA DISTRICT.
We further confirm that the research was accepted both in form and content and that the
researcher demonstrated satisfactory knowledge of the subject under investigation.
SUPERVISORS:
MS. K. CHIPUTA ……………………………………….. Date ………………………
MR. W. PHIRI ……………………………………….. Date ………………………
iii
Dedication
This thesis is dedicated to my late wife, Freyness Mwaayo Mangaba, for her distinct faith,
support, encouragement and sacrifice, without which this work would not have been a success.

iv
Acknowledgement
A project of this nature and magnitude is impossible without the intellectual, editorial and
practical assistance from other people. As a result, I would like to take this opportunity to
acknowledge the input of the following people: Ms. Kalinda Chiputa, Lecturer in the School of
Education at Information and Communications University and Mr. William Phiri, Lecturer and
Coordinator of the School of Education at Information and Communications University for their
invaluable guidance and supervision. I further extend my gratitude to Mr. Mweemba Hibajene,
Dean of the School of Education at Rusangu University for intellectual contribution and Ms.
Betty Chipopa, Teacher of Languages and Literature at Nega-nega Secondary School for proof-
reading this work.

v
Operational definitions of terms
Recruitment – the process of attracting sufficient and suitable potential candidates
for vacant positions in the organisation.
Selection – the process of identifying the most suitable candidates that meet
the requirements for the vacant positions in the organisation.
Appointment – the confirmation of offer of a position or job to a deserving
candidate that has duly met the requirements of the job position as
justified by the authorities responsible for filling up the vacant
position.
Promotion – an advancement to a more senior job or a higher rank, grade, or
position
Assumption – belief or opinion.
Stakeholders – people involved in some operations/operating authorities.
Respondents – people providing feedback to the questions asked.

vi
Abbreviations or Acronyms
CSO - Central Statistical Office.
GDP - Gross Domestic Product.
ICT - Information Communications Technology.
EMIS - Education Management Information System.
IRMT - International Records Management Trust.
UNIP - United National Independence Party.
CMI - Chr. Michelsen Institute.
CMO - Charter Management Organisation.
DEO - District Education Office.
AF - Achievement First.
UNESCO - United Nations Educational, Scientific and Cultural Organisation.

vii
Organisation of the study
The study was organised into six chapters as follows;
Chapter One - Presentation of the research proposal.
Chapter Two - Review of literate in the related areas.
Chapter Three - Presentation of the study methodology.
Chapter Four - Gives the presentation of the study findings and their
interpretation.
Chapter Five - Presents the discussion of the study findings and
their applicability.
Chapter Six - Presents the conclusion and recommendations of the study.

viii
List of Tables
Table 4.1 Demographic Characteristics of the Respondents 23
Table 4.2.1 Database and Website Use 24
Table 4.2.2 Types of Systems used to Submit and Store Staff Data/Records 25
Table 4.4.6 Reasons for Promoting Incompetent Teachers to Administrative Positions 32
Table 4.4.8 All eligible Teachers Apply for Advertised Positions/Promotion 33
Table 4.5.1 Chi Square Test of Association 34
Table 4.5.2 Regression Test 35
Table 4.5.3 T-Test 36
Table 4.5.4 Chi Square Test of Association 37
Table 4.5.5 Chi Square Test of Association 38
Table 4.5.6 Regression Test 39
Table 4.5.7 Regression Test 40
Table 4.5.8 Chi Square Test of Association 41
Table 4.5.9 Chi Square Test of Association 42
Table 4.5.10 Chi Square Test of Association 43
Table 4.5.11 Chi Square Test of Association 44
Table 4.5.12 Regression Test 45
Table 4.5.13 Regression Test 46
Table 4.5.14 Regression Test 47
Table 4.5.15 Regression Test 48
Table 4.5.16 T-Test 49
Table 4.5.17 T-Test 50
Table 4.5.18 T-Test 51
Table 4.5.19 T-Test 52

ix
List of Charts
Chart 4.2.3 Updating of Teacher Qualifications 25
Chart 4.2.4 Contact Details of Teachers 26
Chart 4.3.1 Modes of Communication used in the District 27
Chart 4.4.1 Effectiveness of Dissemination of Vacancy Advertisements 29
Chart 4.4.2 Rising of Teachers to Management Positions 30

x
Abstract
There is no doubt that education is an important sector in the development of any economy.
Education is one of the most powerful instruments for reducing poverty and inequality (World
Bank, 2011). The Education sector’s contribution to the growth and development of the economy
is however difficult to measure because it is immaterial and non-quantitative.
Despite the education sector’s vivid contribution to the national development, serious concerns
exist regarding the various lapses in the sector. Of great concern is the inadequate adoption and
utilisation of Information and Communications Technology, which seems to be hampering
efficiency in most management processes.
The study purported to establish the causes of and solutions to ineffective promotion procedures
in the education sector. The major focus having been put on the evaluation of the effects of the
lack or underutilisation of effective information management and information communications
systems. The focus also extended to addressing the impact of corruption in the processes of
recruiting, selecting and appointing staff for promotion.
The study employed a quantitative survey design approach. The findings of the study indicated
that ineffective data capturing, poor record management and storage, ineffective communication,
as well as corruption are detrimental to staff promotion hence hindering sound school
management and the quality of education in the final end.
In anticipation of achieving an effective staff promotion process, the government ought to
consider reinitiating and fully supporting the provision of cost effective information management
and communications infrastructure and facilities, streamline the staff promotion policy
framework that will take care of political interference in the Public Administration and foster
transparency and accountability.

xi
Contents Declaration ................................................................................................................................... i
Certification of the Research Project .......................................................................................... ii
Dedication .................................................................................................................................. iii
Acknowledgement ...................................................................................................................... iv
Operational definitions of terms .................................................................................................. v
Abbreviations or Acronyms ....................................................................................................... vi
Organisation of the study .......................................................................................................... vii
List of Tables ............................................................................................................................ viii
List of Charts .............................................................................................................................. ix
Abstract ....................................................................................................................................... x
CHAPTER ONE ......................................................................................................................... 1
1.0 INTRODUCTION............................................................................................................ 1
1.1 Background ........................................................................................................................... 1
1.2 Problem statement ................................................................................................................. 4
1.3 Objectives .............................................................................................................................. 4
1.3.1 General Objective: ............................................................................................................. 4
1.3.2 Specific Objectives: ........................................................................................................... 4
1.4 Research Questions .......................................................................................................... 4
1.5 Justification of the Study ....................................................................................................... 5
1.6 Assumptions of the study ...................................................................................................... 5
CHAPTER TWO ........................................................................................................................ 7
2.0 LITERATURE REVIEW...................................................................................................... 7
2.1 Introduction ........................................................................................................................... 7
2.2 Definition and Scope of Recruitment, Selection and Appointment of Staff ......................... 7
2.3 Global Perspective of Recruitment, Selection and Appointment of Staff ............................ 8
2.4 Zambian Perspective of Recruitment, Selection and Appointment of Staff ....................... 10
2.5 Comparative Studies ........................................................................................................... 12
2.6 Personal Critique ................................................................................................................. 15
2.7 Establishment of the Gap .................................................................................................... 15

xii
2.8 Conceptual Framework ....................................................................................................... 16
2.9 Theoretical Framework ....................................................................................................... 17
CHAPTER THREE ................................................................................................................... 19
3.0 METHODOLOGY .............................................................................................................. 19
3.1 Introduction ......................................................................................................................... 19
3.2 Research Site: Description of the Research Area ............................................................... 19
3.3 Research Design .................................................................................................................. 19
3.4 Target Population ........................................................................................................... 19
3.5 Sample Size .................................................................................................................... 20
3.6 Sampling Procedures ...................................................................................................... 20
3.7 Data Collection Instruments ................................................................................................ 21
3.8 Validation of the Data Collection Instruments .................................................................... 21
3.9 Data Collection Procedures ................................................................................................. 21
3.10 Data Analysis .................................................................................................................... 21
3.11 Triangulation ..................................................................................................................... 21
3.12 Ethical Considerations ...................................................................................................... 21
3.13 Limitations of the Study .................................................................................................... 22
CHAPTER FOUR ..................................................................................................................... 23
4.0 STUDY FINDINGS ............................................................................................................ 23
4.1 Demographic Characteristics of the Respondents ............................................................... 23
Table 4.1 Demographic Characteristics of the Respondents ............................................... 23
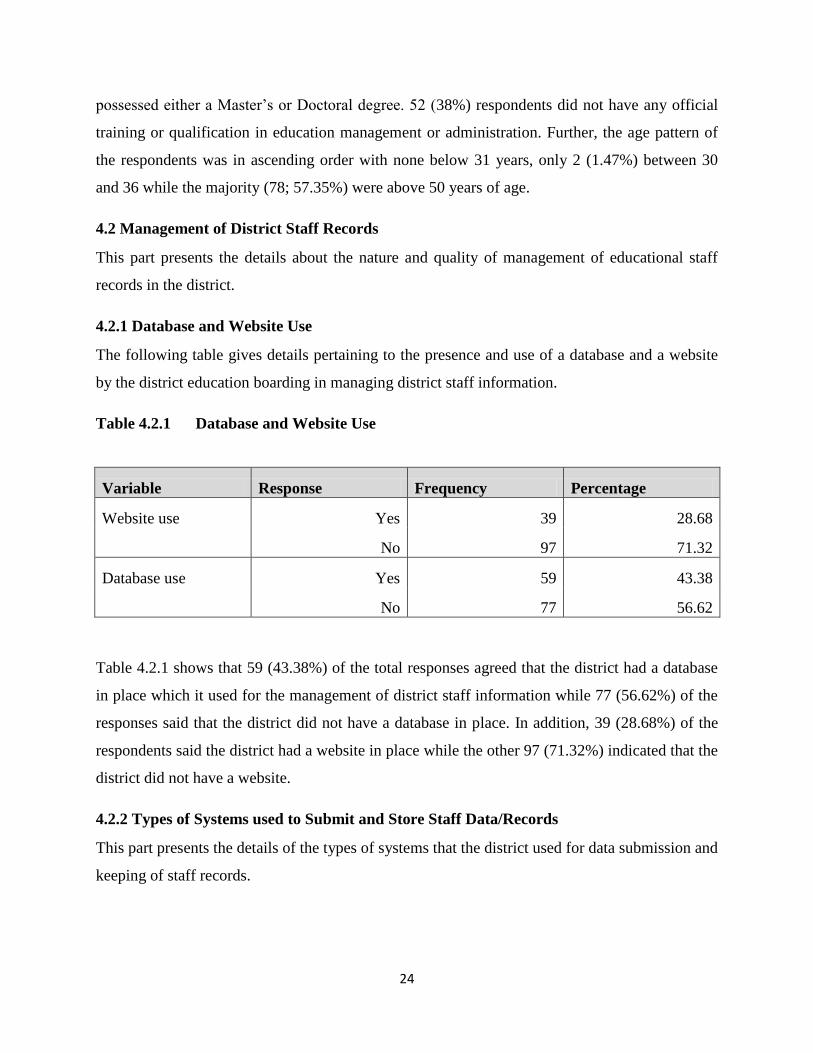
4.2 Management of District Staff Records ................................................................................ 24
4.2.1 Database and Website Use ............................................................................................... 24
Table 4.2.1 Database and Website Use ............................................................................. 24
4.2.2 Types of Systems used to Submit and Store Staff Data/Records..................................... 24
Table 4.2.2 Types of Systems used to Submit and Store Staff Data/Records .................... 25
4.2.3 Updating of Teacher Qualifications ................................................................................. 25
Chart 4.2.3 Updating of Teacher Qualifications ................................................................ 25
4.2.4 Contact Details of Teachers ............................................................................................. 26
Chart 4.2.4 Contact Details of Teachers ............................................................................. 26

xiii
4.2.5 Updating of Information Management System and Teacher Records ............................. 27
4.3 District Information Communication System ..................................................................... 27
4.3.1 Modes of Communication used in the District ................................................................ 27
Chart 4.3.1 Modes of Communication used in the District ....................................................... 27
4.3.2 Effectiveness of Information Communicated through Head Teachers ............................ 28
4.3.3 Complaints about the Effectiveness of Advertisement Messages .................................... 28
4.4 District Staff Promotion Procedures ................................................................................... 28
4.4.1 Effectiveness of the dissemination of the Vacancy Advertisement ................................. 29
Chart 4.4.1 Effectiveness of Dissemination of the Vacancy Advertisements .................... 29
4.4.2 Rising of Teachers to Administrative/Management Positions ......................................... 29
Chart 4.4.2 Rising of Teachers to Administrative/Management Positions ........................ 30
4.4.3 Existence of Corruption in the Promotion Process .......................................................... 30
4.4.4 Reliability of the Selection/Promotion Procedures .......................................................... 31
4.4.5 Reasons for Promoting Incompetent Teachers to Administrative Positions .................... 31
4.4.6 All eligible Teachers Apply for Advertised Positions/Promotion ................................... 32
Table 4.4.6 Do all eligible Teachers Apply for Advertised Positions/Promotion? ............ 32
4.4.7 Reasons Why not All Eligible Teachers Apply for Promotion ........................................ 32
4.4.8 Reliability of the Selection/Promotion Procedures .......................................................... 32
Table 4.4.8 Reliability of the Selection/Promotion Procedures ........................................ 33
4.5 Statistical Tests for the Hypotheses .................................................................................... 34
Table 4.5.1 Chi Square Test of Association ....................................................................... 34
4.5.2 Regression Test ................................................................................................................ 35
Table 4.5.2 Regression Test ............................................................................................... 35
4.5.3 T-Test ............................................................................................................................... 36
Table 4.5.3 T-Test .............................................................................................................. 36
4.5.4 Chi Square Test of Association ........................................................................................ 37
Table 4.5.4 Chi Square Test of Association ....................................................................... 37
4.5.5 Chi Square Test of Association ........................................................................................ 38
Table 4.5.5 Chi Square Test of Association ....................................................................... 38
4.5.6 Regression Test ................................................................................................................ 39

xiv
Table 4.5.6 Regression Test ............................................................................................... 39
4.5.7 Regression Test ................................................................................................................ 40
Table 4.5.7 Regression Test ............................................................................................... 40
4.5.8 Chi Square Test of Association ........................................................................................ 41
Table 4.5.8 Chi Square Test of Association ....................................................................... 41
4.5.9 Chi Square Test of Association ........................................................................................ 42
Table 4.5.9 Chi Square Test of Association ....................................................................... 42
4.5.10 Chi Square Test of Association ...................................................................................... 43
Table 4.5.10 Chi Square Test of Association ....................................................................... 43
4.5.11 Chi Square Test of Association ...................................................................................... 44
Table 4.5.11 Chi Square Test of Association ....................................................................... 44
4.5.12 Regression Test .............................................................................................................. 45
Table 4.5.12 Regression Test ............................................................................................... 45
4.5.13 Regression Test .............................................................................................................. 46
Table 4.5.13 Regression Test ............................................................................................... 46
4.5.14 Regression Test .............................................................................................................. 47
Table 4.5.14 Regression Test ............................................................................................... 47
4.5.15 Regression Test .............................................................................................................. 48
Table 4.5.15 Regression Test ............................................................................................... 48
4.5.16 T-Test ............................................................................................................................. 49
Table 4.5.16 T-Test .............................................................................................................. 49
4.5.17 T-Test ............................................................................................................................. 50
Table 4.5.17 T-Test .............................................................................................................. 50
4.5.18 T-Test ............................................................................................................................. 51
Table 4.5.18 T-Test .............................................................................................................. 51
4.5.19 T-Test ............................................................................................................................. 52
Table 4.5.19 T-Test .............................................................................................................. 52
CHAPTER FIVE ....................................................................................................................... 53
5.0 DISCUSSION ..................................................................................................................... 53
xv
CHAPTER SIX ......................................................................................................................... 58
6.0 CONCLUSION AND RECOMMENDATIONS ................................................................ 58
6.1 Conclusion........................................................................................................................... 58
6.2 Recommendations ............................................................................................................... 58
References ................................................................................................................................. 60
Appendix 1: Questionnaire ....................................................................................................... 62

1
CHAPTER ONE
1.0 INTRODUCTION
1.1 Background
Education is one of the most powerful instruments for reducing poverty and inequality (World
Bank, 2011). Education is equally a key factor to enhancing Zambia’s competitiveness in the
global economy. Therefore, ensuring access to quality education for all, in particular for the poor
and rural population, is central to the economic and socio-cultural development of Zambia. The
Education sector’s contribution to the growth and development of the economy is however
difficult to measure because it is immaterial and non-quantitative. Education forms the backbone
for every society. This has been recognised by the subsequent Zambian governments and indeed
huge investments have been made in the educational sector by the Zambian government and
other organisations (Sikazwe et’ al., 2003).
Since the establishment of the third republic of Zambia, the Zambian economy has been
liberalized, which also had an effect on the educational sector. Private organizations, individuals,
religious bodies and local communities were vested with the right to establish and control their
own schools and educational institutions. This has contributed to the expansion of educational
opportunities. However issues of quality of education being provided from these many varied
institutions are a source of concern and challenge to the sector. Even with liberalization, the
education sector is greatly influenced and to some extent regulated by the National Education
Policy. The Ministry of Education, being the major participant in the provision of education, has
been eager to respond to the challenges of the need to increase access to education, improve
quality and efficiency of education, ensure equity and equality of education provision and to
provide relevant education via curriculum change. The quality of education has taken shape from
the calibre of the professionals put in charge of the management of education in schools. The
selection and appointment of such professionals determines the ultimate ‘shape’ of the education
being provided. The staff appointed on merit usually perform better with high self-confidence
and self-esteem.
There are policies aimed at attracting and retaining effective teachers, recruiting competent
people into the profession, and providing support and incentives for professional development

2
and on-going high performance (Sikazwe et’ al., 2003). Despite the existence of such policies,
the system has been corrupted and there have been several appointments made on the basis of
nepotism and other biased preferences. Corruption in the education system can take several faces
such as bribes paid by parents to teachers to ensure good examination results, bribes paid by
teachers to public officials to get preferred posting and promotion. In the past years, most
promotions in the teaching fraternity were made on tribal and nepotistic lines (Phiri, 2013).
We are currently living in a world which is totally networked with communication. With the
advent of fast technology, the world has become a global village. The sharing of information
among various groups in society at national and international levels has become very smooth,
effective and efficient. It is just impossible to think of a world or situation where there is no
exchange of ideas, feelings, emotions, reactions, propositions, facts, and figures. From time
immemorial, communication has been one of the most important activities of the human lives.
For a well-coordinated series of activities, success has been owing to the quality of information
management and communication systems employed. The integration of the world economy has
been made possible with strong and efficient channels of communication. The nature of
communication has undergone significant changes during the past few years. Now the economic
power lies in the hands of the countries having very sound information technology networks.
Communication is important from the point of view of understanding it in terms of a process,
system, interactional base and structuring. There are various objectives of communication in
business organisations. Prudence, coordination and enhanced economic, social, political and
cultural growth are all products of good information systems. If the intended massage does not
get to the right person, in the right format, then this could affect the entire organisation. Worse
still, the wrong messages might be passed on to the wrong people. This could actually harm the
organisation (Shariq, 2014).
The Ministry of Education has been active in the implementation of Information and
Communications Technology in a bid to facilitate the development of reliable ‘information
banks’, quick and accurate access and retrieval of information, fast and accurate communication
and good information utilisation. To this effect, most of the offices in the Ministry of Education
have been equipped with computers and an intensive programme has started in computer
literacy. Having established an Education Management Information System (EMIS), the

3
Ministry of Education has now embarked on training school managers in methods of how best to
make use the technology. The aim is to have computers and their use aid managers in making
management decisions. Schools, districts and regional offices ought to start to use computers to
store useful information and data for future use. Given the fact that data and information
management has remained perhaps the weakest link in the Ministry of Education, Education
Management Information System (EMIS) is expected to bring about profound changes and
improvements in the way information is stored, managed and used. Effective use of data and
information at middle and lower levels is of absolute necessity. Through a carefully controlled
programme, schools and managers in the education system will be trained to improve not just the
management of their institutions but make informed decisions based on the available information
and what they are able to access on-line from other regions (Sikazwe et’ al., 2003).
Between January and March, 2007, the Government of Zambia had introduced major reforms in
the public sector, including a computerised human resource and payroll system. The system was
intended to introduce better control of the establishment, improve information handling,
eliminate the loss of vital information and improve work flow. However, paper-based record
systems still needed to be enhanced, and strategies for managing electronic records and digital
information needed to be developed, to strengthen data quality, ensure that important evidence
was preserved and support transparency in government (IRMT, 2007).
Recruitment and selection policies in local authorities can be traced back to the 1970s when
Councils were recruiting staff from the United Kingdom. The term recruitment refers to the
process of attracting sufficient and suitable potential candidates for vacant positions in the
organisation. The aim is to ensure that the organisation’s demand for employees is met by
attracting employees in a cost-effective manner. Selection on the other hand, is the process of
identifying the most suitable candidates that meet the requirements for the vacant positions in the
organisation (Cole, 2004).
Vacant positions in the Teaching Service are advertised to promote fair and open competition
and provide the best opportunity to attract a wide field of applicants. Unfortunately, competition
for the advertised vacancies has not been fair over the years. There have been concerns with
regard to the way advertisements have been run. It is questionable that information about the
availability of vacancies has really been reaching all the prospective contenders.

4
1.2 Problem statement
The quality of education offered depends highly on the calibre of the people entrusted with the
management of educational institutions. The existing problem is the presence of ill-qualified and
incompetent individuals at the helm of education management in the education system. These ill-
qualified and incompetent individuals have acquired education management positions due to the
lack of effective promotional selection processes, which in turn compromise their competence
and professionalism.
1.3 Objectives
1.3.1 General Objective:
The general objective of this study was to establish the challenges that Education Administrators
and Managers face in recruiting, selecting and appointing staff for promotion.
1.3.2 Specific Objectives:
The specific objectives of the study were:
1. To assess the impact of the information management system used in the district’s
education system on the quality of teacher promotion.
2. To establish the fairness of the criteria used in the selection of teachers for promotion to
management positions in the district’s education system.
3. To investigate the reliability of the information communication system used in the
district’s education system in the promotion of teachers to management positions.
1.4 Research Questions
1. How effective is the information management system used in the district’s education
system in as far as selection of teachers for promotion to management positions?
2. Are all records regarding teacher qualifications and professional upgrading kept up-to-
date, by the district education office, all the time?
3. Are the criteria used in the selection of teachers for promotion to management positions
in the district’s education system fair?
4. Are all teachers promoted to management positions selected and appointed on merit?
5. Is the information communication system used in the district’s education system reliable
for effective promotion of teachers to management positions?

5
6. Is the information concerning the need to recruit, select and appoint teachers for
promotion to management positions well and timely disseminated to reach all the
prospective contenders?
1.5 Justification of the Study
The researcher undertook the study due to the following reasons; firstly, to provide adequate
explanation about the factors that impede effective and efficient recruitment, selection and
appointment of staff for promotion in the education system in districts, provinces as well as at
national level. Secondly, to provide evidence based on statistical information, regarding the
existence of feasible constraints faced by the recruiting, selecting and appointing authorities in
Mazabuka district’s education system which lead to the recruitment, selection and appointment
of ill-qualified and incompetent personnel. The other reason was to validate the significance of
sound information management and information dissemination systems towards achieving
effective and efficient recruitment, selection and appointment processes. This study was seen to
be important in that the findings may be of help in the efforts to control the problem of
inefficiency in the promotion process in the education system. The sought constraints to
successful and efficient promotion exercises, if availed to all relevant stakeholders in the
education sector, may be used, together with the already existing strategies, in the improvement
and enhancement of the effective and prudent recruitment, selection and appointment processes
based on merit. The problems emanating from corrupt and unjust conduct, such as nepotism,
political alignment bias, faulty information storage and dissemination and bribery for selfish gain
give rise to the placement of ill-qualified and incompetent persons in strategic positions in which
they cannot successfully perform thereby leading to low ultimate motivation and productivity.
Since such a situation requires immediate intervention, this study and its findings, if made
available to education institutions, may act as a guide and reference point towards the
development of more reliable and beneficial systems that will promote prudent promotions
whose core values will be anchored on merit.
1.6 Assumptions of the study
This study was carried out under the assumption that;
All the respondents would cooperate and provide accurate information as it were to the
best of their perception.

6
The findings of this study would be meaningful and made available to the relevant
stakeholders, in the education system, to facilitate the development of sound recruitment,
selection and appointment procedures in order to achieve effective promotions that would
foster the implementation of quality service delivery.
The findings obtained from this study would be a good supplement to the already existing
information regarding the constraints and solutions to the conceptual and practical
application of promotion procedures, to enhance the making of informed decisions as
well as the establishment of effective promotion procedures.

7
CHAPTER TWO
2.0 LITERATURE REVIEW
2.1 Introduction
To be precise in this study existing literature related to the research problem was reviewed. The
problem was the escalating levels of ineffective and inefficient promotion procedures coupled
with diminishing standards of education management that result from unfair promotion of staff
in the education sector. It was deemed paramount to investigate the roles of efficient recruitment,
selection and appointment of staff for promotion in increasing and stabilising educational
productivity and progressive service delivery, by the fact that every learner, primary, secondary
or tertiary, relies on the qualification and competence of the persons entrusted to manage
educational programmes. To this effect, any administrator or manager in the education sector
needs to competently employ strategies that will foster effective learning and academic and
professional success through strategic education management. The achievement of quality
education is a direct product of well managed recruitment, selection and appointment of staff
done solely on merit. It was therefore, important to investigate this question as there is need to
enhance sustainable and productive education through prudent management of education
structures.
2.2 Definition and Scope of Recruitment, Selection and Appointment of Staff
There is some significant degree of universality and integration among the terms recruitment,
selection and appointment. These may be viewed as a single process involving several stages.
The term recruitment refers to the process of attracting sufficient and suitable potential
candidates for vacant positions in the organisation. The aim is to ensure that the organisation’s
demand for employees is met by attracting employees in a cost-effective manner. Selection on
the other hand, is the process of identifying the most suitable candidates that meet the
requirements for the vacant positions in the organisation. The aim is to identify, individuals that
are most likely to fulfil the requirements of the organisation (Cole, 2004). Appointment is the
confirmation of offer of a position or job to a deserving candidate that has duly met the
requirements of the job position as justified by the authorities responsible for filling up the
vacant position. Mckinney (2014) defines recruitment as the process of finding and hiring the
best-qualified and competent candidates (from within or outside an organisation) for a job
8
opening, in a timely and cost-effective manner. He further highlights that the recruitment process
involves analysing the requirements of a job, attracting employees to that job, screening and
selecting applicants, hiring and integrating the new employee into the organisation.
Recruitment and selection policies in local authorities can be traced back to the 1970s when
Councils were recruiting staff from the United Kingdom. Achievement First (AF) is an
organisation established to ensure that prudence is upheld in the recruitment process through
adherence to merit. The organisation has invested heavily in its recruitment process and focused
intensively on putting in place systems and processes that yield the highest quality teachers.
An extensive body of research shows that teacher quality is one of the most important factors
related to increasing student achievement. Teachers who are committed, engaged, and skilful in
their approach to instruction and tactical management have a powerful, long-term impact on
students’ lives. Educational leaders recognize the critical importance of teacher quality, yet they
struggle with the question of how to find and recruit the best and the brightest within a relatively
limited talent pool. From an organizational standpoint, tapping into this talent requires a
significant upfront investment of human and financial resources, aided by a sound information
management system (Cole, 2004).
2.3 Global Perspective of Recruitment, Selection and Appointment of Staff
An Education Management Information System (EMIS) can monitor performance and enhance
quality by countering the problem of inadequate information about activities in the education
sector. It is used in many countries, and its overall purpose is to improve accountability for
public spending, as well as understanding of school programmes and accomplishments. It
provides information on the needs of school districts, including student performance and
participation indicators (CMI, 2006).
In Gambia the introduction of EMIS provided an objective means of tracking and ranking
teachers by seniority, language skills, specialisation, and other relevant factors for appointment.
The EMIS thus laid grounds for appointments and promotions made on the basis of merit. The
information prevented appointments based on personal connections and other invalid grounds
(Department of State Education of Gambia 2001, in B. I. Spector et al. 2005).

9
When assessing applicants, selection panel members must ensure that they do not directly or
indirectly discriminate. Panel members should be aware of individual bias, assumptions and
stereotyping which may impede the selection of the best applicant for the position. Panel
members should be aware of the diverse pathways of experience and approaches which male and
female candidates may bring to the interview and to the workplace, including people of diverse
cultural and linguistic backgrounds and people with a disability. This diversity should be viewed
as an attribute and should in no way diminish the assessment of the applicant’s suitability for the
position. Panel members should be aware that the Recruitment Department has a positive duty
under the Equal Opportunity Act of 2010, to provide reasonable and proportionate measures to
eliminate discrimination and a duty to provide reasonable adjustments for people with a
disability.
Panel members should also be aware that it is unlawful to discriminate against an applicant on
the ground of an attribute or ask a discriminatory question, in contravention of the Equal
Opportunity Act of 2010. Panel members should focus on abilities, skills, knowledge, potential
and qualifications required for the position and not seniority, length of experience or familiarity
with the position. This is important as to focus too much on length and continuity of experience
may impact negatively on women or ‘carers’ who take career breaks for family reasons and on
those who have not had an opportunity to ‘act’ in the position. Principals and panel members are
to avoid any real or perceived conflict of interest in the selection process including the selection
decision. A conflict may arise where it could be reasonably perceived that a principal or panel
member is influenced by the private interest of facilitating employment (for example the
employment of a family member). Where there could be a perception of possible favouritism and
bias, the principal and/or panel member may need to remove him or herself from the selection
process and/or selection decision (CMI, 2006).
Research has shown that teacher quality is one of the most important factors related to increasing
student achievement. It is generally proven that teachers who are highly committed, engaged,
and skilful in their approach to instruction have a powerful, long-lasting impact on students’
lives. Educational leaders have over the years recognised the critical importance of teacher
quality, yet they struggle with the question of how to find and recruit the best and the brightest
within a relatively limited talent pool. From an organisational standpoint, tapping into this talent
10
requires a significant upfront investment of human and financial resources. Achievement First
(AF) is a Charter Management Organisation (CMO) that runs high-quality schools in New York
and Connecticut. Its mission is to deliver on the promise of equal educational opportunity for all
of America’s children. We believe that all children, regardless of race or economic status, can
succeed if they have access to a great education (CMI, 2006).
In 2006-07, Achievement First served 1,704 students in 10 schools. Its experience has relevance
to many other CMOs for which teacher recruitment is an on-going challenge. Unique, Replicable
Approach Achievement First has identified teacher recruitment as an organisational priority
which drives decision-making around staffing and allocation of resources. As a result, the
organisation is highly systematic and proactive in its approach to teacher recruitment.
Achievement First’s recruitment team oversees all aspects of teacher recruiting, including
conducting outreach to potential candidates, processing and reviewing applications,
communicating with school principals about hiring needs and candidate prospects, and
shepherding candidates through the application process. One key component of the process is the
on-going communication flow between the central office and school sites (CMI, 2006).
2.4 Zambian Perspective of Recruitment, Selection and Appointment of Staff
As the criteria for recruitment are repeatedly bypassed, unqualified personnel are often appointed
to critical positions. Placements in rural schools tend to be unpopular, especially among
unmarried and female teachers, and can sometimes be avoided by bribing public officials.
Skewed distributions of teacher postings can leave some schools overstaffed and others in crisis.
For promotion purposes candidates may bribe or otherwise influence promotion committees.
Despite the rigid academic hierarchy in universities, senior academics often promote unqualified
friends or colleagues to new positions. Lack of transparent regulations and criteria in the
promotion process exacerbates higher opportunities for corruption. Without clear standards and
regulations, the line between acceptable and unacceptable behaviour becomes blurred. Most
administrators in schools are teachers, just picked and appointed to management positions,
usually undeservingly, without any form of in-service or pre-service management training and
they often lack the knowledge to analyse audits and financial information. Such skill deficiencies
are often prevalent at district, provincial and national levels, too (CMI, 2006).

11
The policies of an organisation can affect its recruitment and selection of personnel. A
recruitment and selection policy will state whether the organisation will recruit from within or
outside the organisation. A recruitment and selection policy will also state the requirements for
particular positions in the organisation. (Bhaskar, 2007) states that, policies and practices of
every organisation have an effect on recruitment and selection. This is because a policy
statement for recruitment will state, for example, whether or not an organisation will seek
candidates on the basis of their qualifications for the vacant position that may be available. A
recruitment and selection policy that reminds recruiters and selectors about the implications of
recruiting ill-skilled personnel can go a long way towards ensuring that the right people with the
right qualifications are hired (Cole, 2002). A lack of a recruitment and selection policy can make
it difficult to recruit and select the most desired human resources. This may result into staff
shortages for qualified people in the organisation. According to Cole (2002), one of the first
steps in planning for recruitment of employees into the organisation is to establish adequate
policies and procedures. He stressed that a recruitment policy represents the organisation’s code
of conduct in this regard. An example of a typical policy statement for recruitment may include:
advertising all vacancies internally (ensuring that the advertisement message reaches the target
population on time and in good form), replying to every job applicant with minimum delay,
informing potential recruits in good faith, about the basic details and job conditions of every job
advertised, processing all applications with efficiency and courtesy, seeking candidates on the
basis of their qualifications and competence.
Literature by Cole is important to this study because it provides information on the importance of
developing adequate policies on recruitment and selection which deter corrupt indulgence and
bias. These are necessary in order to ensure that recruitment practices are consistent, systematic
and responsive. In view of the observation made by Cole, this study does not only focus interest
in establishing whether or not recruitment and selection policies exist in the education system,
but also establishing factors, examining constraints and identifying recruitment and selection
methods used and their shortcomings. The findings of the studies suggest that there were
variations in the factors that impede operations of the education authorities in Zambia. Literature
also revealed that factors such as political interference have had adverse effects on the quality of
personnel that education authorities have been recruiting over the years and that there is need for
organisations to develop adequate policies on recruitment and selection because these are
12
essential in guiding the process. Literature further revealed that educational authorities have
lamentably failed to provide quality services due to, among other things, the lack of sufficiently
qualified personnel in the right positions.
2.5 Comparative Studies
As demand in school management increases globally on a daily basis, the available resources
may become over-stressed. Therefore, adequate record keeping of the human and material
resources is needed to address the issue of the ever-increasing demand for education managers.
With the growing need to provide schools with human and material resources that can help them
achieve sustainable educational objectives, professional teacher promotion stands out as a key
solution to meeting the demand. According to Ololube (2012) the rising cost of running school
systems leaves some schools with low quality and inadequate human and material resources.
This is because there is no cheap education the world over. Thus, the need for alternative ways of
utilizing slim resources to attain set objectives makes school record keeping imperative. The
complexity in school administration, its constraints, contingencies, and other difficulties also
make record keeping a necessity (Nwaoku, 2005; Obi, 2005; Ololube, 2011).
The scarce resources in schools may be wasted if their utilization and underutilization is not
properly recorded (Usen, Udofia, & Offiong, 2012; Ololube, 2009). There is a need to keep
record of all school activities as part of effective school administration. Record keeping and the
management of records is a vital responsibility of the education administrators because of the
indispensable role of records and information in the day-to-day activities of the education
system. Education managers rely on the short and long-term data captured in records to make
effective decisions about immediate issues and more comprehensive policies (Okpetu &
Peretomode, 1995). According to Ibara (2010), without records there can be no accountability.
He further maintains that quality performance, task accomplishment, and measurable outcomes
are increasingly important responsibilities, all of which depend on the accessibility of usable
records. Without access to records, it is virtually impossible to determine responsibility for
actions, taking rightful actions and to hold individuals accountable for their actions.
Additionally, records in the education system include those pertaining to personal details of staff,
their academic and professional achievements and individual attributes. According to Ololube
(2013), school or educational records can thus be said to comprise all existing and accessible

13
records, books, files and other documents containing useful information that relates to what goes
on in the system. These records may also be in the form of reports, letters, memos, pictures,
films, journals, diaries, and so on.
Record keeping generally concerns the administrative activities that are concerned with
achieving cost-effectiveness and efficiency in the creation, maintenance, use and disposal of the
records of educational institutions throughout their entire life cycle and in making the
information they contain accessible in support of the educational business administration
(UNESCO, 2005). It is essential that records are kept in school for effective administration,
because proper record keeping facilitates retrieval of valuable information that might be helpful
in day-to-day operations and decision making in educational systems globally (Durosaro, 2002).
According to Ololube (2013), the importance of good record keeping transcends into short and
long term benefits and affects the overall achievement of educational objectives. He identified
some additional and important reasons for records keeping in schools. Record keeping is vital to
an education system’s information cycle as a whole, because of its fundamental role in the
process of efficient information production and collection, and retrieval and utilisation. This is a
form of accountability. Educational records help education administrators to make decisions.
Records provide raw data that enable coherent, balanced and objective decisions on issues such
as promotion, student and staff discipline, and teaching and learning performances. Properly kept
records on the human resources are useful for employment and planning related purposes. The
number of staff, their areas of specialization, qualifications, age, gender, and so on will help the
authorities to determine the human resource needs and assets of his or her functional jurisdiction.
Consistent information kept about employees can also be used in employee performance
appraisals and promotions. Accurate data assists educational planners to identify areas of need
that should be addressed or accorded priority attention.
A study conducted by Moonga on the Lusaka City Council shows that a recruitment based on
appeasing political supporters in the local government service may result into recruiting ill-
qualified personnel. Therefore, because of political interference, ill-qualified people may be
recruited and placed in positions where they fail to perform. Political interference may arise
from, for example, councillors or ministers serving in the government. In view of the above, it
becomes difficult for councils to recruit adequately qualified and competent personnel based on

14
merit. Lolojih (2008) noted that during the reigns of governors in particular councils such as
Lusaka City Council, councils were influenced to employ party cadres in order to appease UNIP
supporters and that the employment of party functionaries had nothing to do with the need to
boost output and service delivery. Therefore, because of political interference Lusaka City
Council may be compelled to recruit party cadres that are not qualified.
Moonga’s study added some focus to this study by providing a comprehensive foresight of the
presence of political influence in the recruitment process. It is therefore justifiable that political
and other influence exist in the recruitment process with the education systems. The kinds of
influence give rise to the employment and promotion of ill-qualified and incompetent personnel
in the education sector. Such misdirected promotions result in mismanagement of educational
institutions.
A report by the United Nations Development Programme in Indonesia revealed that
strengthening of local capacity in local authorities meant improving the professional standards of
central officials stationed at the lower levels of government. The study revealed that local
authorities in Indonesia did not have adequate professional staff. This was essential since many
local authorities were ill-equipped to implement development projects due to the lack of
qualified personnel (Human Development Report, 1993). This study benefited from the United
Nations report because it highlighted the importance of recruiting individuals with the right
qualifications and competence. The study noted constraints by local authorities in undertaking
developmental projects due to lack of qualified personnel. This study was also interested in
establishing some of the constraints that Mazabuka district education office faces in the
recruitment and selection of qualified personnel.
Alikipo (2007) conducted a study under the title; A Comparative Study of Recruitment and
Selection Policies and Practices for Academic Staff at first Appointment in Higher Education. In
this study, he explored and analysed recruitment and selection policies and practices with
emphasis on the extent of formality in the processes of manpower planning, implications of
budgetary situations on recruitment and selection, effects of various influences like government
intervention or political interference, the economy and trade unions on recruitment and selection
and further determining adjustments and adaptations in policy and practices arising from those
changes. The study established that among the major factors that influenced recruitment in the

15
two university colleges were: corporate policy, the economy, labour market, government
intervention, remuneration and management style. Although the subject area for the study was
broad, this investigation benefited from it because it highlighted factors that influenced
recruitment and selection of professional staff at the two higher institutions of learning in the
United Kingdom. It was also important in directing this research because the highlighted study
dwelt on the significance of good education management, which is the direction of this research.
However, unlike Alikipo’s study, this one seeks to establish factors that affect recruitment and
selection in the education sector, as opposed to higher learning institutions.
2.6 Personal Critique
Accountable education systems rely on laws promoting transparency, a free press, and an active
civil society. Additionally, organisational structures and administrative procedures must be clear-
cut and built on principles of accountability and transparency. Necessary factors for success
include: politically independent administrations, clear-cut management rules and procedures,
clear standards and rules for merit-based teacher recruitment and promotion (CMI, 2006). Any
deviation from the right course of the standard requirements of recruitment, selection and
appointment for promotion gives way to a faulty and ineffective system. Any organisation that
overlooks the guidelines and expectations of the recruitment procedures and the associated
ethical implications directly influences its fall. A management team that is ushered into office
without adherence to the implications of qualifications and competence will definitely operate
without confidence and proficiency thereby exacerbating conflicts, frustrations and a
downgraded productivity in the system. This is a common phenomenon in the education sector
today in which such importance norms as merit and professionalism are consistently lacking.
2.7 Establishment of the Gap
All the reviewed studies show some ineffectiveness in the selection of staff for promotion to
management or other senior positions. The identified gaps are basically as a result of lack of
supported autonomy among the bodies responsible for the promotional exercise.
There seems to be a widening gap between the need for a stable and reliable information
management system and the actual scenario in district education offices. Information about staff
qualifications and professional achievements is not gathered and stored reliably and never up to
date. This then effects the professional identification of the right candidate to be earmarked for

16
promotion. The disbursement of information about such vacancies has serious shortcoming.
Many are the times that such information is issues only to a selected group of individuals. The
majority and usually potentials contenders are either do not get hold of this information or get it
late. Corrupt practices such as nepotism and other forms of unfair considerations in the
recruitment process hinder the achievement of a high-class, professional and highly competent
education management team.
The intent of this study is to provide evidence of the presence of lapses in the promotional
processes and elicit measures and strategies that might improve the effectiveness of the selection
of teachers for promotion to management positions in the education system. It is hoped that the
achievement of effective teacher promotion criteria will result in an improved school
management system that fosters the provision of quality education.
2.8 Conceptual Framework
The study used the following conceptual framework.
INDEPENDENT VARIABLES DEPENDENT VARIABLE
The above framework proposes that the perceived inefficiency and ineffectiveness in the process
of recruiting, selecting and appointing members of staff, in the education system, for promotion
is most likely to be influenced by five major variables. These variables include; the lack of an
Effective staff recruitment,
selection and appointment for
promotion.
Lack of fair criteria for recruiting,
selecting and appointing staff.
Lack of an effective information
management system.
Lack of a dependable information
communication system.
Lack of continuous update of staff
professional achievements.
Corruption in the public
administration fraternity.

17
effective information management system for storing and verifying information about
professional achievements and competences of the existing members of staff. The other factors
attributed to are the lack of fair and dependable criteria for recruiting, selecting and appointing
staff for promotion as well as the lack of a reliable system for communicating vital information
to all the stakeholders or prospective contenders. Lack of a mechanism to enable continuous
update of staff professional progress and achievements and the prevalence of corruption in the
public administration fraternity are other variables seen to have influence on staff recruitment,
selection and appointment.
2.9 Theoretical Framework
The policies of an organisation can affect its recruitment, selection and appointment of
personnel. A recruitment and selection policy states the requirements for particular positions in
the organisation. (Bhaskar, 2007) states that policies and practices of every organisation affect
the quality of staff recruitment, selection and appointment processes. This is because a policy
statement for recruitment states, for example, whether or not the organisation will seek
candidates on the basis of their qualifications and competence for the vacant position that may be
available. A recruitment and selection policy that reminds recruiters and selectors about the
implications of recruiting ill-skilled personnel can go a long way towards ensuring that the right
people with the right qualifications and competences are hired (Cole, 2002). A lack of a good
recruitment and selection policy or just a lack of adherence to it can make it difficult for an
organisation to recruit, select and appoint or promote the most desired human resources. This
may result in staff shortages and misplacement of qualified people in the organisation and
consequently giving rise to a haphazard way of carrying out functional and productive
operations.
Recruitment based on unprofessional preferences such as appeasing political supporters in
government departments may result in recruiting ill-qualified personnel. Therefore, because of
political interference, ill-qualified people may be recruited and placed in positions where they
fail to perform. In view of the above, it becomes difficult for non-autonomous authorities to
recruit adequately qualified personnel based on merit. Lolojih (2008) noted that during the reigns
of governors in particular councils such as Lusaka City Council, councils were influenced to
employ party cadres in order to appease UNIP supporters and that the employment of party

18
functionaries had nothing to do with the need to boost output and service delivery. Therefore,
because of political interference Lusaka City Council was compelled to recruit party cadres that
were neither qualified nor competent. The theoretical framework shows that recruitment and
selection policies are crucial in guiding local authorities towards engaging well qualified and
competent personnel.

19
CHAPTER THREE
3.0 METHODOLOGY
3.1 Introduction
This chapter presents the details of the way the study was designed. The information hereunder
includes; the description of the study area, the study population, sample size and sampling
procedures, data collection instruments and procedures, validation of the data collection
instruments, data analysis and an account of the variables and their effects, if any.
3.2 Research Site: Description of the Research Area
The study was conducted in Mazabuka district of Southern province. The targeted area was the
whole of Mazabuka district, covering all the 103 schools in the district, both primary and
secondary.
The research area lies in zone 2 of Zambia’s three distinct agro-ecological zones. The area has an
altitude of 950 m above sea level, with annual temperatures ranging from 00C to 38
0C, and
average annual rainfall of 850 mm. The soils of this area are reddish loamy clay, deep well
structured and well drained, with a sandy clay top soil of pH 5.5 to 6.0 (ZARI, 2013). The
district’s population is 261, 268 (CSO, 2010).
3.3 Research Design
The research design used in this study is a quantitative survey design. To this accord, the study
relied on quantitative data. A quantitative survey design is a type of a research method used to
gather information about some phenomenon and to draw conclusions about it based on empirical
facts or quantities of feedback, in respect to conditions or variables that are found in a given
situation (Kombo & Tromp, 2006). This design was suitable, for this study, because it provided
for the collection of information regarding the naturally occurring characteristics of a particular
group without changing the environment.
3.4 Target Population
Bryman (2004) defines study or target population as the universe of units from which the study
sample is to be selected. The study intended to cover school administrators in the education
system because the nature of the information required was highly associated with administration

20
and management in schools. For this reason, the study involved Head teachers and deputy head
teachers, as respondents. Mazabuka district has a total of 103 schools (DEBS’ Office, 2015),
both primary and secondary. Since only Head teachers and deputy head teachers participated in
the study, the study population was therefore 206, represented by 2 administrators from each of
the 103 schools.
3.5 Sample Size
The selection of the district was done using purposive or non-probability sampling, owing to the
observations made. Random sampling was used in the selection of the sample to ensure that there
was no bias in the selection process of the study units. The sample that was selected comprised
one hundred thirty-six (136) Head teachers and deputy head teachers. The sample size was
determined as follows;
n = N / 1+N(e)2
where n = sample size, N = population and e = margin of error.
Total district sample:
n = N / 1+N(e)2
= 206 / 1+206 (0.05)2
= 206 / 1+206 x 0.0025
= 206 / 1+0.515
= 206 / 1.515
= 135.9735974
= 136.
The study involved a total of 136 study units or respondents drawn from among the
administrators in schools in the education system.
3.6 Sampling Procedures
The selection of the study units was done using Excel Randomisation, a form of probability
sampling. All the members or elements of the study population were coded and randomised in
Microsoft Excel, in which each element had an equal but non-zero chance of participating in the
study. This entails that every individual holding an administrative position (Head teacher/deputy
head teacher) was accorded an equal opportunity of being part of the study sample. This
approach intended to ensure that only the pre-desired study units or respondents (Head
21
teachers/deputy head teachers) were selected for the sake of achieving a provision of insight with
regard to the study direction.
3.7 Data Collection Instruments
The study relied on structured questionnaires and interviews to gather primary data. Secondary
data was obtained from the local District Education Office (DEO), School Administrative
Offices, Teachers’ Unions and any other relevant sources, including publications.
3.8 Validation of the Data Collection Instruments
The data collection instruments were both face and content validated. They were submitted to the
research supervisors for scrutiny and authentication. All recommendations from the supervisors
were effected before administering the instruments. The research instruments were further
validated by means of a pilot study.
3.9 Data Collection Procedures
Data were collected within a period of 20 days. The researcher distributed the data collection
instruments to the respondents in their respective schools and collected the questionnaires by the
agreed time, within 20 days. Secondary data was sought during the visits to schools for the
distribution and collection of the data collection instruments.
3.10 Data Analysis
The data gathered were systematically coded in Microsoft Excel spread sheets and then subjected
to statistical analysis using STATA in order to generate tabulations, cross tabulations, t-tests,
regression tests, and the Chi square test of association.
3.11 Triangulation
To facilitate validation of the data, the collected data were cross-verified by comparing it to the
data that would be obtained from a parallel source that would involve respondents that were not
holding any administrative positions. The data collected from a pilot study were also used to
cross-verify and validate the collected data.
3.12 Ethical Considerations
In most social science researches, the participants are known to the researcher and anonymity is
thus exclusively impossible. In such an instance, the researcher must assure the participants that

22
their identities as well as their feedback would be treated with prime confidentiality, and never to
be revealed to any third party (Parahoo, 2006). The researcher assured the respondents that their
identity would not be disclosed by both parties and the feedback would equally be treated with
high confidentiality. The respondents were also assured that their responses would only be used
for the research and academic purposes and none of them would be disclosed to any person or
office for any ill purposes to disadvantage any of the respondents. The findings of the study
would only be used for purposes of implementing change in and for the improvement of the
education system, should there be need.
3.13 Limitations of the Study
This study was conducted under the following constraints;
The period of time in which the study was to be completed was short.
The financial challenges hindered the production of better work as the study was not
externally funded and all expenses were met by the researcher. This fact contributed to
the limiting of the study population as well as the sample size, which is likely to produce
findings that might not be very representative hence limiting their generalisation.
23
CHAPTER FOUR
4.0 STUDY FINDINGS
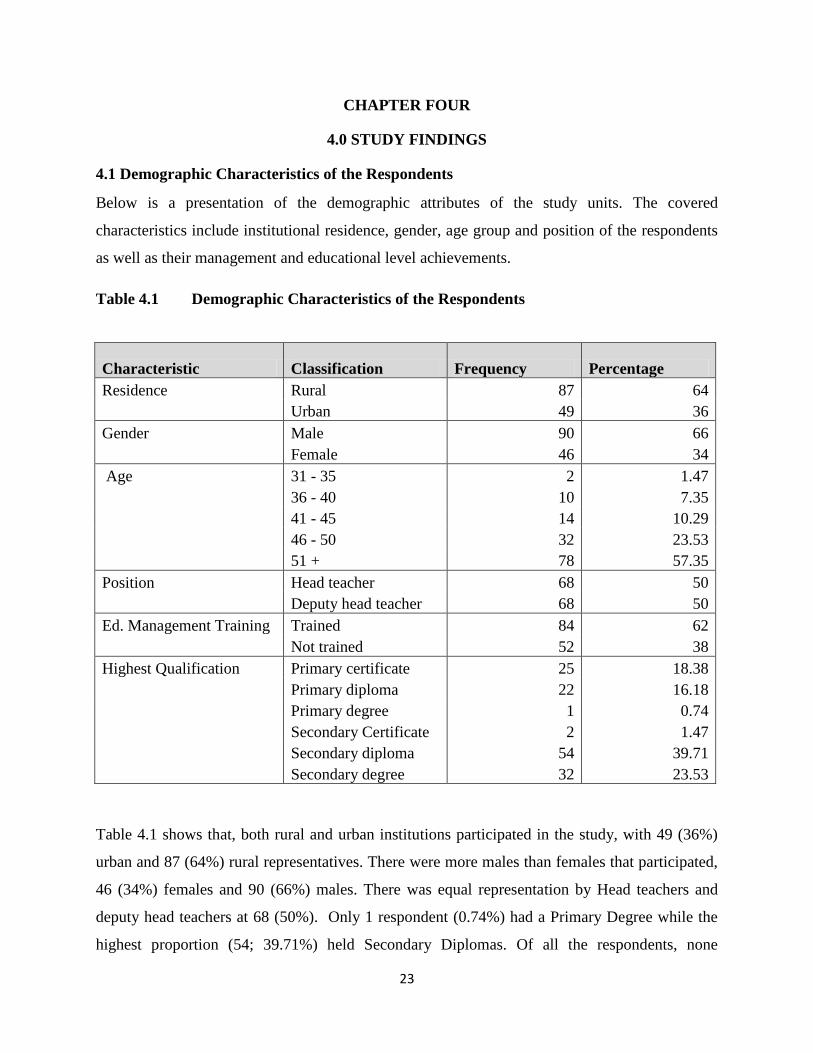
4.1 Demographic Characteristics of the Respondents
Below is a presentation of the demographic attributes of the study units. The covered
characteristics include institutional residence, gender, age group and position of the respondents
as well as their management and educational level achievements.
Table 4.1 Demographic Characteristics of the Respondents
Characteristic Classification Frequency Percentage
Residence Rural 87 64
Urban 49 36
Gender Male 90 66
Female 46 34
Age 31 - 35 2 1.47
36 - 40 10 7.35
41 - 45 14 10.29
46 - 50 32 23.53
51 + 78 57.35
Position Head teacher 68 50
Deputy head teacher 68 50
Ed. Management Training Trained 84 62
Not trained 52 38
Highest Qualification Primary certificate 25 18.38
Primary diploma 22 16.18
Primary degree 1 0.74
Secondary Certificate 2 1.47
Secondary diploma 54 39.71
Secondary degree 32 23.53
Table 4.1 shows that, both rural and urban institutions participated in the study, with 49 (36%)
urban and 87 (64%) rural representatives. There were more males than females that participated,
46 (34%) females and 90 (66%) males. There was equal representation by Head teachers and
deputy head teachers at 68 (50%). Only 1 respondent (0.74%) had a Primary Degree while the
highest proportion (54; 39.71%) held Secondary Diplomas. Of all the respondents, none
24
possessed either a Master’s or Doctoral degree. 52 (38%) respondents did not have any official
training or qualification in education management or administration. Further, the age pattern of
the respondents was in ascending order with none below 31 years, only 2 (1.47%) between 30
and 36 while the majority (78; 57.35%) were above 50 years of age.
4.2 Management of District Staff Records
This part presents the details about the nature and quality of management of educational staff
records in the district.
4.2.1 Database and Website Use
The following table gives details pertaining to the presence and use of a database and a website
by the district education boarding in managing district staff information.
Table 4.2.1 Database and Website Use
Variable Response Frequency Percentage
Website use Yes 39 28.68
No 97 71.32
Database use Yes 59 43.38
No 77 56.62
Table 4.2.1 shows that 59 (43.38%) of the total responses agreed that the district had a database
in place which it used for the management of district staff information while 77 (56.62%) of the
responses said that the district did not have a database in place. In addition, 39 (28.68%) of the
respondents said the district had a website in place while the other 97 (71.32%) indicated that the
district did not have a website.
4.2.2 Types of Systems used to Submit and Store Staff Data/Records
This part presents the details of the types of systems that the district used for data submission and
keeping of staff records.
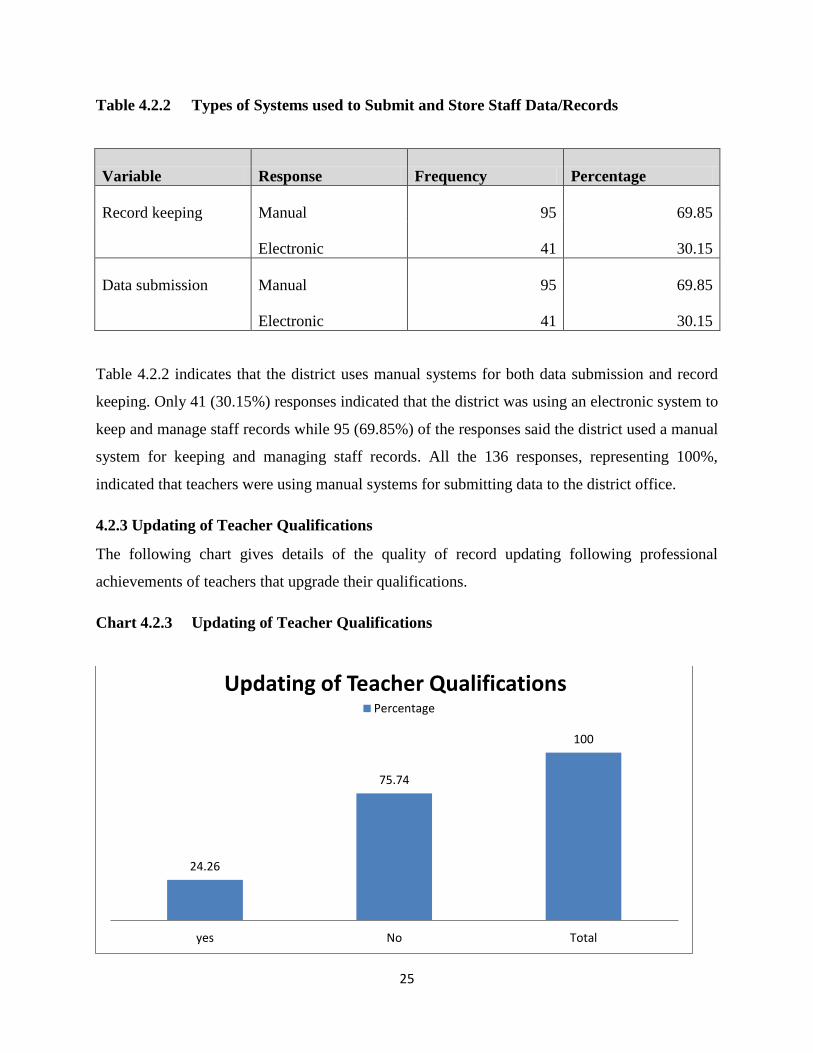
25
Table 4.2.2 Types of Systems used to Submit and Store Staff Data/Records
Variable Response Frequency Percentage
Record keeping Manual 95 69.85
Electronic 41 30.15
Data submission Manual 95 69.85
Electronic 41 30.15
Table 4.2.2 indicates that the district uses manual systems for both data submission and record
keeping. Only 41 (30.15%) responses indicated that the district was using an electronic system to
keep and manage staff records while 95 (69.85%) of the responses said the district used a manual
system for keeping and managing staff records. All the 136 responses, representing 100%,
indicated that teachers were using manual systems for submitting data to the district office.
4.2.3 Updating of Teacher Qualifications
The following chart gives details of the quality of record updating following professional
achievements of teachers that upgrade their qualifications.
Chart 4.2.3 Updating of Teacher Qualifications
24.26
75.74
100
yes No Total
Updating of Teacher Qualifications Percentage

26
Chart 4.2.3 shows that the records of teacher professional qualifications are not timely and
sufficiently updated. This is justified by the 33 (24.26%) of the total responses that agreed to say
the district always had an updated record of teachers by their current/latest qualifications. The
majority, 103 (75.74%) responses said that the district did not always have an updated record of
teacher qualifications.
4.2.4 Contact Details of Teachers
Below is a presentation of the information regarding the state of the contact details of teachers,
as kept by the district education office.
Chart 4.2.4 Contact Details of Teachers
Chart 4.2.4 shows that only 8 (5.88%) of the total respondents said the district had an up-to-date
record of the contact details of teachers while the majority, 128 (94.12%) indicated that the
district did not have a record of contact details of teachers which is up-to-date.
5.88
94.12 100
yes No Total
Contact Details of Teachers
Percentage

27
4.2.5 Updating of Information Management System and Teacher Records
This part presents the details of how often the district staff record management system was being
updated and also whether or not the district record of staff data was up to date.
According to the findings, the district’s information management is rarely updated. Only 26
(19.12%) responses said that the system was often updated. 71 (52.21%) responses, representing
more than half of the total number of respondents, said that the system was rarely updated. 39
(28.67%) responses indicated that the system was very rarely updated.
4.3 District Information Communication System
This part presents the details about the nature and quality of the Information Communication
System and its management in the district.
4.3.1 Modes of Communication used in the District
Below is a presentation of the modes of information dissemination that the district uses to
communicate with its staff regarding advertisements.
Chart 4.3.1 Modes of Communication used in the District
97.06 93.38
6.62 0 0 2.94
6.62
93.38 100 100
Circulars Notice boards TV/Radio Phone calls/SMSs Emails
Modes of Communication used in the District
yes No

28
Chart 4.3.1 shows that communication in the district is majorly through circulars sent through
Head teachers and the notice boards at the district office. Out of 136 valid responses, 127
(93.38%) indicated that communication was mainly done through the notice boards at the district
office while 132 (97.06%) responses showed that communication was also majorly done through
circulars sent to schools through Head teachers. Only 9 (6.62%) responses indicated that the
district communicated the advertisements through televisions or radios. The findings further
show that advertisements are never communicated through phone calls, short massage services
(SMSs) and emails.
4.3.2 Effectiveness of Information Communicated through Head Teachers
The following section gives details of the assessment of the effectiveness of information
communicated by means of circulars through Head teachers.
The findings showed that only 7 (5.15%) responses of the 136 supported that the information
communicated through Head teachers reached the teachers timely and in its correct form while
the other 129 (94.85%) indicated that information communicated through Head teachers did not
reach all teachers in correct form and on time.
4.3.3 Complaints about the Effectiveness of Advertisement Messages
This part presents the details regarding the effectiveness of advertisement messages as well as
the levels of complaints about the inefficiencies in the dissemination of vacancy messages.
According to the study findings, only 7 (5.15%) responses of the 136 supported that the
advertisement information reached all eligible teachers timely and in its correct form while the
other 129 (94.85%) indicated that information regarding promotion advertisements did not reach
all eligible teachers in correct form and on time. The table also confirms that Head teacher were
aware of teachers having complained about not receiving promotion advertisement messages on
time and in their correct form. This was backed by 134 (98.53%) responses out of the 136 valid
responses.
4.4 District Staff Promotion Procedures
This part presents the details about the reliability of the staff promotion procedures in the district.
The section gives a clear picture of the state in which promotion procedures are in the district.

29
4.4.1 Effectiveness of the dissemination of the Vacancy Advertisement
Below is a chart giving data regarding the effectiveness of the vacancy advertisement procedures
in the district.
Chart 4.4.1 Effectiveness of Dissemination of the Vacancy Advertisements
Chart 4.4.1 depicts that only 25 (18.38%) responses agreed that every eligible teacher was made
aware of the existing vacancy and the need for it to be filled up on time while the majority,
represented by 111 (81.62%) responses indicated that not every teacher was made aware of the
existence of a vacancy and the need to fill it up on time.
4.4.2 Rising of Teachers to Administrative/Management Positions
The chart below presents information regarding the rising of teachers to
Administrative/Management positions in the district.
18.38
81.62
100
Yes No Total
Effectiveness of Vacancy Advertisements
Percentage

30
Chart 4.4.2 Rising of Teachers to Administrative/Management Positions
Chart 4.4.2 indicates that only 7 (5.15%) responses claimed that all the teachers holding
Administrative/Management positions in schools obtained those positions purely on merit. To
the contrary, the majority responses, 129 (94.85%) said that some of the individuals in
Administrative/Management positions did not rise to the positions purely on merit.
4.4.3 Existence of Corruption in the Promotion Process
The table below presents the perception of the study respondents about the prevalence of some
forms of corruption in the process of staff promotion in the district.
Table 4.4.3 Existence of Corruption in the Promotion Process
Variable Response Frequency Percentage
Corruption present Yes 133 97.79
No 3 2.21
Promotions on merit Yes 7 5.15
No 128 94.85
5.15
94.85 100
Yes No Total
Rising of Teachers to Management Positions
Percentage

31
Table 4.4.3 indicates that only 7 (5.15%) responses claimed that all the teachers holding
Administrative/Management positions in schools obtained those positions purely on merit while
the majority responses, 129 (94.85%) said that some of the individuals in
administrative/management positions did not rise to the positions purely on merit. The table
further shows that 3 (2.21%) respondents indicated that there were no forms of corruption in the
promotion process while 133 (97.79%) respondents out of the 136 alluded to the prevalence of
some forms of corruption in the promotion process.
4.4.4 Reliability of the Selection/Promotion Procedures
Below is a presentation of the details pertaining to whether the selection/promotion procedures
are reliable or not.
The findings indicated that only 3 (2.21%) responses said the promotion procedures were very
reliable or fair, 26 (19.12%) respondents said the promotion procedure were just reliable or fair
and the majority, 107 (78.67%) said that the promotion procedure were not reliable or fair at all.
The table also shows that 7 (5.15%) responses claimed that all the teachers holding
Administrative/Management positions in schools obtained those positions purely on merit while
the majority responses, 129 (94.85%) said that some of the individuals in
administrative/management positions did not rise to the positions purely on merit. The table
further shows that 5 (2.21%) respondents indicated that there were not forms of corruption in the
promotion process while 133 (97.79%) respondents out of the 136 alluded to the prevalence of
some forms of corruption in the promotion process.
4.4.5 Reasons for Promoting Incompetent Teachers to Administrative Positions
The following section presents the relationship between the presence of incompetent teachers in
administrative/management positions and the reasons why that is the case.
According to the findings, there are various forms of corruption in the promotion process
because there are teachers that have ascended to administrative/management positions beyond
merit provisions as justified by 133 (97.79%) responses in support of this fact against the 3
(2.21%) denying the vice (table 4.4.3). The findings also showed that 93 (68.38%) responses
alluded to nepotism, 113 (83.08%) responses alluded to bribery and 90 (66.17%) responses
alluded to political influence as some forms of corruption existing in the promotion process that

32
have given way to the rising of incompetent and ill-qualified persons to positions of
responsibility in the education system.
4.4.6 All eligible Teachers Apply for Advertised Positions/Promotion
The tabulation below gives the details pertaining to applications for promotion by eligible
teachers.
Table 4.4.6 Do all eligible Teachers Apply for Advertised Positions/Promotion?
Variable Response Frequency Percentage
All eligible staff
apply for promotion Yes 7 97.79
No 129 2.21
Total
136 100.00
Table 4.4.6 shows that, only 7 (5.15%) responses supported that all eligible teachers do apply for
promotion to advertised positions while the 129 (94.85%) respondents indicated that not all
eligible teachers do apply for promotion.
4.4.7 Reasons Why not All Eligible Teachers Apply for Promotion
The following section presents the reasons why not all eligible teachers apply for promotion to
advertised position.
According to the study findings, not all eligible teachers apply for promotion. This was
vindicated by the 129 (94.85%) responses in support against a total of 136. Further, 109
(80.15%) of the total valid responses identified the perceived biasness (no confidence) and lack
of adequate and timely information in the selection/promotion process as the major reasons why
not all eligible teachers apply for promotion.
4.4.8 Reliability of the Selection/Promotion Procedures
The following table presents the rating details of the perceptions regarding the reliability of the
selection/promotion procedures used in the education system.

33
Table 4.4.8 Reliability of the Selection/Promotion Procedures
Variable Response Frequency Percentage
Reliability Very reliable 3 2.21
Reliable
Not reliable
26
107
19.12
78.67
Total 136 100.00
Table 4.4.8 shows that the selection/promotion process is not reliable. This evidence is drawn
from the findings that only 3 (2.21%) responses said the process was very reliable/fair, 26
(19.12%) responses said the process was reliable/fair while the majority, 107 (78.67%)
respondents cited that the selection/promotion process was not reliable/fair at all.
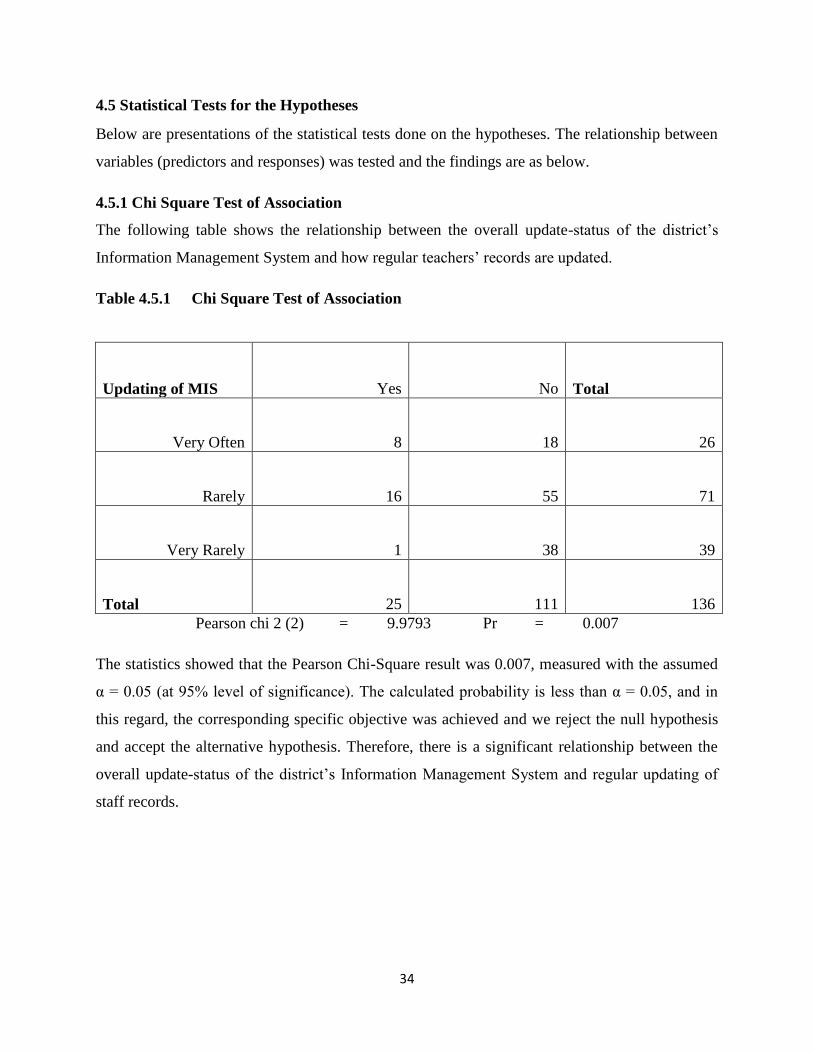
34
4.5 Statistical Tests for the Hypotheses
Below are presentations of the statistical tests done on the hypotheses. The relationship between
variables (predictors and responses) was tested and the findings are as below.
4.5.1 Chi Square Test of Association
The following table shows the relationship between the overall update-status of the district’s
Information Management System and how regular teachers’ records are updated.
Table 4.5.1 Chi Square Test of Association
Updating of MIS
Yes No Total
Very Often 8 18 26
Rarely 16 55 71
Very Rarely 1 38 39
Total 25 111 136
Pearson chi 2 (2) = 9.9793 Pr = 0.007
The statistics showed that the Pearson Chi-Square result was 0.007, measured with the assumed
α = 0.05 (at 95% level of significance). The calculated probability is less than α = 0.05, and in
this regard, the corresponding specific objective was achieved and we reject the null hypothesis
and accept the alternative hypothesis. Therefore, there is a significant relationship between the
overall update-status of the district’s Information Management System and regular updating of
staff records.

35
4.5.2 Regression Test
The following table shows the relationship between the overall update-status of the district’s
Information Management System and how regular teachers’ records are updated.
Table 4.5.2 Regression Test
Source SS df MS No. of obs. = 136
Model 4.32095654 1 4.32095654
F(1, 134) = 9.74
Residual 59.4363964 134 0.4435552
Prob. > F = 0.0022
Total 63.7573529 135 0.47227669
R-squared = 0.0678
Adj. R-squared= 0.0608
Root MSE = .666
Yes Coef. Std. Err. t P>|t| [95% Conf. Interval]
No 0.4601802 0.1474388 3.12 0.002 0.1685719 0.7517884
_cons 1.25982 0.273797 4.60 0.000 0.718297 1.801343
The statistics showed that the Regression test result was at p = 0.002, measured with the assumed
α = 0.05 (at 95% level of significance). The calculated probability is less than α = 0.05, and in
this regard, the corresponding specific objective was achieved and we reject the null hypothesis
and accept the alternative hypothesis. Therefore, there is a significant relationship between the
overall update-status of the district’s Information Management System and regular updating of
staff records.
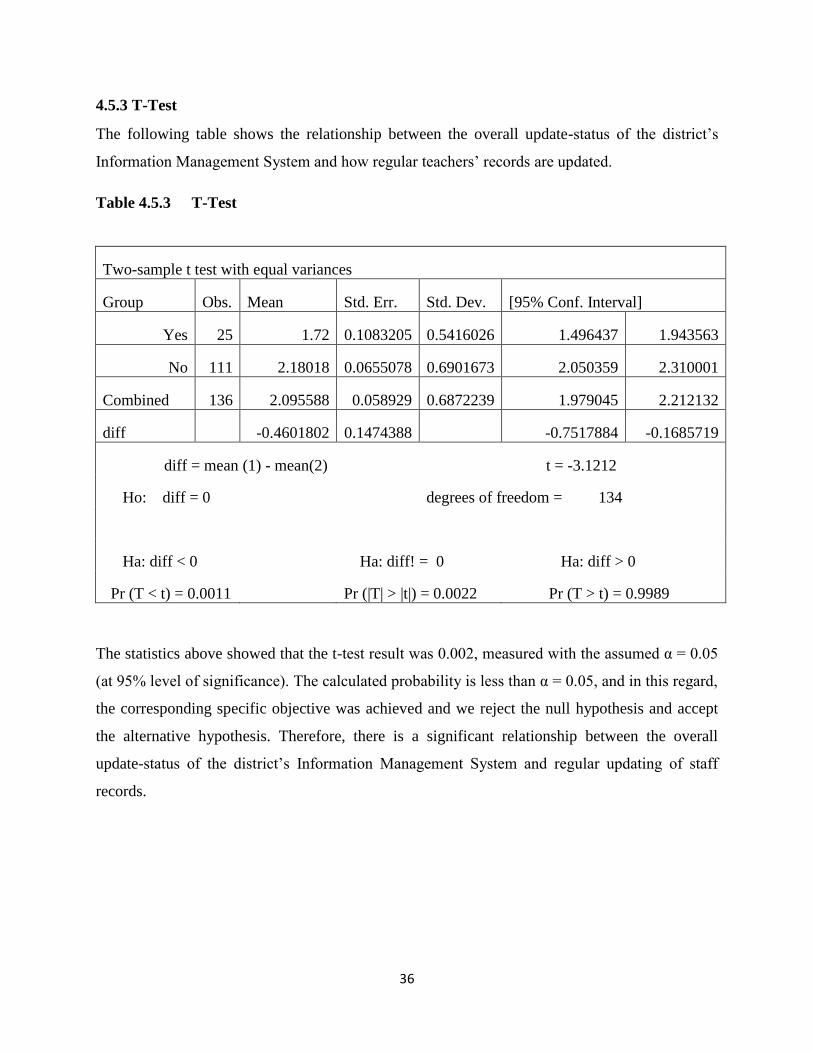
36
4.5.3 T-Test
The following table shows the relationship between the overall update-status of the district’s
Information Management System and how regular teachers’ records are updated.
Table 4.5.3 T-Test
Two-sample t test with equal variances
Group Obs. Mean Std. Err. Std. Dev. [95% Conf. Interval]
Yes 25 1.72 0.1083205 0.5416026 1.496437 1.943563
No 111 2.18018 0.0655078 0.6901673 2.050359 2.310001
Combined 136 2.095588 0.058929 0.6872239 1.979045 2.212132
diff -0.4601802 0.1474388 -0.7517884 -0.1685719
diff = mean (1) - mean(2)
t = -3.1212
Ho: diff = 0
degrees of freedom = 134
Ha: diff < 0
Ha: diff! = 0 Ha: diff > 0
Pr (T < t) = 0.0011 Pr (|T| > |t|) = 0.0022 Pr (T > t) = 0.9989
The statistics above showed that the t-test result was 0.002, measured with the assumed α = 0.05
(at 95% level of significance). The calculated probability is less than α = 0.05, and in this regard,
the corresponding specific objective was achieved and we reject the null hypothesis and accept
the alternative hypothesis. Therefore, there is a significant relationship between the overall
update-status of the district’s Information Management System and regular updating of staff
records.

37
4.5.4 Chi Square Test of Association
The following table shows the relationship between advertising using circulars through Head
teachers and the effectiveness of this mode of communication.
Table 4.5.4 Chi Square Test of Association
Response
(Circulars)
None Yes Total
(Method Effectiveness)
Very Effective 0 1 1
Effective 4 53 57
Not Effective 5 73 78
Total 9 127 136
Pearson chi 2 (2) = 0.0910 Pr = 0.955
The statistics showed that the Pearson Chi-Square result was 0.955, measured with the assumed
α = 0.05 (at 95% level of significance). The calculated probability is greater than α = 0.05, and in
this regard, the corresponding specific objective was achieved and we accept the null hypothesis
and reject the alternative hypothesis. Therefore, the use of circulars in the communication system
is not a factor of significant influence on the effectiveness of the communication system.
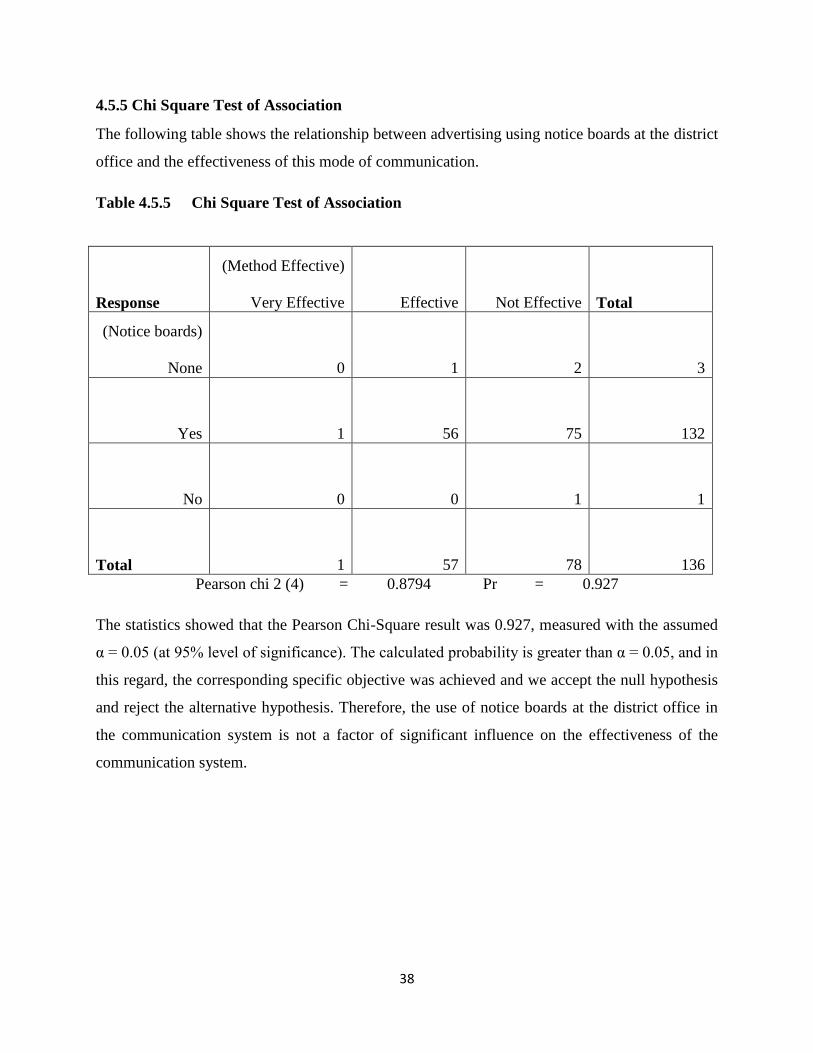
38
4.5.5 Chi Square Test of Association
The following table shows the relationship between advertising using notice boards at the district
office and the effectiveness of this mode of communication.
Table 4.5.5 Chi Square Test of Association
Response
(Method Effective)
Very Effective Effective Not Effective Total
(Notice boards)
None 0 1 2 3
Yes 1 56 75 132
No 0 0 1 1
Total 1 57 78 136
Pearson chi 2 (4) = 0.8794 Pr = 0.927
The statistics showed that the Pearson Chi-Square result was 0.927, measured with the assumed
α = 0.05 (at 95% level of significance). The calculated probability is greater than α = 0.05, and in
this regard, the corresponding specific objective was achieved and we accept the null hypothesis
and reject the alternative hypothesis. Therefore, the use of notice boards at the district office in
the communication system is not a factor of significant influence on the effectiveness of the
communication system.
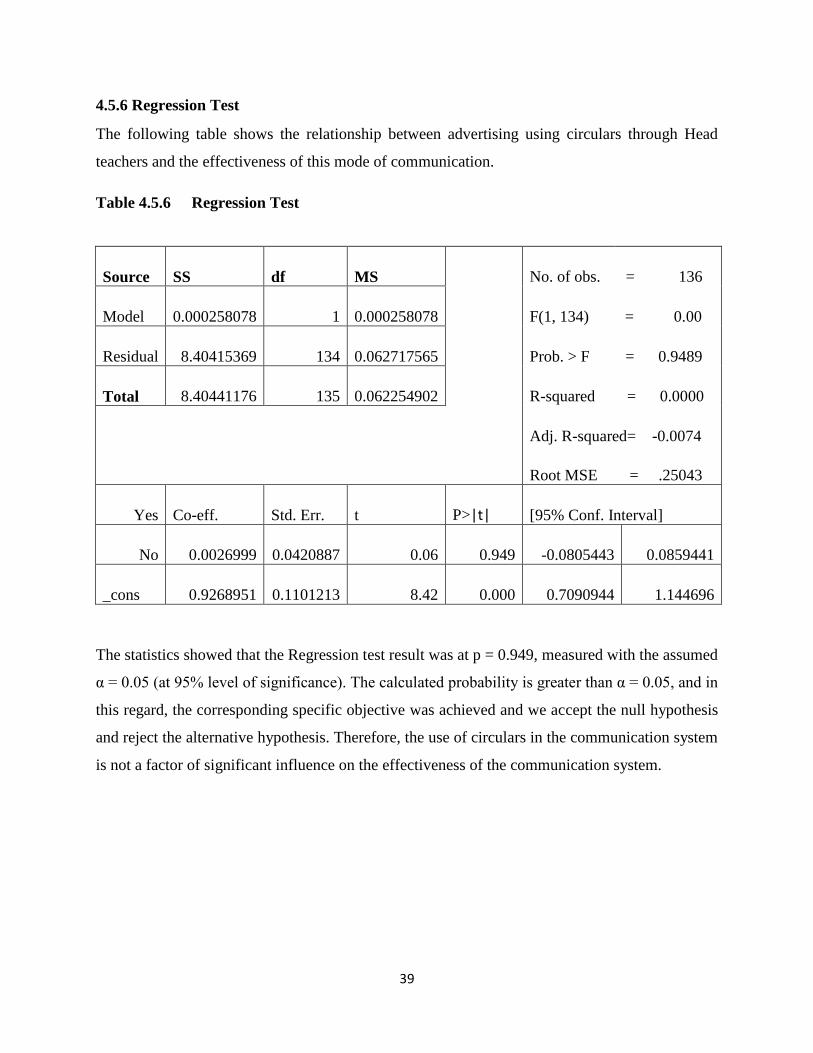
39
4.5.6 Regression Test
The following table shows the relationship between advertising using circulars through Head
teachers and the effectiveness of this mode of communication.
Table 4.5.6 Regression Test
Source SS df MS No. of obs. = 136
Model 0.000258078 1 0.000258078
F(1, 134) = 0.00
Residual 8.40415369 134 0.062717565
Prob. > F = 0.9489
Total 8.40441176 135 0.062254902
R-squared = 0.0000
Adj. R-squared= -0.0074
Root MSE = .25043
Yes Co-eff. Std. Err. t P>|t| [95% Conf. Interval]
No 0.0026999 0.0420887 0.06 0.949 -0.0805443 0.0859441
_cons 0.9268951 0.1101213 8.42 0.000 0.7090944 1.144696
The statistics showed that the Regression test result was at p = 0.949, measured with the assumed
α = 0.05 (at 95% level of significance). The calculated probability is greater than α = 0.05, and in
this regard, the corresponding specific objective was achieved and we accept the null hypothesis
and reject the alternative hypothesis. Therefore, the use of circulars in the communication system
is not a factor of significant influence on the effectiveness of the communication system.

40
4.5.7 Regression Test
The following table shows the relationship between advertising using notice boards at the district
office and the effectiveness of this mode of communication.
Table 4.5.7 Regression Test
Source SS df MS No. of obs. = 136
Model 0.000494777 1 0.000494777
F(1, 134) = 0.02
Residual 3.97009346 134 0.029627563
Prob. > F = 0.8974
Total 3.97058824 135 0.029411765
R-squared = 0.0001
Adj. R-squared= 0.0073
Root MSE = 0.17213
Yes Coef. Std. Err. t P>|t| [95% Conf. Interval]
No 0.0037383 0.0289281 0.13 0.897 -0.0534763 0.060953
_cons 0.9757009 0.0756876 12.89 0.000 0.8260041 1.125398
The statistics showed that the Regression test result was at p = 0.897, measured with the assumed
α = 0.05 (at 95% level of significance). The calculated probability is greater than α = 0.05, and in
this regard, the corresponding specific objective was achieved and we accept the null hypothesis
and reject the alternative hypothesis. Therefore, the use of notice boards at the district office in
the communication system is not a factor of significant influence on the effectiveness of the
communication system.

41
4.5.8 Chi Square Test of Association
The following table shows the relationship between the reliability of the selection/promotion
process and poor communication in the process of staff promotion.
Table 4.5.8 Chi Square Test of Association
Response
(Poor Communication)
None Yes Total
(Process Reliability)
Very Reliable 0 3 3
Reliable 2 24 26
Not Reliable 33 74 107
Total 35 101 136
Pearson chi 2 (2) = 6.9278 Pr = 0.031
The statistics showed that the Pearson Chi-Square result was 0.031, measured with the assumed
α = 0.05 (at 95% level of significance). The calculated probability is less than α = 0.05, and in
this regard, the corresponding specific objective was achieved and we reject the null hypothesis
and accept the alternative hypothesis. Therefore, there is a significant relationship between poor
communication in the selection/promotion process and the reliability of the promotion
procedures.

42
4.5.9 Chi Square Test of Association
The following table shows the relationship between the reliability of the selection/promotion
process and nepotism in the process of staff promotion.
Table 4.5.9 Chi Square Test of Association
Response
(Nepotism Presence)
None Yes Total
(Process Reliability)
Very Reliable 3 0 3
Reliable 23 3 26
Not Reliable 17 90 107
Total 43 93 136
Pearson chi 2 (2) = 57.5901 Pr = 0.000
The statistics showed that the Pearson Chi-Square result was 0.000, measured with the assumed
α = 0.05 (at 95% level of significance). The calculated probability is less than α = 0.05, and in
this regard, the corresponding specific objective was achieved and we reject the null hypothesis
and accept the alternative hypothesis. Therefore, there is a significant relationship between
nepotism in the selection/promotion process and the reliability of the promotion procedures.
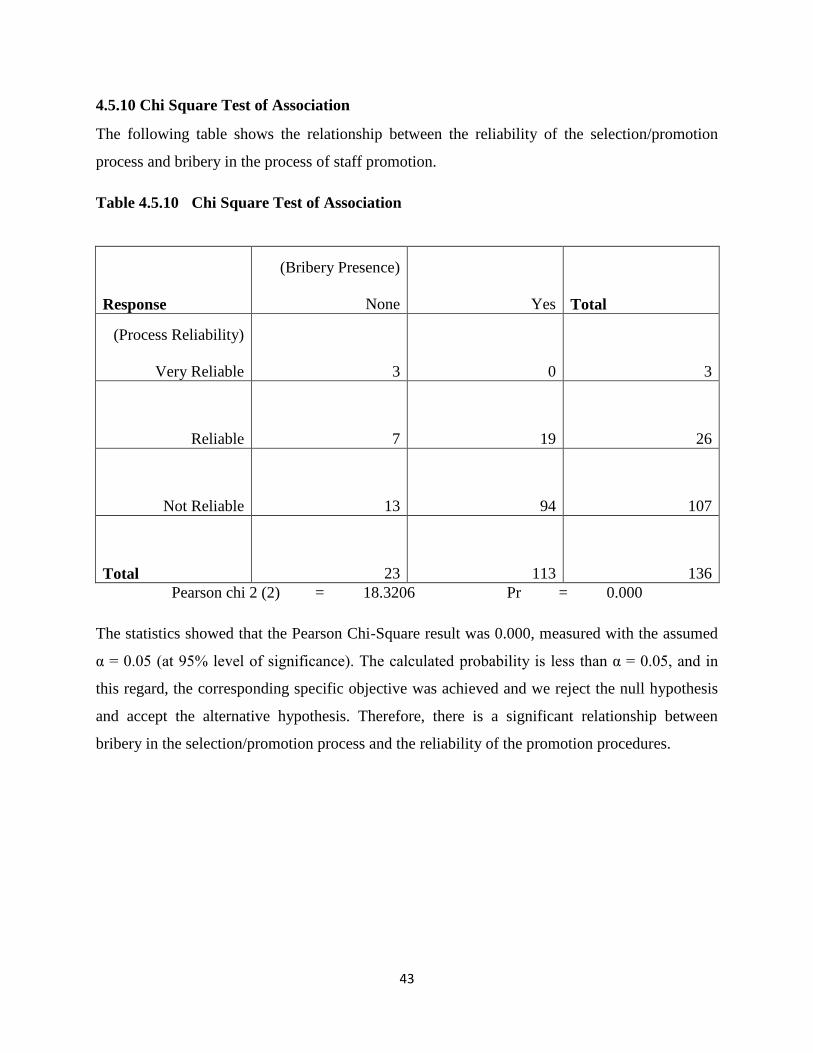
43
4.5.10 Chi Square Test of Association
The following table shows the relationship between the reliability of the selection/promotion
process and bribery in the process of staff promotion.
Table 4.5.10 Chi Square Test of Association
Response
(Bribery Presence)
None Yes Total
(Process Reliability)
Very Reliable 3 0 3
Reliable 7 19 26
Not Reliable 13 94 107
Total 23 113 136
Pearson chi 2 (2) = 18.3206 Pr = 0.000
The statistics showed that the Pearson Chi-Square result was 0.000, measured with the assumed
α = 0.05 (at 95% level of significance). The calculated probability is less than α = 0.05, and in
this regard, the corresponding specific objective was achieved and we reject the null hypothesis
and accept the alternative hypothesis. Therefore, there is a significant relationship between
bribery in the selection/promotion process and the reliability of the promotion procedures.
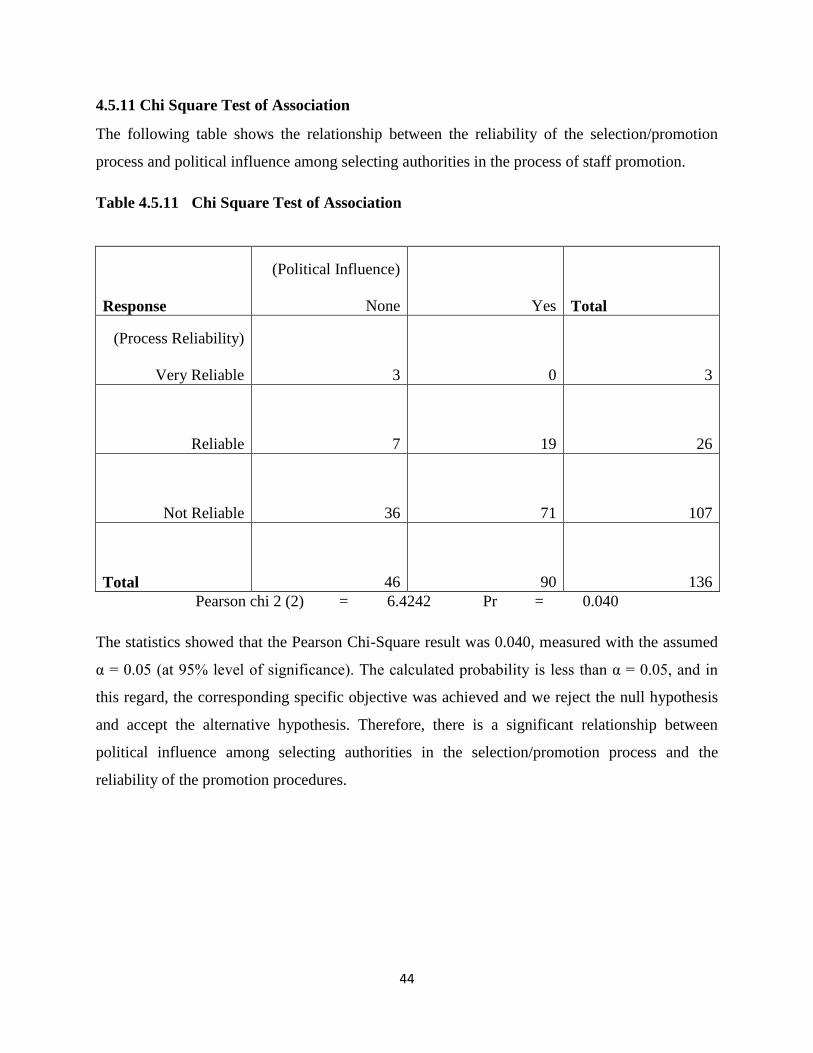
44
4.5.11 Chi Square Test of Association
The following table shows the relationship between the reliability of the selection/promotion
process and political influence among selecting authorities in the process of staff promotion.
Table 4.5.11 Chi Square Test of Association
Response
(Political Influence)
None Yes Total
(Process Reliability)
Very Reliable 3 0 3
Reliable 7 19 26
Not Reliable 36 71 107
Total 46 90 136
Pearson chi 2 (2) = 6.4242 Pr = 0.040
The statistics showed that the Pearson Chi-Square result was 0.040, measured with the assumed
α = 0.05 (at 95% level of significance). The calculated probability is less than α = 0.05, and in
this regard, the corresponding specific objective was achieved and we reject the null hypothesis
and accept the alternative hypothesis. Therefore, there is a significant relationship between
political influence among selecting authorities in the selection/promotion process and the
reliability of the promotion procedures.

45
4.5.12 Regression Test
The following table shows the relationship between the reliability of the selection/promotion
process and poor communication in the process of staff promotion.
Table 4.5.12 Regression Test
Source SS df MS No. of obs. = 136
Model 1.49576504 1 1.49576504
F(1, 134) = 6.92
Residual 28.9748232 134 0.216230024
Prob. > F = 0.0095
Total 30.4705882 135 0.225708061
R-squared = 0.0491
Adj. R-squared= 0.0420
Root MSE = 0.46501
Yes Coef. Std. Err. t P>|t| [95% Conf. Interval]
No -0.2398868 0.091208 -2.63 0.010 -0.4202803 -0.0594934
_cons 2.942857 0.0786003 37.44 0.000 2.7874 3.098315
The statistics showed that the Regression test result was at p = 0.01, measured with the assumed
α = 0.05 (at 95% level of significance). The calculated probability is less than α = 0.05, and in
this regard, the corresponding specific objective was achieved and we reject the null hypothesis
and accept the alternative hypothesis. Therefore, poor communication has a significant effect on
the reliability/fairness of the selection/promotion process.

46
4.5.13 Regression Test
The following table shows the relationship between the reliability of the selection/promotion
process and nepotism in the process of staff promotion.
Table 4.5.13 Regression Test
Source SS df MS No. of obs. = 136
Model 12.125502 1 12.125502
F(1, 134) = 88.57
Residual 18.3450863 134 0.136903629
Prob. > F = 0.0000
Total 30.4705882 135 0.225708061
R-squared = 0.3979
Adj. R-squared= 0.3934
Root MSE = 0.37
Yes Coef. Std. Err. t P>|t| [95% Conf. Interval]
No 0.6421605 0.0682341 9.41 0.000 0.5072055 0.7771156
_cons 2.325581 0.0564252 41.22 0.000 2.213982 2.437181
The statistics showed that the Regression test result was at p = 0.00, measured with the assumed
α = 0.05 (at 95% level of significance). The calculated probability is less than α = 0.05, and in
this regard, the corresponding specific objective was achieved and we reject the null hypothesis
and accept the alternative hypothesis. Therefore, nepotism has a significant effect on the
reliability/fairness of the selection/promotion process.

47
4.5.14 Regression Test
The following table shows the relationship between the reliability of the selection/promotion
process and bribery in the process of staff promotion.
Table 4.5.14 Regression Test
Source SS df MS No. of obs. = 136
Model 3.01310459 1 3.01310459
F(1, 134) = 14.70
Residual 27.4574836 134 0.204906594
Prob. > F = 0.0002
Total 30.4705882 135 0.225708061
R-squared = 0.0989
Adj. R-squared= 0.0922
Root MSE = 0.45267
Yes Coef Std. Err. t P>|t| [95% Conf. Interval]
No 0.3970758 0.1035486 3.83 0.000 0.1922747 0.6018769
_cons 2.434783 0.0943874 25.80 0.000 2.248101 2.621464
The statistics showed that the Regression test result was at p = 0.00, measured with the assumed
α = 0.05 (at 95% level of significance). The calculated probability is less than α = 0.05, and in
this regard, the corresponding specific objective was achieved and we reject the null hypothesis
and accept the alternative hypothesis. Therefore, bribery has a significant effect on the
reliability/fairness of the selection/promotion process.
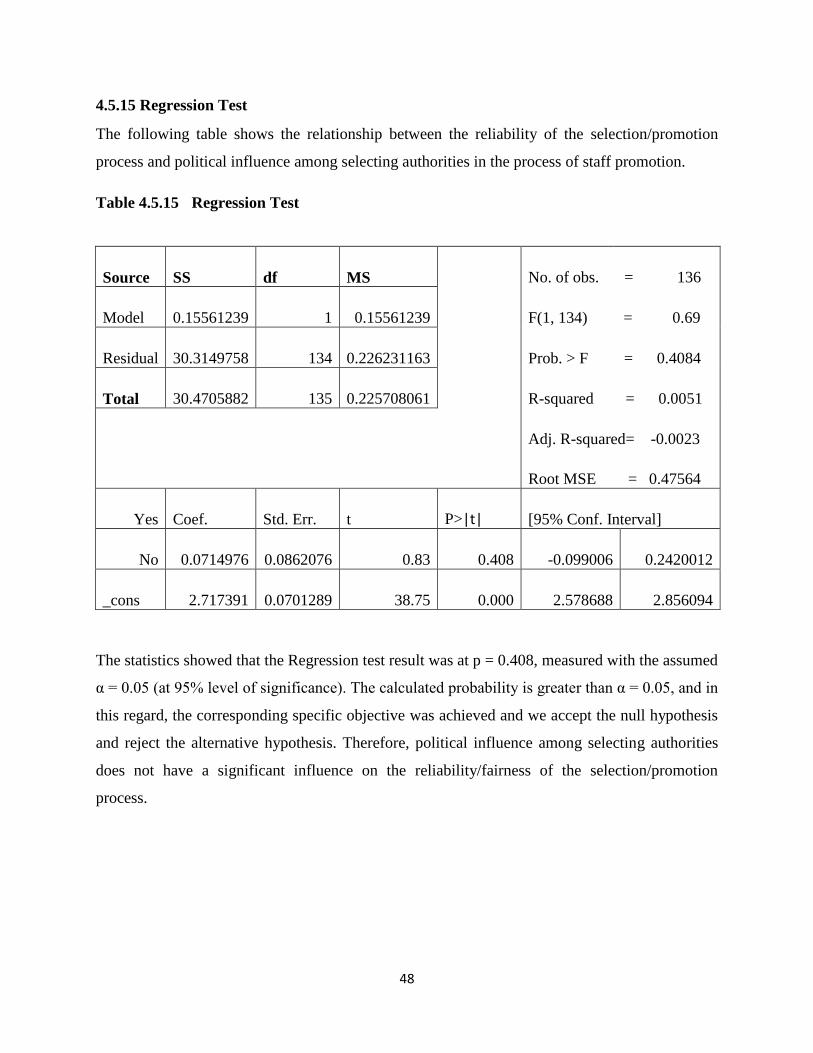
48
4.5.15 Regression Test
The following table shows the relationship between the reliability of the selection/promotion
process and political influence among selecting authorities in the process of staff promotion.
Table 4.5.15 Regression Test
Source SS df MS No. of obs. = 136
Model 0.15561239 1 0.15561239
F(1, 134) = 0.69
Residual 30.3149758 134 0.226231163
Prob. > F = 0.4084
Total 30.4705882 135 0.225708061
R-squared = 0.0051
Adj. R-squared= -0.0023
Root MSE = 0.47564
Yes Coef. Std. Err. t P>|t| [95% Conf. Interval]
No 0.0714976 0.0862076 0.83 0.408 -0.099006 0.2420012
_cons 2.717391 0.0701289 38.75 0.000 2.578688 2.856094
The statistics showed that the Regression test result was at p = 0.408, measured with the assumed
α = 0.05 (at 95% level of significance). The calculated probability is greater than α = 0.05, and in
this regard, the corresponding specific objective was achieved and we accept the null hypothesis
and reject the alternative hypothesis. Therefore, political influence among selecting authorities
does not have a significant influence on the reliability/fairness of the selection/promotion
process.

49
4.5.16 T-Test
The following table shows the relationship between the reliability of the selection/promotion
process and poor communication in the process of staff promotion.
Table 4.5.16 T-Test
Two-sample t test with equal variances
Group Obs. Mean Std. Err. Std. Dev. [95% Conf. Interval]
None 35 2.942857 0.0398075 0.2355041 2.861959 3.023756
Yes 101 2.70297 0.0517889 0.520472 2.600223 2.805718
Combined 136 2.764706 0.0407384 0.4750874 2.684138 2.845274
diff 0.2398868 0.091208 0.0594934 0.4202803
diff = mean (0) - mean(1)
t = 2.6301
Ho: diff = 0
degrees of freedom = 134
Ha: diff < 0
Ha: diff! = 0 Ha: diff > 0
Pr (T < t) = 0.9952 Pr (|T| > |t|) = 0.0095 Pr (T > t) = 0.0048
The statistics in the table above showed that the t-test result was 0.0095, measured with the
assumed α = 0.05 (at 95% level of significance). The calculated probability is less than α = 0.05,
and in this regard, the corresponding specific objective was achieved and we reject the null
hypothesis and accept the alternative hypothesis. Therefore, there is a significant relationship
between poor communication and the reliability of the selection/promotion procedures.

50
4.5.17 T-Test
The following table shows the relationship between the reliability of the selection/promotion
process and nepotism in the process of staff promotion.
Table 4.5.17 T-Test
Two-sample t test with equal variances
Group Obs. Mean Std. Err. Std. Dev. [95% Conf. Interval]
None 43 2.325581 0.0924679 0.6063525 2.138974 2.512189
Yes 93 2.967742 0.0184207 0.1776423 2.931157 3.004327
Combined 136 2.764706 0.0407384 0.4750874 2.684138 2.845274
diff -0.6421605 0.0682341 -0.7771156 -0.5072055
diff = mean (0) - mean(1)
t = -9.4111
Ho: diff = 0
degrees of freedom = 134
Ha: diff < 0
Ha: diff! = 0 Ha: diff > 0
Pr (T < t) = 0.0000 Pr (|T| > |t|) = 0.0000 Pr (T > t) = 1.0000
The statistics above showed that the t-test result was 0.000, measured with the assumed α = 0.05
(at 95% level of significance). The calculated probability is less than α = 0.05, and in this regard,
the corresponding specific objective was achieved and we reject the null hypothesis and accept
the alternative hypothesis. Therefore, there is a significant relationship between nepotism in the
selection/promotion process and the reliability of the selection/promotion procedures.

51
4.5.18 T-Test
The following table shows the relationship between the reliability of the selection/promotion
process and bribery in the process of staff promotion.
Table 4.5.18 T-Test
Two-sample t test with equal variances
Group Obs. Mean Std. Err. Std. Dev. [95% Conf. Interval]
None 23 2.434783 0.1517498 0.7277666 2.120073 2.749492
Yes 113 2.831858 0.0353389 0.3756579 2.761839 2.901878
Combined 136 2.764706 0.0407384 0.4750874 2.684138 2.845274
diff -0.3970758 0.1035486 -0.6018769 -0.1922747
diff = mean (0) - mean(1)
t = -3.8347
Ho: diff = 0
degrees of freedom = 134
Ha: diff < 0
Ha: diff! = 0 Ha: diff > 0
Pr (T < t) = 0.0001 Pr (|T| > |t|) = 0.0002 Pr (T > t) = 0.9999
The statistics in the table above showed that the t-test result was 0.0002, measured with the
assumed α = 0.05 (at 95% level of significance). The calculated probability is less than α = 0.05,
and in this regard, the corresponding specific objective was achieved and we reject the null
hypothesis and accept the alternative hypothesis. Therefore, there is a significant relationship
between bribery in the selection/promotion process and the reliability of the selection/promotion
procedures.

52
4.5.19 T-Test
The following table shows the relationship between the reliability of the selection/promotion
process and political influence among selecting authorities in the process of staff promotion.
Table 4.5.19 T-Test
Two-sample t test with equal variances
Group Obs. Mean Std. Err. Std. Dev. [95% Conf. Interval]
None 46 2.717391 0.086046 0.5835921 2.544086 2.890697
Yes 90 2.788889 0.0432582 0.4103833 2.702936 2.874842
Combined 136 2.764706 0.0407384 0.4750874 2.684138 2.845274
diff -0.0714976 0.0862076 -0.2420012 0.99006
diff = mean (0) - mean(1)
t = -0.8294
Ho: diff = 0
degrees of freedom = 134
Ha: diff < 0
Ha: diff! = 0 Ha: diff > 0
Pr (T < t) = 0.2042 Pr (|T| > |t|) = 0.4084 Pr (T > t) = 0.7958
The statistics above showed that the t-test result was 0.408, measured with the assumed α = 0.05
(at 95% level of significance). The calculated probability is greater than α = 0.05, and in this
regard, the corresponding specific objective was achieved and we accept the null hypothesis and
reject the alternative hypothesis. Therefore, there is no significant relationship between political
influence in the selection/promotion process and the reliability of the selection/promotion
procedures.

53
CHAPTER FIVE
5.0 DISCUSSION
The study findings show that the process of recruiting, selecting and appointing staff for
promotion in the education system is not effective. Further indications are that there is poor
management of information, poor information communications system, uncertain or ambiguous
criteria for promoting staff and the whole process of recruiting, selecting and appointing staff for
promotion is marred with corruption. These findings correlate with the literature by Ibara (2010),
Okpetu & Peretomode (1995), Durosaro, (2002) and Ololube (2013). There is also a substantial
correlation between the findings of this study and the findings of the studies conducted by
Lolojih (2008), Alikipo (1987), Moonga, (2005).
The findings of this study revealed that, clear, fair and sound promotion criteria or procedures,
free from corruption, and an effective information management system, which enhances prudent
record keeping, easy access to vital information as well as its retrieval, have a significant
influence on the overall effectiveness of the recruitment, selection and appointment process with
regard to promotion of staff to administrative/management positions. The study further found out
that a good and reliable information communication system is an instrumental tool in fostering
the existence of an effective promotion process, right from recruitment, through selection to
appointment of staff.
The above facts have been arrived at as evidenced by the results of the statistical tests carried out
on the hypotheses or the predictors associated with the specific objective. For specific objective
number one; to assess the effectiveness of the information management system used in the
district’s education system, the information management system was found not be effective
because it was not regularly updated. 111 out of 136 responses indicated that the system used in
managing information was mostly not up to date (table 4.2.5). The Chi Square test result was
p=0.007 (table 4.5.1), the Regression test result was p=0.002 (table 4.5.2) and the t-test result
was p=0.0022 (table 4.5.3). All these statistical tests results show a p-value less than the assumed
or theoretical p-value of 0.05 thus confirming the existence of a significant correlation between
an up to date information system and an effective recruitment, selection and appointment
process.

54
With reference to specific objective number two; to establish the fairness of the criteria used in
the recruitment, selection and appointment of staff for promotion in the district’s education
system, the relationship between corruption and the reliability/fairness of the promotion criteria
or procedures was investigated. The findings showed that there was presence of corruption in the
promotion process as justified by 133 out of 136 responses (table 4.4.7). The major forms of
corruption identified were nepotism, bribery and political influence. Nepotism is one form of
corruption that was found to be playing a key role in compromising the quality of the
recruitment, selection and appointment processes in the promotion of staff in the education
system. The presence of nepotism was supported by 93 responses out of 136, representing
68.38% (table 4.4.5). The Chi Square test result was p=0.000 (table 4.5.9), the Regression test
result was p=0.000 (table 4.5.13) and the t-test result was p=0.000 (table 4.5.17). All these
statistical tests results show a p-value less than the assumed or theoretical p-value of 0.05 thus
confirming the existence of a significant relationship between nepotism, a form of corruption,
and an effective recruitment, selection and appointment process.
Bribery is one other form of corruption that was found to be playing a pivotal role in
compromising the quality of the recruitment, selection and appointment processes in the
promotion of staff in the education system. The presence of bribery was supported by 113
responses out of 136, representing 83.09% (table 4.4.6). The Chi Square test result was p=0.000
(table 4.5.10), the Regression test result was p=0.000 (table 4.5.14) and the t-test result was
p=0.0002 (table 4.5.18). All these statistical tests results show a p-value less than the assumed or
theoretical p-value of 0.05 thus confirming the existence of a significant relationship between
bribery, a form of corruption, and an effective recruitment, selection and appointment process.
The third and final form of corruption cited in the study is political influence. The presence of
bribery was supported by 90 responses out of 136, representing 66.18% (table 4.4.7). The Chi
Square test result was p=0.040 (table 4.5.11). The statistical test result of the Chi Square test of
association shows a p-value less than the assumed or theoretical p-value of 0.05 thus confirming
the existence of a significant relationship between political influence, a form of corruption, and
an effective recruitment, selection and appointment process.
The third specific objective; to investigate the reliability of the information communication
system used in the district’s education system, had the information communication system in

55
place weighed against the effectiveness of the recruitment, selection and appointment processes
by statistical means. The findings showed that the statistical tests results were; the Chi Square
test result was p=0.031 (table 4.5.8), the Regression test result was p=0.01 (table 4.5.12) and the
t-test result was p=0.0095 (table 4.5.16). All these statistical tests results show a p-value less than
the assumed or theoretical p-value of 0.05 thus confirming the existence of a significant
relationship between a reliable information communication system and an effective recruitment,
selection and appointment process.
According to Cole (2002), one of the first steps in planning for recruitment of employees into the
organisation is to establish adequate policies and procedures. There are policies aimed at
attracting and retaining effective teachers, recruiting competent people into the profession, and
providing support and incentives for professional development and on-going high performance
(Sikazwe et’ al., 2003). Despite the existence of such policies, the system has been corrupted and
there have been several appointments made on the basis of nepotism and other biased
preferences.
It is prudent, according to the researcher’s view, to agree with Cole and Sikazwe and others. A
well formulated and observed policy direction is essential for successful recruitment, selection
and appointment of staff in any organisation. The saddest side of all is that there are several
policies in the education sector that are aimed at enhancing effectiveness and professionalism yet
there existence is merely paper-bound. There are no stringent measures put in place to ensure the
successful implementation of such policies.
For every successful professional undertaking, central to its success is an effective information
management system. Record keeping and the management of records is a vital responsibility of
the education administrators because of the indispensable role of records and information in the
day-to-day activities of the education system. Education managers rely on the short and long-
term data captured in records to make effective decisions about immediate issues and more
comprehensive policies (Okpetu & Peretomode, 1995). According to Ibara (2010), without
records there can be no accountability. The three writers justify the significance of good record
keeping which is enhanced by the presence and utilisation of an effective information
management system. It is indeed true and logical that accountability, fairness and
professionalism may never be realised in the absence of a sound record keeping mechanism.

56
Educational leaders recognize the critical importance of teacher quality, yet they struggle with
the question of how to find and recruit the best and the brightest within a relatively limited
talent-pool. From an organizational standpoint, tapping into this talent requires a significant
upfront investment of human and financial resources, aided by a sound information management
system (Cole, 2004). Therefore, for the education sector to succeed in its endeavour to tap the
best personnel during recruitment, selection and appointment processes, it should devise and
sustain a sound information management system that will facilitate real-time record updating,
access to data, data retrieval as well as information utilisation.
Effective use of data and information at middle and lower levels is of absolute necessity.
Through a carefully controlled programme, schools and managers in the education system will
be trained to improve not just the management of their institutions but make informed decisions
based on the available information and what they are able to access on-line from other regions
(Sikazwe et’ al., 2003). The researcher agrees with Sikazwe and others that good decision-
making is a product of sound information management.
In Gambia the introduction of Education Management Information Systems (EMIS) provided an
objective means of tracking and ranking teachers by seniority, language skills, specialisation, and
other relevant factors for appointment. The EMIS thus laid grounds for appointments and
promotions made on the basis of merit. The information prevented appointments based on
personal connections and other invalid grounds (Department of State Education of Gambia 2001,
in B. I. Spector et al. 2005). According to statistics, 133 out of 136 responses, representing
97.79%, indicated that there were teachers that did not get promoted on merit. This fact suggests
that in Zambia, Mazabuka district in particular, the EMIS has not served its purposed due to the
presence of a number of lapses that it should have taken care of.
The integration of the world economy has been made possible with strong and efficient channels
of communication. The nature of communication has undergone significant changes during the
past few years. Now the economic power lies in the hands of the countries having very sound
information technology networks. Communication is important from the point of view of
understanding it in terms of a process, system, interactional base and structuring. There are
various objectives of communication in business organisations. Prudence, coordination and
enhanced economic, social, political and cultural growth are all products of good information
57
systems. If the intended massage does not get to the right person, in the right format, then this
could affect the entire organisation. Worse still, the wrong messages might be passed on to the
wrong people. This could actually harm the organisation (Shariq, 2014). The researcher remains
in agreement with Shariq. Statistics have shown that it is more often that the right information
does not reach the right people at the right time. 129 out 136 (94.85) responses said that the right
information did not reach the rightful persons on time and in its correct form.
The ideal thing is that vacant positions in the Teaching Service be advertised to promote fair and
open competition and provide the best opportunity to attract a wide field of applicants.
Unfortunately, competition for the advertised vacancies has not been fair over the years. There
have been concerns with regard to the way advertisements have been run. It is questionable that
information about the availability of vacancies has really been reaching all the prospective
contenders. Statistics have shown that some prospective contenders do not get the right
information at the right time and this fact has been vindicated by statistics. It has been confirmed
that teachers have complained about not receiving the right information on time and in good
form. 129 out 136 (94.85) responses said that the right information did not reach the rightful
persons on time and in its correct form.
Corruption is a compounding variable in most remunerable circumstance. Corruption in the
education system can take several faces such as bribes paid by parents to teachers to ensure good
examination results, bribes paid by teachers to public officials to get preferred posting and
promotion. ICT facilities have been adopted in most systems and organisations world-over in a
bid to curb bias and enhance professionalism. It is however saddening to learn that, despite the
presence of ICT facilities that aid professionalism, processes of staff recruitment, selection and
appointment in the education sector are still being conducted in unprofessional ways, marred
with various forms of corruption. In the past years, most promotions in the teaching fraternity
were made on tribal and nepotistic lines (Phiri, 2013). The above citation from Phiri confirms the
researcher’s assertion that the promotion process in the education sector is not effective as it is
not free of corruption. The fact that some members of staff in the teaching service have not been
promoted on merit, justifies that the recruitment, selection and appointment process has not been
fairly and professionally conducted over the years.

58
CHAPTER SIX
6.0 CONCLUSION AND RECOMMENDATIONS
6.1 Conclusion
The study revealed that education administration/management in schools in Mazabuka district
was dominated by people who do not have official qualifications in education
administration/management. It was also found that there were about twice the number of males
than females holding administrative/management positions in schools. The study further
indicated that the information management system being used in the district was rarely updated
hence rendering it ineffective in as far as dependability of the information was concerned. The
information communications system being used was equally ineffective because most of the
targeted people did not receive the intended information at the right time and, in most cases, in
the right form. The promotion procedures were found to be marred with corruption. The most
common forms of corruption identified were nepotism, bribery and political influence. The
above findings justify that the entire process of staff promotion, from recruitment, selection and
finally to appointment, had serious lapses that compromised professionalism and efficiency in a
bid to promote only the duly deserving individuals based on merit. It is therefore clear that the
processes of recruitment, selection and appointment of staff for promotion in the district were not
effective.
6.2 Recommendations
Having successfully conducted the study and understood the interpretations of the findings, the
Researcher recommends that;
1. The government revisits and refines the policy framework on staff promotion so that
transparency and accountability are enhanced in the course of promoting staff in the
education sector so as to ensure that only those people duly qualified, competent and
fairly selected rise to positions of responsibility.
2. The Ministry of Education, in partnership with other stakeholders, both public and
private, taking advantage of ICT facilities, works on the development and sustainability
of an information system that will enhance effective data capturing, record keeping,
information retrieval and information dissemination mechanisms aimed at identifying all

59
the suitable contenders and reaching out to them correctly and timely in a fair and
transparent manner.
3. The government draws a distinct boundary between Politics and Public Administration
and devises a deliberate policy that will deter politicians from interfering with
management structures within the operations of government.
4. Other academicians conduct similar or related studies in other areas in order to fully
justify the authenticity and credibility of the findings of this study.

60
References
1. Achievement First, 2007, The design and implementation of a highly effective teacher
recruitment system, San Francisco, CA, New schools venture.
2. Alikipo, C 2007, A comparative Study of recruitment and selection policies and practices
for academic staff at first appointment in higher education, A Masters of Arts
Dissertation, Bath, University of Bath.
3. Armstrong, M 2009, Handbook of human resource management and Practice, 11th
ed.,
New Delhi: Replika Press Pvt Ltd
4. Basu, R 2003, Public administration, concepts and themes, New Delhi, Sterling
Publishers Ltd.
5. Bhaskar, C 2007, Human resource management, New Delhi, Sterling Publishers Ltd.
6. Bryman, A 2004, Social research methods, New York, Oxford Press.
7. Central Statistical Office, 2010, Census of population and housing, preliminary report,
Lusaka, Government of the Republic of Zambia
8. Chr. Michelsen Institute (CMI), 2006, Corruption in the education sector, U4 issue 4,
Bergen, Chr. Michelsen Institute.
9. Cole, G A 2002, Personnel and human management, 5th
ed., London, Book Power.
10. Cole, G A 2004, Management theory and practice, London, Book Power.
11. Durosaro, D O 2002, Management of school records, Illorin, Indemac.
12. Ibara, E C 2010, Perspectives in educational administration, Port Harcourt, Rodi Printing
and Publishing.
13. International Records Management Trust (IRMT), 2007, Fostering trust and transparency
in governance, investigating and addressing the requirements for building integrity in
public sector information systems in the ICT environment, London, UK Department for
International Development.
14. Kombo, D K & Tromp, D A 2006, Proposal and thesis writing, an introduction, Nairobi,
Pauline’s Publications Africa.
15. Kumar R S 2011, Master of human resource and organizational development, recruitment
and selection-summer-report, Delhi, University of Delhi. (Available at http//www.sribd,
Accessed on October 5 2015).
61
16. Lolojih, K 2008, Local government and service delivery in the third republic, PhD
Thesis, Lusaka, University of Zambia.
17. Mckinney, P 2014, The business dictionary.
18. Mondy, W. et’ al., 2002, Human resource management, New-Jersey, Prentice Hall.
19. Moonga, M 2005, The impact of changes of central government policies on operations of
councils, A Master of Arts Dissertation, Kitwe, Copperbelt University.
20. Nwaoku, N A 2005, Educational management in Nigeria, theory and practice, Aba,
Assemblies of God Press.
21. Ololube, N P 2009, Understanding teachers’ professional competencies for education
effectiveness, Owerri, Spring Field Publishers.
22. Ololube, N P 2011, Education and society, an interactive approach, Owerri, Spring Field
Publishers.
23. Ololube, N P 2012, Sociology of education and society, an interactive approach, Owerri,
Spring Field Publishers.
24. Ololube, N P 2013, Educational management, planning and supervision, model for
effective implementation, Owerri, Spring Field Publishers.
25. Okpetu, S A, & Peretomode, O 1995, School records in educational administration,
Lagos, Joja Educational Research and Publishers.
26. Parahoo, K 2006, Nursing research, principles, process and issues, Basingstoke, Palgrave
Macmillan Ltd.
27. Phiri, J 2013, Tribal appointments and promotions will not be tolerated, Lusaka, Times of
Zambia Newspaper (9/04/13).
28. Shariq, H 2014, Significance of effective communication, Karachi, Karachi Chamber of
Commerce.
29. Sikazwe, A K, Kalabula, D M & Chizambe, E 2003, Reference paper, round table
workshop, Ndola, ICT in the education sector.
30. UNESCO, 2005, School management, a training manual for educational management,
Paris, UNESCO.
31. Usen, S M, Udofia, A E, & Offiong, A A 2012, Effective management of wastages in
vocational education for sustainable development in Nigeria. African Research Review.

62
Appendix 1: Questionnaire
Course Project
Dear respondent,
You have been picked randomly via the use of probability techniques to participate in this
research project. Therefore, your full participation will be highly appreciated.
It is my sincere assurance that the findings generated in this study will be handled with the highest level of confidentiality and for this academic exercise only.
Educational System Questionnaire
Teachers in Administrative Positions
ICU
(Contemporary Issues in Education 2015)
Please respond to the following questions as truthfully as possible. Write your response or the
number corresponding to your response of choice in the “response” box.

63
A. BACKGROUND INFORMATION
Q. id
Question Response For official use
A1
Name of Institution (school)
A2
Residence (of the institution)
1. Rural
2. Urban
A3
Ownership of the Institution
1. Public
2. Private
A4
What position do you hold?
(At your school/institution)
1. Head teacher
2. Deputy head teacher
A5
How old are you?
1. Below 31
2. 31 – 35
3. 36 – 40
4. 41 – 45
5. 46 – 50
6. 51 and Above
B. OTHER BACKGROUND CHARACTERISTICS OF THE RESPONDENT
Q. id Question Response For official use
B1
Management
(Do you hold any official qualification in education
management/administration)?
1. Yes
2. No
B2
Gender
1. Female
2. Male
B3
What is your highest level of education?
1. Primary/Basic school certificate
2. Primary/Basic school diploma
3. Primary/Basic school degree
4. Secondary school certificate
5. Secondary school diploma
6. Secondary school degree
7. Master’s degree
8. Doctoral degree

64
C. MANAGEMENT OF DISTRICT STAFF RECORDS
C1
Do you have a system(s) in place to manage all district staff
records?
1. Yes
2. No
C2
Do you have a database you use to manage district staff records?
1. Yes
2. No
C3
Do you have a district education website?
1. Yes
2. No
C4
How often is the system(s) you use for staff record management
updated?
1. Very often
2. Rarely
3. Very rarely
C5
What kind of system do you use to keep and manage district staff
information/records?
1. Manual
2. Electronic
C6
How do teachers submit their data to the district office for
updating of their records?
1. Manually
2. Electronically
C7
Does the district office always have a correct record of the total
number of teachers it has?
1. Yes
2. No
C8
Does the district office always have an updated record of all
teachers by their current/latest qualification?
1. Yes
2. No
C9
Is there a district record of all teachers currently pursuing higher
qualifications at different levels?
1. Yes
2. No
C10
Is there a district record of all teachers that graduated last year
(2014) with higher qualifications?
1. Yes
2. No
C11
Is there a district record of all teachers graduating this year
(2015) with higher qualifications?
1. Yes
2. No
C12
Does the district office update teacher qualification records as
soon as new credentials are attained?
1. Yes
2. No
C13
Does the district office have up-to-date contacts of all teachers
(phone numbers or email addresses)?
1. Yes
2. No

65
C14
Are staff records at the district office always up to date?
1. Yes
2. No
D. INFORMATION COMMUNICATION SYSTEM
Q. id
Question Response For official use
D1
Are there times when some positions fall vacant and need to be
replaced / filled up?
1. Yes
2. No
D2
If ‘yes’ to D1 above, are such vacancies always advertised?
1. Yes
2. No
D3
If vacancies are advertised, through which medium are they
communicated to all teachers (indicate all that apply)?
1. Circulars through Head teachers
2. Radio/TV
3. Notice boards at district office
4. Phone contacts to all teachers
D4
Do you think the information about vacant positions reaches all
eligible teachers on time/in right form?
1. Yes
2. No
D5
For information communicated through Head teachers, do you
think it reaches all teachers at the right time and in right form?
1. Yes
2. No
D6
Have you by any chance heard about teachers complaining that
they do not receive certain information correctly and timely?
1. Yes
2. No
D7
Does the district office regularly make follow-ups to teachers
to ascertain the effectiveness of the dissemination of
information sent through Head teachers?
1. Yes
2. No
D8
What could be the cause of some Head teachers not giving
information to all teachers correctly/timely (select all that
apply)?
1. Selfishness
2. Fear of losing their positions
3. Incompetence
4. Other, specify……………………………
D9
Do you think that everything Head teachers communicate to
higher authorities about their teachers is true and just?
1. Yes
2. No

66
D10
How would you rate the mode/method used by the district
office to communicate to teachers?
1. Very effective
2. Effective
3. Not effective
E. STAFF PROMOTION PROCEDURES
Q. id
Question Response For official use
E1
Do you know what promotion is?
1. Yes
2. No
E2
When there is need to promote some staff to fill vacant positions,
is every teacher made aware of such a need, on time?
1. Yes
2. No
E3
Do Head teachers, at times, make promotion recommendations to
the district office?
1. Yes
2. No
E4
Are there prescribed and known criteria for selecting staff for
promotion?
1. Yes
2. No
E5
Do you think all the teachers holding administrative positions in
the district deserve and obtained them on merit?
1. Yes
2. No
E6
Is there any form of corruption (favouritism), based on religion,
tribe, relations, etc. when selecting staff for promotion?
1. Yes
2. No
E7
Do all eligible teachers apply for advertised positions?
1. Yes
2. No
E8
What challenges do you think are faced during the selection of
staff for promotion (select all that apply)?
1. Lack of updated staff records
2. Poor communication
3. Political/outside influence
4. Undue preferences among selecting authorities
5. Other, specify …………………………….
E9
Why do you think some eligible teachers don’t apply for the
advertised positions (select all that apply)?
1. Fear of responsibilities
2. Perceived biasness in selection processes
3. Lack of confidence
4. Lack of information about the advertisements
5. Information reaches them late
6. Other, specify ............................................
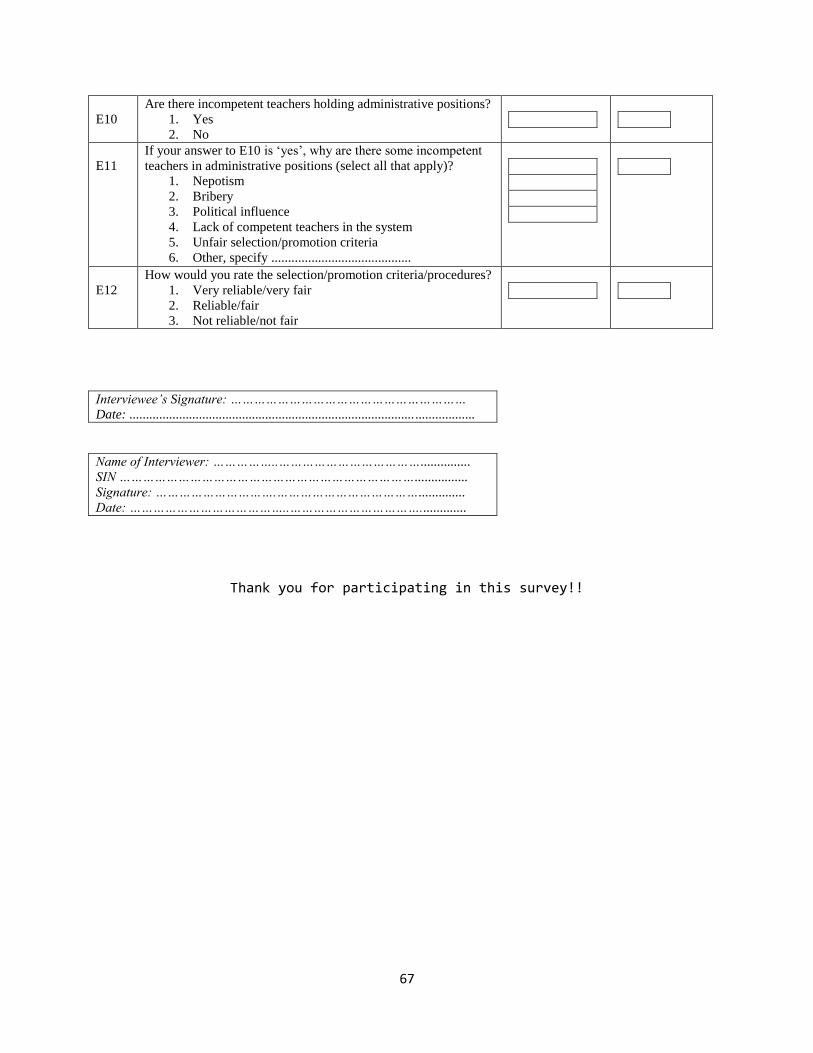
67
Interviewee’s Signature: ……………………………………………………
Date: ...................................................................................... ..................
Name of Interviewer: ……………..………………………………...............
SIN …………………………………………………………………................
Signature: ………………………….………………………………..............
Date: …………………………………..……………………………..............
Thank you for participating in this survey!!
E10
Are there incompetent teachers holding administrative positions?
1. Yes
2. No
E11
If your answer to E10 is ‘yes’, why are there some incompetent
teachers in administrative positions (select all that apply)?
1. Nepotism
2. Bribery
3. Political influence
4. Lack of competent teachers in the system
5. Unfair selection/promotion criteria
6. Other, specify ..........................................
E12
How would you rate the selection/promotion criteria/procedures?
1. Very reliable/very fair
2. Reliable/fair
3. Not reliable/not fair
68

Members of the Editorial Board
Editor in chief Dr. Mohammad Othman Nassar, Faculty of Computer Science and Informatics, Amman Arab University for Graduate Studies, Jordan, [email protected] , 00962788780593
Editorial Board Prof. Dr. Felina Panas Espique, Dean at School of Teacher Education, Saint Louis University, Bonifacio St., Baguio City, Philippines. Prof. Dr. Hye-Kyung Pang, Business Administration Department, Hallym University, Republic Of Korea. Prof. Dr. Amer Abdulrahman Taqa, basic science Department, College of Dentistry, Mosul University, Iraq. Prof. Dr. Abdul Haseeb Ansar, International Islamic University, Kuala Lumpur, Malaysia Dr. kuldeep Narain Mathur, school of quantitative science, Universiti Utara, Malaysia Dr. Zaira Wahab, Iqra University, Pakistan. Dr. Daniela Roxana Andron, Lucian Blaga University of Sibiu, Romania. Dr. Chandan Kumar Sarkar, IUBAT- International University of Business Agriculture and Technology, Bangladesh. Dr. Azad Ali, Department of Zoology, B.N. College, Dhubri, India. Dr. Narayan Ramappa Birasal, KLE Society’s Gudleppa Hallikeri College Haveri (Permanently affiliated to Karnatak University Dharwad, Reaccredited by NAAC), India. Dr. Rabindra Prasad Kayastha, Kathmandu University, Nepal. Dr. Rasmeh Ali AlHuneiti, Brunel University, United Kingdom.
Dr. Florian Marcel Nuta, Faculty of Economics/Danubius University of Galati, Romania. Dr. Suchismita Satapathy, School of Mechanical Engineering, KIIT University, India. Dr. Juliana Ajdini, Department of Social Work and Social Policy, Faculty of Social Science, University of Tirana, Albania. Dr. Arfan Yousaf, Department of Clinical Sciences, Faculty of Veterinary and Animal Sciences, PMAS-Arid Agriculture University Rawalpindi, Pakistan. Dr. Rajamohan Natarajan, Chemical Engineering, Faculty of Engineering, Sohar university, Oman. Dr. Tariq Javed, Lahore Pharmacy College (LMDC), University of Health Sciences, Lahore, Pakistan. Dr. Rogers Andrew, Sokoine University of Agriculture, United Republic Of Tanzania Dr Feras Fares, Amman Arab University for graduate studies, Jordan.

Print & Online


