
i
FACTORS AFFECTING THE GROWTH OF SMES: A CASE STUDY OF MOTOR
VEHICLE GARAGES IN INDUSTRIAL AREA, NAIROBI
BY MATHEW MWANGI GICHUKE
D61/63672/2010
A RESEARCH PROPOSAL SUBMITTEDTO THE SCHOOL OF BUSIN ESS, UNIVERSITY OF NAIROBI IN PARTIAL FULFILLMENT OF THE
REQUIREMENTS FOR THE AWARD OF A DEGREE IN MASTERS O F BUSINESS ADMINSTRATION
October 2013.

ii
DECLARATION I, the undersigned, declare that this is my original work and has not been submitted to any
other college, institution or university for academic credit.
Signed: ________________________ Date: _________________________
Mathew Mwangi Gichuke
This research project has been submitted for examination with my approval as university:
Supervisor
Signed: ________________________ Date: _________________________
Mr Martin Odipo.

iii
ACKNOWLEDGEMENT This achievement would have been a futility without the input of the significant others. The
mercy of the good God has always been with me and I cannot overstate the blessings, love
and care I have so far received. My family has been my source of strength and a true
foundation upon which I have build my success. They have also been a well from whom I
have drawn financial and material resources. I also appreciate the support of my friends, the
criticism, guidance and encouragement that has been my driving force this far. Today I stand
proud because they have stood with me.
I also drew a lot from the University of Nairobi. The lecturers have been really supportive
and willing to go the extra mile to quest my unending thirst for knowledge. My fellow
classmates have positively influenced my thinking due to their informed reasoning as we
brainstormed over issues and their varying ideologies. I would also want to salute my
supervisor Mr. Martin Odipo for his guidance in this research and for guiding me with a lot
of enthusiasm and interest and for being available whenever I needed his assistance.

iv
DEDICATION To my grandfather whose legendary intent has always been to see everyone of his
grandchildren get quality education, my parents for their love, and humble upbringing, and
bringing forth the KING, my brothers David and Kennedy, sisters Judy, Grace and Margaret
for pushing me to greater achievements.
To Cate, Rome and Tarmo for letting my world revolve around them and giving me a reason
to go home every day, my uncles and aunts for pushing and supporting me when it mattered
most, my lecturers, fellow students and true friends for their unquestionable loyalty, and for
all those who nurture love and espouse level playing grounds.
v
TABLE OF CONTENTS DECLARATION..................................................................................................................... ii
ACKNOWLEDGEMENT ..................................................................................................... iii
DEDICATION........................................................................................................................ iv
LIST OF ABBREVIATIONS .............................................................................................. vii
LIST OF TABLES ................................................................................................................ vii
TABLE OF FIGURES .......................................................................................................... vii
ABSTRACT .......................................................................................................................... viii
CHAPTER ONE ..................................................................................................................... 1
INTRODUCTION................................................................................................................... 1
1.1 Background of the Study ................................................................................................ 1
1.1.1 Growth of SMEs ...................................................................................................... 2
1.1.2 Factors affecting the growth of SMEs ..................................................................... 4
1.1.3 Relationship between SMEs growth and factors affecting it ................................... 4
1.1.4 Motor Vehicle garages in Industrial Area ................................................................ 7
1.2 Statement of the Problem ................................................................................................ 8
1.3 Objective of the Study .................................................................................................. 10
1.4 Value of the Study ........................................................................................................ 10
CHAPTER TWO .................................................................................................................. 11
LITERATURE REVIEW .................................................................................................... 11
2.1 Introduction ................................................................................................................... 11
2.2 Theories of the Growth of the Firm .............................................................................. 11
2.2.1 Behavioral Theory of the Firm .............................................................................. 12
2.2.2 Gibrat's Law on Growth of the Firm/ Law of Proportionate effect. ...................... 13
2.3 Empirical Review.......................................................................................................... 14
2.3.1 Local Empirical Review ........................................................................................ 14
2.3.1 International Empirical Review ............................................................................. 16
2.4 Summary ....................................................................................................................... 18
CHAPTER THREE .............................................................................................................. 20
RESEARCH DESIGN AND METHODOLOGY .............................................................. 20
3.1 Introduction ................................................................................................................... 20
3.2 Research Design............................................................................................................ 20
3.3 Population ..................................................................................................................... 20
3.4 Data Collection ............................................................................................................. 20
3.5 Data Analysis ................................................................................................................ 21
vi
3.6 Analytical model ........................................................................................................... 21
3.7 Data Reliability and Validity ........................................................................................ 22
CHAPTER FOUR ................................................................................................................. 23
DATA ANALYSIS, RESULTS AND DISCUSSION ......................................................... 23
4.1 Introduction ................................................................................................................... 23
4.2 Summary of Statistics ................................................................................................... 23
4.2.1 Age of the Businesses ............................................................................................ 23
4.2.2 Form of ownership ................................................................................................. 23
4.2.3 Day to day management of the operations of the business .................................... 24
4.2.4 Level of training of the business manager ............................................................. 24
4.2.5 Gender of the entrepreneur/ main shareholder ....................................................... 24
4.3. Constraints to growth ................................................................................................... 25
4.4 Major investment in the last five years ......................................................................... 28
4.5 Major sources of finance for new investments ............................................................. 29
4.6 Implementation of desired investments. ....................................................................... 30
4.7 Average growth in sales, Profits and Employment ....................................................... 30
4.8 Regression Analysis ...................................................................................................... 31
CHAPTER FIVE .................................................................................................................. 34
SUMMARY, CONCLUSIONS AND RECOMMENDATIONS .......... ............................ 34
5.1 Introduction ................................................................................................................... 34
5.2 Key findings .................................................................................................................. 34
5.3 Conclusions ................................................................................................................... 36
5.5 Recommendations for Further Research ....................................................................... 37
REFERENCES ...................................................................................................................... 38
APENDICES....................................................................................................................... 43
SURVEY QUESTIONNAIRE ....................................................................................... 43
LIST OF GARAGES ...................................................................................................... 46

vii
LIST OF ABBREVIATIONS
CBK : Central Bank of Kenya
EU : European Union
GDP : Gross Domestic Product
ICT : Information and Communications Technology
KAM : Kenya Association of Manufacturers
KNBS : Kenya National Bureau of Statistics
LPE : Law of Proportionate Effect
MSE : Micro and Small Enterprises
NCG : Nairobi County Government
PCA : Principal Component Approach
SMEs : Small and Medium Enterprises
KRA : Kenya Revenue Authority
LIST OF TABLES
Table 1: European Union Categorization of SMEs -------------------------------------------------- 1
Table 4.2: Number of years in business -------------------------------------------------------------- 23
Table 4.3: Form of Business ownership ------------------------------------------------------------- 23
Table 4.4: Management of the business -------------------------------------------------------------- 24
Table 4.5: Level of training of managers ------------------------------------------------------------ 24
Table 4.6: Gender of the entrepreneur --------------------------------------------------------------- 24
Table 4.7: Factors affecting growth ------------------------------------------------------------------ 25
Table 4.8: Regression statistics ------------------------------------------------------------------------ 31
Table 4.9: Regression Coefficient Matrix ----------------------------------------------------------- 32
TABLE OF FIGURES
Figure 4.1: Frequency Polygon on Factors Affecting Growth ------------------------------------ 26
Figure 4.2: Percentage Frequency polygon on Factors Affecting Growth ---------------------- 27
Figure 4.3: Investments in the last five years ------------------------------------------------------- 28
Figure 4.4: Sources of finance ------------------------------------------------------------------------- 29
Figure 4.5: Implementation of desired investments ------------------------------------------------ 30
Figure 4.6: Average growth rate of the SMEs ------------------------------------------------------ 30

viii
ABSTRACT Available estimates show that SMEs are a growing and vibrant stream with a lot of untapped
potential and employ about 7.5 million Kenyans or 80 per cent of the country’s total
employment outside small-scale agriculture and contributes 20 per cent to the country GDP.
Of all the 503,000 jobs created in 2011, 440,400 or 80.6 per cent were in the SMEs. Despite
their importance, over 60% of SMEs are estimated to fail each year in Kenya. The health of
the economy as a whole has a strong relationship with the health and nature of SMEs.
However, despite government efforts in Kenya to promote SMEs activity, not much progress
seems to have been achieved, judging by the performance of the informal sector. There is
very little information on how the SMEs sector is structured. Despite their major
contributions to the economy, many SMEs do not grow into large scale enterprises to
significantly contribute to employment creation and economic growth.
There are many constraints to growth and the objective of this study was to identify the
factors that affect the growth of motor vehicle garages in Industrial Area, Nairobi. A
descriptive design was used to study 54 garages in Industrial Area, Nairobi. Questionnaires
which included questions on background, growth and constraints to growth were used to
collect the data from the 54 garages. Data was analysed using Ms Excel and SPSS and the
researcher identified eight factors that constrain the growth of SMEs. The factors, from high
effect to no effect are inadequate technology, cost of machinery, low business skills, cost of
energy (fuel and electricity), cost of raw materials, loan transaction cost, Interest rates and
collateral for loans. Some factor had little or no effect at all on some of the garages, while
some of the factors had very high effect. Transaction cost for loans had no effect on the
highest number of garages, while cost of machinery had very high effect on most of the
garages. The research further found out that growth in sales does not lead to a proportional
growth in profits and employment.
1
CHAPTER ONE
INTRODUCTION
1.1 Background of the Study
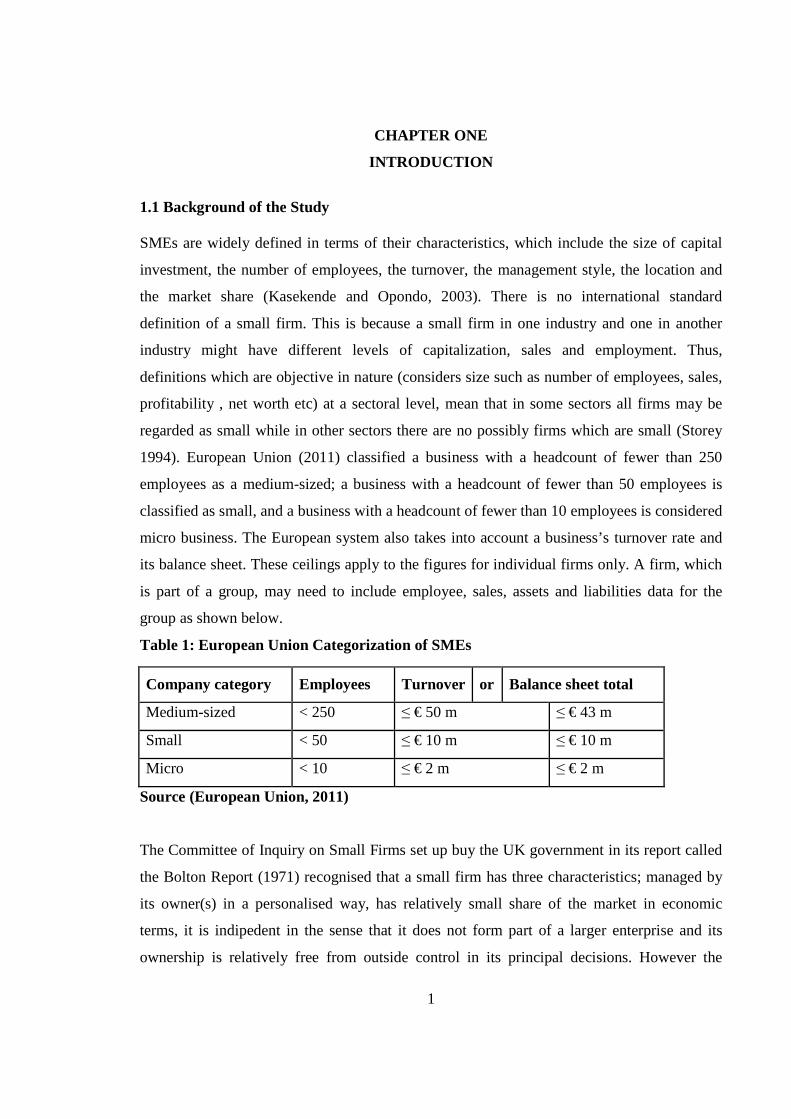
SMEs are widely defined in terms of their characteristics, which include the size of capital
investment, the number of employees, the turnover, the management style, the location and
the market share (Kasekende and Opondo, 2003). There is no international standard
definition of a small firm. This is because a small firm in one industry and one in another
industry might have different levels of capitalization, sales and employment. Thus,
definitions which are objective in nature (considers size such as number of employees, sales,
profitability , net worth etc) at a sectoral level, mean that in some sectors all firms may be
regarded as small while in other sectors there are no possibly firms which are small (Storey
1994). European Union (2011) classified a business with a headcount of fewer than 250
employees as a medium-sized; a business with a headcount of fewer than 50 employees is
classified as small, and a business with a headcount of fewer than 10 employees is considered
micro business. The European system also takes into account a business’s turnover rate and
its balance sheet. These ceilings apply to the figures for individual firms only. A firm, which
is part of a group, may need to include employee, sales, assets and liabilities data for the
group as shown below.
Table 1: European Union Categorization of SMEs
Company category Employees Turnover or Balance sheet total
Medium-sized < 250 ≤ € 50 m ≤ € 43 m
Small < 50 ≤ € 10 m ≤ € 10 m
Micro < 10 ≤ € 2 m ≤ € 2 m
Source (European Union, 2011)
The Committee of Inquiry on Small Firms set up buy the UK government in its report called
the Bolton Report (1971) recognised that a small firm has three characteristics; managed by
its owner(s) in a personalised way, has relatively small share of the market in economic
terms, it is indipedent in the sense that it does not form part of a larger enterprise and its
ownership is relatively free from outside control in its principal decisions. However the
2
report supplemented the above general qualities by more specific quantitative measures
depending on the industry type. A manufacturing enterprise with 200 employees or less was
categorized as an SME while a construction firm with 25 employees or less was categorized
as SME. A road transport enterprise with 5 vehicles or fewer was categorized as an SME.
According to Beaver (2002), SME’s are much easier to describe than to define. Further there
is no generally accepted operational or numerical definition of what constitute an SME.
Countries and in many cases individual institutions within them have developed
classifications and definitions that reflect the nature and compositions of that country’s
settings. Definitions may also reflect the nature and context of the industrial sector or the
market under consideration; for example different criteria would be considered appropriate
for firms engaged in manufacturing, construction, retailing hospitality and tourism, and
professional services etc. The issue of small and micro enterprises definition and
classification is a complex one and individuals should use their innate business and common
sense to dictate suitable criteria that are helpful in a given sector or operating context.
According to Page and Soderbom (2012), SMEs are also diverse – ranging from small
workshops making furniture, metal parts and clothing to medium-sized manufacturers of
machinery. Some are services providers, such as restaurants, consulting and computer
software firms. Some are traditional, “craftsman” enterprises that are satisfied to remain
small, while others – epitomized by the Silicon Valley start-up - are innovation based and
growth-oriented. All of this suggests that the romantic stereotype of the small enterprise as
Bill Hewlett and David Packard, in their garage in Palo Alto growing into a global
manufacturing giant is likely to be the exception rather than the rule.
1.1.1 Growth of SMEs
Firm growth is one of the most analysed fields in economics. Its impact on employment,
industry concentration, firm survival and economic activity are reasons enough for it to be
considered an issue of crucial interest (Carrizosa, 2007). Several arguments highlight the
crucial importance of this field. First, firm growth is related very closely to firm survival.
Specifically, firm growth is positively correlated with the likelihood of survival and firms
that experience continuous growth have a higher probability of surviving in the market.

3
Second, firm growth is related to employment. A positive rate of growth implies a net
creation of new jobs, and the vice versa is true. The third factor is the effect of business
growth on economic growth. The economic dynamics are related to the growth of the firm.
Fourth, firm growth is a way to introduce innovation and is a leading factor leading to
technological change. For example, if a firm wants to grow and survive in a competitive
industry, it needs to incorporate new technologies in order to be more efficient. In this sense,
growth is a challenge a firm must meet by introducing innovation. Fifth, the evolution of the
size of incumbents and new entrants determines market concentration. If small firms grow at
a high rate, market competitiveness will increase. Conversely, increases in the size of large
firms will affect market concentration. The regulation of market concentration to avoid the
creation of monopolies and oligopolies has been one of the main interests of governments.
The analysis of firm growth may therefore help to clarify the concentration of firms in a
market. Firm growth also has practical consequences for policy-makers’ decisions. Firm
growth can increase employment and economic activity and policymakers can control these
macroeconomic variables using firm growth policies. However, as the growth is
heterogeneous between firms, it is crucial to know the internal and external characteristics of
firms that affect their performance in the market. An ample knowledge of these features will
enhance the effectiveness of public policies as well as their impact. A study of firm growth
can shed light on the importance of the selection process after a firm has entered the market.
Once a firm enters a market a selection process takes place and less efficient firms decrease
in size and disappear and more efficient firms survive and grow. The analysis of firm growth
will therefore show how firms behave once they enter the market, their market opportunities,
turbulence and level of efficiency.
Only a tiny proportion of SMEs plan to and achieve growth in employment. Not all small
businesses are growth oriented and scholars have identified a variety of characteristics that an
established small firm may possess in order to achieve high growth and the factors are
entrepreneurial, business based or integrated (Storey, 1994). According to Churchill and
Lewis (1983) any firm whose business generates significant positive cash flows or earnings,
which increase at significantly faster rates than the overall economy, is growing. According
to Koech (2011), profits and sales are the factors that influence business growth. Sales
growth is easier to measure compared with some other indices and is much more likely to be

4
recorded. According to Investopedia, a firm is growing if it generates significant positive
cash flows or earnings, which increase at significantly faster rates than the overall economy.
A growth company tends to have very profitable reinvestment opportunities for its own
retained earnings. Thus, it typically pays little to no dividends to stockholders, opting instead
to plow most or all of its profits back into its expanding business. There are many
different ways to measure financial performance which should all be taken in aggregation.
Revenue from operations, operating income or cash flow from operations can be used, as
well as total unit sales. Furthermore, the analyst or investor may wish to look deeper into
financial statements and seek out margin growth rates or any declining debt.
1.1.2 Factors affecting the growth of SMEs
Cost, capital market and capital access are the highest factors constraining SMEs growth into
large business enterprises. Profits and sales are other factors that influence business growth
(Koech, 2011). According to Robai (2006) SMEs face unique issues which affect their
financial performance and diminish their ability to contribute effectively to sustainable
growth. Some of those factors are common to all SMEs and others are unique to various
clusters of SMEs. According to Thuranira (2009), interest rate, literacy levels, the number of
lending institutions and the security for the loans are some of the factors that affect SMEs
access to credit and hence affect their growth. Bokea et al. (1999) identify infrastructure, as it
relates to provision of access roads, adequate power, water, sewerage and telecommunication
as the major constraint in the development of SMEs. The factors that affect SMEs can be
classified into three; financial costs, production costs and production efficiency factors.
1.1.3 Relationship between SMEs growth and factors affecting it
Business financing is a very important factor in growth and performance of businesses,
Shepherd, et al. (2007) noted that one of the most difficult problems in the small businesses
is obtaining financing. For the entrepreneur available financing needs to be considered from
the perspective of debts versus equity and using external versus external funds. The external
finances or credit facility is the type of finance that is obtained from persons other than the
actual owners of the company (Manasseh, 2004). As Steel (1994) highlights, high
transactions costs and risks associated with small loans, a lack of collateral and an historical
orientation towards larger enterprises, continue to restrict small scale enterprise access to
5
formal credit. Credit facilities can be form of loans, debentures, overdrafts, lease finance,
trade creditors, etc. Financial costs increases the finance cost of a firm; these factors are
interest rates, collateral for loan and transaction costs. Interest rate is the amount charged,
expressed as a percentage of principal, by a lender to a borrower. Interest can be defined as
the return on capital (Saleemi, 2007). The rate of interest can be fixed or variable.
Collateral, also referred to as security is an asset pledged to get a loan. Collateral plays a
major part in the accessibility of loans among the SME’s since majority of them do not have
collateral. Loans not secured are charged a higher rate of interest to cover the high risk. To
make matters worse, most SMEs are not registered and banks and other financial institutions
find it hard to deal with non formal entities. In the site www.allbusiness.com, collateral is
highlighted as a major constraint to credit accessibility. According to Beaver (2002), the
historical development and the associated culture of the banking system underpins the
problem of the emphasis on the provision of collateral as a primary condition in lending.
Banks have always adopted a risk averse stance towards small firms, with an accompanying
inability to focus on the income generating potential of the venture, when analyzing the
likelihood of loan repayment.
Transaction costs are costs relating to the issue of a loan. Banks charge fees for managing
and issuing a loan. In Kenya the fees take various forms like loan negotiation fees, risk
management fee etc. This costs are charged at the beginning of the loan or annually. They
increase the cost of the loan. The costs are charged as a percentage of the loan or as a fixed
amount. According to (CBK,2013), the average bank lending rate is was 16.97% in July 2013
having gone down from over 20% in 2011.This can result to decline in borrowing to finance
investments through loan by the firms. Banks are particularly nervous of smaller businesses
due to a perception that they represent a greater credit risk (Kariuki, 1995). Small scale
borrowers are faced with higher nominal interest rates and higher explicit transactions costs
of borrowing.
Production costs include cost of energy (Fuel and Electricity), cost of raw materials and cost
of machinery. For most of the last century, cheap oil powered global economic growth.
However, in the last decade, the price of oil has quadrupled, and that shift will permanently
shackle the growth potential of the world’s economies. Oil provides more than a third of the

6
energy we use on the planet every day, more than any other energy source. You can draw a
straight line between oil consumption and gross-domestic- product growth. The more oil we
burn, the faster the global economy grows. On average over the last four decades, a one
percent bump in world oil consumption has led to a two percent increase in global GDP. That
means if GDP increased four percent a year as it often did before the 2008 recession, oil
consumption was increasing by two percent a year. Over the last four decades, every time oil
prices have spiked, the global economy has entered a recession (Rubin 2012). Fuel is a major
factor of production. Fuel is used to run machines for production and also for transport.
Economists and manufacturers have expressed concern that the increase in cost of electricity
is bound to push up the cost of production, dampen economic growth prospects and make
Kenya an uncompetitive investment destination (Aron, 2012). The negative impact of
increasing energy costs might force the emerging SMEs to shut down their operations due to
increased production costs (KAM, 2002). According to the World Bank doing business
survey (2012), high cost of energy is one of the factors affecting growth of firms in Kenya.
Most of the raw materials used in motor vehicle garages are exported. The cost is therefore
determined by the international market, transport costs across the world and locally,
government taxes and exchange rate fluctuations. Garages also require machinery to make
their work faster and efficient. These machines are expensive to acquire and maintain and the
technology required to maintain them may not be available locally.
Production efficiency is determined by how well a firm uses resources to maximize
production. Efficiency is driven by technology and trained manpower. ICT is important to
every firm whether big or small today; Manual operations result in inefficiencies such as high
cost and slow decision making. Those firms than embrace the latest technology grow rapidly
as opposed to firms resistant to change. Manufacturing uses machines which are expensive to
buy and maintain for SMEs. According to Wanjohi and Mugure (2008), change of
technology has posed a great challenge to small businesses. Since the mid-1990s there has
been a growing concern about the impact of technological change on the work of micro and
small enterprises. Even with change in technology, many small business entrepreneurs
appear to be unfamiliar with new technologies. Those who seem to be well positioned, they
are most often unaware of this technology and if they know, it is not either locally available
or not affordable or not situated to local conditions.

7
Low business skills affect the performance of SMEs due to poor decision making, wastage in
production and low outputs. This translates to high prices, industrial accidents and
dissatisfied customers. Skilled employees are expensive to hire and sometimes not even
available. Many SMEs owners or managers lack managerial training and experience. The
typical owner or managers of small businesses develop their own approach to management,
through a process of trial and error. Their management style is therefore likely to be more
intuitive than analytical, more concerned with day-to-day operations than long-term issues,
and more opportunistic than strategic in its concept (Hill, 1987). According to King and
McGrath (2002), those with more education and training are more likely to be successful in
the SMEs sector. Majority of those who run SMEs are ordinary lot whose educational
background is lacking and hence they may not be well equipped to carry out managerial
routines for their enterprises. According to Thuranira, (2009), the level of literacy is one of
the factors affecting SMEs access to credit. Most institutions insist on well written business
proposals and business records which most SMEs do not keep because of low levels of
literacy. The lengthy loan application procedure could pose a challenge and discourage the
less literate loan applicant. Majority of SMEs also fear applying for loans due to their
inability to understand the loan application process. As Saleemi (2007) states, complete,
accurate and precise information is necessary for financial decisions including obtaining
business loans. Small and medium enterprises therefore require trained and experienced staff
if they are to grow into large organizations and realize their true potential.
1.1.4 Motor Vehicle garages in Industrial Area
Small and Micro Enterprises (SMEs) play an important economic role in many countries.
According to the KNBS Economic survey 2012, of all the 503,000 jobs created in 2011,
440,400 or 80.6 per cent were in the SMEs. This clearly shows that efforts to reduce
joblessness should be channeled to the SMEs and informal sector. Motor vehicle garages in
Kenya deal with motor vehicle body building, accidental repairs, reconditioning of old
vehicles and customization. Most of the garages also act as training centres for mechanics.
The garages operate as companies, partnerships and sole proprietorships. They form of
employment is both permanent and casual, with casual employees being hired when there is a
stretch on the available labour. The importance of the garages in the economy is not limited

8
to employment only. The garages also help in preventing economic waste and environmental
degradation by repairing cars which would otherwise be grounded and dumped. They have
also become sources of innovation, a fact that can be attested to by the Kenyan Matatu
culture.
The growth in the Kenya Motor Vehicle industry has been very high in the recent past. The
first vehicle in Kenya was introduced in 1905. In 1990 Kenya had 350,000 registered units
and by 2009 the number had risen to 569,400 representing an average increase of 0.8% per
year with a registration of 150 vehicles per day. In Kenya, as it’s in most third world
countries, 50% of all cars and motorcycles owned in the country are based in the capital city.
The numbers of reported accidents have been showing an increasing trend from 10,300 in
1990 to 16,800 in 2000 and 17,400 in 2009. The annual economic cost of road traffic
accidents is 5% of the country’s Gross National Product (East African Orthopaedic Journal,
2009). As the number of vehicles increase, the need for garages grows also. This growth in
the motor vehicle industry opens room for more employment and innovation. With the right
technology, trained manpower and government support, some of the garages are potential
motor vehicle assemblers and producers in the long run. It is worthwhile to note that
manufacturing together with tourism, agriculture, wholesale and retail trade, ICT & Business
Process Outsourcing (BPO) and Financial Services have been identified as some of the
sectors with the potential to contribute to the envisaged 10% GDP growth for the
achievement of vision 2030. Vision 2030 is the country’s long–term development blueprint
which aims to create a globally competitive and prosperous country providing a high quality
of life for all citizens. It aspires to transform Kenya into a newly industrializing, middle
income country by 2030.
1.2 Statement of the Problem
Globally, small and medium firms – those with less than 250 workers – account for nearly
80% of employment in the formal sector in low income countries (Ayyagari, Demirguc-Kunt
and Maksimovic, 2011). When micro and informal firms are counted, the employment share
of SMEs in developing countries rises to an estimated 90% of all workers. In Africa firms
with more than 100 workers employ about 50% of the labor force. Medium scale enterprises
(20-99 workers) constitute the second leading employment category with about 27% of the

9
labor force, and small firms employ a further 23%. However, consistent with the evidence for
developing countries in general, small firms in Africa appear to create a disproportionate
share of new jobs. In the African countries, about 47% of new jobs are created in firms with
5-19 workers (Page and Soderbom, 2012)
The Micro, Small and Medium Enterprise industry has for a long time been the buzzword in
the world economy. It has been touted as the panacea to the growth of most developing
economies. It still plays an important role in the provision of employment and contribution to
the developed world’s Gross Domestic Product (GDP). Kenya, which is considered as a
market economy, relies heavily on SMEs to provide the much needed employment. Available
estimates show that SMEs are a growing and vibrant stream with a lot of untapped potential
and employ about 7.5 million Kenyans or 80 per cent of the country’s total employment
outside small-scale agriculture and contributes 20 per cent to the country GDP (Wandabusi,
2011). According to the KNBS Economic survey 2012, of all the 503,000 jobs created in
2011, 440,400 or 80.6 per cent were in the SMEs.
In Kenya, over 60% of SMEs are estimated to fail each year (KNBS, 2007). The health of
the economy as a whole has a strong relationship with the health and nature of SMEs.
However, despite government efforts in Kenya to promote SMEs activity, not much progress
seems to have been achieved, judging by the performance of the informal sector. There is
very little information on how the SMEs sector is structured. Despite their major
contributions to the economy, many SMEs do not grow into large scale enterprises to
significantly contribute to employment creation and economic growth.
There is a gap on the literature on SME growth due to lack of information or interest and the
number of studies of SME sector has not matched their economic development. It is
important to note the lack of empirical studies related to a specific sector. Prior research
focused on factors inhibiting SMEs growth in a general perspective. However, a study by
Njoroge (2012), focused on the factors influencing the performance of small scale
horticulture farmers in Thika District. A study by Mwobobia (2012) focused on the
challenges facing Small-Scale Women Entrepreneurs in Kenya.

10
This study seeks to investigate the factors that influence the performance of motor vehicle
garages in order to develop an understanding of their dynamics for the development of
support program and growth strategies and also for the growth of the economy as a whole.
The research will seek to answer the following research question; how do financial costs,
production costs and production efficiency affect the growth of SMES? The information is
crucial in the evolution of appropriate policies for promoting SMEs development and
increasing the sector’s impact on poverty reduction.
1.3 Objective of the Study
The objective of the research is to establish the factors that have an effect on the growth of
SMEs in Kenya.
1.4 Value of the Study
The research findings will be important in management of SMEs. The research findings on
determinants of growth will be useful to the management of SMEs to identify and deal with
factors hindering their performance and growth.
This study will be of help to policy makers and development partners to formulate policies to
promote growth of SMEs. The government can utilize the results to promote its development
agenda and Vision 2030. Development partners will also find this research useful in
developing programs for funding of activities aimed at improving the growth of SMEs in
Kenya.
This study will provide a contribution to the scholarly discourse concerning SMEs in Kenya.
This will be important to future researchers who may want to use the findings of this research
as a basis for advancing their arguments.
11
CHAPTER TWO
LITERATURE REVIEW
2.1 Introduction
This chapter reviews the literature on the growth of the firm. It will look at the theories of
growth of a firm, empirical study of previous international studies and topics specifically
targeting the SME sector in Kenya.
2.2 Theories of the Growth of the Firm
Small business scholars have devoted much effort to examining the variations in the birth of
small firms over time, space and sector (Storey, 1994) as well as the factors which impact on
small business growth and demise. A review of small business and entrepreneur literature
reveals many determinants of business success and growth including entrepreneurial and
environmental factors. At the same time, the ‘barriers to growth’ literature (Storey, 1994)
identifies key barriers and problems for small firms. A high proportion of firms are likely to
cease to trade in the short term, while other firms which are currently small are moving
towards becoming medium sized. Even so the highest numbers of SMEs are those which are
small today and, even if they survive, are always likely to remain small-scale in operations.
Not all small businesses are growth oriented and scholars have identified a variety of
characteristics that an established small firm may possess in order to achieve high growth and
the factors are entrepreneurial related, business related or integrated. However, no clear
understanding, predictive theory or interrelated model emerges from the small business
literature which can determine whether a small business will start up, grow, succeed or fail.
Similarly, no simple pattern or ideal-type personality for pre-determining characteristics of
business success or demise is identified. Rather, the literature points towards a complex set of
interrelated situational and contextual factors that increase or decrease the probability that an
enterprise will become a successful and growing small business (Tonge, 2001).
There has been no convergence of the theories of business growth. These may be due to the
complexity involved in defining the firm (Carrizosa, 2007). Contributions from classic
economic theory, the behaviorist theories, the stochastic growth theory and the learning
models have helped to perceive the causes and effects of firm growth. This complexity has
12
led to the emergence of scholars with different perspectives and, more importantly, with
different predictions of the evolution of growth. This is clearly seen from the variables used
in the literature to measure firm growth and its determinants. Some theories focus on average
size, some focus on internal characteristics and others focus on random variables. Firm size is
however a major link in all the theories.
2.2.1 Behavioral Theory of the Firm
Nelson and Winter’s (1982) evolution theory is loosely based on a biological evolutionary
model, where organisms, with genetic material, evolve in response to their changing
environment. Their goal is to use models of evolutionary theory to improve economic theory.
They are solely interested in the understanding of economic problems, with the core concern
of their evolutionary theory being the dynamic process by which firm behavior patterns and
market outcomes are jointly determined over time. However, there is no sharp distinction
between blind evolution and deliberate goal-seeking. This approach, where firms are both
carried along by their changing environment and deliberately evolve to improve their
position therein, is the critical contribution of Nelson and Winter toward firm strategy and
ultimately the dynamic capabilities theory of the firm. While Nelson and Winter
acknowledge the difficulty of deliberate direction in firm evolution, they do not espouse the
impossibility of it. Nelson and Winter suggest a role for long-term strategic planning in the
dynamic performance of the firm. Firms are no longer purely myopic and inevitably tied to
their existing standard operating procedures. They have the ability to affect their chances of
long-term survival, that is, to partially guide their evolution. They do not possess the
absolute control of neo-classical managers, nor do they suffer from the evolutionary
impotence of the behavioral theory. They have differential characteristics and abilities and
thus have unique potential evolutionary paths. This limited but nonetheless existent adaptive
control implies that firm strategy is not only possible, but also highly important because it
has an impact on the survival and profitability of the firm.
In order to understand contemporary economic decision-making, we need to supplement the
study of market factors with an explanation of the internal operation of the firm (Cyert and
March, 1963). Their work presents the firm as a complex organization defined by its unique
goals, expectations, and standard operating procedures. Because each firm is uniquely

13
defined by these aspects, firms are heterogeneous and thus not easily modeled. This
heterogeneity creates inequalities in both short and long-term performance, as each firm’s
unique characteristics make it better or worse suited than its rivals to succeed in a given
environment. Cyert and March argue that a behavioral theory of the firm requires attention to
organizational goals, expectations, choice, and control. Only through these characteristics can
one truly understand how firms function.
2.2.2 Gibrat's Law on Growth of the Firm/ Law of Proportionate effect.
Gibrat (1931) suggested that proportionate growth rate of a firm is completely random and
independent of firms’ initial size or previous growth rates. This is known as Gibrat’s Law or
the Law of Proportionate Effect. Factors that influence firm growth such as increase in
demand, management talent and innovation, organisational structure and luck, are distributed
across firms in a manner which cannot be predicted from information about firm’s current
size or its previous growth performance (Goddard et al ., 2001). In fact, firm growth is the
result of a multiplicative process that affects the initial size. The factors that can affect firm
growth relate not only to the firm, but also to its environment.
While Gibrat’s theory had little immediate impact, the 1950s and 1960s saw a revival of
stochastic firm growth theory. The main implications of the LPE: large and small firms
should have the same average proportional growth; no heteroscedasticity in growth rates; the
firm size distribution should be log-normal; and the relative dispersion of firm sizes should
increase over time. Using these properties as a basis for regression-based tests, scholars
found no evidence against the LPE for various industries during the 1930s, 1940s and 1950s.
As pointed out by Sutton (1997), the contribution of Mansfield (1962) is of particular
interest. Mansfield points out that the previous inconclusive findings about the validity of the
LPE emanates from using three different types of samples: all firms (including those that fail
to survive during the period); surviving firms only; and well established firms (i.e. firms
which have exhausted economies of scale). Overall, Mansfield concludes that smaller firms
have higher and more variable growth rates than large firms, while there is support for the
LPE for firms which have exhausted the economies of scale.

14
According to Sutton, (1997), there is no optimum size to which firms will converge, the
likelihood of growth is independent of initial size and so expected growth and its variability
are the same for all firms, past growth does not affect current growth since there is no serial
correlation both between firms and over time, firm size dispersion increases over time, so
market concentration is higher if the number of firms remains constant and the variance of
firm growth rates is equal for all sizes. This means that the variance of firm growth rates for
small firms is equal to the variance of firm growth rates for large firms. In other words,
Gibrat's Law postulates that the “probability that the next opportunity is taken up by any
particular active firm is proportional to the current size of the firm”
In the study of the firms the scholars do not agree that the foundation and the outcome of
Gibrat's law are empirically correct. This approach has been criticised in the literature
because it assumes that the firm growth process is a random walk in which factors such as
luck have a high weight. Nelson and Winter (1982) propose an evolutionary model of firm
growth which implies that there is some serial correlation in growth: “success breeds success
and failure breeds failure”. This is in contrast to purely stochastic models of growth, such as
the LPE. The model avoids strict maximizing assumptions in favour of weaker rationality
assumptions, and raises some fundamental questions as to the appropriateness of making
strong rationality and informational assumptions on agents who face continuing
technological change. Instead of optimising, agents tend to react automatically to changes in
the market environment using routines which are specific to the firm. Successful routines
which have produced growth in the past are likely to do so in the future. It is true that
circumstances change, but successful firms have successful routines for changing previous
methods to meet new market environments.
2.3 Empirical Review
2.3.1 Local Empirical Review
Bowen, et al. (2009) studied the management of business challenges among small and micro
enterprises in Nairobi-Kenya. Small and Micro Enterprises (SMEs) play an important
economic role in many countries and in Kenya, for example the SME sector contributed over
50% of new jobs created in 2005. Despite their significance, SMEs are faced with the threat

15
of failure with past statistics indicating that three out five fail within the first few months.
This study sought to understand how SMEs manage the challenges they face which seems to
evolve according to different macro and micro conditions. This study employed stratified
random sampling to collect data from 198 businesses using interviews and questionnaires.
The data was analysed descriptively and presented through figures, tables and percentages.
Competition among themselves and from large firms, lack of access to credit, cheap imports,
insecurity and debt collection were found to be the challenges facing SMES. They found out
that credit constraint seemed to be easing up when compared to previous researches and
relevant training or education is positively related to business success. Fair pricing, discounts
and special offers, offering a variety of services and products, superior customer service and
continuously improving quality of service delivery were found to be the strategies used to
overcome the challenges faced by SMEs. Further, the research concludes that business
success is a consequence of embracing a mix of strategies.
A study by Mwobobia (2012) sought to identify the challenges facing small scale women
entrepreneurs in Kenya and initiatives put in place to counter the challenges. The study
employed desktop research. The MSEs National Baseline survey, recorded that there are
612,848 women in Micro and Small Enterprises (MSEs) in Kenya, accounting for 47.4 per
cent of all those in MSEs. The study showed that women tended to operate enterprises
associated with traditional women’s roles, such as hairstyling. The small and micro
enterprises (SMEs) play an important role in the Kenyan economy such as creating jobs.
However they face serious challenges such as lack of finance, discrimination, problems with
the city council, multiple duties, poor access to justice, lack of education, among others. The
study established that many stakeholders from both public and private sector are helping
empower women entrepreneurs in Kenya: such as formation of women enterprise fund,
establishing of women’s university of science and technology, formal and informal financial
support, and donor initiatives among others have been put in place. The study recommends
that women in entrepreneurs need to be accepted and supported financially, legally and more
capacity building should be made available. Further research was recommended in this area.
A study by Koech (2011) examined the financial factors affecting growth of SMEs in Kenya,
she found out that the SME Sector has continued to play an important role in the Kenyan

16
economy. Many entrepreneurs have limited ways to grow their business into large
enterprises. There are many to constraints hindering their growth , so it is important for an
entrepreneur to fully understand all financial constraints. The study involved a survey of the
financial constraints hindering growth of SME’s : a case study of Kamukunji District.
Descriptive research design was applied with questionnaires as the main instrument of data
collection from the 100 Small and Medium Enterprises within Kamukunji District.
According to (Koech 2011), sales data are usually readily available and business owners
themselves attach high importance to sales as an indicator of business performance. In
addition, sales growth is also easier to measure compared with some other indices and is
much more likely to be recorded.
A study by Thuranira, (2009) examined the factors affecting accessibility of credit facilities
among the small and micro-enterprises in Meru CBD. He found out that literacy, the number
of credit lending institutions available, interest rates charged on loan and the demand for
collateral affect accessibility of credit facility among the SME’s. Due to low level of literacy
few read news and financial publications where these services are advertised. They feared the
loan application since they did not understand the process. High interest rates charged by
banks lead them to prefer personal savings and family sources of income. Since majority did
not own assets they could not provide collateral for loans which is requirement to access
loans. Majority of the respondents thought there were less financial institutions, compared to
demand for loan facilities. Therefore, most respondents resulted to other sources of finances.
Descriptive research design was applied with questionnaires as the main instrument of data
collection from the SMEs in Meru CBD with a revenue of under Shillings five million. The
researcher was unable to obtain the exact number of SME traders in the meru CBD, since
there is no existing database, as most of them are neither registered nor licensed by the local
authorities. Therefore, a randomly selected sample size of fifty SME’s were selected from
across every street to maintain objectivity.
2.3.1 International Empirical Review
A study by Olawale and Garwe (2010) investigated the obstacles to the growth of new SMEs
in South Africa using the principal component approach. Even though SMEs were seen as a
significant component of the solution to South Africa’s development issues, most new SMEs
do not grow; their failure rate in South Africa at 75% is one of the highest in the world. The
17
objective of the study was to investigate the internal and external environmental obstacles to
the growth of new SMEs. As a new business develops, it exists and survives in an
environment characterized by both internal and external factors which impact negatively on
the new business’ survival. Thirty variables were identified as obstacles. The principal
component analysis with varimax rotation was used to reduce the variables to five clusters.
The most important obstacle was termed Financial which is largely an internal factor. The
other obstacles respectively as determined by the PCA were Economic (external), Markets
(external) Management (internal) and Infrastructure (external).
A study by Olusola (2011), on accounting skill as a performance factor for small businesses
in Nigeria found out that small businesses are vehicles for growth and development of a
nation thus require much attention. Further, small businesses are affected by several many
factors with major emphasis on funding. A Survey research design was used for this research
and data was collected from a sample of small business owners to determine the relationship
between accounting skill and small business performance in Nigeria. Despite the increased
number of small businesses in Nigeria, the rate of business failure is alarming. It is expected
that small businesses entrepreneurs possess distinct skills found to have greater effect on
their performances for their development. The study investigated the effect of accounting
skill on entrepreneur performance for the success of small businesses in Nigeria. Accounting
skill was found to be contributory to entrepreneurial performance and as such, owner
entrepreneurs are advised to embark on capacity building in accounting skill in the area of
financial management and record keeping while the government makes preparation of
financial statement for performance monitoring mandatory for small business owners.
Nkonoki (2010) studied the factors limiting the success and/or growth of small businesses in
Tanzania. Corruption, in access to finances/capital constraint, government policy,
unfavorable economic conditions, people factor/ lack of needed talent, lack of proper record
keeping, lack of or improper professional advice and consultation, theft/cheating and lack of
trust in doing business, lack of a proper business plan/vision for the business, Inadequate
education and training and lack of background and experience in the business have emerged
as the key constraints to business the growth of small firms in Tanzania. The author saw it as
18
a merit to group the results into two groups; limiting factors that are internal to the firm
(Inadequate education and training, lack of a proper business plan and capital constraint) and
those that are external to the firm (comprising of corruption, government policy and
bureaucratic processes). An empirical study model was used and nine interviews were
conducted which included six small business owners and three officials representing three
organizations (Bank M Tanzania Ltd, Small industries Development Organisation and
Tanzania Harbors Authority) . A number of factors identified as the reasons as to why small
firms in Tanzania fail to grow were identified and discussed in light of literature concerning
factors influencing growth of small firms and barriers to growth in small firms. Interviews
were conducted to evaluate the major factors influencing small business growth.
2.4 Summary
While we can gather from the literature and empirical review that finance is the major
constraint to SME growth, other factors also play a major role in constraining the growth of a
firm. SMEs are affected more due to their lack of economies of scale, lack of professional
management, ignorance from the government, low or no credit rating, less diversification and
high dependence on credit. SMEs will continue to perform poorly if the issues of capital
access and cost, production costs and efficiency are not addressed. There is therefore the
need for more effort to be put into growing SMEs into large companies and multinational
players if Kenya is to grow into a middle class income economy as envisaged by Vision
2030. The government commitment to foster the growth of SMEs emerged as one of the key
strategies in the 1986 report Economic Management for Renewed Growth. It was reinforced
as a priority in the 1989 report, The Strategy for Small Enterprise Development in Kenya, a
document that set out the mechanisms for removing constraints to growth of the SME sector.
In 1992, the government published the SME policy report, Sessional Paper No. 2, Small
Enterprises and Jua Kali Development in Kenya. This report was reviewed in 2002, leading
to a new policy framework that provides a balanced focus to SME development in line with
the national goals of fostering growth, employment creation, income generation, poverty
reduction and industrialization. The current development plan, Vision 2030, aims at creating
a globally competitive and prosperous nation with a high quality of life by 2030. This blue
print aims at transforming Kenya into a newly industrializing, middle-income country
providing a high quality of life to all its citizens in a clean and secure environment and has

19
also laid a major emphasis on SMEs as agents for economic growth and development. The
vision is anchored on three key pillars; economic, social and political governance.
Complete information on the growth of the SMEs is not readily available, and when
available, it is too general. There is therefore a need to research sector related issues to ensure
there is no generalization when developing programs for developing SMEs.
20
CHAPTER THREE
RESEARCH DESIGN AND METHODOLOGY
3.1 Introduction
This chapter outlines the methodology that was used for the study, the research design and
target population and how data collection and analysis was done. It presents a description of
how the study was approached and planned.
3.2 Research Design
Research design is a plan outlining techniques and strategies on how information is to be
gathered for an assessment or evaluation that includes identifying the data gathering method,
the instruments to be used, how the instruments will be administrating and how the
information will be organized and analysed (Lawrence et al., 2012). According to Chandran
(2004), descriptive study describes the existing conditions and attitudes through observation
and interpretation techniques. Robson, (2002) revealed that descriptive research portrays an
accurate profile of persons, events, or situations. The descriptive research design is one of the
best methods for conducting research in human contexts because of portraying accurate
current facts through data collection for testing hypothesis or answering questions to
conclude the study and was used for this research.
3.3 Population
According to the Nairobi County Government, there are 54 garages in Industrial Area, a
population not large enough to warrant sampling and a census was therefore conducted.
Primary data collected from the census is more reliable, accurate and up-to-date and hence
the choice of this method. This ensured that the findings are accurate, valid and reliable as
possible regarding the responses on the growth of SMEs.
3.4 Data Collection
The study used primary data. A formal list of questionnaire on the factors that affect the
growth of SMEs was prepared and the researcher used interviews to obtain data from the
respondents as required by the questionnaire. The method was preferred because the face to
face encounter encourages the respondents to be more co-operative in providing the
21
information and the researcher will clarify and elaborate the purpose of research and answer
any other questions from the respondents.
3.5 Data Analysis
Cooper & Schindler (2003) points out that data analysis is a process of bringing order,
structure and meaning the mass information. The questionnaire responses were grouped into
various categories for analysis using descriptive statistics. Statistical data analysis packages
such as Ms. Excel and SPSS were used in the analysis of the information obtained and the
results presented in tables and graphs.
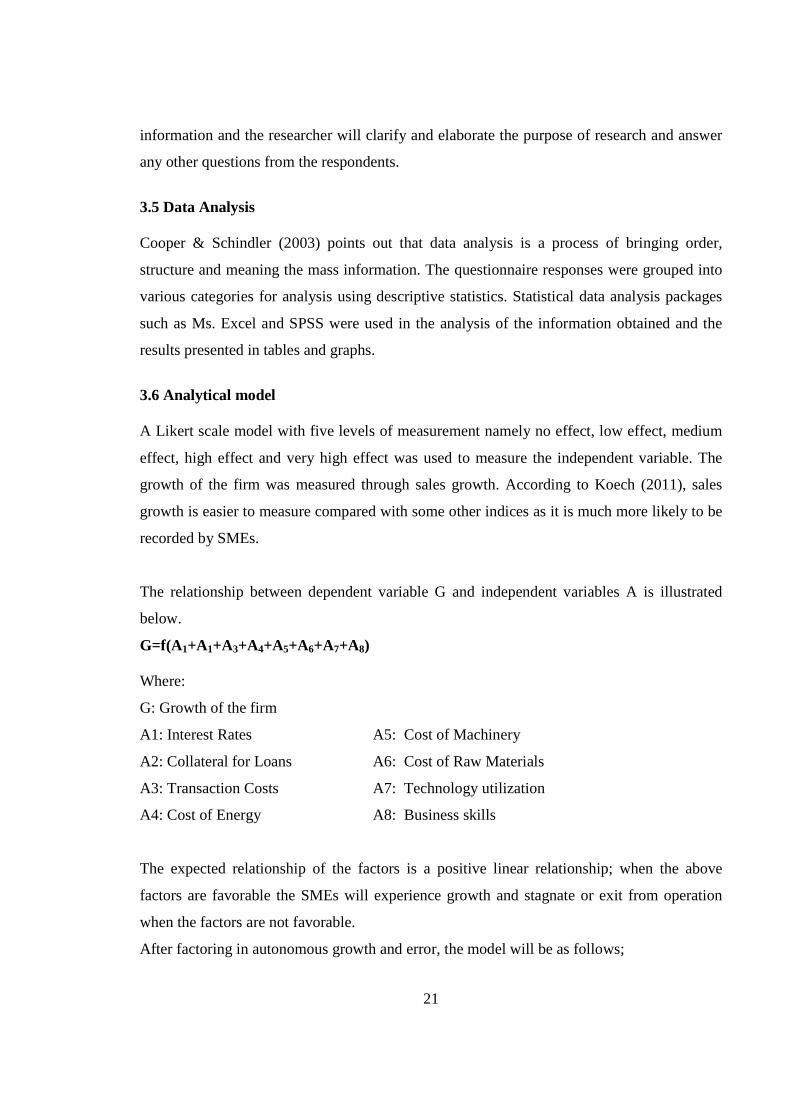
3.6 Analytical model
A Likert scale model with five levels of measurement namely no effect, low effect, medium
effect, high effect and very high effect was used to measure the independent variable. The
growth of the firm was measured through sales growth. According to Koech (2011), sales
growth is easier to measure compared with some other indices as it is much more likely to be
recorded by SMEs.
The relationship between dependent variable G and independent variables A is illustrated
below.
G=f(A1+A1+A3+A4+A5+A6+A7+A8)
Where:
G: Growth of the firm
A1: Interest Rates A5: Cost of Machinery
A2: Collateral for Loans A6: Cost of Raw Materials
A3: Transaction Costs A7: Technology utilization
A4: Cost of Energy A8: Business skills
The expected relationship of the factors is a positive linear relationship; when the above
factors are favorable the SMEs will experience growth and stagnate or exit from operation
when the factors are not favorable.
After factoring in autonomous growth and error, the model will be as follows;
22
G=α+β1A1+β2A2+β3A3+β4A4+β5A5+β6A6+β7A7+β8A8+ε
Where:- α: Autonomous growth β:Slope ε:Error In order to determine the strength of the relationship, independent t-tests and analysis of
variance were calculated at the 95% confidence interval to establish if there exist significant
differences.
3.7 Data Reliability and Validity
Validity determines whether the research truly measures that which it was intended to
measure or how truthful the research results are (Joppe, 2000). Validity is high if the study
contains what one wants to study and nothing else. Validity takes three forms: construct,
internal and external. Construct validity refers to data collection, internal validity is a link
between theory and empirical research and external validity refers to the domain to which the
findings can be generalized. Construct validity was addressed by administering the
questionnaires to the SMEs which were being studied. Internal validity was addressed by
considering existing theories and external validity was be addressed by studying all the firms
in the research area.
Reliability demonstrates that the study can be repeated with the same outcome. Joppe, (2000)
defines reliability as the extent to which results are consistent over time and an accurate
representation of the total population under study. If the results of a study can be reproduced
under a similar methodology, then the research instrument is considered to be reliable. The
researcher used clear and well defined questionnaire as a method of data collection.
Questions by the respondents were also clarified. This is easily applicable to another sample
to test the reliability of the results. However, subjectivity that may distort responses cannot
be over ruled.

23
CHAPTER FOUR
DATA ANALYSIS, RESULTS AND DISCUSSION
4.1 Introduction
This chapter shows the findings of the study and also discusses them in depth. The study
targeted the 54 motor vehicle garages operating in Industrial Area of Nairobi and registered
by the Nairobi County Government. A census was done on all this firms.
4.2 Summary of Statistics
4.2.1 Age of the Businesses
Most of the motor vehicle garages (70%) have been in operation for more than five years.
The garages in operation for one year, two years, three years, four years and five years were
6%, 9%, 7%, 4% and 4% respectively.
Table 4.2: Number of years in business
NUMBER OF YEARS NUMBER OF FIRMS PERCENTAGE
1 3 6
2 5 9
3 4 7
4 2 4
5 2 4
Above 5 yrs 38 70
Total 54 100
Source: Research findings
4.2.2 Form of ownership
Most of the garages operate as companies. Only 19% operate as sole proprietorships while
4% are partnerships, with companies at 78%.
Table 4.3: Form of Business ownership
OWNERSHIP NUMBER OF FIRMS PERCENTAGE
Sole Proprietorship 10 19
Partnership 2 4
Company 42 78
Others 0 0
Total 54 100
Source: Research findings

24
4.2.3 Day to day management of the operations of the business
Most of the owners run their businesses, whether companies or sole proprietorships. Only
28% of the businesses are run by professional managers and 13% by others. It is worthwhile
to note that all businesses run by ‘others’ are run by a member of the family of the owner.
Table 4.4: Management of the business
BUSINESS MANAGER
NUMBER OF
FIRMS PERCENTAGE
Owner 32 59
Professional Manager 15 28
Others 7 13
Total 54 100
Source: Research findings
4.2.4 Level of training of the business manager
Only 6% of the management has university education. Majority of the managers at 59% have
technical college education, 22% secondary school education while 13% have other form of
training.
Table 4.5: Level of training of managers
LEVEL OF TRAINING NUMBER OF FIRMS PERCENTAGE
Secondary School 12 22
Technical College 32 59
University 3 6
Others 7 13
Total 54 100
Source: Research findings
4.2.5 Gender of the entrepreneur/ main shareholder
Table 4.6: Gender of the entrepreneur
GENDER NUMBER OF FIRMS PERCENTAGE
Male 48 89
Female 2 4
Others 4 7
Total 54 100
Source: Research findings

25
Most of the garages are owned by men, at 89%. Women owned 4% of the garages while 7%
of the firms were owned by other companies.
4.3. Constraints to growth
This research aimed at establishing the constraints to growth of SMEs. Respondents were
given a list of constraints picked by the researcher and asked to rank their effect on their
firms’ growth. The ranking scale ranged from 1-5 with 1,2,3,4 and 5 being no effect, low
effect, medium effect, high effect and very high effect respectively.
Table 4.7: Factors affecting growth
FACTOR\SCALE No Effect Low Effect
Medium
Effect
High
Effect
Very high
Effect
Grand
Total
Interest Rates 9 8 6 21 10 54
Collateral for loans 25 9 9 5 6 54
Transaction costs for loans 36 7 3 4 4 54
Energy costs ( Fuel & Electricity) 7 11 4 20 12 54
Cost of raw materials 4 6 10 21 13 54
Cost of machinery 3 6 14 17 14 54
Low business skills 9 12 14 8 11 54
Inadequate technology 9 18 16 8 3 54
Source: Research findings Interest rates had a high effect on the growth of SMEs with 57% of the respondents ranked
its effect on SME growth as above average. Interest rates had no effect on the growth of 17%
of the respondents and low effect on 15% of the respondents. It had medium effect on 11% of
the respondents.
Collateral for loans had little effect on the growth of the respondents. The demand for
collateral had below average effect on 63% of the respondents and above average effect on
20% of the respondents. Demand for collateral had an average effect on 17% of the
respondents. Most of the respondents had enough machinery to pledge as security.

26
Figure 4.1: Frequency Polygon on Factors Affecting Growth
Source: Research findings
0
5
10
15
20
25
30
35
40
Frequency
Factors affecting growth
Low Effect
Medium Effect
High Effect
Very high Effect
No Effect

27
Figure 4.2: Percentage Frequency polygon on Factors Affecting Growth
Source: Research findings
Transaction cost had low effect on the growth of the SMEs. It had below average effect on
80% of the respondents and average effect on 6% of the respondents. It had above average
effect on only 14% of the respondents. The transaction costs were negligible to affect the
growth of the SMEs.
Costs of energy affect the growth of most of the SMEs. It had above average effect on 59%
of the respondents, an average effect on 7% of the respondents and below average effect on
33% of the respondents. Cost of energy had a lot of effect on the growth of the garages that
0%
10%
20%
30%
40%
50%
60%
70%
80%
90%
100%
Percentage
Frequency
Constrain to growth
Very high Effect
High Effect
Medium Effect
Low Effect
No Effect

28
were mechanized while it had little or no effect on the garages that were manual or partly
mechanized. The cost of raw materials had an effect on the growth of most of the SMEs. It
had an above average effect on 63% of the respondents, average effect on 19% of the
respondents and below average effect on 18% of the respondents. Cost of machinery had
above average effect on 57% of the respondents, average effect on 26% of the respondents
and below average effect on 17% of the respondents. Most of the machinery is imported and
hence the high effect as the machinery is expensive. Business skills had above average effect
on 35% of the respondents. Most of the businesses had acquired enough skills through
training and experience. It had below average effect on 39% of the respondents and average
effect on 26% of the respondents. Inadequate technology had low effect on the growth of the
respondents. This is because most of the garages were mechanized. It had below average
effect on 50% of the respondents, average effect on 30% of the respondents and above
average effect on 20% of the respondents.
4.4 Major investment in the last five years
Only 6% of the respondents have not made a major investment. This 6% are firms that have
been in the market for only one year. Most of the firms, at 43% have purchased machines and
equipment, 15% have invested in extra working capital, 17% have invested in ICT, 7% have
purchased premises, 6% have opened new branches and 7% have made other types of
investment.
Figure 4.3: Investments in the last five years
Source: Research findings
43%
15%
17%
7%
5% 7%6%
PERCENTAGE
Purchase of machines and
equipment
Funding of working capital
Investment in ICT
Purchase of premises
New Branch

29
4.5 Major sources of finance for new investments
Most of the garages used bank loans to finance the new investments. This explains why
interest rates had an above effect on the growth. 37% of the garages used bank loans to
finance new investments, 17% of the garages used retained earnings, 15% used loans from
government agencies, 11% used new capital from owners, 7% of the garages got new capital
from new shareholders, 7% used other types of finances and 6% of the garages had no new
investments.
Figure 4.4: Sources of finance
Source: Research findings Most of the garages used bank loans to finance the new investments. This explains why
interest rates had an above effect on the growth. 37% of the garages used bank loans to
finance new investments, 17% of the garages used retained earnings, 15% used loans from
government agencies, 11% used new capital from owners, 7% of the garages got new capital
from new shareholders, 7% used other types of finances and 6% of the garages had no new
investments.
37%
15%
17%
11%
7%
7%
6%
Bank Loans
Loan from government agencies
eg KIE, Youth Fund, Women Fund
Retained Earnings (profits)
New capital from owner(s)
New capital from new partners
Others
No new investments

30
4.6 Implementation of desired investments.
Only 8% of the garages have been able to implement all their desired investments. 92% of
the garages have not been able to implement their strategies. Most of them attributed their
failure to invest as planned to lack of finances.
Figure 4.5: Implementation of desired investments
Source: Research findings
4.7 Average growth in sales, Profits and Employment
Figure 4.6: Average growth rate of the SMEs
Source: Research findings
8%
92%
Yes
No
-4%
-2%
0%
2%
4%
6%
8%
10%
12%
14%
16%
2007 2008 2009 2010 2011 2012 2013
AV
ER
AG
E G
RO
WT
H (
%)
FINANCIAL YEAR
SMES AVERAGE GROWTH
SALES
PROFITS
EMPLOYMENT

31
In the year 2008, sales dropped by 2% while profit and employment grew by 1% and 2%
respectively. The drop in sales could be attributed to the effects of the post election violence
that rocked the country that year. In the year 2009, sales grew by 8% while profits and
employment grew by 11% and 4% respectively. In the year 2010, sales grew by 11% while
profits and employment grew by 12% and 2% respectively. The year 2011 also showed
positive growth with sales, profits and employment increasing by 11%, 7% and 3%. In the
year 2012, sales grew by 14% and profits and employment grew by 6% and 2% respectively.
The reduction in growth in profitability in the year 2011 and 2012 could be attributed to the
high interest rates that banks were charging for the loans and also the high inflation in the
two years that led to sharp increases in the prices of raw materials and sharp increases in
prices of fuel.
4.8 Regression Analysis
Multiple regression was used for statistical analysis with dependent variable being sales
growth and independent variable being financial constraints factors.
Table 4.8: Regression statistics
Regression
Statistics
Multiple R 0.78
R Square 0.6084
Adjusted R Square 0.5388
Standard Error 5.2102
Observations 54
ANOVA
df SS MS F Significance F
Regression 8 1897.674 237.2092 8.738162 0.000000414
Residual 45 1221.586 27.14635
Total 53 3119.259
Source: Research findings
The column labeled F gives the overall F-test of H0: β2 = 0 and β3 = 0 versus Ha: at least one of β2 and β3 does not equal zero. Since 0.00000041 < 0.05, we do reject H0 at significance level 0.05. We therefore conclude that the parameters are jointly statistically insignificant at significance level of 95%.

32
R-square measures the proportion of the variation in the dependent variable that was
explained by variations in the independent variables.
The values of R2 lie between zero and unity.
0 ≤ R2 ≥ 1
A value of unity implies that 100 per cent of the variations of dependent variable have been
explained by the variations in the explanatory variables. On the other hand, a value of zero
implies that no variations in the dependent variable are explained by the variations in the
independent variable. From the study, a value of 0.6084 is attained for the coefficient. This
means that 60.84 per cent of the variations of the dependent variable have been explained by
the explanatory variations and only 39.16 per cent of the variations are unexplained and are
taken care of by the error term. The regression model therefore has a good fit.
Table 4.9: Regression Coefficient Matrix
Coefficients
Standard
Error t Stat
P-
value
Lower
95%
Upper
95%
Bi Intercept 48.06 4.64 10.35 0.00 38.71 57.41
B1 Interest Rates -0.60 0.55 -1.08 0.28 -1.71 0.51
B2 Collateral for loans -0.45 0.55 -0.82 0.42 -1.55 0.65
B3 Loans transaction cost -0.83 0.59 -1.42 0.16 -2.01 0.35
B4 Energy costs -1.30 0.55 -2.34 0.02 -2.41 -0.18
B5 Cost of raw materials -1.07 2.36 -0.45 0.65 -5.82 3.69
B6 Cost of machinery -2.23 2.41 -0.93 0.36 -7.09 2.62
B7 Low business skills -1.73 0.54 -3.21 0.00 -2.82 -0.65
B8 Inadequate technology -2.88 0.69 -4.15 0.00 -4.28 -1.48
Source: Research findings A simple summary of the above output is that the fitted line is
G=48.06-0.6A1-0.45A2-0.83A3-1.3A4-1.07A5-2.23A6-1.73A7-2.88A8
Column "Coefficient" gives the least squares estimates of βj. Column "Standard error" gives
the estimated standard deviation of the least squares estimates bj of βj. Column "t Stat" gives
the computed t-statistic for H0: βj = 0 against Ha: βj ≠ 0. Column "P-value" gives the p-value
for test of H0: βj = 0 against Ha: βj ≠ 0. This equals the Pr{|t| > t-Stat}where t is a t-
distributed random variable with n-k degrees of freedom and t-Stat is the computed value of

33
the t-statistic. This p-value is for a two-sided test. For a one-sided test divide this p-value by
2 (also checking the sign of the t-Stat). Columns "Lower 95%" and "Upper 95%" values
define a 95% confidence interval for βj.
Test of Statistical Significance
The coefficient of Interest Rates has estimated standard error of 0.55, t-statistic of -1.08 and
p-value of 0.28. It is therefore statistically significant at significance level of 95% as p-
value>t-statistic. The coefficient of collateral for loans estimated standard error is 0.55, t-
statistic of -0.82 and p-value of 0.42. It is therefore statistically significant at significance
level of 95% as p-value>t-statistic. The coefficient of loan transaction cost has a standard
error of 0.59, t-statistic of -1.42 and p-value of 0.16. It is therefore statistically significant at
significance level of 95% as p-value>t-statistic. The coefficient of energy cost has an
estimated standard error of 0.55, t-statistic of -2.34 and p-value of 0.02. It is therefore
statistically significant at significance level of 95% as p-value>t-statistic.
The coefficient of cost of raw materials has a standard error of 2.36, t-statistic of -0.45 and p-
value of 0.65. It is therefore statistically significant at significance level of 95% as p-value>t-
statistic. The coefficient of cost of machinery has estimated standard error of 2.41, t-statistic
of -0.93 and p-value of 0.36. It is therefore statistically significant at significance level of
95% as p-value>t-statistic. The coefficient of low business skills has estimated standard error
of 0.54, t-statistic of -3.21 and p-value of 0. It is therefore statistically significant at
significance level of 95% as p-value>t-statistic. The coefficient of inadequate technology has
an estimated standard error of 0.69, t-statistic of -4.15 and p-value of 0. It is therefore
statistically significant at significance level of 95% as p-value>t-statistic.
34
CHAPTER FIVE
SUMMARY, CONCLUSIONS AND RECOMMENDATIONS
5.1 Introduction
This chapter provides the summary of key findings, the research conclusions, explains
limitations of the study and recommendations for further research.
5.2 Key findings
The objective of the study was to find out the factors that affect the growth of SMEs. Data
was collected using a questionnaire from all the garages in Industrial Area, Nairobi. The data
was checked for completeness and it was coded and formatted before being analyzed to be
understandable.
Of all the garages in Industrial Area, 70% have been in operation for more than five years.
The garages in operation for one year, two years, three years, four years and five years were
6%, 9%, 7%, 4% and 4% respectively. Only 19% operate as sole proprietorships while 4%
are partnerships, with companies at 78%. Only 28% of the businesses are run by professional
managers and 13% by others, with owner running 59% of the garages are run by their
owners. Majority of the managers at 59% have technical college education, 22% secondary
school education while 13% have other form of training. Only 6% of the management has
university education. Most of the garages are owned by men, at 89%. Women owned 4% of
the garages while 7% of the firms were owned by other companies.
Only 6% of the respondents have not made a major investment in the last five years. This 6%
are firms that have been in the market for only one year. Most of the firms, at 43% have
purchased machines and equipment, 15% have invested in extra working capital, 17% have
invested in ICT, 7% have purchased premises, 6% have opened new branches and 7% have
made other types of investment. Bank loans were used by the highest number or garages to
finance growth. Most of the garages used bank loans to finance their new investments. While
37% of the garages used bank loans to finance new investments, 17% of the garages used
retained earnings, 15% used loans from government agencies, 11% used new capital from

35
owners, 7% of the garages got new capital from new shareholders, 7% used other types of
finances and 6% of the garages had no new investments. Only 8% of the garages have been
able to implement all their desired investments. 92% of the garages have not been able to
implement their strategies. Most of them attributed their failure to implement their desired
investments to lack of finances.
Except for the year 2008, sales have been increasing for all the other years. The drop in sales
in the year 2008 could be attributed to the effects of the post election violence that rocked the
country that year. From the year 2008 to 2012, sales have increased at an increasing rate
except for the year 2010 and 2011 when the growth was constant at 11%. Profits increased at
an increasing level between 2008 and 2010, and increased at a decreasing rate between 2011
and 2012. The reduction in growth in profitability in the year 2011 and 2012 could be
attributed to the high interest rates that banks were charging for the loans and also the high
inflation in the two years that led to sharp increases in the prices of raw materials and sharp
increases in prices of fuel. The growth in employment has been at a much lower rate than the
growth in sales and profits. Employment grew at 2% in 2008 despite the drop in sales. It also
grew at 4%, 2%, 3%, and 2% in the year 2009, 2010, 2011 and 2012 respectively.
This research aimed at establishing the constraints to growth of SMEs. Respondents were
given a list of constraints picked by the researcher and asked to rank their effect on their
firms’ growth. The ranking scale ranged from 1-5 with 1,2,3,4 and 5 being no effect, low
effect, medium effect, high effect and very high effect respectively. Interest rates had a high
effect on the growth of SMEs with 57% of the respondents ranked its effect on SME growth
as above average. Collateral for loans had little effect on the growth of the respondents. The
demand for collateral had below average effect on 63% of the respondents and above average
effect on 20% of the respondents. Demand for collateral had an average effect on 17% of the
respondents. Most of the respondents had enough machinery to pledge as security.
Transaction cost had low effect on the growth of the SMEs. It had below average effect on
80% of the respondents and average effect on 6% of the respondents. It had above average
effect on only 14% of the respondents. The transaction costs were negligible to affect the
growth of the SMEs. Costs of energy affect the growth of most of the SMEs. It had above
average effect on 59% of the respondents, an average effect on 7% of the respondents and

36
below average effect on 33% of the respondents. Cost of energy had a lot of effect on the
growth of the garages that were mechanized while it had little or no effect on the garages that
were manual or partly mechanized. The cost of raw materials had an effect on the growth of
most of the SMEs. It had an above average effect on 63% of the respondents, average effect
on 19% of the respondents and below average effect on 18% of the respondents. Cost of
machinery had above average effect on 57% of the respondents, average effect on 26% of the
respondents and below average effect on 17% of the respondents. Most of the machinery is
imported and hence the high effect as the machinery is expensive. Business skills had above
average effect on 35% of the respondents. Most of the businesses had acquired enough skills
through training and experience. It had below average effect on 39% of the respondents and
average effect on 26% of the respondents. Inadequate technology had low effect on the
growth of the respondents. This is because most of the garages were mechanized. It had
below average effect on 50% of the respondents, average effect on 30% of the respondents
and above average effect on 20% of the respondents.
5.3 Conclusions
The researcher identified eight factors that constrain the growth of SMEs. The factors, from
high effect to no effect are inadequate technology, cost of machinery, low business skills,
cost of energy (fuel and electricity), cost of raw materials, loan transaction cost, Interest rates
and collateral for loans. Some factor had little or no effect at all on some of the garages,
while some of the factors had very high effect. Transaction cost for loans had no effect on
the highest number of garages, while cost of machinery had very high effect on most of the
garages.
It is also worthwhile to note the growth in SMEs does not lead to a proportional growth in
sales, which is a pointer of economies of scale. Growth in sales does not lead to a
proportional growth in profits. It is also notable that some of the firms have opened new
branches, and others have even acquired the premises they operate in. Whereas the sales have
been growing in the period reviewed, it is advisable that the firms diversify to move from
motor vehicle repairs to body building and finally to assembly. The firms can also join hands
and incorporate a big company to enjoy the economies of scale.
37
It is also notable that most of the entrepreneurs run their businesses. Whereas their
qualification, whether from education or experience is not doubtable, hiring an external party
to run the businesses could lead to more growth. It is also worrying to note the low level of
women entrepreneurs in this sector. The government and development partners should at the
forefront to inform women of the opportunities available in this sector to encourage them to
invest in the sector. It is however notable that most of the entrepreneurs have realized the
importance of incorporation and are running their businesses as a company.
5.4 Limitations of the Study
This researcher faced various limitations when conducting this research. The major problem
was business owners’ suspicion that we were KRA officers. We were also turned away at
various business enterprises as the owners or managers were not available at the time. Other
respondents thought we would leak out their trade secrets and others asked for compensation.
There were also issues with communication, as some of the officers assigned to us could not
really comprehend some of the questions we had.
Some of the businesses did not have formal records and had to do computations to give us
the figures we wanted. In some businesses, I had to go back after a day or two to allow the
oners or managers get the data I wanted.
5.5 Recommendations for Further Research
There needs to be initiatives to have a common ground on what really constitutes SMEs in
Kenya. This will enable more comparability of studies in the future. All the information on
SMEs needs to be consolidated and a proper research carried out on all the factors affecting
the growth of SMEs, and also on how the factors affect SMEs. Simulations can also be done
eg through provision of capital, cheap loans, training etc and see how this affects the small
businesses. There should also be a study to determine the reason for the low number of
women entrepreneurs in this sector.
38
REFERENCES
Amyx, C. (2005) Small business challenges – the perception problem: size doesn’t matter.
Washington Business Journal.
Aron, M. (17th May 2011). High Cost of Electricity to Stall Economic Growth. The Standard
Online Edition.
Ayyagari, M., Demirguc-Kunt A. Maksimovic V. (2011) “Small vs. Young Firms Across the
World” Policy Research Working Paper 5631 Washington, DC: World Bank
Barber, J., Metcalfe, J. S. & Porteous, M. (1989). Barriers to Growth in Small Firms.
London: Routledge.
Beaver, (2002). Small Business Entrepreneurship and Enterprise Development (3rd ed.).
London. Pearson Education publishers Ltd.
Bokea, C., and Mullei, A. (1999). Micro and small enterprises in Kenya. Nairobi: ICEG,
Africa Program.
Bokea, C., Dondo A., and Mutiso J. (1999). ‘Physical infrastructure.’ In: A. Mullei and C.
Bokea, eds. Micro and Small Enterprises in Kenya: Agenda for Improving the Policy
Environment. Nairobi: International Centre for Economic Growth. 56–79.
Bolton Report (1971). Committee of inquiry on Small firms.
Bowen, M., Morara M., and Mureithi S. (2009). Management of business challenges among
small and micro enterprises in Nairobi-Kenya. KCA journal of business management:
vol. 2(1), 18-19.
Burns, P. (1994) - Barriers To Growth In Europe - 3i/Cranfield European Enterprise Centre,
Report No.11.
Carrizosa, M. T. (2007). Firm Growth, Persistence and Multiplicity of Equilibria: An
Analysis of Spanish Manufacturing and Service Industries. Published Project,
Universitat Rovira I Virgili
Central Bank of Kenya. (2013). The Annual Economic Report 2012. Central Bank of Kenya

39
Chandran, C. (2004). Research Methods with Illustrations from Christian Ministries.
Starbright Services Ltd.
Churchill, N.C., Lewis V.L., (1983). The five stages of small business growth. Harvard
Business Review, 61(3), 30-50
Cooney, M., Malinen, P. (2004). Firm growth as a research issue. 1st. Inter-RENT online
publication, 4-16.
Cooper, D. R., Schindler P. S. (2003). Business Research Methods. (8th ed.); New Delhi;
MacGraw-Hill
Cyert, R. M., March J. G. (1963). A Behavioral Theory of the Firm. 2nd ed. Prentice Hall,
Englewood Cliffs, NJ.
East African Orthopaedic Journal, (2009). Road Safety in Kenya. Vol 2(1).
European Commission. (2011). European Union website, the official EU website. Retrieved
2013 25, July, from Definition of SMEs: http://www.europa.eu
Grant Thornton International (1995). European Business Survey. Business Strategies Ltd.,
London
Hill, T. (1987). Small Business Production / Operations Management. Macmillan Education
Ltd.
Joppe, M. (2000). The Research Process. Retrieved July 25, 2013, from
http://www.ryerson.ca/~mjoppe/rp.htm
Kenya Association of Manufacturers. (2012). High cost of electricity to stall economic growth.
Retrieved July 24 2013, from latest News: http://www.kam.co.ke/
Kariuki, N. (1995). The effects of liberalization on access to bank credit in Kenya, Small
Enterprise Development, 6(1), 15-23
Kasekende, L., Opondo, H. (2003). Financing Small and Medium-scale Enterprises (SMEs):
Uganda’s Experience, Bank of Uganda Working Paper.
40
Kenya National Bureau of Statistics. (2012). Economic Survey 2012, 43-44
Kiggundu, M. (2002). Enterprenuers and Enterprenuership in Africa. What is known and
what needs to be done. Journal of Development Enterprenuership,7(3), 239-258
King, K. and McGrath, S. (2002). Educational Training and Development, International
Review of Education. Globalization, Enterprise and Knowledge Symposium, Oxford.
Koech, B. C. (2011). A Survey of the Financial Constraints Hindering Growth of Sme’s In
Kenya: The Case of Kamukunji District In Nairobi County. Unpublished MBA
project University of Nairobi , 1-66.
Kothari, C.R., 2004, Research Methodology-Methods and Techniques (2nd Ed). New Age
International Publishers.
Lawrence, N., Grace, W. & Maurice, S (2012). An Analysis of Competitive Strategies
Employed by Private Universities in Kenya: A case study of private universities in
Nairobi. Retrieved July 10, 2013
(WWW.escanda.net/index.phs/mse/article/view/j.mse.1913035x20120602.3600)
Manasseh, P.N (2004). A Text Book of Business Finance. 3rd Edition. Nairobi. McMore
Accounting Books.
Mansfield, E (1962), “Entry, Gibrat’s Law, Innovation, and the Growth of Firms”, American
Economic Review, 52, 1023–1051.
Msoka, E.M. (2012). Do Entrepreneurship Skills Have an Influence on the Performance of
Women Owned Enterprises in Africa? Case of Micro and Small Enterprises in Dar es
Salaam, Tanzania. International Journal of Business, Humanities and Technology,
3(3), 53-59
Mugenda, M. O. and Mugenda G. A., (2003). Quantitative and Qualitative Approaches.
ACTS Press, Nairobi, Kenya
Mwobobia, F.M (2012), The Challenges Facing Small-Scale Women Entrepreneurs: A Case
of Kenya. International Journal of Business Administration 3(2), 112-115.
41
Njoroge, E. (2012). Factors Affecting Perfomance of Small Scale Horticulture Farmers in
Thika District. Unpublished MBA project, University of Nairobi.
Nkonoki, E. (2010), Factors limiting the success and/or growth of small businesses in
Tanzania, An empirical study on small business growth. Unpublished MBA project,
Arcada University of Applied Sciences
Olawale, F., and Garwe, D. (2010). Obstacles to the growth of new SMEs in South Africa.
Unpublished MBA Project, University of Fort Hare, South Africa.
Olusola A. (2011). Accounting Skill as a Performance Factor for Small Businesses in
Nigeria. Journal of Emerging Trends in Economics and Management Sciences, 2(5),
372-378
Page, J., Soderbom M. (2012). Is small beautiful? Small enterprise, aid and employment in
Africa. Paper presented at the UNU-WIDER seminar on “Aid and Employment”,
Copenhagen, Denmark.
Penrose, E. (2009). The Theory of the Growth of the Firm. Oxford: 2009.
Republic of Kenya (1986). Sessional Paper No.1 of 1986 on Economic Management for
Renewed Growth. Government Printer, Nairobi
Republic of Kenya (1989). National Development Plan for the Period 1989 to 1993.
Government Printer. Nairobi
Republic of Kenya (1992). Sessional Paper No. 2 on Small Enterprises and Jua Kali
Development in Kenya. Government Printer, Nairobi
Republic of Kenya (2008). Vision 2030. Government Printer, Nairobi
Robai, V. (2006). Informal finance as a Source of Fund for SME in Kenya: Dandora.
Unpublished MBA Project University of Nairobi, pp. 1-57.
Rubin, J. (2012). The Big Flatline: Oil and the No-Growth Economy. New York, Palgrave
Macmillan
Robson, C. (2002). Real World Research (2nd Ed.). Oxford: Blackwell.

42
Saleemi, N.A (2007). Economics Simplified. Nairobi. Saleemi Publications Ltd.
Scott, M. and Bruce, R. (1987). Five stages of small business growth, Long range planning,
20 (3), 45-52.
Steel W (1994) 'Changing the institutional and policy environment for small enterprise
development in Africa', Small Enterprise Development, 5 (2), 4-9
Stokes, D. and Wilson, N. (2010). Small Business Growth and Enterprenuership. South
Western Cengage Larning.
Storey, D.J. (1994). Understanding the small business sector, London: International
Thomson Business Press.
Sutton, J (1997). “Gibrat’s Legacy.” Journal of Economic Literature, 35, 40–59.
Terpstra, D.E. and Olson, P.D. (1993) - Entrepreneurial Start-up And Growth: A
Classification Of Problems - Entrepreneurship Theory and Practice, Vol.17, No.3, pp
5-20
Thuranira, C.A. (2009). Factors affecting accessibility of credit facilities among the small
and micro-enterprises: A case study of Meru CBD.
Tonge, J. (2001) A Review of Small Business Literature Part 2: Birth, Growth and Death of
the Small Business. Manchester Metropolitan University Business School Working
Paper Series.
Wandabusi, S. (10th May 2011). SME sector urgently needs legal framework. The Standard
Digital Edition.
Wanjohi, A.M. and Mugure, A. (2008). Factors affecting the growth of MSEs in rural areas
of Kenya: A case of ICT firms in Kiserian Township, Kajiado District of Kenya.
World Bank. (2013). Doing Business in 2012. The World Bank. Washington D. C.

43
APENDICES
SURVEY QUESTIONNAIRE
Part one: General Information
1. Company Name__________________________________________________
2. Number of years in operation________________
3. Form of ownership: Sole proprietorship( ) Partnership ( ) Company ( ) Others;
Specify________________
4. Number of employees: Permanent ( ) Casual ( ) Other;
Specify________________
5. Who runs the business: Owner ( ) Professional Manager ( ) Others;
Specify________
6. What is the level of training of the person in 7 above: Primary School ( ) Secondary
School ( ) Technical College( ) University Degree ( ) Others;
Specify________________
7. Gender of the entrepreneur / main shareholder: Male ( ) Female ( ) Others;
Specify________________
Part two: Determinants of Financial Performance
1. In a scale of 1-5 how would you rank the following factors that affect performance of
your firm’s and inhibits growth.(1 being no effect and 5 being very high effect)
FINANCIAL CONSTRAINTS No
Effect
Low
Effect
Medium
Effect
High
Effect
Very
High
Effect
Interest Rates
Collateral for Loans
Transaction costs for loans
Energy costs (Fuel & Electricity)
Cost of raw materials Eg Paint,
Cost of Machines
Low Business Skills
Inadequate Technology e.g ICT

44
2. Which has been your major investment in the last five years?
TYPE OF INVESTMENT PERCENTAGE
Purchase of machines and equipment
Funding of working capital
Investment in ICT
Purchase of premises
New Branch
Others
None
TOTAL 100 %
3. What was your main source of funds for the above investment?
SOURCE OF FINANCE
Bank Loans
Loan from government agencies eg KIE, Youth Fund, Women Fund
Retained Earnings (profits)
Other types of loans eg from friends Merry go round etc
Owners funds
New capital to shareholders
Others __________________
TOTAL
4. Have you been able to implement all your desired investments: Yes ( ) No ( )
5. If no in 5 above, what was the main reason you did not execute your plan
_____ ___________
6. What has been the sales, profit and number of employees in your business in the years
indicated below?

45
YEAR SALES PROFITS EMPLOYMENT
2008
2009
2010
2011
2012
7. In your opinion, what has hindered the growth of your firm?
__ _

46
LIST OF GARAGES
NAME LOCATION
1 Action Auto Spares Likoni Rd
2 Automotive solutions ltd Enterprise Rd
3 Axel Body Builders & Engineering KNTC Godowns Off Nanyuki
4 Bizzy Beat Auto Centre Ltd Enterprise Rd
5 Calzmotor Services Ltd Baricho Rd
6 Concorde Motors Ltd Enterprise Rd
7 Dalex Motors Ltd. Chepkorio Road, Off Lusaka Rd. Ind Area
8 Dhanjal motor works Bondo Rd
9 Dhruv Auto Clinic Pokomo RD
10 Dodi Auto tech Nanyuki Rd
11 Echo Kenya Ltd Kitui Rd
12 Emel motors Ltd Lusaka Rd
13 Executive Auto Services Ltd Dakar Rd
14 Four Wheel Drive Ltd Bondo rd
15 Four Runners Chepkorio Road, Off Lusaka Road
16 G T I Auto Services Ltd Likoni Rd
17 Gari Motors Ltd Lusaka Close – off Lusaka Rd. Ind Area
18 Gari Panel beaters Ltd Lusaka Rd
19 Gicard Enterprises Likoni Rd
20 Goldex Enterprises Pate Rd
21 Hazina Motors ltd Busia RD
22 Huade Motors Off Enterprise Road, next to Isiolo Road
23 Ihururu Technical services Shimo la Tewa Rd
24 J. B. Motors Ltd. Lusaka Road, Industrial Area
25 Kavia Panel Beaters and Painters Enterprise Rd
26 Kenhar Motor Service Ltd Lusaka rd
27 Kenya Coach Industries Addis Ababa Road, Industrial area
28 Kenya Motors & Equipment Gilgil Road Industrial Area
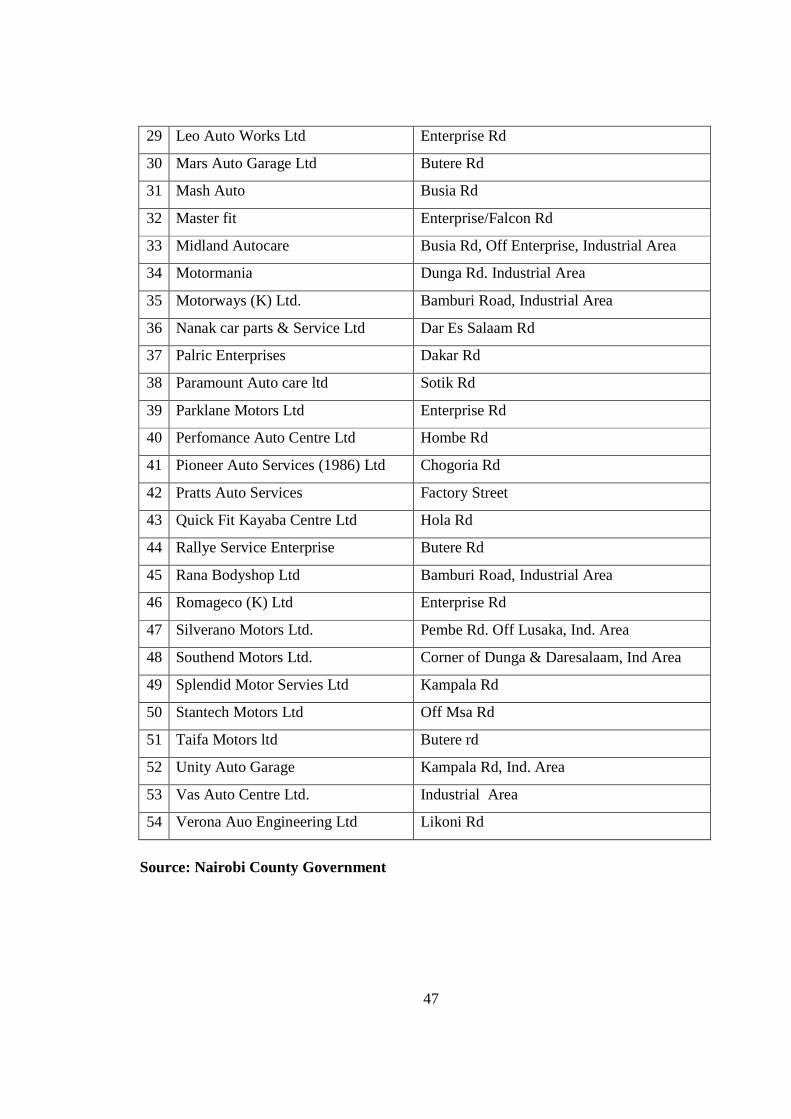
47
29 Leo Auto Works Ltd Enterprise Rd
30 Mars Auto Garage Ltd Butere Rd
31 Mash Auto Busia Rd
32 Master fit Enterprise/Falcon Rd
33 Midland Autocare Busia Rd, Off Enterprise, Industrial Area
34 Motormania Dunga Rd. Industrial Area
35 Motorways (K) Ltd. Bamburi Road, Industrial Area
36 Nanak car parts & Service Ltd Dar Es Salaam Rd
37 Palric Enterprises Dakar Rd
38 Paramount Auto care ltd Sotik Rd
39 Parklane Motors Ltd Enterprise Rd
40 Perfomance Auto Centre Ltd Hombe Rd
41 Pioneer Auto Services (1986) Ltd Chogoria Rd
42 Pratts Auto Services Factory Street
43 Quick Fit Kayaba Centre Ltd Hola Rd
44 Rallye Service Enterprise Butere Rd
45 Rana Bodyshop Ltd Bamburi Road, Industrial Area
46 Romageco (K) Ltd Enterprise Rd
47 Silverano Motors Ltd. Pembe Rd. Off Lusaka, Ind. Area
48 Southend Motors Ltd. Corner of Dunga & Daresalaam, Ind Area
49 Splendid Motor Servies Ltd Kampala Rd
50 Stantech Motors Ltd Off Msa Rd
51 Taifa Motors ltd Butere rd
52 Unity Auto Garage Kampala Rd, Ind. Area
53 Vas Auto Centre Ltd. Industrial Area
54 Verona Auo Engineering Ltd Likoni Rd
Source: Nairobi County Government


