
Page 1 of 60
FCC Test Report
Report No.: AGC00625170801FE03
FCC ID : 2ALAZMS01B-BES
APPLICATION PURPOSE : Original Equipment
PRODUCT DESIGNATION : True Wireless Stereo Earbuds (TWS earbuds)
BRAND NAME : MEES
MODEL NAME : See Page 4
CLIENT : Shenzhen Mees Technology Co., Ltd.
DATE OF ISSUE : Jun. 30, 2017
STANDARD(S) TEST PROCEDURE(S)
: FCC Part 15 Subpart C Section 15.249
REPORT VERSION : V1.0
Attestation of Global Compliance (Shenzhen) Co., Ltd
CAUTION: This report shall not be reproduced except in full without the written permission of the test laboratory and shall not be quoted out of context.
Report No.: AGC00625170801FE03
Page 2 of 60
Report Revise Record
Report Version Revise Time Issued Date Valid Version Notes
V1.0 / Jun. 30, 2017 Valid Original Report
Report No.: AGC00625170801FE03
Page 3 of 60
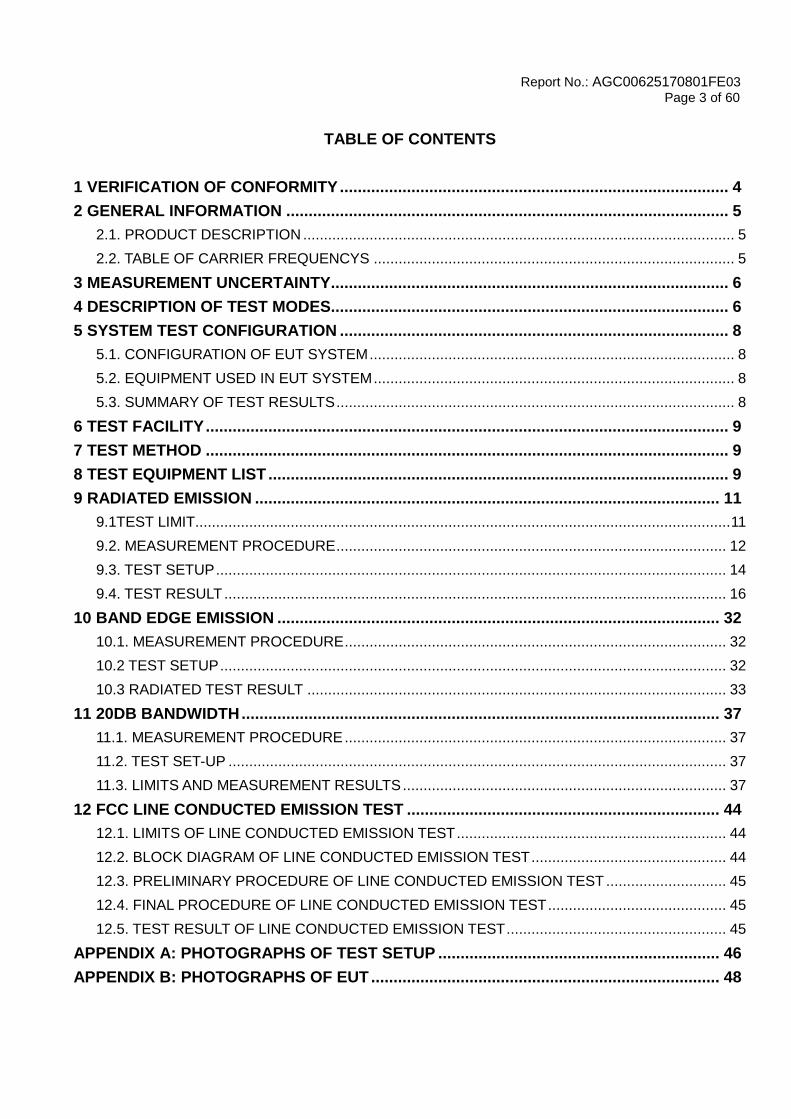
TABLE OF CONTENTS
1 VERIFICATION OF CONFORMITY ....................................................................................... 4
2 GENERAL INFORMATION ................................................................................................... 5
2.1. PRODUCT DESCRIPTION ........................................................................................................ 5
2.2. TABLE OF CARRIER FREQUENCYS ....................................................................................... 5
3 MEASUREMENT UNCERTAINTY......................................................................................... 6
4 DESCRIPTION OF TEST MODES......................................................................................... 6
5 SYSTEM TEST CONFIGURATION ....................................................................................... 8
5.1. CONFIGURATION OF EUT SYSTEM ........................................................................................ 8
5.2. EQUIPMENT USED IN EUT SYSTEM ....................................................................................... 8
5.3. SUMMARY OF TEST RESULTS ................................................................................................ 8
6 TEST FACILITY ..................................................................................................................... 9
7 TEST METHOD ..................................................................................................................... 9
8 TEST EQUIPMENT LIST ....................................................................................................... 9
9 RADIATED EMISSION ........................................................................................................ 11
9.1TEST LIMIT................................................................................................................................. 11
9.2. MEASUREMENT PROCEDURE .............................................................................................. 12
9.3. TEST SETUP ........................................................................................................................... 14
9.4. TEST RESULT ......................................................................................................................... 16
10 BAND EDGE EMISSION ................................................................................................... 32
10.1. MEASUREMENT PROCEDURE ............................................................................................ 32
10.2 TEST SETUP .......................................................................................................................... 32
10.3 RADIATED TEST RESULT ..................................................................................................... 33
11 20DB BANDWIDTH ........................................................................................................... 37
11.1. MEASUREMENT PROCEDURE ............................................................................................ 37
11.2. TEST SET-UP ........................................................................................................................ 37
11.3. LIMITS AND MEASUREMENT RESULTS .............................................................................. 37
12 FCC LINE CONDUCTED EMISSION TEST ...................................................................... 44
12.1. LIMITS OF LINE CONDUCTED EMISSION TEST ................................................................. 44
12.2. BLOCK DIAGRAM OF LINE CONDUCTED EMISSION TEST ............................................... 44
12.3. PRELIMINARY PROCEDURE OF LINE CONDUCTED EMISSION TEST ............................. 45
12.4. FINAL PROCEDURE OF LINE CONDUCTED EMISSION TEST ........................................... 45
12.5. TEST RESULT OF LINE CONDUCTED EMISSION TEST ..................................................... 45
APPENDIX A: PHOTOGRAPHS OF TEST SETUP ............................................................... 46
APPENDIX B: PHOTOGRAPHS OF EUT .............................................................................. 48
Report No.: AGC00625170801FE03
Page 4 of 60
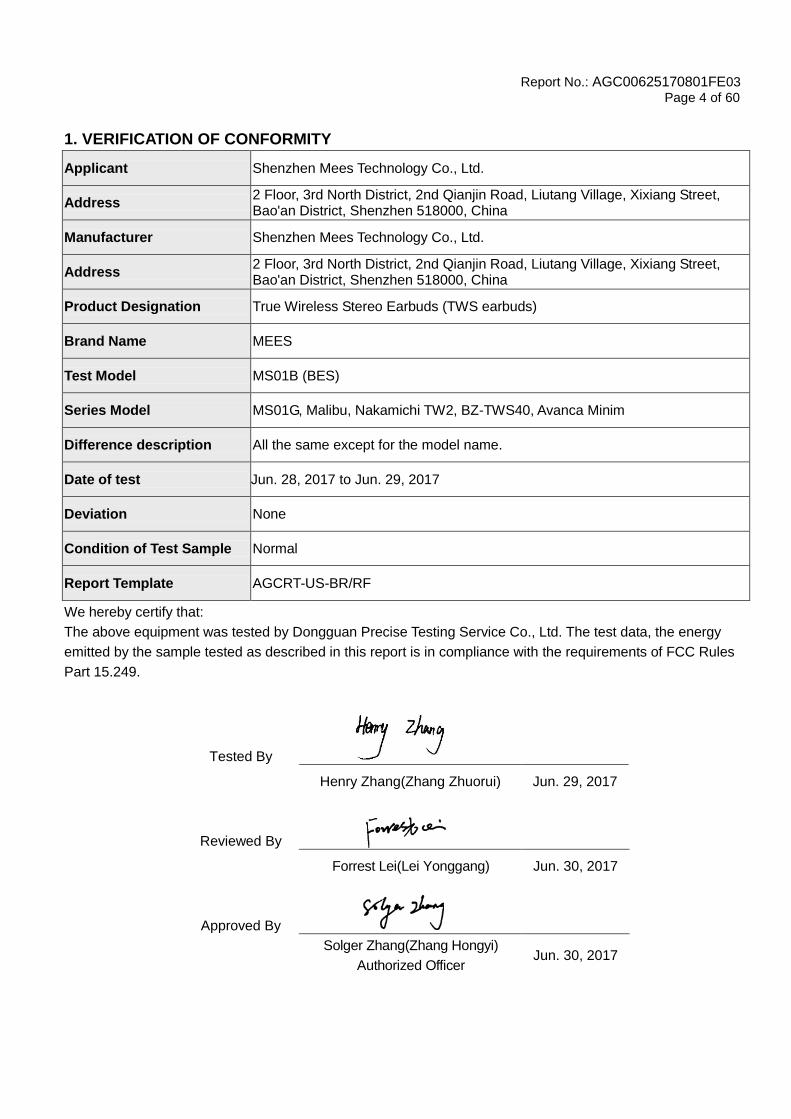
1. VERIFICATION OF CONFORMITY
Applicant Shenzhen Mees Technology Co., Ltd.
Address 2 Floor, 3rd North District, 2nd Qianjin Road, Liutang Village, Xixiang Street, Bao'an District, Shenzhen 518000, China
Manufacturer Shenzhen Mees Technology Co., Ltd.
Address 2 Floor, 3rd North District, 2nd Qianjin Road, Liutang Village, Xixiang Street, Bao'an District, Shenzhen 518000, China
Product Designation True Wireless Stereo Earbuds (TWS earbuds)
Brand Name MEES
Test Model MS01B (BES)
Series Model MS01G, Malibu, Nakamichi TW2, BZ-TWS40, Avanca Minim
Difference description All the same except for the model name.
Date of test Jun. 28, 2017 to Jun. 29, 2017
Deviation None
Condition of Test Sample Normal
Report Template AGCRT-US-BR/RF
We hereby certify that:
The above equipment was tested by Dongguan Precise Testing Service Co., Ltd. The test data, the energy
emitted by the sample tested as described in this report is in compliance with the requirements of FCC Rules
Part 15.249.
Tested By
Henry Zhang(Zhang Zhuorui) Jun. 29, 2017
Reviewed By
Forrest Lei(Lei Yonggang) Jun. 30, 2017
Approved By
Solger Zhang(Zhang Hongyi)
Authorized Officer Jun. 30, 2017
Report No.: AGC00625170801FE03
Page 5 of 60
2. GENERAL INFORMATION
2.1. PRODUCT DESCRIPTION
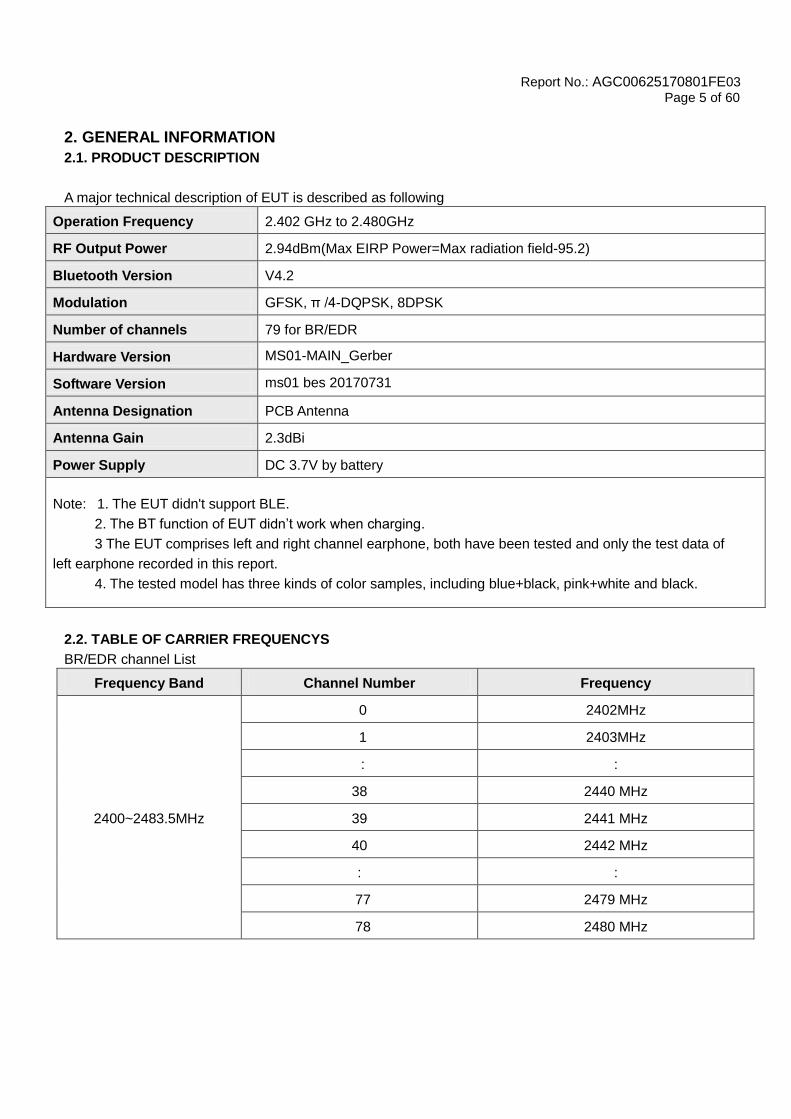
A major technical description of EUT is described as following
Operation Frequency 2.402 GHz to 2.480GHz
RF Output Power 2.94dBm(Max EIRP Power=Max radiation field-95.2)
Bluetooth Version V4.2
Modulation GFSK, π /4-DQPSK, 8DPSK
Number of channels 79 for BR/EDR
Hardware Version MS01-MAIN_Gerber
Software Version ms01 bes 20170731
Antenna Designation PCB Antenna
Antenna Gain 2.3dBi
Power Supply DC 3.7V by battery
Note: 1. The EUT didn't support BLE.
2. The BT function of EUT didn’t work when charging.
3 The EUT comprises left and right channel earphone, both have been tested and only the test data of
left earphone recorded in this report.
4. The tested model has three kinds of color samples, including blue+black, pink+white and black.
2.2. TABLE OF CARRIER FREQUENCYS
BR/EDR channel List
Frequency Band Channel Number Frequency
2400~2483.5MHz
0 2402MHz
1 2403MHz
: :
38 2440 MHz
39 2441 MHz
40 2442 MHz
: :
77 2479 MHz
78 2480 MHz

Report No.: AGC00625170801FE03
Page 6 of 60
3. MEASUREMENT UNCERTAINTY
The reported uncertainty of measurement y ±U, where expended uncertainty U is based on a standard
uncertainty multiplied by a coverage factor of k=2, providing a level of confidence of approximately 95 %.
No. Item Uncertainty
1 Conducted Emission Test ±3.18dB
2 All emissions,radiated ±3.91dB
3 Temperature ±0.5°C
4 Humidity ±2%
4. DESCRIPTION OF TEST MODES
NO. TEST MODE DESCRIPTION
1 Low channel GFSK
2 Middle channel GFSK
3 High channel GFSK
4 Low channel π /4-DQPSK
5 Middle channel π /4-DQPSK
6 High channel π /4-DQPSK
7 Low channel 8DPSK
8 Middle channel 8DPSK
9 High channel 8DPSK
10 BT Link
Note:
1. All the test modes can be supply by battery, only the result of the worst case was recorded in the
report, if no other cases.
2. For Radiated Emission, 3axis were chosen for testing for each applicable mode.
3.The EUT used fully-charged battery when tested.
Report No.: AGC00625170801FE03
Page 7 of 60
Software Setting
Report No.: AGC00625170801FE03
Page 8 of 60
5. SYSTEM TEST CONFIGURATION
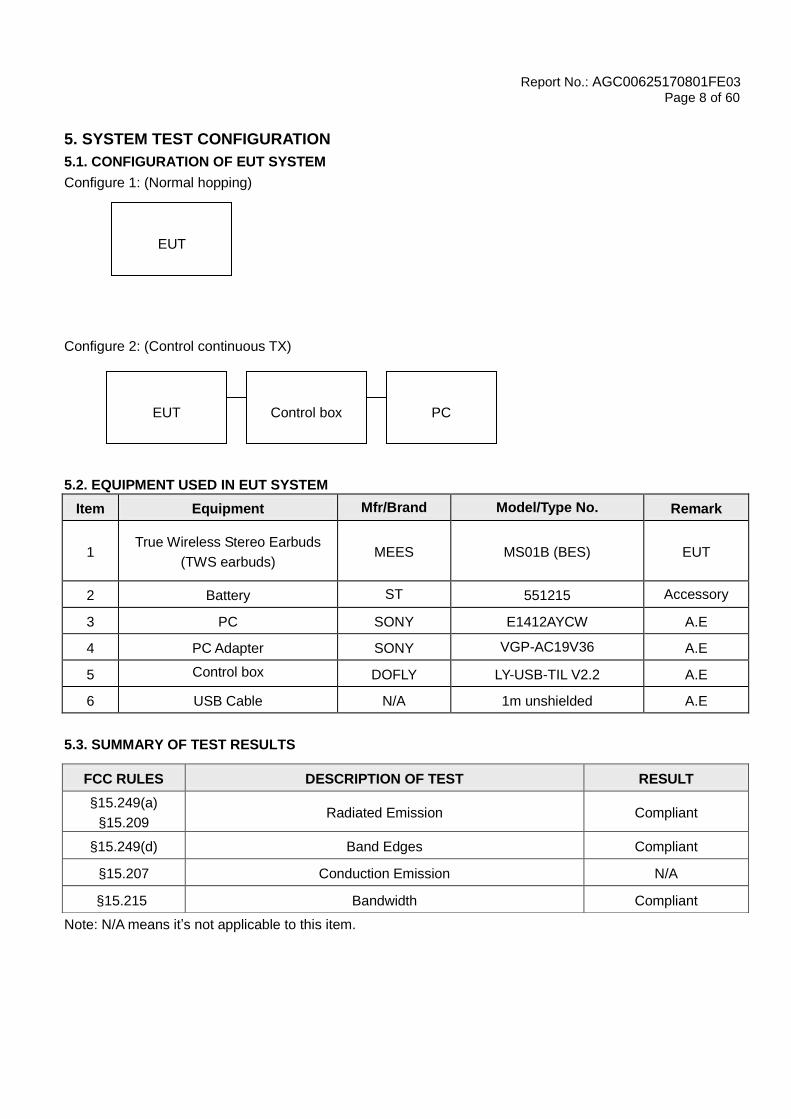
5.1. CONFIGURATION OF EUT SYSTEM
Configure 1: (Normal hopping)
Configure 2: (Control continuous TX)
5.2. EQUIPMENT USED IN EUT SYSTEM
Item Equipment Mfr/Brand Model/Type No. Remark
1 True Wireless Stereo Earbuds
(TWS earbuds) MEES MS01B (BES) EUT
2 Battery ST 551215 Accessory
3 PC SONY E1412AYCW A.E
4 PC Adapter SONY VGP-AC19V36 A.E
5 Control box
DOFLY LY-USB-TIL V2.2 A.E
6 USB Cable N/A 1m unshielded A.E
5.3. SUMMARY OF TEST RESULTS
Note: N/A means it’s not applicable to this item.
FCC RULES DESCRIPTION OF TEST RESULT
§15.249(a)
§15.209 Radiated Emission Compliant
§15.249(d) Band Edges Compliant
§15.207 Conduction Emission N/A
§15.215 Bandwidth Compliant
EUT
PC
Control box
EUT
Report No.: AGC00625170801FE03
Page 9 of 60
6. TEST FACILITY
7.TEST METHOD
All measurements contained in this report were conducted with ANSI C63.10-2013
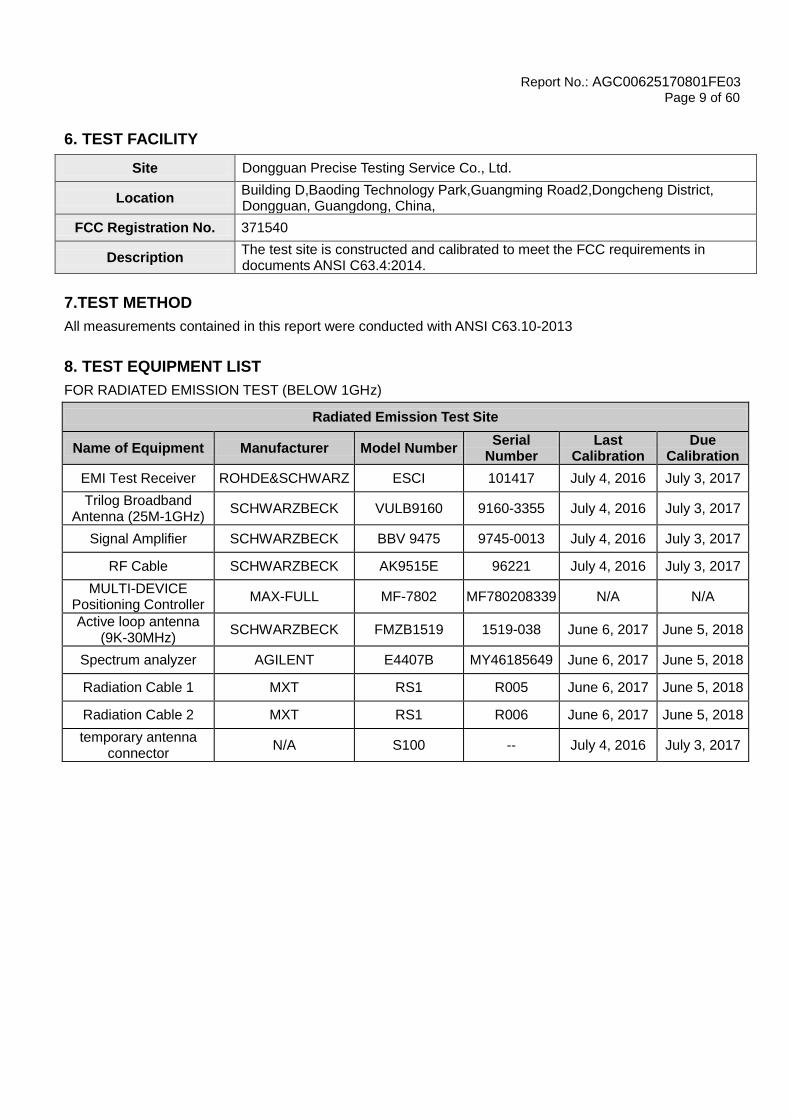
8. TEST EQUIPMENT LIST
FOR RADIATED EMISSION TEST (BELOW 1GHz)
Radiated Emission Test Site
Name of Equipment Manufacturer Model Number Serial
Number Last
Calibration Due
Calibration
EMI Test Receiver ROHDE&SCHWARZ ESCI 101417 July 4, 2016 July 3, 2017
Trilog Broadband Antenna (25M-1GHz)
SCHWARZBECK VULB9160 9160-3355 July 4, 2016 July 3, 2017
Signal Amplifier SCHWARZBECK BBV 9475 9745-0013 July 4, 2016 July 3, 2017
RF Cable SCHWARZBECK AK9515E 96221 July 4, 2016 July 3, 2017
MULTI-DEVICE Positioning Controller
MAX-FULL MF-7802 MF780208339 N/A N/A
Active loop antenna (9K-30MHz)
SCHWARZBECK FMZB1519 1519-038 June 6, 2017 June 5, 2018
Spectrum analyzer AGILENT E4407B MY46185649 June 6, 2017 June 5, 2018
Radiation Cable 1 MXT RS1 R005 June 6, 2017 June 5, 2018
Radiation Cable 2 MXT RS1 R006 June 6, 2017 June 5, 2018
temporary antenna connector
N/A S100 -- July 4, 2016 July 3, 2017
Site Dongguan Precise Testing Service Co., Ltd.
Location Building D,Baoding Technology Park,Guangming Road2,Dongcheng District, Dongguan, Guangdong, China,
FCC Registration No. 371540
Description The test site is constructed and calibrated to meet the FCC requirements in documents ANSI C63.4:2014.
Report No.: AGC00625170801FE03
Page 10 of 60
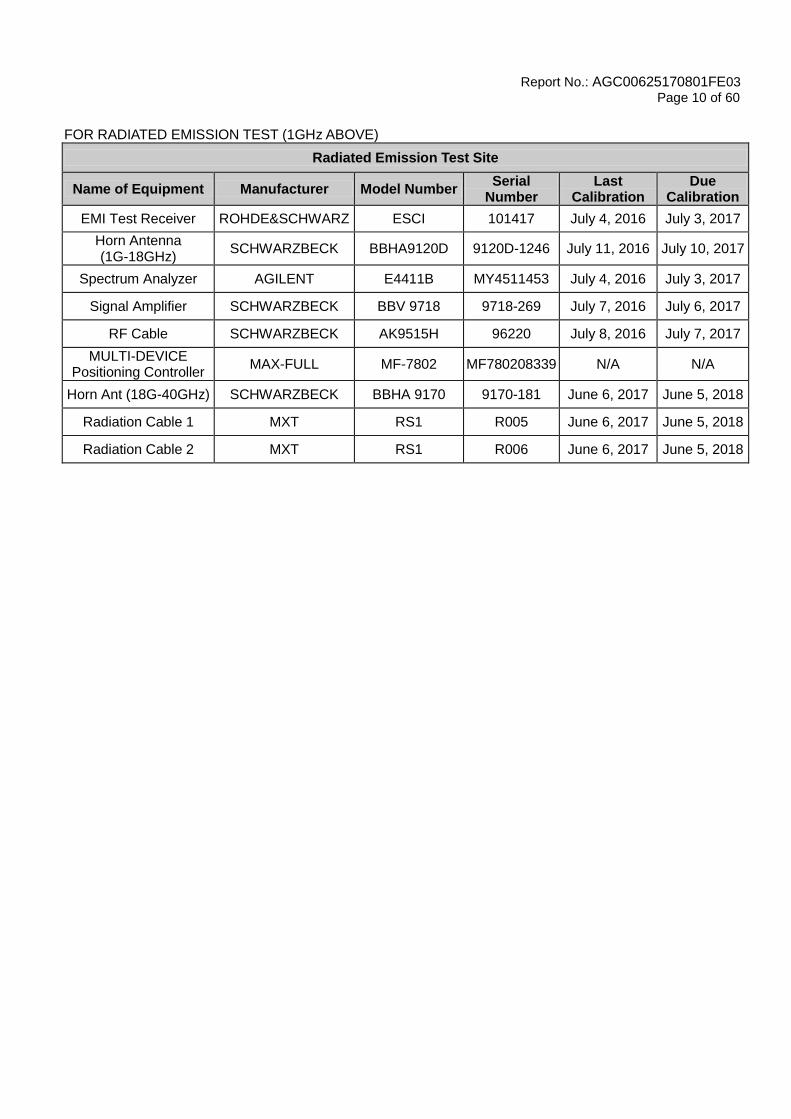
FOR RADIATED EMISSION TEST (1GHz ABOVE)
Radiated Emission Test Site
Name of Equipment Manufacturer Model Number Serial
Number Last
Calibration Due
Calibration
EMI Test Receiver ROHDE&SCHWARZ ESCI 101417 July 4, 2016 July 3, 2017
Horn Antenna (1G-18GHz)
SCHWARZBECK BBHA9120D 9120D-1246 July 11, 2016 July 10, 2017
Spectrum Analyzer AGILENT E4411B MY4511453 July 4, 2016 July 3, 2017
Signal Amplifier SCHWARZBECK BBV 9718 9718-269 July 7, 2016 July 6, 2017
RF Cable SCHWARZBECK AK9515H 96220 July 8, 2016 July 7, 2017
MULTI-DEVICE Positioning Controller
MAX-FULL MF-7802 MF780208339 N/A N/A
Horn Ant (18G-40GHz) SCHWARZBECK BBHA 9170 9170-181 June 6, 2017 June 5, 2018
Radiation Cable 1 MXT RS1 R005 June 6, 2017 June 5, 2018
Radiation Cable 2 MXT RS1 R006 June 6, 2017 June 5, 2018
Report No.: AGC00625170801FE03
Page 11 of 60
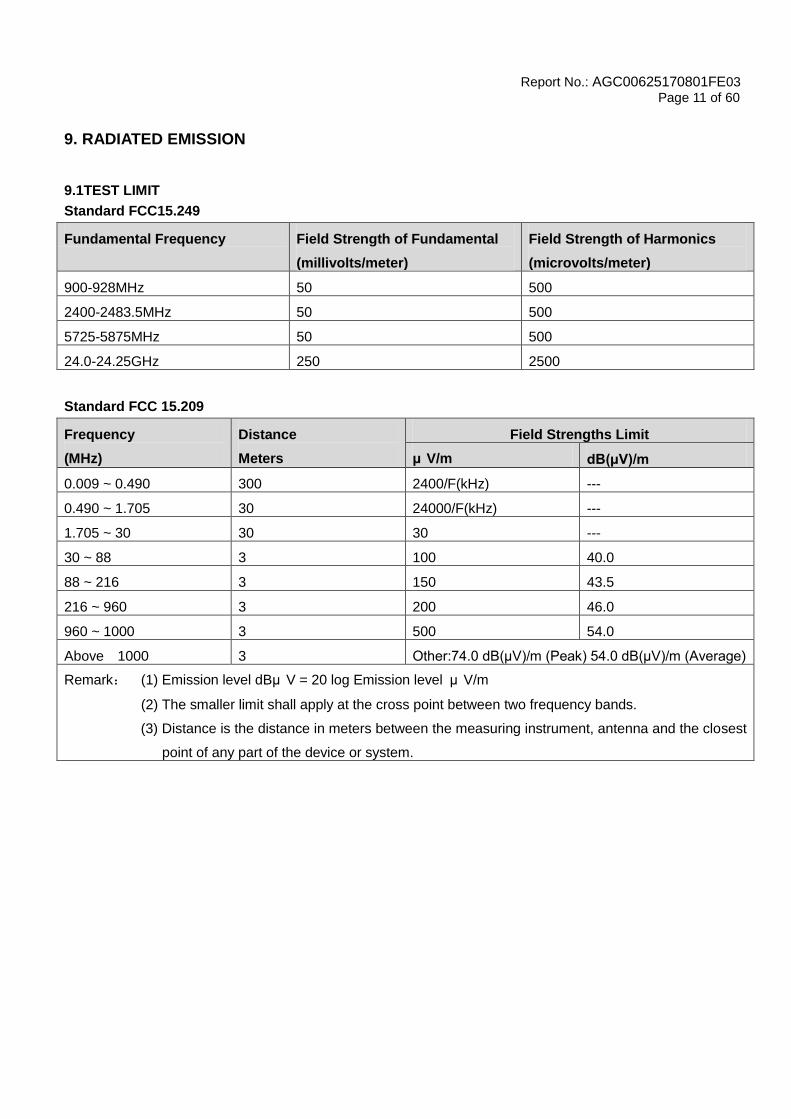
9. RADIATED EMISSION
9.1TEST LIMIT
Standard FCC15.249
Fundamental Frequency Field Strength of Fundamental
(millivolts/meter)
Field Strength of Harmonics
(microvolts/meter)
900-928MHz 50 500
2400-2483.5MHz 50 500
5725-5875MHz 50 500
24.0-24.25GHz 250 2500
Standard FCC 15.209
Frequency
(MHz)
Distance
Meters
Field Strengths Limit
μ V/m dB(μV)/m
0.009 ~ 0.490 300 2400/F(kHz) ---
0.490 ~ 1.705 30 24000/F(kHz) ---
1.705 ~ 30 30 30 ---
30 ~ 88 3 100 40.0
88 ~ 216 3 150 43.5
216 ~ 960 3 200 46.0
960 ~ 1000 3 500 54.0
Above 1000 3 Other:74.0 dB(μV)/m (Peak) 54.0 dB(μV)/m (Average)
Remark: (1) Emission level dBμ V = 20 log Emission level μ V/m
(2) The smaller limit shall apply at the cross point between two frequency bands.
(3) Distance is the distance in meters between the measuring instrument, antenna and the closest
point of any part of the device or system.
Report No.: AGC00625170801FE03
Page 12 of 60
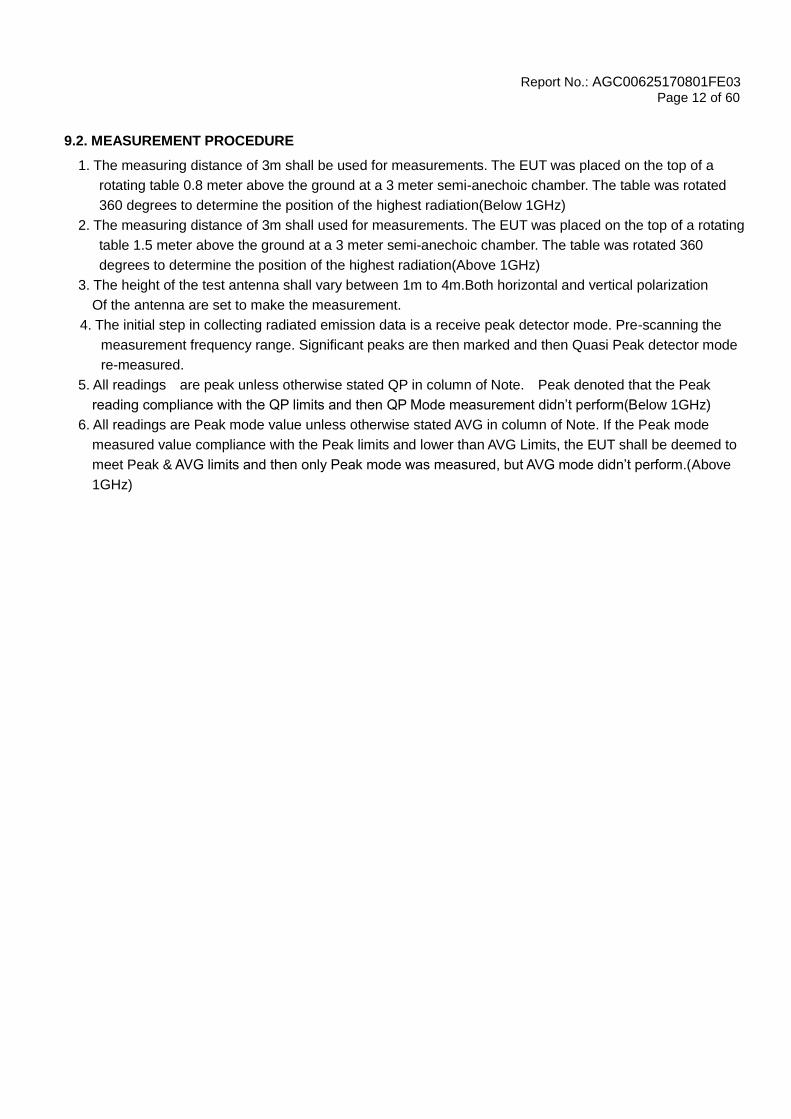
9.2. MEASUREMENT PROCEDURE
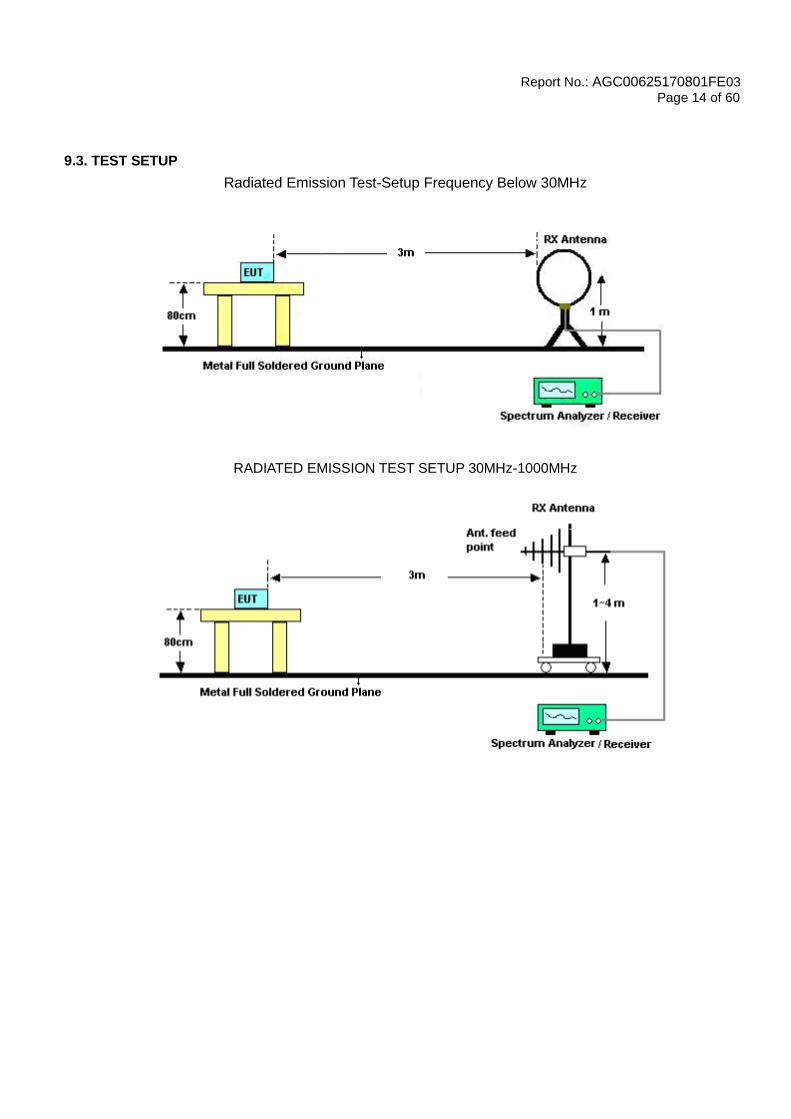
1. The measuring distance of 3m shall be used for measurements. The EUT was placed on the top of a
rotating table 0.8 meter above the ground at a 3 meter semi-anechoic chamber. The table was rotated
360 degrees to determine the position of the highest radiation(Below 1GHz)
2. The measuring distance of 3m shall used for measurements. The EUT was placed on the top of a rotating
table 1.5 meter above the ground at a 3 meter semi-anechoic chamber. The table was rotated 360
degrees to determine the position of the highest radiation(Above 1GHz)
3. The height of the test antenna shall vary between 1m to 4m.Both horizontal and vertical polarization
Of the antenna are set to make the measurement.
4. The initial step in collecting radiated emission data is a receive peak detector mode. Pre-scanning the
measurement frequency range. Significant peaks are then marked and then Quasi Peak detector mode
re-measured.
5. All readings are peak unless otherwise stated QP in column of Note. Peak denoted that the Peak
reading compliance with the QP limits and then QP Mode measurement didn’t perform(Below 1GHz)
6. All readings are Peak mode value unless otherwise stated AVG in column of Note. If the Peak mode
measured value compliance with the Peak limits and lower than AVG Limits, the EUT shall be deemed to
meet Peak & AVG limits and then only Peak mode was measured, but AVG mode didn’t perform.(Above
1GHz)
Report No.: AGC00625170801FE03
Page 13 of 60
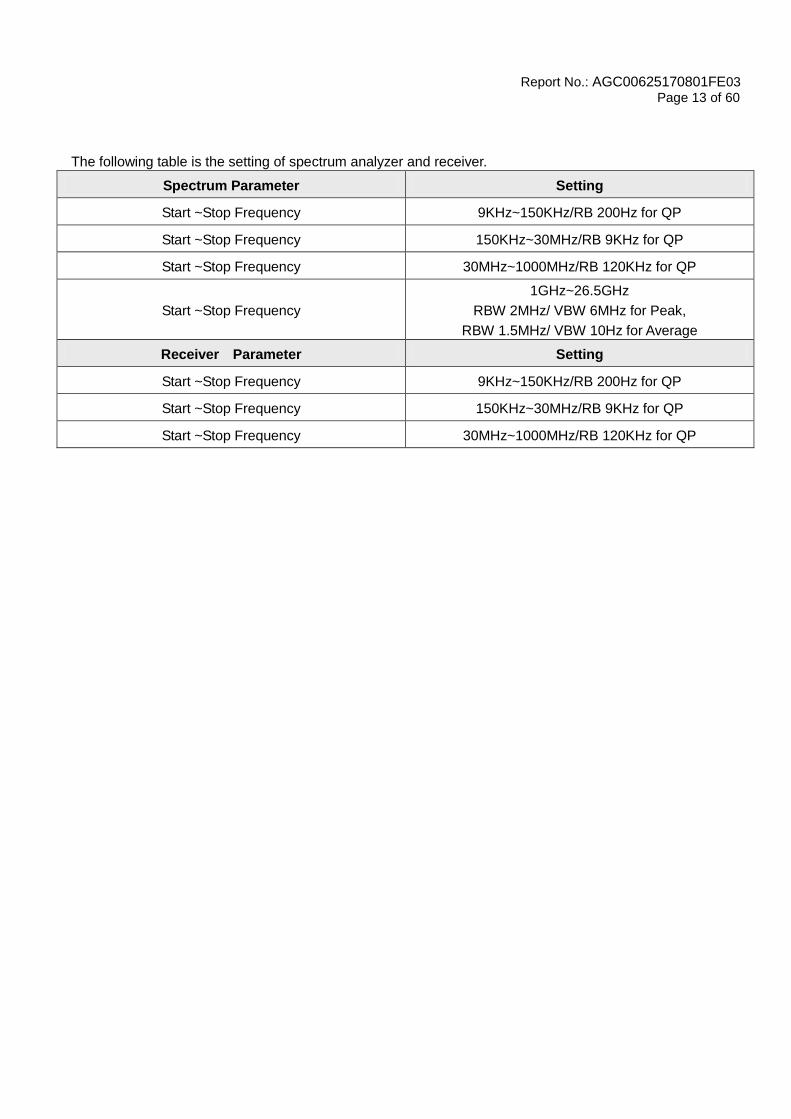
The following table is the setting of spectrum analyzer and receiver.
Spectrum Parameter Setting
Start ~Stop Frequency 9KHz~150KHz/RB 200Hz for QP
Start ~Stop Frequency 150KHz~30MHz/RB 9KHz for QP
Start ~Stop Frequency 30MHz~1000MHz/RB 120KHz for QP
Start ~Stop Frequency
1GHz~26.5GHz
RBW 2MHz/ VBW 6MHz for Peak,
RBW 1.5MHz/ VBW 10Hz for Average
Receiver Parameter Setting
Start ~Stop Frequency 9KHz~150KHz/RB 200Hz for QP
Start ~Stop Frequency 150KHz~30MHz/RB 9KHz for QP
Start ~Stop Frequency 30MHz~1000MHz/RB 120KHz for QP
Report No.: AGC00625170801FE03
Page 14 of 60
9.3. TEST SETUP
Radiated Emission Test-Setup Frequency Below 30MHz
RADIATED EMISSION TEST SETUP 30MHz-1000MHz

Report No.: AGC00625170801FE03
Page 15 of 60
RADIATED EMISSION TEST SETUP ABOVE 1000MHz
Report No.: AGC00625170801FE03
Page 16 of 60
9.4. TEST RESULT
(Worst modulation:GFSK)
FOR BR/EDR
RADIATED EMISSION BELOW 30MHz
No emission found between lowest internal used/generated frequencies to 30MHz.
RADIATED EMISSION BELOW 1GHz
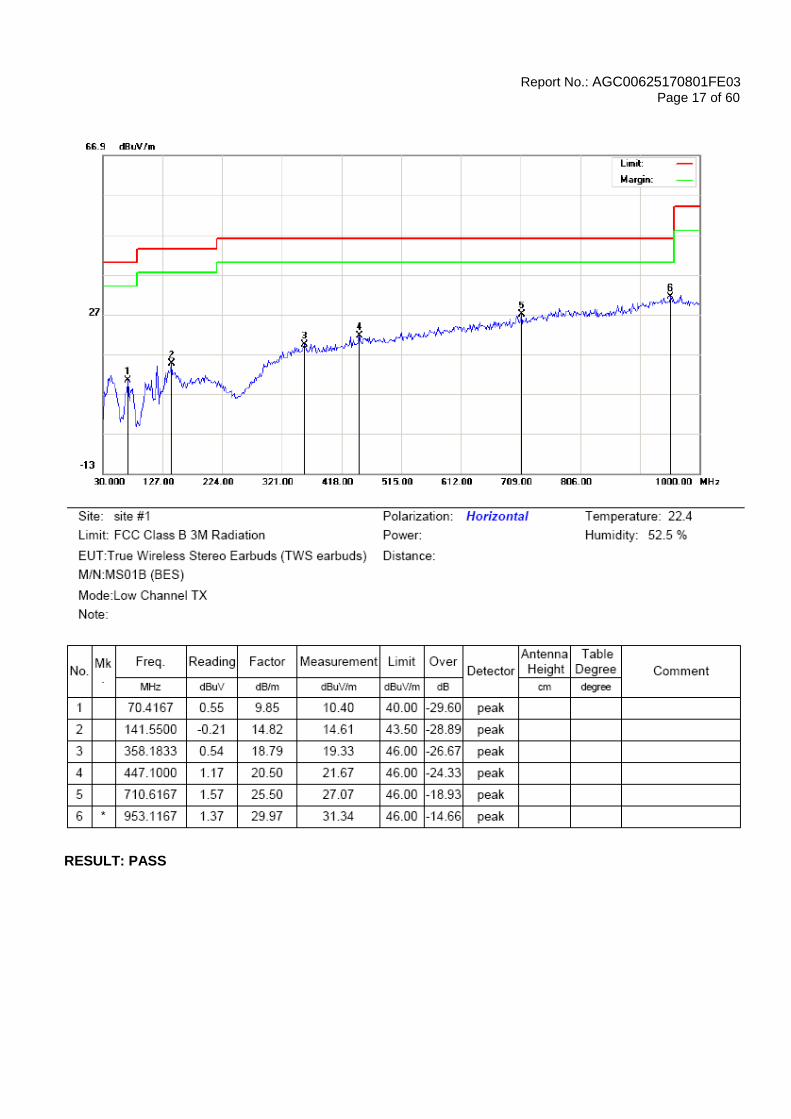
RADIATED EMISSION TEST- (30MHZ-1GHZ)-LOW CHANNEL-HORIZONTAL
Report No.: AGC00625170801FE03
Page 17 of 60
RESULT: PASS
Report No.: AGC00625170801FE03
Page 18 of 60
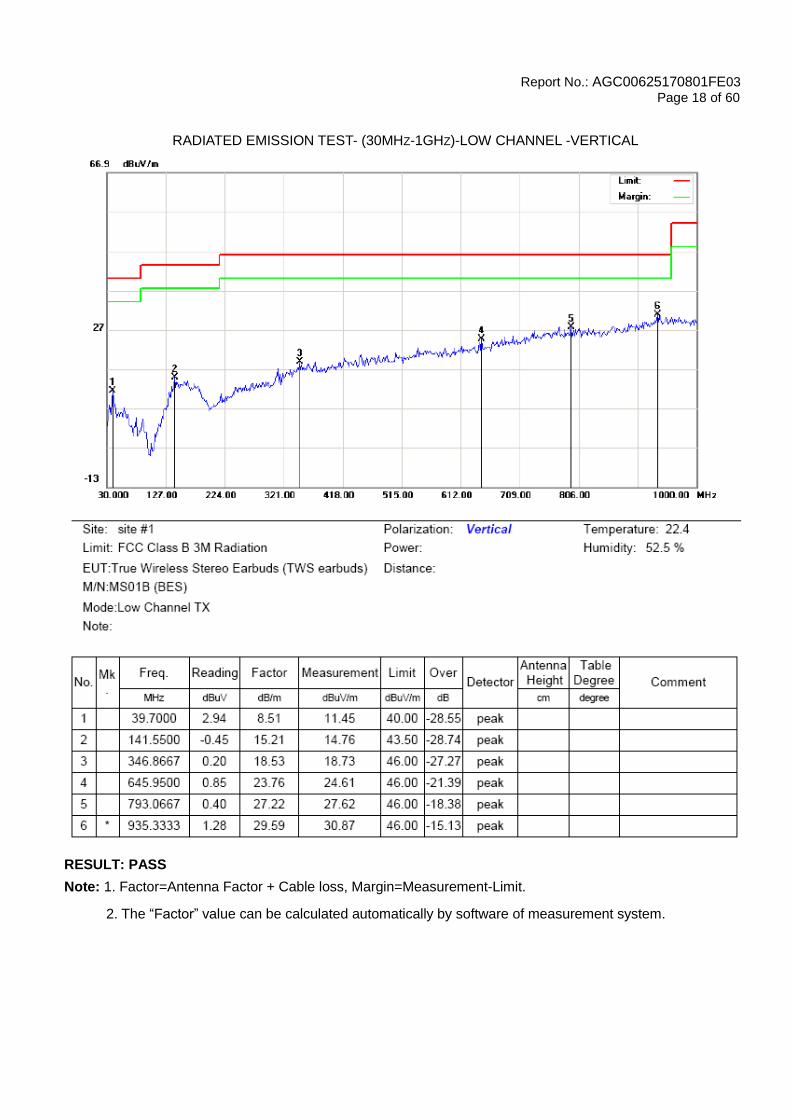
RADIATED EMISSION TEST- (30MHZ-1GHZ)-LOW CHANNEL -VERTICAL
RESULT: PASS
Note: 1. Factor=Antenna Factor + Cable loss, Margin=Measurement-Limit.
2. The “Factor” value can be calculated automatically by software of measurement system.
Report No.: AGC00625170801FE03
Page 19 of 60
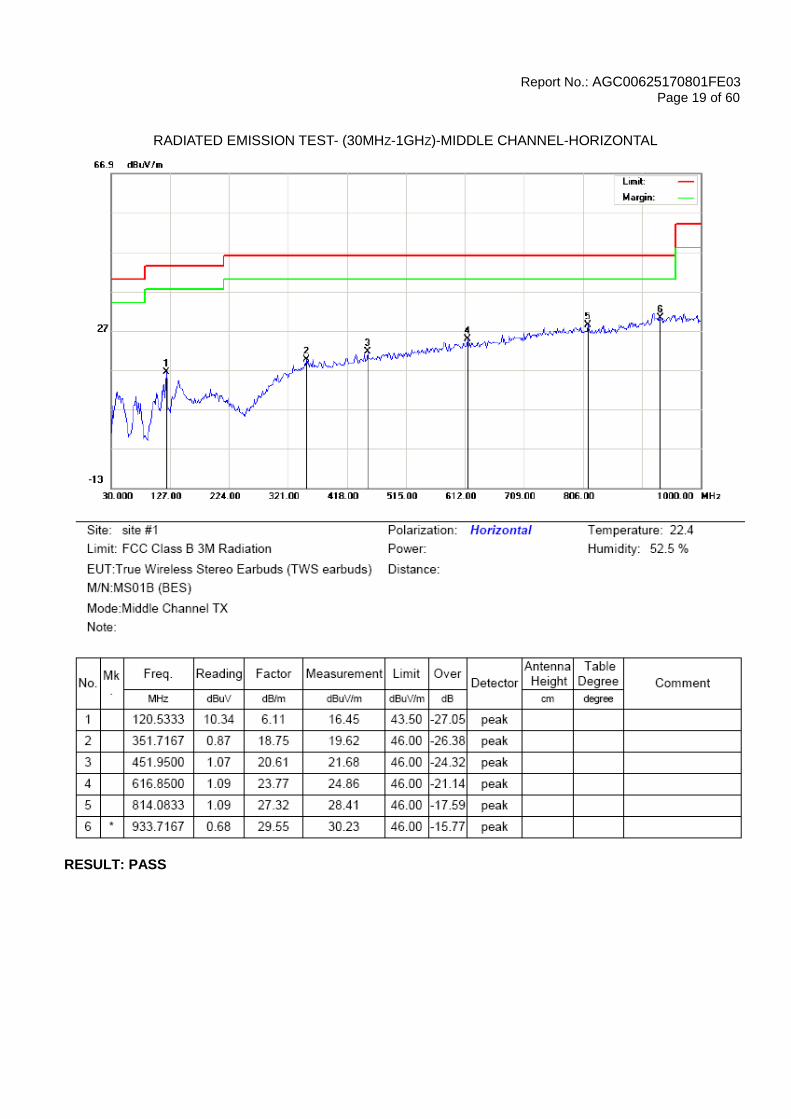
RADIATED EMISSION TEST- (30MHZ-1GHZ)-MIDDLE CHANNEL-HORIZONTAL
RESULT: PASS
Report No.: AGC00625170801FE03
Page 20 of 60
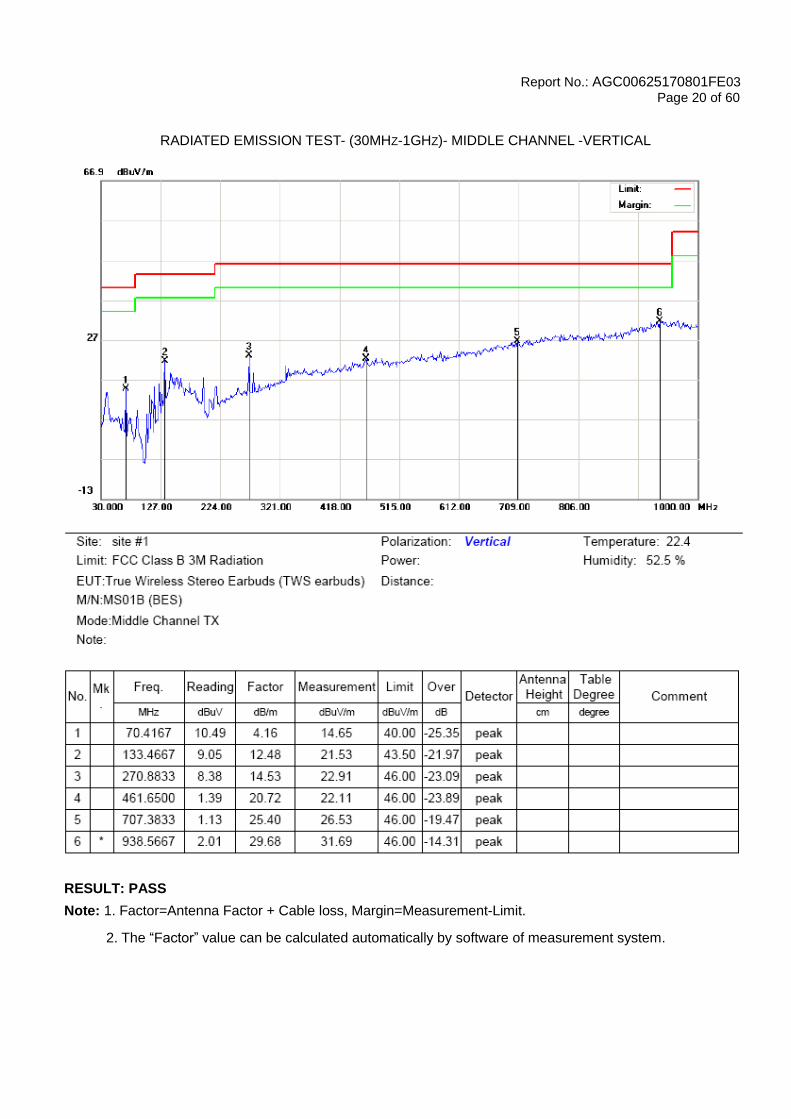
RADIATED EMISSION TEST- (30MHZ-1GHZ)- MIDDLE CHANNEL -VERTICAL
RESULT: PASS
Note: 1. Factor=Antenna Factor + Cable loss, Margin=Measurement-Limit.
2. The “Factor” value can be calculated automatically by software of measurement system.
Report No.: AGC00625170801FE03
Page 21 of 60
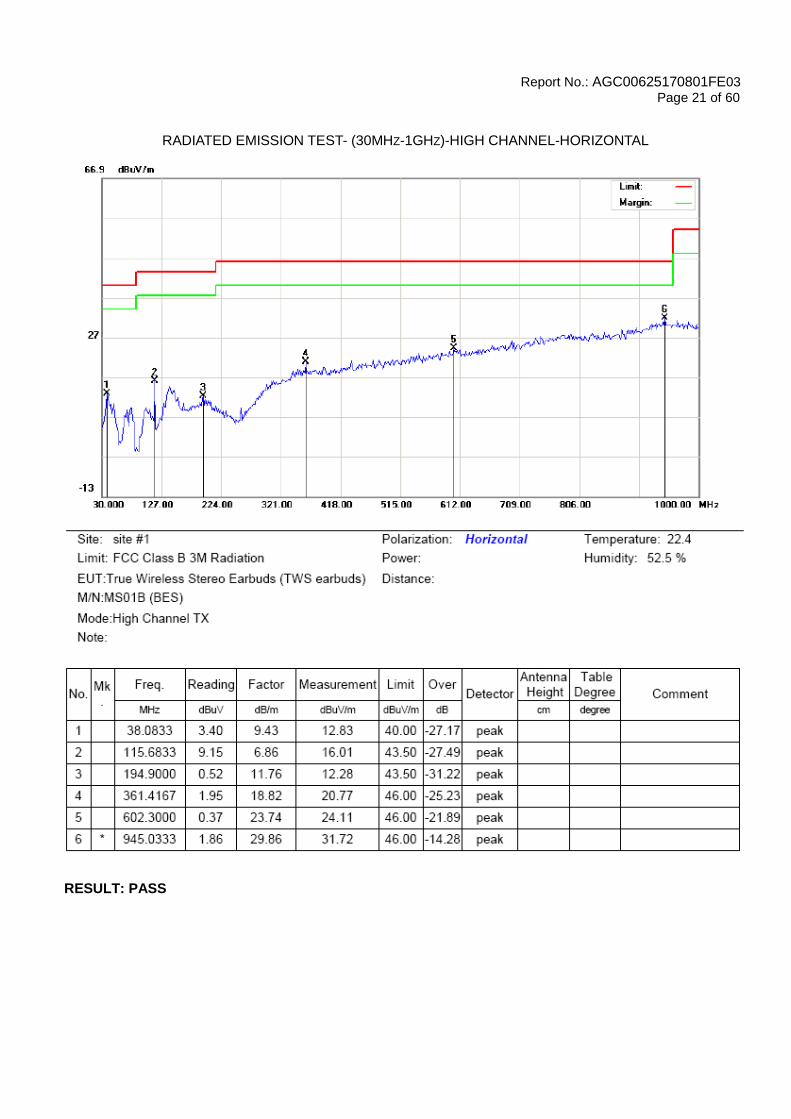
RADIATED EMISSION TEST- (30MHZ-1GHZ)-HIGH CHANNEL-HORIZONTAL
RESULT: PASS
Report No.: AGC00625170801FE03
Page 22 of 60
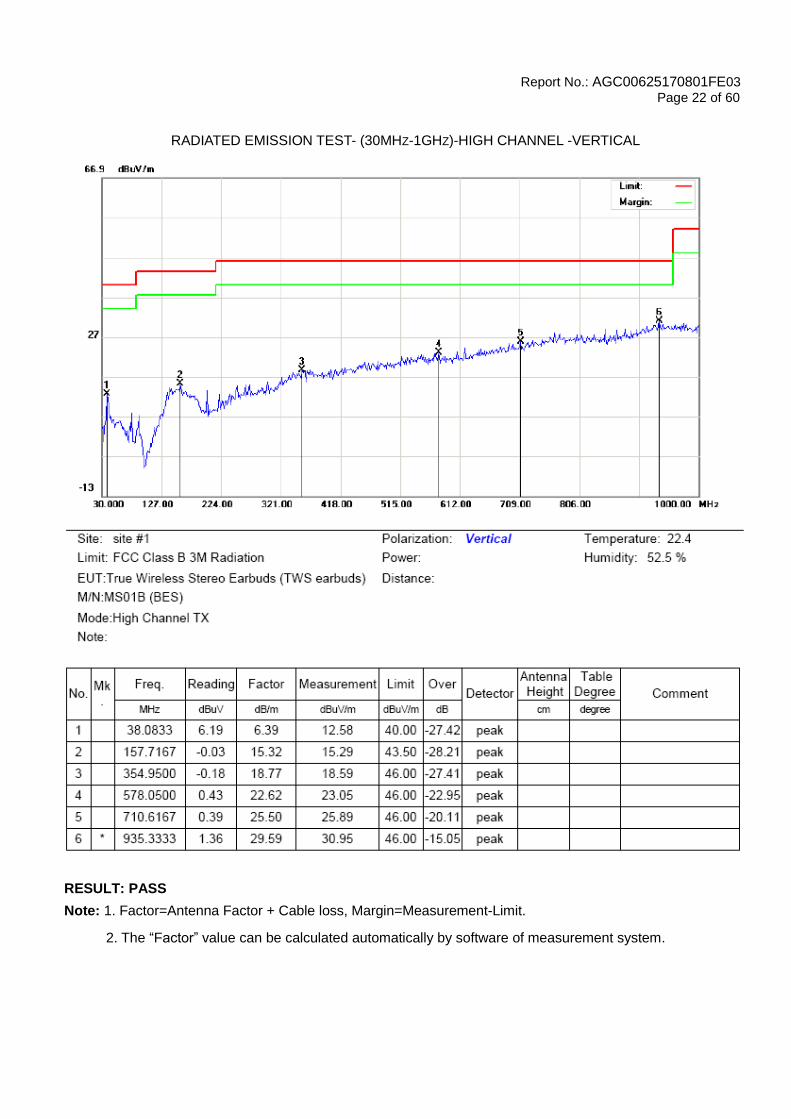
RADIATED EMISSION TEST- (30MHZ-1GHZ)-HIGH CHANNEL -VERTICAL
RESULT: PASS
Note: 1. Factor=Antenna Factor + Cable loss, Margin=Measurement-Limit.
2. The “Factor” value can be calculated automatically by software of measurement system.

Report No.: AGC00625170801FE03
Page 23 of 60
RADIATED EMISSION ABOVE 1GHz
(Worst modulation: GFSK)
FOR BR/EDR
RADIATED EMISSION TEST- (ABOVE 1GHZ)-LOW CHANNEL-HORIZONTAL
RESULT: PASS
Report No.: AGC00625170801FE03
Page 24 of 60
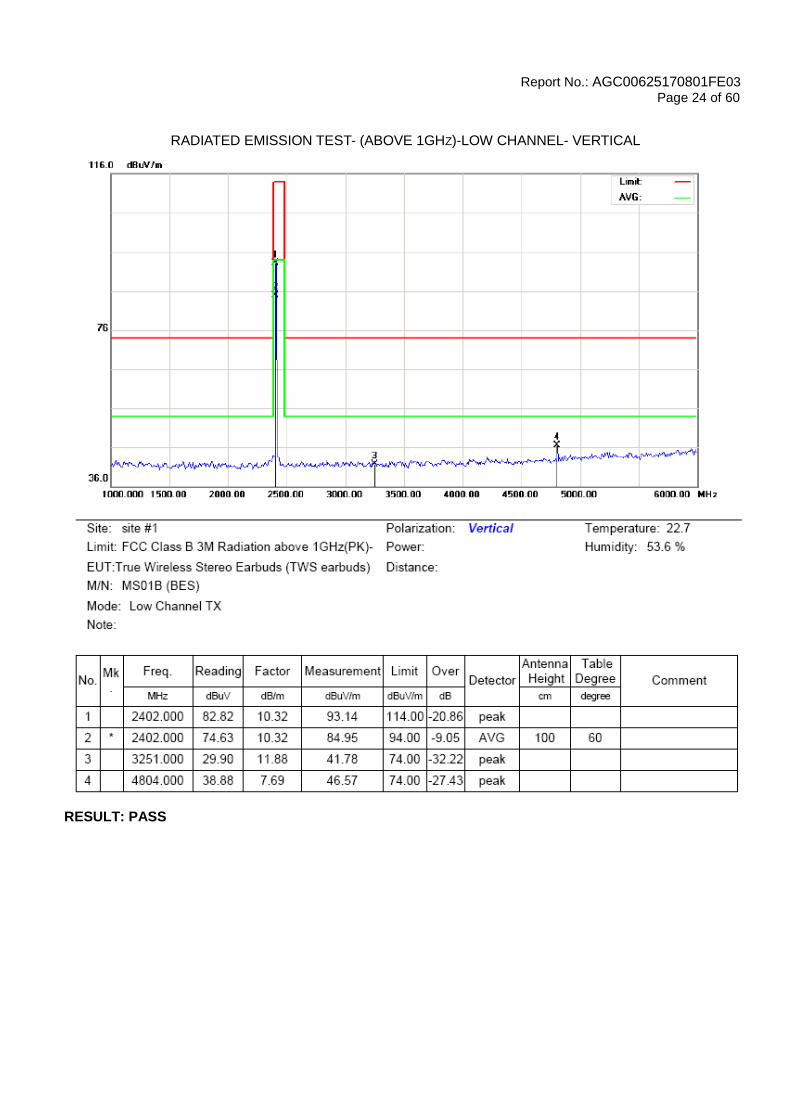
RADIATED EMISSION TEST- (ABOVE 1GHZ)-LOW CHANNEL- VERTICAL
RESULT: PASS
Report No.: AGC00625170801FE03
Page 25 of 60
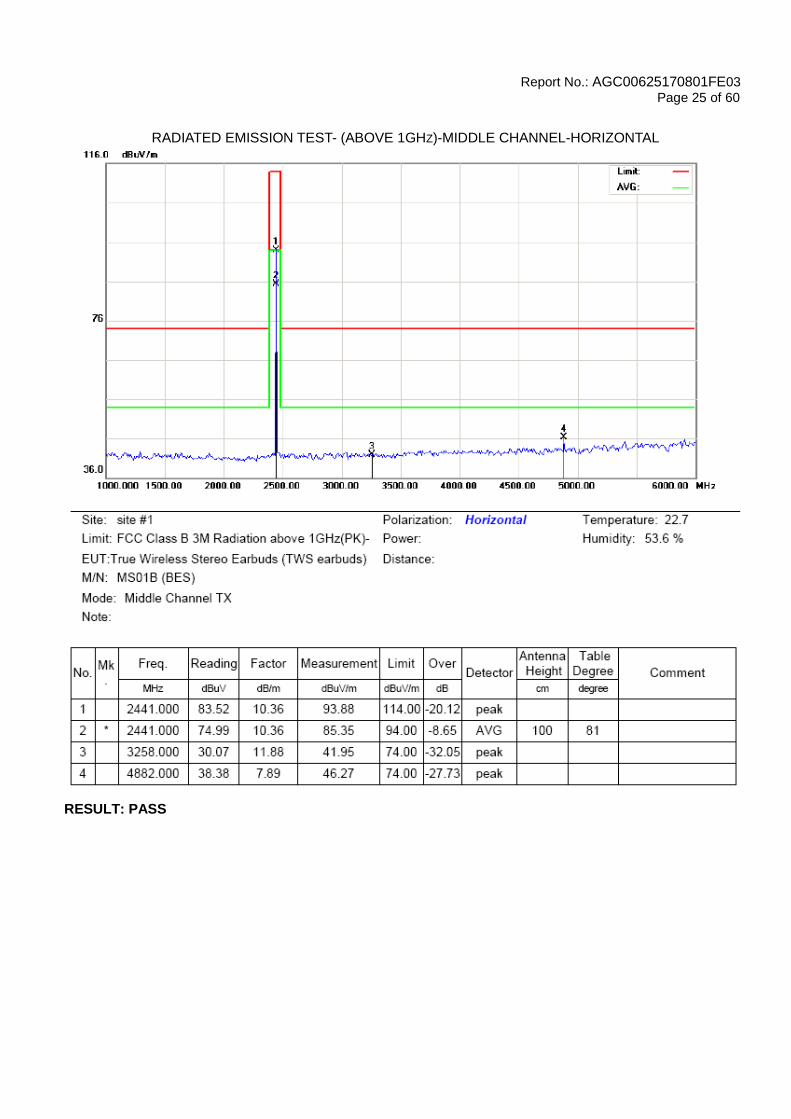
RADIATED EMISSION TEST- (ABOVE 1GHZ)-MIDDLE CHANNEL-HORIZONTAL
RESULT: PASS
Report No.: AGC00625170801FE03
Page 26 of 60
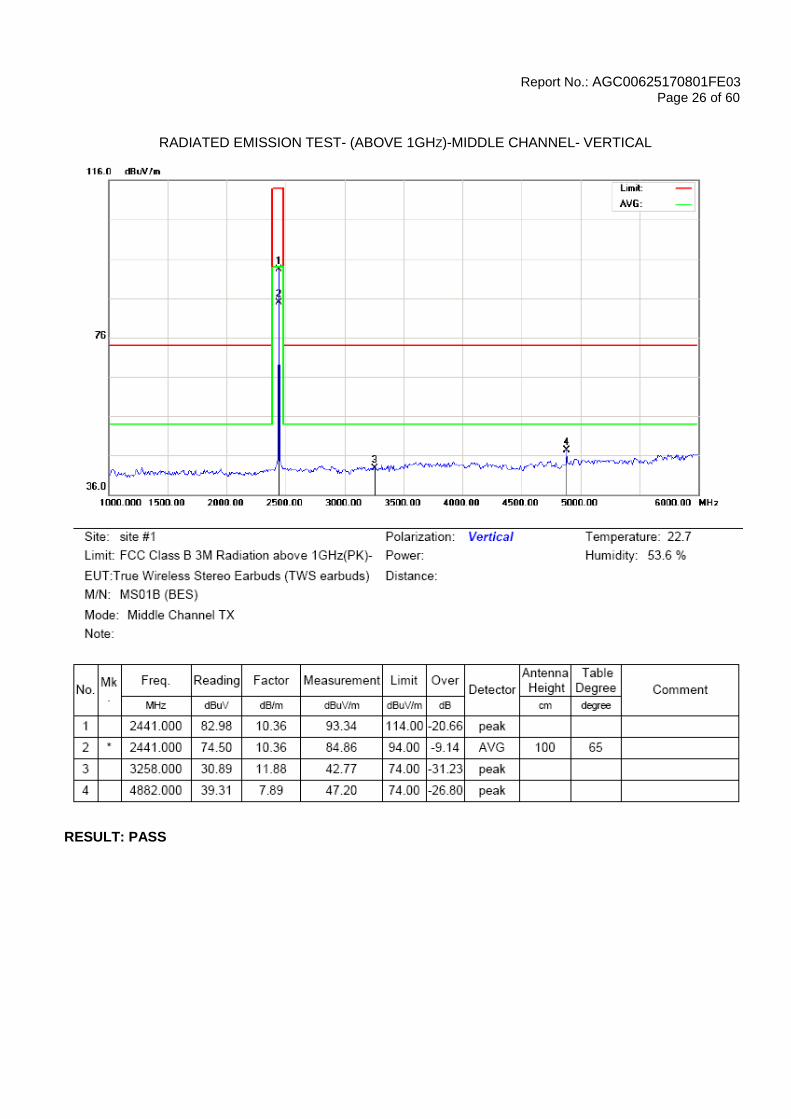
RADIATED EMISSION TEST- (ABOVE 1GHZ)-MIDDLE CHANNEL- VERTICAL
RESULT: PASS
Report No.: AGC00625170801FE03
Page 27 of 60
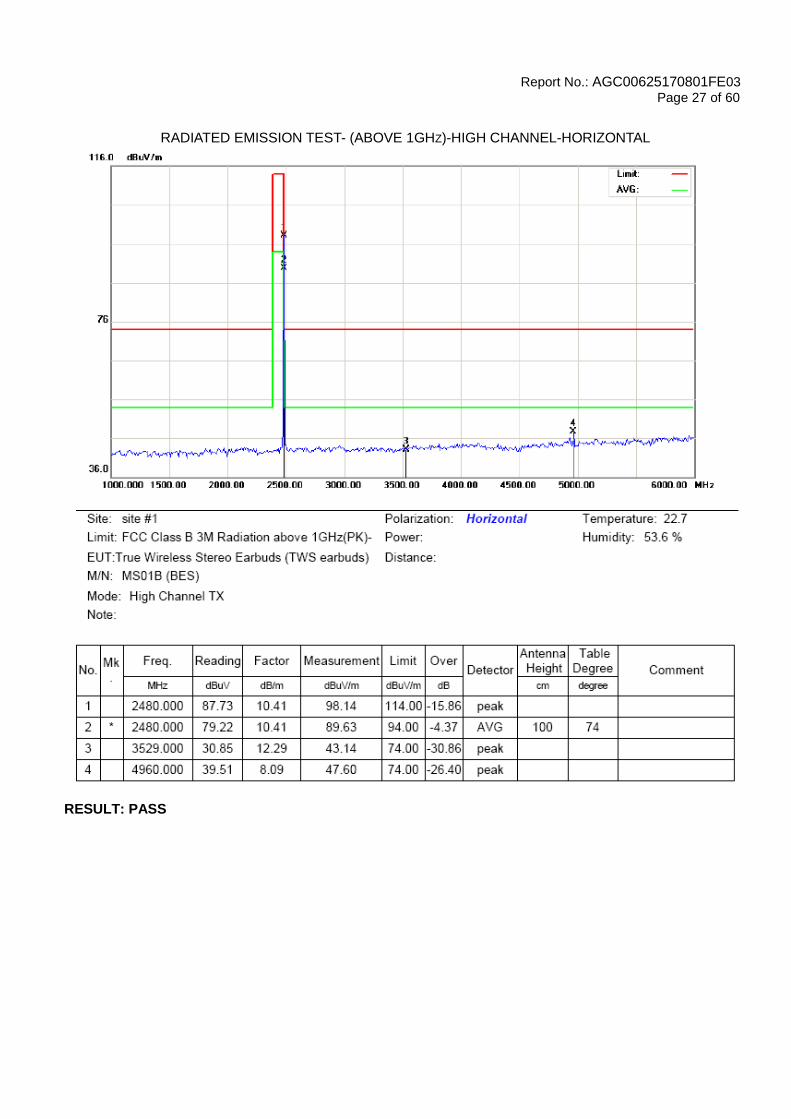
RADIATED EMISSION TEST- (ABOVE 1GHZ)-HIGH CHANNEL-HORIZONTAL
RESULT: PASS
Report No.: AGC00625170801FE03
Page 28 of 60
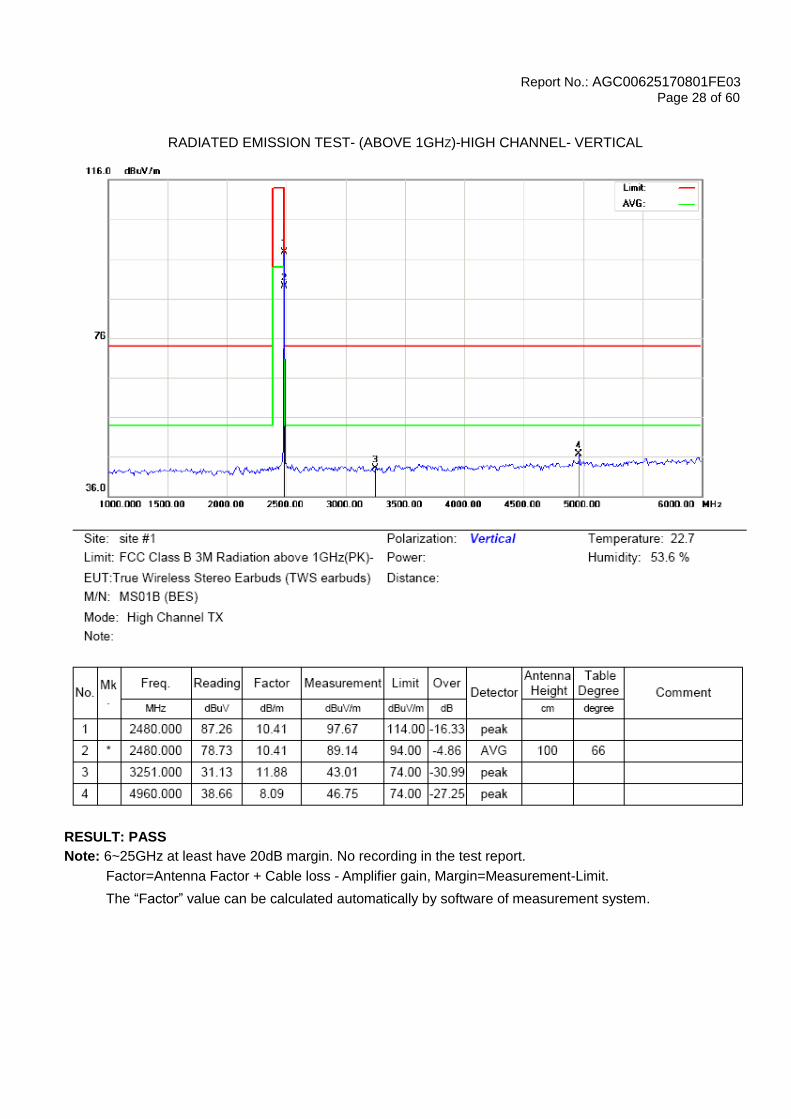
RADIATED EMISSION TEST- (ABOVE 1GHZ)-HIGH CHANNEL- VERTICAL
RESULT: PASS
Note: 6~25GHz at least have 20dB margin. No recording in the test report.
Factor=Antenna Factor + Cable loss - Amplifier gain, Margin=Measurement-Limit.
The “Factor” value can be calculated automatically by software of measurement system.
Report No.: AGC00625170801FE03
Page 29 of 60
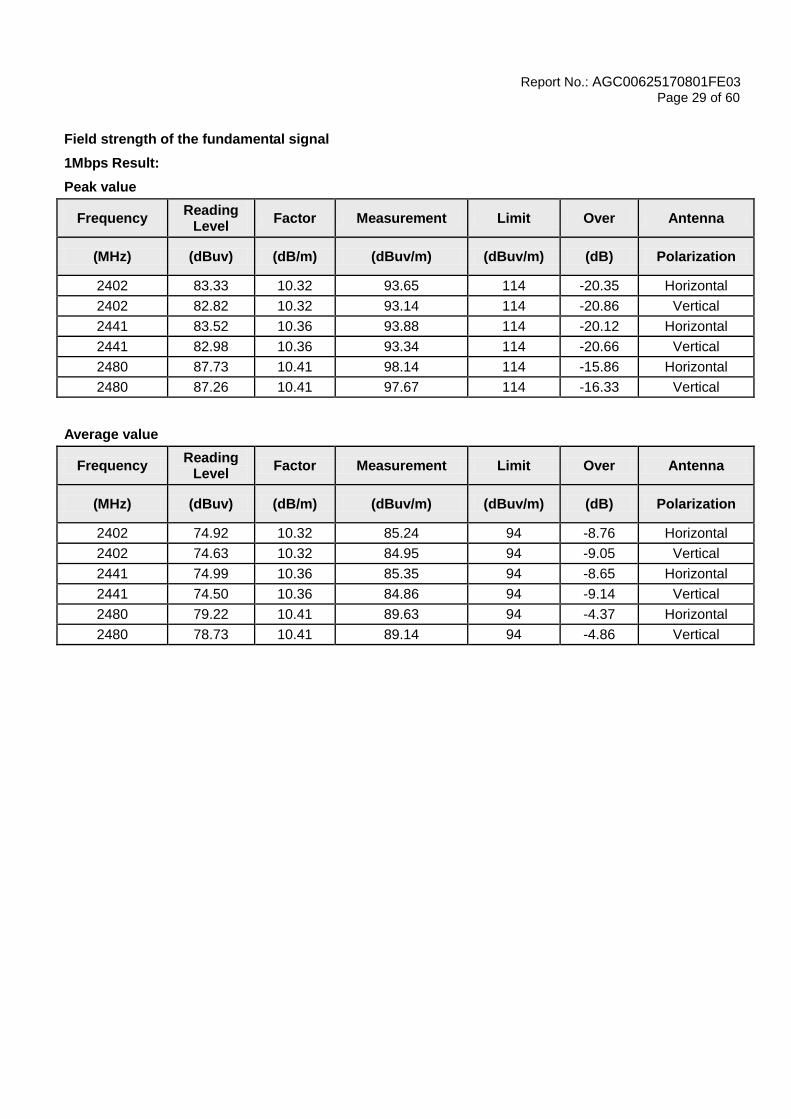
Field strength of the fundamental signal
1Mbps Result:
Peak value
Frequency Reading
Level Factor Measurement Limit Over Antenna
(MHz) (dBuv) (dB/m) (dBuv/m) (dBuv/m) (dB) Polarization
2402 83.33 10.32 93.65 114 -20.35 Horizontal
2402 82.82 10.32 93.14 114 -20.86 Vertical
2441 83.52 10.36 93.88 114 -20.12 Horizontal
2441 82.98 10.36 93.34 114 -20.66 Vertical
2480 87.73 10.41 98.14 114 -15.86 Horizontal
2480 87.26 10.41 97.67 114 -16.33 Vertical
Average value
Frequency Reading
Level Factor Measurement Limit Over Antenna
(MHz) (dBuv) (dB/m) (dBuv/m) (dBuv/m) (dB) Polarization
2402 74.92 10.32 85.24 94 -8.76 Horizontal
2402 74.63 10.32 84.95 94 -9.05 Vertical
2441 74.99 10.36 85.35 94 -8.65 Horizontal
2441 74.50 10.36 84.86 94 -9.14 Vertical
2480 79.22 10.41 89.63 94 -4.37 Horizontal
2480 78.73 10.41 89.14 94 -4.86 Vertical

Report No.: AGC00625170801FE03
Page 30 of 60
2Mbps Result:
Peak value
Frequency Reading
Level Factor Measurement Limit Over Antenna
(MHz) (dBuv) (dB/m) (dBuv/m) (dBuv/m) (dB) Polarization
2402 83.26 10.32 93.58 114 -20.42 Horizontal
2402 82.73 10.32 93.05 114 -20.95 Vertical
2441 83.45 10.36 93.81 114 -20.19 Horizontal
2441 82.91 10.36 93.27 114 -20.73 Vertical
2480 87.63 10.41 98.04 114 -15.96 Horizontal
2480 87.21 10.41 97.62 114 -16.38 Vertical
Average value
Frequency Reading
Level Factor Measurement Limit Over Antenna
(MHz) (dBuv) (dB/m) (dBuv/m) (dBuv/m) (dB) Polarization
2402 74.85 10.32 85.17 94 -8.83 Horizontal
2402 74.54 10.32 84.86 94 -9.14 Vertical
2441 74.93 10.36 85.29 94 -8.71 Horizontal
2441 74.42 10.36 84.78 94 -9.22 Vertical
2480 79.15 10.41 89.56 94 -4.44 Horizontal
2480 78.66 10.41 89.07 94 -4.93 Vertical
Report No.: AGC00625170801FE03
Page 31 of 60
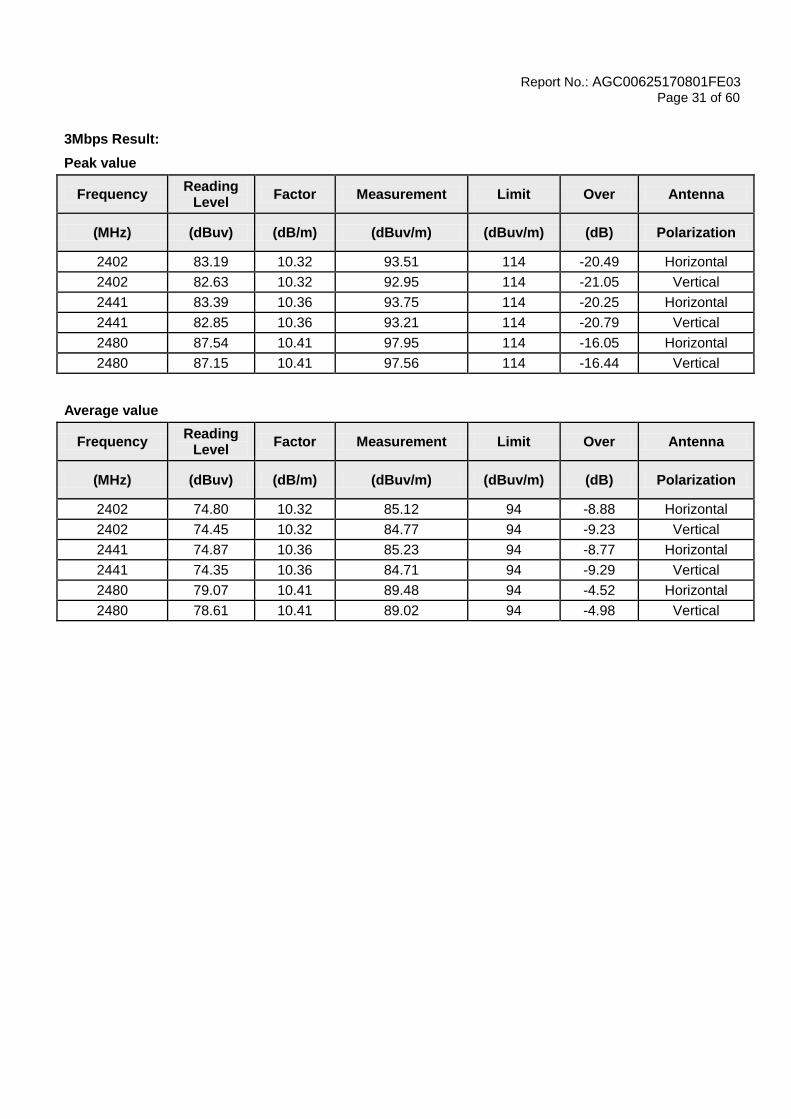
3Mbps Result:
Peak value
Frequency Reading
Level Factor Measurement Limit Over Antenna
(MHz) (dBuv) (dB/m) (dBuv/m) (dBuv/m) (dB) Polarization
2402 83.19 10.32 93.51 114 -20.49 Horizontal
2402 82.63 10.32 92.95 114 -21.05 Vertical
2441 83.39 10.36 93.75 114 -20.25 Horizontal
2441 82.85 10.36 93.21 114 -20.79 Vertical
2480 87.54 10.41 97.95 114 -16.05 Horizontal
2480 87.15 10.41 97.56 114 -16.44 Vertical
Average value
Frequency Reading
Level Factor Measurement Limit Over Antenna
(MHz) (dBuv) (dB/m) (dBuv/m) (dBuv/m) (dB) Polarization
2402 74.80 10.32 85.12 94 -8.88 Horizontal
2402 74.45 10.32 84.77 94 -9.23 Vertical
2441 74.87 10.36 85.23 94 -8.77 Horizontal
2441 74.35 10.36 84.71 94 -9.29 Vertical
2480 79.07 10.41 89.48 94 -4.52 Horizontal
2480 78.61 10.41 89.02 94 -4.98 Vertical
Report No.: AGC00625170801FE03
Page 32 of 60
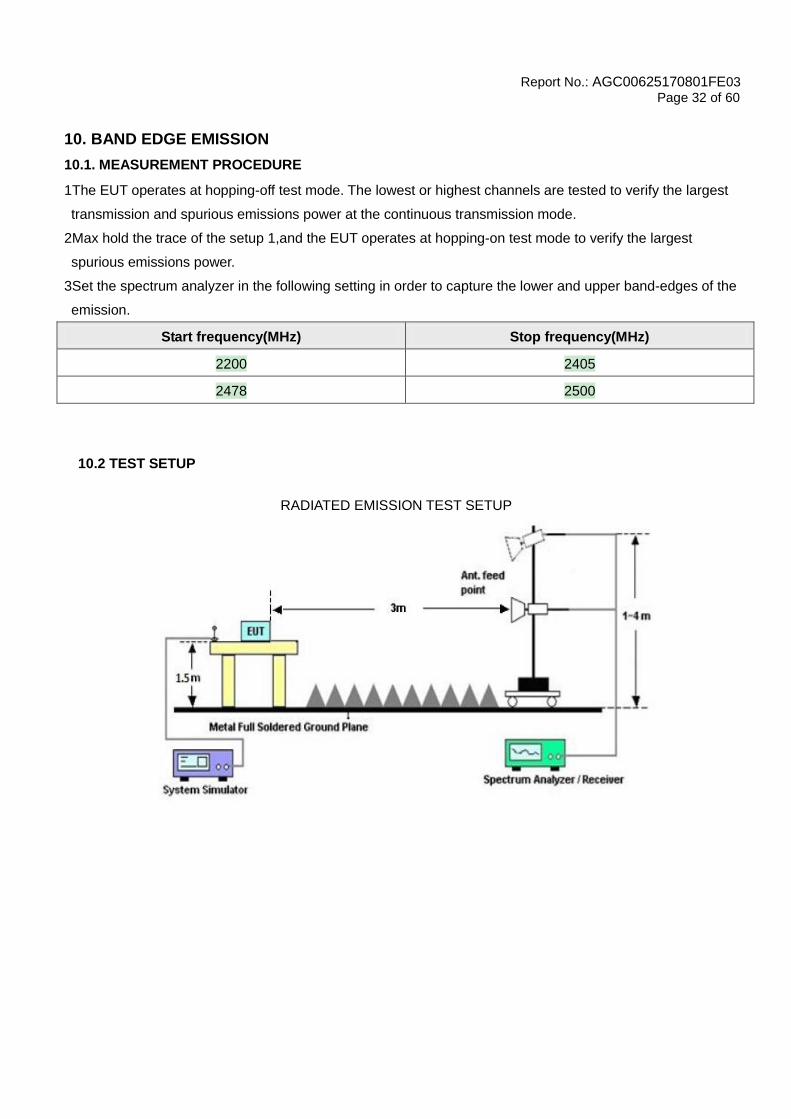
10. BAND EDGE EMISSION
10.1. MEASUREMENT PROCEDURE
1The EUT operates at hopping-off test mode. The lowest or highest channels are tested to verify the largest
transmission and spurious emissions power at the continuous transmission mode.
2Max hold the trace of the setup 1,and the EUT operates at hopping-on test mode to verify the largest
spurious emissions power.
3Set the spectrum analyzer in the following setting in order to capture the lower and upper band-edges of the
emission.
Start frequency(MHz) Stop frequency(MHz)
2200 2405
2478 2500
10.2 TEST SETUP
RADIATED EMISSION TEST SETUP
Report No.: AGC00625170801FE03
Page 33 of 60
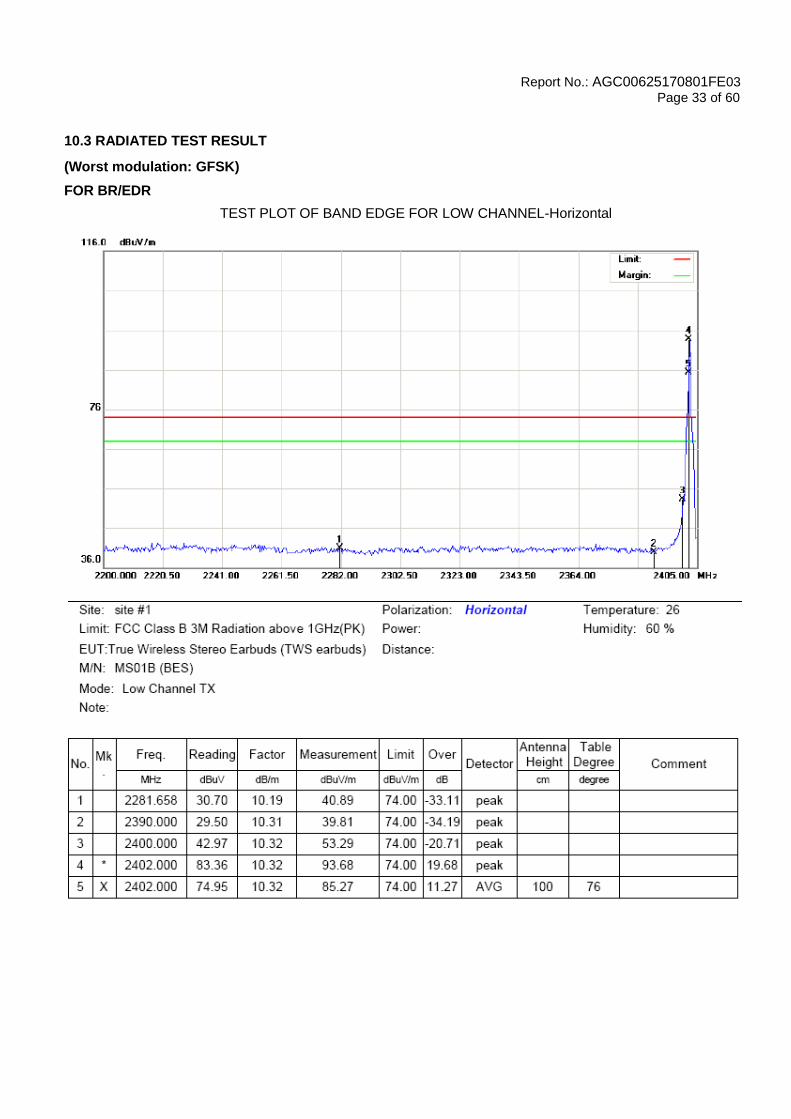
10.3 RADIATED TEST RESULT
(Worst modulation: GFSK)
FOR BR/EDR
TEST PLOT OF BAND EDGE FOR LOW CHANNEL-Horizontal
Report No.: AGC00625170801FE03
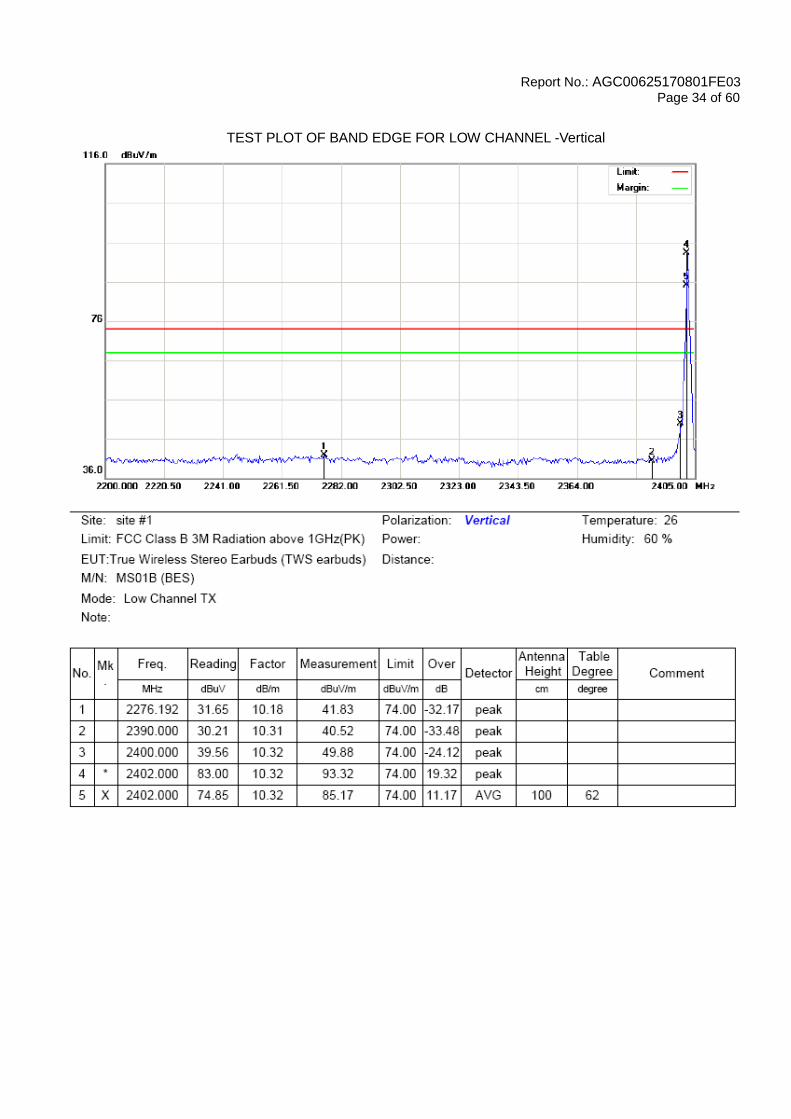
Page 34 of 60
TEST PLOT OF BAND EDGE FOR LOW CHANNEL -Vertical
Report No.: AGC00625170801FE03
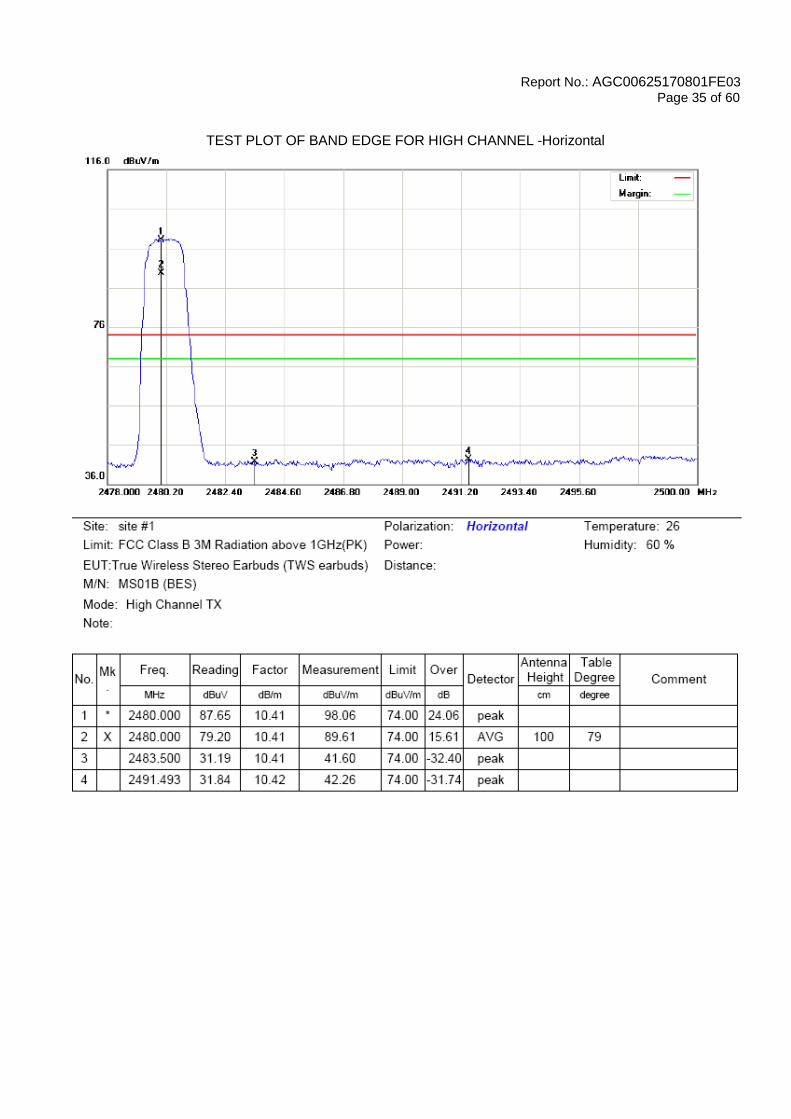
Page 35 of 60
TEST PLOT OF BAND EDGE FOR HIGH CHANNEL -Horizontal
Report No.: AGC00625170801FE03
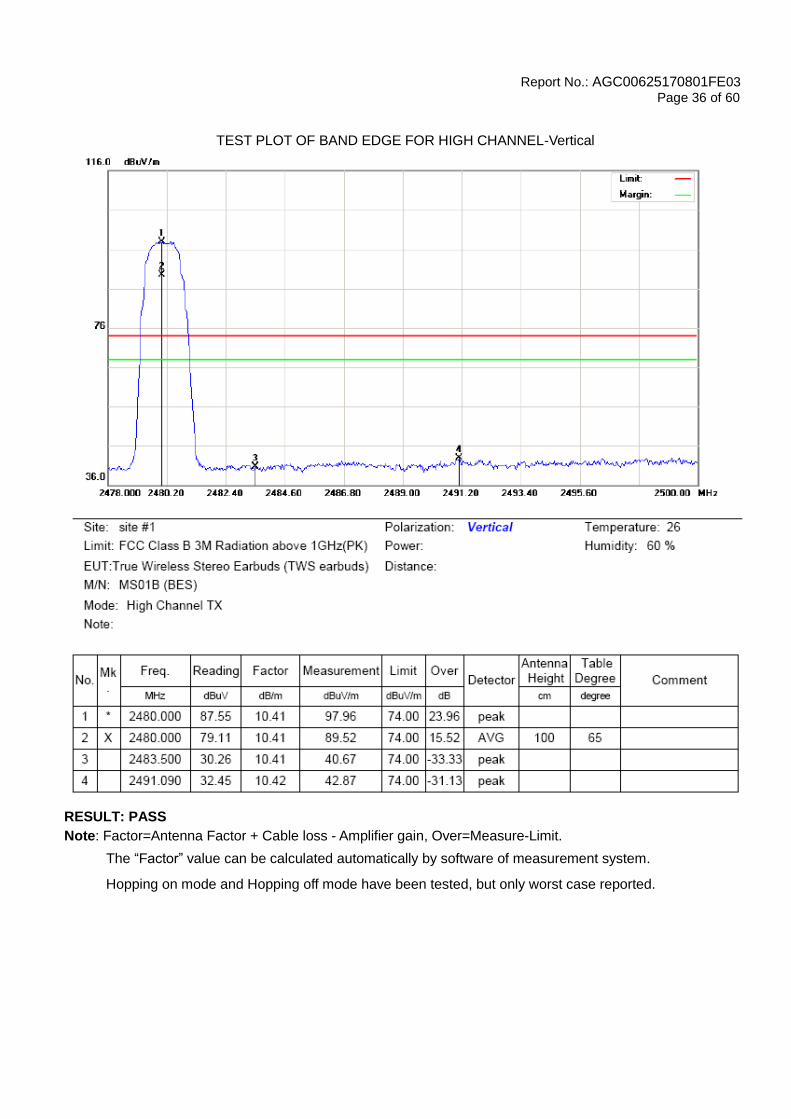
Page 36 of 60
TEST PLOT OF BAND EDGE FOR HIGH CHANNEL-Vertical
RESULT: PASS
Note: Factor=Antenna Factor + Cable loss - Amplifier gain, Over=Measure-Limit.
The “Factor” value can be calculated automatically by software of measurement system.
Hopping on mode and Hopping off mode have been tested, but only worst case reported.

Report No.: AGC00625170801FE03
Page 37 of 60
11. 20DB BANDWIDTH
11.1. MEASUREMENT PROCEDURE
1. Set the EUT Work on the top, the middle and the bottom operation frequency individually.
2. Set Span = approximately 2 to 3 times the 20 dB bandwidth, centered on a hoping channel
RBW 1% of the 20 dB bandwidth, VBW RBW; Sweep = auto; Detector function = peak
3. Set SPA Trace 1 Max hold, then View.
11.2. TEST SET-UP
11.3. LIMITS AND MEASUREMENT RESULTS
FOR BR/EDR
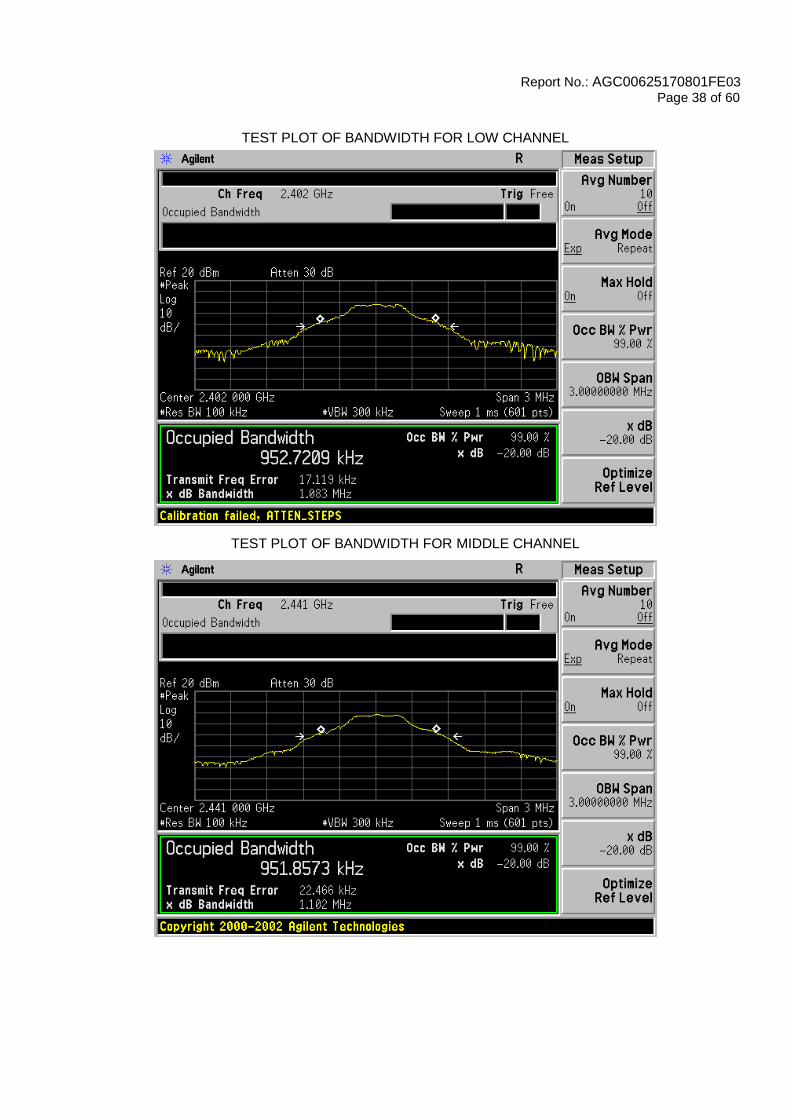
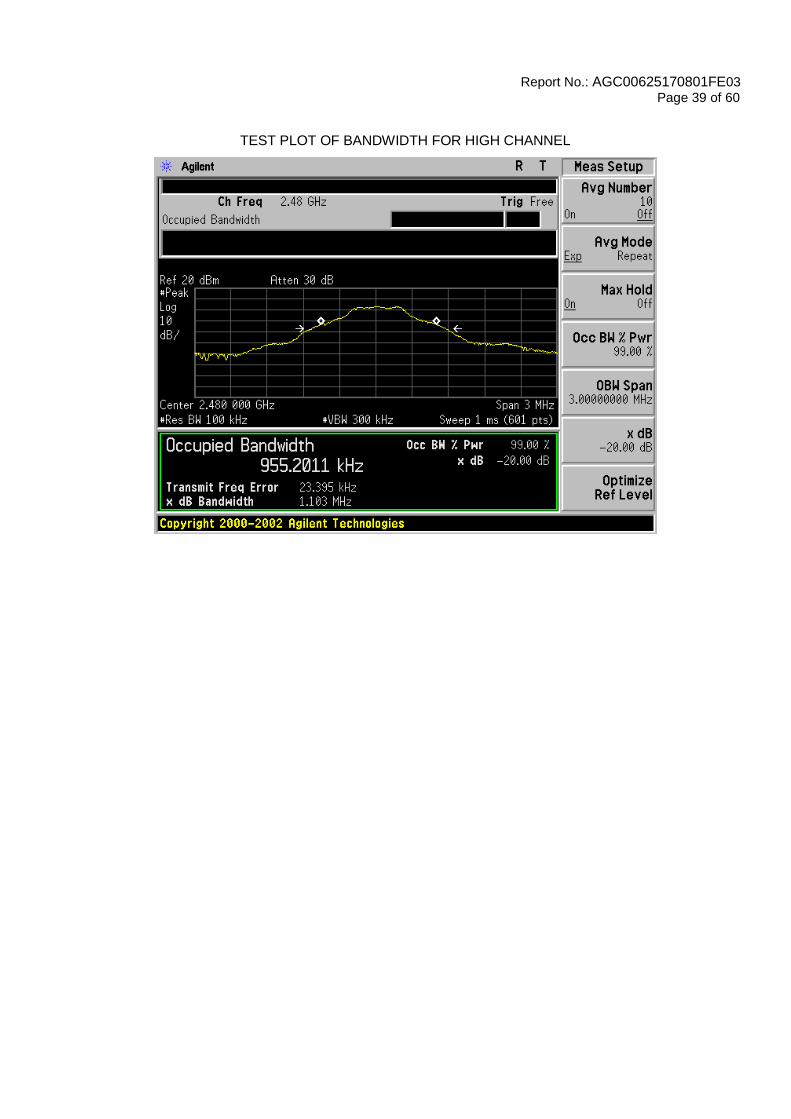
BLUETOOTH 1MBPS LIMITS AND MEASUREMENT RESULT
Applicable Limits
Measurement Result
Test Data (MHz) Result
99%OBW (MHz) -20dB BW(MHz)
N/A
Low Channel 0.953 1.083 PASS
Middle Channel 0.952 1.102 PASS
High Channel 0.955 1.103 PASS
Report No.: AGC00625170801FE03
Page 38 of 60
TEST PLOT OF BANDWIDTH FOR LOW CHANNEL
TEST PLOT OF BANDWIDTH FOR MIDDLE CHANNEL
Report No.: AGC00625170801FE03
Page 39 of 60
TEST PLOT OF BANDWIDTH FOR HIGH CHANNEL
Report No.: AGC00625170801FE03
Page 40 of 60
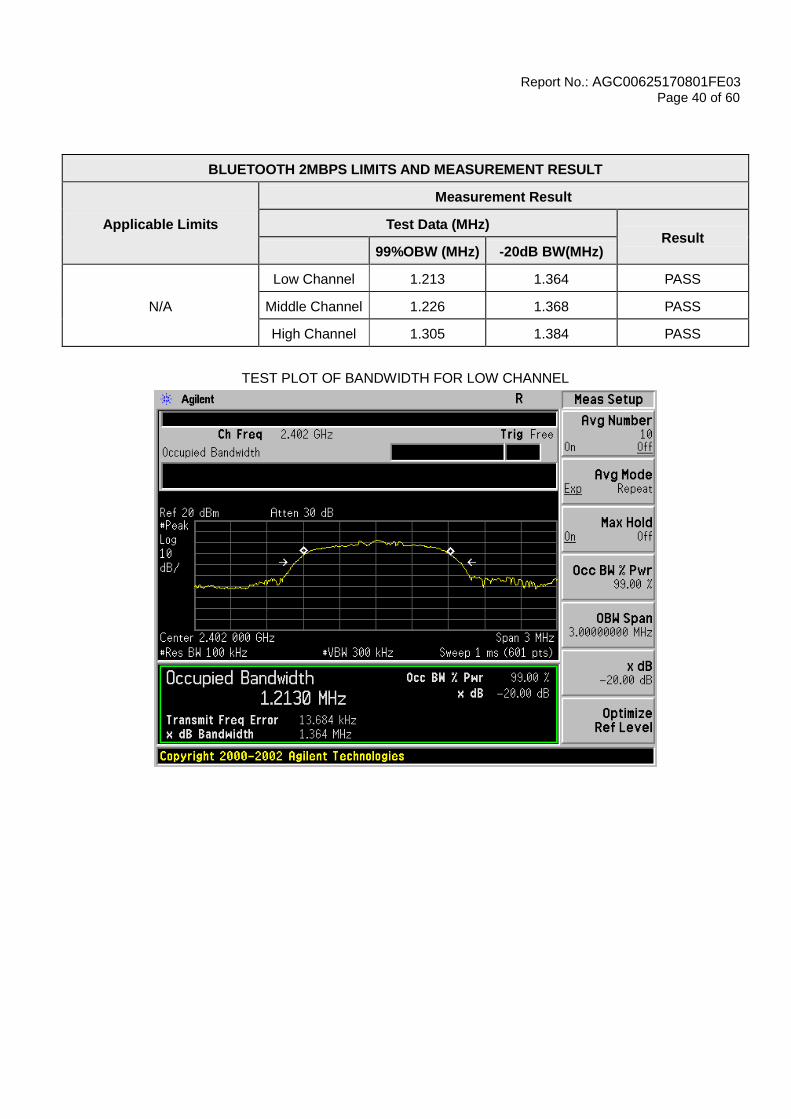
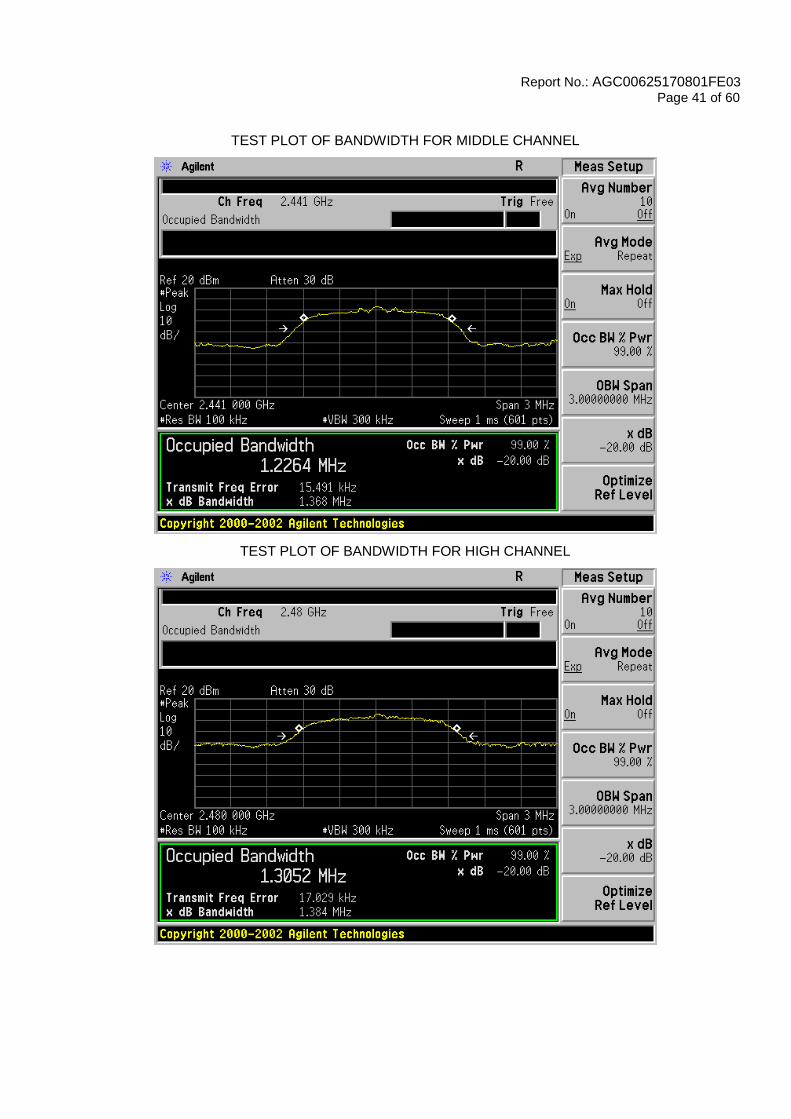
BLUETOOTH 2MBPS LIMITS AND MEASUREMENT RESULT
Applicable Limits
Measurement Result
Test Data (MHz) Result
99%OBW (MHz) -20dB BW(MHz)
N/A
Low Channel 1.213 1.364 PASS
Middle Channel 1.226 1.368 PASS
High Channel 1.305 1.384 PASS
TEST PLOT OF BANDWIDTH FOR LOW CHANNEL
Report No.: AGC00625170801FE03
Page 41 of 60
TEST PLOT OF BANDWIDTH FOR MIDDLE CHANNEL
TEST PLOT OF BANDWIDTH FOR HIGH CHANNEL

Report No.: AGC00625170801FE03
Page 42 of 60
BLUETOOTH 3MBPS LIMITS AND MEASUREMENT RESULT
Applicable Limits
Measurement Result
Test Data (MHz) Result
99%OBW (MHz) -20dB BW(MHz)
N/A
Low Channel 1.207 1.350 PASS
Middle Channel 1.237 1.349 PASS
High Channel 1.272 1.395 PASS
TEST PLOT OF BANDWIDTH FOR LOW CHANNEL

Report No.: AGC00625170801FE03
Page 43 of 60
TEST PLOT OF BANDWIDTH FOR MIDDLE CHANNEL
TEST PLOT OF BANDWIDTH FOR HIGH CHANNEL
Report No.: AGC00625170801FE03
Page 44 of 60
12. FCC LINE CONDUCTED EMISSION TEST
12.1. LIMITS OF LINE CONDUCTED EMISSION TEST
Frequency Maximum RF Line Voltage
Q.P.( dBuV) Average( dBuV)
150kHz~500kHz 66-56 56-46
500kHz~5MHz 56 46
5MHz~30MHz 60 50
Note:
1. The lower limit shall apply at the transition frequency.
2. The limit decreases linearly with the logarithm of the frequency in the range 0.15 MHz to 0.50 MHz.
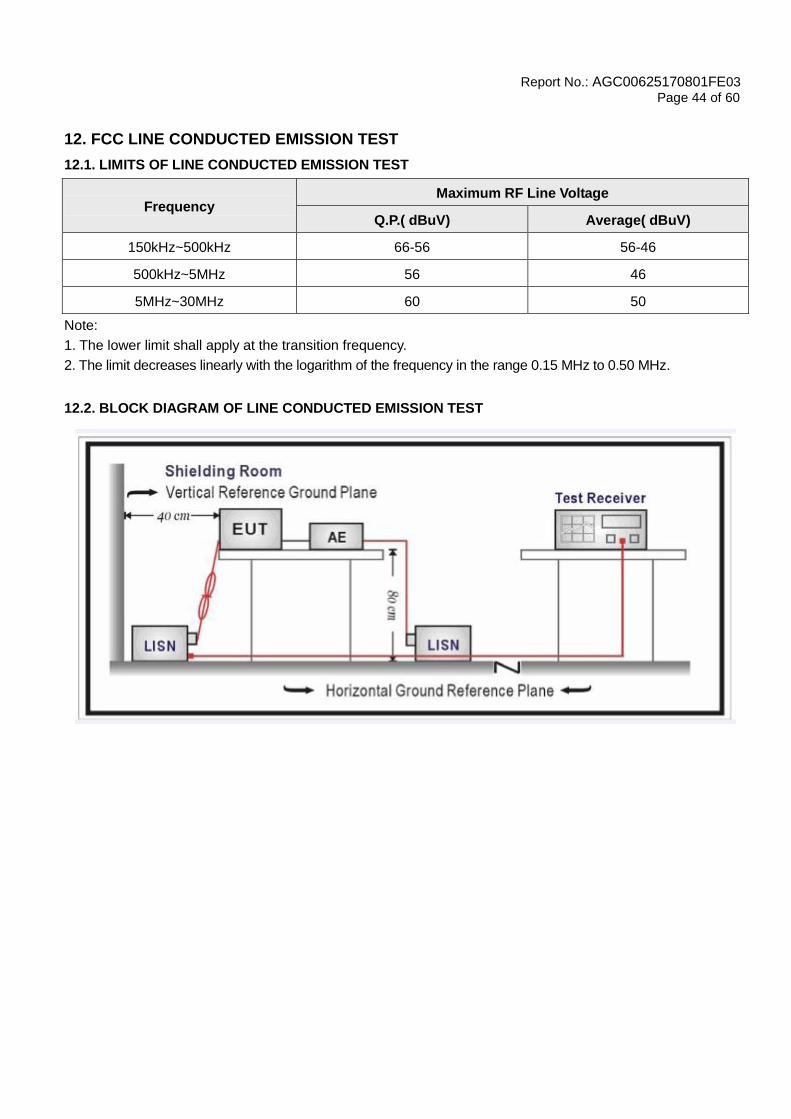
12.2. BLOCK DIAGRAM OF LINE CONDUCTED EMISSION TEST
Report No.: AGC00625170801FE03
Page 45 of 60
12.3. PRELIMINARY PROCEDURE OF LINE CONDUCTED EMISSION TEST
1. The equipment was set up as per the test configuration to simulate typical actual usage per the user’s
manual. When the EUT is a tabletop system, a wooden table with a height of 0.8 meters is used and is
placed on the ground plane as per ANSI C63.10 (see Test Facility for the dimensions of the ground plane
used). When the EUT is a floor-standing equipment, it is placed on the ground plane which has a 3-12
mm non-conductive covering to insulate the EUT from the ground plane.
2. Support equipment, if needed, was placed as per ANSI C63.10.
3. All I/O cables were positioned to simulate typical actual usage as per ANSI C63.10.
4. All support equipments received AC120V/60Hz power from a LISN, if any.
5. The EUT received DC charging voltage by adapter or PC which received 120V/60Hzpower by a LISN.
6. The test program was started. Emissions were measured on each current carrying line of the EUT using a
spectrum Analyzer / Receiver connected to the LISN powering the EUT. The LISN has two monitoring
points: Line 1 (Hot Side) and Line 2 (Neutral Side). Two scans were taken: one with Line 1 connected to
Analyzer / Receiver and Line 2 connected to a 50 ohm load; the second scan had Line 1 connected to a
50 ohm load and Line 2 connected to the Analyzer / Receiver.
7. Analyzer / Receiver scanned from 150 kHz to 30MHz for emissions in each of the test modes.
8. During the above scans, the emissions were maximized by cable manipulation.
9. The test mode(s) were scanned during the preliminary test.
Then, the EUT configuration and cable configuration of the above highest emission level were recorded for
reference of final testing.
12.4. FINAL PROCEDURE OF LINE CONDUCTED EMISSION TEST
1. EUT and support equipment was set up on the test bench as per step 2 of the preliminary test.
2. A scan was taken on both power lines, Line 1 and Line 2, recording at least the six highest emissions.
Emission frequency and amplitude were recorded into a computer in which correction factors were used
to calculate the emission level and compare reading to the applicable limit. If EUT emission level was
less –2dB to the A.V. limit in Peak mode, then the emission signal was re-checked using Q.P and Average
detector.
3. The test data of the worst case condition(s) was reported on the Summary Data page.
12.5. TEST RESULT OF LINE CONDUCTED EMISSION TEST
N/A
Note: The BT function of EUT didn’t work when charging.
Report No.: AGC00625170801FE03
Page 46 of 60
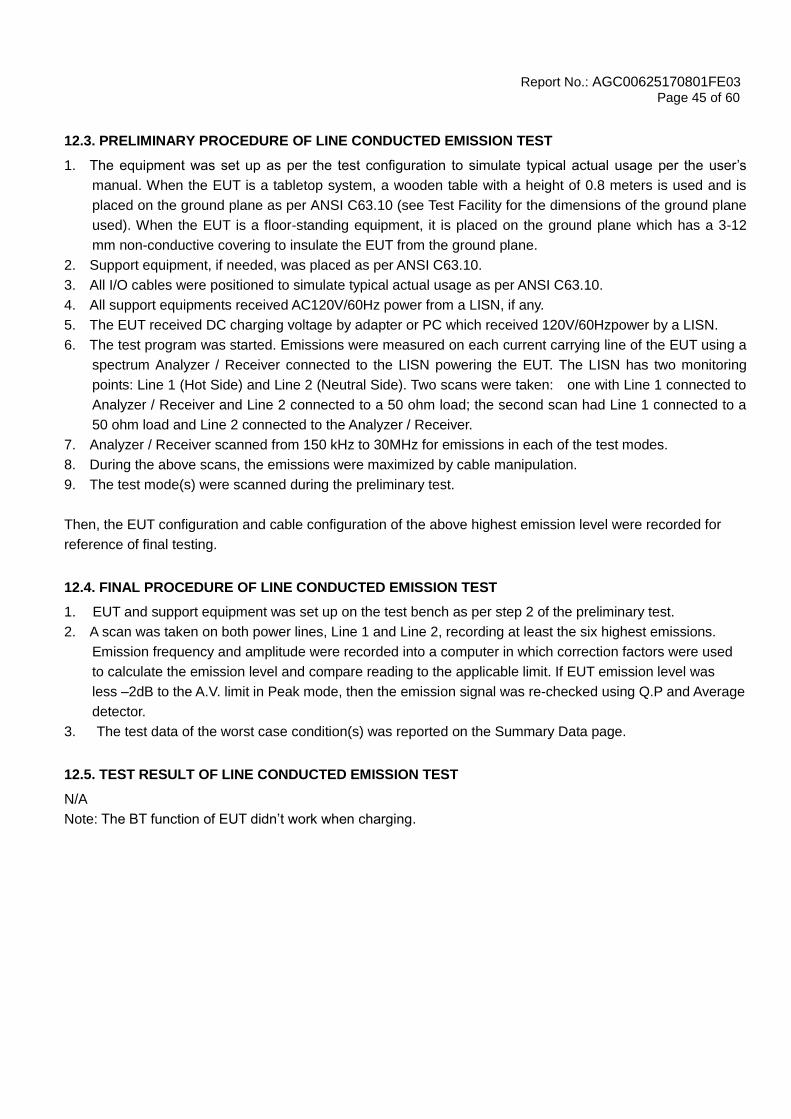
APPENDIX A: PHOTOGRAPHS OF TEST SETUP
FCC RADIATED EMISSION TEST SETUP

Report No.: AGC00625170801FE03
Page 47 of 60

Report No.: AGC00625170801FE03
Page 48 of 60
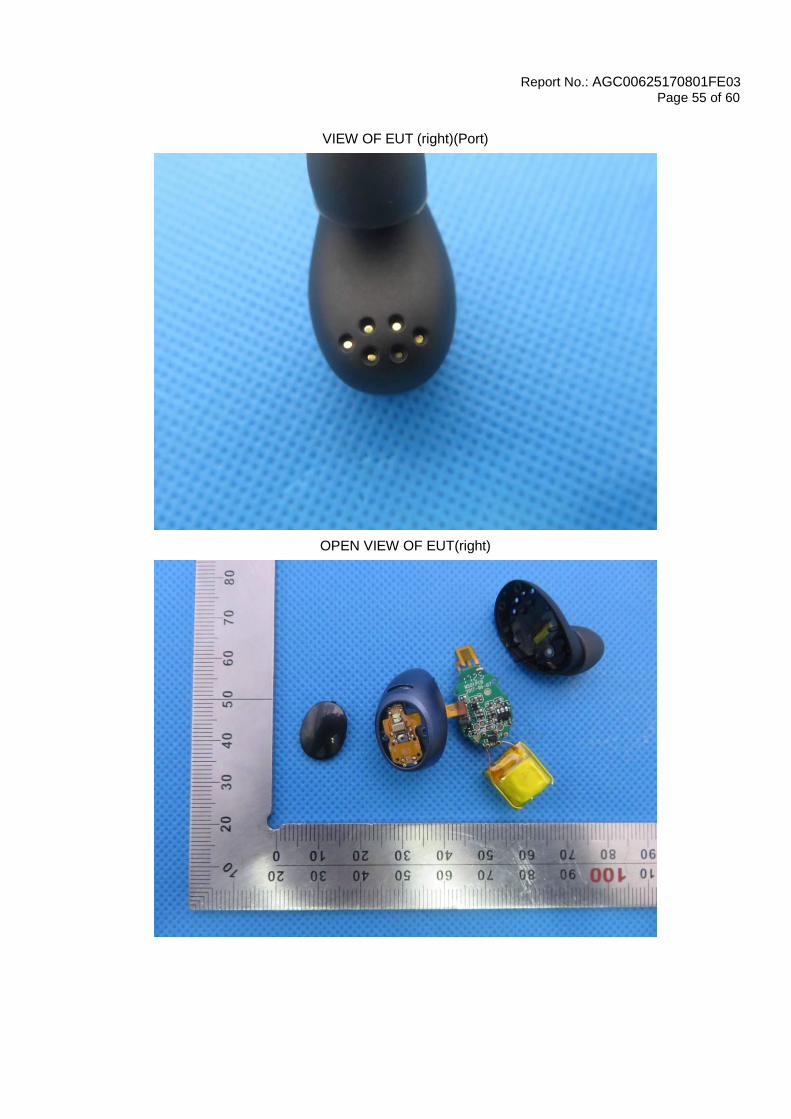
APPENDIX B: PHOTOGRAPHS OF EUT
ALL VIEW OF EUT
TOP VIEW OF EUT
Report No.: AGC00625170801FE03
Page 49 of 60
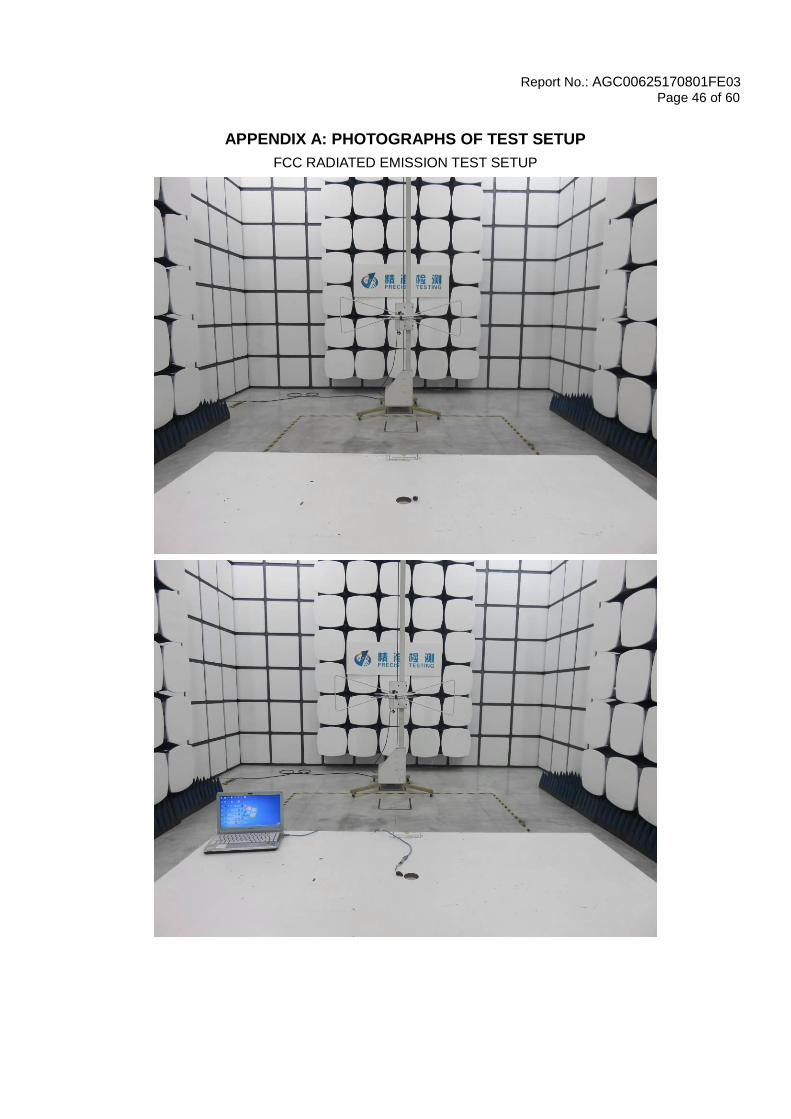
BOTTOM VIEW OF EUT
FRONT VIEW OF EUT
Report No.: AGC00625170801FE03
Page 50 of 60
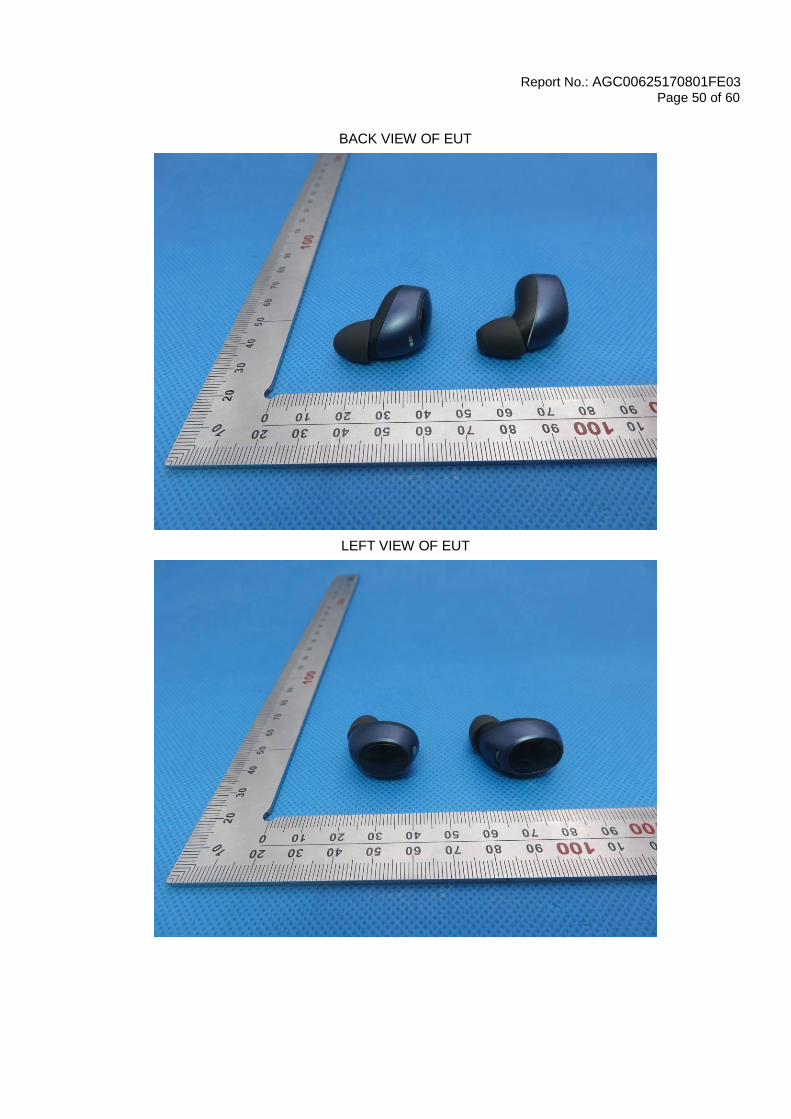
BACK VIEW OF EUT
LEFT VIEW OF EUT

Report No.: AGC00625170801FE03
Page 51 of 60
RIGHT VIEW OF EUT
VIEW OF EUT (left)(Port)
Report No.: AGC00625170801FE03
Page 52 of 60
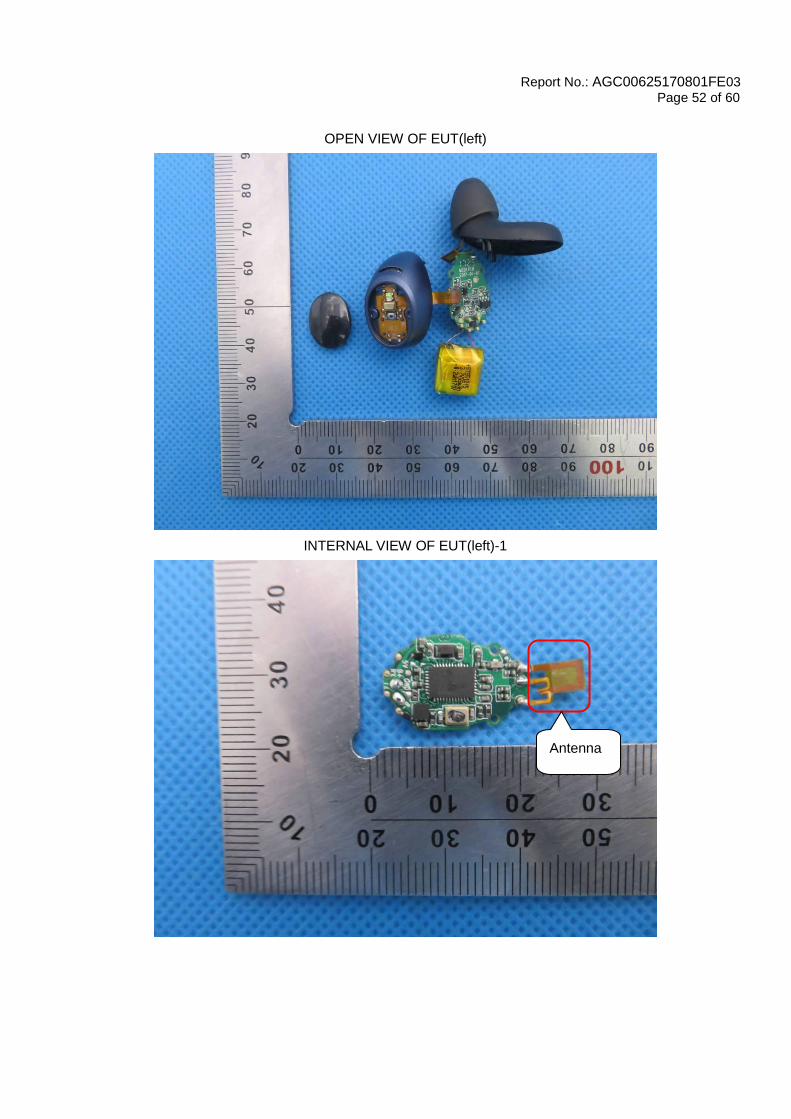
OPEN VIEW OF EUT(left)
INTERNAL VIEW OF EUT(left)-1
Antenna
Report No.: AGC00625170801FE03
Page 53 of 60
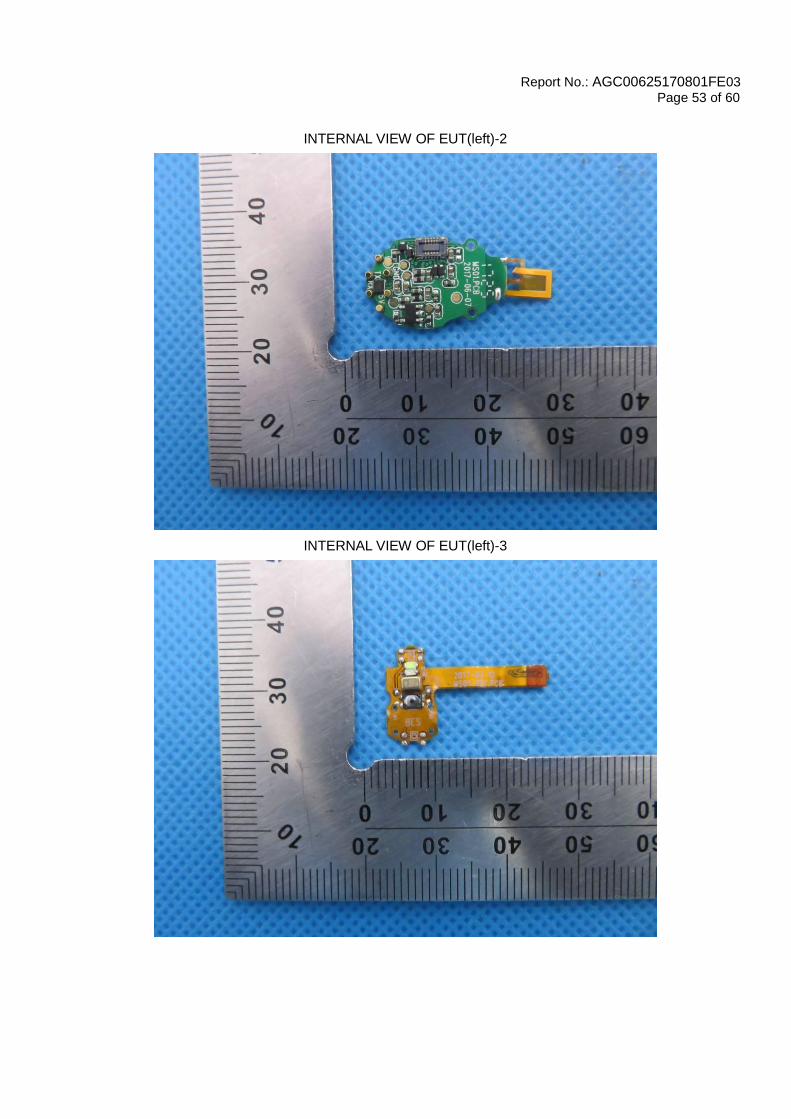
INTERNAL VIEW OF EUT(left)-2
INTERNAL VIEW OF EUT(left)-3
Report No.: AGC00625170801FE03
Page 54 of 60
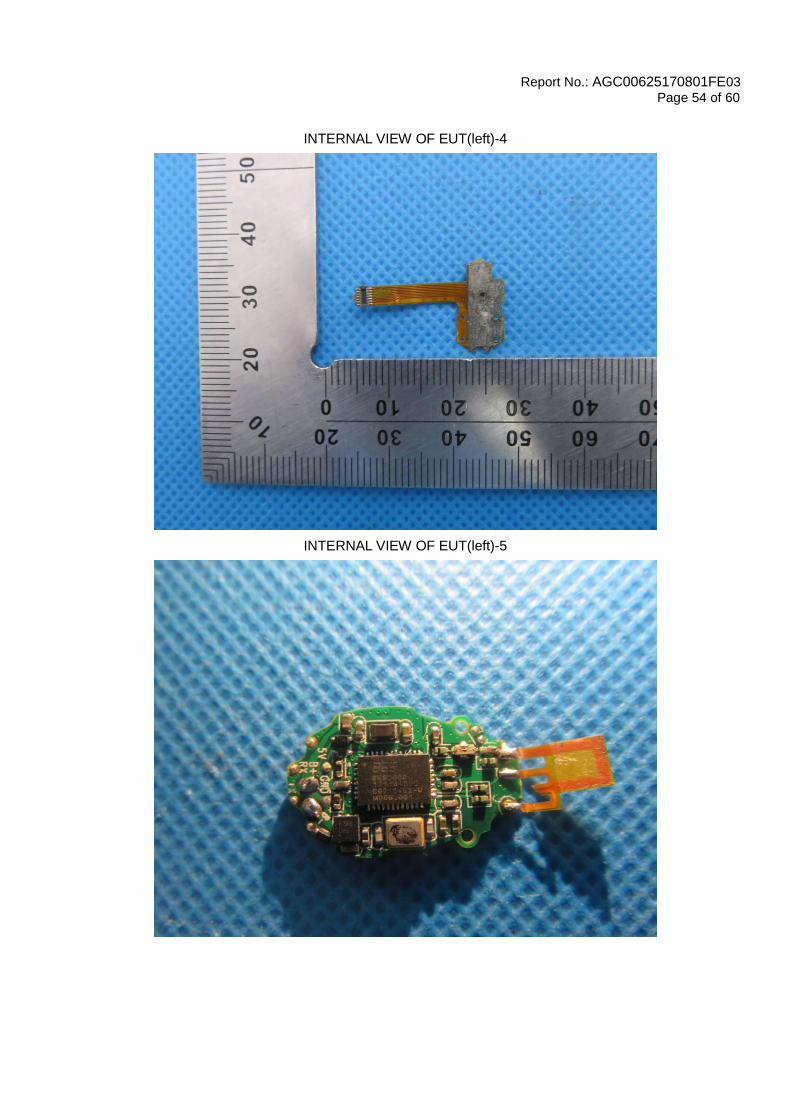
INTERNAL VIEW OF EUT(left)-4
INTERNAL VIEW OF EUT(left)-5
Report No.: AGC00625170801FE03
Page 55 of 60
VIEW OF EUT (right)(Port)
OPEN VIEW OF EUT(right)
Report No.: AGC00625170801FE03
Page 56 of 60
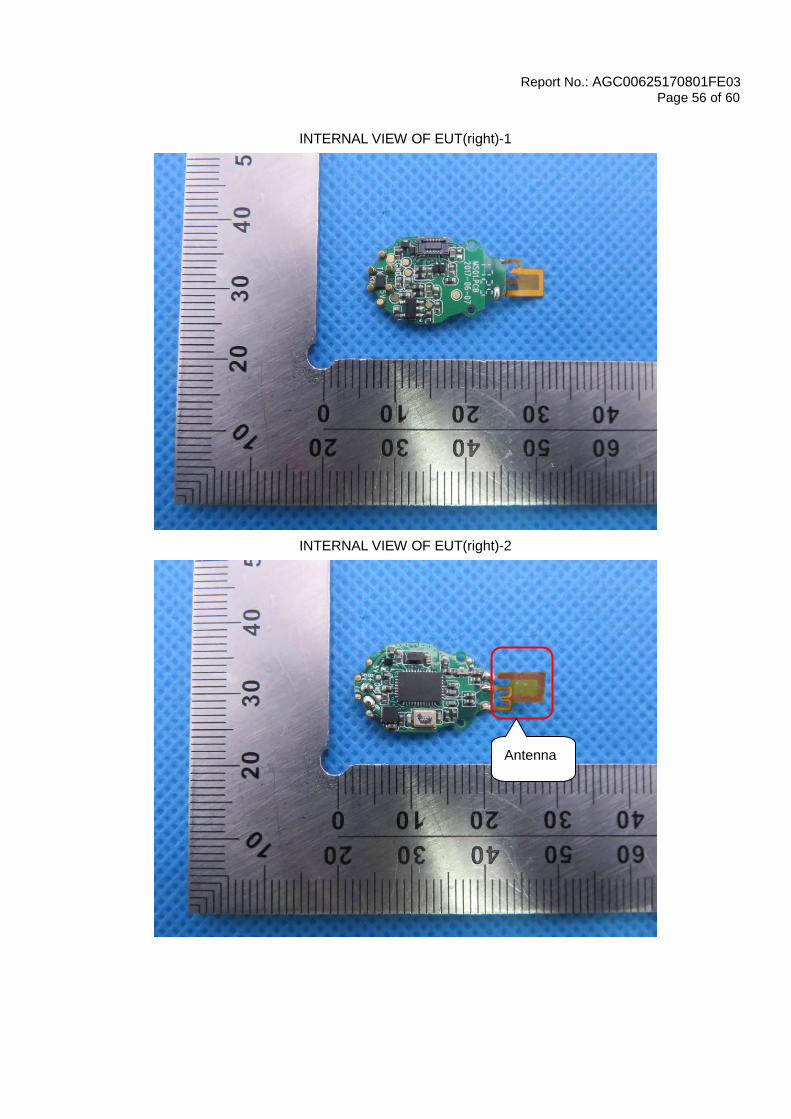
INTERNAL VIEW OF EUT(right)-1
INTERNAL VIEW OF EUT(right)-2
Antenna
Report No.: AGC00625170801FE03
Page 57 of 60
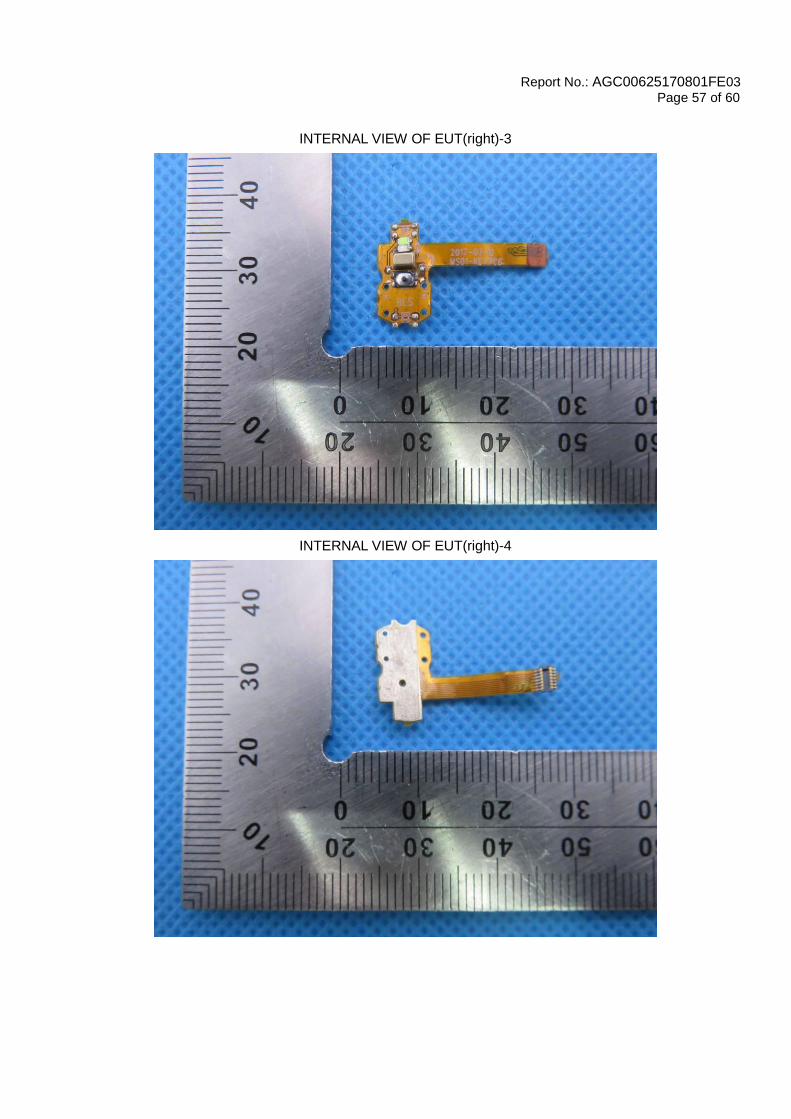
INTERNAL VIEW OF EUT(right)-3
INTERNAL VIEW OF EUT(right)-4
Report No.: AGC00625170801FE03
Page 58 of 60
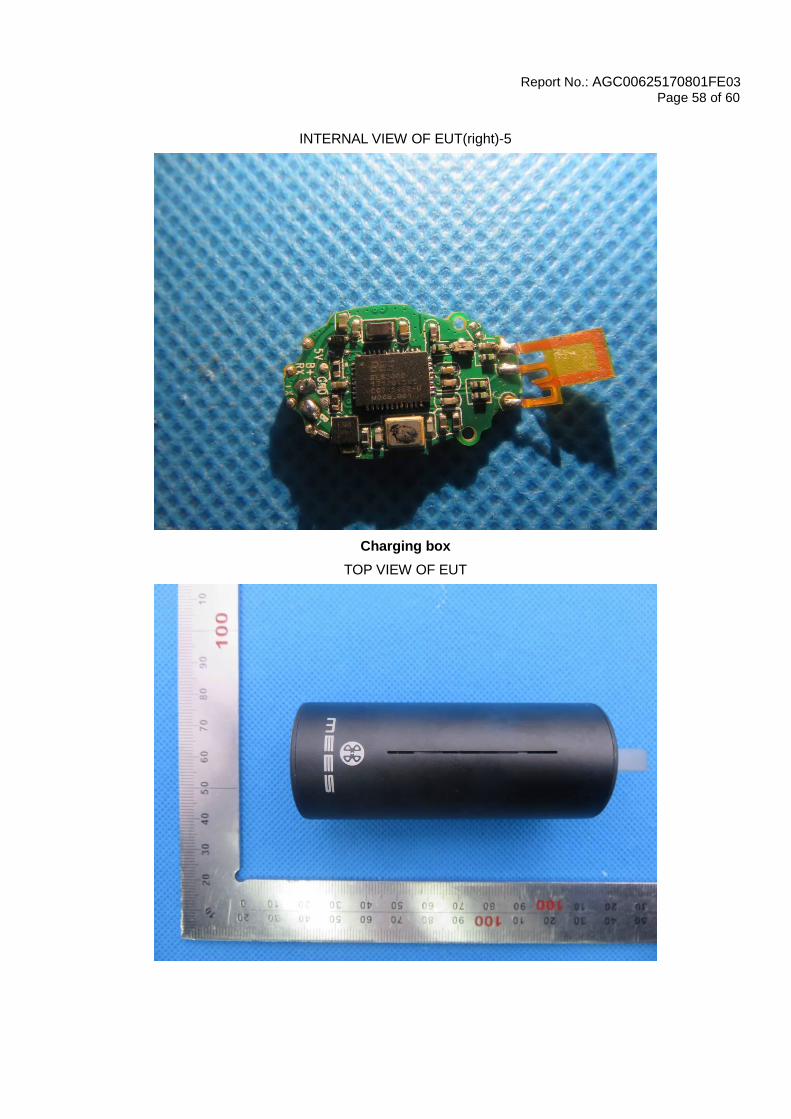
INTERNAL VIEW OF EUT(right)-5
Charging box
TOP VIEW OF EUT

Report No.: AGC00625170801FE03
Page 59 of 60
BOTTOM VIEW OF EUT
VIEW OF EUT (PORT)-1
Report No.: AGC00625170801FE03
Page 60 of 60
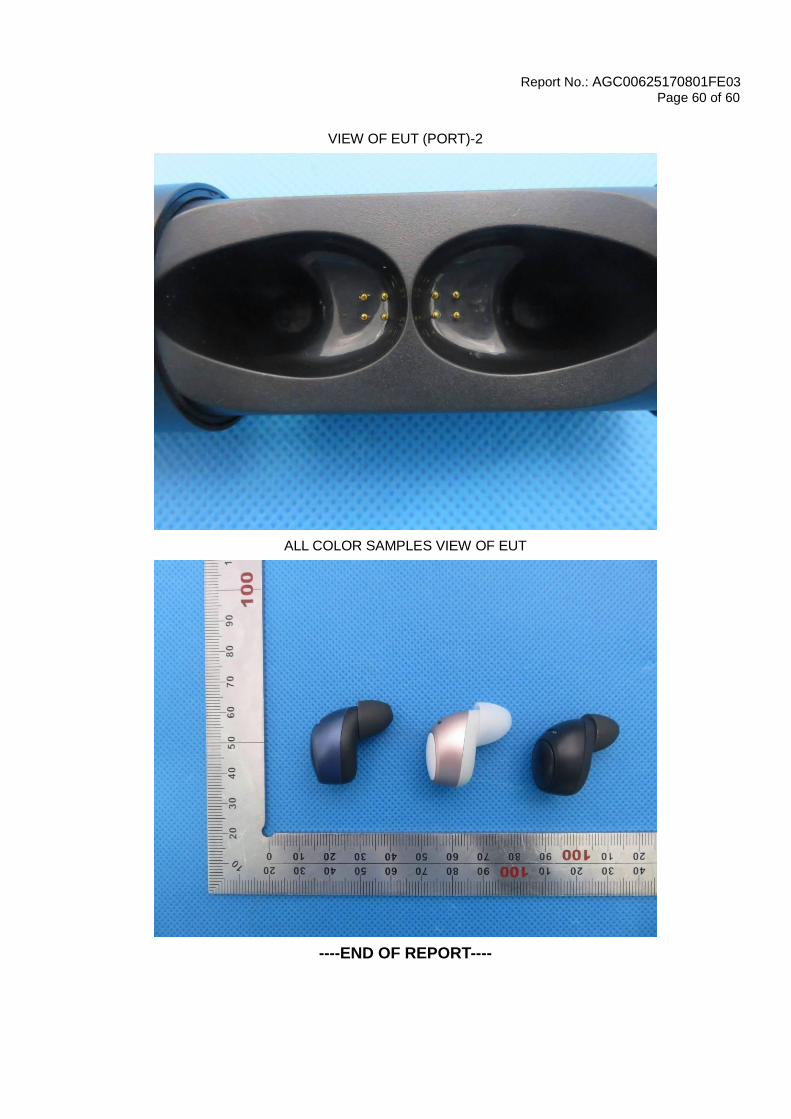
VIEW OF EUT (PORT)-2
ALL COLOR SAMPLES VIEW OF EUT
----END OF REPORT----


