

Working and Learning in a Changing World Part VI: Literacy and Numeracy Skills – Test Design,
Implementation, Scaling and Statistical Models for
Proficiency Estimation
Corinna Kleinert
Kentaro Yamamoto
Oliver Wölfel
Rainer Gilberg
10/2012
FDZ-Methodenreport 10/2012 1
Working and Learning in a Changing World Part VI: Literacy and Numeracy Skills – Test Design, Implementation, Scaling and Statistical Models for Proficiency Estimation
Corinna Kleinert (Institute for Employment Research)
Kentaro Yamamoto (Educational Testing Service)
Oliver Wölfel (Institute for Employment Research)
Rainer Gilberg (infas Institute for Applied Social Sciences)
Die FDZ-Methodenreporte befassen sich mit den methodischen Aspekten der Daten des FDZ und
helfen somit Nutzerinnen und Nutzern bei der Analyse der Daten. Nutzerinnen und Nutzer können
hierzu in dieser Reihe zitationsfähig publizieren und stellen sich der öffentlichen Diskussion.
FDZ-Methodenreporte (FDZ method reports) deal with methodical aspects of FDZ data and help us-
ers in the analysis of these data. In addition, users can publish their results in a citable manner and
present them for public discussion.

FDZ-Methodenreport 10/2012 2
Contents
1 Study and test design 4
1.1 Sampling 5
1.2 Instruments 5
1.3 Skill definitions and measurement 7
2 Implementation 10
2.1 Pilot study 10
2.2 Main study 10
2.3 Scoring 13
3 Weighting methods 13
3.1 Probability weights (design weights) 14
3.2 Benchmark weights (post-stratification weights) 15
3.3 Jackknife weights 15
4 Scaling methods 16
4.1 The scaling model 16
4.2 Proficiency estimates 19
4.3 Plausible Values—a brief survey 21
4.4 Deriving Plausible Values in ALWA 22
5 The quality of testing and scaling in the ALWA study 23
5.1 Pilot study results 23
5.2 Main study results 25
6 How to work with the ALWA competence data 29
6.1 Which competence test data should I use? 29
6.2 Analyses based on Plausible Values 30
6.3 Example 32
6.4 Computing the sampling variance 33
7 Data access 34
Appendix 37
FDZ-Methodenreport 10/2012 3
Abstract
This report describes the skills tests conducted in the face-to-face (PAPI) interview of the IAB study “Working and Learning in a Changing World” (ALWA). These tests focused on measur-ing cognitive skills in two domains, prose literacy and numeracy. The major goal of the ALWA study, for which the pilot was conducted in 2006/07 and the main survey in 2007/08, was to provide a database for statistical analyses on the relationships among cognitive competen-cies, educational credentials, and employment and working lives in longitudinal perspective. In the skills tests measurement constructs and items from both the International Adult Litera-cy Survey (IALS, 1994-1999) and the Adult Literacy and Life Skills survey (ALL, 2003-2008) were used. Scaling methods were modeled as well after those used for IALS and ALL (Yamamoto 1998, Yamamoto & Kirsch 1998). This report has two major goals. First, it de-scribes the design and implementation of the skills tests in the ALWA study. Second, the scaling model used for describing the test results is explained, empirical results of scaling the ALWA skills data are presented, and practical advice how to work with the delivered data (in the form of plausible values and weights) is given to those users how are no specialists in handling IRT (Item Response Theory) models.
Zusammenfassung
Dieser Bericht beschreibt die Kompetenztests, die in persönlichen Interviews der IAB-Studie „Arbeiten und Lernen im Wandel“ (ALWA) durchgeführt wurden. Mit diesen Tests wurden kognitive Fähigkeiten in zwei Domänen erfasst, das Lesen von Fließtexten (prose literacy) und der Umgang mit Zahlen (numeracy). Das grundlegende Ziel der ALWA-Studie, deren Pilotstudie 2006/07 und deren Hauptfeld 2007/08 durchgeführt wurde, bestand darin, eine Datenbasis für statistische Analysen zu den Zusammenhängen zwischen kognitiven Kompe-tenzen, Bildungszertifikaten und Erwerbsverläufen in einer Längsschnittperspektive zu schaf-fen. In den Tests wurden Messkonstrukte und Items aus den internationalen Erwachsenen-studien „International Adult Literacy Survey“ (IALS, 1994-1999) und „Adult Literacy and Life Skills Survey“ (ALL, 2003-2008) verwendet. Auch die Skalierung der ALWA-Kompetenztest-daten wurde nach dem Vorbild dieser beiden Studien modelliert (Yamamoto 1998, Yamamo-to & Kirsch 1998). Dieser Bericht hat zwei Ziele: Erstens wird das Design und die Durchfüh-rung der Kompetenztests in der ALWA-Studie beschrieben. Zweitens wird das Skalierungs-modell erklärt, das für die Beschreibung der Kompetenztestdaten verwendet wird, und es werden empirische Ergebnisse der Skalierung der ALWA-Daten vorgestellt. Für die Daten-nutzer, die keine Spezialisten im Umgang mit Item Response Theory (IRT) Modellen sind, wird schließlich praktische Hilfestellung gegeben, wie man mit den Kompetenztestdaten ar-beitet.
Keywords: ALWA, competence tests, cognitive competencies, literacy, numeracy, scaling model, plausible values
We would like to thank many colleagues who ensured the success of the ALWA competence test pro-ject, first and foremost Jutta Allmendinger, who generously supported the project, and Hans Dietrich, who made the first contact with the ALL research team. Our special thanks go to Sylvie Grenier at Statistics Canada, who administered our study internationally, the two domain experts who helped adapting the instrument, Anouk Zabal at GESIS Mannheim and Timo Ehmke at IPN Kiel, and to Steffi Pohl at NEPS Bamberg, who gave helpful advice on this report.
FDZ-Methodenreport 10/2012 4
1 Study and test design
The ALWA survey consists of two parts: in the first step, using a sample representing the
population living in Germany born in between 1956 to 1988, the study gathered information
through an extensive life-course questionnaire administered by computer-assisted telephone
interviews (CATI) (for details on design and sampling, see Antoni et al. 2010). The focus of
the retrospective biographical interviews was put on residential, educational and work histo-
ries. In a second step, assessments were carried out measuring basic cognitive skills in two
domains, prose literacy and numeracy. Here the respondents had to complete task booklets
in a face-to-face (PAPI) interview conducted on-site.
Due to this design, for all the participants who responded to the cognitive items a common,
extensive set of background information is available concerning their demographic character-
istics, educational experiences, labor market experiences and literacy-related activities. Be-
sides providing information on substantial research questions, these variables increased the
accuracy of the proficiency estimates (see section 4.4). Since the CATI questionnaire did not
require respondents to read any materials, it was independent of respondents’ literacy profi-
ciencies.
The blueprint for measurement constructs, scales, items, and task booklets used in ALWA
was the Adult Literacy and Life Skills survey (ALL), a six-country competence assessment
performed in between 2003 and 2008 (for design and results, see Statistics Canada & OECD
2005). In the ALL survey, Statistics Canada was responsible for quality control and data col-
lection standards, and US-based Educational Testing Service (ETS) had developed the tests
and estimated the proficiency scales. Both organizations adopted the same responsibilities in
co-operation with the IAB in the ALWA study. Here, administration of data collection activities
were carried out based upon the description of the ALL study in various documents supplied
by ETS, and ETS also designed the tests used in ALWA.
Due to the specific goals of the ALWA study, its design differed to ALL in several respects:
First, the target population had a different age range; it consisted only of 18 to 52 year old
persons, while the ALL participants were in between 16 and 64 years old. Second, respond-
ents in ALL were administered only a subset of items in the item pool of ALL while the ALWA
respondents received the entire item pool of ALL. Consequently, the number of items per
respondent per scale is higher for ALWA respondents. ALL is designed to maximize the ac-
curacy of subpopulation proficiency estimates while ALWA is concerned with increasing the
accuracy of individual proficiency estimates in order to monitor changes in cognitive skills
over time for a longitudinal study.1 Thus, ALWA data substantially reduced measurement
errors due to the increased number of items per scale per respondent. ALWA scales were
1 Originally, the ALWA tests were developed for a panel design, i.e. for measuring the selected skill
domains a second time for the same respondents. In this context, accurate measurement of indi-vidual proficiencies and their change over time was particularly important. In practice, the ALWA respondents became part of the adult starting cohort of the National Educational Panel Study (NEPS), and the second wave of skills measurement was not realized.
FDZ-Methodenreport 10/2012 5
linked to ALL scales through selection of items from ALL item pool and retaining almost all
item parameter values unchanged. Both support the comparability of inferences of results
between ALWA and ALL.
1.1 Sampling
The target group of the ALWA survey consists of all individuals living in Germany who were
born between 1956 and 1988, irrespective of the language they speak, their nationality or
their employment status. The sample was drawn in three stages: at the first stage, 281 sam-
ple points (representing 250 municipalities) were drawn from municipality data provided by
the Federal and the State Statistical Offices. At the second stage, the local registration offic-
es in these sample points were asked to compile a list of addresses of individuals born be-
tween 1956 and 1988 from the registers using a systematic random sampling procedure. At
the third stage, for this pool of addresses telephone numbers were researched using up-to-
date as well as older digital telephone directories (for details, see Antoni et al. 2010: 14f).
This sample was the basis for the CATI interviews.
At the end of the CATI interview, all German-speaking respondents were asked if they were
willing to conduct an additional face-to-face interview in the following weeks consisting of
“task booklets on reading and handling numbers”. Asking for consent is a necessary prereq-
uisite for reasons of German data protection law if a second interview in a different mode is
conducted. A fixed incentive of 15 Euro was announced, paid after completion of the face-to-
face interview. The PAPI survey was conducted with the whole subset of respondents who
agreed to participate (for realization and non-response, see section 2.2).
1.2 Instruments
The face-to-face interviews could take place at the respondents’ homes as well as at any
other suitable location. Three paper-and-pencil instruments were employed: a short back-
ground questionnaire and two task booklets, the core and the main booklet. The latter was
implemented in four versions signed by four different colors. For each target person the in-
terviewers received a contact record sheet stating the version of the survey materials, which
had been randomly assigned during sampling, as well as information about the use of the
incentive. Both contact record sheet and survey materials were designed in colors matching
the main booklet in order to ensure correct assignment.
The background questionnaire contained a few introductory questions on the respondents
and their current life situation in order to ensure that the person who performed the tests was
identical with the CATI participant. The interviewers read out these questions and recorded
the respective answers in the booklet. The background questionnaire also served as provi-
sion of instructions for the interviewers on how to conduct the skills tests. Furthermore, it
functioned as record sheet: all information about carrying out the competence tests was rec-
orded in there. Finally, it included interviewer questions about their assessment of the test,
which had to be answered after the tests without the respondents being present.
FDZ-Methodenreport 10/2012 6
To achieve strong content coverage of both domains, 30 prose literacy and 27 numeracy
cognitive items were selected from the ALL item pool based on meeting several criteria. First,
they had to represent the two selected constructs, prose literacy and numeracy, as much as
possible, i.e. all central aspects of the domains had to be covered by at least one task. Se-
cond, accurate measurement for the range of scale most common for the general population
had to be secured. And third, the set of items should not require too much time to complete
the whole booklet for the majority of respondents. After the items were selected by Statistics
Canada, ETS reviewed them in terms of constructs and psychometric characteristics of sin-
gle items as well as a whole. The number of items was limited by time constraints. Previous
research showed that a one hour test (on average) would be the most what the average
adult person would be willing to conduct. In order to balance the potential item position effect,
the cognitive items were assigned in four different sequences called booklets (see Table 1).
First, ten core items were identified, with five from each scale, to form one sequence reflect-
ing a mixture of literacy and numeracy items, the so-called core booklet. According to anal-
yses of item difficulties with the ALL data, these tended to be the easiest items in the whole
item pool and they were mostly independent2 cognitive items. The aim of the short core
booklet was to identify respondents with very low literacy and numeracy competencies in
order to avoid forcing them to answer a long test with complicated tasks.
In the interview the respondents were asked to complete the core booklet after having an-
swered the introductory questions in the frame questionnaire. The items in the booklet were
read out by the interviewers and had to be completed without any support from the inter-
viewers or other persons present, and also without any other resources (e.g. encyclopedias).
Immediately afterwards, the interviewers had to score the respondents’ core booklet answers
by marking and summing up all correct answers according to standardized instructions. At
maximum respondents could achieve 10 points, at minimum 0 points. If the sum was 4 points
(the cut-off point) or below in the main study, the interview was finished; if the sum was high-
er, the interview was continued with the main booklet.3
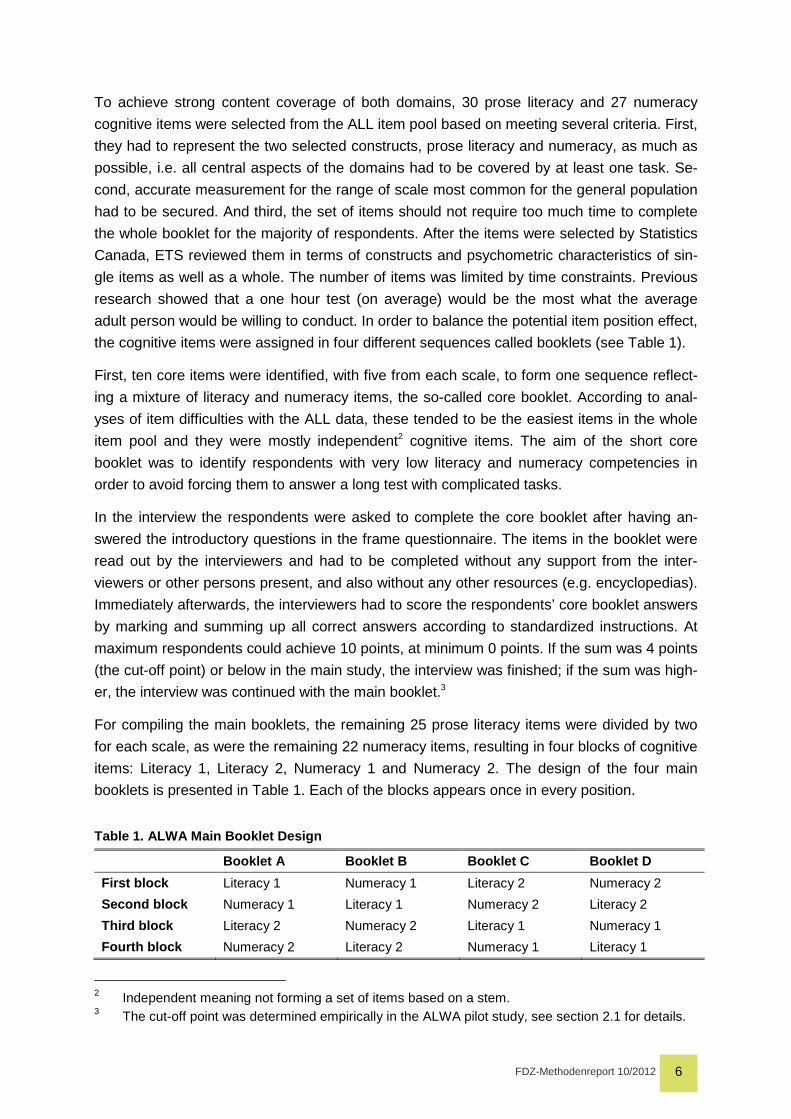
For compiling the main booklets, the remaining 25 prose literacy items were divided by two
for each scale, as were the remaining 22 numeracy items, resulting in four blocks of cognitive
items: Literacy 1, Literacy 2, Numeracy 1 and Numeracy 2. The design of the four main
booklets is presented in Table 1. Each of the blocks appears once in every position.
Table 1. ALWA Main Booklet Design
Booklet A Booklet B Booklet C Booklet D
First block Literacy 1 Numeracy 1 Literacy 2 Numeracy 2
Second block Numeracy 1 Literacy 1 Numeracy 2 Literacy 2
Third block Literacy 2 Numeracy 2 Literacy 1 Numeracy 1
Fourth block Numeracy 2 Literacy 2 Numeracy 1 Literacy 1
2 Independent meaning not forming a set of items based on a stem. 3 The cut-off point was determined empirically in the ALWA pilot study, see section 2.1 for details.
FDZ-Methodenreport 10/2012 7
The tasks in the main booklet were not read out by the interviewers; they had to be complet-
ed by the respondents on their own without any help. The only aid allowed was a pocket cal-
culator and a ruler, which the respondents received along with the main booklet. The inter-
viewers were not permitted to interfere with the respondents’ completion of the main booklet;
their role had to meet the demands of an uninvolved observer. It was neither allowed to abort
the tests nor to continue at a second interview session. According to the instructions in the
background questionnaire, the interviewers had to record the period of time the respondents
needed to complete the four blocks of tasks in the main booklet.
1.3 Skill definitions and measurement
While in the ALL survey four domains of cognitive skills were tested, prose and document
literacy, numeracy, and problem solving, in ALWA only two domains were tested, prose liter-
acy and numeracy. The ALL study defines skills along a continuum of proficiency. Thus,
there is no arbitrary standard distinguishing adults who have or do not have skills. The opera-
tional definitions of the two domains used in ALWA are the following:
� Prose literacy is the knowledge and skills needed to understand and use information from
continuous texts including editorials, news stories, brochures and instruction manuals.
� Numeracy is the knowledge and skills required to effectively manage the mathematical
demands of diverse situations (Statistics Canada & OECD 2005).
A general definition of literacy underlying the IALS and ALL survey is: “Literacy is using print-
ed and written information to function in society, to achieve one’s goals, and to develop one’s
knowledge and potential” (Statistics Canada & OECD 2005: 280). Thus, not simple reading
as decoding is meant when the skill tasks were constructed, but something deeper and
broader. Those skills are always applied for specific purposes in specific contexts, a charac-
teristic that is very different from purely theoretical school-based skills. Since adults read
within a particular context or for a particular purpose, for the literacy assessment materials
were selected that represent a variety of contexts and contents to help ensure that no single
group of adults is advantaged or disadvantaged. Six categories have been identified:
� Home and family (interpersonal relationships, personal finance, housing, and insurance)
� Health and safety (drugs and alcohol, disease prevention and treatment, safety and acci-
dent prevention, first aid, emergencies, and staying healthy)
� Community and citizenship (staying informed and community resources)
� Consumer economics (credit and banking, savings, advertising, making purchases, and
maintaining personal possessions)
� Work (materials that deal in general with various occupations but not job specific texts,
finding employment, finance, and being on the job)
� Leisure and recreation (travel, recreational activities, and restaurants).
Conceptions of numeracy used for developing the instruments emphasize the practical or
functional application and use of mathematical knowledge and skills to cope with the pres-
ence of mathematical elements in real situations. Thus, numeracy involves more than just
FDZ-Methodenreport 10/2012 8
applying arithmetical skills to information embedded in printed materials. Adult numeracy
extends to a possession of number sense, estimation skills, measurement and statistical
literacy.
Since the ALL items are heavily protected, only examples may be published (for examples,
see Statistics Canada & OECD 2005: Annex A). The items administered in ALWA were
based on the Swiss German adaptation of ALL. In order to account for linguistic differences
between Swiss German and German German, the ALWA team adapted these items a se-
cond time. This was done by the team at IAB, Nuremberg in collaboration with two external
experts, Anouk Zabal (GESIS Mannheim) for prose literacy and Timo Ehmke (IPN Kiel) for
numeracy. Afterwards, the new adaptations were re-translated and compared with the Eng-
lish versions for cultural, linguistic and cultural comparability. One of the most important func-
tions of the ALWA pilot study was to detect peculiar item differences caused by adaptation by
statistically comparing the central item parameters of Canadian ALL, Swiss German ALL and
ALWA (for results, see section 2.1).
All tasks in the assessment were open-ended or constructed responses, requiring written
answers, printed in paper booklets to be filled out by pencil. Unlike multiple-choice questions,
which are commonly used in large-scale surveys and offer a fixed number of answer choices,
open-ended items elicit a large variety of responses. Because raw data is seldom useful by
itself, responses must be grouped to summarize results. Responses to the ALWA open-
ended items were classified into four categories: correct, incorrect, omitted and not
reached/not presented. This was done by a specially trained and experienced scoring team
at the survey institute infas. All of the scorers were bi-lingual (English and German) and un-
derwent a long training process. Additionally, they were provided a scoring manual (for de-
tails see section 2.3). The two categories ‘omitted’ and ‘not reached’ both contain non-
response of an item. ‘Omitted’ represents that the respondent saw an item and decided not
to respond. The operational definition of ‘omitted’ is non-response followed by at least one
correct or incorrect response on any subsequent items. ‘Not reached’ represents that the
respondent did not even see the item. The operational definition of ‘not reached’ is consecu-
tive non-response at the end of the block.
ALWA employed the same methodology as in ALL to measure skill proficiency. The proce-
dure used to model continua of difficulty and ability is Item Response Theory (IRT) (see sec-
tion 4); empirically, different proficiency measures based on IRT were estimated (see section
4.2). For all the estimators, proficiency in both domains is denoted on a scale ranging from 0
to 500 points. Each score denotes a point at which a person has an 80 per cent chance of
successfully completing tasks that are associated with a similar level of difficulty. For both
domains, the ALL experts have defined five broad levels of difficulty; each corresponding to a
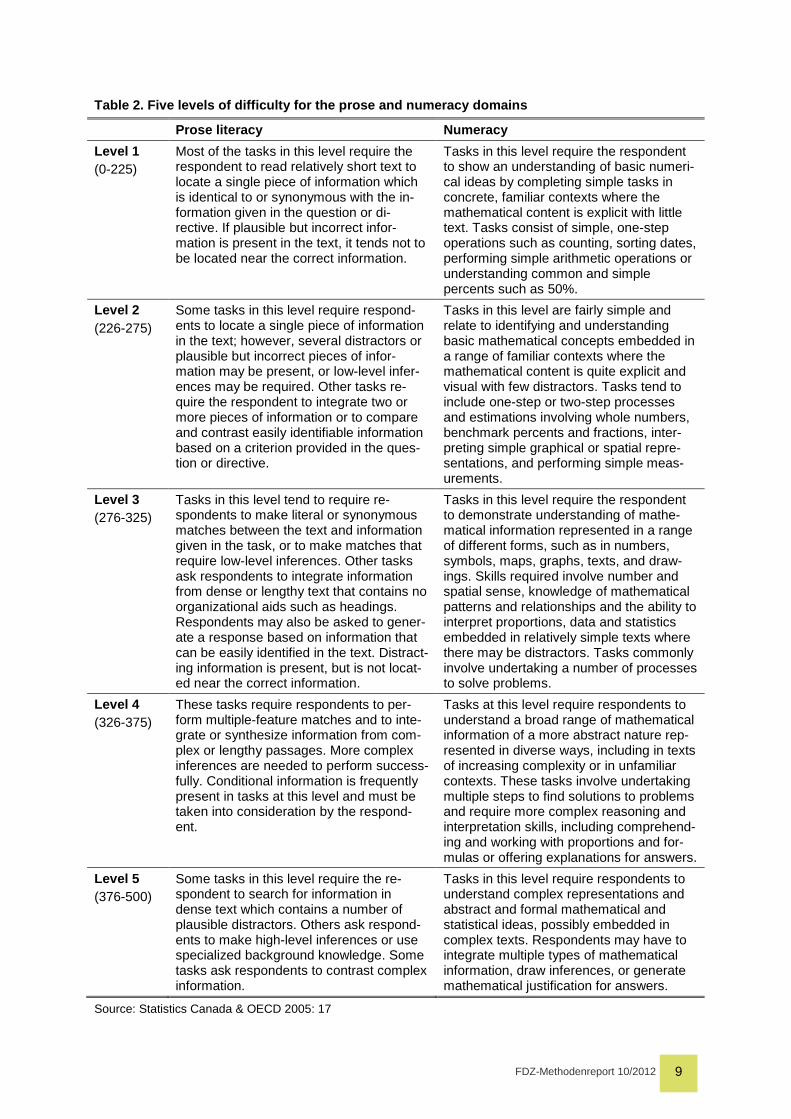
range of scores (Table 2).
FDZ-Methodenreport 10/2012 9
Table 2. Five levels of difficulty for the prose an d numeracy domains
Prose literacy Numeracy
Level 1 (0-225)
Most of the tasks in this level require the respondent to read relatively short text to locate a single piece of information which is identical to or synonymous with the in-formation given in the question or di-rective. If plausible but incorrect infor-mation is present in the text, it tends not to be located near the correct information.
Tasks in this level require the respondent to show an understanding of basic numeri-cal ideas by completing simple tasks in concrete, familiar contexts where the mathematical content is explicit with little text. Tasks consist of simple, one-step operations such as counting, sorting dates, performing simple arithmetic operations or understanding common and simple percents such as 50%.
Level 2 (226-275)
Some tasks in this level require respond-ents to locate a single piece of information in the text; however, several distractors or plausible but incorrect pieces of infor-mation may be present, or low-level infer-ences may be required. Other tasks re-quire the respondent to integrate two or more pieces of information or to compare and contrast easily identifiable information based on a criterion provided in the ques-tion or directive.
Tasks in this level are fairly simple and relate to identifying and understanding basic mathematical concepts embedded in a range of familiar contexts where the mathematical content is quite explicit and visual with few distractors. Tasks tend to include one-step or two-step processes and estimations involving whole numbers, benchmark percents and fractions, inter-preting simple graphical or spatial repre-sentations, and performing simple meas-urements.
Level 3 (276-325)
Tasks in this level tend to require re-spondents to make literal or synonymous matches between the text and information given in the task, or to make matches that require low-level inferences. Other tasks ask respondents to integrate information from dense or lengthy text that contains no organizational aids such as headings. Respondents may also be asked to gener-ate a response based on information that can be easily identified in the text. Distract-ing information is present, but is not locat-ed near the correct information.
Tasks in this level require the respondent to demonstrate understanding of mathe-matical information represented in a range of different forms, such as in numbers, symbols, maps, graphs, texts, and draw-ings. Skills required involve number and spatial sense, knowledge of mathematical patterns and relationships and the ability to interpret proportions, data and statistics embedded in relatively simple texts where there may be distractors. Tasks commonly involve undertaking a number of processes to solve problems.
Level 4 (326-375)
These tasks require respondents to per-form multiple-feature matches and to inte-grate or synthesize information from com-plex or lengthy passages. More complex inferences are needed to perform success-fully. Conditional information is frequently present in tasks at this level and must be taken into consideration by the respond-ent.
Tasks at this level require respondents to understand a broad range of mathematical information of a more abstract nature rep-resented in diverse ways, including in texts of increasing complexity or in unfamiliar contexts. These tasks involve undertaking multiple steps to find solutions to problems and require more complex reasoning and interpretation skills, including comprehend-ing and working with proportions and for-mulas or offering explanations for answers.
Level 5 (376-500)
Some tasks in this level require the re-spondent to search for information in dense text which contains a number of plausible distractors. Others ask respond-ents to make high-level inferences or use specialized background knowledge. Some tasks ask respondents to contrast complex information.
Tasks in this level require respondents to understand complex representations and abstract and formal mathematical and statistical ideas, possibly embedded in complex texts. Respondents may have to integrate multiple types of mathematical information, draw inferences, or generate mathematical justification for answers.
Source: Statistics Canada & OECD 2005: 17
FDZ-Methodenreport 10/2012 10
2 Implementation
2.1 Pilot study
A pilot study was conducted from autumn 2006 to spring 2007 in order to verify the appropri-
ateness of the selected items from the ALL item pool and their adaptation for the main ALWA
assessment as well as to finalize the main survey design. The study design and the larger
part of the sample were identical to the main study; i.e. a CATI interview was conducted first
and then the respondents were asked for their consent to perform a face-to-face interview,
which took place some days or weeks later. 197 persons were successfully interviewed. The
total duration averaged 81.5 minutes; the shortest interview took 28 minutes, the longest a
little more than 147 minutes. The completion of the core booklet averaged 7 minutes; the
main booklet averaged 70 minutes. Additionally, a small sample of low qualified adults was
drawn to gather enough information for determining the break-off point in the core booklet
(for results, see section 5.1). This sample was drawn from Employment Agency register data
on persons eligible for social welfare (SGB II). At the beginning of the interview, these per-
sons were screened by educational attainment, only very low educated persons continuing
with the interview. In this group 152 interviews were realized.
After completion of the field work, the open-ended answers to the tasks in the main booklets
were scored in the same way (and mostly by the same scoring team) as in the main study
(for details on scoring, see section 2.3).
2.2 Main study
The cover letter for the ALWA survey did not announce the second part of the survey, the
PAPI interview with the competence tests. This information was provided at the end of the
CATI interview combined with the request to participate. The gross sample for the perfor-
mance tests thus consisted of German speaking CATI respondents who were willing to take
part in a subsequent face-to-face interview. CATI respondents who had been interviewed in
Turkish or Russian language were not asked to participate.
Three measures were taken in order to raise participation rates. First, respondents were of-
fered an incentive of 15 Euros for participation in the face-to-face interview, mainly in order to
reduce education-prone selectivity bias. Second, 3,483 persons who had consented in partic-
ipating in further interviews in general but not in the competence tests were contacted per
telephone a second time and asked for their participation. Third, a confirmation letter was
sent to all respondents who had consented in participating in the face-to-face interview short-
ly after the CATI interview. In order to personalize contact, the name of the interviewer re-
sponsible for them was mentioned in the letter.
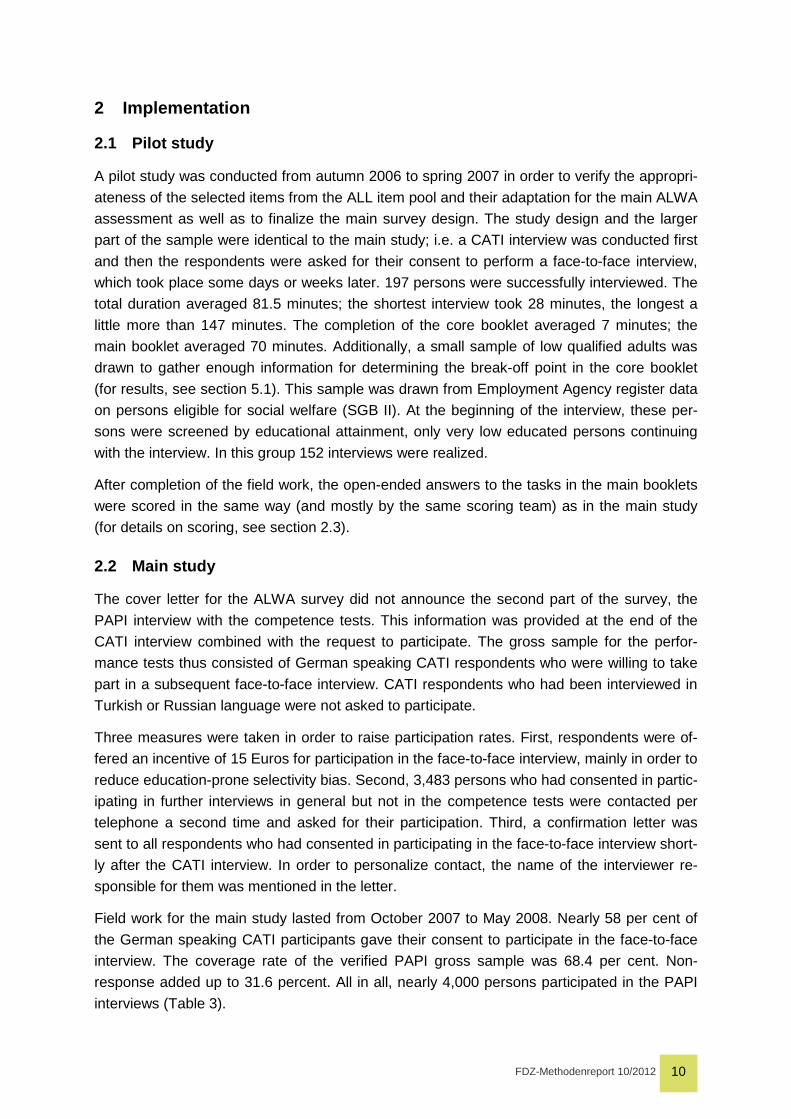
Field work for the main study lasted from October 2007 to May 2008. Nearly 58 per cent of
the German speaking CATI participants gave their consent to participate in the face-to-face
interview. The coverage rate of the verified PAPI gross sample was 68.4 per cent. Non-
response added up to 31.6 percent. All in all, nearly 4,000 persons participated in the PAPI
interviews (Table 3).
FDZ-Methodenreport 10/2012 11
Table 3. Coverage of the PAPI gross sample
n % German speaking CATI participants 10,177 100.0 With PAPI consent 5,889 57.9 Non-samples 68 0.7
Verified PAPI gross sample 5,821 100.0 Non-response 1,831 31.5 Not reached 487 8.4 Not capable 58 1.0 Unwilling to participate 1,286 22.1 Realized interviews 3,990 68.5 Interviews with valid competence test data 3,980 68.4
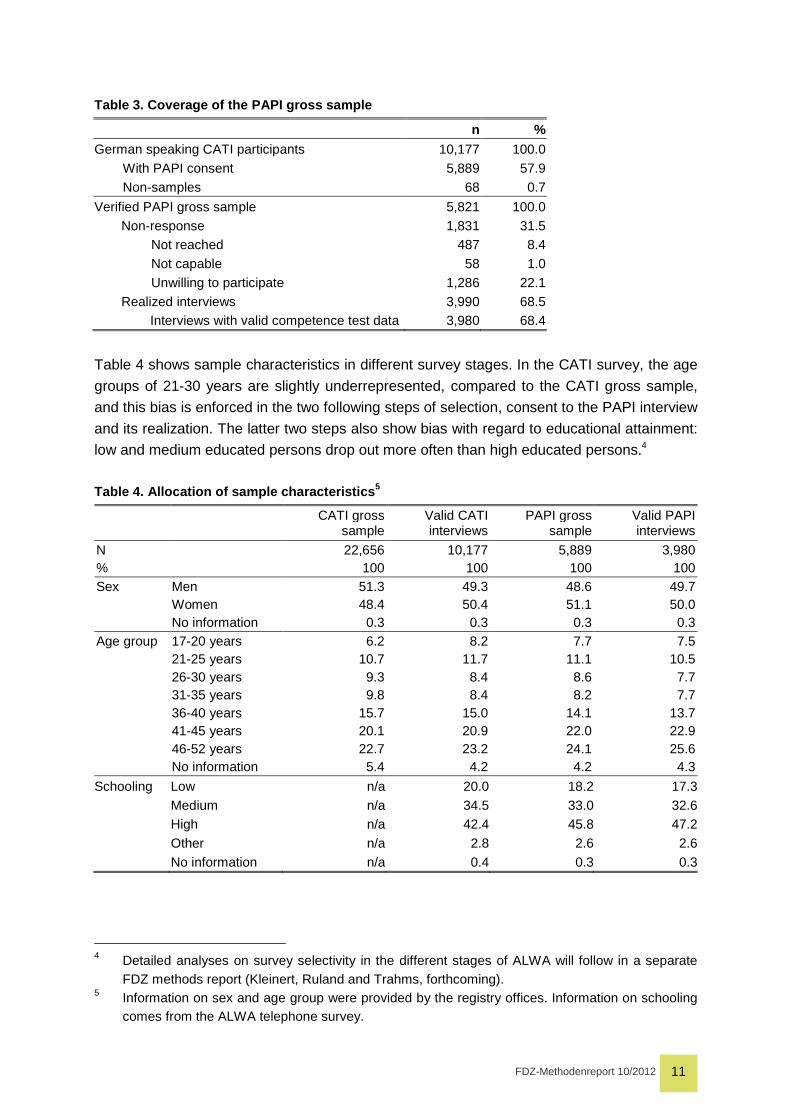
Table 4 shows sample characteristics in different survey stages. In the CATI survey, the age
groups of 21-30 years are slightly underrepresented, compared to the CATI gross sample,
and this bias is enforced in the two following steps of selection, consent to the PAPI interview
and its realization. The latter two steps also show bias with regard to educational attainment:
low and medium educated persons drop out more often than high educated persons.4
Table 4. Allocation of sample characteristics 5
CATI gross sample
Valid CATI interviews
PAPI gross sample
Valid PAPI interviews
N 22,656 10,177 5,889 3,980 % 100 100 100 100 Sex Men 51.3 49.3 48.6 49.7 Women 48.4 50.4 51.1 50.0 No information 0.3 0.3 0.3 0.3 Age group 17-20 years 6.2 8.2 7.7 7.5 21-25 years 10.7 11.7 11.1 10.5 26-30 years 9.3 8.4 8.6 7.7 31-35 years 9.8 8.4 8.2 7.7 36-40 years 15.7 15.0 14.1 13.7 41-45 years 20.1 20.9 22.0 22.9 46-52 years 22.7 23.2 24.1 25.6 No information 5.4 4.2 4.2 4.3
Schooling Low n/a 20.0 18.2 17.3 Medium n/a 34.5 33.0 32.6 High n/a 42.4 45.8 47.2 Other n/a 2.8 2.6 2.6 No information n/a 0.4 0.3 0.3
4 Detailed analyses on survey selectivity in the different stages of ALWA will follow in a separate
FDZ methods report (Kleinert, Ruland and Trahms, forthcoming). 5 Information on sex and age group were provided by the registry offices. Information on schooling
comes from the ALWA telephone survey.
FDZ-Methodenreport 10/2012 12
116 face-to-face interviewers throughout Germany were involved in the ALWA study. All of
them had extensive experience in conducting social-scientific surveys and ability tests. All
interviewers were trained intensively for conducting the assessments. The training focused
on presenting the different materials and explaining how to conduct the tests, in particular the
core booklet. Moreover, the interviewers received a comprehensive manual. The interviewers
conducted an average of 34 interviews, with a minimum of two and a maximum of 185 inter-
views per interviewer. Within the course of the entire field period the interviewers had to pass
specific quality checks and were permanently in close contact with infas’ field management.
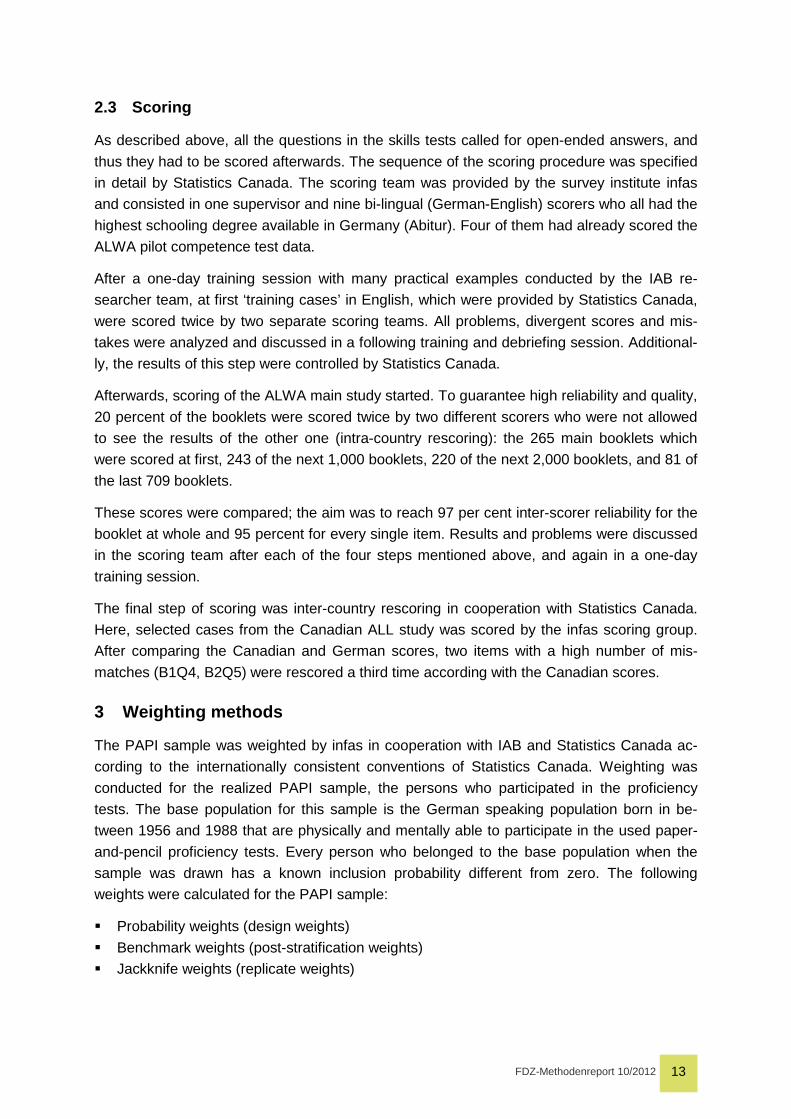
The total duration for answering the questions of the background questionnaire and complet-
ing the tasks of the core and the main booklet averaged 80.3 minutes (Table 5). The shortest
interview lasted 6 minutes, whereas the longest took a little longer than 185 minutes. The
completion of the core booklet averaged 7.2 minutes; the main booklet averaged 70.5
minutes. The interviewers’ instruction was to break off the completion of the main booklet
after approx. 90 minutes; yet, six respondents needed more than 2 hours for its completion.
Table 5. Duration of the PAPI interview (in minutes )
Mean Min Max SD Duration in total 80.3 6 185 16.6 Start core booklet - end main booklet 81.0 20 185 16.8 Core booklet 7.2 1 68 4.2 Main booklet 70.5 10 160 14.6
Base: n=3,892 processed background questionnaires, durations as per minute and time entered in the background questionnaire.
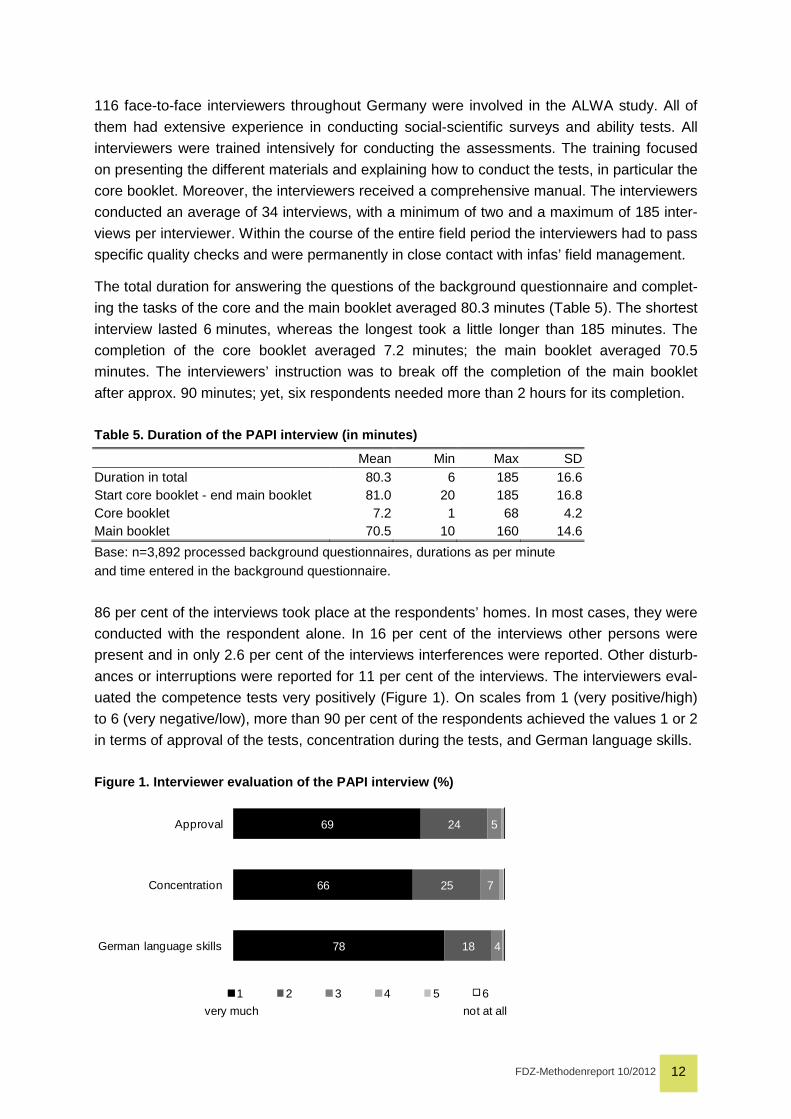
86 per cent of the interviews took place at the respondents’ homes. In most cases, they were
conducted with the respondent alone. In 16 per cent of the interviews other persons were
present and in only 2.6 per cent of the interviews interferences were reported. Other disturb-
ances or interruptions were reported for 11 per cent of the interviews. The interviewers eval-
uated the competence tests very positively (Figure 1). On scales from 1 (very positive/high)
to 6 (very negative/low), more than 90 per cent of the respondents achieved the values 1 or 2
in terms of approval of the tests, concentration during the tests, and German language skills.
Figure 1. Interviewer evaluation of the PAPI interv iew (%)
69
66
78
24
25
18
5
7
4
Approval
Concentration
German language skills
1 2 3 4 5 6
very much not at all
FDZ-Methodenreport 10/2012 13
2.3 Scoring
As described above, all the questions in the skills tests called for open-ended answers, and
thus they had to be scored afterwards. The sequence of the scoring procedure was specified
in detail by Statistics Canada. The scoring team was provided by the survey institute infas
and consisted in one supervisor and nine bi-lingual (German-English) scorers who all had the
highest schooling degree available in Germany (Abitur). Four of them had already scored the
ALWA pilot competence test data.
After a one-day training session with many practical examples conducted by the IAB re-
searcher team, at first ‘training cases’ in English, which were provided by Statistics Canada,
were scored twice by two separate scoring teams. All problems, divergent scores and mis-
takes were analyzed and discussed in a following training and debriefing session. Additional-
ly, the results of this step were controlled by Statistics Canada.
Afterwards, scoring of the ALWA main study started. To guarantee high reliability and quality,
20 percent of the booklets were scored twice by two different scorers who were not allowed
to see the results of the other one (intra-country rescoring): the 265 main booklets which
were scored at first, 243 of the next 1,000 booklets, 220 of the next 2,000 booklets, and 81 of
the last 709 booklets.
These scores were compared; the aim was to reach 97 per cent inter-scorer reliability for the
booklet at whole and 95 percent for every single item. Results and problems were discussed
in the scoring team after each of the four steps mentioned above, and again in a one-day
training session.
The final step of scoring was inter-country rescoring in cooperation with Statistics Canada.
Here, selected cases from the Canadian ALL study was scored by the infas scoring group.
After comparing the Canadian and German scores, two items with a high number of mis-
matches (B1Q4, B2Q5) were rescored a third time according with the Canadian scores.
3 Weighting methods
The PAPI sample was weighted by infas in cooperation with IAB and Statistics Canada ac-
cording to the internationally consistent conventions of Statistics Canada. Weighting was
conducted for the realized PAPI sample, the persons who participated in the proficiency
tests. The base population for this sample is the German speaking population born in be-
tween 1956 and 1988 that are physically and mentally able to participate in the used paper-
and-pencil proficiency tests. Every person who belonged to the base population when the
sample was drawn has a known inclusion probability different from zero. The following
weights were calculated for the PAPI sample:
� Probability weights (design weights)
� Benchmark weights (post-stratification weights)
� Jackknife weights (replicate weights)
FDZ-Methodenreport 10/2012 14
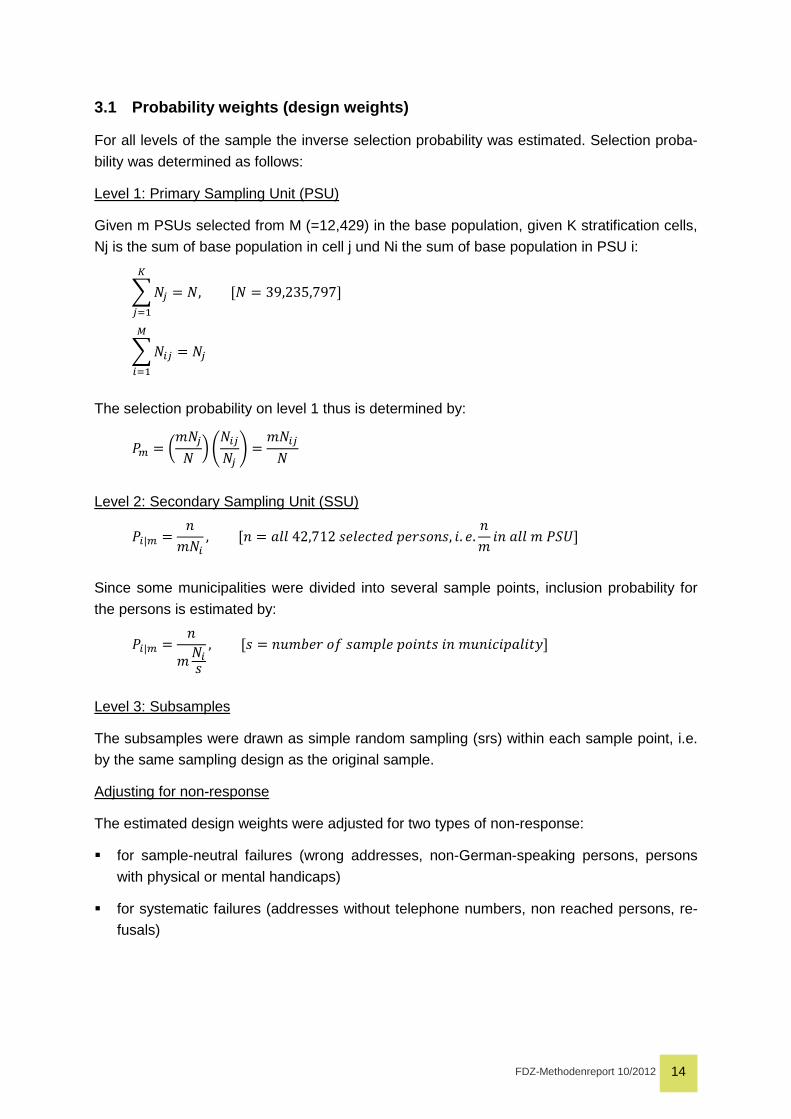
3.1 Probability weights (design weights)
For all levels of the sample the inverse selection probability was estimated. Selection proba-
bility was determined as follows:
Level 1: Primary Sampling Unit (PSU)
Given m PSUs selected from M (=12,429) in the base population, given K stratification cells,
Nj is the sum of base population in cell j und Ni the sum of base population in PSU i:
� �� � �, �� � 39,235,797�
���
� ��� � ���
���
The selection probability on level 1 thus is determined by:
�� � ����� � ������ � � �����
Level 2: Secondary Sampling Unit (SSU)
��|� � ���� , �� � ��� 42,712 !�!"#!$ %!& '� , (. !. �
� (� ��� � �*+�
Since some municipalities were divided into several sample points, inclusion probability for
the persons is estimated by:
��|� � �� ��
, � � �,�-!& '. ��%�! %'(�# (� �,�("(%��(#/�
Level 3: Subsamples
The subsamples were drawn as simple random sampling (srs) within each sample point, i.e.
by the same sampling design as the original sample.
Adjusting for non-response
The estimated design weights were adjusted for two types of non-response:
� for sample-neutral failures (wrong addresses, non-German-speaking persons, persons
with physical or mental handicaps)
� for systematic failures (addresses without telephone numbers, non reached persons, re-
fusals)
FDZ-Methodenreport 10/2012 15
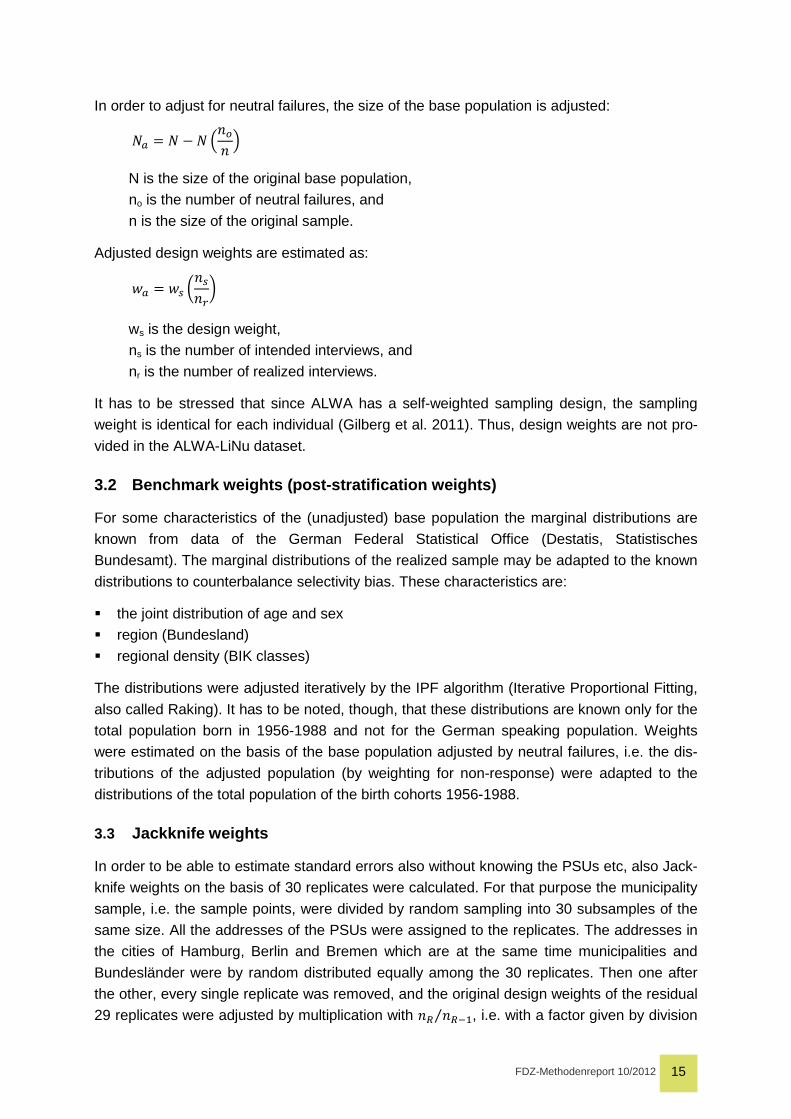
In order to adjust for neutral failures, the size of the base population is adjusted:
�0 � � 1 � 2�3� 4 N is the size of the original base population,
no is the number of neutral failures, and
n is the size of the original sample.
Adjusted design weights are estimated as:
50 � 56 ��6�7� ws is the design weight,
ns is the number of intended interviews, and
nr is the number of realized interviews.
It has to be stressed that since ALWA has a self-weighted sampling design, the sampling
weight is identical for each individual (Gilberg et al. 2011). Thus, design weights are not pro-
vided in the ALWA-LiNu dataset.
3.2 Benchmark weights (post-stratification weights)
For some characteristics of the (unadjusted) base population the marginal distributions are
known from data of the German Federal Statistical Office (Destatis, Statistisches
Bundesamt). The marginal distributions of the realized sample may be adapted to the known
distributions to counterbalance selectivity bias. These characteristics are:
� the joint distribution of age and sex
� region (Bundesland)
� regional density (BIK classes)
The distributions were adjusted iteratively by the IPF algorithm (Iterative Proportional Fitting,
also called Raking). It has to be noted, though, that these distributions are known only for the
total population born in 1956-1988 and not for the German speaking population. Weights
were estimated on the basis of the base population adjusted by neutral failures, i.e. the dis-
tributions of the adjusted population (by weighting for non-response) were adapted to the
distributions of the total population of the birth cohorts 1956-1988.
3.3 Jackknife weights
In order to be able to estimate standard errors also without knowing the PSUs etc, also Jack-
knife weights on the basis of 30 replicates were calculated. For that purpose the municipality
sample, i.e. the sample points, were divided by random sampling into 30 subsamples of the
same size. All the addresses of the PSUs were assigned to the replicates. The addresses in
the cities of Hamburg, Berlin and Bremen which are at the same time municipalities and
Bundesländer were by random distributed equally among the 30 replicates. Then one after
the other, every single replicate was removed, and the original design weights of the residual
29 replicates were adjusted by multiplication with �8 �89�⁄ , i.e. with a factor given by division

FDZ-Methodenreport 10/2012 16
of the total gross sample (42,712) by the total gross sample minus the gross sample of the
particular replicate. Then this weighting process was repeated for the other 29 replicates.
Thus, for every interviewee 30 replicate or Jackknife weights were calculated.
4 Scaling methods
Limitations to conventional scoring methods, including limited linking capability to previous
surveys based on the total scores, can be overcome by using Item Response Theory (IRT).6
The basic idea of IRT is that if several items require similar skills the response patterns
should show some regularity. These patterns can be used to characterize both respondents
and items in terms of a common standard scale, even when all respondents do not take iden-
tical sets of items as presented in previous surveys. IRT is thus based on the idea that the
probability of a correct response to an item is a mathematical function of person and item
parameters.
In the case of ALWA, a subset of items was selected from the ALL survey. In this way, it be-
came possible to discuss distributions of performance in a population or subpopulation and
to estimate relationships between proficiency and background variables. Scaling and anal-
yses of ALWA were carried out separately for the literacy and numeracy. By creating a sepa-
rate scale for each domain, it was possible to explore potential differences in performance
across both areas of competencies.
4.1 The scaling model
The scaling model used for ALWA is the two-parameter logistic (2PL) model from IRT (Birn-
baum 1968, Lord 1980). It is a mathematical model for the probability that a particular person
will respond correctly to a particular item from a single domain of items. This probability is
given as a function of a parameter characterizing the proficiency of that person (a latent trait
or ability), and two parameters characterizing the properties of an item, difficulty (location)
and discrimination (slope or correlation).7
The following 2PL IRT model was employed in ALWA, identical to its use in IALS and ALL:
�;<�� � 1=>�, �� , -�? � ��.@ABCD E9F0G;HI9JG?K (1)
where
<�� is the response of person j to item i, 1 if correct and 0 if incorrect;
6 The name IRT is due to the focus of the theory on the item, as opposed to the test-level focus of
classical test theory, by modeling the response of an examinee of given ability to each item in the test. IRT is generally regarded as an improvement over classical test theory, because it generally brings greater flexibility and provides more sophisticated information which allows a researcher to improve the reliability of an assessment.
7 IRT models are described by the number of parameters they make use of: the 2PL model em-ploys two item parameters, the 3PL model additionally employs an item parameter for pseudoguessing (lower asymptote).
FDZ-Methodenreport 10/2012 17
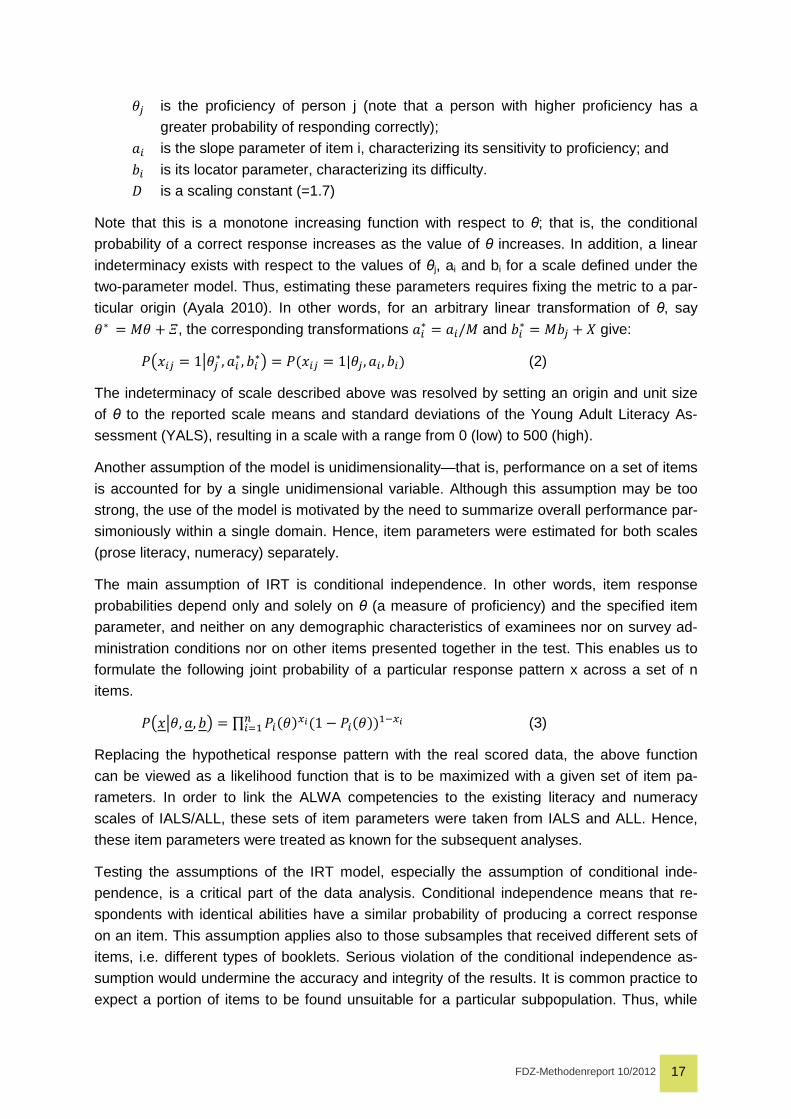
>� is the proficiency of person j (note that a person with higher proficiency has a
greater probability of responding correctly);
�� is the slope parameter of item i, characterizing its sensitivity to proficiency; and
-� is its locator parameter, characterizing its difficulty.
L is a scaling constant (=1.7)
Note that this is a monotone increasing function with respect to θ; that is, the conditional
probability of a correct response increases as the value of θ increases. In addition, a linear
indeterminacy exists with respect to the values of θj, ai and bi for a scale defined under the
two-parameter model. Thus, estimating these parameters requires fixing the metric to a par-
ticular origin (Ayala 2010). In other words, for an arbitrary linear transformation of θ, say
>M � N> O P, the corresponding transformations ��M � ��/N and -�M � N-� O R give:
�;<�� � 1=>�M, ��M, -�M? � �E<�� � 1|>�, �� , -�K (2)
The indeterminacy of scale described above was resolved by setting an origin and unit size
of θ to the reported scale means and standard deviations of the Young Adult Literacy As-
sessment (YALS), resulting in a scale with a range from 0 (low) to 500 (high).
Another assumption of the model is unidimensionality—that is, performance on a set of items
is accounted for by a single unidimensional variable. Although this assumption may be too
strong, the use of the model is motivated by the need to summarize overall performance par-
simoniously within a single domain. Hence, item parameters were estimated for both scales
(prose literacy, numeracy) separately.
The main assumption of IRT is conditional independence. In other words, item response
probabilities depend only and solely on θ (a measure of proficiency) and the specified item
parameter, and neither on any demographic characteristics of examinees nor on survey ad-
ministration conditions nor on other items presented together in the test. This enables us to
formulate the following joint probability of a particular response pattern x across a set of n
items.
�;<=>, �, -? � ∏ ��E>KTGE1 1 ��E>KK�9TGU��� (3)
Replacing the hypothetical response pattern with the real scored data, the above function
can be viewed as a likelihood function that is to be maximized with a given set of item pa-
rameters. In order to link the ALWA competencies to the existing literacy and numeracy
scales of IALS/ALL, these sets of item parameters were taken from IALS and ALL. Hence,
these item parameters were treated as known for the subsequent analyses.
Testing the assumptions of the IRT model, especially the assumption of conditional inde-
pendence, is a critical part of the data analysis. Conditional independence means that re-
spondents with identical abilities have a similar probability of producing a correct response
on an item. This assumption applies also to those subsamples that received different sets of
items, i.e. different types of booklets. Serious violation of the conditional independence as-
sumption would undermine the accuracy and integrity of the results. It is common practice to
expect a portion of items to be found unsuitable for a particular subpopulation. Thus, while
FDZ-Methodenreport 10/2012 18
the item parameters were being estimated for the ALWA data, empirical conditional percent-
ages correct were monitored (for results, see section 5.2). The number of common item pa-
rameters establishes the bases of comparable inferences. If a large number of items are
found to be unsuitable for a particular subpopulation, it is expected to have greater errors in
proficiency distribution as well as inferences about the proficiency such as descriptions of
levels.
One of the strengths of IRT models is that when their assumptions hold and estimates of the
model’s item parameters are available for the collections of items that make up the different
test forms, all results can be reported directly in terms of the IRT proficiency. This property of
IRT scaling removes the need to establish the comparability of number-correct score scales
for different forms of the test, i.e. different types of booklets (see Table 1).
In ALWA, the 2PL item-parameters of IALS/ALL for each scale were evaluated using a cur-
rent version of Yamamoto’s (1989) Hybil program with standardized weights. Hybil proce-
dures are based on an extension of the marginal-maximum-likelihood approach described by
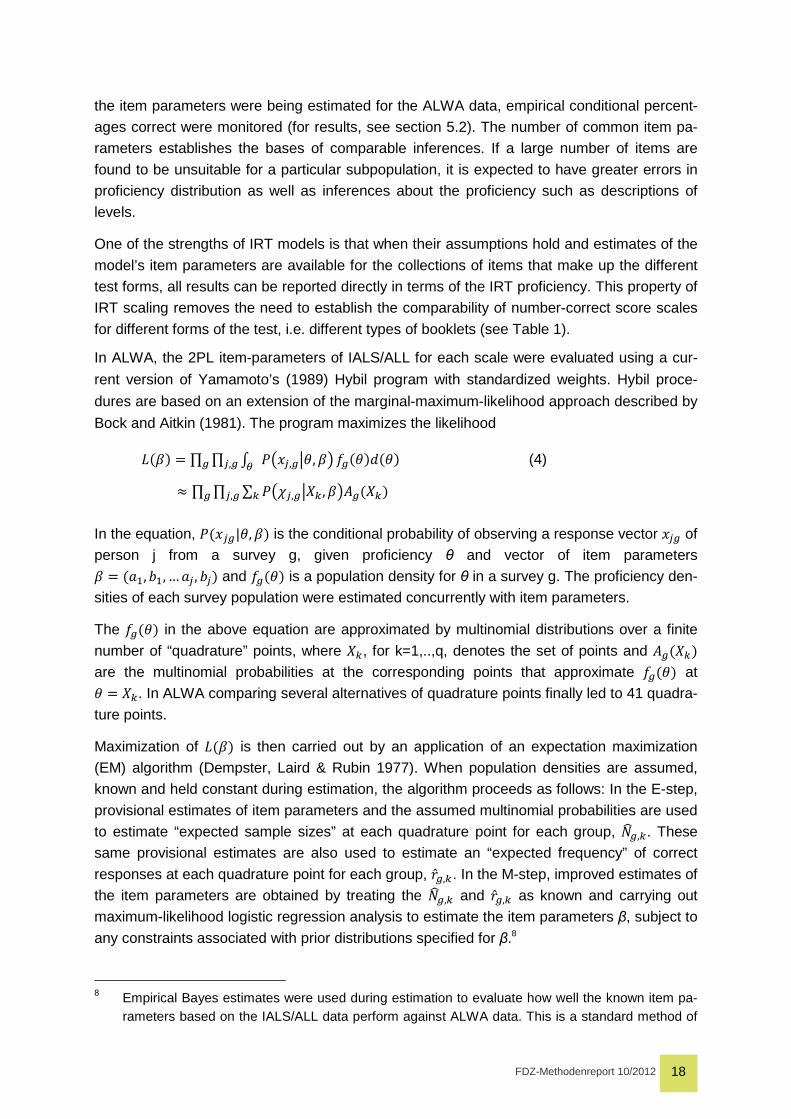
Bock and Aitkin (1981). The program maximizes the likelihood
VEWK � ∏ ∏ X �;<�,Y=>, W?H�,Y .YE>K$E>KY (4)
Z ∏ ∏ ∑ �;\�,Y=R] , W?^YER]K]�,YY
In the equation, �E<�Y|>, WK is the conditional probability of observing a response vector <�Y of
person j from a survey g, given proficiency θ and vector of item parameters
W � E��, -�, … �� , -�K and .YE>K is a population density for θ in a survey g. The proficiency den-
sities of each survey population were estimated concurrently with item parameters.
The .YE>K in the above equation are approximated by multinomial distributions over a finite
number of “quadrature” points, where R], for k=1,..,q, denotes the set of points and ^YER]K
are the multinomial probabilities at the corresponding points that approximate .YE>K at
> � R]. In ALWA comparing several alternatives of quadrature points finally led to 41 quadra-
ture points.
Maximization of VEWK is then carried out by an application of an expectation maximization
(EM) algorithm (Dempster, Laird & Rubin 1977). When population densities are assumed,
known and held constant during estimation, the algorithm proceeds as follows: In the E-step,
provisional estimates of item parameters and the assumed multinomial probabilities are used
to estimate “expected sample sizes” at each quadrature point for each group, �̀Y,]. These
same provisional estimates are also used to estimate an “expected frequency” of correct
responses at each quadrature point for each group, &̂Y,]. In the M-step, improved estimates of
the item parameters are obtained by treating the �̀Y,] and &̂Y,] as known and carrying out
maximum-likelihood logistic regression analysis to estimate the item parameters β, subject to
any constraints associated with prior distributions specified for β.8
8 Empirical Bayes estimates were used during estimation to evaluate how well the known item pa-
rameters based on the IALS/ALL data perform against ALWA data. This is a standard method of
FDZ-Methodenreport 10/2012 19
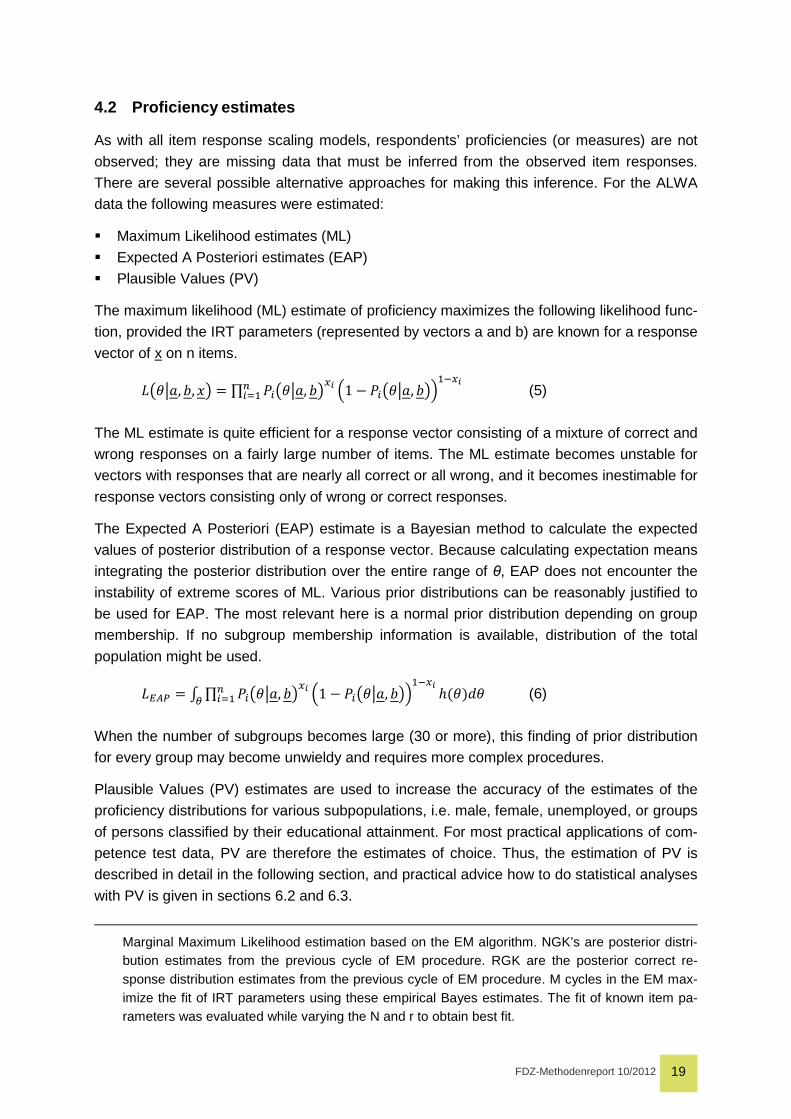
4.2 Proficiency estimates
As with all item response scaling models, respondents’ proficiencies (or measures) are not
observed; they are missing data that must be inferred from the observed item responses.
There are several possible alternative approaches for making this inference. For the ALWA
data the following measures were estimated:
� Maximum Likelihood estimates (ML)
� Expected A Posteriori estimates (EAP)
� Plausible Values (PV)
The maximum likelihood (ML) estimate of proficiency maximizes the following likelihood func-
tion, provided the IRT parameters (represented by vectors a and b) are known for a response
vector of x on n items.
V;>=�, -, <? � ∏ ��;>=�, -?TGU��� 21 1 ��;>=�, -?4�9TG (5)
The ML estimate is quite efficient for a response vector consisting of a mixture of correct and
wrong responses on a fairly large number of items. The ML estimate becomes unstable for
vectors with responses that are nearly all correct or all wrong, and it becomes inestimable for
response vectors consisting only of wrong or correct responses.
The Expected A Posteriori (EAP) estimate is a Bayesian method to calculate the expected
values of posterior distribution of a response vector. Because calculating expectation means
integrating the posterior distribution over the entire range of θ, EAP does not encounter the
instability of extreme scores of ML. Various prior distributions can be reasonably justified to
be used for EAP. The most relevant here is a normal prior distribution depending on group
membership. If no subgroup membership information is available, distribution of the total
population might be used.
Vbcd � X ∏ ��;>=�, -?TG 21 1 ��;>=�, -?4�9TG eE>K$>U���H (6)
When the number of subgroups becomes large (30 or more), this finding of prior distribution
for every group may become unwieldy and requires more complex procedures.
Plausible Values (PV) estimates are used to increase the accuracy of the estimates of the
proficiency distributions for various subpopulations, i.e. male, female, unemployed, or groups
of persons classified by their educational attainment. For most practical applications of com-
petence test data, PV are therefore the estimates of choice. Thus, the estimation of PV is
described in detail in the following section, and practical advice how to do statistical analyses
with PV is given in sections 6.2 and 6.3.
Marginal Maximum Likelihood estimation based on the EM algorithm. NGK’s are posterior distri-bution estimates from the previous cycle of EM procedure. RGK are the posterior correct re-sponse distribution estimates from the previous cycle of EM procedure. M cycles in the EM max-imize the fit of IRT parameters using these empirical Bayes estimates. The fit of known item pa-rameters was evaluated while varying the N and r to obtain best fit.
FDZ-Methodenreport 10/2012 20
Most assessments that test cognitive skills are concerned with accurately assessing the per-
formance of individual respondents for the purpose of diagnosis, selection or placement. Re-
gardless of which measurement model is used, classical test theory or item response theory,
the accuracy of these measurements can be improved, that is, the amount of measurement
error can be reduced, by increasing the number of items given to the individual test partici-
pants. Thus, achievement tests containing more than 70 items are common. Since the uncer-
tainty associated with each > is negligible, the distribution of > or the joint distribution of θ
with other variables can be approximated using individual >.
However, when analyzing the distribution of proficiencies in a large group of persons—as
survey research usually does—more efficient estimates can be obtained from a so-called
incomplete sampling design, a wide range of items that are only administered in part to every
respondent. Compared to individual achievement tests, interview time in large-scale surveys
is restricted and thus they can only obtain relatively few responses from each sampled re-
spondent. Instead, they maintain a wide range of content representation when responses are
summed for all respondents. This was done in the ALL survey, but not in ALWA. Here all
respondents were asked the same set of items, mainly, because the original aim was to re-
peat the tests in a panel design. The advantage of estimating population characteristics more
efficiently is offset by the inability to make precise statements about individuals. Uncertainty
associated with individual > estimates is too large to be ignored.
Point estimates of proficiency such as ML that are, in some sense, optimal for each sampled
respondent might lead to seriously biased estimates of population characteristics
(Wingersky, Kaplan, & Beaton, 1987). Vice versa, PV are not the best estimates for individu-
al diagnostics since they do reflect the group membership of the respondent. Thus, it is im-
portant to state that PV are not proficiency estimates for the individuals. Instead, PV may be
described as random draws from a distribution providing a possibility to estimate population
parameters (for further information and discussions about the different estimation methods
see Uebersax 1993; Chen, Hou and Dodd 1998; Davier et al. 2009).
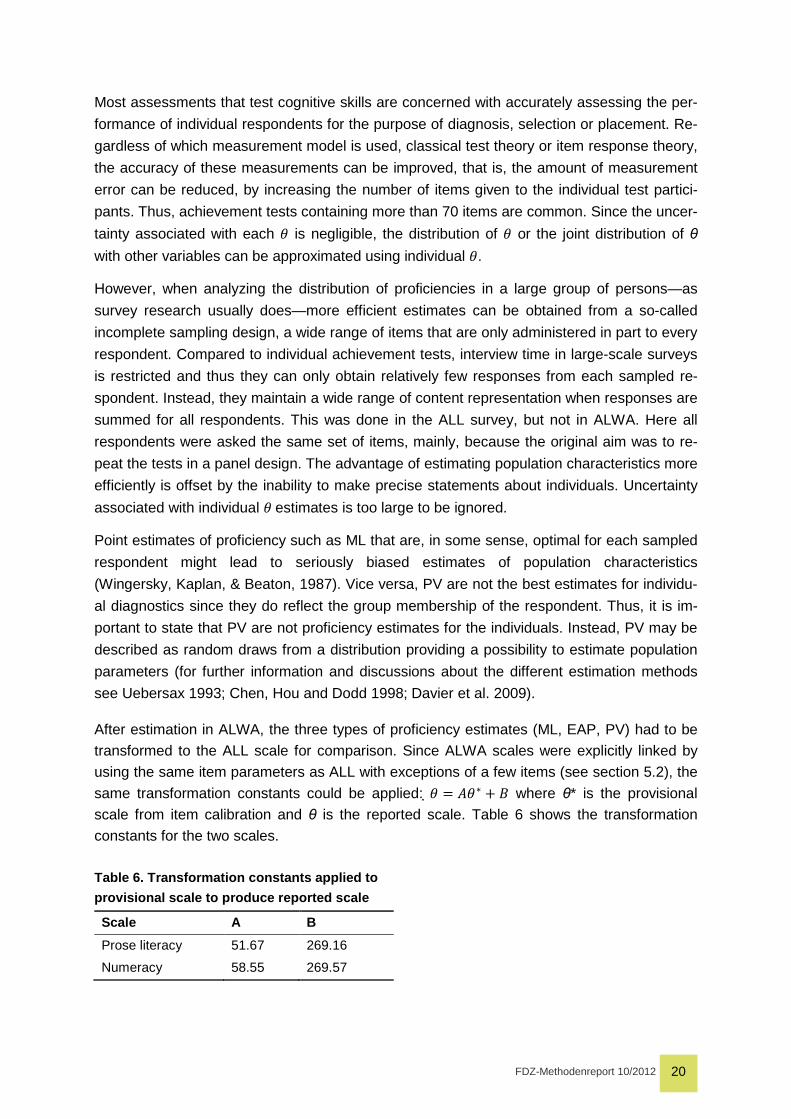
After estimation in ALWA, the three types of proficiency estimates (ML, EAP, PV) had to be
transformed to the ALL scale for comparison. Since ALWA scales were explicitly linked by
using the same item parameters as ALL with exceptions of a few items (see section 5.2), the
same transformation constants could be applied: > � ^>M O f where θ* is the provisional
scale from item calibration and θ is the reported scale. Table 6 shows the transformation
constants for the two scales.
Table 6. Transformation constants applied to
provisional scale to produce reported scale
Scale A B
Prose literacy 51.67 269.16
Numeracy 58.55 269.57
FDZ-Methodenreport 10/2012 21
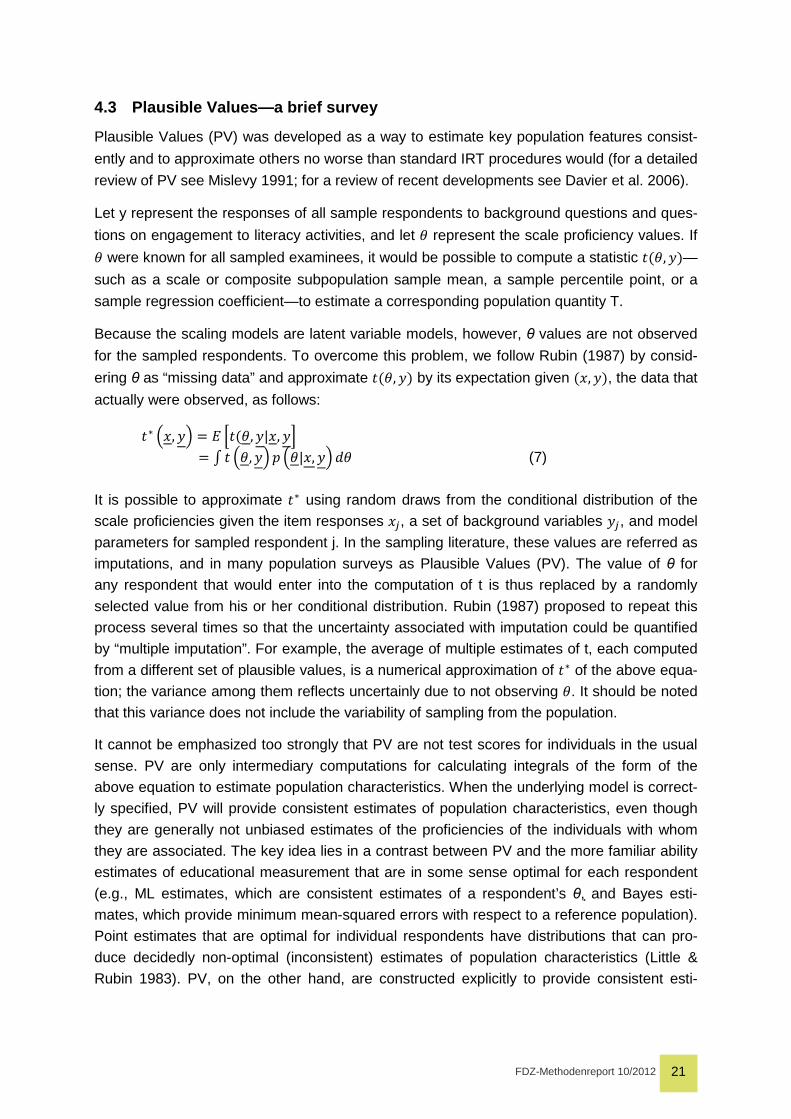
4.3 Plausible Values—a brief survey
Plausible Values (PV) was developed as a way to estimate key population features consist-
ently and to approximate others no worse than standard IRT procedures would (for a detailed
review of PV see Mislevy 1991; for a review of recent developments see Davier et al. 2006).
Let y represent the responses of all sample respondents to background questions and ques-
tions on engagement to literacy activities, and let > represent the scale proficiency values. If
> were known for all sampled examinees, it would be possible to compute a statistic #E>, /K—
such as a scale or composite subpopulation sample mean, a sample percentile point, or a
sample regression coefficient—to estimate a corresponding population quantity T.
Because the scaling models are latent variable models, however, θ values are not observed
for the sampled respondents. To overcome this problem, we follow Rubin (1987) by consid-
ering θ as “missing data” and approximate #E>, /K by its expectation given E<, /K, the data that
actually were observed, as follows:
#M 2<, /4 � g h#E>, /|<, /i � X # 2>, /4 % 2>|<, /4 $> (7)
It is possible to approximate #M using random draws from the conditional distribution of the
scale proficiencies given the item responses <�, a set of background variables /�, and model
parameters for sampled respondent j. In the sampling literature, these values are referred as
imputations, and in many population surveys as Plausible Values (PV). The value of θ for
any respondent that would enter into the computation of t is thus replaced by a randomly
selected value from his or her conditional distribution. Rubin (1987) proposed to repeat this
process several times so that the uncertainty associated with imputation could be quantified
by “multiple imputation”. For example, the average of multiple estimates of t, each computed
from a different set of plausible values, is a numerical approximation of #M of the above equa-
tion; the variance among them reflects uncertainly due to not observing >. It should be noted
that this variance does not include the variability of sampling from the population.
It cannot be emphasized too strongly that PV are not test scores for individuals in the usual
sense. PV are only intermediary computations for calculating integrals of the form of the
above equation to estimate population characteristics. When the underlying model is correct-
ly specified, PV will provide consistent estimates of population characteristics, even though
they are generally not unbiased estimates of the proficiencies of the individuals with whom
they are associated. The key idea lies in a contrast between PV and the more familiar ability
estimates of educational measurement that are in some sense optimal for each respondent
(e.g., ML estimates, which are consistent estimates of a respondent’s θ, and Bayes esti-
mates, which provide minimum mean-squared errors with respect to a reference population).
Point estimates that are optimal for individual respondents have distributions that can pro-
duce decidedly non-optimal (inconsistent) estimates of population characteristics (Little &
Rubin 1983). PV, on the other hand, are constructed explicitly to provide consistent esti-
FDZ-Methodenreport 10/2012 22
mates of population effects (for further discussion see Mislevy et al. 1992, Carstens &
Hastedt 2010).
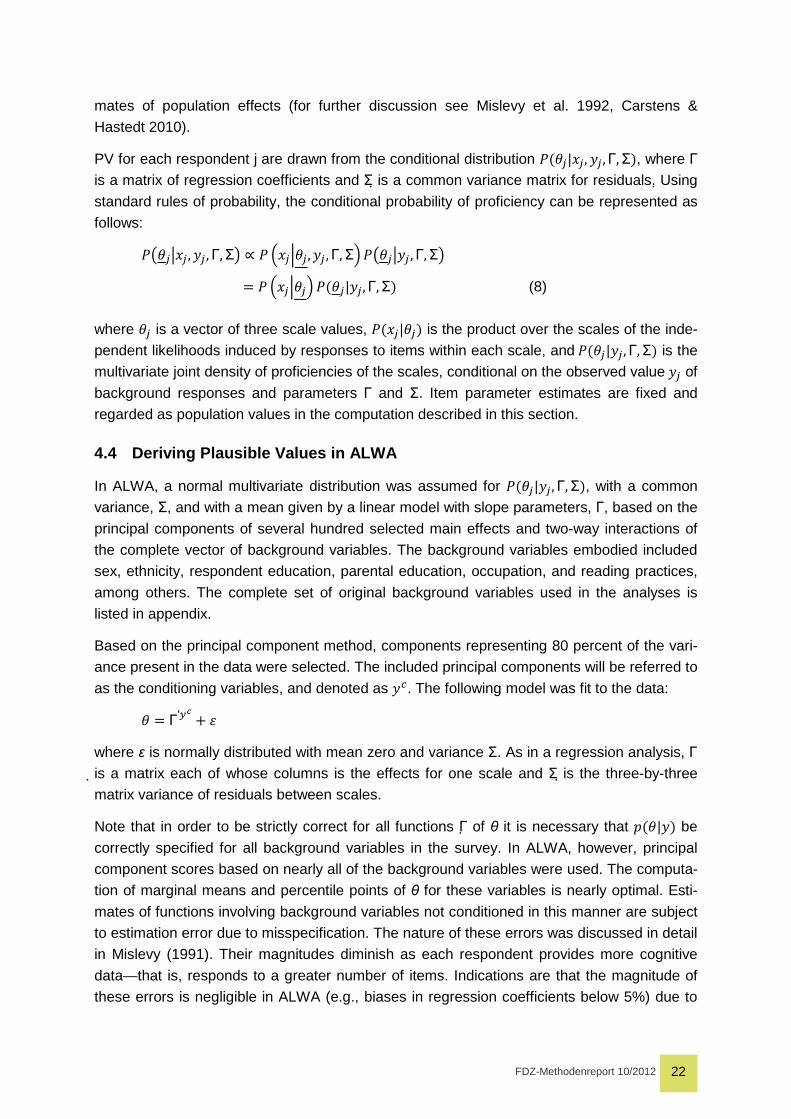
PV for each respondent j are drawn from the conditional distribution �E>�|<�, /�,Γ,ΣK, where Γ
is a matrix of regression coefficients and Σ is a common variance matrix for residuals. Using
standard rules of probability, the conditional probability of proficiency can be represented as
follows:
�;>�=<�, /� ,Γ,Σ? j � 2<�k>�, /� ,Γ,Σ4 �;>�=/� ,Γ,Σ?
� � 2<�k>�4 �E>�|/�,Γ,ΣK (8)
where >� is a vector of three scale values, �E<�|>�K is the product over the scales of the inde-
pendent likelihoods induced by responses to items within each scale, and �E>�|/�,Γ,ΣK is the
multivariate joint density of proficiencies of the scales, conditional on the observed value /� of
background responses and parameters Γ and Σ. Item parameter estimates are fixed and
regarded as population values in the computation described in this section.
4.4 Deriving Plausible Values in ALWA
In ALWA, a normal multivariate distribution was assumed for �E>�|/�,Γ,ΣK, with a common
variance, Σ, and with a mean given by a linear model with slope parameters, Γ, based on the
principal components of several hundred selected main effects and two-way interactions of
the complete vector of background variables. The background variables embodied included
sex, ethnicity, respondent education, parental education, occupation, and reading practices,
among others. The complete set of original background variables used in the analyses is
listed in appendix.
Based on the principal component method, components representing 80 percent of the vari-
ance present in the data were selected. The included principal components will be referred to
as the conditioning variables, and denoted as /l. The following model was fit to the data:
> � Γ′mn O o
where ε is normally distributed with mean zero and variance Σ. As in a regression analysis, Γ
is a matrix each of whose columns is the effects for one scale and Σ is the three-by-three
matrix variance of residuals between scales.
Note that in order to be strictly correct for all functions Γ of θ it is necessary that %E>|/K be
correctly specified for all background variables in the survey. In ALWA, however, principal
component scores based on nearly all of the background variables were used. The computa-
tion of marginal means and percentile points of θ for these variables is nearly optimal. Esti-
mates of functions involving background variables not conditioned in this manner are subject
to estimation error due to misspecification. The nature of these errors was discussed in detail
in Mislevy (1991). Their magnitudes diminish as each respondent provides more cognitive
data—that is, responds to a greater number of items. Indications are that the magnitude of
these errors is negligible in ALWA (e.g., biases in regression coefficients below 5%) due to
FDZ-Methodenreport 10/2012 23
the larger numbers of cognitive items presented to each respondent in the survey (30 items
for prose and 27 items for numeracy).
The exception is the sample of respondents who could not or did not proceed beyond the
background questions. These respondents did not attempt the assessment items due to re-
fusal to participate, physical or mental disability, or non-command of the German language. If
these respondents had been excluded from estimation, the proficiency scores of some sub-
populations in ALWA would have been severely overestimated. Detailed analyses of the pro-
ficiencies of these respondents, not surprisingly, may lead to unstable results; thus their es-
timates are not included in the provided data of ALWA-LiNu.
The basic method for estimating Γ and Σ with the EM procedure was described in Mislevy
(1985) for a single scale case. The EM algorithm requires the computation of the mean, θ
and variance, Σ, of the posterior distribution in (8). For the multiple scales of ALWA, the
computer program DGROUP (Sinharay & von Davier 2005) was used. The program imple-
mented a method to compute the moments using higher order asymptotic corrections to a
normal approximation. Case weights were employed in this step.
After completing the EM algorithm, PV are drawn in a three-step process from the joint distri-
bution of the values of Γ for all sampled respondents with more than four cognitive items at-
tempted. First, a value of Γ is drawn from a normal approximation to �EΓ, Σ|xs, ysK that fixes Σ
at the value ∑̀ (Thomas, 1993). Second, conditional on the generated value of Γ (and the
fixed value of ∑ � ∑̀), the mean θ, and variance Σ�u of the posterior distribution in equation (2)
are computed using the same methods applied in the EM algorithm. In the third step, θ is
drawn independently from a multivariate normal distribution with mean θ and variance Σ�u.
These three steps are repeated five times, producing five imputations of θ for each sampled
respondent.
For test participants with an insufficient number of responses, the Γ and Σ described in the
previous paragraph were fixed. Hence, all respondents—regardless of the number of items
attempted—were assigned a set of five PV for the two scales. This method correctly retains
the uncertainty associated with proficiency estimates for individual respondents by using mul-
tiple imputed proficiency values rather than assuming that this type of uncertainty is zero—a
more common practice. Retaining this component of uncertainty requires that additional
analysis procedures be used to estimate respondents’ proficiencies (see OECD 2009).
5 The quality of testing and scaling in the ALWA st udy
5.1 Pilot study results
Taken together, the items used in the ALWA pilot study represented the measurement
frameworks. But first, it was necessary to determine if there was any lack of comparability of
ALWA and ALL results, which would be indicated by deviations of pilot data from the existing
ALL item parameters. Many factors can cause such lack of comparability including transla-
FDZ-Methodenreport 10/2012 24
tion of items, scoring standard differences and poor scoring accuracy, as well as other un-
known reasons.
Following the methodology described in the previous section (4.4), the pilot data of 349 indi-
viduals who responded to at least one cognitive item were analyzed. It was found that over
90 per cent of item parameters fit well to the pilot data, indicating a comparability of infer-
ences could be achieved between ALWA and ALL. Five items with greater deviations from
ALL item parameters (b1q7, b1q8, b2q1, b2q10, b3q4) were reported to the ALWA manage-
ment, and the accuracy of translation, scoring and administration procedures were reviewed
and changed, when necessary.
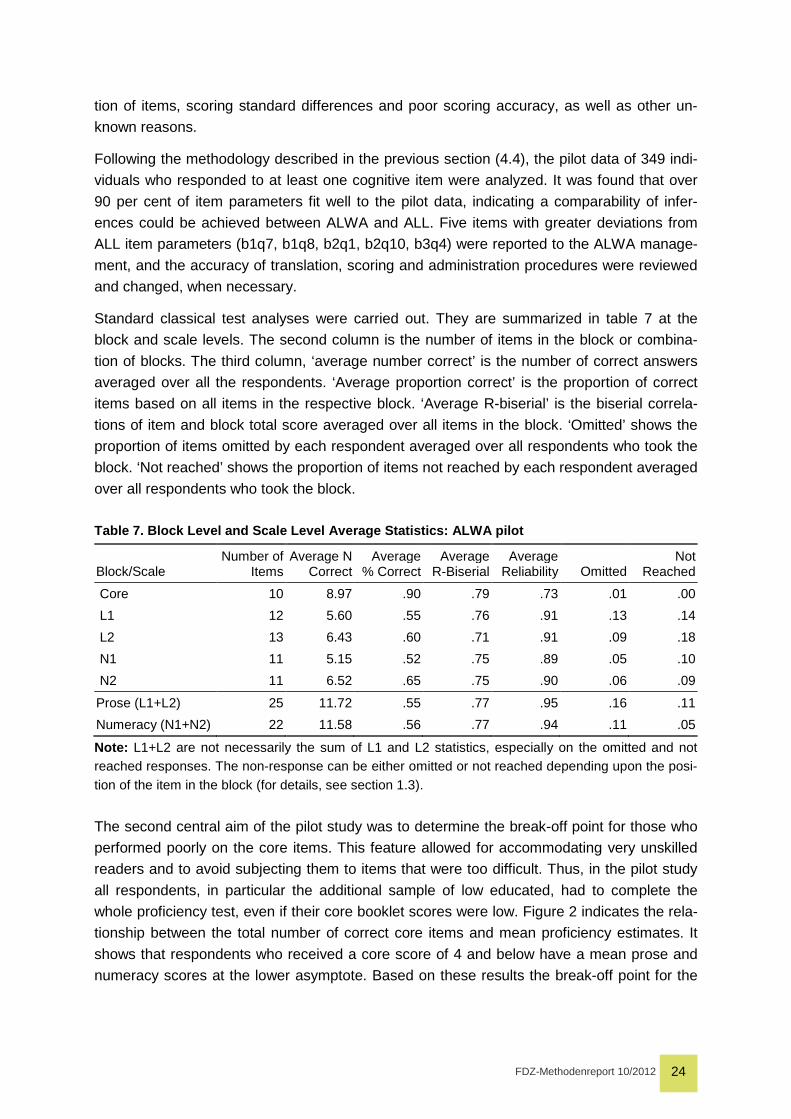
Standard classical test analyses were carried out. They are summarized in table 7 at the
block and scale levels. The second column is the number of items in the block or combina-
tion of blocks. The third column, ‘average number correct’ is the number of correct answers
averaged over all the respondents. ‘Average proportion correct’ is the proportion of correct
items based on all items in the respective block. ‘Average R-biserial’ is the biserial correla-
tions of item and block total score averaged over all items in the block. ‘Omitted’ shows the
proportion of items omitted by each respondent averaged over all respondents who took the
block. ‘Not reached’ shows the proportion of items not reached by each respondent averaged
over all respondents who took the block.
Table 7. Block Level and Scale Level Average Statis tics: ALWA pilot
Block/Scale Number of
Items Average N
Correct Average
% Correct Average
R-Biserial Average
Reliability Omitted Not
Reached
Core 10 8.97 .90 .79 .73 .01 .00
L1 12 5.60 .55 .76 .91 .13 .14
L2 13 6.43 .60 .71 .91 .09 .18
N1 11 5.15 .52 .75 .89 .05 .10
N2 11 6.52 .65 .75 .90 .06 .09
Prose (L1+L2) 25 11.72 .55 .77 .95 .16 .11
Numeracy (N1+N2) 22 11.58 .56 .77 .94 .11 .05
Note: L1+L2 are not necessarily the sum of L1 and L2 statistics, especially on the omitted and not reached responses. The non-response can be either omitted or not reached depending upon the posi-tion of the item in the block (for details, see section 1.3).
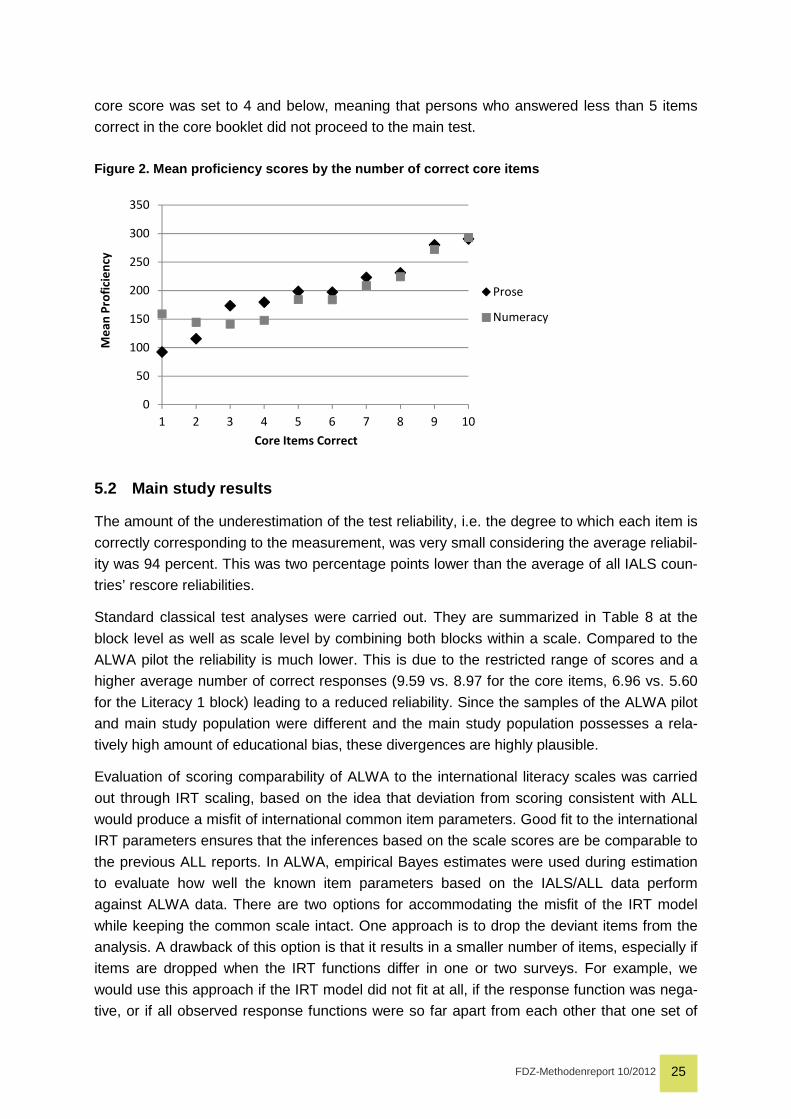
The second central aim of the pilot study was to determine the break-off point for those who
performed poorly on the core items. This feature allowed for accommodating very unskilled
readers and to avoid subjecting them to items that were too difficult. Thus, in the pilot study
all respondents, in particular the additional sample of low educated, had to complete the
whole proficiency test, even if their core booklet scores were low. Figure 2 indicates the rela-
tionship between the total number of correct core items and mean proficiency estimates. It
shows that respondents who received a core score of 4 and below have a mean prose and
numeracy scores at the lower asymptote. Based on these results the break-off point for the
FDZ-Methodenreport 10/2012 25
core score was set to 4 and below, meaning that persons who answered less than 5 items
correct in the core booklet did not proceed to the main test.
Figure 2. Mean proficiency scores by the number of correct core items
5.2 Main study results
The amount of the underestimation of the test reliability, i.e. the degree to which each item is
correctly corresponding to the measurement, was very small considering the average reliabil-
ity was 94 percent. This was two percentage points lower than the average of all IALS coun-
tries’ rescore reliabilities.
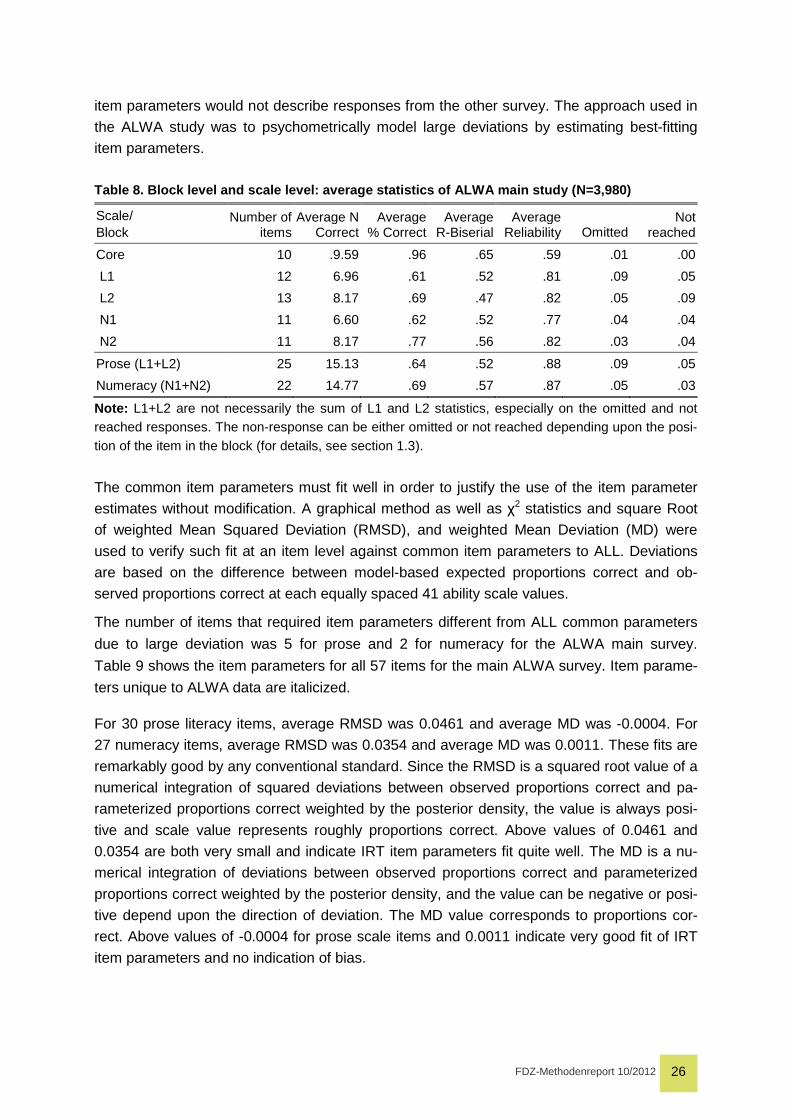
Standard classical test analyses were carried out. They are summarized in Table 8 at the
block level as well as scale level by combining both blocks within a scale. Compared to the
ALWA pilot the reliability is much lower. This is due to the restricted range of scores and a
higher average number of correct responses (9.59 vs. 8.97 for the core items, 6.96 vs. 5.60
for the Literacy 1 block) leading to a reduced reliability. Since the samples of the ALWA pilot
and main study population were different and the main study population possesses a rela-
tively high amount of educational bias, these divergences are highly plausible.
Evaluation of scoring comparability of ALWA to the international literacy scales was carried
out through IRT scaling, based on the idea that deviation from scoring consistent with ALL
would produce a misfit of international common item parameters. Good fit to the international
IRT parameters ensures that the inferences based on the scale scores are be comparable to
the previous ALL reports. In ALWA, empirical Bayes estimates were used during estimation
to evaluate how well the known item parameters based on the IALS/ALL data perform
against ALWA data. There are two options for accommodating the misfit of the IRT model
while keeping the common scale intact. One approach is to drop the deviant items from the
analysis. A drawback of this option is that it results in a smaller number of items, especially if
items are dropped when the IRT functions differ in one or two surveys. For example, we
would use this approach if the IRT model did not fit at all, if the response function was nega-
tive, or if all observed response functions were so far apart from each other that one set of
0
50
100
150
200
250
300
350
1 2 3 4 5 6 7 8 9 10
Me
an
Pro
fici
en
cy
Core Items Correct
Prose
Numeracy
FDZ-Methodenreport 10/2012 26
item parameters would not describe responses from the other survey. The approach used in
the ALWA study was to psychometrically model large deviations by estimating best-fitting
item parameters.
Table 8. Block level and scale level: average stati stics of ALWA main study (N=3,980)
Scale/ Block
Number of items
Average N Correct
Average % Correct
Average R-Biserial
Average Reliability Omitted
Not reached
Core 10 .9.59 .96 .65 .59 .01 .00
L1 12 6.96 .61 .52 .81 .09 .05
L2 13 8.17 .69 .47 .82 .05 .09
N1 11 6.60 .62 .52 .77 .04 .04
N2 11 8.17 .77 .56 .82 .03 .04
Prose (L1+L2) 25 15.13 .64 .52 .88 .09 .05
Numeracy (N1+N2) 22 14.77 .69 .57 .87 .05 .03
Note: L1+L2 are not necessarily the sum of L1 and L2 statistics, especially on the omitted and not reached responses. The non-response can be either omitted or not reached depending upon the posi-tion of the item in the block (for details, see section 1.3).
The common item parameters must fit well in order to justify the use of the item parameter
estimates without modification. A graphical method as well as χ2 statistics and square Root
of weighted Mean Squared Deviation (RMSD), and weighted Mean Deviation (MD) were
used to verify such fit at an item level against common item parameters to ALL. Deviations
are based on the difference between model-based expected proportions correct and ob-
served proportions correct at each equally spaced 41 ability scale values.
The number of items that required item parameters different from ALL common parameters
due to large deviation was 5 for prose and 2 for numeracy for the ALWA main survey.
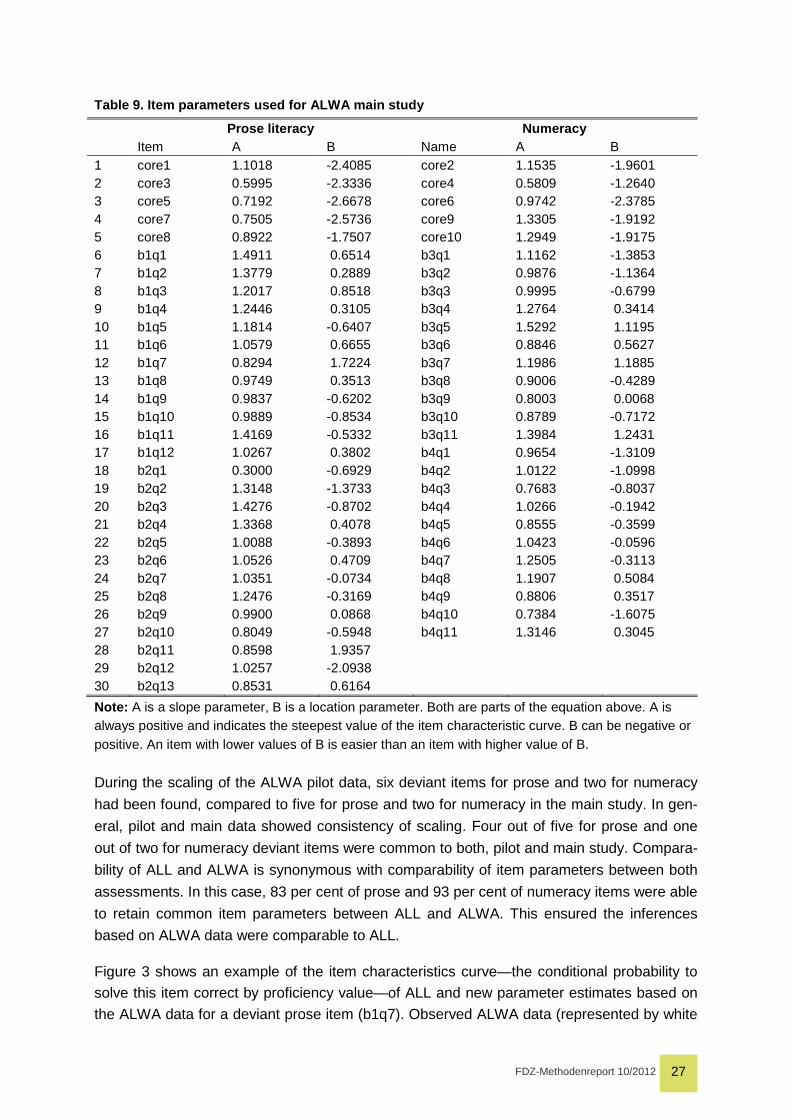
Table 9 shows the item parameters for all 57 items for the main ALWA survey. Item parame-
ters unique to ALWA data are italicized.
For 30 prose literacy items, average RMSD was 0.0461 and average MD was -0.0004. For
27 numeracy items, average RMSD was 0.0354 and average MD was 0.0011. These fits are
remarkably good by any conventional standard. Since the RMSD is a squared root value of a
numerical integration of squared deviations between observed proportions correct and pa-
rameterized proportions correct weighted by the posterior density, the value is always posi-
tive and scale value represents roughly proportions correct. Above values of 0.0461 and
0.0354 are both very small and indicate IRT item parameters fit quite well. The MD is a nu-
merical integration of deviations between observed proportions correct and parameterized
proportions correct weighted by the posterior density, and the value can be negative or posi-
tive depend upon the direction of deviation. The MD value corresponds to proportions cor-
rect. Above values of -0.0004 for prose scale items and 0.0011 indicate very good fit of IRT
item parameters and no indication of bias.
FDZ-Methodenreport 10/2012 27
Table 9. Item parameters used for ALWA main study
Prose literacy Numeracy Item A B Name A B 1 core1 1.1018 -2.4085 core2 1.1535 -1.9601 2 core3 0.5995 -2.3336 core4 0.5809 -1.2640 3 core5 0.7192 -2.6678 core6 0.9742 -2.3785 4 core7 0.7505 -2.5736 core9 1.3305 -1.9192 5 core8 0.8922 -1.7507 core10 1.2949 -1.9175 6 b1q1 1.4911 0.6514 b3q1 1.1162 -1.3853 7 b1q2 1.3779 0.2889 b3q2 0.9876 -1.1364 8 b1q3 1.2017 0.8518 b3q3 0.9995 -0.6799 9 b1q4 1.2446 0.3105 b3q4 1.2764 0.3414 10 b1q5 1.1814 -0.6407 b3q5 1.5292 1.1195 11 b1q6 1.0579 0.6655 b3q6 0.8846 0.5627 12 b1q7 0.8294 1.7224 b3q7 1.1986 1.1885 13 b1q8 0.9749 0.3513 b3q8 0.9006 -0.4289 14 b1q9 0.9837 -0.6202 b3q9 0.8003 0.0068 15 b1q10 0.9889 -0.8534 b3q10 0.8789 -0.7172 16 b1q11 1.4169 -0.5332 b3q11 1.3984 1.2431 17 b1q12 1.0267 0.3802 b4q1 0.9654 -1.3109 18 b2q1 0.3000 -0.6929 b4q2 1.0122 -1.0998 19 b2q2 1.3148 -1.3733 b4q3 0.7683 -0.8037 20 b2q3 1.4276 -0.8702 b4q4 1.0266 -0.1942 21 b2q4 1.3368 0.4078 b4q5 0.8555 -0.3599 22 b2q5 1.0088 -0.3893 b4q6 1.0423 -0.0596 23 b2q6 1.0526 0.4709 b4q7 1.2505 -0.3113 24 b2q7 1.0351 -0.0734 b4q8 1.1907 0.5084 25 b2q8 1.2476 -0.3169 b4q9 0.8806 0.3517 26 b2q9 0.9900 0.0868 b4q10 0.7384 -1.6075 27 b2q10 0.8049 -0.5948 b4q11 1.3146 0.3045 28 b2q11 0.8598 1.9357 29 b2q12 1.0257 -2.0938 30 b2q13 0.8531 0.6164
Note: A is a slope parameter, B is a location parameter. Both are parts of the equation above. A is always positive and indicates the steepest value of the item characteristic curve. B can be negative or positive. An item with lower values of B is easier than an item with higher value of B.
During the scaling of the ALWA pilot data, six deviant items for prose and two for numeracy
had been found, compared to five for prose and two for numeracy in the main study. In gen-
eral, pilot and main data showed consistency of scaling. Four out of five for prose and one
out of two for numeracy deviant items were common to both, pilot and main study. Compara-
bility of ALL and ALWA is synonymous with comparability of item parameters between both
assessments. In this case, 83 per cent of prose and 93 per cent of numeracy items were able
to retain common item parameters between ALL and ALWA. This ensured the inferences
based on ALWA data were comparable to ALL.
Figure 3 shows an example of the item characteristics curve—the conditional probability to
solve this item correct by proficiency value—of ALL and new parameter estimates based on
the ALWA data for a deviant prose item (b1q7). Observed ALWA data (represented by white
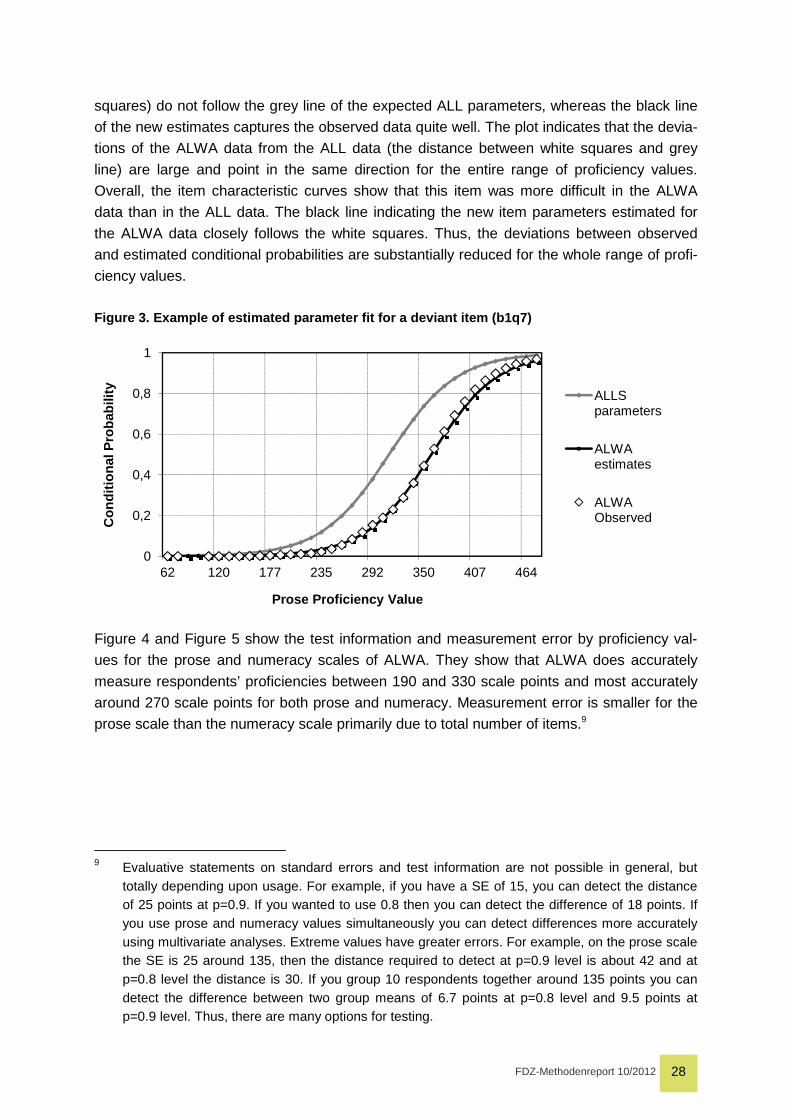
FDZ-Methodenreport 10/2012 28
squares) do not follow the grey line of the expected ALL parameters, whereas the black line
of the new estimates captures the observed data quite well. The plot indicates that the devia-
tions of the ALWA data from the ALL data (the distance between white squares and grey
line) are large and point in the same direction for the entire range of proficiency values.
Overall, the item characteristic curves show that this item was more difficult in the ALWA
data than in the ALL data. The black line indicating the new item parameters estimated for
the ALWA data closely follows the white squares. Thus, the deviations between observed
and estimated conditional probabilities are substantially reduced for the whole range of profi-
ciency values.
Figure 3. Example of estimated parameter fit for a deviant item (b1q7)
Figure 4 and Figure 5 show the test information and measurement error by proficiency val-
ues for the prose and numeracy scales of ALWA. They show that ALWA does accurately
measure respondents’ proficiencies between 190 and 330 scale points and most accurately
around 270 scale points for both prose and numeracy. Measurement error is smaller for the
prose scale than the numeracy scale primarily due to total number of items.9
9 Evaluative statements on standard errors and test information are not possible in general, but
totally depending upon usage. For example, if you have a SE of 15, you can detect the distance of 25 points at p=0.9. If you wanted to use 0.8 then you can detect the difference of 18 points. If you use prose and numeracy values simultaneously you can detect differences more accurately using multivariate analyses. Extreme values have greater errors. For example, on the prose scale the SE is 25 around 135, then the distance required to detect at p=0.9 level is about 42 and at p=0.8 level the distance is 30. If you group 10 respondents together around 135 points you can detect the difference between two group means of 6.7 points at p=0.8 level and 9.5 points at p=0.9 level. Thus, there are many options for testing.
0
0,2
0,4
0,6
0,8
1
62 120 177 235 292 350 407 464
Con
ditio
nal P
roba
bilit
y
Prose Proficiency Value
ALLS parameters
ALWA estimates
ALWA Observed
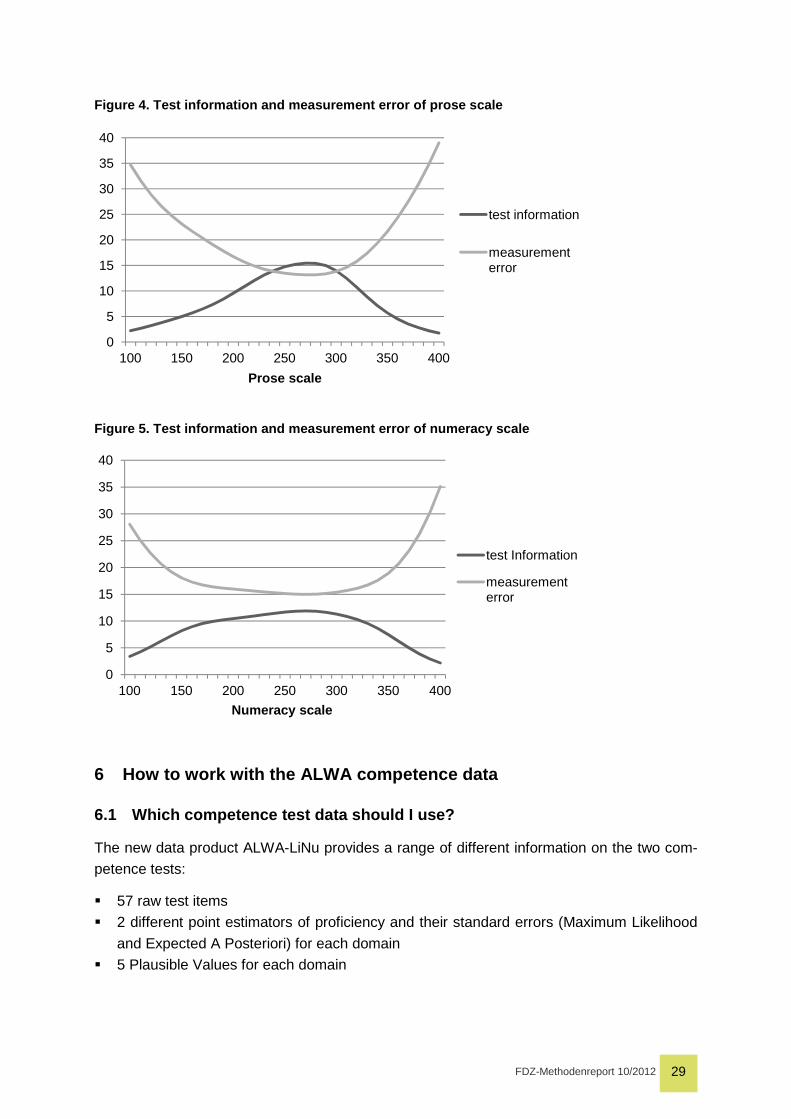
FDZ-Methodenreport 10/2012 29
Figure 4. Test information and measurement error of prose scale
Figure 5. Test information and measurement error of numeracy scale
6 How to work with the ALWA competence data
6.1 Which competence test data should I use?
The new data product ALWA-LiNu provides a range of different information on the two com-
petence tests:
� 57 raw test items
� 2 different point estimators of proficiency and their standard errors (Maximum Likelihood
and Expected A Posteriori) for each domain
� 5 Plausible Values for each domain
0
5
10
15
20
25
30
35
40
100 150 200 250 300 350 400
Prose scale
test information
measurement error
0
5
10
15
20
25
30
35
40
100 150 200 250 300 350 400
Numeracy scale
test Information
measurement error
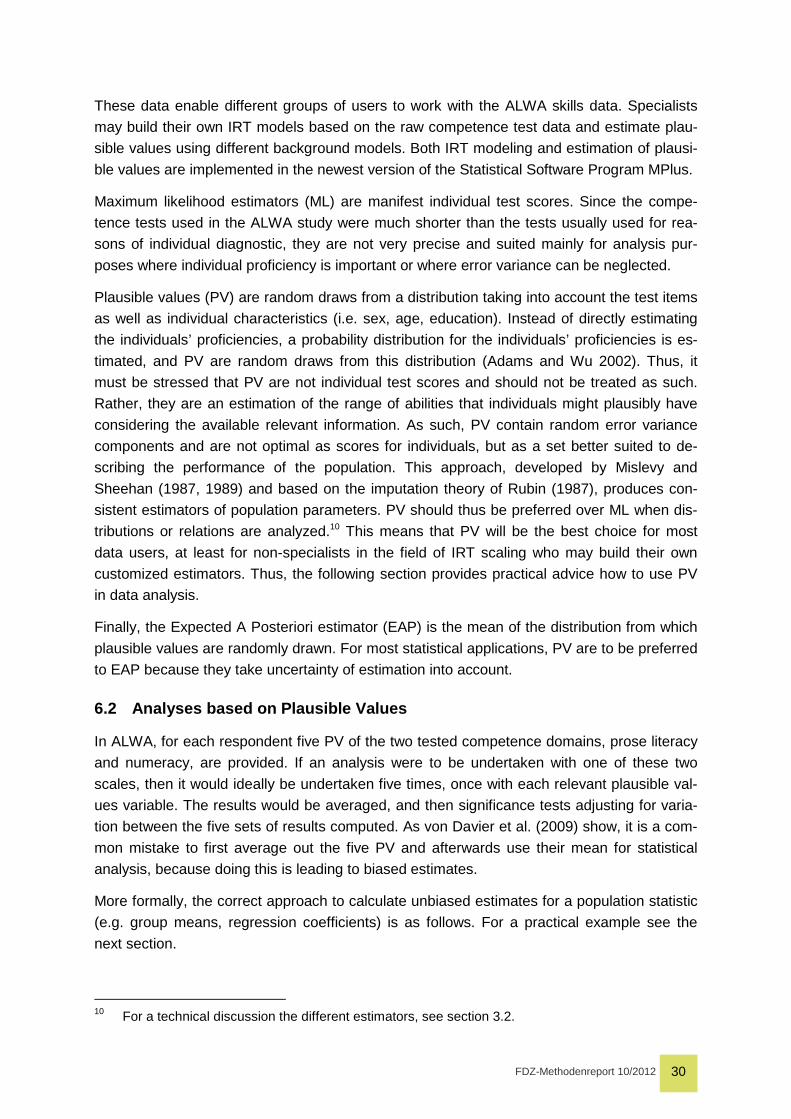
FDZ-Methodenreport 10/2012 30
These data enable different groups of users to work with the ALWA skills data. Specialists
may build their own IRT models based on the raw competence test data and estimate plau-
sible values using different background models. Both IRT modeling and estimation of plausi-
ble values are implemented in the newest version of the Statistical Software Program MPlus.
Maximum likelihood estimators (ML) are manifest individual test scores. Since the compe-
tence tests used in the ALWA study were much shorter than the tests usually used for rea-
sons of individual diagnostic, they are not very precise and suited mainly for analysis pur-
poses where individual proficiency is important or where error variance can be neglected.
Plausible values (PV) are random draws from a distribution taking into account the test items
as well as individual characteristics (i.e. sex, age, education). Instead of directly estimating
the individuals’ proficiencies, a probability distribution for the individuals’ proficiencies is es-
timated, and PV are random draws from this distribution (Adams and Wu 2002). Thus, it
must be stressed that PV are not individual test scores and should not be treated as such.
Rather, they are an estimation of the range of abilities that individuals might plausibly have
considering the available relevant information. As such, PV contain random error variance
components and are not optimal as scores for individuals, but as a set better suited to de-
scribing the performance of the population. This approach, developed by Mislevy and
Sheehan (1987, 1989) and based on the imputation theory of Rubin (1987), produces con-
sistent estimators of population parameters. PV should thus be preferred over ML when dis-
tributions or relations are analyzed.10 This means that PV will be the best choice for most
data users, at least for non-specialists in the field of IRT scaling who may build their own
customized estimators. Thus, the following section provides practical advice how to use PV
in data analysis.
Finally, the Expected A Posteriori estimator (EAP) is the mean of the distribution from which
plausible values are randomly drawn. For most statistical applications, PV are to be preferred
to EAP because they take uncertainty of estimation into account.
6.2 Analyses based on Plausible Values
In ALWA, for each respondent five PV of the two tested competence domains, prose literacy
and numeracy, are provided. If an analysis were to be undertaken with one of these two
scales, then it would ideally be undertaken five times, once with each relevant plausible val-
ues variable. The results would be averaged, and then significance tests adjusting for varia-
tion between the five sets of results computed. As von Davier et al. (2009) show, it is a com-
mon mistake to first average out the five PV and afterwards use their mean for statistical
analysis, because doing this is leading to biased estimates.
More formally, the correct approach to calculate unbiased estimates for a population statistic
(e.g. group means, regression coefficients) is as follows. For a practical example see the
next section.
10 For a technical discussion the different estimators, see section 3.2.
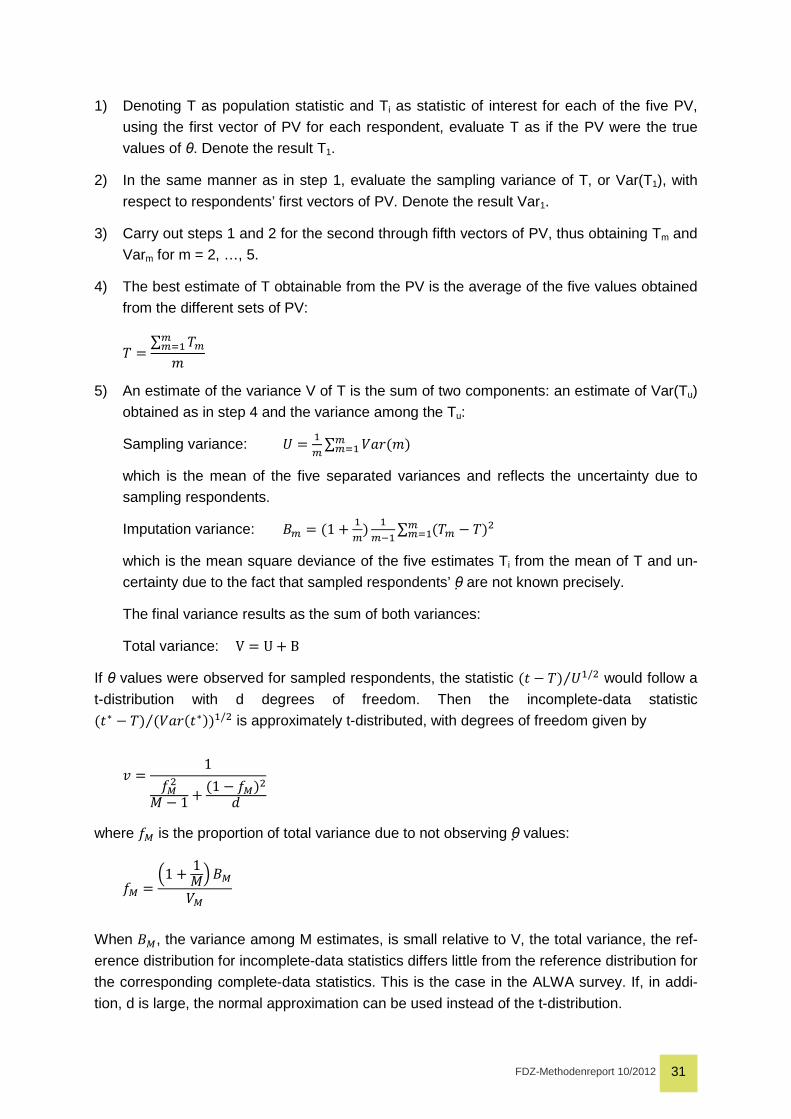
FDZ-Methodenreport 10/2012 31
1) Denoting T as population statistic and Ti as statistic of interest for each of the five PV,
using the first vector of PV for each respondent, evaluate T as if the PV were the true
values of θ. Denote the result T1.
2) In the same manner as in step 1, evaluate the sampling variance of T, or Var(T1), with
respect to respondents’ first vectors of PV. Denote the result Var1.
3) Carry out steps 1 and 2 for the second through fifth vectors of PV, thus obtaining Tm and
Varm for m = 2, …, 5.
4) The best estimate of T obtainable from the PV is the average of the five values obtained
from the different sets of PV:
v � ∑ v������
5) An estimate of the variance V of T is the sum of two components: an estimate of Var(Tu)
obtained as in step 4 and the variance among the Tu:
Sampling variance: + � �� ∑ w�&E�K����
which is the mean of the five separated variances and reflects the uncertainty due to
sampling respondents.
Imputation variance: f� � E1 O ��K �
�9� ∑ Ev� 1 vKx����
which is the mean square deviance of the five estimates Ti from the mean of T and un-
certainty due to the fact that sampled respondents’ θ� are not known precisely.
The final variance results as the sum of both variances:
Total variance: V � U O B
If θ values were observed for sampled respondents, the statistic E# 1 vK +�/x⁄ would follow a
t-distribution with d degrees of freedom. Then the incomplete-data statistic
E#M 1 vK Ew�&E#MKK�/x⁄ is approximately t-distributed, with degrees of freedom given by
| � 1.�xN 1 1 O E1 1 .�Kx
$
where .� is the proportion of total variance due to not observing θ� values:
.� � 21 O 1N4 f�w�
When f�, the variance among M estimates, is small relative to V, the total variance, the ref-
erence distribution for incomplete-data statistics differs little from the reference distribution for
the corresponding complete-data statistics. This is the case in the ALWA survey. If, in addi-
tion, d is large, the normal approximation can be used instead of the t-distribution.
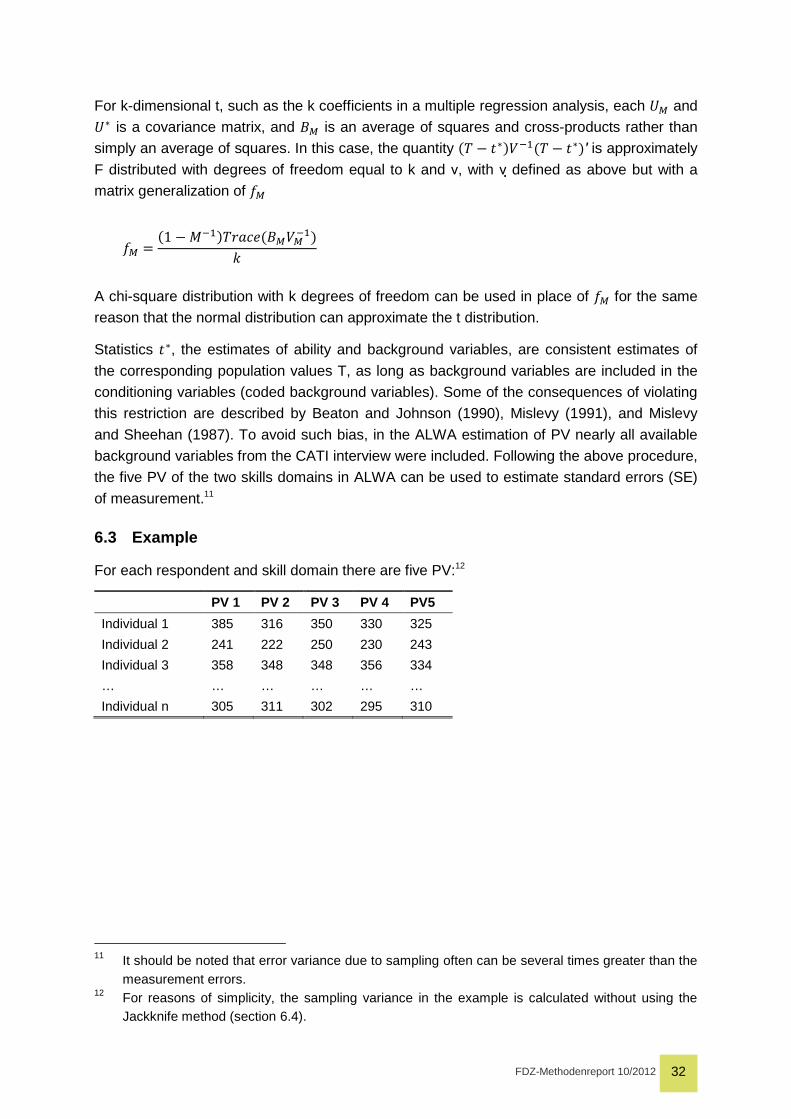
FDZ-Methodenreport 10/2012 32
For k-dimensional t, such as the k coefficients in a multiple regression analysis, each +� and
+M is a covariance matrix, and f� is an average of squares and cross-products rather than
simply an average of squares. In this case, the quantity Ev 1 #MKw9�Ev 1 #MK′ is approximately
F distributed with degrees of freedom equal to k and ν, with ν defined as above but with a
matrix generalization of .�
.� � E1 1 N9�Kv&�"!Ef�w�9�K}
A chi-square distribution with k degrees of freedom can be used in place of .� for the same
reason that the normal distribution can approximate the t distribution.
Statistics #M, the estimates of ability and background variables, are consistent estimates of
the corresponding population values T, as long as background variables are included in the
conditioning variables (coded background variables). Some of the consequences of violating
this restriction are described by Beaton and Johnson (1990), Mislevy (1991), and Mislevy
and Sheehan (1987). To avoid such bias, in the ALWA estimation of PV nearly all available
background variables from the CATI interview were included. Following the above procedure,
the five PV of the two skills domains in ALWA can be used to estimate standard errors (SE)
of measurement.11
6.3 Example
For each respondent and skill domain there are five PV:12
PV 1 PV 2 PV 3 PV 4 PV5
Individual 1 385 316 350 330 325
Individual 2 241 222 250 230 243
Individual 3 358 348 348 356 334
… … … … … …
Individual n 305 311 302 295 310
11 It should be noted that error variance due to sampling often can be several times greater than the
measurement errors. 12 For reasons of simplicity, the sampling variance in the example is calculated without using the
Jackknife method (section 6.4).
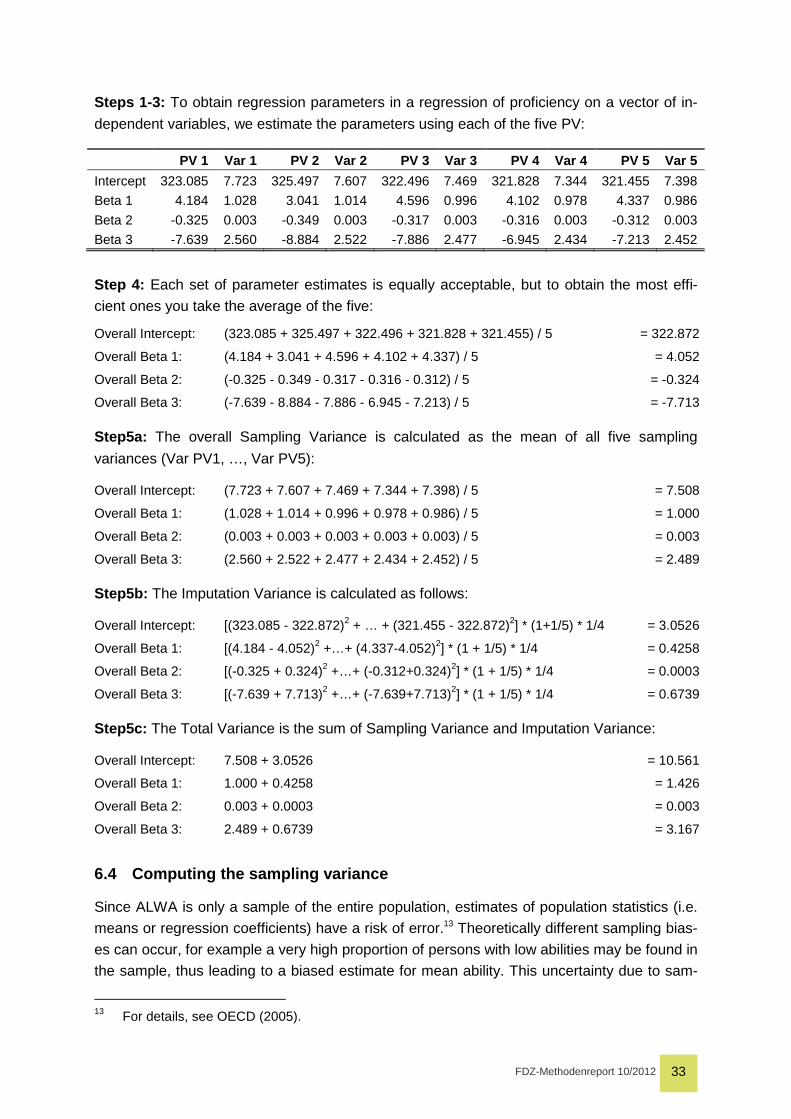
FDZ-Methodenreport 10/2012 33
Steps 1-3: To obtain regression parameters in a regression of proficiency on a vector of in-
dependent variables, we estimate the parameters using each of the five PV:
PV 1 Var 1 PV 2 Var 2 PV 3 Var 3 PV 4 Var 4 PV 5 Var 5
Intercept 323.085 7.723 325.497 7.607 322.496 7.469 321.828 7.344 321.455 7.398
Beta 1 4.184 1.028 3.041 1.014 4.596 0.996 4.102 0.978 4.337 0.986
Beta 2 -0.325 0.003 -0.349 0.003 -0.317 0.003 -0.316 0.003 -0.312 0.003
Beta 3 -7.639 2.560 -8.884 2.522 -7.886 2.477 -6.945 2.434 -7.213 2.452
Step 4: Each set of parameter estimates is equally acceptable, but to obtain the most effi-
cient ones you take the average of the five:
Overall Intercept: (323.085 + 325.497 + 322.496 + 321.828 + 321.455) / 5 = 322.872
Overall Beta 1: (4.184 + 3.041 + 4.596 + 4.102 + 4.337) / 5 = 4.052
Overall Beta 2: (-0.325 - 0.349 - 0.317 - 0.316 - 0.312) / 5 = -0.324
Overall Beta 3: (-7.639 - 8.884 - 7.886 - 6.945 - 7.213) / 5 = -7.713
Step5a: The overall Sampling Variance is calculated as the mean of all five sampling
variances (Var PV1, …, Var PV5):
Overall Intercept: (7.723 + 7.607 + 7.469 + 7.344 + 7.398) / 5 = 7.508
Overall Beta 1: (1.028 + 1.014 + 0.996 + 0.978 + 0.986) / 5 = 1.000
Overall Beta 2: (0.003 + 0.003 + 0.003 + 0.003 + 0.003) / 5 = 0.003
Overall Beta 3: (2.560 + 2.522 + 2.477 + 2.434 + 2.452) / 5 = 2.489
Step5b: The Imputation Variance is calculated as follows:
Overall Intercept: [(323.085 - 322.872)2 + … + (321.455 - 322.872)2] * (1+1/5) * 1/4 = 3.0526
Overall Beta 1: [(4.184 - 4.052)2 +…+ (4.337-4.052)2] * (1 + 1/5) * 1/4 = 0.4258
Overall Beta 2: [(-0.325 + 0.324)2 +…+ (-0.312+0.324)2] * (1 + 1/5) * 1/4 = 0.0003
Overall Beta 3: [(-7.639 + 7.713)2 +…+ (-7.639+7.713)2] * (1 + 1/5) * 1/4 = 0.6739
Step5c: The Total Variance is the sum of Sampling Variance and Imputation Variance:
Overall Intercept: 7.508 + 3.0526 = 10.561
Overall Beta 1: 1.000 + 0.4258 = 1.426
Overall Beta 2: 0.003 + 0.0003 = 0.003
Overall Beta 3: 2.489 + 0.6739 = 3.167
6.4 Computing the sampling variance
Since ALWA is only a sample of the entire population, estimates of population statistics (i.e.
means or regression coefficients) have a risk of error.13 Theoretically different sampling bias-
es can occur, for example a very high proportion of persons with low abilities may be found in
the sample, thus leading to a biased estimate for mean ability. This uncertainty due to sam-
13 For details, see OECD (2005).
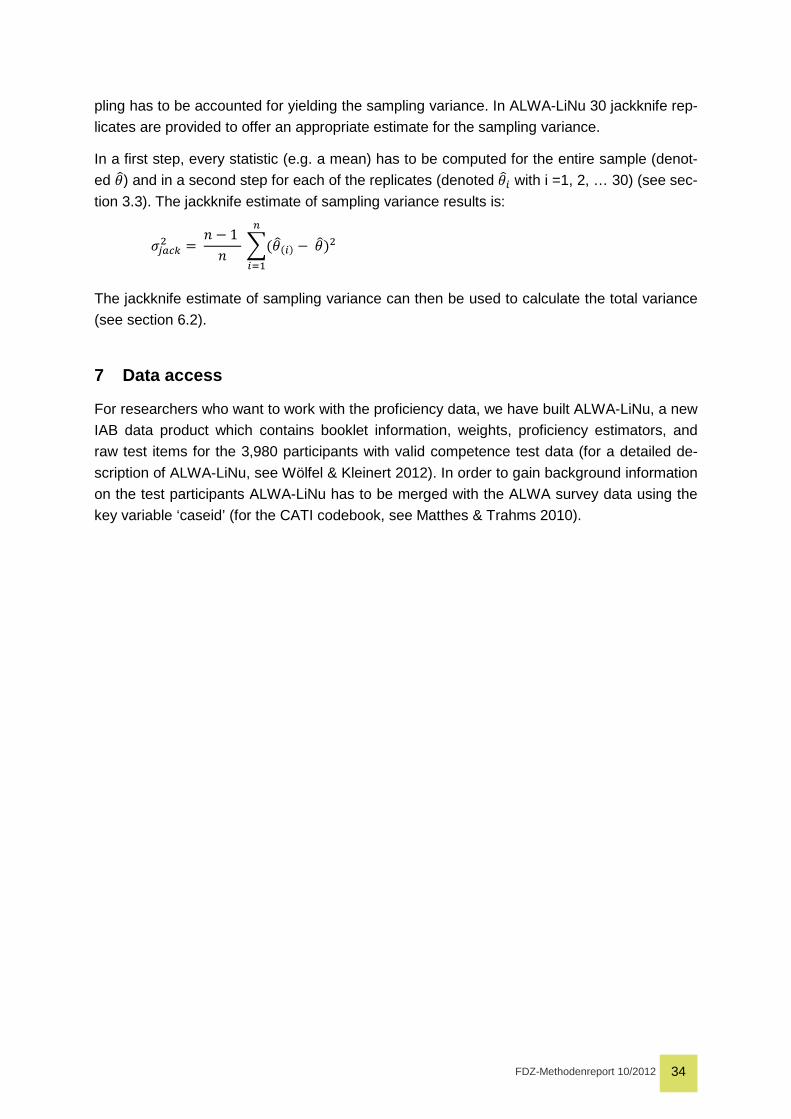
FDZ-Methodenreport 10/2012 34
pling has to be accounted for yielding the sampling variance. In ALWA-LiNu 30 jackknife rep-
licates are provided to offer an appropriate estimate for the sampling variance.
In a first step, every statistic (e.g. a mean) has to be computed for the entire sample (denot-
ed >~) and in a second step for each of the replicates (denoted >~� with i =1, 2, … 30) (see sec-
tion 3.3). The jackknife estimate of sampling variance results is:
��0l]x � � 1 1 � �E>~E�K 1 >~Kx
U
���
The jackknife estimate of sampling variance can then be used to calculate the total variance
(see section 6.2).
7 Data access
For researchers who want to work with the proficiency data, we have built ALWA-LiNu, a new
IAB data product which contains booklet information, weights, proficiency estimators, and
raw test items for the 3,980 participants with valid competence test data (for a detailed de-
scription of ALWA-LiNu, see Wölfel & Kleinert 2012). In order to gain background information
on the test participants ALWA-LiNu has to be merged with the ALWA survey data using the
key variable ‘caseid’ (for the CATI codebook, see Matthes & Trahms 2010).
FDZ-Methodenreport 10/2012 35
References
Adams, R. & Wu, M. (2002). PISA 2000 Technical Report. Paris: OECD.
Antoni, M., Drasch, K., Kleinert, C., Matthes, B., Ruland, M., & Trahms, A. (2010). Working and learning in a changing world. Part I: Overview of the study. FDZ Methodenreport 05/2010. Nürnberg: IAB.
Beaton, A. E., & Johnson, E. G. (1990). The average response method of scaling. Journal of Educational Statistics, 15, 9-38.
Benjamini, Y. & Hochberg, Y. (1995) Controlling the false discovery rate: a practical and powerful approach to multiple testing. J. Roy. Statist. Soc. Ser. B, 57, 289-300.
Birnbaum, A. (1968). Some latent trait models and their use in inferring an examinee's ability. In: F. M. Lord & M. R. Novick (Eds.), Statistical theories of mental test scores. Reading, Mass.: Addison-Wesley Publishing.
Carstens, R. & Hastedt, D. (2010). The effect of not using plausible values when they should be: an illustration using TIMMS 2007 grade 8 mathematics data. International Research Con-ference 2010.
Chen, S-K., Hou, L. & Dodd, B. (1998). A Comparison of Maximum Likelihood Estimation and Expected a Posteriori Estimation in CAT Using the Partial Credit Model. Educational and Psychological Measurement, 58 (4), 569-95.
Cohen, J. (1988). Statistical power analysis for the behavioral sciences (2nd ed.). Hillsdale, NJ: Lawrence Erlbaum Associates.
von Davier, M., Gonzalez, E., & Mislevy, R.J. (2009). What are plausible values and why are they useful? IERI Monograph Series. Issues and Methodologies in Large-Scale Assess-ments, Vol. 2, 9-36.
von Davier, M. & Sinharay, S. (2010). Stochastic approximation methods for latent regres-sion Item Response Models. Journal of Educational and Behavioral Statistics, 35 (2), 174-93.
von Davier, M., Sinharay, S., Oranje, A. & Beaton, A. (2006). Statistical procedures used in the National Assessment of Educational Progress (NAEP): Recent developments and future directions. In C. R. Rao & S. Sinharay (Eds.), Handbook of statistics: 26. Psychometrics. Amsterdam: Elsevier.
Gilberg, R., Hess, D., Prussog-Wagner, A., Steinwede, A. (2011): Arbeiten und Lernen im Wandel. Teil III: Methodenbericht. FDZ Methodenreport 10/2011. Nürnberg: IAB.
Hochberg, Y. (1988). A sharper Bonferroni procedure for multiple tests of significance. Biometrika, 75: 800-2.
Johnson, E. G. & Rust, K. F. (1992). Population inferences and variance estimation for NAEP data. Journal of Educational Statistics, 17, 175-90.
Kleinert, C., Ruland, M. & Trahms, A. (2013). FDZ Methodenreport, forthcoming. Nürnberg: IAB.
Little, R. J. A. & Rubin, D. B. (1983). On jointly estimating parameters and missing data. American Statistician, 37, 218-20.
Lord, F. M. (1980). Applications of item response theory to practical testing problems. Hills-dale, NJ: Erlbaum Associates.
FDZ-Methodenreport 10/2012 36
Matthes, B. & Trahms, A. (2010). Working and Learning in a Changing World. Part II: Code-book. FDZ Datenreport 02/2010. Nürnberg: IAB.
Mislevy, R. J. (1985). Estimation of latent group effects. Journal of the American Statistical Association, 80, 993-97.
Mislevy, R.J. (1990). Scaling procedures. In E.G. Johnson & R. Zwick (Eds.), Focusing the new design: the NAEP 1988 technical report (No. 19-TR-20). Princeton, NJ: National As-sessment of Educational Progress, Educational Testing Service.
Mislevy, R.J. (1991). Randomization-based inference about latent variables from complex samples. Psychometrika, 56, 177-96.
Mislevy, R.J., Beaton, A., Kaplan, B.A. & Sheehan, K. (1992). Estimating population charac-teristics from sparse matrix samples of item responses. Journal of Educational Measure-ment, 29 (2), 133-61.
Mislevy, R. J. & Bock, R. D. (1982). BILOG: Item analysis and test scoring with binary logistic models [Computer program]. Morresville, IN: Scientific Software.
Mislevy, R. J. & Sheehan, K. (1987). Marginal estimation procedures. In A. E. Beaton (Ed.), Implementing the new design: The NAEP 1983-84 technical report (pp. 293-360). Princeton, NJ: Educational Testing Service, National Assessment of Educational Progress.
OECD (2005). PISA 2003 Data Analysis Manual: SAS Users. Paris: OECD.
OECD (2009). PISA DATA Analysis Manual SPSS (2nd ed.). Paris: OECD.
Rubin, D. B. (1987). Multiple imputation for nonresponse in surveys. New York: John Wiley.
Sinharay, S., & von Davier, M. (2005). Extension of NAEP BGROUP program to higher di-mensions (ETS Research Rep. No., RR-05-27). Princeton, NJ: Educational Testing Service.
Statistics Canada & OECD (2005). Learning A Living. First Results of the Adult Literacy and Life Skills Survey. Ottawa, Paris: OECD Publications.
Thomas, N. (1993). Asymptotic corrections for multivariate posterior moments with factored likelihood functions. Journal of Computations and Graphical Statistics, 2, 309-22.
Wingersky, M, Kaplan, B. A., & Beaton, A. E. (1987). Joint estimation procedures. In A. E. Beaton (Ed.), Implementing the new design: The NAEP 1983-84 technical report (pp. 285-92). Princeton, NJ: Educational Testing Service, National Assessment of Educational Pro-gress.
Wölfel, O. & Kleinert, C. (2012). Working and Learning in a Changing World. Part VII: Code-book of the ALWA literacy and numeracy data (ALWA-LiNu). FDZ Datenreport 05/2012. Nürnberg: IAB.
Yamamoto, K. (1998). Scoring, scaling, and statistical models for proficiency estimation of the IALS. International Adult Literacy Survey Technical Report. Ottawa, Canada: Statistics Canada.
Yamamoto, K & Kirsch, I. (1998). Estimating literacy proficiencies with and without cognitive data of IALS. International Adult Literacy Survey Technical Report. Ottawa, Canada: Statis-tics Canada.
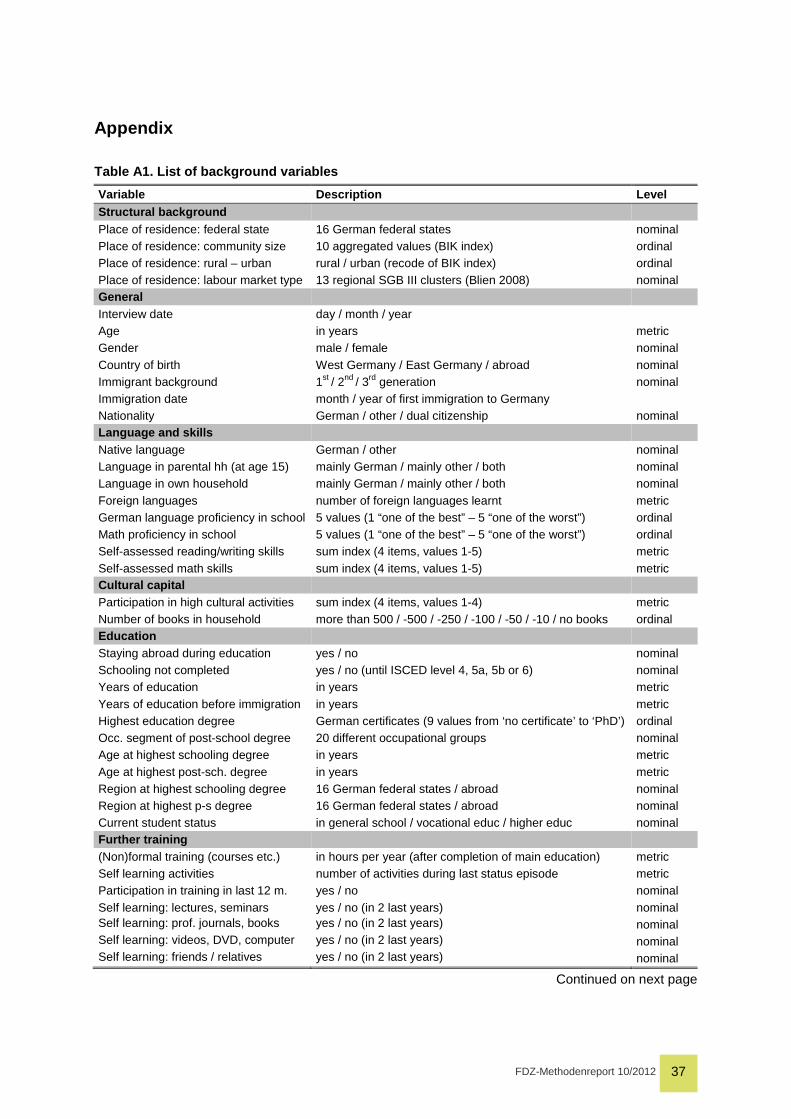
FDZ-Methodenreport 10/2012 37
Appendix
Table A1. List of background variables
Variable Description Level Structural background Place of residence: federal state 16 German federal states nominal Place of residence: community size 10 aggregated values (BIK index) ordinal Place of residence: rural – urban rural / urban (recode of BIK index) ordinal Place of residence: labour market type 13 regional SGB III clusters (Blien 2008) nominal General Interview date day / month / year Age in years metric Gender male / female nominal Country of birth West Germany / East Germany / abroad nominal Immigrant background 1st / 2nd / 3rd generation nominal Immigration date month / year of first immigration to Germany Nationality German / other / dual citizenship nominal Language and skills Native language German / other nominal Language in parental hh (at age 15) mainly German / mainly other / both nominal Language in own household mainly German / mainly other / both nominal Foreign languages number of foreign languages learnt metric German language proficiency in school 5 values (1 “one of the best” – 5 “one of the worst”) ordinal Math proficiency in school 5 values (1 “one of the best” – 5 “one of the worst”) ordinal Self-assessed reading/writing skills sum index (4 items, values 1-5) metric Self-assessed math skills sum index (4 items, values 1-5) metric Cultural capital Participation in high cultural activities sum index (4 items, values 1-4) metric Number of books in household more than 500 / -500 / -250 / -100 / -50 / -10 / no books ordinal Education Staying abroad during education yes / no nominal Schooling not completed yes / no (until ISCED level 4, 5a, 5b or 6) nominal Years of education in years metric Years of education before immigration in years metric Highest education degree German certificates (9 values from ‘no certificate’ to ‘PhD’) ordinal Occ. segment of post-school degree 20 different occupational groups nominal Age at highest schooling degree in years metric Age at highest post-sch. degree in years metric Region at highest schooling degree 16 German federal states / abroad nominal Region at highest p-s degree 16 German federal states / abroad nominal Current student status in general school / vocational educ / higher educ nominal Further training (Non)formal training (courses etc.) in hours per year (after completion of main education) metric Self learning activities number of activities during last status episode metric Participation in training in last 12 m. yes / no nominal Self learning: lectures, seminars yes / no (in 2 last years) nominal Self learning: prof. journals, books yes / no (in 2 last years) nominal Self learning: videos, DVD, computer yes / no (in 2 last years) nominal Self learning: friends / relatives yes / no (in 2 last years) nominal
Continued on next page
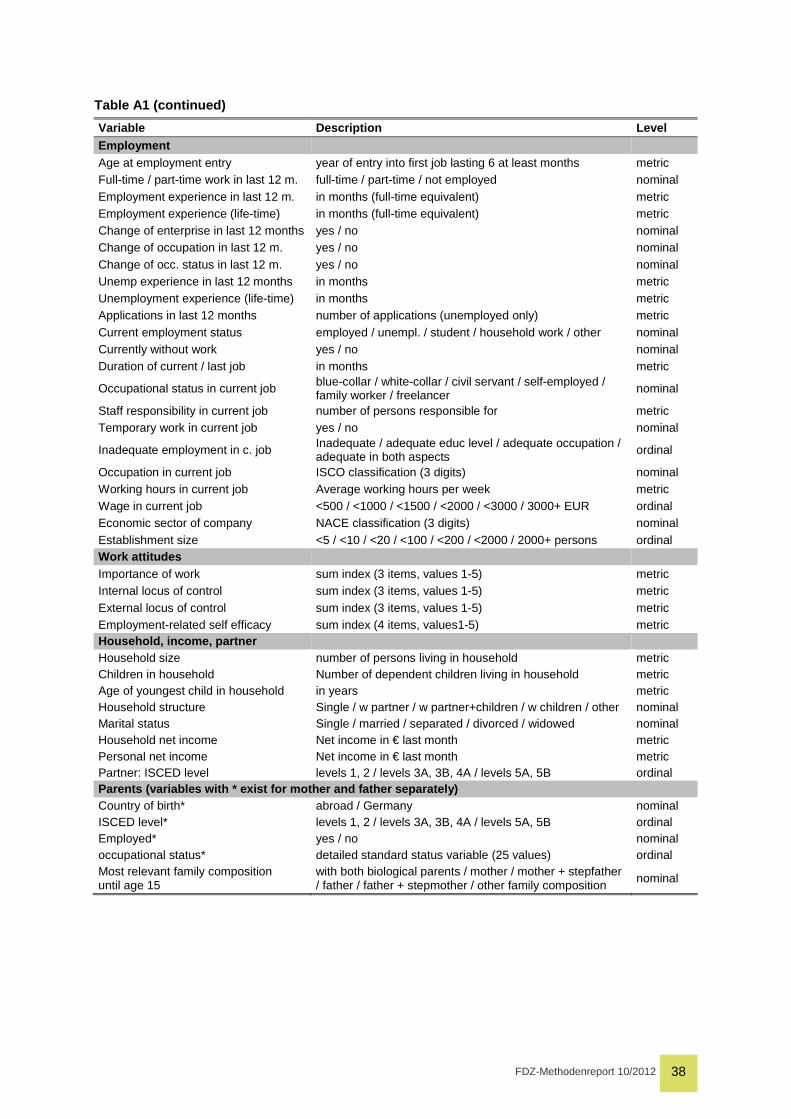
FDZ-Methodenreport 10/2012 38
Table A1 (continued)
Variable Description Level Employment Age at employment entry year of entry into first job lasting 6 at least months metric Full-time / part-time work in last 12 m. full-time / part-time / not employed nominal Employment experience in last 12 m. in months (full-time equivalent) metric Employment experience (life-time) in months (full-time equivalent) metric Change of enterprise in last 12 months yes / no nominal Change of occupation in last 12 m. yes / no nominal Change of occ. status in last 12 m. yes / no nominal Unemp experience in last 12 months in months metric Unemployment experience (life-time) in months metric Applications in last 12 months number of applications (unemployed only) metric Current employment status employed / unempl. / student / household work / other nominal Currently without work yes / no nominal Duration of current / last job in months metric
Occupational status in current job blue-collar / white-collar / civil servant / self-employed / family worker / freelancer nominal
Staff responsibility in current job number of persons responsible for metric Temporary work in current job yes / no nominal
Inadequate employment in c. job Inadequate / adequate educ level / adequate occupation / adequate in both aspects ordinal
Occupation in current job ISCO classification (3 digits) nominal Working hours in current job Average working hours per week metric Wage in current job <500 / <1000 / <1500 / <2000 / <3000 / 3000+ EUR ordinal Economic sector of company NACE classification (3 digits) nominal Establishment size <5 / <10 / <20 / <100 / <200 / <2000 / 2000+ persons ordinal Work attitudes Importance of work sum index (3 items, values 1-5) metric Internal locus of control sum index (3 items, values 1-5) metric External locus of control sum index (3 items, values 1-5) metric Employment-related self efficacy sum index (4 items, values1-5) metric Household, income, partner Household size number of persons living in household metric Children in household Number of dependent children living in household metric Age of youngest child in household in years metric Household structure Single / w partner / w partner+children / w children / other nominal Marital status Single / married / separated / divorced / widowed nominal Household net income Net income in € last month metric Personal net income Net income in € last month metric Partner: ISCED level levels 1, 2 / levels 3A, 3B, 4A / levels 5A, 5B ordinal Parents (variables with * exist for mother and fath er separately) Country of birth* abroad / Germany nominal ISCED level* levels 1, 2 / levels 3A, 3B, 4A / levels 5A, 5B ordinal Employed* yes / no nominal occupational status* detailed standard status variable (25 values) ordinal Most relevant family composition until age 15
with both biological parents / mother / mother + stepfather / father / father + stepmother / other family composition
nominal
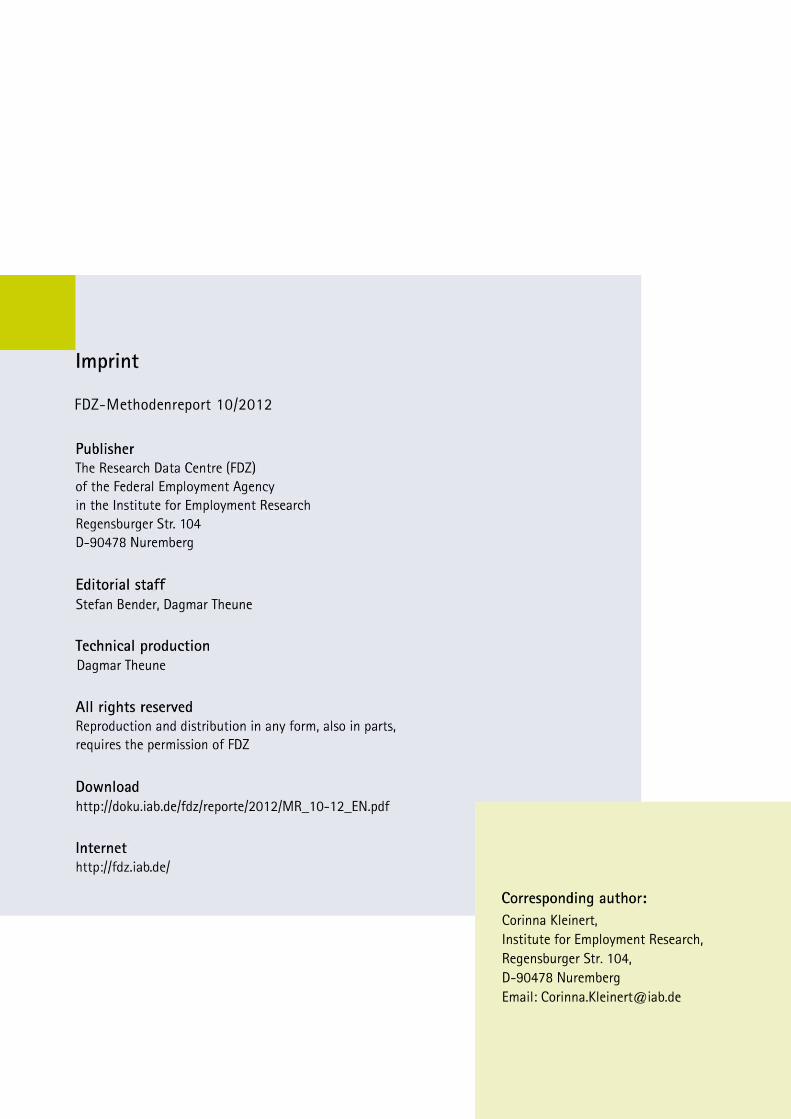
01/2009
FDZ-Methodenreport 10/2012
Stefan Bender, Dagmar Theune
Dagmar Theune
http://doku.iab.de/fdz/reporte/2012/MR_10-12_EN.pdf
Corinna Kleinert,
Institute for Employment Research,
Regensburger Str. 104,
D-90478 Nuremberg
Email: [email protected]


