
HAL Id: hal-02446972https://hal.archives-ouvertes.fr/hal-02446972
Submitted on 21 Jan 2020
HAL is a multi-disciplinary open accessarchive for the deposit and dissemination of sci-entific research documents, whether they are pub-lished or not. The documents may come fromteaching and research institutions in France orabroad, or from public or private research centers.
L’archive ouverte pluridisciplinaire HAL, estdestinée au dépôt et à la diffusion de documentsscientifiques de niveau recherche, publiés ou non,émanant des établissements d’enseignement et derecherche français ou étrangers, des laboratoirespublics ou privés.
Fear Not For Man ? Armed conflict and social capital inMali
Thomas Calvo, Emmanuelle Lavallée, Mireille Razafindrakoto, FrançoisRoubaud
To cite this version:Thomas Calvo, Emmanuelle Lavallée, Mireille Razafindrakoto, François Roubaud. Fear Not ForMan ? Armed conflict and social capital in Mali. Journal of Comparative Economics, 2019,�10.1016/j.jce.2019.11.005�. �hal-02446972�

UMR LEDa
Place du Maréchal de Lattre de Tassigny 75775 • Paris •Tél. (33) 01 44 05 45 42 • Fax (33) 01 44 05 45 45
DIAL • 4, rue d’Enghien • 75010 Paris • Tél. (33) 01 53 24 14 50 • Fax (33) 01 53 24 14 51
E-mail : [email protected] • Site : dial.ird.fr
DOCUMENT DE TRAVAIL DT/2019-10
DT/2016/11
Fear Not For Man? Armed conflict and social capital in
Mali
Health Shocks and Permanent Income Loss: the Household Business Channel
Thomas CALVO
Emmanuelle LAVALLEE
Mireille RAZANFINDRAKOTO
François ROUBAUD
Axel Demenet
Fear Not For Man?†
Armed conflict and social capital in Mali‡ §
Thomas Calvoa,∗, Emmanuelle Lavalleea, Mireille Razafindrakotob,a, Francois Roubaudb,a
aDIAL, LEDa, IRD, CNRS, Universite Paris-Dauphine, Universite PSL, 75016 Paris, FrancebIRD, 75010 Paris, France
Abstract
This paper studies the effects of armed conflict on social capital in Mali, where a violent conflict has been
raging since 2012. We examine the conflict’s impacts on associational membership using event location data
and unique survey data on governance, peace and security (GPS-SHaSA). We show that, in conflict-exposed
areas, adult involvement in associations increases from 7 to 14 percentage points. Instrumental variable and
difference-in-differences strategies complementary mitigate reverse causation and omitted variable biases as
estimated results remain very consistent. Robust estimations constrained to non-migrants samples also rule
out selection into migration. Yet this result, consistent with the argument that armed conflict cultivates
social engagement, is not a positive outcome in the case of Mali. The increase is observed solely for family
and political associations, which are comparatively inward-looking and act as interest groups. We interpret
this finding as a form of withdrawal behind group or community boundaries, an interpretation supported by
further analysis of interpersonal trust. This sort of withdrawal may exacerbate ethnic divisions and deepen
the conflict.
Keywords: Social capital; Conflict; Participation; Trust; Mali
JEL classification: D71, F51, O12, Z13
†Title from a 1977 song and album by Fela Kuti who fiercely opposed the Nigerian army.‡This Working Paper is a pre-print version of T. Calvo, E. Lavallee, M. Razafindrakoto F. Roubaud (2019): “Fear Not
For Man? Armed conflict and social capital in Mali”. Journal of Comparative Economics, Forthecoming, available online at:https://doi.org/10.1016/j.jce.2019.11.005.§We would like to thank Antoine Pietri, Lisa Chauvet, Marion Mercier, Philip Verwimp, Tillman Bruck, Delphine Boutin,
Siyavash Eslami Loutij, Marin Ferry, Marc Raffinot, Philippe Bocquier, Pedro Vicente and Mathieu Couttenier for theirvery useful comments. We would also like to thank all participants at the Defense-conflict economics workshop, the 4th DIALconference, the 13th HiCN Workshop, the 2017 CSAE conference and the 2017 EPCS conference. We thank the two anonymousreferees for their comments from which we benefited a lot.∗Corresponding author.Email addresses: [email protected] (Thomas Calvo), [email protected] (Emmanuelle Lavallee),
[email protected] (Mireille Razafindrakoto), [email protected] (Francois Roubaud)
1. Introduction
Terrorism and armed conflicts have become a major concern in recent years as they increasingly challenge
individual, local and regional development around the globe. In addition to the destruction of physical capital
and human losses, these events have adverse short- and long-term repercussions on economic outcomes
(Abadie and Gardeazabal, 2003; Collier et al., 2003; Gaibulloev and Sandler, 2009). There is still an open
question about the channels through which armed conflicts impact economic development. The role of
social capital warrants particular attention in this respect.1 Indeed, it can positively influence development
outcomes, especially in areas with market failure, weak formal institutions and scarce public goods (Woolcock
and Narayan, 2000). Social capital connects individuals, facilitates collective action and plays a substantial
role in the provision of public goods in these areas (Putnam et al., 1993; Durlauf and Fafchamps, 2005).
A number of studies have highlighted the pro-social effect of armed conflict (Bellows and Miguel, 2006,
2009; Voors et al., 2012; Gilligan et al., 2014) and some of them have explicitly suggested that the pro-
social impact of war may explain the documented economic recovery of many post-war societies (Davis and
Weinstein, 2002; Brakman et al., 2004; Miguel and Roland, 2011). However, these studies usually consider
social capital as unidimensional or uniform, even though it is theoretically depicted as a multifaceted notion.
Studies considering different facets of social capital question this optimism (Cassar et al., 2013; Rohner et al.,
2013; Grosjean, 2014). These latter results echo theoretical and empirical evidence based on ethnographic
and archaeological data. Indeed, inter-group conflict should favour both altruistic behaviours towards one’s
own group, and exclusionary behaviours against out-groups, also called parochialism (Choi and Bowles,
2007;Bowles, 2009). This paper contributes to this literature. It focuses on participation in associations
according to their characteristics in an attempt to unravel the web of social capital and learn more about
the repercussions of armed conflict on social cohesion.
Papers addressing the social legacy of conflicts generally use associational membership as a measure of
social capital. However, associations are diverse and their functions and objectives highly heterogeneous.
Not all associations have the same implications in terms of social interactions. Social capital can penalise
non-members (Acemoglu and Robinson, 2008) and “reinforce polarisation between the ‘in’ group and the
‘out’ group” (Durlauf and Fafchamps, 2005). “Social capital can be used by certain groups to overtake oth-
ers, generating between-group inequality and political tension” (ibid.). The substantial role of association
density (and networks) in the rise of the Nazi party in the 1930s (Satyanath et al., 2017) is illustrative of
the potential negative effects of social capital. Knack and Keefer (1997) and Fidrmuc and Gerxhani (2008)
contrast “Olsonian” and “Putnamesque” associations based on the divergent hypotheses of Olson (1982) and
Putnam et al. (1993) regarding the relationship between associational activity and growth. Olsonian groups
act as special interest groups at the expense of the rest of the society, whereas Putnamesque groups act
more for the community at large without any negative externalities (Knack and Keefer, 1997). This Olso-
nian/Putnamesque distinction can be viewed in relation to the usual differentiation between strong/bonding
and weak/bridging ties (Granovetter, 1973). The former are characterised by kinship-based relationships
resulting from shared affinities, for instance, among relatives, neighbours or close friends, whereas the latter
relate to a wider network. Bridging relationships are needed to prevent exclusion from social interactions
1Social capital is defined by Bourdieu (1980) as “the entire aggregate of current and potential resources associated with thepossession of a durable network”.
2
(Jackson et al., 2012) and are considered as a “source of value-added” (Burt, 2001). If conflict spurs involve-
ment in associations, then the kind of associations concerned matters to be able to interpret the effects on
social interactions and cooperation. Some, far from bridging the gap between groups, actually widen it. To
the best of our knowledge, the impact of conflict on membership of different types of associations has never
been explored, at least not in a comprehensive empirical manner. Our paper contributes to the literature
on the effects of social capital and questions its dominant assumption that social capital is a force of good.
The paper draws on the division between Olsonian and Putnamesque groups to develop a typology of
associations to address this knowledge gap in the particularly relevant case of Mali. Mali has been at war
since 2012. The conflict broke out when a number of armed groups challenged the government’s authority.
The insurgents were mainly Tuareg rebel groups fighting for the independence of northern Mali and jihadist
groups keen to impose Sharia law on the country. Although Mali has seen repeated Tuareg uprisings,2
jihadist groups only started thriving in the late 2000s driven by growing insecurity and central government
withdrawal from the Sahelian regions (Julien, 2011).3 In January 2012, the jihadists together with the
Tuaregs launched their first attacks on military positions in the north. After three months of intense
fighting, the major cities of the north, including Timbuktu, Gao and Kidal, were under the insurgents’
yoke. The National Movement for the Liberation of Azawad (MNLA), which was supported by Ansar Dine
(supported by Al Qaeda in Islamic Maghreb and the Movement for Oneness and Jihad in West Africa),
declared the north independent and imposed Islamic law.4 Meanwhile, a military coup toppled President
Amadou Toumani Toure held responsible for the crisis. As jihadist groups started moving south, France
launched Operation Serval under the UN flag and sent troops to stop their progress. By the end of January
2013, most cities had been taken back. Although two peace agreements were signed in 2014 and 2015 (in
Ouagadougou and Algiers: Government of Mali, 2015), jihadist groups continue their attacks and political
instability has spawned the emergence of new insurgent groups with ethnic and community demands. To
date, the conflict has claimed thousands of lives and displaced hundreds of thousands. Although the conflict
is essentially rooted in the northern and central part of Mali, it has spread throughout the country. Attacks
have even taken place on the Ivoirian border on the southern edge of the country.
Civic engagement plays a key role in Mali. It is recognised as central to local governance, acting as
a local intermediary and much-needed counterpart to weak public institutions. Civic engagement mainly
takes the form of substantial involvement in community life, especially in local development associations
(Kuepie and Sougane, 2014; Chauvet et al., 2015). The most recent Afrobarometer data (2017) report that
two-thirds of adults in Mali attend community meetings. The Indices of Social Development (ISD, 2010)
show Malian civic engagement to be particularly high compared with other African countries. Indeed, the
latest available data rank Mali among the top 15 to 30 countries consistently above the continental mean for
“civic activism”, “clubs and associations participation” and “interpersonal safety and trust”. In addition
to this quantitative evidence, Mali’s recent history has shown civil society, and associations in particular,
to be central to political transition to a democratic system (Roy, 2005). Mali has even been held up as a
regional model (Chauzal, 2007) making the outbreak of violence even more unexpected to the international
community. Ethnic groups moreover play a key role in the current crisis (Chauzal and van Damme, 2015).
2Four major uprisings in 1963, 1991, 2007 and 2012 were all followed by peace agreements.3Galy (2013) presents a full background analysis to understand the Malian war.4The Tuaregs tried to distance themselves from the Islamist radicals (as seen from the MNLA’s separation from Ansar Dine
just days after their alliance was announced).
3
Therefore, studying what kind of association is fostered by conflict can shed new light on the current state
of social interactions in Mali.
To the best of our knowledge, this is the first time a paper has empirically studied the conflict and social
capital nexus in Mali and in a former French colony of Sub-Saharan Africa.5 Our study broadens the picture
and analysis to take in a different context, where the set of institutional characteristics differs substantially
from other previously studied countries (La Porta et al., 1999; Djankov et al., 2003). This case study is,
unfortunately, still ongoing. The Malian conflict is in deadlock, and responses to date from national and
international authorities have fallen short of the mark (Guichaoua and Pellerin, 2017). Furthermore, the
Malian conflict presents a hybrid, albeit insufficiently studied form (mixing political grievances, separatism,
criminal activity and terrorism), which appears to be spreading in West Africa and destabilising the region
with potential unparalleled national and international demographic repercussions. This analysis can provide
deeper insights into the conflict’s current repercussions and potentially offer more targeted responses.
We use two sets of data to examine the repercussions of armed conflict on social capital in Mali. First, we
compute a local index of armed conflict from the Armed Conflict Location and Event Database (ACLED)
project developed by Raleigh et al. (2010). ACLED lists all available newspaper articles, press agency
telegrams and non-governmental organisation briefs reporting on conflict-related events since 1997. We
merge this local index of armed conflict with unique nationally and regionally representative household
surveys conducted by the National Statistics Office (NSO) in 2006, 2014, 2015 and 2016. All these surveys
include first-hand modules on governance and democracy issues. The 2014, 2015 and 2016 surveys at the
core of our study are repeated harmonised add-on survey modules on governance, peace and security (GPS-
SHaSA) and are included in the main household survey (Continuous, Modular Household Survey, hereafter
EMOP). They provide perfectly comparable data on large samples of individuals.6 A highly similar 2006
module is used as a pre-conflict benchmark. We draw on these original governance datasets to analyse the
repercussions of the Malian conflict on different types of social capital. The data is also rich enough to be
able to address potential endogeneity issues which is another limitation of many analyses.
We find that the conflict has a causal impact on adult involvement in associations, raising participation by
7 to 14 percentage points in exposed areas. The results are driven in particular by growth in participation in
inward-looking groups (Olsonian groups), namely family and political associations. These results are robust
to a number of robustness checks for reverse causation, omitted variables and selection issues. We rely
on two alternative strategies to address reverse causation wherever possible: instrumental variables (IV)
and difference-in-differences (DiD) estimations. We interpret these findings as evidence that an increase
in associational membership, far from being pro-social, actually forms a veiled withdrawal behind inner
group or community frontiers and can therefore spawn exclusion and local tensions. Our interpretation is
supported by additional tests showing that interpersonal trust decreases significantly in exposed areas.
The paper is structured as follows. In section 2, we present the related literature and the conceptual
framework. In section 3, we describe our data and introduce the empirical model. In section 4, we present
our estimation results for associative engagement. Section 5 further investigates the effects of the armed
5Countries commonly studied in the conflict literature in Africa are Burundi, Kenya, Sierra Leone, Rwanda, Tanzania andUganda. Some other analyses focus on European countries (e.g. Grosjean, 2014).
6Samples include up to 54,000 individuals. Data surveys with large samples representative at regional and even sub-regionallevel are required to ensure reliable results from an analysis of the impact of armed conflict in certain specific areas of thecountry. Many sub-national analyses are based on surveys with small samples representative at national level only.
4
conflict on the types of social capital cultivated. We summarise our findings and conclude in section 6.
2. Related literature and conceptual framework
2.1. Social capital, associational membership and types of groups
The notion of social capital can be defined in a number of ways. In this paper, social capital refers
to resources generated by structural relations or networks gravitating around an individual. Unlike some
analyses, we consider that trust is not a component of social capital per se. We make a clear distinction
between trust and social capital. We are aware that trust and social capital are often studied as one. We
argue that trust is an attitude that can be a factor (upstream) or a consequence (downstream) of social
capital (Woolcock, 1998; Lin, 1999). Indeed, a number of studies posit that trust and social capital are
mutually reinforcing (Sønderskov, 2011). Some show that trust builds up people’s networks and relations
(Narayan and Pritchett, 1999; Haddad and Maluccio, 2003), whereas others find an opposite relationship
(Paxton and Ressler, 2017).
We focus on one component of social capital: membership of associations, classified as a formal network
as opposed to an individual network, which we define as informal.7 The associative sector is heterogeneous
with a wide range of associations for which a typology needs to be developed. In keeping with Knack and
Keefer (1997) and Fidrmuc and Gerxhani (2008), we make a distinction between Putnamesque groups and
Olsonian groups. Olsonian groups act as special interest groups at the expense of the rest of the society,
whereas Putnamesque groups act more for the community at large without any negative externalities. In line
with Fidrmuc and Gerxhani (2008), educational, sport and art clubs, religious and charitable organisations,
and youth groups are considered as Putnamesque groups. On the other side, political associations, trade
unions and professional associations are classified as Olsonian groups. Our approach is somewhat different in
that our classification focuses on the association’s orientation, strategy and promoted values rather than on
its sector of intervention. More specifically, we separate out inward-looking (hereafter Olsonian) groups and
outward-looking (hereafter Putnamesque) groups. For example, we believe that human rights organisations,
which can be classified as political associations, cannot be included in the Olsonian groups. Therefore, in
our typology, Putnamesque organisations are open to individuals from different groups/categories. They
hence enable individuals to develop their bridging social capital as they constitute an inclusive process.
Activities benefit a broad community that extends beyond its members.8 Conversely, Olsonian groups are
more often based on kinship ties, enabling the development of bonding social capital. Activities benefit
solely their members even to the detriment of non-members.9 The principle of favouring only their members
sets up a barrier and creates an isolation and exclusion process. An increase in participation in these
inward-looking (bonding) associations indicates social withdrawal rather than pro-social behaviour. In our
typology, we assume that political, family and professional associations are Olsonians. As already mentioned,
the inclusion of political associations in this group is questionable. However, in the case of Mali, there is
no question since sectarianism and cronyism prevail in political associations in the country (Roy, 2005).
7A formal network refers to a network that is visible (groups or associations even though they are not necessarily formallydeclared), whereas individual networks are called informal since they are less visible.
8This description ties in with Sønderskov (2011) who points out the particularity of associations that produce public goods.See also Paxton and Ressler (2017) for a description of bridging and bonding associations.
9Alesina and Giuliano (2014) show that family ties, as the strongest ties, are negatively linked to growth drivers.
5
Local development associations are classified as Putnamesque organisations. Religious associations can also
be considered as outward-looking, given the specific context of Mali. More than 95% of the population
is Muslim. Malian Islam, which originated from the same Sunni tradition, is characterised by tolerance
and syncretism. Over the last two decades, Mali has seen a general wave of re-Islamisation in the country.
Islamic associations have been flourishing, but mainly as charitable organisations (Holder and Saint-Lary,
2013). Their main motive is to challenge the central state for its corruption, poor governance and lack of
redistributive policies, rather than religion-based violent confrontation.
This distinction between Olsonian/inward-looking and Putnamesque/outward-looking associations sheds
new light on what group membership really captures and the interpretation of the so-called pro-social effects
of war.
2.2. Social capital and conflict: a literature review
Studying the impact of conflict on social capital is of the utmost importance, as it can influence countries’
post-war economic, social and political paths. Some studies, as in Voors et al. (2012), explicitly suggest that
the “pro-social” impact of war may explain the documented economic recovery of many post-war societies
(Davis and Weinstein, 2002; Brakman et al., 2004; Miguel and Roland, 2011). The reasons why war might
influence social capital are not well-established, but can be summarised as follows (see Bauer et al., 2016,
for an overview). Investing in social capital is part of a household’s war-coping strategy. Social capital, in
the form of greater cooperation or participation in associations, can act as informal insurance to minimise
the adverse repercussions of war and shocks in general (destruction of assets and crops, injury and death)
on household welfare (Uphoff and Wijayaratna, 2000). In wartime, social cooperation helps people protect
themselves. On this point, community responses such as neighbourhood watch schemes, local vigilante
groups, and self-defence forces are documented in civil wars in Liberia and Afghanistan (Sawyer, 2005;
Jones and Munoz, 2010). In addition, studies in psychology suggest that exposure to war steadfastly steers
behaviour (Dyregrov et al., 2002) and preferences towards greater participation in the community (Carmil
and Breznitz, 1991).
The literature on the impact of armed conflicts on social capital turns up mixed findings. Jennings and
Sanchez-Pages (2017) use a theoretical approach to show that, below certain intensity thresholds, conflicts
increase social capital in the form of group creation. Yet above these levels, social capital decreases and can
end up lower than its peacetime level. The empirical literature’s conclusions are dependent on the context
and the expression of social capital studied. On the subject of social participation, studies on Sierra Leone,
Nepal and Burundi show that violence increases collective action and civic engagement (Bellows and Miguel,
2006, 2009; Voors et al., 2012; Gilligan et al., 2014). In a study on Uganda, Blattman (2009) finds that
the impact of civil war is greater for direct participants, particularly abductees and militia members. The
former are more involved in local political activities at community level. In a meta-analysis of 16 studies in
the areas of economics, anthropology, political science, and psychology, Bauer et al. (2016) use a synthetic
index of cooperation to show that the effect of armed conflict on social capital is on average positive
and statistically significant, but moderate in magnitude. Yet, this positive interpretation of increased
participation is somewhat contradictory with theoretical and empirical evidence based on ethnographic
and archaeological data. Indeed, inter-group conflict should favour pro-social behaviours towards one’s
own group but should simultaneously imply exclusionary behaviours towards out-groups (Choi and Bowles,
2007;Bowles, 2009). The study of collective action in European countries during post-World War II period
6

suggests this increased in-group bias (Grosjean, 2014). The increased participation rather evokes the increase
of a negative social capital also featured in the rise of the Nazi party (Satyanath et al., 2017).
On the subject of trust, countries affected by slave trading (characterised by violence between ethnic
groups) currently form the most distrustful populations in Africa (Nunn and Wantchekon, 2011). A study
on Uganda by Rohner et al. (2013), combining Afrobarometer data with ACLED event data, shows that
generalised trust is lower for individuals in areas exposed to violent conflicts. Furthermore, a number of
studies highlight that the impact of a conflict on trust can vary over time or according to local or individual
characteristics. In Uganda, De Luca and Verpoorten (2011, 2015) take the same dataset as Rohner et al.
(2013) to show that the conflict had a negative short-term impact on generalised trust and associational
membership, but a positive impact on these factors in the longer run. In Tajikistan, Cassar et al. (2013)
draw on behavioural experiments and individual surveys to demonstrate that interpersonal trust in ethnically
diverse villages is lower in the most exposed areas ten years after the end of the civil war. In their meta-
analysis, Bauer et al. (2016) show that the effects of armed conflict on trust are close to zero.
Few studies come to clear conclusions about social interactions, with the exception of Colletta and
Cullen (2000) who show that the post-genocide period in Cambodia improved bridging relationships in the
village with higher market penetration forces, thereby reducing bonding networks. However, some studies
suggest the potential mechanisms through which conflicts increase inward-looking interactions. Some posit
that armed conflict can strengthen kinship-based ties due to a stronger ethnic identity (Rohner et al., 2013),
increase “kinship-based norms of morality” (Cassar et al., 2013), and elevate egalitarian motivations towards
in-group members among children exposed to the conflict (Bauer et al., 2014).
2.3. Differentiated effects of conflict on social capital
In some papers (see for instance: Bellows and Miguel, 2006, 2009; Voors et al., 2012), an increase in
participation in associations in conflict-affected areas is positively interpreted as pro-social. Conversely,
a decrease in participation in associations is presented negatively as social withdrawal. Yet these works
say little about what participation in groups really captures. As illustrated in Figure 1, the meaning of
these results can change dramatically when the type of association is considered. Exposure to violence
might be more conducive to some associations than others. The increase in participation in groups in
conflict-affected areas might correspond to an increase in participation in Putnamesque associations. If so,
it would be considered as pro-social behaviour enabling increased interaction, cooperation and exchange
across groups and would therefore be a driver for the documented post-war economic recovery in affected
areas. Conversely, the conflict might be expected to be conducive to participation in Olsonian associations
only. Increased participation in inward-looking associations widens the gap between groups as all groups
give precedence to their own self-interests. This would lead to greater opposition between groups, and would
eventually lock the conflict in a “conflict trap” (Collier et al., 2003).
To further understand the effects of conflict on social capital and participation in associations in par-
ticular, we also explore the impact of conflict on interpersonal trust. We consider different components of
interpersonal trust: generalised trust, intra-group trust and inter-group trust. As presented in sub-section
2.1 and Figure 1, there is a link between participation in groups and interpersonal trust. Intra-group trust
refers to an individual’s immediate circle. Here, intra-group trust is captured by trust in relatives and
neighbours. Inter-group trust refers to the different out-groups that communities can form. These include
other ethnic groups, other region or country groups, and other political affiliation groups. An increase in
7
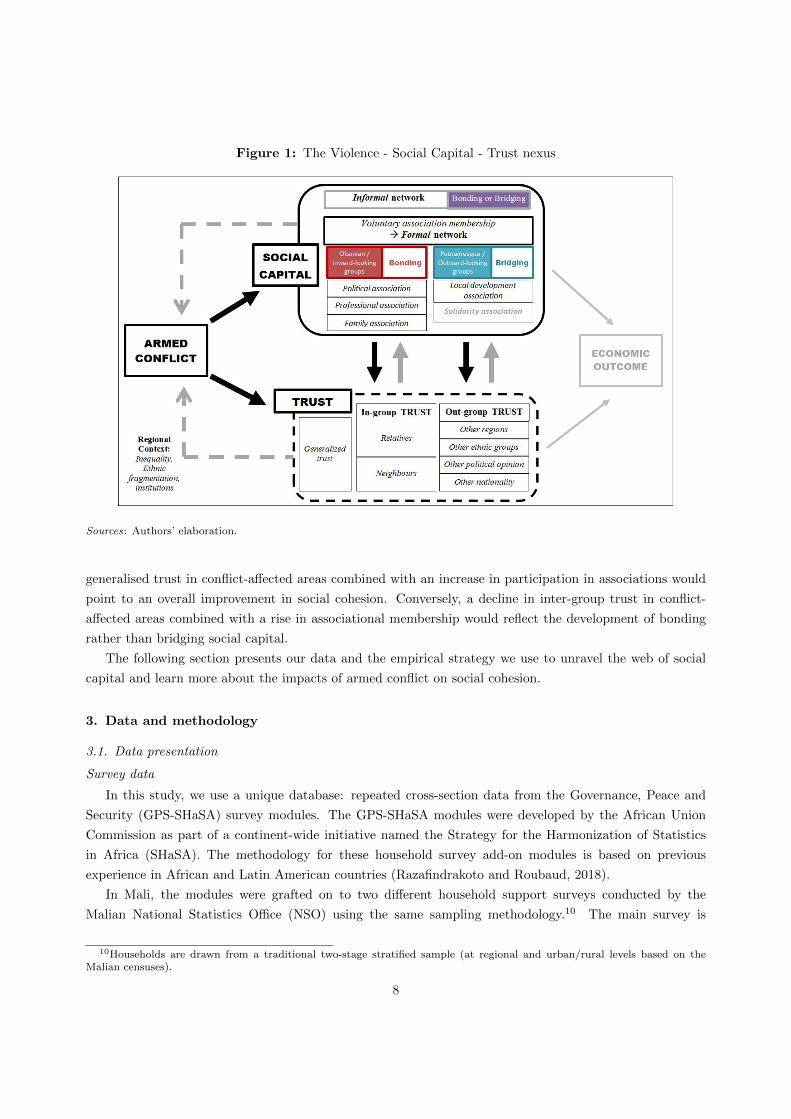
Figure 1: The Violence - Social Capital - Trust nexus
Sources: Authors’ elaboration.
generalised trust in conflict-affected areas combined with an increase in participation in associations would
point to an overall improvement in social cohesion. Conversely, a decline in inter-group trust in conflict-
affected areas combined with a rise in associational membership would reflect the development of bonding
rather than bridging social capital.
The following section presents our data and the empirical strategy we use to unravel the web of social
capital and learn more about the impacts of armed conflict on social cohesion.
3. Data and methodology
3.1. Data presentation
Survey data
In this study, we use a unique database: repeated cross-section data from the Governance, Peace and
Security (GPS-SHaSA) survey modules. The GPS-SHaSA modules were developed by the African Union
Commission as part of a continent-wide initiative named the Strategy for the Harmonization of Statistics
in Africa (SHaSA). The methodology for these household survey add-on modules is based on previous
experience in African and Latin American countries (Razafindrakoto and Roubaud, 2018).
In Mali, the modules were grafted on to two different household support surveys conducted by the
Malian National Statistics Office (NSO) using the same sampling methodology.10 The main survey is
10Households are drawn from a traditional two-stage stratified sample (at regional and urban/rural levels based on theMalian censuses).
8

the EMOP. It was conducted in 2014, 2015 and 2016 in all Malian regions, excepting Kidal for all three
rounds and Timbuktu and Gao in 2014 for obvious security reasons. The complementary survey is the
2006 Short-Form, Integrated Household Survey (ELIM). This latter survey provides a highly reliable point
of comparison with the EMOP data and forms a conflict-free benchmark.11 Both support surveys include
the usual sociodemographic questionnaires and are representative at national and regional level, but the
very large available samples also allow for inference at cercle (hereafter, called district), arrondissement
(hereafter, called sub-district) and commune levels.12
These add-on modules interview people over 18 years old living in Mali. A maximum of three adults per
household were interviewed in 2014, 2015 and 2016,13 whereas all adults were interviewed in 2006. For the
comparability of estimation, three adults were drawn at random from each household comprising four or
more adults in the 2006 sample. The pooled sample from the three post-2012 surveys (2014, 2015 and 2016)
provides a main sample of over 43,000 observations, while the 2006 survey database includes 11,670 adults.
These modules ask questions about perceptions and experience of governance and insecurity at national
and local level, and interpersonal trust and participation in associations.14 The following questions are of
particular interest here:
• Participation in an association: “Are you an office-bearer or a member of an association?” The binary
answer is given for the five following types of association: local, family, religious, professional and
political. An aggregated measure of participation in at least one of these five associations is created.
• Trust: “To what extent can most people be trusted?” and “To what extent do you trust: ... - your
relatives? - your neighbours? - people from a different ethnic group/race than yours? - people with a
different language/dialect than yours? - people with a different political affiliation than yours? - people
with a different nationality than yours?”. The potential answers are gradient from 1 (not at all) to 4
(very). For the purposes of interpretation, we aggregate the answers into a binary outcome. Both “not
at all” and “not much” answers take the value of 0, while “fairly” and “very much” take the value of
1. It is also important to note that the groups or category of individuals considered for interpersonal
trust do not fit exactly within the association types. For instance, trust in relatives is a proxy measure
of intra-group trust. Yet, relatives include, here, all members of the extended family who are not
necessarily members of inward-looking group embodied by family associations.
Descriptive statistics confirm the importance of participation in groups in Mali (reported in appendix
Table A1). In total, 50% of adults take part in at least one association. This corresponds to 70% of
households with one or more members engaged in at least one association. Bamako, the capital, has the
smallest participation rate. Local associations represent the majority of the population, with 35% of adults
belonging to a local association (50% of households report at least one adult member in a local association
in 2014 and after). These associations play a substantial role in the local provision of public goods and small
11The 2006 Tuareg uprising was a minor bout of unrest occurring only in the Kidal region.12Mali counts eight regions plus the capital Bamako (three regions are in the northern part of the country). Each region is
divided in cercles, which correspond to districts. Sub-districts and communes are lower administrative level areas, and bothcorrespond to a group of villages. Administrative divisions are mapped in appendix Figure A1.
13If there are more than three adults in the sampled household, then three of them are drawn at random to be interviewed.14In the pre-conflict sample (2006), information on participation is observed at household level only. Interpersonal trust was
not measured in 2006.
9
infrastructures (Kuepie and Sougane, 2014). A total of 20% of adults are members of a family, professional
or political association. Family associations play a financial support role for a group of related individuals.
Their members can also rely on it for particular events (births, deaths, marriages, etc.). Religious associations
account for the fewest citizens. In addition, 70% of adults say they trust most people. No clear variation
can be identified in participation and trust levels over time at first glance. The analysis of how the conflict
disrupted the apparently highly pro-social society is thus extremely relevant in Mali.
Conflict data
The conflict location and event inventory is taken from the ACLED project developed by Raleigh et al.
(2010). ACLED is based on a census of all newspaper articles, press agency telegrams and non-governmental
organisation briefs reporting conflict-related events in Mali since 1997. In addition to the geolocation of each
event, the database provides general information on the groups involved, the reported number of fatalities
(undifferentiated by which side they are on), the information source, and a brief summary of the event. We
limit the event study to precisely located violent events covering all types of “battles”, “remote violence”
and “violence against civilians” detailed by the ACLED typology.15 “Battles” represent two opposing armed
groups and are distinguished by their outcomes as to a change or not in control of a location (no change,
or if the non-state actors or government wins). “Remote violence” corresponds to one sided-violence and
concerns mainly the use of bombing devices; the physical presence of the perpetrator is not required for this
type of event. “Violence against civilians” represents one-sided events that directly target unarmed civilians.
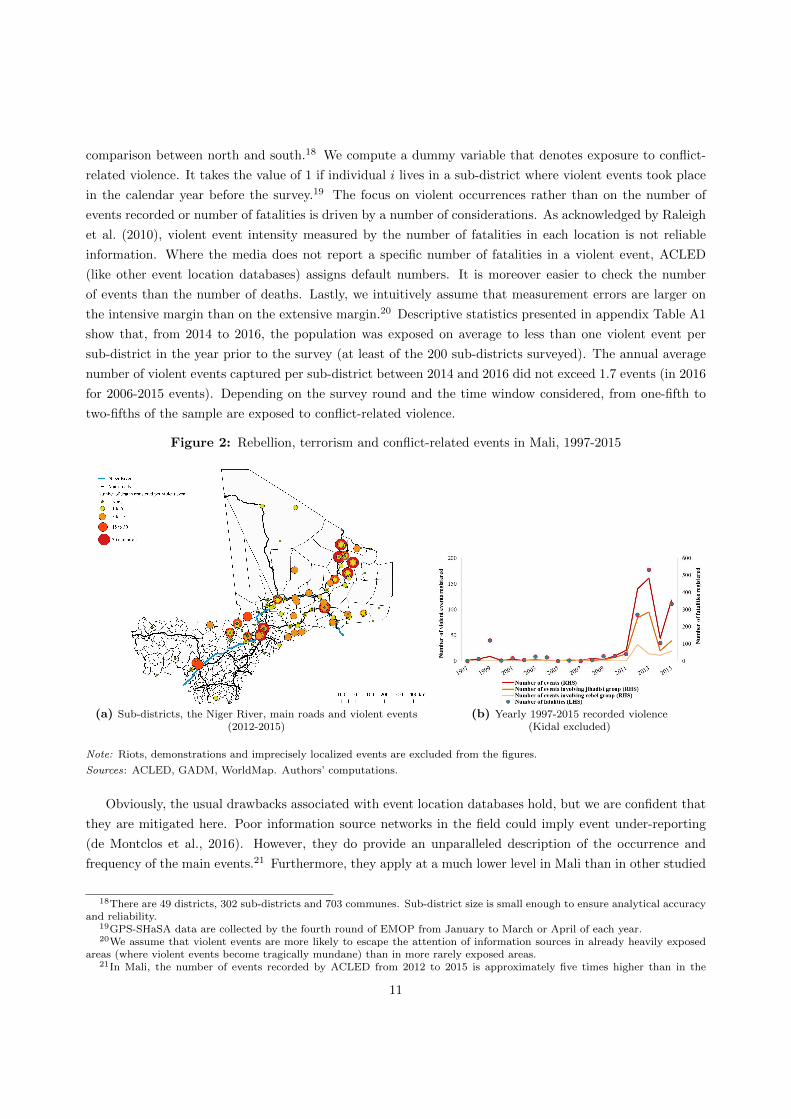
ACLED recorded 529 events prior to 2016, Kidal excluded (758 including Kidal); 464 of these events
occurred in 2012 or later.16 Figure 2a shows that all eight regions and Bamako have been affected by
conflict-induced violence included southern regions: attacks even took place at the Ivoirian border, which
is in the southernmost part of the country. Figure 2b highlights that the majority of the violent events
were led by jihadist groups (half of the recorded violent events outside of Kidal region involved jihadist
groups from 2012 to 2015) rather than Tuareg armed groups (16% of all violent events recorded in Mali,
Kidal excluded).17 Figure 2b illustrates the evolution of the conflict. Violent events skyrocketed in 2012
with the re-emergence of rebel and jihadist activity. Following the French military intervention in 2013,
field battles, violence against civilians and remote violence intensified. In 2014, following the Ouagadougou
peace agreements and the deployment of the UN Multidimensional Integrated Stabilization Mission in Mali
(MINUSMA), violence temporarily abated. However, despite the Algiers peace agreements, there was a
fresh upsurge in violence in 2015.
All violent events are aggregated yearly at sub-district level and are merged with the survey data based
on the surveyed adults’ administrative areas of residence. We use the sub-district level of aggregation
rather than the commune level for two reasons. First, communes correspond to very small entities in
Mali and geolocation is rarely perfect. The location of violent events at sub-district level makes exposure
identification errors marginal. Second, there is substantial variance in commune size between the north and
south of the country. The aggregation of events at sub-district level therefore makes for a more reliable
15Twenty events from 2012 to 2015 were dropped for reasons of imprecise location. Also excluded from the sample areconflict-related non-violent events (strategic troop movements and establishment of headquarters), and riots and protestsrelated to political demands (mainly in Bamako).
16In total, 40 events were recorded from 2006 to 2011.17The other events correspond mainly to other violent ethnic related militia rebellions.
10
comparison between north and south.18 We compute a dummy variable that denotes exposure to conflict-
related violence. It takes the value of 1 if individual i lives in a sub-district where violent events took place
in the calendar year before the survey.19 The focus on violent occurrences rather than on the number of
events recorded or number of fatalities is driven by a number of considerations. As acknowledged by Raleigh
et al. (2010), violent event intensity measured by the number of fatalities in each location is not reliable
information. Where the media does not report a specific number of fatalities in a violent event, ACLED
(like other event location databases) assigns default numbers. It is moreover easier to check the number
of events than the number of deaths. Lastly, we intuitively assume that measurement errors are larger on
the intensive margin than on the extensive margin.20 Descriptive statistics presented in appendix Table A1
show that, from 2014 to 2016, the population was exposed on average to less than one violent event per
sub-district in the year prior to the survey (at least of the 200 sub-districts surveyed). The annual average
number of violent events captured per sub-district between 2014 and 2016 did not exceed 1.7 events (in 2016
for 2006-2015 events). Depending on the survey round and the time window considered, from one-fifth to
two-fifths of the sample are exposed to conflict-related violence.
Figure 2: Rebellion, terrorism and conflict-related events in Mali, 1997-2015
(a) Sub-districts, the Niger River, main roads and violent events(2012-2015)
(b) Yearly 1997-2015 recorded violence(Kidal excluded)
Note: Riots, demonstrations and imprecisely localized events are excluded from the figures.
Sources: ACLED, GADM, WorldMap. Authors’ computations.
Obviously, the usual drawbacks associated with event location databases hold, but we are confident that
they are mitigated here. Poor information source networks in the field could imply event under-reporting
(de Montclos et al., 2016). However, they do provide an unparalleled description of the occurrence and
frequency of the main events.21 Furthermore, they apply at a much lower level in Mali than in other studied
18There are 49 districts, 302 sub-districts and 703 communes. Sub-district size is small enough to ensure analytical accuracyand reliability.
19GPS-SHaSA data are collected by the fourth round of EMOP from January to March or April of each year.20We assume that violent events are more likely to escape the attention of information sources in already heavily exposed
areas (where violent events become tragically mundane) than in more rarely exposed areas.21In Mali, the number of events recorded by ACLED from 2012 to 2015 is approximately five times higher than in the
11
contexts. First, as the Malian conflict started recently, there are more information sources on the ground and
they are of higher quality. The involvement of international forces (both from France and the international
community) should enhance event reporting. Last but not least, Figures B1 in the online appendix shows
that ACLED is globally consistent with the Malian conflict’s perceived reality, and vice versa. Citizens
living in the most exposed districts are the most scared of the threat of armed conflict (districts shaded
in black). Districts where individuals are the least frightened (vertical lines) are very marginally exposed
areas.
3.2. Empirical strategy
To explore the impact of armed conflict on social capital, we estimate the following model:
Yi,sd,t = α+ βEvOccsd,(t−1) + γXi,sd,t + δEthnFrsd,2009 + ηDd + θTt + εi,sd,t (1)
where Yi,sd,t, our dependent variable, denotes the social capital (or trust) of individual i in sub-district
sd at time t. It is a dummy variable either denoting that individual i is a member of an association (or
not) or that individual i is trustful (or not). EvOccsd,(t−1) is our main variable of interest. It takes the
value of 1 if one or more violent events were recorded in sub-district sd in year t − 1 and 0 otherwise.
Xi,sd,t is a vector of individual characteristics including gender, age group, level of education, link with the
household head, marital status and area of residence (urban-rural). EthnFrsd,2009 is a measure of ethno-
linguistic fractionalisation at sub-district level. It tracks findings regarding the role of group homogeneity
in participation Alesina and La Ferrara (2000). It corresponds to the conventional index of ethnolinguistic
fractionalisation and is computed from the 2009 Malian census (RGPH). It measures the probability of two
randomly selected people in a given area belonging to different ethnolinguistic groups.22 District dummies
and year dummies, Dd and Tt respectively, are also included to control for local time-invariant and country
time-variant unobservables. εi,sd,t is the error term. All estimations are robust and adjusted for clustering
at year and sub-district levels. For ease of interpretation, we estimate this model using a linear probability
model (LPM).
One obvious concern is the possible endogeneity of our variable of interest: violent event occurrence.
In our case, endogeneity has two potential origins: reverse causality and omitted variable bias. First,
people could be targeted (or engage) in the conflict on the basis of their social preferences. Targeting the
places where social cohesion is strongest might be an envisaged strategy, as a way for insurgents to both
symbolically and quantitatively maximise the scope (via information) of their acts and disrupt the most
tightly knit regions. The opposite could also hold true. Targeting the least cohesive places could be a
way to fuel resentment between groups and conduct a “divide and rule” strategy. An examination of the
Malian context and data leads us to argue that reverse causality is unlikely. The pre-conflict period sample
shows that there are no significant differences in participation between the locations affected and unaffected
ex-post by the conflict.23 The pattern of violent events does not support a particular targeting strategy of
Uppsala Conflict Data Program due to more restrictive inclusion criteria (Croicu and Sundberg, 2015).22The ethnolinguistic fragmentation score is calculated as equal to 1 minus the Herfindahl index, based on the mother
tongue.23Estimates are reported in online appendix Table B2. Results hold for aggregated participation and participation in family,
political, professional and local associations. Engagement in religious associations appears to be lower (at 10% significancelevel) in future exposed areas.
12

populations, communities or ethnic groups.24 Insurgents rather seem to follow the main routes crossing the
country from north to south. By 2015, all the largest cities had suffered conflict-related violence, and all
regions had experienced violent events (see Figure 2a).
Second, conflict may be determined by a third factor time-varying or not, which also influences social
preferences and group membership. For instance, areas with easier access to markets or better economic
performance could be more prone to conflict-related violence (Berman et al., 2017), as targeting is less costly,
as well as it favours social interactions and group membership through impersonal exchange (Colletta and
Cullen, 2000).
To deal with potential omitted variable biases we include district and year dummies in all estimations.
We further alleviate this bias by including a large set of individual, district or sub-district-level controls in
complementary estimations. Following Altonji et al. (2005) and Oster (2019) procedures, we also measure
the minimum size of unobservables relative to observables required to explain away the effects of occurrence
of violence on social capital.
To further mitigate potential endogeneity biases, we estimate instrumental variables (IV) and difference-
in-differences (DiD). Both methods are complementary. IV addresses endogeneity biases but are subject to
relative imprecision, especially when both endogenous and outcome variables are binary (Chiburis et al.,
2012). We instrument the occurrence of violent events by an interaction between local historical tensions and
precipitation. We discuss the IV identification strategy in sub-section 4.2. DiD addresses endogeneity biases
with more accuracy. DiD controls for unobserved heterogeneity between the control group, inhabitants of
never affected sub-districts, and the treatment group, individuals living in sub-districts exposed to conflict-
related violence between 2006 and the year prior to the survey. It addresses the omitted variable biases,
including potential spurious dynamic correlations as the specification includes time-varying region dummies.
Nevertheless, different unit of observation of participation and absence of interpersonal trust measure in the
2006 sample limit its implementation.
Lastly, selection into migration is likely to bias the effects of violence if displaced individuals are system-
atically less or more pro-social. Constrained DiD estimations to non-migrants,25 enable to rule out selection
into migration.
4. Conflict and participation in associations
4.1. Baseline results
Table 1 reports the baseline results. To save space, the coefficients of the control variables are not
reported. All control variables are intuitively signed and consistent with the existing literature on the deter-
minants of participation in associations (Alesina and La Ferrara, 2000).26 People living in rural areas and
educated adults are more likely to be involved in associations. Ethnolinguistic fragmentation at sub-district
level negatively, but non-significantly, influences membership in local associations. This result supports the
findings reported by Alesina and La Ferrara (2000) regarding the role of group homogeneity in participation.
Results show a positive relationship between violent events and participation in Mali. Indeed, individuals
exposed to violent events are 13 percentage points more likely to be a member of at least one association
24Event location and ethnolinguistic fragmentation is depicted in online appendix Figure B2.252015 is the only round of EMOP with available data on migration.26Benchmark results are presented in online appendix Table B1.
13
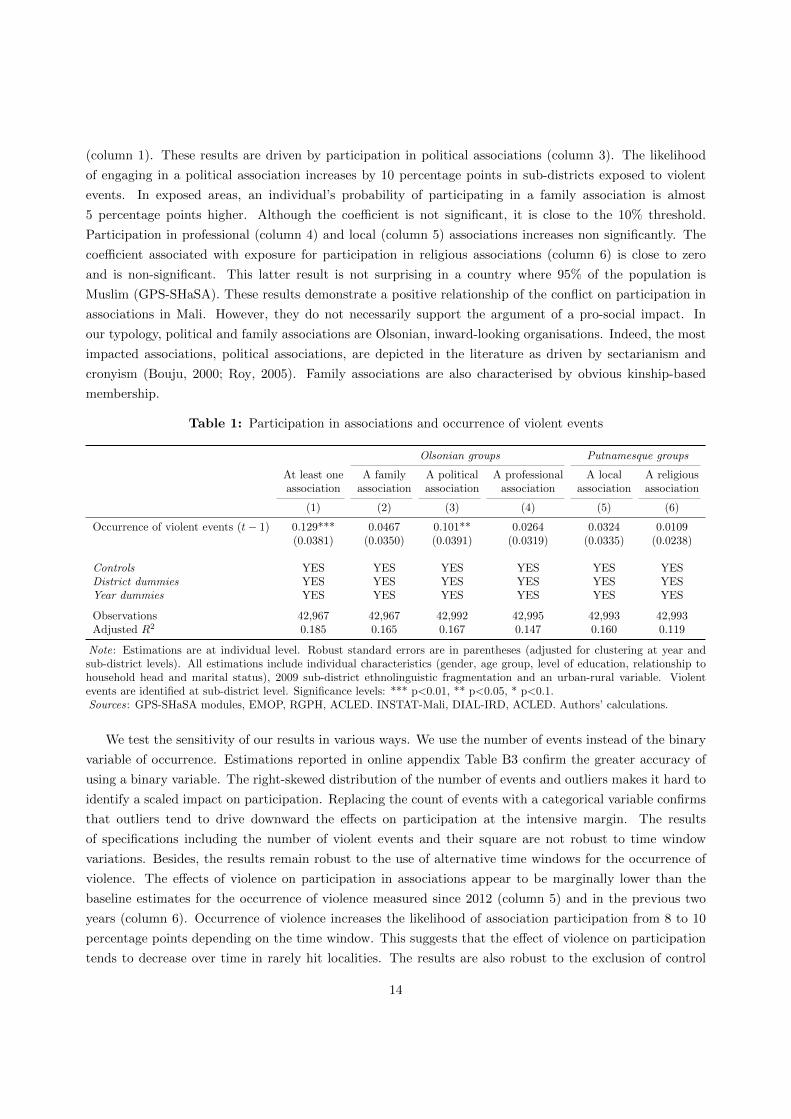
(column 1). These results are driven by participation in political associations (column 3). The likelihood
of engaging in a political association increases by 10 percentage points in sub-districts exposed to violent
events. In exposed areas, an individual’s probability of participating in a family association is almost
5 percentage points higher. Although the coefficient is not significant, it is close to the 10% threshold.
Participation in professional (column 4) and local (column 5) associations increases non significantly. The
coefficient associated with exposure for participation in religious associations (column 6) is close to zero
and is non-significant. This latter result is not surprising in a country where 95% of the population is
Muslim (GPS-SHaSA). These results demonstrate a positive relationship of the conflict on participation in
associations in Mali. However, they do not necessarily support the argument of a pro-social impact. In
our typology, political and family associations are Olsonian, inward-looking organisations. Indeed, the most
impacted associations, political associations, are depicted in the literature as driven by sectarianism and
cronyism (Bouju, 2000; Roy, 2005). Family associations are also characterised by obvious kinship-based
membership.
Table 1: Participation in associations and occurrence of violent events
Olsonian groups Putnamesque groups
At least one A family A political A professional A local A religiousassociation association association association association association
(1) (2) (3) (4) (5) (6)
Occurrence of violent events (t− 1) 0.129*** 0.0467 0.101** 0.0264 0.0324 0.0109(0.0381) (0.0350) (0.0391) (0.0319) (0.0335) (0.0238)
Controls YES YES YES YES YES YESDistrict dummies YES YES YES YES YES YESYear dummies YES YES YES YES YES YES
Observations 42,967 42,967 42,992 42,995 42,993 42,993Adjusted R2 0.185 0.165 0.167 0.147 0.160 0.119
Note: Estimations are at individual level. Robust standard errors are in parentheses (adjusted for clustering at year andsub-district levels). All estimations include individual characteristics (gender, age group, level of education, relationship tohousehold head and marital status), 2009 sub-district ethnolinguistic fragmentation and an urban-rural variable. Violentevents are identified at sub-district level. Significance levels: *** p<0.01, ** p<0.05, * p<0.1.Sources: GPS-SHaSA modules, EMOP, RGPH, ACLED. INSTAT-Mali, DIAL-IRD, ACLED. Authors’ calculations.
We test the sensitivity of our results in various ways. We use the number of events instead of the binary
variable of occurrence. Estimations reported in online appendix Table B3 confirm the greater accuracy of
using a binary variable. The right-skewed distribution of the number of events and outliers makes it hard to
identify a scaled impact on participation. Replacing the count of events with a categorical variable confirms
that outliers tend to drive downward the effects on participation at the intensive margin. The results
of specifications including the number of violent events and their square are not robust to time window
variations. Besides, the results remain robust to the use of alternative time windows for the occurrence of
violence. The effects of violence on participation in associations appear to be marginally lower than the
baseline estimates for the occurrence of violence measured since 2012 (column 5) and in the previous two
years (column 6). Occurrence of violence increases the likelihood of association participation from 8 to 10
percentage points depending on the time window. This suggests that the effect of violence on participation
tends to decrease over time in rarely hit localities. The results are also robust to the exclusion of control
14
variables. For further robustness checks, we use firstly participation in associations at household level as the
dependent variable, and, secondly, aggregated violent events at commune level. Results remain very similar.
Logit estimates remain very consistent (reported in online appendix Table B4). The results, reported in
online appendix Table B5, are also consistent with the exclusion of northern Mali observations.
To test for an omitted variable bias, we add to the baseline estimations additional controls that might
explain changes in participation. First, we introduce geo-climatic information starting with variables cap-
turing climate variations. Indeed, climate shocks are among the most intuitive events that might directly
affect participation and indirectly affect conflict through the channel of economic growth (Miguel et al.,
2004; Hsiang et al., 2013). A standardised rainfall deviation from the past ten years of yearly-average pre-
cipitation (2005-2015 period) is calculated at district level using the Climate Research Unit dataset (version
3.24). A two-year lag is also included in the baseline estimation. We also include log-linear distance from
sub-district centroids to primary roads as a proxy for market access. Second, we take advantage of the
specific information contained in EMOP and particularly the GPS-SHaSA modules to include additional in-
dividual controls. We include per capita consumption quintiles, the individual level of fear due to the threat
of terrorism and armed conflict, reported injury or illness in the past three months (available in the 2015
and 2016 questionnaires), stated local tensions in the previous year in the respondent’s place of residence
and stated access to the administration. Results are reported in appendix Table A3. The results are highly
consistent and robust regardless of the specification. Additional controls do not change the consistency
of our previous estimations and confirm the rising effects of exposure to conflict-related violent events on
participation in associations.
Following Altonji et al. (2005), we further mitigate the omitted variable bias by measuring the relative
size of unobservables to observables necessary to explain away the effect of violence on participation. It
consists in comparing coefficients of violence occurrence between baseline estimations with controls and
baseline estimations without control (but with district dummies). The estimation with controls is limited to
baseline specification.27 Unobservables should be 3 times larger than observables to explain away the effects
of violence on participation in at least one association and in political associations. This result is confirmed
by Oster (2019) improved procedure which takes into account the change of R-squared from estimations
without control to estimations with controls.28 Unobservables need to be 3 times larger than observables to
explain away the effect of violence on participation in at least one association.29 This ratio is estimated for a
maximum R-squared corresponding to 1.3 times the baseline R-squared (as suggested in Oster, 2019). These
results suggest that omitted variable bias is unlikely. Nevertheless, this result does not completely rule out
endogeneity biases. The following sub-sections use two complementary estimation strategies (IV and DiD)
to further address potential endogeneity biases. It also considers potential selection into migration.
27The ratio equalsβcontrol
βnocontrol−βcontrolwhere βcontrol is the coefficient of violence occurrence in baseline estimation with
controls and βnocontrol is the same coefficient in the uncontrolled specification.28We use Oster (2019) Stata command psacalc to estimate the ratio.29The size of unobservables needs to be the same as observables to explain away the effect of violence on participation in
political associations.
15
4.2. Identifying a causal relationship
Instrumental variable estimations
Although we argue in sub-section 3.2 that there is no statistical evidence suggesting a problem of reverse
causality, potential endogeneity issues cannot be ruled out definitively. To overcome such biases, we first
conduct an instrumental variable estimation on participation in associations. We instrument the occurrence
of violent events by an interaction between local historical tensions and precipitation. The reason behind
the choice of this instrument is that climate variations are conducive to violence, especially in areas with
structural tensions, revealed by past violence. In Mali, some areas are exposed to local tensions, mainly land
disputes and ethnic opposition, which cause scattered violence (Leclerc-Olive, 2017). The use of an interacted
instrument is inspired by Nunn and Qian (2014). To estimate the effect of United States (US) food aid on the
incidence of conflict in recipient countries, they instrument US food aid by an interaction of lagged US wheat
production with a country’s propensity to receive US food aid. Similarly, our interacted instrument exploits
both cross-sectional variation in historical tensions and time and cross-sectional variations in precipitation.
The interacted instrument also strengthens the fit of our first stage.
To identify local historical tensions, we use ACLED data and compute a dummy variable denoting the
occurrence of a violent event in the sub-district in a peaceful time (i.e. over the 1997-2005 period).30 The
precipitation variable is a standardised measure of the deviation of the previous year’s rainfall from the past
ten years (2005-2015) of annual average precipitation at district level. There is considerable evidence of the
role of rainfall and weather variations in the onset of conflict (see, for instance, Couttenier and Soubeyran,
2015, for an overview; see also Miguel et al., 2004; Koubi et al., 2012; Harari and La Ferrara, 2018). The
transmission channels of weather variations on violence can be twofold. First, through an opportunity
cost mechanism, positive variations could deter from engaging in violent activities while living conditions
improve, as suggested in Couttenier and Soubeyran (2014) and Harari and La Ferrara (2018). Second, on
the contrary, through a rent-seeking behaviour, positive variations could also increase violence: the potential
gains from winning violent confrontation increase, as it has been shown in the case of coca production in
Columbia (Angrist and Kugler, 2008). This evidence does not relate exclusively to large rainfall deviations.
It also concerns more marginal deviations, as reviewed in Hsiang et al. (2013).
There may be some concern that weather shocks and historical tensions might determine contemporary
participation in groups. Should this be the case, the exclusion criterion would be violated. We argue
that this is unlikely. Substantial weather shocks, including drought and floods, may have a direct effect
on participation in associations, especially those playing an informal insurance role. However, such shocks
are not observed over the 2012-2015 period, which presents between −2 and +2 standard deviations. For
historical tensions, although occurrences of violence are found across all regions of Mali, they are rare and
highly localised in time and space. These violent events are associated with neither jihadist nor Tuareg
violence nor any potential ideological combat. They are due rather to criminal activity and local disputes.
Moreover, not only is past violence rare, but it is not recurrent. Only two sub-districts were affected by
violence more than once (twice in Bamako and three times in Gao) over eight years. It is therefore unlikely
that past violence drove the creation of or participation in groups, including self-defence groups. The
falsification tests reported in Table 2 confirm that neither past violent events (column 1 without district
301997-2005 events are mapped in appendix Figure A2.
16
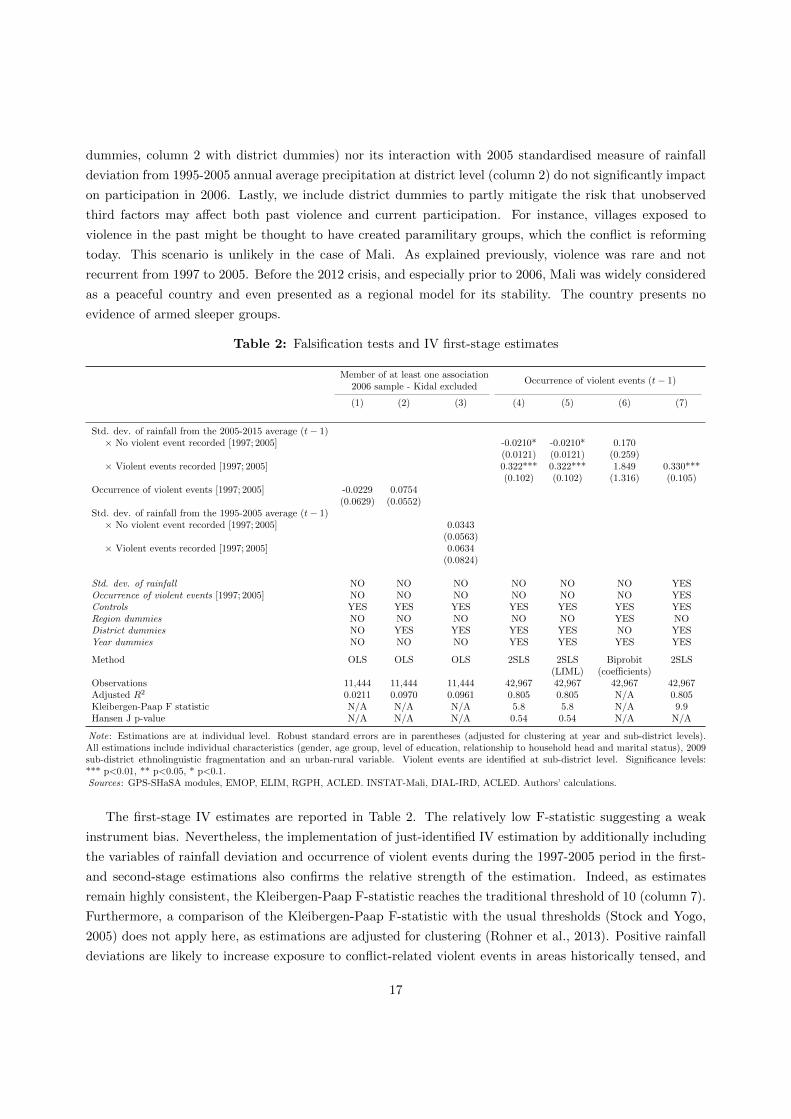
dummies, column 2 with district dummies) nor its interaction with 2005 standardised measure of rainfall
deviation from 1995-2005 annual average precipitation at district level (column 2) do not significantly impact
on participation in 2006. Lastly, we include district dummies to partly mitigate the risk that unobserved
third factors may affect both past violence and current participation. For instance, villages exposed to
violence in the past might be thought to have created paramilitary groups, which the conflict is reforming
today. This scenario is unlikely in the case of Mali. As explained previously, violence was rare and not
recurrent from 1997 to 2005. Before the 2012 crisis, and especially prior to 2006, Mali was widely considered
as a peaceful country and even presented as a regional model for its stability. The country presents no
evidence of armed sleeper groups.
Table 2: Falsification tests and IV first-stage estimates
Member of at least one associationOccurrence of violent events (t− 1)
2006 sample - Kidal excluded
(1) (2) (3) (4) (5) (6) (7)
Std. dev. of rainfall from the 2005-2015 average (t− 1)× No violent event recorded [1997; 2005] -0.0210* -0.0210* 0.170
(0.0121) (0.0121) (0.259)× Violent events recorded [1997; 2005] 0.322*** 0.322*** 1.849 0.330***
(0.102) (0.102) (1.316) (0.105)Occurrence of violent events [1997; 2005] -0.0229 0.0754
(0.0629) (0.0552)Std. dev. of rainfall from the 1995-2005 average (t− 1)× No violent event recorded [1997; 2005] 0.0343
(0.0563)× Violent events recorded [1997; 2005] 0.0634
(0.0824)
Std. dev. of rainfall NO NO NO NO NO NO YESOccurrence of violent events [1997; 2005] NO NO NO NO NO NO YESControls YES YES YES YES YES YES YESRegion dummies NO NO NO NO NO YES NODistrict dummies NO YES YES YES YES NO YESYear dummies NO NO NO YES YES YES YES
Method OLS OLS OLS 2SLS 2SLS Biprobit 2SLS(LIML) (coefficients)
Observations 11,444 11,444 11,444 42,967 42,967 42,967 42,967Adjusted R2 0.0211 0.0970 0.0961 0.805 0.805 N/A 0.805Kleibergen-Paap F statistic N/A N/A N/A 5.8 5.8 N/A 9.9Hansen J p-value N/A N/A N/A 0.54 0.54 N/A N/A
Note: Estimations are at individual level. Robust standard errors are in parentheses (adjusted for clustering at year and sub-district levels).All estimations include individual characteristics (gender, age group, level of education, relationship to household head and marital status), 2009sub-district ethnolinguistic fragmentation and an urban-rural variable. Violent events are identified at sub-district level. Significance levels:*** p<0.01, ** p<0.05, * p<0.1.Sources: GPS-SHaSA modules, EMOP, ELIM, RGPH, ACLED. INSTAT-Mali, DIAL-IRD, ACLED. Authors’ calculations.
The first-stage IV estimates are reported in Table 2. The relatively low F-statistic suggesting a weak
instrument bias. Nevertheless, the implementation of just-identified IV estimation by additionally including
the variables of rainfall deviation and occurrence of violent events during the 1997-2005 period in the first-
and second-stage estimations also confirms the relative strength of the estimation. Indeed, as estimates
remain highly consistent, the Kleibergen-Paap F-statistic reaches the traditional threshold of 10 (column 7).
Furthermore, a comparison of the Kleibergen-Paap F-statistic with the usual thresholds (Stock and Yogo,
2005) does not apply here, as estimations are adjusted for clustering (Rohner et al., 2013). Positive rainfall
deviations are likely to increase exposure to conflict-related violent events in areas historically tensed, and
17
rather decrease otherwise. The latter effect is small and significant at 10%. These results can be interpreted
in the light of the economic literature on the causes of civil war. The opportunity cost channel may prevail
in areas unaffected by past violence in Mali. It might then explain the negative impact of positive rainfall
variations on the occurrence of violence. A rent-seeking behaviour should be at stake in Malian land
disputed localities. Indeed, potentially higher rewards due to positive rainfall deviations may explain the
greater likelihood of the occurrence of violence.
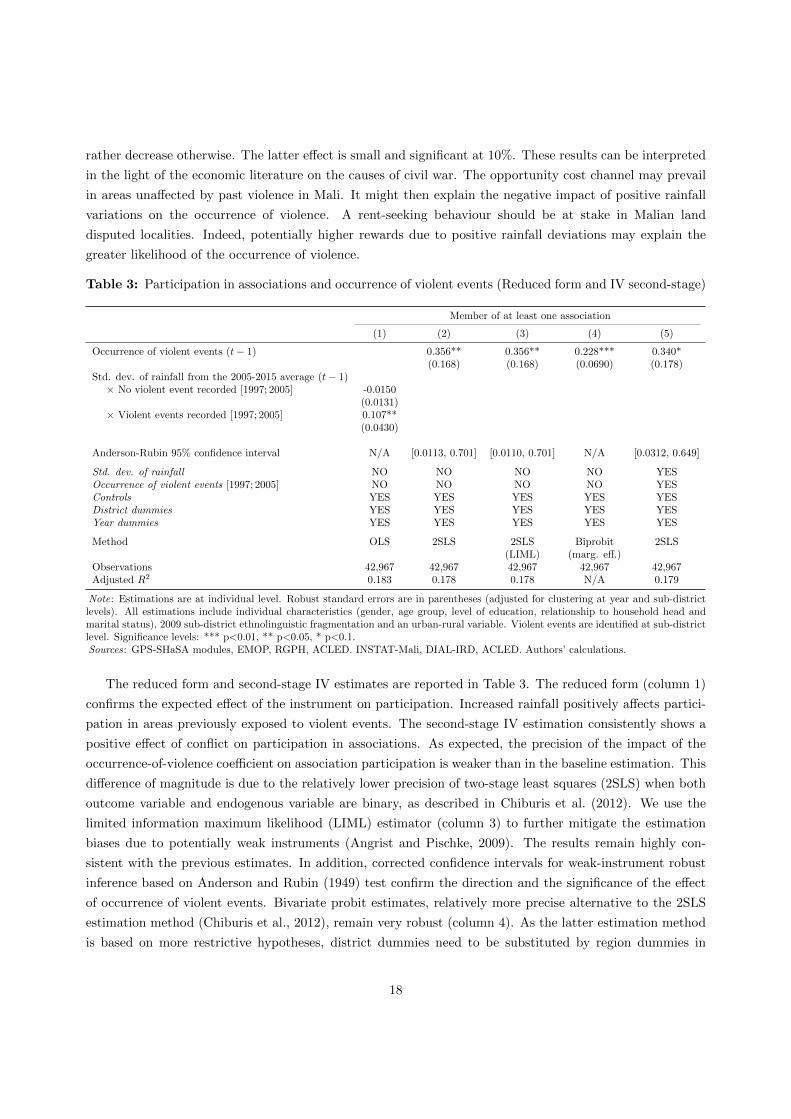
Table 3: Participation in associations and occurrence of violent events (Reduced form and IV second-stage)
Member of at least one association
(1) (2) (3) (4) (5)
Occurrence of violent events (t− 1) 0.356** 0.356** 0.228*** 0.340*(0.168) (0.168) (0.0690) (0.178)
Std. dev. of rainfall from the 2005-2015 average (t− 1)× No violent event recorded [1997; 2005] -0.0150
(0.0131)× Violent events recorded [1997; 2005] 0.107**
(0.0430)
Anderson-Rubin 95% confidence interval N/A [0.0113, 0.701] [0.0110, 0.701] N/A [0.0312, 0.649]
Std. dev. of rainfall NO NO NO NO YESOccurrence of violent events [1997; 2005] NO NO NO NO YESControls YES YES YES YES YESDistrict dummies YES YES YES YES YESYear dummies YES YES YES YES YES
Method OLS 2SLS 2SLS Biprobit 2SLS(LIML) (marg. eff.)
Observations 42,967 42,967 42,967 42,967 42,967Adjusted R2 0.183 0.178 0.178 N/A 0.179
Note: Estimations are at individual level. Robust standard errors are in parentheses (adjusted for clustering at year and sub-districtlevels). All estimations include individual characteristics (gender, age group, level of education, relationship to household head andmarital status), 2009 sub-district ethnolinguistic fragmentation and an urban-rural variable. Violent events are identified at sub-districtlevel. Significance levels: *** p<0.01, ** p<0.05, * p<0.1.Sources: GPS-SHaSA modules, EMOP, RGPH, ACLED. INSTAT-Mali, DIAL-IRD, ACLED. Authors’ calculations.
The reduced form and second-stage IV estimates are reported in Table 3. The reduced form (column 1)
confirms the expected effect of the instrument on participation. Increased rainfall positively affects partici-
pation in areas previously exposed to violent events. The second-stage IV estimation consistently shows a
positive effect of conflict on participation in associations. As expected, the precision of the impact of the
occurrence-of-violence coefficient on association participation is weaker than in the baseline estimation. This
difference of magnitude is due to the relatively lower precision of two-stage least squares (2SLS) when both
outcome variable and endogenous variable are binary, as described in Chiburis et al. (2012). We use the
limited information maximum likelihood (LIML) estimator (column 3) to further mitigate the estimation
biases due to potentially weak instruments (Angrist and Pischke, 2009). The results remain highly con-
sistent with the previous estimates. In addition, corrected confidence intervals for weak-instrument robust
inference based on Anderson and Rubin (1949) test confirm the direction and the significance of the effect
of occurrence of violent events. Bivariate probit estimates, relatively more precise alternative to the 2SLS
estimation method (Chiburis et al., 2012), remain very robust (column 4). As the latter estimation method
is based on more restrictive hypotheses, district dummies need to be substituted by region dummies in
18
the first-stage estimation.31 As reported in appendix Table A4, IV estimates confirm that participation is
mainly, if not exclusively, driven by participation in inward-looking groups.
Difference-in-differences estimations
We round out the IV estimation methods with a DiD estimation method applied to repeated cross-section
data (Wooldridge, 2009). IV estimates provide unbiased estimates under certain restrictions. Aside from
the difficulty of finding a satisfactory instrumental variable, IV estimates in our case are less precise due to
the fact that our outcome and endogenous variables are both binary (Chiburis et al., 2012). DiD estimates
are usually more accurate and able to rule out potential reverse causality bias and mitigates the risk of
unobserved heterogeneity between the control group and treatment group for all association types. The
pooled ELIM 2006 sample is identified as the pre-treatment period, while the GPS-SHaSA samples are used
as the post-treatment period. As mentioned above, participation data is measured at household level in 2006.
To ensure that harmonised, consistent scales are used for the analysis, we assume that all adult household
members in the post-2012 samples were asked about their involvement in associations.32 Hereafter, we use
a binary dependent variable taking the value of 1 if an adult belongs to a household in which at least one
member is part of an association and 0 otherwise.33 The treatment is the occurrence of violent events at
sub-district level from 2006 to 2015.34 Treated adults are those who live in a sub-district affected by one or
more violent events since 2006, while the control group includes adults living in sub-districts that were never
affected by violent events in the same time period. Formally, the DiD estimation method can be modelled
as follows:
(2)Yi,sd,t = α+ βEvOccsd,[2006;(t−1)] + λPost2012t + µ(EvOccsd,[2006;(t−1)] × Post2012t)
+ γXi,sd,t + δEthnFrsd,2009 + ηDd + θTt + πRr,2006 + ρRr,Post2012 + εi,sd,t
where EvOccsd,[2006;(t−1)] is a binary variable taking the value of 1 if one or more violent events were recorded
in sub-district sd from 2006 to the year before the survey and 0 otherwise. This variable corresponds to
the difference in participation between the control and treatment groups during the pre-treatment period
(2006). Post2012t differentiates between pre-treatment and post-treatment observations. The variable of
interest is the interaction between these latter two variables, as it captures the actual impact of exposure
to conflict-related violence on participation in groups. In addition to the same controls as those used in the
baseline estimations, we include pre- and post-treatment regional dummies to capture for regional structural
changes between the two periods. This interaction addresses the potential dynamic omitted variable bias
by capturing the most radical changes in infrastructures across regions over time. Robust standard errors
are adjusted for clustering at sub-district level.
The DiD estimation rests upon a strict common trend assumption. Under this assumption, the likelihood
of living in a household with an association member in exposed (treatment group) or non-exposed (control
group) sub-districts would follow a parallel trend if the conflict were not observed, which is a very strong
31The results remain consistent with the district dummies, but the first-stage equation is likely to be misspecified.32This could be problematic for households comprising four or more adults. However, this is a minor approximation, as it
affects less than 5% of the adults in our post-conflict pooled sample. Sensitivity checks and the correlation between householdand individual measures (from 0.7 to 0.8) confirm the absence of bias due to such measurement errors.
33Group membership of one household member impacts the rest of the household members (Jackson et al., 2012).34Since 92% of the violent events recorded from 2006 to 2015 took place and were the most intense in 2012 and after, the
effects of being exposed to violent events are attributed to the 2012 conflict.
19
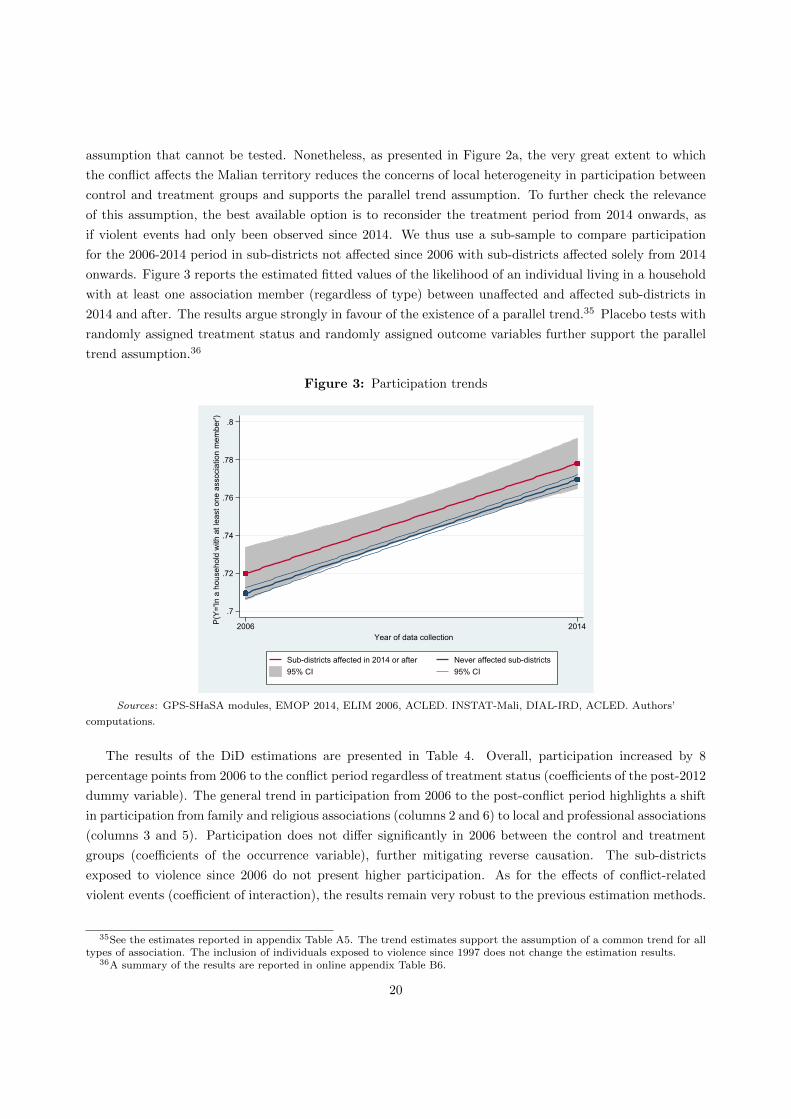
assumption that cannot be tested. Nonetheless, as presented in Figure 2a, the very great extent to which
the conflict affects the Malian territory reduces the concerns of local heterogeneity in participation between
control and treatment groups and supports the parallel trend assumption. To further check the relevance
of this assumption, the best available option is to reconsider the treatment period from 2014 onwards, as
if violent events had only been observed since 2014. We thus use a sub-sample to compare participation
for the 2006-2014 period in sub-districts not affected since 2006 with sub-districts affected solely from 2014
onwards. Figure 3 reports the estimated fitted values of the likelihood of an individual living in a household
with at least one association member (regardless of type) between unaffected and affected sub-districts in
2014 and after. The results argue strongly in favour of the existence of a parallel trend.35 Placebo tests with
randomly assigned treatment status and randomly assigned outcome variables further support the parallel
trend assumption.36
Figure 3: Participation trends
.7
.72
.74
.76
.78
.8
P(Y
='In
a h
ouse
hold
with
at l
east
one
ass
ocia
tion
mem
ber')
2006 2014Year of data collection
95% CISub-districts affected in 2014 or after
95% CINever affected sub-districts
Sources: GPS-SHaSA modules, EMOP 2014, ELIM 2006, ACLED. INSTAT-Mali, DIAL-IRD, ACLED. Authors’
computations.
The results of the DiD estimations are presented in Table 4. Overall, participation increased by 8
percentage points from 2006 to the conflict period regardless of treatment status (coefficients of the post-2012
dummy variable). The general trend in participation from 2006 to the post-conflict period highlights a shift
in participation from family and religious associations (columns 2 and 6) to local and professional associations
(columns 3 and 5). Participation does not differ significantly in 2006 between the control and treatment
groups (coefficients of the occurrence variable), further mitigating reverse causation. The sub-districts
exposed to violence since 2006 do not present higher participation. As for the effects of conflict-related
violent events (coefficient of interaction), the results remain very robust to the previous estimation methods.
35See the estimates reported in appendix Table A5. The trend estimates support the assumption of a common trend for alltypes of association. The inclusion of individuals exposed to violence since 1997 does not change the estimation results.
36A summary of the results are reported in online appendix Table B6.
20

Being exposed to conflict-related violence increases the likelihood of participation in associations even if the
coefficients are not significant (column 1). This upward trend in participation in exposed areas is driven by
the significant positive impact on membership in family and political associations, which is consistent with
our previous estimates. Indeed, being exposed to conflict increases participation by respectively 14 and 11
percentage points. Participation in local, professional and religious associations is not significantly affected
by the occurrence of violent events in Mali.
DiD estimates confirm our main findings: conflict-related violent events increase participation in asso-
ciations, but these results are driven by increased participation in inward-looking associations (family and
political groups).
Table 4: Participation in associations and occurrence of violent events (DiD)
Olsonian groups Putnamesque groups
At least one A family A political A professional A local A religiousassociation association association association association association
(1) (2) (3) (4) (5) (6)
Post-2012 dummy 0.0795* -0.106*** -0.00885 0.105*** 0.203*** -0.169***(0.0437) (0.0398) (0.0358) (0.0339) (0.0605) (0.0385)
Occurrence of violent events [2006; (t− 1)] -0.00848 -0.0875 -0.0203 0.0292 -0.0242 -0.0218(0.0503) (0.0596) (0.0396) (0.0401) (0.0451) (0.0296)
Post-2012 × Occurrence 0.0770 0.140* 0.116*** 0.0352 0.0535 0.0309(0.0583) (0.0742) (0.0424) (0.0410) (0.0555) (0.0337)
Controls YES YES YES YES YES YESDistrict dummies YES YES YES YES YES YESYear dummies YES YES YES YES YES YESRegion × Post-2012 dummies YES YES YES YES YES YES
Observations 54,878 54,860 54,883 54,888 54,891 54,892Adjusted R2 0.129 0.120 0.138 0.140 0.169 0.0852
Note: Estimations are at individual level. Robust standard errors are in parentheses (adjusted for clustering at sub-district level).All estimations include individual characteristics (gender, age group, level of education, relationship to household head and maritalstatus), 2009 sub-district ethnolinguistic fragmentation and an urban-rural variable. Violent events are identified at sub-districtlevel. Significance levels: *** p<0.01, ** p<0.05, * p<0.1.Sources: GPS-SHaSA modules, EMOP, ELIM, RGPH, ACLED. INSTAT-Mali, DIAL-IRD, ACLED. Authors’ calculations.
Selection into migration
Selection into migration is a source of concern in studies on the micro-effects of conflicts. In Mali, the
crisis forced almost 400,000 people to flee from their hometowns, particularly from the Timbuktu and Gao
regions, to neighbouring regions or countries in 2012 and 2013 (IOM, 2014a). The majority of those who fled
violence and lived in refugee camps abroad (Burkina Faso, Mauritania and Niger) did not come back and so
cannot be taken into account by the available data, which is a source of limitation for the present findings.
Nonetheless, the majority of the displaced population (61%) moved to neighbouring Malian areas, mainly
to Bamako and the Mopti and Segou regions. Internally displaced persons (IDPs) also moved within the
north (representing more than 30% of IDPs). A substantial share of IDPs spontaneously returned to their
place of origin before the 2013 presidential elections (UNHCR, 2014). By the end of 2014, approximately
80% of IDPs had returned to their hometowns (IOM, 2014b). Still, more than 50,000 IDPs were recorded
in 2016 (UNHCR, 2016). Those displaced individuals could bias our results if their social characteristics
21
were found to differ from the rest of the population. If displaced adults are less pro-social, as documented
by Gilligan et al. (2014) in the case of the Nepalese civil war, our results would be overestimated. Less
pro-social individuals would then lower the actual levels of participation in groups in non-exposed areas.
Conversely, IDPs could conceivably be more pro-social, resulting in the underestimation of impacts, or as
social as others.
We have data on migration for 2015. They show that migrants are younger and more educated. These
two characteristics have opposite effects on the probability of participating in an association. It is thus
unclear how migrants would bias our results. To control for selection into migration, we exclude from
the 2015 sample all adults who migrated in the past ten years (almost 2,000 observations) and recalibrate
the participation measure. The characteristics of the adults interviewed in 2006 should not differ from
those interviewed in 2015. The results of the unconstrained (panel A) and constrained (migrants excluded,
panel B) DiD estimations are presented in appendix Table A6. The results are consistent with the baseline
estimation and rule out selection into migration.
5. Going further: Are strong ties favoured?
5.1. Participation in fragmented areas
If being exposed to violent events robustly implies an increase in participation in associations, this
concerns primarily family and political associations. Family associations concern only kinship-based related
adults, while political associations are described in the literature as a necessary tool for satisfying particular
groups’ interests in Mali (Roy, 2005). The latter’s cronyism practices in favouring in-groups are documented,
as in Roy (2010). Other types of associational membership seem to be affected more heterogeneously by
the conflict. Participation in more heterogeneously-composed associations is impacted at much lower levels
and non-significantly, compared with participation in family or political associations. This is particularly
the case with local development associations, which account for the highest number of members in Mali.
Local associations are central to local development, replacing weak or absent institutions to provide public
goods such as health and education infrastructures. Their intrinsic role implies a certain representativeness
of the different groups’ interests. These results hence suggest that kinship-based interactions are favoured
in the case of exposure to violent events, perhaps at the expense of bridging ties via an exclusion process.
Therefore, our results tend to indicate that only bonding social capital, via inward-looking organisations,
has increased.
The available data do not enable us to directly identify adults’ withdrawal within their own groups in
conflict-affected areas. For instance, we are not able to observe the associations’ compositions. However, we
are able to further investigate this hypothesis by studying associational membership in highly heterogeneous
localities versus more homogeneous localities. In Mali, some associations, particularly local associations,
have to take into account the concerns of all groups living in the same area to serve the general interest. As
they need to achieve some local representativeness, local associations ought to be somewhat heterogeneously
composed in fragmented areas. If bridging ties are actually deteriorating in Mali, participation in local
associations would be negatively affected by violence in the most fragmented areas. Simultaneously, partici-
pation would increase in associations based on kinship ties. To differentiate homogeneous and heterogeneous
22
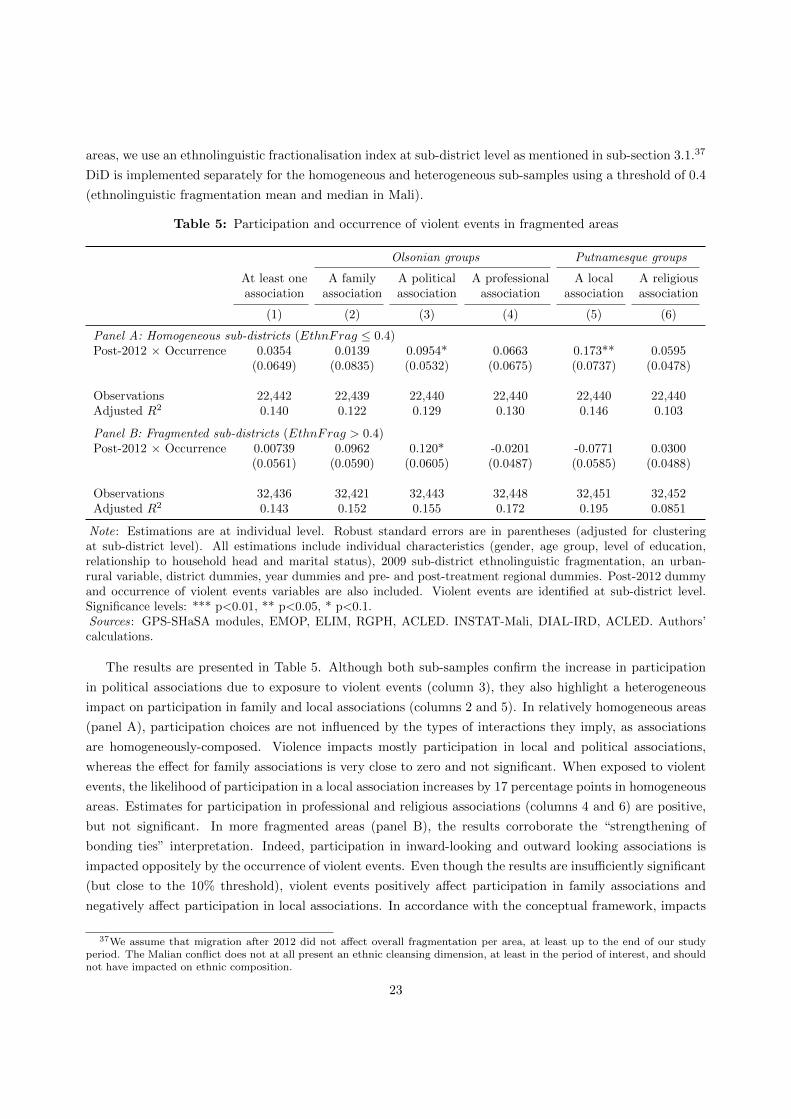
areas, we use an ethnolinguistic fractionalisation index at sub-district level as mentioned in sub-section 3.1.37
DiD is implemented separately for the homogeneous and heterogeneous sub-samples using a threshold of 0.4
(ethnolinguistic fragmentation mean and median in Mali).
Table 5: Participation and occurrence of violent events in fragmented areas
Olsonian groups Putnamesque groups
At least one A family A political A professional A local A religiousassociation association association association association association
(1) (2) (3) (4) (5) (6)
Panel A: Homogeneous sub-districts (EthnFrag ≤ 0.4)Post-2012 × Occurrence 0.0354 0.0139 0.0954* 0.0663 0.173** 0.0595
(0.0649) (0.0835) (0.0532) (0.0675) (0.0737) (0.0478)
Observations 22,442 22,439 22,440 22,440 22,440 22,440Adjusted R2 0.140 0.122 0.129 0.130 0.146 0.103
Panel B: Fragmented sub-districts (EthnFrag > 0.4)Post-2012 × Occurrence 0.00739 0.0962 0.120* -0.0201 -0.0771 0.0300
(0.0561) (0.0590) (0.0605) (0.0487) (0.0585) (0.0488)
Observations 32,436 32,421 32,443 32,448 32,451 32,452Adjusted R2 0.143 0.152 0.155 0.172 0.195 0.0851
Note: Estimations are at individual level. Robust standard errors are in parentheses (adjusted for clusteringat sub-district level). All estimations include individual characteristics (gender, age group, level of education,relationship to household head and marital status), 2009 sub-district ethnolinguistic fragmentation, an urban-rural variable, district dummies, year dummies and pre- and post-treatment regional dummies. Post-2012 dummyand occurrence of violent events variables are also included. Violent events are identified at sub-district level.Significance levels: *** p<0.01, ** p<0.05, * p<0.1.Sources: GPS-SHaSA modules, EMOP, ELIM, RGPH, ACLED. INSTAT-Mali, DIAL-IRD, ACLED. Authors’calculations.
The results are presented in Table 5. Although both sub-samples confirm the increase in participation
in political associations due to exposure to violent events (column 3), they also highlight a heterogeneous
impact on participation in family and local associations (columns 2 and 5). In relatively homogeneous areas
(panel A), participation choices are not influenced by the types of interactions they imply, as associations
are homogeneously-composed. Violence impacts mostly participation in local and political associations,
whereas the effect for family associations is very close to zero and not significant. When exposed to violent
events, the likelihood of participation in a local association increases by 17 percentage points in homogeneous
areas. Estimates for participation in professional and religious associations (columns 4 and 6) are positive,
but not significant. In more fragmented areas (panel B), the results corroborate the “strengthening of
bonding ties” interpretation. Indeed, participation in inward-looking and outward looking associations is
impacted oppositely by the occurrence of violent events. Even though the results are insufficiently significant
(but close to the 10% threshold), violent events positively affect participation in family associations and
negatively affect participation in local associations. In accordance with the conceptual framework, impacts
37We assume that migration after 2012 did not affect overall fragmentation per area, at least up to the end of our studyperiod. The Malian conflict does not at all present an ethnic cleansing dimension, at least in the period of interest, and shouldnot have impacted on ethnic composition.
23
are differentiated by type of association (inward-looking or outward-looking associations). Associations
based on weak ties appear to suffer from the occurrence of violent events, while the opposite holds true
for those based on kinship or shared affinities, particularly family and political associations. In exposed
areas, participation to the latter associations increase by 12 percentage points. The results of the sub-
sample estimations thus confirm the strengthening of bonding ties through the empowerment of same-group
interest associations. Associations that include individuals from out-groups appear to attract progressively
fewer individuals. The impact of conflict on social engagement appears to foster withdrawal into one’s own
group rather than increased solidarity between Malians. The study of the impact of conflict-related violence
on interpersonal trust is discussed in the next section and supports this interpretation.
5.2. Effects of conflict on interpersonal trust
Further interpretation of the impacts of conflict on participation calls for the mechanisms at stake to be
understood. Given the assumed link between participation in groups and interpersonal trust (Sønderskov,
2011; Paxton and Ressler, 2017), we look into the effects of violent events on interpersonal trust. Consistently,
based on the available data, individual participation in associations is positively correlated with trust in out-
groups. Thus, if trust increased in affected areas, the parallel increase in participation could represent an
actual improvement in social capital, which would facilitate post-war convergence with unaffected areas.
Conversely, a decline in out-group trust might indicate the development of self-centred exclusive groups.
The increased participation due to exposure to violent events in Mali could be then identified as a form
of withdrawal rather than pro-social behaviour. Information on interpersonal trust is only available in the
post-2012 samples. We keep as the dependent variable the probability of an adult trusting in a specified
group. This variable takes the value of 1 when an adult trusts (“Somewhat” or “Completely”) and 0 when
the adult does not (“Not at all” or “Not really”).
Table 6 presents the LPM baseline estimations.38 The occurrence of violence tends to significantly lower
generalised trust by 11 percentage points (column 1). The results are particularly significant for trust in
those with a different political opinion or a different nationality. Being affected by conflict increases distrust
in the latter out-groups by 6 to 7 percentage points. Although the results for trust in other groups are
not significant, they still make for interesting trends. While the coefficients for trust in out-groups, namely
other ethnic groups and other linguistic groups, are negative (columns 4 and 5), the coefficient related to
neighbours is positive and close to zero. Trust in relatives (column 2) is marginally, but negatively related to
violence. This latter negative result could cast doubt on the hypothesis of the strengthening of kinship-based
ties. However, considering the Malian reality, this result has to be qualified. First, trust in relatives is a
measure which refers globally to members of the extended family. Some of them can be excluded from family
associations, which gather a narrow circle of persons (the close relatives) to whom individuals fall back in
their withdrawal strategy. Second, the level of trust in relatives is very high in Mali, as 95% of Malians trust
their family members: a marginal decrease leaves trust in family members quite high.
We take advantage of the ordered response options offered by the interpersonal trust questions to delve
deeper into the potential effects of the occurrence of violence on trust levels. Instead of using a simple
positive/negative dependent binary variable, we use each response option against the other options as the
dependent binary variable. For each type of trust question, we use four different dependent variables, which
38Alternative specifications were estimated. The results, reported in online appendix Table B7, remain very consistent.
24

Table 6: Interpersonal trust and occurrence of violent events
Trust in:
GeneralisedRelatives Neighbours
Other Other Different Othertrust ethnic group linguistic group pol. opinion nationality
(1) (2) (3) (4) (5) (6) (7)
Occurrence of violent events (t− 1) -0.111*** -0.0227** 0.0190 -0.0396 -0.0333 -0.0720** -0.0625*(0.0360) (0.00982) (0.0235) (0.0305) (0.0306) (0.0326) (0.0339)
Controls YES YES YES YES YES YES YESDistrict dummies YES YES YES YES YES YES YESYear dummies YES YES YES YES YES YES YES
Observations 42,936 42,814 42,987 42,996 42,995 42,995 42,966Adjusted R2 0.105 0.0744 0.0741 0.116 0.117 0.120 0.132
Note: Estimations are at individual level. Robust standard errors are in parentheses (adjusted for clustering at year and sub-district levels).All estimations include individual characteristics (gender, age group, level of education, relationship to household head and marital status),2009 sub-district ethnolinguistic fragmentation and an urban-rural variable. Violent events are identified at sub-district level. Significancelevels: *** p<0.01, ** p<0.05, * p<0.1.Sources: GPS-SHaSA modules, EMOP, RGPH, ACLED. INSTAT-Mali, DIAL-IRD, ACLED. Authors’ calculations.
take the value of 1 if corresponding to the option of interest and 0 for any other response option. The
estimates reported in Table 7 confirm the signs of the effects of violent events on interpersonal trust in Mali.
The low significance levels of the previous estimates can be explained by the almost null impact of conflict
on extreme answers. Adults are not significantly more likely to be “not at all” or “very” trusting (line 1
and 4) in exposed sub-districts. By contrast, those who are more balanced display greater sensitivity to
the occurrence of violence. The detailed estimations confirm the lower generalised trust as well as trust in
persons with different political opinions and trust in foreigners (respectively columns 1, 6 and 7). Trust
in family members (column 2) seems not as negatively affected as in baseline estimates when looking at
the details. Although citizens trust less “somewhat” in their own family members, they trust more “very”
much. The impact on negative levels of trust remains very close to zero when it comes to family members.
Trust in neighbours (column 3) seems also to be very marginally affected by violence, as none of the options
are affected significantly. In addition, the results support the negative effect of the Malian conflict on trust
in other ethnic groups (column 4) and to a lesser extent trust in other linguistic groups (column 5). Indeed,
although the least and most trustful individuals do not appear to be affected by violence occurrence, exposed
adults are more likely to “not really” trust other ethnic groups by 5 percentage points, significantly at 10%.
At the same time, the likelihood of trusting “somewhat” also decreases. Distrust in those with a different
political opinion is particularly and negatively affected by the occurrence of violence confirming the impact
on association membership. These results support the weakening of bridging ties and withdrawal into one’s
own group. Trust in closely-related people is affected to a very marginal extent by conflict occurrence, which
differs from trust in out-groups.
As with the regressions on participation in associations, there is a risk of endogeneity bias from omitted
variables and reverse causality. First, omitted variable bias is partly addressed by the implementation of
the baseline estimation with additional controls. The results are presented in online appendix Table B8.
The decline in generalised trust remains consistent across the estimations. In addition, we follow Altonji
et al. (2005) procedure to measure the relative size of unobservables to observables to explain away the
effect of occurrence of violent events on interpersonal trust. According to the different measures of trust,
25
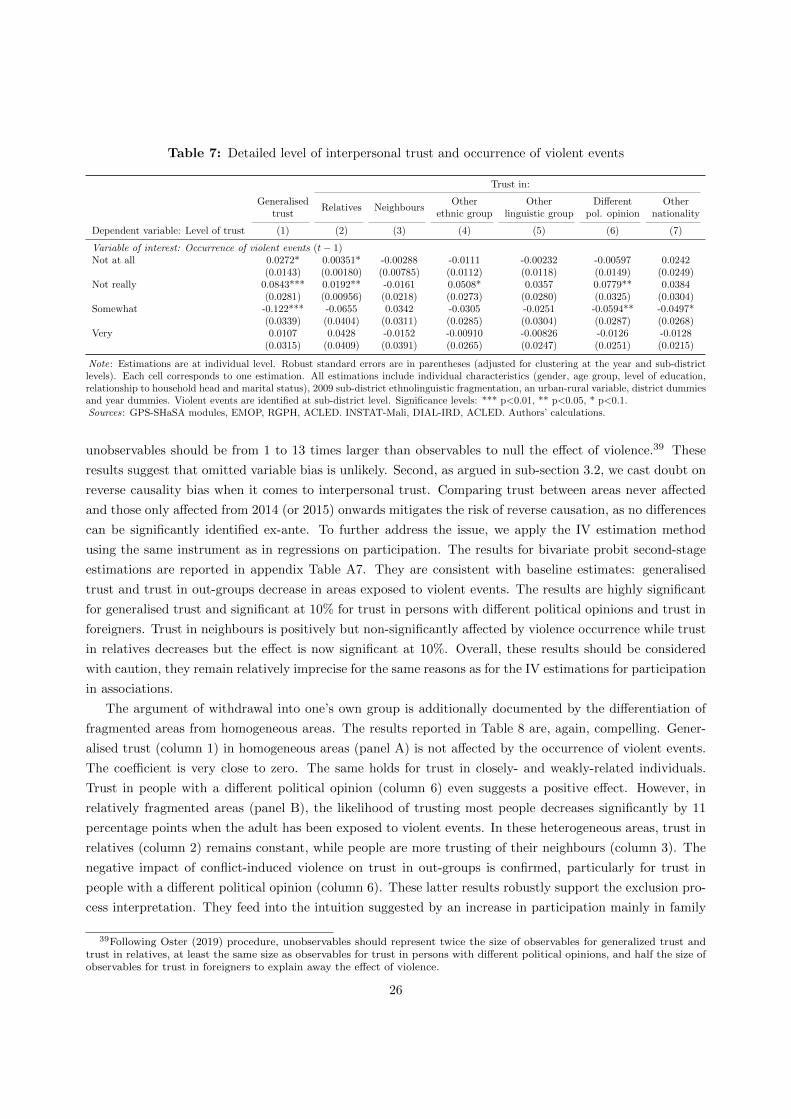
Table 7: Detailed level of interpersonal trust and occurrence of violent events
Trust in:
GeneralisedRelatives Neighbours
Other Other Different Othertrust ethnic group linguistic group pol. opinion nationality
Dependent variable: Level of trust (1) (2) (3) (4) (5) (6) (7)
Variable of interest: Occurrence of violent events (t− 1)Not at all 0.0272* 0.00351* -0.00288 -0.0111 -0.00232 -0.00597 0.0242
(0.0143) (0.00180) (0.00785) (0.0112) (0.0118) (0.0149) (0.0249)Not really 0.0843*** 0.0192** -0.0161 0.0508* 0.0357 0.0779** 0.0384
(0.0281) (0.00956) (0.0218) (0.0273) (0.0280) (0.0325) (0.0304)Somewhat -0.122*** -0.0655 0.0342 -0.0305 -0.0251 -0.0594** -0.0497*
(0.0339) (0.0404) (0.0311) (0.0285) (0.0304) (0.0287) (0.0268)Very 0.0107 0.0428 -0.0152 -0.00910 -0.00826 -0.0126 -0.0128
(0.0315) (0.0409) (0.0391) (0.0265) (0.0247) (0.0251) (0.0215)
Note: Estimations are at individual level. Robust standard errors are in parentheses (adjusted for clustering at the year and sub-districtlevels). Each cell corresponds to one estimation. All estimations include individual characteristics (gender, age group, level of education,relationship to household head and marital status), 2009 sub-district ethnolinguistic fragmentation, an urban-rural variable, district dummiesand year dummies. Violent events are identified at sub-district level. Significance levels: *** p<0.01, ** p<0.05, * p<0.1.Sources: GPS-SHaSA modules, EMOP, RGPH, ACLED. INSTAT-Mali, DIAL-IRD, ACLED. Authors’ calculations.
unobservables should be from 1 to 13 times larger than observables to null the effect of violence.39 These
results suggest that omitted variable bias is unlikely. Second, as argued in sub-section 3.2, we cast doubt on
reverse causality bias when it comes to interpersonal trust. Comparing trust between areas never affected
and those only affected from 2014 (or 2015) onwards mitigates the risk of reverse causation, as no differences
can be significantly identified ex-ante. To further address the issue, we apply the IV estimation method
using the same instrument as in regressions on participation. The results for bivariate probit second-stage
estimations are reported in appendix Table A7. They are consistent with baseline estimates: generalised
trust and trust in out-groups decrease in areas exposed to violent events. The results are highly significant
for generalised trust and significant at 10% for trust in persons with different political opinions and trust in
foreigners. Trust in neighbours is positively but non-significantly affected by violence occurrence while trust
in relatives decreases but the effect is now significant at 10%. Overall, these results should be considered
with caution, they remain relatively imprecise for the same reasons as for the IV estimations for participation
in associations.
The argument of withdrawal into one’s own group is additionally documented by the differentiation of
fragmented areas from homogeneous areas. The results reported in Table 8 are, again, compelling. Gener-
alised trust (column 1) in homogeneous areas (panel A) is not affected by the occurrence of violent events.
The coefficient is very close to zero. The same holds for trust in closely- and weakly-related individuals.
Trust in people with a different political opinion (column 6) even suggests a positive effect. However, in
relatively fragmented areas (panel B), the likelihood of trusting most people decreases significantly by 11
percentage points when the adult has been exposed to violent events. In these heterogeneous areas, trust in
relatives (column 2) remains constant, while people are more trusting of their neighbours (column 3). The
negative impact of conflict-induced violence on trust in out-groups is confirmed, particularly for trust in
people with a different political opinion (column 6). These latter results robustly support the exclusion pro-
cess interpretation. They feed into the intuition suggested by an increase in participation mainly in family
39Following Oster (2019) procedure, unobservables should represent twice the size of observables for generalized trust andtrust in relatives, at least the same size as observables for trust in persons with different political opinions, and half the size ofobservables for trust in foreigners to explain away the effect of violence.
26
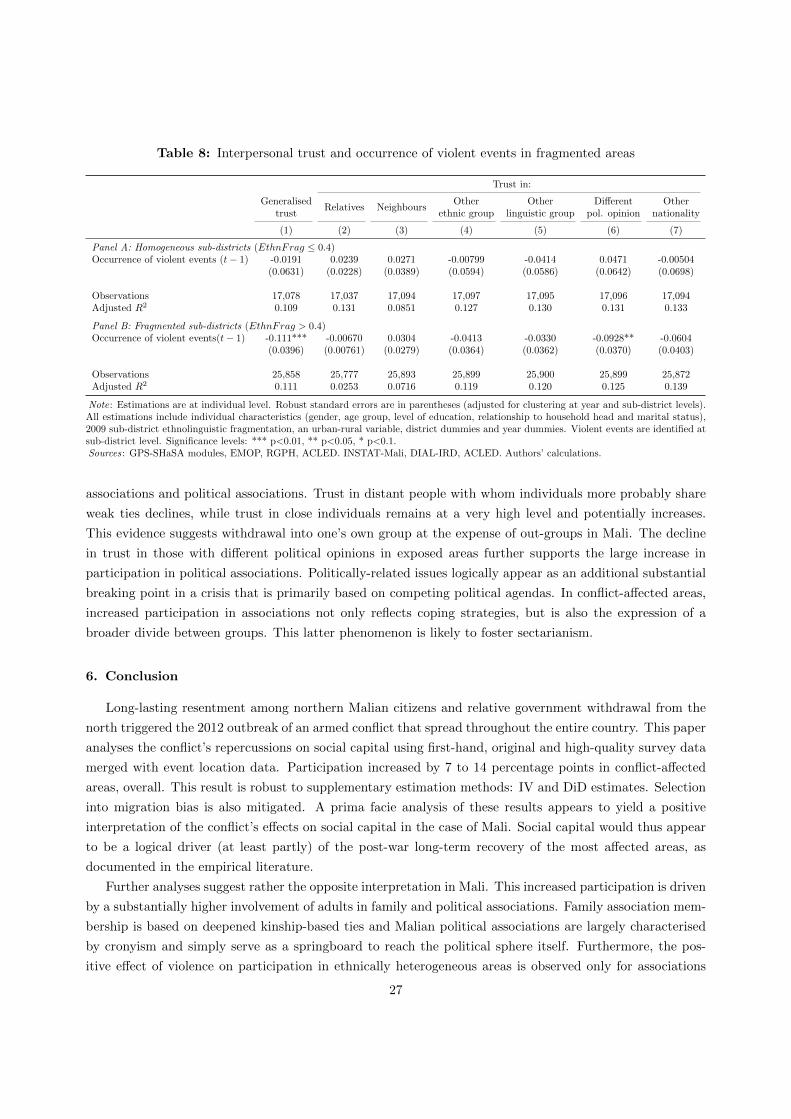
Table 8: Interpersonal trust and occurrence of violent events in fragmented areas
Trust in:
GeneralisedRelatives Neighbours
Other Other Different Othertrust ethnic group linguistic group pol. opinion nationality
(1) (2) (3) (4) (5) (6) (7)
Panel A: Homogeneous sub-districts (EthnFrag ≤ 0.4)Occurrence of violent events (t− 1) -0.0191 0.0239 0.0271 -0.00799 -0.0414 0.0471 -0.00504
(0.0631) (0.0228) (0.0389) (0.0594) (0.0586) (0.0642) (0.0698)
Observations 17,078 17,037 17,094 17,097 17,095 17,096 17,094Adjusted R2 0.109 0.131 0.0851 0.127 0.130 0.131 0.133
Panel B: Fragmented sub-districts (EthnFrag > 0.4)Occurrence of violent events(t− 1) -0.111*** -0.00670 0.0304 -0.0413 -0.0330 -0.0928** -0.0604
(0.0396) (0.00761) (0.0279) (0.0364) (0.0362) (0.0370) (0.0403)
Observations 25,858 25,777 25,893 25,899 25,900 25,899 25,872Adjusted R2 0.111 0.0253 0.0716 0.119 0.120 0.125 0.139
Note: Estimations are at individual level. Robust standard errors are in parentheses (adjusted for clustering at year and sub-district levels).All estimations include individual characteristics (gender, age group, level of education, relationship to household head and marital status),2009 sub-district ethnolinguistic fragmentation, an urban-rural variable, district dummies and year dummies. Violent events are identified atsub-district level. Significance levels: *** p<0.01, ** p<0.05, * p<0.1.Sources: GPS-SHaSA modules, EMOP, RGPH, ACLED. INSTAT-Mali, DIAL-IRD, ACLED. Authors’ calculations.
associations and political associations. Trust in distant people with whom individuals more probably share
weak ties declines, while trust in close individuals remains at a very high level and potentially increases.
This evidence suggests withdrawal into one’s own group at the expense of out-groups in Mali. The decline
in trust in those with different political opinions in exposed areas further supports the large increase in
participation in political associations. Politically-related issues logically appear as an additional substantial
breaking point in a crisis that is primarily based on competing political agendas. In conflict-affected areas,
increased participation in associations not only reflects coping strategies, but is also the expression of a
broader divide between groups. This latter phenomenon is likely to foster sectarianism.
6. Conclusion
Long-lasting resentment among northern Malian citizens and relative government withdrawal from the
north triggered the 2012 outbreak of an armed conflict that spread throughout the entire country. This paper
analyses the conflict’s repercussions on social capital using first-hand, original and high-quality survey data
merged with event location data. Participation increased by 7 to 14 percentage points in conflict-affected
areas, overall. This result is robust to supplementary estimation methods: IV and DiD estimates. Selection
into migration bias is also mitigated. A prima facie analysis of these results appears to yield a positive
interpretation of the conflict’s effects on social capital in the case of Mali. Social capital would thus appear
to be a logical driver (at least partly) of the post-war long-term recovery of the most affected areas, as
documented in the empirical literature.
Further analyses suggest rather the opposite interpretation in Mali. This increased participation is driven
by a substantially higher involvement of adults in family and political associations. Family association mem-
bership is based on deepened kinship-based ties and Malian political associations are largely characterised
by cronyism and simply serve as a springboard to reach the political sphere itself. Furthermore, the pos-
itive effect of violence on participation in ethnically heterogeneous areas is observed only for associations
27
where membership is based on kinship. In contrast, participation in heterogeneously-composed associations
decreases in fragmented areas affected by violent events. This is the case for the most popular associations,
namely, local development associations. The latter are a necessary means to improve individual and local
living conditions via better access to information and more efficient collective action. Hence, where associa-
tions tend to be more heterogeneous, conflict has the opposite effect: violence implies disengagement. The
negative effect of the occurrence of violence on participation in heterogeneous associations makes even more
sense in the light of the developments in interpersonal trust in affected areas. We find that trust in people
from out-groups declines in the case of exposure to violence, while trust in close individuals remains at very
high levels and even tends to increase.
Our paper provides new empirical evidence on how conflict impacts social capital. We find differentiated
effects depending on the type of association and the level of ethnic fragmentation in the local area. We
show that the distinction between bonding-type (inward-looking) and bridging-type (outward-looking) social
capital is necessary to fully capture the effects of conflict. We provide evidence of an increased in-group bias
in conflict-affected areas, whose existence has been deemed speculative to date (Bauer et al., 2016). Even
though the study is context-specific, these findings cast doubt on the role attributed to social capital as a
driver of post-war and post-conflict recovery.
Our analysis is not only a step forward for the literature, but more importantly, makes for a better
understanding of the ongoing conflict in a country destabilised by jihadist activities presenting a real risk
for the entire Sahelian region. The results shed light on a rather worrying impact of conflict on social
capital in Mali. The weakening of bridging associations implying the corrosion of bridging ties could be
socioeconomically detrimental. At the same time, the development of inward-looking, Olsonian associations
is even more worrying since the shift in interactions from out-groups to in-groups suggests a deepening of the
conflict into entrenched opposition between groups. This opposition is shaped by greater political opposition
and kinship within communities and ethnic groups. Incentives to engage with others diminish as distrust
and exclusion increase because of the conflict. Interpersonal exchanges between Malians and between groups
could therefore be negatively impacted to an even greater extent. This would be a harbinger of the conflict
having negative indirect impacts on economic and political development in the longer run. Our analysis
aligns and agrees with some experts’ views as to the need for suitable solutions to avoid the entrenchment of
violent opposition in Mali (Guichaoua and Pellerin, 2017). Some solutions may be found in more inclusive
governance policies, including better representativeness and incentives for ethnic mixing. Our study also
suggests that particular attention should be paid to local associations representing “bridging-type” social
capital in Mali. They could play a role in preventing a conflict trap whereby armed conflict aggravates social
divisions which escalate the conflict.
28

Appendix A
Table A1: Main variables of interest - Descriptive statistics
2006 2014 2015 2016
Mean Std. Dev Mean Std. Dev Mean Std. Dev Mean Std. Dev
Variables from survey dataAssociation participation (2006: participation at household level, individual level otherwise)In at least one association 0.66 0.47 0.58 0.49 0.52 0.50 0.54 0.50In a family association 0.31 0.46 0.20 0.40 0.18 0.38 0.20 0.40In a political association 0.24 0.43 0.17 0.38 0.13 0.33 0.24 0.43In a professional association 0.20 0.40 0.19 0.39 0.17 0.38 0.19 0.39In a local association 0.35 0.48 0.38 0.48 0.35 0.48 0.35 0.48In a religious association 0.26 0.44 0.14 0.35 0.12 0.33 0.12 0.32Interpersonal trustGeneralised trust N/A 0.66 0.47 0.69 0.46 0.70 0.46Trust in relatives N/A 0.96 0.20 0.90 0.30 0.95 0.21Trust in neighbours N/A 0.79 0.41 0.75 0.43 0.81 0.39Trust in person from a different ethnic group N/A 0.63 0.48 0.61 0.49 0.64 0.48Trust in person speaking a different language N/A 0.60 0.49 0.59 0.49 0.62 0.48Trust in person with a different political opinion N/A 0.57 0.49 0.58 0.49 0.62 0.49Trust in person with a different nationality N/A 0.48 0.50 0.52 0.50 0.52 0.50Scared of terrorist threat N/A 0.53 0.50 0.63 0.48 0.70 0.46Scared of armed conflict/war threat N/A 0.54 0.50 0.59 0.49 0.59 0.49
Number of observations 11,670 13,835 15,135 14,335Treated (t− 1) 0.22 0.20 0.31Treated [2012; (t− 1)] 0.25 0.31 0.35Treated [2006; (t− 1)] 0.28 0.33 0.38Number of households 4,494 5,214 6,074 5,881
Event data variables (within Malian regions surveyed)Violent events (t− 1) (a) 0.00 0.00 0.24 1.50 0.12 0.90 0.31 1.37[Min;Max] [0;0] [0;17] [0;10] [0;13]Violent events [2012; (t− 1)] (a) 0.38 2.19 1.20 7.78 1.58 9.28[Min;Max] [0;23] [0;98] [0;111]Violent events [2006; (t− 1)] (a) 0.43 2.37 1.32 8.42 1.70 9.95[Min;Max] [0;26] [0;101] [0;114]Fatalities (t− 1) (a) 0.00 0.00 1.03 9.90 0.24 2.08 0.79 3.70[Min;Max] [0;0] [0;140] [0;28] [0;32]Fatalities [2012; (t− 1)] (a) 1.17 10.24 3.07 21.33 4.09 24.84[Min;Max] [0;140] [0;263] [0;295]Fatalities [2006; (t− 1)] (a) 1.29 10.32 3.26 22.28 4.05 25.83[Min;Max] [0;140] [0;266] [0;298]
Note: (a)per sub-district. Weighted survey data.Sources: GPS-SHaSA modules, EMOP, ELIM, RGPH, ACLED. INSTAT-Mali, DIAL-IRD, ACLED. Authors’ calculations.
Appendix B
29

Figure A1: Malian administrative divisions
(a) 9 regions (b) 49 districts (c) 302 sub-districts
Table A2: Other control variables - Descriptive statistics
2006 2014 2015 2016
Mean Std. Dev Mean Std. Dev Mean Std. Dev Mean Std. Dev
Variables from survey dataFemale 0.54 0.50 0.53 0.50 0.54 0.50 0.52 0.50Rural 0.64 0.48 0.68 0.47 0.73 0.44 0.74 0.44Level of education reached
No education 0.78 0.41 0.68 0.46 0.74 0.44 0.72 0.45Fondamental I 0.09 0.29 0.16 0.37 0.12 0.32 0.13 0.33Fondamental II 0.06 0.24 0.07 0.25 0.08 0.28 0.09 0.28Secondary 0.05 0.21 0.07 0.25 0.04 0.20 0.05 0.21Post-Secondary 0.02 0.13 0.02 0.15 0.02 0.14 0.02 0.13
Age 37.72 14.83 38.06 15.85 38.76 15.53 38.77 15.13Age group
18 - 24 y.o. 0.20 0.40 0.22 0.41 0.20 0.40 0.19 0.3925 - 30 y.o. 0.19 0.40 0.20 0.40 0.19 0.39 0.20 0.4031 - 40 y.o. 0.25 0.43 0.22 0.41 0.23 0.42 0.23 0.4241 - 50 y.o. 0.17 0.38 0.15 0.35 0.15 0.36 0.17 0.3751 - 60 y.o. 0.08 0.28 0.09 0.28 0.10 0.30 0.10 0.3061 y.o. and more 0.10 0.30 0.13 0.33 0.13 0.33 0.12 0.32
Relationship to household headHead 0.32 0.47 0.22 0.41 0.26 0.44 0.30 0.46Spouse 0.33 0.47 0.26 0.44 0.30 0.46 0.33 0.47Child 0.14 0.35 0.16 0.36 0.17 0.37 0.17 0.37Other relatives 0.19 0.39 0.34 0.48 0.25 0.44 0.20 0.40Other unrelated members 0.01 0.12 0.02 0.14 0.01 0.10 0.01 0.10
Marital statusMarried (monogamous) 0.54 0.50 0.47 0.50 0.47 0.50 0.51 0.50Married (polygamous) 0.23 0.42 0.29 0.45 0.31 0.46 0.30 0.46Common law couple 0.00 0.02 0.01 0.08 0.01 0.09 0.01 0.08Single 0.16 0.36 0.17 0.38 0.15 0.35 0.13 0.34Divorced/Separated 0.01 0.11 0.01 0.08 0.01 0.10 0.00 0.06Widow 0.06 0.25 0.06 0.23 0.05 0.23 0.05 0.21
2009 census data Mean Std. Dev.Ethnolinguistic fragmentation (per commune) 0.39 0.20Ethnolinguistic fragmentation (per sub-district) 0.41 0.19
Note: Weighted survey data.Sources: GPS-SHaSA modules, EMOP, ELIM, RGPH. INSTAT-Mali, DIAL-IRD. Authors’ calculations.
30
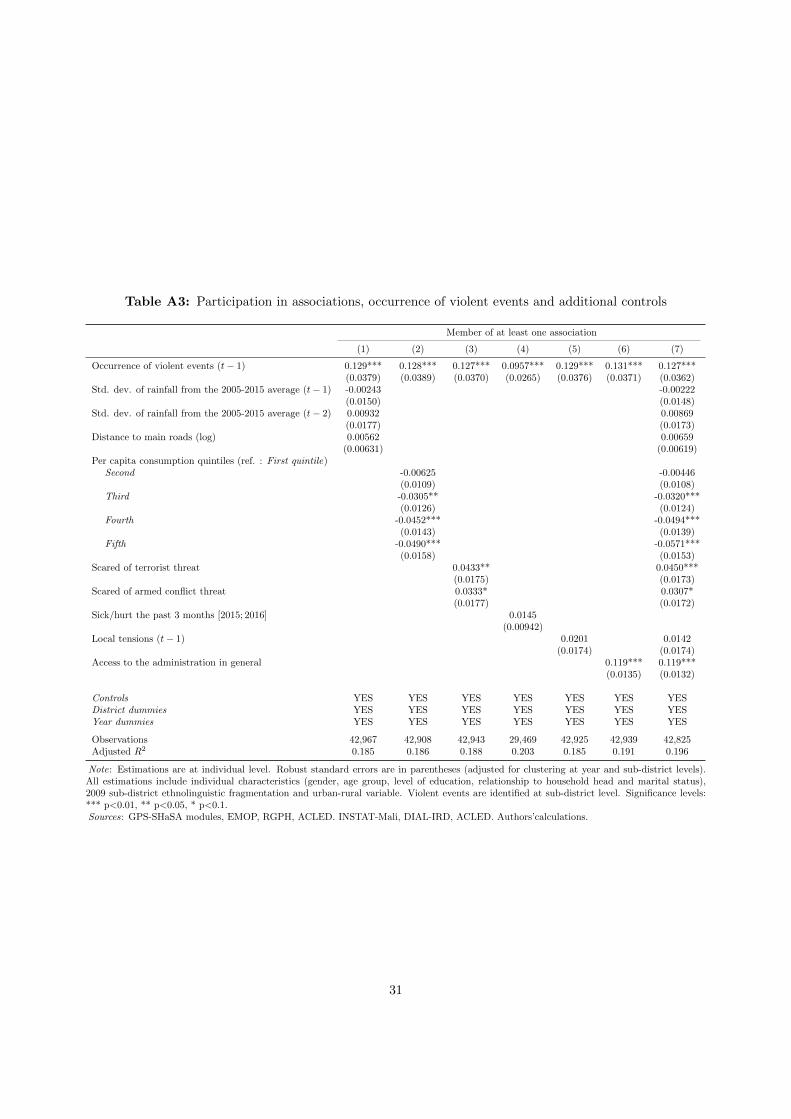
Table A3: Participation in associations, occurrence of violent events and additional controls
Member of at least one association
(1) (2) (3) (4) (5) (6) (7)
Occurrence of violent events (t− 1) 0.129*** 0.128*** 0.127*** 0.0957*** 0.129*** 0.131*** 0.127***(0.0379) (0.0389) (0.0370) (0.0265) (0.0376) (0.0371) (0.0362)
Std. dev. of rainfall from the 2005-2015 average (t− 1) -0.00243 -0.00222(0.0150) (0.0148)
Std. dev. of rainfall from the 2005-2015 average (t− 2) 0.00932 0.00869(0.0177) (0.0173)
Distance to main roads (log) 0.00562 0.00659(0.00631) (0.00619)
Per capita consumption quintiles (ref. : First quintile)Second -0.00625 -0.00446
(0.0109) (0.0108)Third -0.0305** -0.0320***
(0.0126) (0.0124)Fourth -0.0452*** -0.0494***
(0.0143) (0.0139)Fifth -0.0490*** -0.0571***
(0.0158) (0.0153)Scared of terrorist threat 0.0433** 0.0450***
(0.0175) (0.0173)Scared of armed conflict threat 0.0333* 0.0307*
(0.0177) (0.0172)Sick/hurt the past 3 months [2015; 2016] 0.0145
(0.00942)Local tensions (t− 1) 0.0201 0.0142
(0.0174) (0.0174)Access to the administration in general 0.119*** 0.119***
(0.0135) (0.0132)
Controls YES YES YES YES YES YES YESDistrict dummies YES YES YES YES YES YES YESYear dummies YES YES YES YES YES YES YES
Observations 42,967 42,908 42,943 29,469 42,925 42,939 42,825Adjusted R2 0.185 0.186 0.188 0.203 0.185 0.191 0.196
Note: Estimations are at individual level. Robust standard errors are in parentheses (adjusted for clustering at year and sub-district levels).All estimations include individual characteristics (gender, age group, level of education, relationship to household head and marital status),2009 sub-district ethnolinguistic fragmentation and urban-rural variable. Violent events are identified at sub-district level. Significance levels:*** p<0.01, ** p<0.05, * p<0.1.Sources: GPS-SHaSA modules, EMOP, RGPH, ACLED. INSTAT-Mali, DIAL-IRD, ACLED. Authors’calculations.
31

Figure A2: 1997-2005 violent events and intensity
Sources: ACLED, GADM, authors’ computation.
Table A4: Olsonian and Putnamesque participation and occurrence of violent events
Olsonian associations Putnamesque associations
(1) (2) (3) (4) (5) (6)
Occurrence of violent events (t− 1) 0.132*** 0.471* 0.0367 -0.0666(0.0425) (0.240) (0.0344) (0.165)
Post-2012 dummy × Occurrence [2006; (t− 1)] 0.125** 0.0504(0.0632) (0.0574)
Std. dev. of rainfall (t− 1) NO YES NO NO YES NOOccurrence of violent events [1997; 2005] NO YES NO NO YES NOControls YES YES YES YES YES YESDistrict dummies YES YES YES YES YES YESYear dummies YES YES YES YES YES YESRegion × Post-2012 dummies NO NO YES NO NO YES
Method OLS 2SLS DiD OLS 2SLS DiD
Observations 42,967 42,967 54,878 42,967 42,967 54,878Adjusted R2 0.181 0.163 0.130 0.158 0.156 0.156
Note: Estimations are at individual level. Robust standard errors are in parentheses (adjusted for clustering at sub-district and yearlevels, and only for sub-district level for DiD estimations). Olsonian associations comprise family, political and professional associations.Putnamesque associations comprise local and religious associations. All estimations include individual characteristics (gender, agegroup, level of education, relationship to household head and marital status), 2009 sub-district ethnolinguistic fragmentation, anurban-rural variable, district dummies, year dummies and pre and post-treatment regional dummies. Violent events are identified atsub-district level. Significance levels: *** p<0.01, ** p<0.05, * p<0.1.
Sources: GPS-SHaSA modules, EMOP, ELIM, RGPH, ACLED. INSTAT-Mali, DIAL-IRD, ACLED. Authors’ calculations.
32
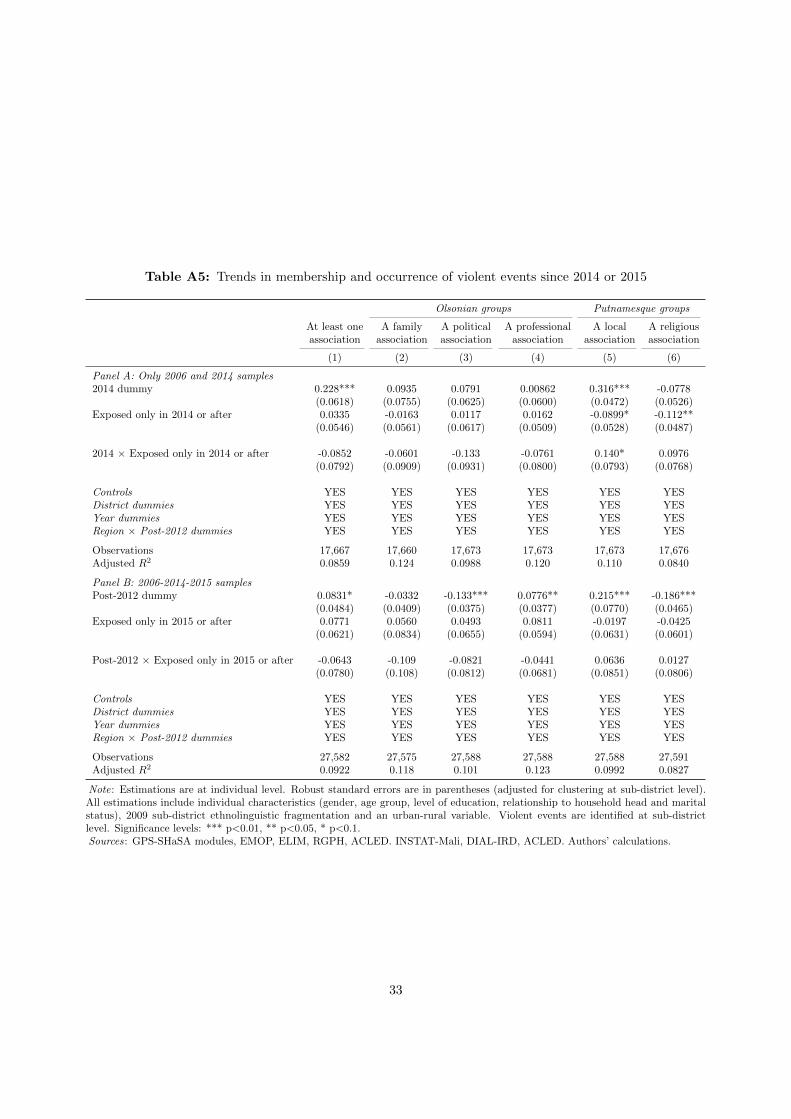
Table A5: Trends in membership and occurrence of violent events since 2014 or 2015
Olsonian groups Putnamesque groups
At least one A family A political A professional A local A religiousassociation association association association association association
(1) (2) (3) (4) (5) (6)
Panel A: Only 2006 and 2014 samples2014 dummy 0.228*** 0.0935 0.0791 0.00862 0.316*** -0.0778
(0.0618) (0.0755) (0.0625) (0.0600) (0.0472) (0.0526)Exposed only in 2014 or after 0.0335 -0.0163 0.0117 0.0162 -0.0899* -0.112**
(0.0546) (0.0561) (0.0617) (0.0509) (0.0528) (0.0487)
2014 × Exposed only in 2014 or after -0.0852 -0.0601 -0.133 -0.0761 0.140* 0.0976(0.0792) (0.0909) (0.0931) (0.0800) (0.0793) (0.0768)
Controls YES YES YES YES YES YESDistrict dummies YES YES YES YES YES YESYear dummies YES YES YES YES YES YESRegion × Post-2012 dummies YES YES YES YES YES YES
Observations 17,667 17,660 17,673 17,673 17,673 17,676Adjusted R2 0.0859 0.124 0.0988 0.120 0.110 0.0840
Panel B: 2006-2014-2015 samplesPost-2012 dummy 0.0831* -0.0332 -0.133*** 0.0776** 0.215*** -0.186***
(0.0484) (0.0409) (0.0375) (0.0377) (0.0770) (0.0465)Exposed only in 2015 or after 0.0771 0.0560 0.0493 0.0811 -0.0197 -0.0425
(0.0621) (0.0834) (0.0655) (0.0594) (0.0631) (0.0601)
Post-2012 × Exposed only in 2015 or after -0.0643 -0.109 -0.0821 -0.0441 0.0636 0.0127(0.0780) (0.108) (0.0812) (0.0681) (0.0851) (0.0806)
Controls YES YES YES YES YES YESDistrict dummies YES YES YES YES YES YESYear dummies YES YES YES YES YES YESRegion × Post-2012 dummies YES YES YES YES YES YES
Observations 27,582 27,575 27,588 27,588 27,588 27,591Adjusted R2 0.0922 0.118 0.101 0.123 0.0992 0.0827
Note: Estimations are at individual level. Robust standard errors are in parentheses (adjusted for clustering at sub-district level).All estimations include individual characteristics (gender, age group, level of education, relationship to household head and maritalstatus), 2009 sub-district ethnolinguistic fragmentation and an urban-rural variable. Violent events are identified at sub-districtlevel. Significance levels: *** p<0.01, ** p<0.05, * p<0.1.Sources: GPS-SHaSA modules, EMOP, ELIM, RGPH, ACLED. INSTAT-Mali, DIAL-IRD, ACLED. Authors’ calculations.
33
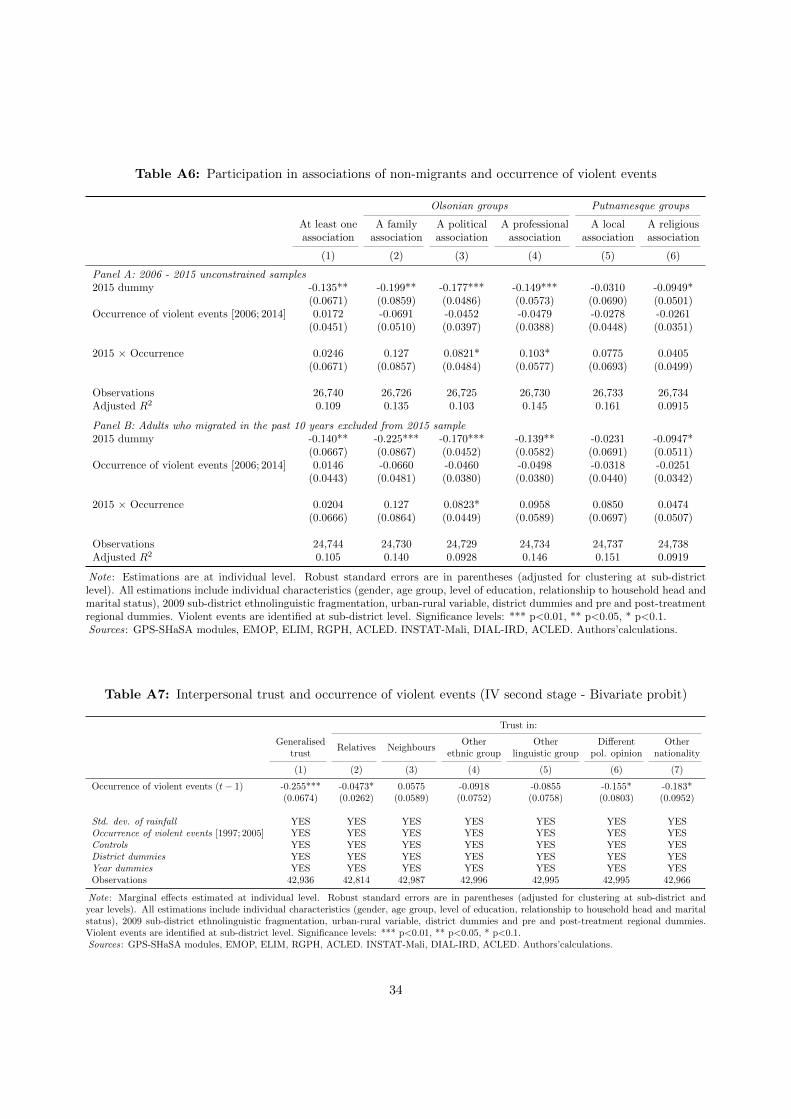
Table A6: Participation in associations of non-migrants and occurrence of violent events
Olsonian groups Putnamesque groups
At least one A family A political A professional A local A religiousassociation association association association association association
(1) (2) (3) (4) (5) (6)
Panel A: 2006 - 2015 unconstrained samples2015 dummy -0.135** -0.199** -0.177*** -0.149*** -0.0310 -0.0949*
(0.0671) (0.0859) (0.0486) (0.0573) (0.0690) (0.0501)Occurrence of violent events [2006; 2014] 0.0172 -0.0691 -0.0452 -0.0479 -0.0278 -0.0261
(0.0451) (0.0510) (0.0397) (0.0388) (0.0448) (0.0351)
2015 × Occurrence 0.0246 0.127 0.0821* 0.103* 0.0775 0.0405(0.0671) (0.0857) (0.0484) (0.0577) (0.0693) (0.0499)
Observations 26,740 26,726 26,725 26,730 26,733 26,734Adjusted R2 0.109 0.135 0.103 0.145 0.161 0.0915
Panel B: Adults who migrated in the past 10 years excluded from 2015 sample2015 dummy -0.140** -0.225*** -0.170*** -0.139** -0.0231 -0.0947*
(0.0667) (0.0867) (0.0452) (0.0582) (0.0691) (0.0511)Occurrence of violent events [2006; 2014] 0.0146 -0.0660 -0.0460 -0.0498 -0.0318 -0.0251
(0.0443) (0.0481) (0.0380) (0.0380) (0.0440) (0.0342)
2015 × Occurrence 0.0204 0.127 0.0823* 0.0958 0.0850 0.0474(0.0666) (0.0864) (0.0449) (0.0589) (0.0697) (0.0507)
Observations 24,744 24,730 24,729 24,734 24,737 24,738Adjusted R2 0.105 0.140 0.0928 0.146 0.151 0.0919
Note: Estimations are at individual level. Robust standard errors are in parentheses (adjusted for clustering at sub-districtlevel). All estimations include individual characteristics (gender, age group, level of education, relationship to household head andmarital status), 2009 sub-district ethnolinguistic fragmentation, urban-rural variable, district dummies and pre and post-treatmentregional dummies. Violent events are identified at sub-district level. Significance levels: *** p<0.01, ** p<0.05, * p<0.1.Sources: GPS-SHaSA modules, EMOP, ELIM, RGPH, ACLED. INSTAT-Mali, DIAL-IRD, ACLED. Authors’calculations.
Table A7: Interpersonal trust and occurrence of violent events (IV second stage - Bivariate probit)
Trust in:
GeneralisedRelatives Neighbours
Other Other Different Othertrust ethnic group linguistic group pol. opinion nationality
(1) (2) (3) (4) (5) (6) (7)
Occurrence of violent events (t− 1) -0.255*** -0.0473* 0.0575 -0.0918 -0.0855 -0.155* -0.183*(0.0674) (0.0262) (0.0589) (0.0752) (0.0758) (0.0803) (0.0952)
Std. dev. of rainfall YES YES YES YES YES YES YESOccurrence of violent events [1997; 2005] YES YES YES YES YES YES YESControls YES YES YES YES YES YES YESDistrict dummies YES YES YES YES YES YES YESYear dummies YES YES YES YES YES YES YESObservations 42,936 42,814 42,987 42,996 42,995 42,995 42,966
Note: Marginal effects estimated at individual level. Robust standard errors are in parentheses (adjusted for clustering at sub-district andyear levels). All estimations include individual characteristics (gender, age group, level of education, relationship to household head and maritalstatus), 2009 sub-district ethnolinguistic fragmentation, urban-rural variable, district dummies and pre and post-treatment regional dummies.Violent events are identified at sub-district level. Significance levels: *** p<0.01, ** p<0.05, * p<0.1.Sources: GPS-SHaSA modules, EMOP, ELIM, RGPH, ACLED. INSTAT-Mali, DIAL-IRD, ACLED. Authors’calculations.
34

Figure B1: Fear of armed conflict threat per district and recorded violent events
(a) 2012-2013 events,2014 balance of opinion
(b) 2012-2014 events,2015 balance of opinion
(c) 2012-2015 events,2016 balance of opinion
Note: White backdrop corresponds to non-surveyed districts.
Sources: GPS-SHaSA modules, EMOP, ACLED. INSTAT-Mali, DIAL-IRD, ACLED. Authors’ computation.
Figure B2: Communes ethno-linguistic fragmentation and 2012-2015 violent events
Sources: ACLED, GPS-SHaSA modules, EMOP. INSTAT-Mali, DIAL-IRD, ACLED. Authors’ computation.
35
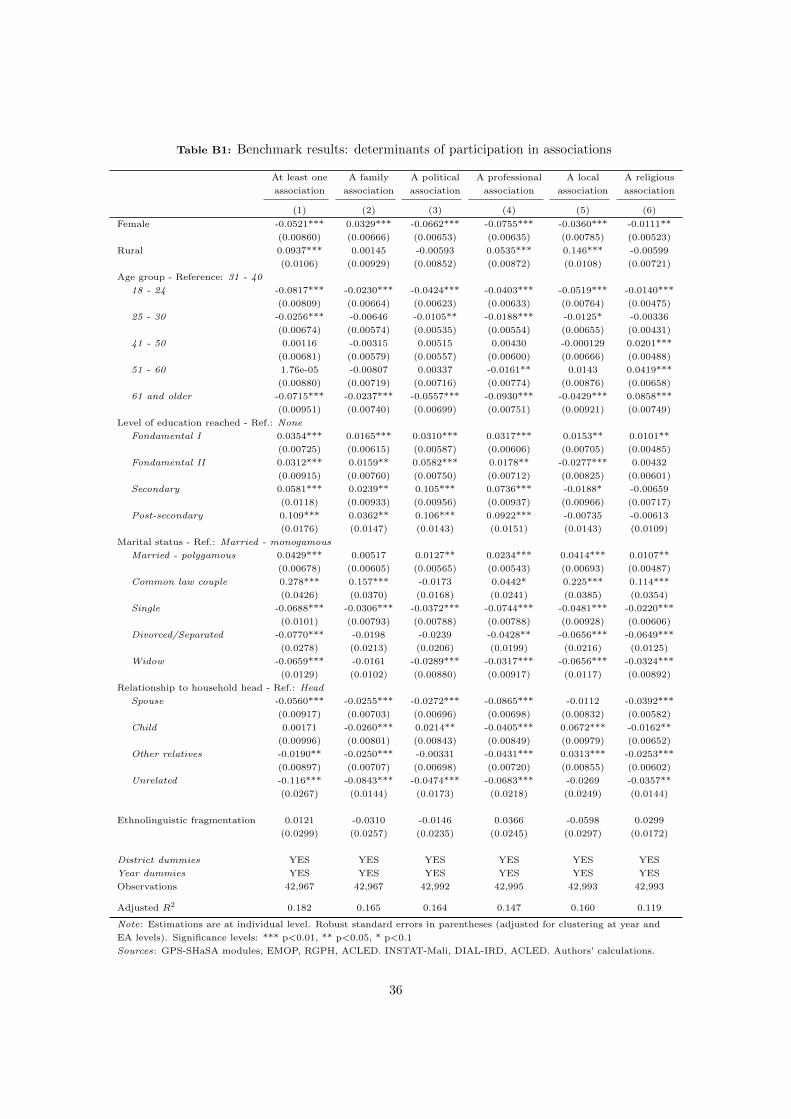
Table B1: Benchmark results: determinants of participation in associations
At least one A family A political A professional A local A religious
association association association association association association
(1) (2) (3) (4) (5) (6)
Female -0.0521*** 0.0329*** -0.0662*** -0.0755*** -0.0360*** -0.0111**
(0.00860) (0.00666) (0.00653) (0.00635) (0.00785) (0.00523)
Rural 0.0937*** 0.00145 -0.00593 0.0535*** 0.146*** -0.00599
(0.0106) (0.00929) (0.00852) (0.00872) (0.0108) (0.00721)
Age group - Reference: 31 - 40
18 - 24 -0.0817*** -0.0230*** -0.0424*** -0.0403*** -0.0519*** -0.0140***
(0.00809) (0.00664) (0.00623) (0.00633) (0.00764) (0.00475)
25 - 30 -0.0256*** -0.00646 -0.0105** -0.0188*** -0.0125* -0.00336
(0.00674) (0.00574) (0.00535) (0.00554) (0.00655) (0.00431)
41 - 50 0.00116 -0.00315 0.00515 0.00430 -0.000129 0.0201***
(0.00681) (0.00579) (0.00557) (0.00600) (0.00666) (0.00488)
51 - 60 1.76e-05 -0.00807 0.00337 -0.0161** 0.0143 0.0419***
(0.00880) (0.00719) (0.00716) (0.00774) (0.00876) (0.00658)
61 and older -0.0715*** -0.0237*** -0.0557*** -0.0930*** -0.0429*** 0.0858***
(0.00951) (0.00740) (0.00699) (0.00751) (0.00921) (0.00749)
Level of education reached - Ref.: None
Fondamental I 0.0354*** 0.0165*** 0.0310*** 0.0317*** 0.0153** 0.0101**
(0.00725) (0.00615) (0.00587) (0.00606) (0.00705) (0.00485)
Fondamental II 0.0312*** 0.0159** 0.0582*** 0.0178** -0.0277*** 0.00432
(0.00915) (0.00760) (0.00750) (0.00712) (0.00825) (0.00601)
Secondary 0.0581*** 0.0239** 0.105*** 0.0736*** -0.0188* -0.00659
(0.0118) (0.00933) (0.00956) (0.00937) (0.00966) (0.00717)
Post-secondary 0.109*** 0.0362** 0.106*** 0.0922*** -0.00735 -0.00613
(0.0176) (0.0147) (0.0143) (0.0151) (0.0143) (0.0109)
Marital status - Ref.: Married - monogamous
Married - polygamous 0.0429*** 0.00517 0.0127** 0.0234*** 0.0414*** 0.0107**
(0.00678) (0.00605) (0.00565) (0.00543) (0.00693) (0.00487)
Common law couple 0.278*** 0.157*** -0.0173 0.0442* 0.225*** 0.114***
(0.0426) (0.0370) (0.0168) (0.0241) (0.0385) (0.0354)
Single -0.0688*** -0.0306*** -0.0372*** -0.0744*** -0.0481*** -0.0220***
(0.0101) (0.00793) (0.00788) (0.00788) (0.00928) (0.00606)
Divorced/Separated -0.0770*** -0.0198 -0.0239 -0.0428** -0.0656*** -0.0649***
(0.0278) (0.0213) (0.0206) (0.0199) (0.0216) (0.0125)
Widow -0.0659*** -0.0161 -0.0289*** -0.0317*** -0.0656*** -0.0324***
(0.0129) (0.0102) (0.00880) (0.00917) (0.0117) (0.00892)
Relationship to household head - Ref.: Head
Spouse -0.0560*** -0.0255*** -0.0272*** -0.0865*** -0.0112 -0.0392***
(0.00917) (0.00703) (0.00696) (0.00698) (0.00832) (0.00582)
Child 0.00171 -0.0260*** 0.0214** -0.0405*** 0.0672*** -0.0162**
(0.00996) (0.00801) (0.00843) (0.00849) (0.00979) (0.00652)
Other relatives -0.0190** -0.0250*** -0.00331 -0.0431*** 0.0313*** -0.0253***
(0.00897) (0.00707) (0.00698) (0.00720) (0.00855) (0.00602)
Unrelated -0.116*** -0.0843*** -0.0474*** -0.0683*** -0.0269 -0.0357**
(0.0267) (0.0144) (0.0173) (0.0218) (0.0249) (0.0144)
Ethnolinguistic fragmentation 0.0121 -0.0310 -0.0146 0.0366 -0.0598 0.0299
(0.0299) (0.0257) (0.0235) (0.0245) (0.0297) (0.0172)
District dummies YES YES YES YES YES YES
Year dummies YES YES YES YES YES YES
Observations 42,967 42,967 42,992 42,995 42,993 42,993
Adjusted R2 0.182 0.165 0.164 0.147 0.160 0.119
Note: Estimations are at individual level. Robust standard errors in parentheses (adjusted for clustering at year and
EA levels). Significance levels: *** p<0.01, ** p<0.05, * p<0.1
Sources: GPS-SHaSA modules, EMOP, RGPH, ACLED. INSTAT-Mali, DIAL-IRD, ACLED. Authors’ calculations.
36
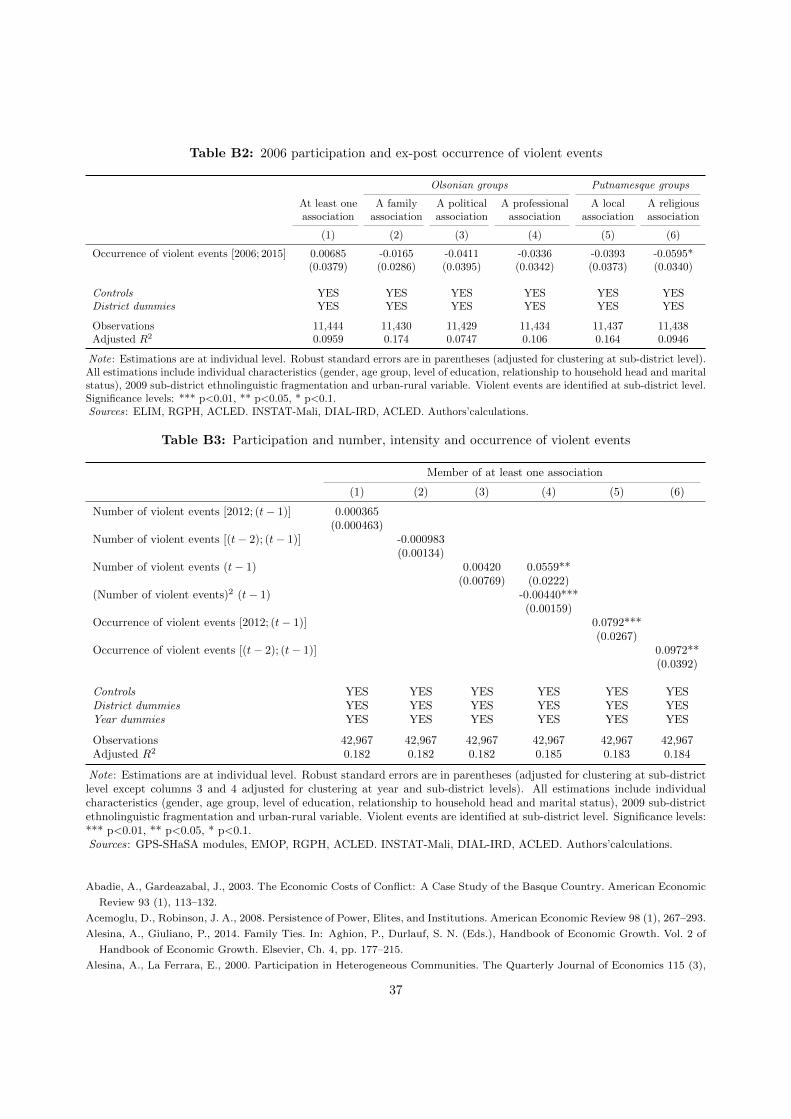
Table B2: 2006 participation and ex-post occurrence of violent events
Olsonian groups Putnamesque groups
At least one A family A political A professional A local A religiousassociation association association association association association
(1) (2) (3) (4) (5) (6)
Occurrence of violent events [2006; 2015] 0.00685 -0.0165 -0.0411 -0.0336 -0.0393 -0.0595*(0.0379) (0.0286) (0.0395) (0.0342) (0.0373) (0.0340)
Controls YES YES YES YES YES YESDistrict dummies YES YES YES YES YES YES
Observations 11,444 11,430 11,429 11,434 11,437 11,438Adjusted R2 0.0959 0.174 0.0747 0.106 0.164 0.0946
Note: Estimations are at individual level. Robust standard errors are in parentheses (adjusted for clustering at sub-district level).All estimations include individual characteristics (gender, age group, level of education, relationship to household head and maritalstatus), 2009 sub-district ethnolinguistic fragmentation and urban-rural variable. Violent events are identified at sub-district level.Significance levels: *** p<0.01, ** p<0.05, * p<0.1.Sources: ELIM, RGPH, ACLED. INSTAT-Mali, DIAL-IRD, ACLED. Authors’calculations.
Table B3: Participation and number, intensity and occurrence of violent events
Member of at least one association
(1) (2) (3) (4) (5) (6)
Number of violent events [2012; (t− 1)] 0.000365(0.000463)
Number of violent events [(t− 2); (t− 1)] -0.000983(0.00134)
Number of violent events (t− 1) 0.00420 0.0559**(0.00769) (0.0222)
(Number of violent events)2 (t− 1) -0.00440***(0.00159)
Occurrence of violent events [2012; (t− 1)] 0.0792***(0.0267)
Occurrence of violent events [(t− 2); (t− 1)] 0.0972**(0.0392)
Controls YES YES YES YES YES YESDistrict dummies YES YES YES YES YES YESYear dummies YES YES YES YES YES YES
Observations 42,967 42,967 42,967 42,967 42,967 42,967Adjusted R2 0.182 0.182 0.182 0.185 0.183 0.184
Note: Estimations are at individual level. Robust standard errors are in parentheses (adjusted for clustering at sub-districtlevel except columns 3 and 4 adjusted for clustering at year and sub-district levels). All estimations include individualcharacteristics (gender, age group, level of education, relationship to household head and marital status), 2009 sub-districtethnolinguistic fragmentation and urban-rural variable. Violent events are identified at sub-district level. Significance levels:*** p<0.01, ** p<0.05, * p<0.1.Sources: GPS-SHaSA modules, EMOP, RGPH, ACLED. INSTAT-Mali, DIAL-IRD, ACLED. Authors’calculations.
Abadie, A., Gardeazabal, J., 2003. The Economic Costs of Conflict: A Case Study of the Basque Country. American Economic
Review 93 (1), 113–132.
Acemoglu, D., Robinson, J. A., 2008. Persistence of Power, Elites, and Institutions. American Economic Review 98 (1), 267–293.
Alesina, A., Giuliano, P., 2014. Family Ties. In: Aghion, P., Durlauf, S. N. (Eds.), Handbook of Economic Growth. Vol. 2 of
Handbook of Economic Growth. Elsevier, Ch. 4, pp. 177–215.
Alesina, A., La Ferrara, E., 2000. Participation in Heterogeneous Communities. The Quarterly Journal of Economics 115 (3),
37
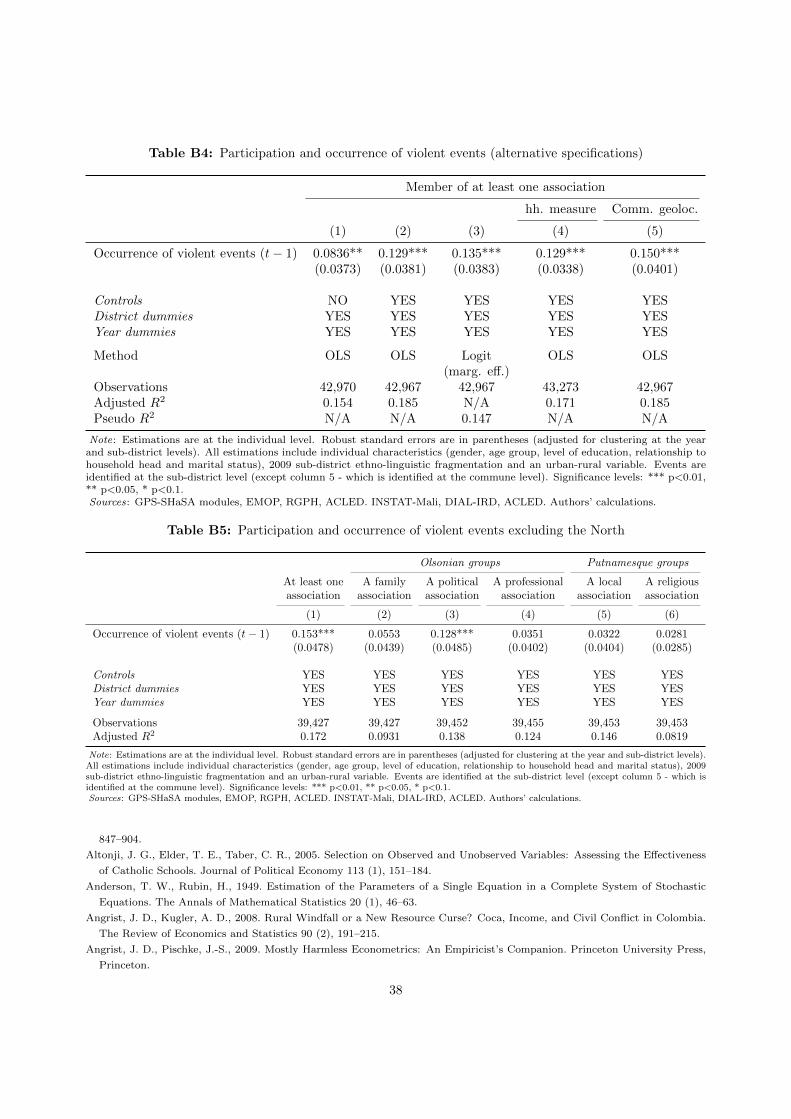
Table B4: Participation and occurrence of violent events (alternative specifications)
Member of at least one association
hh. measure Comm. geoloc.
(1) (2) (3) (4) (5)
Occurrence of violent events (t− 1) 0.0836** 0.129*** 0.135*** 0.129*** 0.150***(0.0373) (0.0381) (0.0383) (0.0338) (0.0401)
Controls NO YES YES YES YESDistrict dummies YES YES YES YES YESYear dummies YES YES YES YES YES
Method OLS OLS Logit OLS OLS(marg. eff.)
Observations 42,970 42,967 42,967 43,273 42,967Adjusted R2 0.154 0.185 N/A 0.171 0.185Pseudo R2 N/A N/A 0.147 N/A N/A
Note: Estimations are at the individual level. Robust standard errors are in parentheses (adjusted for clustering at the yearand sub-district levels). All estimations include individual characteristics (gender, age group, level of education, relationship tohousehold head and marital status), 2009 sub-district ethno-linguistic fragmentation and an urban-rural variable. Events areidentified at the sub-district level (except column 5 - which is identified at the commune level). Significance levels: *** p<0.01,** p<0.05, * p<0.1.Sources: GPS-SHaSA modules, EMOP, RGPH, ACLED. INSTAT-Mali, DIAL-IRD, ACLED. Authors’ calculations.
Table B5: Participation and occurrence of violent events excluding the North
Olsonian groups Putnamesque groups
At least one A family A political A professional A local A religiousassociation association association association association association
(1) (2) (3) (4) (5) (6)
Occurrence of violent events (t− 1) 0.153*** 0.0553 0.128*** 0.0351 0.0322 0.0281(0.0478) (0.0439) (0.0485) (0.0402) (0.0404) (0.0285)
Controls YES YES YES YES YES YESDistrict dummies YES YES YES YES YES YESYear dummies YES YES YES YES YES YES
Observations 39,427 39,427 39,452 39,455 39,453 39,453Adjusted R2 0.172 0.0931 0.138 0.124 0.146 0.0819
Note: Estimations are at the individual level. Robust standard errors are in parentheses (adjusted for clustering at the year and sub-district levels).All estimations include individual characteristics (gender, age group, level of education, relationship to household head and marital status), 2009sub-district ethno-linguistic fragmentation and an urban-rural variable. Events are identified at the sub-district level (except column 5 - which isidentified at the commune level). Significance levels: *** p<0.01, ** p<0.05, * p<0.1.Sources: GPS-SHaSA modules, EMOP, RGPH, ACLED. INSTAT-Mali, DIAL-IRD, ACLED. Authors’ calculations.
847–904.
Altonji, J. G., Elder, T. E., Taber, C. R., 2005. Selection on Observed and Unobserved Variables: Assessing the Effectiveness
of Catholic Schools. Journal of Political Economy 113 (1), 151–184.
Anderson, T. W., Rubin, H., 1949. Estimation of the Parameters of a Single Equation in a Complete System of Stochastic
Equations. The Annals of Mathematical Statistics 20 (1), 46–63.
Angrist, J. D., Kugler, A. D., 2008. Rural Windfall or a New Resource Curse? Coca, Income, and Civil Conflict in Colombia.
The Review of Economics and Statistics 90 (2), 191–215.
Angrist, J. D., Pischke, J.-S., 2009. Mostly Harmless Econometrics: An Empiricist’s Companion. Princeton University Press,
Princeton.
38
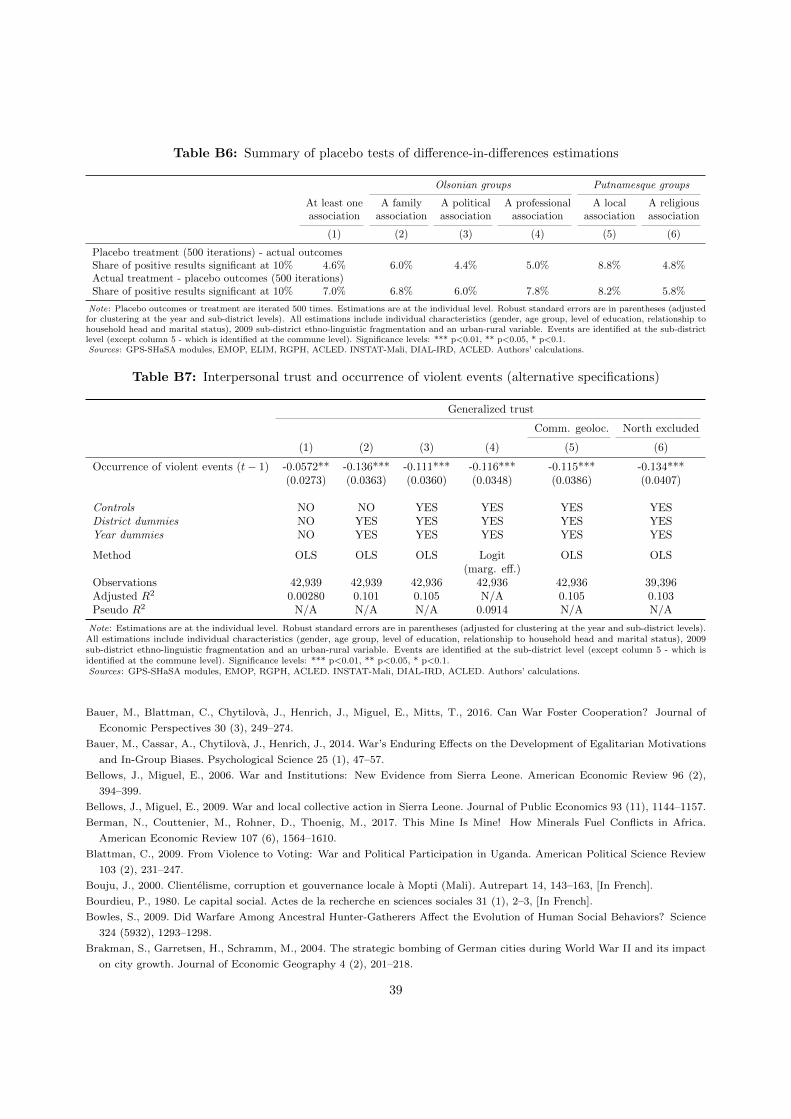
Table B6: Summary of placebo tests of difference-in-differences estimations
Olsonian groups Putnamesque groups
At least one A family A political A professional A local A religiousassociation association association association association association
(1) (2) (3) (4) (5) (6)
Placebo treatment (500 iterations) - actual outcomesShare of positive results significant at 10% 4.6% 6.0% 4.4% 5.0% 8.8% 4.8%Actual treatment - placebo outcomes (500 iterations)Share of positive results significant at 10% 7.0% 6.8% 6.0% 7.8% 8.2% 5.8%
Note: Placebo outcomes or treatment are iterated 500 times. Estimations are at the individual level. Robust standard errors are in parentheses (adjustedfor clustering at the year and sub-district levels). All estimations include individual characteristics (gender, age group, level of education, relationship tohousehold head and marital status), 2009 sub-district ethno-linguistic fragmentation and an urban-rural variable. Events are identified at the sub-districtlevel (except column 5 - which is identified at the commune level). Significance levels: *** p<0.01, ** p<0.05, * p<0.1.Sources: GPS-SHaSA modules, EMOP, ELIM, RGPH, ACLED. INSTAT-Mali, DIAL-IRD, ACLED. Authors’ calculations.
Table B7: Interpersonal trust and occurrence of violent events (alternative specifications)
Generalized trust
Comm. geoloc. North excluded
(1) (2) (3) (4) (5) (6)
Occurrence of violent events (t− 1) -0.0572** -0.136*** -0.111*** -0.116*** -0.115*** -0.134***(0.0273) (0.0363) (0.0360) (0.0348) (0.0386) (0.0407)
Controls NO NO YES YES YES YESDistrict dummies NO YES YES YES YES YESYear dummies NO YES YES YES YES YES
Method OLS OLS OLS Logit OLS OLS(marg. eff.)
Observations 42,939 42,939 42,936 42,936 42,936 39,396Adjusted R2 0.00280 0.101 0.105 N/A 0.105 0.103Pseudo R2 N/A N/A N/A 0.0914 N/A N/A
Note: Estimations are at the individual level. Robust standard errors are in parentheses (adjusted for clustering at the year and sub-district levels).All estimations include individual characteristics (gender, age group, level of education, relationship to household head and marital status), 2009sub-district ethno-linguistic fragmentation and an urban-rural variable. Events are identified at the sub-district level (except column 5 - which isidentified at the commune level). Significance levels: *** p<0.01, ** p<0.05, * p<0.1.Sources: GPS-SHaSA modules, EMOP, RGPH, ACLED. INSTAT-Mali, DIAL-IRD, ACLED. Authors’ calculations.
Bauer, M., Blattman, C., Chytilova, J., Henrich, J., Miguel, E., Mitts, T., 2016. Can War Foster Cooperation? Journal of
Economic Perspectives 30 (3), 249–274.
Bauer, M., Cassar, A., Chytilova, J., Henrich, J., 2014. War’s Enduring Effects on the Development of Egalitarian Motivations
and In-Group Biases. Psychological Science 25 (1), 47–57.
Bellows, J., Miguel, E., 2006. War and Institutions: New Evidence from Sierra Leone. American Economic Review 96 (2),
394–399.
Bellows, J., Miguel, E., 2009. War and local collective action in Sierra Leone. Journal of Public Economics 93 (11), 1144–1157.
Berman, N., Couttenier, M., Rohner, D., Thoenig, M., 2017. This Mine Is Mine! How Minerals Fuel Conflicts in Africa.
American Economic Review 107 (6), 1564–1610.
Blattman, C., 2009. From Violence to Voting: War and Political Participation in Uganda. American Political Science Review
103 (2), 231–247.
Bouju, J., 2000. Clientelisme, corruption et gouvernance locale a Mopti (Mali). Autrepart 14, 143–163, [In French].
Bourdieu, P., 1980. Le capital social. Actes de la recherche en sciences sociales 31 (1), 2–3, [In French].
Bowles, S., 2009. Did Warfare Among Ancestral Hunter-Gatherers Affect the Evolution of Human Social Behaviors? Science
324 (5932), 1293–1298.
Brakman, S., Garretsen, H., Schramm, M., 2004. The strategic bombing of German cities during World War II and its impact
on city growth. Journal of Economic Geography 4 (2), 201–218.
39
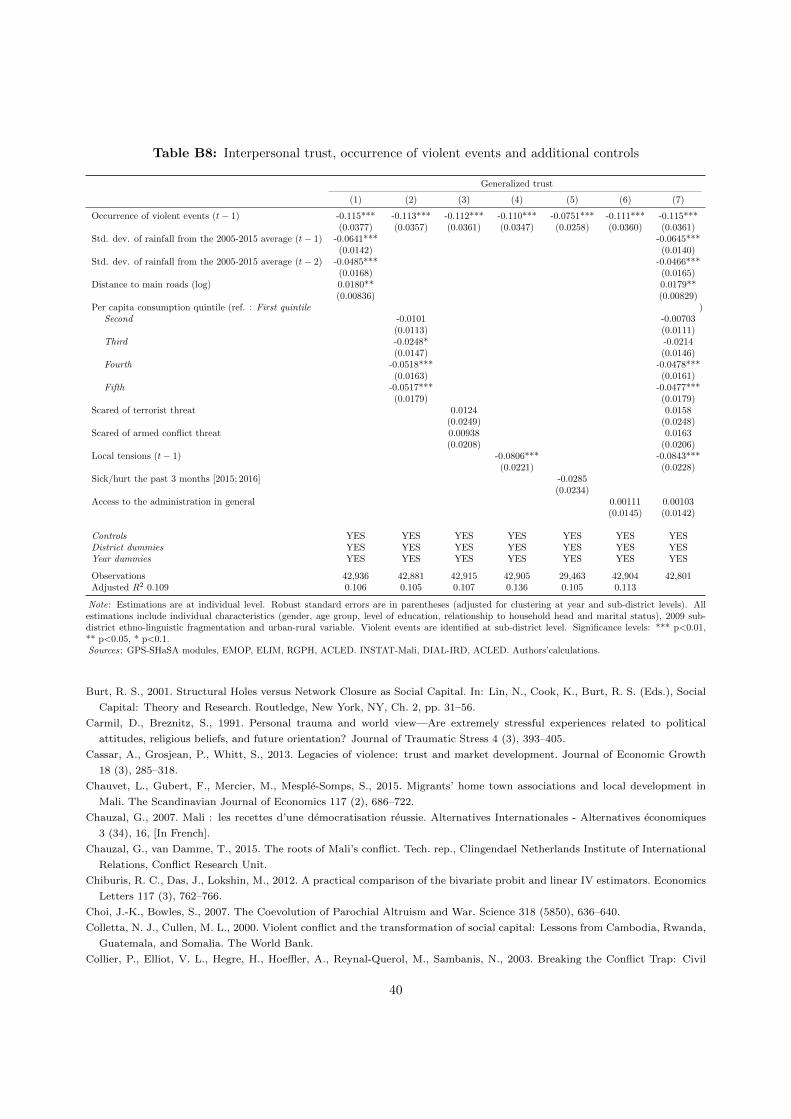
Table B8: Interpersonal trust, occurrence of violent events and additional controls
Generalized trust
(1) (2) (3) (4) (5) (6) (7)
Occurrence of violent events (t− 1) -0.115*** -0.113*** -0.112*** -0.110*** -0.0751*** -0.111*** -0.115***(0.0377) (0.0357) (0.0361) (0.0347) (0.0258) (0.0360) (0.0361)
Std. dev. of rainfall from the 2005-2015 average (t− 1) -0.0641*** -0.0645***(0.0142) (0.0140)
Std. dev. of rainfall from the 2005-2015 average (t− 2) -0.0485*** -0.0466***(0.0168) (0.0165)
Distance to main roads (log) 0.0180** 0.0179**(0.00836) (0.00829)
Per capita consumption quintile (ref. : First quintile )Second -0.0101 -0.00703
(0.0113) (0.0111)Third -0.0248* -0.0214
(0.0147) (0.0146)Fourth -0.0518*** -0.0478***
(0.0163) (0.0161)Fifth -0.0517*** -0.0477***
(0.0179) (0.0179)Scared of terrorist threat 0.0124 0.0158
(0.0249) (0.0248)Scared of armed conflict threat 0.00938 0.0163
(0.0208) (0.0206)Local tensions (t− 1) -0.0806*** -0.0843***
(0.0221) (0.0228)Sick/hurt the past 3 months [2015; 2016] -0.0285
(0.0234)Access to the administration in general 0.00111 0.00103
(0.0145) (0.0142)
Controls YES YES YES YES YES YES YESDistrict dummies YES YES YES YES YES YES YESYear dummies YES YES YES YES YES YES YES
Observations 42,936 42,881 42,915 42,905 29,463 42,904 42,801Adjusted R2 0.109 0.106 0.105 0.107 0.136 0.105 0.113
Note: Estimations are at individual level. Robust standard errors are in parentheses (adjusted for clustering at year and sub-district levels). Allestimations include individual characteristics (gender, age group, level of education, relationship to household head and marital status), 2009 sub-district ethno-linguistic fragmentation and urban-rural variable. Violent events are identified at sub-district level. Significance levels: *** p<0.01,** p<0.05, * p<0.1.Sources: GPS-SHaSA modules, EMOP, ELIM, RGPH, ACLED. INSTAT-Mali, DIAL-IRD, ACLED. Authors’calculations.
Burt, R. S., 2001. Structural Holes versus Network Closure as Social Capital. In: Lin, N., Cook, K., Burt, R. S. (Eds.), Social
Capital: Theory and Research. Routledge, New York, NY, Ch. 2, pp. 31–56.
Carmil, D., Breznitz, S., 1991. Personal trauma and world view—Are extremely stressful experiences related to political
attitudes, religious beliefs, and future orientation? Journal of Traumatic Stress 4 (3), 393–405.
Cassar, A., Grosjean, P., Whitt, S., 2013. Legacies of violence: trust and market development. Journal of Economic Growth
18 (3), 285–318.
Chauvet, L., Gubert, F., Mercier, M., Mesple-Somps, S., 2015. Migrants’ home town associations and local development in
Mali. The Scandinavian Journal of Economics 117 (2), 686–722.
Chauzal, G., 2007. Mali : les recettes d’une democratisation reussie. Alternatives Internationales - Alternatives economiques
3 (34), 16, [In French].
Chauzal, G., van Damme, T., 2015. The roots of Mali’s conflict. Tech. rep., Clingendael Netherlands Institute of International
Relations, Conflict Research Unit.
Chiburis, R. C., Das, J., Lokshin, M., 2012. A practical comparison of the bivariate probit and linear IV estimators. Economics
Letters 117 (3), 762–766.
Choi, J.-K., Bowles, S., 2007. The Coevolution of Parochial Altruism and War. Science 318 (5850), 636–640.
Colletta, N. J., Cullen, M. L., 2000. Violent conflict and the transformation of social capital: Lessons from Cambodia, Rwanda,
Guatemala, and Somalia. The World Bank.
Collier, P., Elliot, V. L., Hegre, H., Hoeffler, A., Reynal-Querol, M., Sambanis, N., 2003. Breaking the Conflict Trap: Civil
40

War and Development Policy. World Bank and Oxford University Press, Washington D.C.
Couttenier, M., Soubeyran, R., 2014. Drought and Civil War In Sub-Saharan Africa. The Economic Journal 124 (575), 201–244.
Couttenier, M., Soubeyran, R., 2015. A Survey of the Causes of Civil Conflicts: Natural Factors and Economic Conditions.
Revue d’economie politique 125 (6), 787–810.
Croicu, M., Sundberg, R., 2015. UCDP GED Codebook version 2.0. Department of Peace and Conflict Research, Uppsala
University, Uppsala, Sweden.
Davis, D. R., Weinstein, D. E., 2002. Bones, Bombs, and Break Points: The Geography of Economic Activity. American
Economic Review 92 (5), 1269–1289.
De Luca, G., Verpoorten, M., 2011. From vice to virtue? Civil war and social capital in Uganda. LICOS Discussion Paper 298.
De Luca, G., Verpoorten, M., 2015. Civil war, social capital and resilience in Uganda. Oxford Economic Papers 67 (3), 661–386.
de Montclos, M.-A. P., Minor, E., Sinha, S. (Eds.), 2016. Violence, Statistics, and the Politics of Accounting for the Dead.
Demographic Transformation and Socio-Economic Development. Springer International Publishing.
Djankov, S., Glaeser, E., La Porta, R., Lopez-de-Silanes, F., Shleifer, A., 2003. The new comparative economics. Journal of
Comparative Economics 31 (4), 595–619.
Durlauf, S. N., Fafchamps, M., 2005. Social Capital. In: Aghion, P., Durlauf, S. N. (Eds.), Handbook of Economic Growth.
Vol. 1B. Elsevier, Netherlands, Ch. 26, pp. 1639–1699.
Dyregrov, A., Gjestad, R., Raundalen, M., 2002. Children exposed to warfare: A longitudinal study. Journal of Traumatic
Stress 15 (1), 59–68.
Fidrmuc, J., Gerxhani, K., 2008. Mind the gap! Social capital, East and West. Journal of Comparative Economics 36 (2),
264–286.
Gaibulloev, K., Sandler, T., 2009. The Impact of Terrorism and Conflicts on Growth in Asia. Economics and Politics 21 (3),
359–383.
Galy, M. (Ed.), 2013. La guerre au Mali: comprendre la crise au Sahel et au Sahara: enjeux et zones d’ombre. Cahiers Libres.
La Decouverte, [In French].
Gilligan, M. J., Pasquale, B. J., Samii, C., 2014. Civil war and social cohesion: Lab-in-the-field evidence from Nepal. American
Journal of Political Science 58 (3), 604–619.
Government of Mali, 2015. Accord Pour La Paix Et La Reconciliation Au Mali Issu Du Processus D’Alger. [in french].
Granovetter, M. S., 1973. The Strength of Weak Ties. American Journal of Sociology 78 (6), 1360–1380.
Grosjean, P., 2014. Conflict and Social and Political Preferences: Evidence from World War II and Civil Conflict in 35 European
Countries. Comparative Economic Studies 56 (3), 424–451.
Guichaoua, Y., Pellerin, M., 2017. Faire la paix et construire l’Etat : Les relations entre pouvoir central et peripheries saheliennes
au Niger et au Mali. Tech. Rep. 51, IRSEM, [In French].
Haddad, L., Maluccio, J. A., 2003. Trust, Membership in Groups, and Household Welfare: Evidence from KwaZulu-Natal,
South Africa. Economic Development and Cultural Change 51 (3), 573–601.
Harari, M., La Ferrara, E., 2018. Conflict, Climate, and Cells: A Disaggregated Analysis. The Review of Economics and
Statistics 100 (4), 594–608.
Holder, G., Saint-Lary, M., 2013. Enjeux democratiques et (re)conquete du politique en Afrique. De l’espace public religieux a
l’emergence d’une sphere islamique oppositionnelle. Cahiers Sens public 15–16 (1), 187–205, [In French].
Hsiang, S. M., Burke, M., Miguel, E., 2013. Quantifying the influence of climate on human conflict. Science 341 (6151).
International Institute of Social Sciences, 2010. Indices of social development. URL: http://www.IndSocDev.org/.
International Organization for Migration (IOM), 2014a. Matrice de suivi des deplacements : Mali (Fevrier 2014). [In French].
International Organization for Migration (IOM), 2014b. Matrice de suivi des deplacements : Mali (Decembre 2014). [In French].
Jackson, M. O., Rodriguez-Barraquer, T., Tan, X., 2012. Social Capital and Social Quilts: Network Patterns of Favor Exchange.
American Economic Review 102 (5), 1857–1897.
Jennings, C., Sanchez-Pages, S., 2017. Social capital, conflict and welfare. Journal of Development Economics 124, 157–167.
Jones, S. G., Munoz, A., 2010. Afghanistan’s Local War: Building Local Defense Forces. Rand National Defense Research.
Julien, S., 2011. Le Sahel comme espace de transit des stupefiants. Acteurs et consequences politiques. Herodote (3), 125–142,
[In French].
Knack, S., Keefer, P., 1997. Does Social Capital Have an Economic Payoff? A Cross-Country Investigation. The Quarterly
Journal of Economics 112 (4), 1251–1288.
Koubi, V., Bernauer, T., Kalbhenn, A., Spilker, G., 2012. Climate variability, economic growth, and civil conflict. Journal of
Peace Research 49 (1), 113–127.
41
Kuepie, M., Sougane, A., 2014. Participation citoyenne au Mali : entre mobilisation associative et engagement politique. Lien
social et Politiques (71), 197–215, [In French].
La Porta, R., Lopez-de-Silanes, F., Shleifer, A., Vishny, R., 1999. The quality of government. The Journal of Law, Economics,
and Organization 15 (1), 222–279.
Leclerc-Olive, M., 2017. Anthropologie des predations foncieres. Entreprises minieres et pouvoirs locaux. Editions des Archives
contemporaines, Paris, [In French].
Lin, N., 1999. Building a Network Theory of Social Capital. Connections 22 (1), 28–51.
Miguel, E., Roland, G., 2011. The long-run impact of bombing Vietnam. Journal of Development Economics 96 (1), 1–15.
Miguel, E., Satyanath, S., Sergenti, E., 2004. Economic Shocks and Civil Conflict: An Instrumental Variables Approach.
Journal of Political Economy 112 (4), 725–753.
Narayan, D., Pritchett, L., 1999. Cents and Sociability: Household Income and Social Capital in Rural Tanzania. Economic
Development and Cultural Change 47 (4), 871–897.
Nunn, N., Qian, N., 2014. US Food Aid and Civil Conflict. American Economic Review 104 (6), 1630–66.
Nunn, N., Wantchekon, L., 2011. The Slave Trade and the Origins of Mistrust in Africa. American Economic Review 101 (7),
3221–3252.
Olson, M., 1982. The Rise and Decline of Nations. Yale University Press, New Haven, CT.
Oster, E., 2019. Unobservable Selection and Coefficient Stability: Theory and Evidence. Journal of Business & Economic
Statistics 37 (2), 187–204.
Paxton, P., Ressler, R., 2017. Trust and Participation in Associations. In: Uslaner, E. M. (Ed.), The Oxford Handbook of
Social and Political Trust. Oxford University Press, Ch. 8, pp. 149–174.
Putnam, R. D., Leonardi, R., Nonetti, R. Y., 1993. Making Democracy Work: Civic Traditions in Modern Italy. Princeton
University Press, Princeton, NJ.
Raleigh, C., Linke, A., Hegre, H., Karlsen, J., 2010. Introducing ACLED: An Armed Conflict Location and Event Dataset.
Journal of peace research 47 (5), 651–660.
Razafindrakoto, M., Roubaud, F., 2018. Responding to the SDG16 Measurement Challenge: The Governance, Peace and
Security Survey Modules in Africa. Global Policy 9 (3), 336–351.
Rohner, D., Thoenig, M., Zilibotti, F., 2013. Seeds of distrust: conflict in Uganda. Journal of Economic Growth 18 (3), 217–252.
Roy, A., 2005. La societe civile dans le debat politique au Mali. Cahiers d’etudes africaines (178), 573–584, [In French].
Roy, A., 2010. Mali: instrumentalisation de la societe civile. Alternatives Sud 17, 111–118, [In French].
Satyanath, S., Voigtlander, N., Voth, H.-J., 2017. Bowling for Fascism: Social Capital and the Rise of the Nazi Party. Journal
of Political Economy 125 (2), 478–526.
Sawyer, A., 2005. Social capital, survival strategies, and their potential for post-conflict governance in Liberia. UNU-WIDER,
Research Paper No. 2005/15, United Nations University (UNU).
Sønderskov, K. M., 2011. Does Generalized Social Trust Lead to Associational Membership? Unravelling a Bowl of Well-Tossed
Spaghetti. European Sociological Review 27 (4), 419–434.
Stock, J. H., Yogo, M., 2005. Testing for Weak Instruments in Linear IV Regression. In: Andrews, D. W. K., Stock, J. H.
(Eds.), Identification and Inference for Econometric Models: Essays in Honor of Thomas Rothenberg. Cambridge University
Press, Ch. 5, pp. 80–108.
United Nations High Commissioner for Refugees (UNHCR), 2014. UNHCR Position On Returns To Mali - Update I. Available
at: http://www.refworld.org/docid/52cc405a4.html [accessed 19 April 2017].
United Nations High Commissioner for Refugees (UNHCR), 2016. Mali Situation: UNHCR Regional Update, December 2015
- February 2016. Available at: http://www.refworld.org/docid/56fcd7094.html [accessed 19 April 2017].
Uphoff, N., Wijayaratna, C., 2000. Demonstrated Benefits from Social Capital: The Productivity of Farmer Organizations in
Gal Oya, Sri Lanka. World Development 28 (11), 1875 – 1890.
Voors, M. J., Nillesen, E. E. M., Verwimp, P., Bulte, E. H., Lensink, R., Van Soest, D. P., 2012. Violent Conflict and Behavior:
A Field Experiment in Burundi. American Economic Review 102 (2), 941–964.
Woolcock, M., 1998. Social capital and economic development: Toward a theoretical synthesis and policy framework. Theory
and Society 27 (2), 151–208.
Woolcock, M., Narayan, D., 2000. Social Capital: Implications for Development Theory, Research, and Policy. World Bank
Research Observer 15 (2), 225–249.
Wooldridge, J. M., 2009. Introductory Econometrics: a Modern Approach, 4th Edition. South-Western Cengage Learning,
Mason, Ohio.
42


