

UNIVERSIDADE FEDERAL DO PARANÁ
ALDO ALFREDO MERINO RAMIREZ
FEASIBILITY STUDY FOR THE GENERATION OF BIOGAS IN AN AUTOMOTIVE
INDUSTRY FACTORY IN BRASIL BY MEANS OF A BIODIGESTER
CURITIBA
2020

ALDO ALFREDO MERINO RAMIREZ
FEASIBILITY STUDY FOR THE GENERATION OF BIOGAS IN AN AUTOMOTIVE
INDUSTRY FACTORY IN BRASIL BY MEANS OF A BIODIGESTER
Dissertação apresentada como requisito parcial à obtenção do grau de Mestre em Meio Ambiente Urbano e Industrial, no Programa de Mestrado Profissional em Meio Ambiente Urbano e Industrial, Setor de Tecnologia, da Universidade Federal do Paraná em parceria com o Serviço Nacional de Aprendizagem Industrial e a Universitӓt Stuttgart, Alemanha.
Orientador: Profa. Dra. Myriam Lorena Melgarejo Navarro Cerutti
Co-Orientador: Profa Dra. Margarete Casagrande Lass Erbe.
CURITIBA
2020


RESUMO
Atualmente, em todo o mundo, vem ganhando interesse a necessidade de novas tecnologias e práticas de redução de poluentes e substituição de energias não renováveis na matriz energética. Uma dessas práticas é o uso da digestão anaeróbia em recipientes fechados conhecidos como biodigestores. A vantagem deste método em relação a outras energias renováveis, é que ao mesmo tempo que se obtém energia a partir da combustão do metano gerado, pode ser considerado como um método de tratamento de resíduos orgânicos. O objetivo principal deste trabalho é estudar a viabilidade de instalação de um biodigestor, para isso, uma empresa automotiva localizada na cidade de Curitiba, estado do Paraná-Brasil, foi tomada como estudo de caso. Na avaliação, a parte econômica foi considerada como o principal fator. A primeira etapa do estudo de viabilidade é entender profundamente a gestão atual dos resíduos orgânicos produzidos na empresa, ou seja, conhecer o tipo de resíduo, quantidades, tratamento, transporte e custos. Em geral, diversos tipos de resíduos orgânicos (principalmente resíduos de cozinha), óleos vegetais, gorduras de restaurantes e resíduos de jardins são os diferentes tipos de resíduos orgânicos gerados, que poderiam ser utilizados no biodigestor. O valor médio total do período 2017-2019 soma aprox. 1.150 toneladas por ano, sendo a maioria redirecionada por terceiros para diferentes instalações que são responsáveis pelo seu tratamento. Esse redirecionamento tem um custo anual de R$ 87.791,40 em transporte e gerenciamento. Conhecendo o tipo de resíduo orgânico e as condições ambientais, o que melhor atende às necessidades é o Continuous flow Stirred Tank Reactor (CSTR), que após busca por fornecedores na região do Paraná, foi contatada a empresa CONATUS ENERGIÁS RENOVÁVEIS. Esta empresa forneceu um orçamento total de instalação e construção de R$ 1.217.600,00. A quantidade de biogás que pode ser gerada é de aprox. 140.000 m3/ano. A energia que pode ser obtida com a combustão do biogás, pode representar uma diminuição no consumo de gás natural, energia elétrica e combustíveis. Essa redução no consumo representa economia para a empresa. A fim de realizar a análise econômica e verificar a viabilidade do projeto, foram utilizados indicadores e ferramentas como fluxo de caixa, receitas, despesas, depreciação, valor presente líquido, taxa interna de retorno e payback. No total, foram analisados 12 casos, três com a quantidade média de resíduos de cada um dos empreendimentos, que são: Biogás em substituição ao Gás Natural, Gasolina ou Diesel. Os 9 casos restantes foram calculados para ter um payback de 2, 5 e 10 anos em cada um dos projetos, a fim de se ter uma ideia da quantidade de substrato e biogás necessários. Os resultados mostraram que para um payback de 2 anos é necessária uma quantidade de substrato entre 3.310 e 4.635 ton/ano. Para um payback de 5 anos 1.880 - 2.675 ton/ano. E para um payback de 10 anos entre 1.405 - 2.025 ton/ano dependendo do tipo de projeto.
Palavras-chave: Digestão anaeróbica. Biodigestor. Biogás. Metano.

ABSTRACT
Nowadays around the world, the need of new technologies and practices regarding reduction of pollutants and the substitution of non-renewable energies in the energy matrix is gaining interest. One of these practices is the use of anaerobic digestion in closed containers known as biodigesters. The advantage of this method compared to other renewable energies, is that at the same time that energy is obtained from the combustion of the generated methane, it can be considered as a method of organic waste treatment. The main objective of this work is to study the feasibility for the installation of a biodigester, for this, an automotive company located in the city of Curitiba, state of Parana-Brazil, was taken as a case study. To carry out this evaluation, the economic part was considered as the main factor. The first step of the feasibility study is thoroughly understand the current management of organic waste produced in the company, that is, know the type of waste, quantities, treatment, transportation, and costs. In general miscellaneous organics (mainly kitchen waste), vegetable oil, fat from restaurants and garden waste are the different types of organic waste generated, which are considered to be used in the biodigester. The total average amount from period 2017-2019 adds up approx. 1,150 tons per year, in which the majority is re-directed by third parties to different facilities for subsequent treatment. This redirection has an annual cost of R$ 87,791.40 in matters of transport and management. Once knowing the type of organic waste, and the environmental conditions, the one that best fulfill the needs is the Continuous flow Stirred Tank Reactor (CSTR), which after a search for providers in the Parana region, a company named CONATUS ENERGIÁS RENOVÁVEIS was contacted. This company provided an installation and construction total quote of R$ 1,217,600.00. The amount of biogas that can be generated is approx. 140,000 m3/year. The energy that can be obtained through the combustion of biogas, may represent a decrease in the consumption of natural gas, electric energy, and fuels. This reduction on consumption represent savings for the company. In order to carry out the economic analysis and verify the viability of the project, indicators and tools such as cash flow, incomes, expenses, depreciation, net present value, internal rate of return and payback, were used. In total, 12 cases were analyzed, three with the average amount of waste for each of the projects, which are: Biogas as a substitution of Natural Gas, Gasoline or Diesel. The remaining 9 cases were calculated to have a payback of 2, 5 and 10 years for each of the projects, in order to have an idea of the amount of substrate and biogas needed. The results showed that to have a payback of 2 years is needed a substrate amount between 3,310 and 4,635 ton/year. For a 5 year payback 1,880 – 2,675 ton/year. And for a 10 year payback between 1,405 – 2,025 ton/year depending on the type of project.
Keywords: Anaerobic digestion. Biodigester. Biogas. Methane.

ZUSAMMENFASSUNG
Heutzutage gewinnt weltweit der Bedarf an neuen Technologien und Praktiken zur Reduzierung von Schadstoffen und zur Substitution nicht erneuerbarer Energien in der Energiematrix an Interesse. Eine dieser Techniken ist die Verwendung des anaeroben Aufschlusses in geschlossenen Behältern, die als Biodigester bekannt ist. Der Vorteil dieser Methode gegenüber anderen erneuerbaren Energien besteht darin, dass sie sowohl zur Erzeugung von Methan als auch als Methode zur Behandlung organischer Abfälle angesehen werden kann. Das Hauptziel dieser Arbeit ist es, die Machbarkeit für die Installation eines Biodigesters zu untersuchen. Dafür wurde ein Automobilunternehmen in der Stadt Curitiba im Bundesstaat Parana-Brasilien als Fallstudie herangezogen. Für diese Bewertung wurde der wirtschaftliche Teil als Hauptfaktor angesehen. Der erste Schritt der Machbarkeitsstudie besteht darin, das derzeitige Management der im Unternehmen produzierten organischen Abfälle genau zu verstehen, die Art der Abfälle, Mengen, Behandlung, Transport und Kosten zu kennen. Im Allgemeinen sind verschiedene organische Abfälle (hauptsächlich Küchenabfälle), Pflanzenöl, Fett aus Restaurants und Gartenabfälle die verschiedenen Arten der organischen Abfälle, die im Bioreaktor verwendet werden können. Die durchschnittliche Gesamtmenge aus dem Zeitraum 2017-2019 beträgt ca. 1.150 Tonnen pro Jahr, wobei die Mehrheit von Dritten zur anschließenden Behandlung an verschiedene Einrichtungen weitergeleitet wird. Diese Behandlung erfordert jährliche Kosten von R$ 87.791,40 in Transport- und Verwaltungsangelegenheiten. Nachdem wir die Art des organischen Abfalls und die Umweltbedingungen kennen, ist der Continuous flow Stirred Tank Reactor (CSTR) der am besten geegneite Reaktortyp. Bei der suche nach Anbietern im Bundesland Paraná wurde ein Unternehmen namens CONATUS ENERGIÁS RENOVÁVEIS kontaktiert. Dieses Unternehmen hat ein Gesamtangebot für Installation und Bau von R$ 1.217.600,00 vorgelegt. Die Menge an Biogas, die erzeugt werden kann, beträgt ca. 140.000 m3/Jahr. Die Energie, die durch die Verbrennung von Biogas gewonnen werden kann, kann eine Verringerung des Verbrauchs von Erdgas, elektrischer Energie und Brennstoffen bedeuten. Diese Verbrauchsreduzierung bedeutet Einsparungen für das Unternehmen. Zur Durchführung der wirtschaftlichen Analyse und zur Überprüfung der Realisierbarkeit des Projekts wurden Indikatoren und Instrumente wie Cashflow, Einnahmen, Ausgaben, Abschreibungen, Barwert, interne Rendite und Amortisation verwendet. Insgesamt wurden 12 Fälle analysiert, drei davon mit der durchschnittlichen Abfallmenge für jedes der Projekte: Biogas als Ersatz für Erdgas, Benzin oder Diesel. Für die verbleibenden 9 Fälle wurde eine Amortisation von 2, 5 und 10 Jahren für jedes der Projekte berechnet, um eine Vorstellung von der Menge an benötigtem Substrat und Biogas zu erhalten. Die Ergebnisse zeigten, dass für eine Amortisation von 2 Jahren eine Substratmenge zwischen 3.310 und 4.635 Tonnen/Jahr erforderlich ist. Für eine 5-Jahres-Amortisation 1.880 – 2.675 Tonnen/Jahr. Und für eine 10-jährige Amortisation zwischen 1.405 - 2.025 Tonnen/Jahr, abhängig von der Art des Projekts.
Schlüsselwörter: Anaerobe Behandlung. Bioreaktor. Biogas. Methan.

LIST OF FIGURES
FIGURE 1 – ANAEROBIC DIGESTION PROCESS .............................................. 21
FIGURE 2 – ANAEROBIC BACTERIA TEMPERATURE CLASSIFICATION ........ 24
FIGURE 3 – BIOMETHANE DEMONSTRATION IN AUTOMOBILES BY ITAIPU
BINACIONAL ..................................................................................... 30
FIGURE 4 – APLICATION OF BIOFERTILIZER .................................................... 31
FIGURE 5 – GENERAL BIOGAS PRODUCTION AND USE SCHEME ................ 32
FIGURE 6 – INDIAN BIODIGESTER MODEL ....................................................... 33
FIGURE 7 – CHINESE BIODIGESTER MODEL ................................................... 34
FIGURE 8 – TUBULAR FLOW BIODIGESTER ..................................................... 35
FIGURE 9 – TUBULAR FLOW BIODIGESTER SCHEME ..................................... 35
FIGURE 10 – UASB BIODIGESTER SCHEME ....................................................... 37
FIGURE 11 – CSTR BIODIGESTER SCHEME ....................................................... 38
FIGURE 12 – CSTR BIODIGESTER........................................................................ 38
FIGURE 13 – MECHANICAL VERTICAL AGITATOR FOR CSTR .......................... 39
FIGURE 14 – BEKON PROCESS SCHEME ........................................................... 40
FIGURE 15 – DRY BIODIGESTER. BEKON MINI-DRY FERMENTATION PLANT 40
FIGURE 16 – BIOGAS LOW PRESSURE GASHOLDER ........................................ 43
FIGURE 17 – DRY BIOGAS GASHOLDER ............................................................. 43
FIGURE 18 – DESICCATOR TO REMOVE WATER FROM BIOGAS: REACTOR
FILLED WITH ADSORBENT MATERIAL (ZEOLITES) ..................... 44
FIGURE 19 – BIOGAS UPGRADING TO BIOMETHANE BY PRESSURE SWING
ADSORPTION ................................................................................... 45
FIGURE 20 – MEMBRANE TECHNOLOGY FOR UPGRADING BIOGAS TO
BIOMETHANE ................................................................................... 45
FIGURE 21 – AVERAGE TEMPERATURE CURITIBA ............................................ 56
FIGURE 22 – ACTUAL ORGANIC WASTE PROCESS DIAGRAM ......................... 59
FIGURE 23 – ORGANIC WASTE PROCESS PROPOSAL DIAGRAM .................... 61
FIGURE 24 – CSTR BIODIGESTER PARTIALLY BURIED ..................................... 61
FIGURE 25 – COMPARISON OF THE PRICE OF US PROPANE WITH NATURAL
GAS AND OIL ................................................................................... 70
FIGURE 26 – AVERAGE PRICES PER LITER OF COMMON GASOLINE, DIESEL
AND ETHANOL FOR period 2004-2017 ........................................... 72

FIGURE 27 – REVENUES FROM THE USE OF BIOGAS ...................................... 73

LIST OF TABLES
TABLE 1 – IDEAL TEMPERATURES ANAEROBIC DIGESTION ......................... 24
TABLE 2 – INHIBITORS RANGES OF BIOGAS PRODUCTION ........................... 27
TABLE 3 – BIOGAS COMPOSITION ..................................................................... 28
TABLE 4 – BIOGAS PROPERTIES ....................................................................... 28
TABLE 5 – ADVANTAGES AND DISADVANTAGES ACCORDING THE TYPE OF
BIODIGESTER ............................................................................... 41-42
TABLE 6 – ORGANIC WASTE 2019 ...................................................................... 57
TABLE 7 – ORGANIC WASTE MANAGMENT COSTS 2019 ................................ 60
TABLE 8 – BIOGAS YIELD FNR ........................................................................... 62
TABLE 9 – BIOGAS YIELD SGC ........................................................................... 63
TABLE 10 – POWER GENERATION POTENTIAL .................................................. 64
TABLE 11 – HERMAL ENERGY OF BIOGAS ......................................................... 68
TABLE 12 – NATURAL GAS VOLUME .................................................................... 68
TABLE 13 – NATURAL GAS INTERNAL NETWORK CONDITIONS ...................... 69
TABLE 14 – NATURAL GAS SUBSTITUTION SAVINGS ........................................ 69
TABLE 15 – ENERGY SAVINGS BY ELECRICITY GENERATION ........................ 70
TABLE 16 – EQUIVALENCE BIOGAS, GASOLINE, DIESEL AND SAVINGS ........ 71
TABLE 17 – CAPEX ................................................................................................. 74
TABLE 18 – INCOMES PER YEAR BIOGAS - NATURAL GAS .............................. 75
TABLE 19 – INCOMES PER YEAR BIOGAS - GASOLINE ..................................... 76
TABLE 20 – INCOMES PER YEAR BIOGAS - DIESEL ........................................... 76
TABLE 21 – EQUIPMENT DEPRECIATION PER YEAR ......................................... 76
TABLE 22 – NATURAL GAS SUBSTITUTION EXPENSES PER YEAR ................. 77
TABLE 23 – GASOLINE SUBSTITUTION EXPENSES PER YEAR ........................ 77
TABLE 24 – DIESEL SUBSTITUTION EXPENSES PER YEAR .............................. 77
TABLE 25 – CASH FLOW, PRESENT VALUE AND NET PRESENT VALUE FOR
BIOGAS-NATURAL GAS ..................................................................... 79
TABLE 26 – CASH FLOW, PRESENT VALUE AND NET PRESENT VALUE FOR
BIOGAS-NATURAL GAS (PAYBACK 2 YEARS) ................................ 80
TABLE 27 – CASH FLOW, PRESENT VALUE AND NET PRESENT VALUE FOR
BIOGAS-NATURAL GAS (PAYBACK 5 YEARS) ................................ 80

TABLE 28 – CASH FLOW, PRESENT VALUE AND NET PRESENT VALUE FOR
BIOGAS-NATURAL GAS (PAYBACK 10 YEARS) .............................. 81
TABLE 29 – CASH FLOW, PRESENT VALUE AND NET PRESENT VALUE FOR
BIOGAS-GASOLINE ............................................................................ 82
TABLE 30 – CASH FLOW, PRESENT VALUE AND NET PRESENT VALUE FOR
BIOGAS-GASOLINE (PAYBACK 2 YEARS) ....................................... 83
TABLE 31 – CASH FLOW, PRESENT VALUE AND NET PRESENT VALUE FOR
BIOGAS-GASOLINE (PAYBACK 5 YEARS) ....................................... 83
TABLE 32 – CASH FLOW, PRESENT VALUE AND NET PRESENT VALUE FOR
BIOGAS-GASOLINE (PAYBACK 10 YEARS) ..................................... 84
TABLE 33 – CASH FLOW, PRESENT VALUE AND NET PRESENT VALUE FOR
BIOGAS-DIESEL ................................................................................. 85
TABLE 34 – CASH FLOW, PRESENT VALUE AND NET PRESENT VALUE FOR
BIOGAS-DIESEL (PAYBACK 2 YEARS) ............................................. 86
TABLE 35 – CASH FLOW, PRESENT VALUE AND NET PRESENT VALUE FOR
BIOGAS-DIESEL (PAYBACK 5 YEARS) ............................................. 86
TABLE 36 – CASH FLOW, PRESENT VALUE AND NET PRESENT VALUE FOR
BIOGAS-DIESEL (PAYBACK 10 YEARS) ........................................... 87
TABLE 37 – SUBSTRATE MASS, VOLUME BIOGAS FOR 2, 5 AND 10 YEARS
PAYBACK ............................................................................................ 88
LIST OF ACRONYMS AND ABBREVIATIONS
BC – Before Christ
C/N – Carbon-Nitrogen ratio
CAPEX – Capital Expenditures
CF – Cash Flow
CH4 – Methane
CO2 – Carbon dioxide
COeq – Carbon dioxide equivalent
CSTR – Contiuos flow Stirred Tank Reactor
EXCEL – Microsoft Office Excel
GHG – Green House Gases
GWP – Global Warming Potential
HRT – Hydraulic Retention Time
IRR – Internal Rate of Return
kWh – kilowatt hour
m3 – cubic meter
MAR – Minimum Atractiveness Rate
MWh – Megawatt hour
NPV – Net Present Value
OPEX – Operational Expenditures
PV – Present Value
UASB – Upflow Anaerobic Sludge Blanket

INDEX
1 INTRODUCTION ........................................................................................... 16
1.1 GENERAL OBJECTIVE ................................................................................ 17
1.2 SPECIFIC OBJECTIVES ............................................................................... 17
2 LITERATURE REVIEW ................................................................................. 18
2.1 HISTORY ...................................................................................................... 18
2.2 BIOGAS PROPERTIES AND PRODUCTION ............................................... 21
2.3 APPLICATIONS OF BIOGAS AND DIGESTATE .......................................... 28
2.4 BIOGAS PRODUCTION AND TREATMENT ................................................ 32
2.5 BIOGAS AND ENVIRONMENT ..................................................................... 46
3 METHODOLOGY .......................................................................................... 48
3.1 CASE OF STUDY: AUTOMOTIVE INDUSTRIAL FABRIC IN BRASIL ......... 49
3.2 CURRENT SITUATION OF ORGANIC WASTE MANAGEMENT ................. 49
3.3 ORGANIC WASTE MANAGMENT COSTS .................................................. 49
3.4 POTENTIAL FOR BIOGAS PRODUCTION .................................................. 49
3.5 POWER GENERATION POTENTIAL ........................................................... 50
3.6 FERTILIZER/COMPOST PRODUCTION CALCULATION ............................ 50
3.7 CALCULATION OF AVOIDED GHG EMISSIONS ........................................ 51
3.8 SAVINGS BY NATURAL GAS SUBSTITUTION WITH BIOGAS .................. 51
3.9 ELECTRICAL ENERGY SAVINGS ............................................................... 51
3.10 VEHICLE FUEL SUBSTITUTION .................................................................. 51
3.11 PROJECT ECONOMIC FEASIBILITY ANALYSIS ........................................ 52
3.12 LEGISLATION ............................................................................................... 55
4 RESULTS AND ANALYSIS .......................................................................... 56
4.1 CURRENT SITUATION OF ORGANIC WASTE MANAGEMENT ................. 56
4.2 ORGANIC WASTE CURRENT MANAGMENT COSTS ................................ 59
4.3 CHARACTERIZATION OF THE BIODIGESTER .......................................... 60
4.4 POTENTIAL FOR BIOGAS PRODUCTION .................................................. 62
4.5 POWER GENERATION POTENTIAL ........................................................... 64
4.6 FERTILIZER/COMPOST PRODUCTION CALCULATION ............................ 64
4.7 CALCULATION OF AVOIDED GHG EMISSIONS ........................................ 66
4.8 INCOME BY NATURAL GAS SUBSTITUTION WITH BIOGAS .................... 67
4.9 ELECTRICAL ENERGY SAVINGS ............................................................... 70
4.10 VEHICLE FUEL SUBSTITUTION .................................................................. 71
4.11 ECONOMIC FEASIBILITY ANALYSIS .......................................................... 73
4.12 LEGISLATION ............................................................................................... 88
5 CONCLUSION .............................................................................................. 90
BIBLIOGRAPHY ...................................................................................................... 91
ANNEX 1 – CONATUS ENERGIAS RENOVÁVEIS LTDA QUOTATION ............. 105 ANNEX 2 – HISTORICAL SELIC RATES 2020 .................................................... 108

16
1 INTRODUCTION
One of the problems at present, in the commitment to adopt renewable resources to
replace traditional sources for energy generation, is the uncertainty of the efficiency
of these resources and the fear of change, but this, at the same time is related to
disinformation. As Bley (2015) said, the activities that generate organic waste and
effluents, raw materials for biogas production, do not consider, do not value and,
therefore, do not incorporate biogas. The producers throw it away together like
organic waste and they prefer to supply their energy demands more conventionally,
as consumers, even if energy costs significantly affect the spreadsheets of their
products and services.
If the use of renewable sources for power generation in the past is compared,
according to the last report of the World Bioenergy Association: Global Bioenergy
Statistics, of 2019, there was an increase from 2000 to 2017 of 48%. Although there
has been an increase on the use of renewable sources, fossil fuels like coal, oil and
natural gas, still dominate the contribution in the global energy supply (86%), and
have been doing so since the dawn of the industrial revolution (WBA, 2019).
In the specific case of biogas, despite the fifty millions of micro, and 132,000 small,
medium and large biodigesters that operate worldwide, according to the World
Biogas Association in its biogas global potential report in 2019, it is only used
between 1.6 and 2.2% of the total global biogas potential (RICO, 2019).
Taking advantage of the potential of biogas for its energy use, the main objective of
this work is to study the variables that involve the installation of a biodigester, with
the purpose of being able to use biogas internally. From an environmental point of
view, there are many advantages that can be obtained from this technology, but
being a project of a private company, financial criteria is essential.
The work in addition to the economic analysis, aims to record in a summarized way,
through a bibliographic review, several points throughout the content, regarding the
use of biogas and biodigesters in history, the process of anaerobic digestion,
focused on biodigesters for the generation of biogas and digestate, the different
types of biodigesters and the environmental benefits they bring.

17
1.1 GENERAL OBJECTIVE
Evaluate the feasibility mainly from an economic point of view, for the installation of a
biodigester to produce biogas, from the organic waste generated inside the
automotive factory.
1.2 SPECIFIC OBJECTIVES
Record the study and analysis of technical and economic feasibility for the
internal generation of biogas, through an internal investigation of the type and
quantity of organic waste generated in the factory as well as the current costs
for its management.
Calculate the potential of biogas generation from the organic waste through
the biodigester.
Evaluate the possibility to decrease consumption of non-renewable resources,
like natural gas, gasoline and diesel fuels through biogas.
Quantify the amount of fertilizer and the possible emission of greenhouse
gases that could be avoided.
Calculate financial viability indicators such as net present value, payback,
internal rate of return and profitability for twelve different scenarios.
Simulate the minimum amount of substrate so that the investment becomes
profitable in 2, 5 and 10 years, for the partial substitution of natural gas,
gasoline and diesel.

18
2 LITERATURE REVIEW
First of all, it is convenient to define what biodigesters are. According to the
dictionary Merriam-Webster (2020) a biodigester is “a device or structure in which
the digestion of organic waste matter by bacteria takes place with the production of a
burnable biogas and a nutrient-rich slurry”. This decomposition within the biodigester
of organic matter is called anaerobic digestion and is carried out by the activity of
anaerobic microorganisms. The organic materials used in the biodigester can be of
different types and from different sources, such as: agriculture residues (leaves,
straws, crop debris), animal production (such as manure and urine), human activities
(feces, urine, household waste) and industrial waste (SUÇUARANA, 2016).
There are several types of biodigesters, each with its own characteristics of
operation, which design depend on the type of material used, local conditions,
requirements, etc. Later a deeper description of the biodigestion process, biogas
properties and the different types of biodigesters will be done.
2.1 HISTORY
The use of organic waste for the production of biogas is not new, according to Bley
(2014) cited by Carvalho (2017) there are reports that biogas was already used to
heat bath water in the 10th century BC. In the 13th century, the Chinese used to
cover their sewage tanks, and thus generated energy, but only from the 17th
century, some chemists and scientists began to study more thoroughly the
flammable gases that arose from the decomposition of solid waste.
Scientists like the Belgian doctor and chemist Jan Baptista van Helmont proved that
flammable gases can be originated from the decomposition of organic matter, or the
Italian physicist Alessandro Volta in 1776, who first identified methane, from different
observations and analysis (BLEY, 2015; MORENO, 2011). Penn State Extension
(2012) in the article A Short History of Anaerobic Digestion, states that Alessandro
Volta concluded that there was a direct correlation between the amount of decaying
organic matter and the amount of flammable gas produced.
19
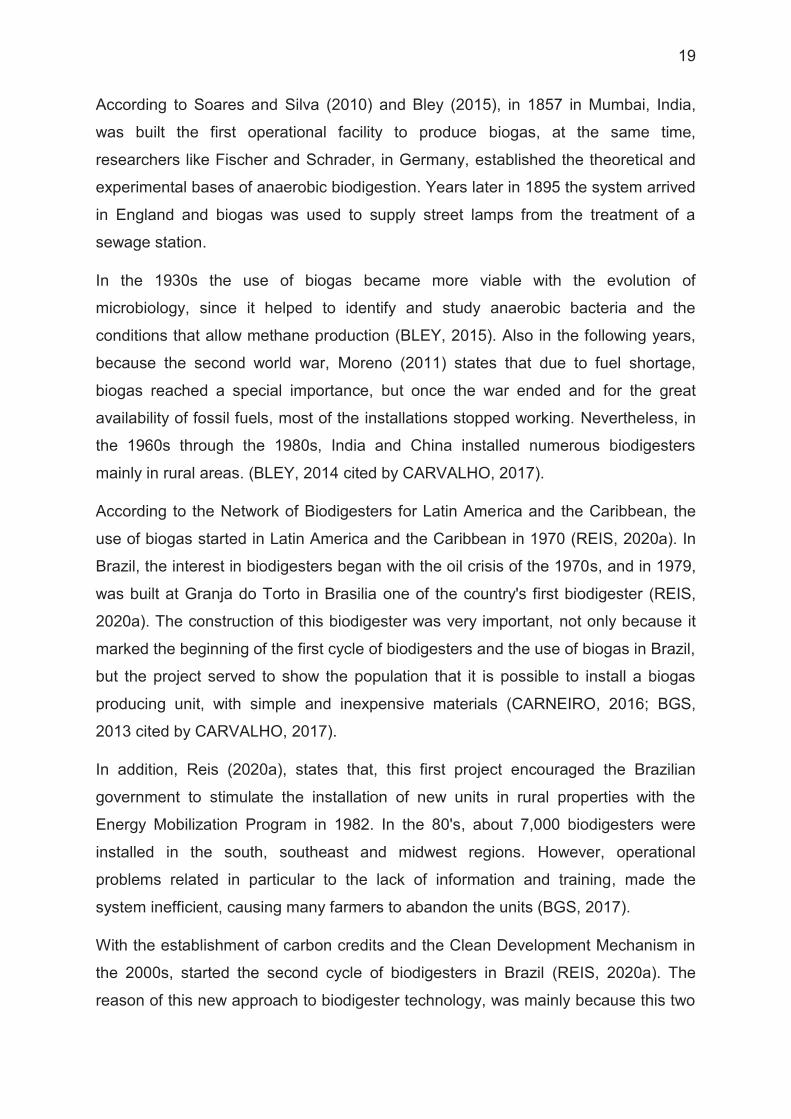
According to Soares and Silva (2010) and Bley (2015), in 1857 in Mumbai, India,
was built the first operational facility to produce biogas, at the same time,
researchers like Fischer and Schrader, in Germany, established the theoretical and
experimental bases of anaerobic biodigestion. Years later in 1895 the system arrived
in England and biogas was used to supply street lamps from the treatment of a
sewage station.
In the 1930s the use of biogas became more viable with the evolution of
microbiology, since it helped to identify and study anaerobic bacteria and the
conditions that allow methane production (BLEY, 2015). Also in the following years,
because the second world war, Moreno (2011) states that due to fuel shortage,
biogas reached a special importance, but once the war ended and for the great
availability of fossil fuels, most of the installations stopped working. Nevertheless, in
the 1960s through the 1980s, India and China installed numerous biodigesters
mainly in rural areas. (BLEY, 2014 cited by CARVALHO, 2017).
According to the Network of Biodigesters for Latin America and the Caribbean, the
use of biogas started in Latin America and the Caribbean in 1970 (REIS, 2020a). In
Brazil, the interest in biodigesters began with the oil crisis of the 1970s, and in 1979,
was built at Granja do Torto in Brasilia one of the country's first biodigester (REIS,
2020a). The construction of this biodigester was very important, not only because it
marked the beginning of the first cycle of biodigesters and the use of biogas in Brazil,
but the project served to show the population that it is possible to install a biogas
producing unit, with simple and inexpensive materials (CARNEIRO, 2016; BGS,
2013 cited by CARVALHO, 2017).
In addition, Reis (2020a), states that, this first project encouraged the Brazilian
government to stimulate the installation of new units in rural properties with the
Energy Mobilization Program in 1982. In the 80's, about 7,000 biodigesters were
installed in the south, southeast and midwest regions. However, operational
problems related in particular to the lack of information and training, made the
system inefficient, causing many farmers to abandon the units (BGS, 2017).
With the establishment of carbon credits and the Clean Development Mechanism in
the 2000s, started the second cycle of biodigesters in Brazil (REIS, 2020a). The
reason of this new approach to biodigester technology, was mainly because this two

20
carbon market mechanisms, gave financial incentive for those who use technologies
that somehow reduce the emission of greenhouse gases into the atmosphere, with
the biodigester being an option (BGS, 2017).
Nowadays, with the advancement of technology and science around the world,
biogas has gained more and more space as a renewable source of energy, along
with global concern for the environment. Despite this, as mentioned in the article by
Scarlat et al. (2018) there is a difference for example; in developing countries, biogas
is mainly produced in small, domestic-scale digesters, to be used for cooking or
lighting, and on the other hand, developed countries are focused on larger scale
digesters, like farm based, commercial, electricity and heat biogas plants.
In the world, Europe is a leader in biogas production, with a large, increasing number
of commercial biogas plants, more than 17,000 plants installed and a total electricity
capacity of over 10 GW, as compared to a global electricity capacity of 16 GW
(SCARLAT et al., 2018). This capacity of the total electricity generated by biogas,
may seem a lot, but compared to its high existing potential, is still low.
In the case of Brazil, there are several plants that generate energy through the reuse
of biogas from different sources. One of the main examples comes from São Paulo,
the largest thermoelectric plant powered by biogas of municipal solid waste in Brazil,
inaugurated in September 2016, with investments of more than R$100 million, with
an installed capacity of 29.5 MW, this plant generates enough energy to supply up to
130,000 homes (CARVALHO, 2017).
Currently in Brazil there are several biodigester plants, projects and initiatives
regarding the use of biogas from different sources and for different purposes.
Despite this, as in the whole world, the current installed capacity according to the last
technical note of Panorama do Biogas no Brasil em 2019 by CIBiogas (2020), the
biogas production is approximately 1.8 billions m3/year, this falls short of the existing
potential of 84.6 billions m3/year.

21
2.2 BIOGAS PROPERTIES AND PRODUCTION
2.2.1 BIOGAS FORMATION PROCESS
Organic matter, when decomposed in anaerobic environment (absence of oxygen),
causes a gas mixture called biogas, due to the action of different microorganisms.
This process is very common in nature and occurs, for example, in swamps, lakes
bottoms, ponds and in the digestive system of ruminant animals (FNR, 2010). Biogas
is part of the planet's natural metabolism, as it is a component of the biochemical
cycle of carbon, the largest and most comprehensive among the Earth's cycles
(BLEY, 2015).
Anaerobic digestion is a complex metabolic process that requires anaerobic
conditions and depends on the joint activity of an association of different groups of
microorganisms. As stated by Kunz, et al. (2019), this process can be divided into
four phases: hydrolysis, acidogenesis, acetogenesis and methanogenesis (FIGURE
1).
FIGURE 1 – ANAEROBIC DIGESTION PROCESS
SOURCE: PENN STATE (2018).

22
The first phase of anaerobic digestion is hydrolysis: In this first stage, practically
complex organic compounds, such as proteins, lipids, and carbohydrates are
decomposed into less complex compounds such as sugars, amino and fatty acids
(FNR, 2010). A variety of microorganisms are involved in hydrolysis, which is carried
out by exoenzymes, produced by those microorganisms, which decompose the
undissolved particulate material by biochemical reactions (AL SEADI et al, 2008).
According to Kunz et al. (2019) hydrolysis can be considered as a limiting phase of
the speed of anaerobic digestion, which can vary depending on the characteristics of
the substrate.
In the phase, acidogenesis, the products formed in hydrolysis stage are then
decomposed in short-chain fatty acids (acids acetic, propionic and butyric), carbon
dioxide and hydrogen, by means of acidogenic fermentative bacteria (AL SEADI, et
al., 2008). Additionally, small amounts of lactic acid and alcoholic acid are also
formed. The types of compounds generated at this stage depend on the
concentration of intermediate hydrogen (FNR, 2010).
The third phase acetogenesis, it is also known as the regulatory stage. The
compounds previously formed, alcohols and organic acids are converted by
acetogenic bacteria in biogas precursors: acetic acid, hydrogen, carbon dioxide
(ONUDI, 2006; SILVA, 2009 cited by ALVES, 2016). In this stage, the partial
pressure of hydrogen is decisive. For energy reasons, a very high concentration of
hydrogen prevents the conversion of intermediate compounds of acidogenesis, the
consequence is the accumulation of organic acids that inhibit methanogenesis. For
this reason, acetogenic bacteria have to be closely associated with methanogenic
archaeas, to ensure the proper means of acetogenic bacteria (FNR, 2010).
In the last stage of biogas formation, methanogenesis, strictly anaerobic methane
archaeas uses mainly acetic acid, hydrogen and carbon dioxide to produce methane
(JØRGENSEN; PLANENERGI, 2009). Hydrogenotrophic methanogens produce
methane from hydrogen and carbon dioxide, and acetoclastic methanogens from
acetic acid reduction (FNR, 2010).
Methanogenic microorganisms can be considered as the most important among
anaerobic microorganisms, since they are responsible for the formation of methane

23
and the elimination of the medium from the products of the previous groups
(MORENO, 2011).
The general and most common methane formation reactions are represented in the
chemical equations (1) and (2) (FISCHER, 2019).
CH3COOH → CH4 + CO2 (1)
CO2 + 4H2 → CH4 + 2H2O (2)
In general, the four phases of anaerobic decomposition occur in parallel in a process
of a single stage. However, since bacteria have different requirements for their
habitat, such as pH and temperature, a medium should be defined, in relation to the
process technology.
2.2.2 LIMITING FACTORS FOR BIOGAS GENERATION
2.2.2.1 Temperature
In general, the higher the temperature, the higher the speed of a chemical reaction.
This rule, however, does not always apply to biological transformation and
degradation, once each microorganism involved in the metabolic processes has its
own ideal temperature range (CORTEZ et al., 2010 cited by SPECK, 2019). The
temperature variation above or below this ideal range or the rapid increase to more
than 5°C per day, may lead to inhibition of microorganisms, and may even lead to
irreversible damage. (CORTEZ et al., 2010 cited by SPECK, 2019). According to the
specific temperature range for their growth, anaerobic bacteria can be divided into
three categories as shown in FIGURE 2:

24
FIGURE 2 – ANAEROBIC BACTERIA TEMPERATURE CLASSIFICATION
SOURCE: MATHERI et al. (2018).
a) Psychrophilic: minimum 4-10 °C, maximum 20-25 °C and 100 days to ferment.
b) Mesophilic: minimum 15-20 °C, maximum 35-45 °C and 30-60 days to ferment.
c) Thermophilic: minimum 25-45 °C, maximum 75-80 °C and 10-15 days to ferment.
In order to get a considerable amount of biogas, mesophilic range is the most used
in biodigesters, since it is less unstable than a thermophilic range and faster than the
psychrophilic (MORENO, 2011).
The following TABLE 1 details the ideal temperatures range for the different phases
in the anaerobic digestion process, for optimal methane production:
TABLE 1 – IDEAL TEMPERATURES ANAEROBIC DIGESTION
HIDROLISIS/ACIDOGENESIS METHANOGENESIS
TEMPERATURE °C 25 - 35 Mesophilic: 32 – 42
Termophilic: 50 – 58
SOURCE: Adapted from EDWIGES (2017).
2.2.2.2 Hydraulic Retention Time (HRT)
According to Kunz et al. (2019), hydraulic retention time counts from the entry of the
substrate to the exit of the digestate, that is, the time in which the material remains
inside the biodigester, and it is directly related to the temperature range used in the

25
biodigester. The retention time must be sufficiently long to ensure that the amount of
microorganisms removed with the digestate, is not higher than the amount of
reproduced microorganisms, but at the same time, a short HRT provides a good
substrate flow rate, but a lower gas yield (AL SEADI et al., 2008).
2.2.2.3 pH
The temperature rule also applies to the pH value. The microorganisms involved in
the different stages of decomposition, require different pH values for their optimal
development (GEHM, 2016).
According to FNR (2010) the ideal pH for hydrolytic and acidic bacteria is from 5.2 to
6.3. These bacteria, however, do not depend strictly on this range, and are able to
transform the substrate even in the presence of slightly elevated pH values, with
their activity only slightly decreased. Acetogenic bacteria and methanogenic
archaeas, on the other hand, depend entirely on a neutral pH between 6.5 and 8.
Fermentation processes should be carried out with these pH ranges, otherwise, the
enzymatic activity can be canceled (MOURA, 2012 cited by ZAVADINACK, 2016).
2.2.2.4 Nutrients
Each species of microorganism involved in anaerobic decomposition has its own
need for vitamins, micro and macronutrients. The growth rate and activity of the
different populations are conditioned to the concentration and availability of these
nutrients. According to Rio (2014) among the macronutrients include: Carbon,
Hydrogen, Nitrogen, Phosphorus, Sulfur, Potassium, Calcium and Magnesium, being
the Carbon and Nitrogen the most important; and among the micronutrients are: Iron,
Manganese, Zinc, Molybdenum, Copper, Cobalt, Nickel, Boron, Chlorine, Sodium,
Selenium, Silicon and Tungsten.
In order to produce the maximum methane with the substrate used, the availability of
nutrients for microorganisms should be maintained at optimal levels. The amount of
26
methane that can be obtained from the substrate is determined by its protein, fat and
carbohydrate content (FNR, 2010).
The appropriate ratio between macro and micronutrients is a prerequisite for process
stability. A very high C/N ratio, reduces metabolic activity, as a result, carbon is not
completely degraded, and methane yield does not reach its peak. Inversely, nitrogen
abundance can cause excessive ammonia (NH3) formation, capable of inhibiting the
growth of bacteria (decreasing methane production), even at low concentrations, and
may even cause the collapse of the entire population of microorganisms (RIO, 2014).
Therefore, in order for the process to take place properly, the C/N ratio must be in
the range of 10 to 30 (FNR, 2010).
Besides Carbon and Nitrogen, Phosphorus and Sulfur are equally essential
nutrients. Amino acids have sulfur in their composition, and phosphorus compounds
are fundamental for the formation of ATP (Adenosine triphosphate) and NADP
(Nicotinamide Adenine Dinucleotide Phosphate), responsible for energy transport
(AL SEADI et al., 2008; FNR, 2010).
2.2.2.5 Inhibitors
Inhibition of gas production may be caused by different factors, it may have technical
and operational reasons. It is important to note that excessive loading of substrate in
the biodigester can also inhibit the digestion process, negatively influencing bacterial
activity (FNR, 2010).
The bacteria responsible for hydrolysis and acidogenesis can perform their metabolic
process both in the presence and absence of oxygen. At the beginning of the
process, there are always small traces of oxygen that enter along with the substrate,
but it is quickly consumed by the facultative bacteria present (BRASIL, 2015). As
long as the oxygen intake is not excessively great, these bacteria consume it before
that it harms the methanogenic archaeas, dependent on of an oxygen-free medium
(FNR, 2010).
In highly concentrations, essential micronutrients may also be toxic to
microorganisms, but at the same time, because microorganisms can adapt to these

27
nutrients, is difficult to determine the exact concentration from which a nutrient is
harmful, and also some inhibitors interact with other substances (MORENO, 2011).
The progress of anaerobic digestion process can be delayed by the action of
inhibitory substances, even at low concentrations. Some inhibitors ranges are
presented in TABLE 2:
TABLE 2 – INHIBITORS RANGES OF BIOGAS PRODUCTION
INHIBITOR CONCENTRATION OBSERVATION
Oxygen > 0,1 mg/L Inhibition of mandatory
anaerobic methanogenic archaeas
Hydrogen sulfide > 50 mg/L The lower the pH, the greater
the inhibitory effect
Volatile fatty Acids
> 2.000 mg/L (pH = 7,0)
The lower the pH, the greater the inhibitory effect. High adaptability of bacteria
Ammoniacal nitrogen
> 3.500 mg/L (pH = 7,0)
The higher the pH and temperature, the greater the
inhibitory effect. High adaptability of bacteria
Heavy metals
Cu > 50 mg/L Only dissolved metals have an inhibitory effect.
Decontamination by sulfide precipitation.
Zn > 150 mg/L
Cr > 100 mg/L Antibiotic
disinfectants* - Inhibitory effect varies with the compound
NOTE: * The contribution of antibiotics usually occurs by the addition of organic fertilizers or animal fats.
SOURCE: Adapted from FNR (2010).
2.2.3 BIOGAS COMPOSITION AND PROPERTIES
The formed gas mixture is mainly composed of methane and carbon dioxide. Biogas
contains still small amounts of hydrogen, sulfide of hydrogen, ammonia and other
trace gases. Its composition is mainly influenced by the substrates used in the
fermentation technique, and the different plant technologies (TABLE 3).

28
TABLE 3 – BIOGAS COMPOSITION
COMPOUND CHEMICAL SYMBOL
CONTENT VOL %
Methane CH4 50-75 Carbon dioxide CO2 25-45
Water vapor H2O 2-7 Oxygen O2 <2 Nitrogen N2 <2 Ammonia NH3 <1 Hydrogen H2 <1
Hydrogen sulphide H2S <1
SOURCE: AL SEADI et al. (2008).
Depending on its composition, biogas has the following properties, owing its calorific
value mainly to the amount of methane present. In this case, an average of 60% vol.
of methane has been consider (TABLE 4).
TABLE 4 – BIOGAS PROPERTIES
PARAMETER UNIT BIOGAS (60% CH4)
Low heating value*
MJ/Nm3 21.5 kWh/Nm3 6
Density kg/Nm3 1.21 Theoretical requirement of air m3 air/m3 gas 5.71
Maximum flame speed m/s 0.25
NOTE: * Refers to the heat of combustion minus the heat of vaporization of the water vapor present in the gas.
SOURCE: Adapted from BRASIL (2015).
2.3 APPLICATIONS OF BIOGAS AND DIGESTATE
The main commercial applications of biogas are:
Thermal energy,
Electrical energy,
Mechanical energy,
Biomethane,
The use of the digestate as fertilizer.

29
2.3.1 THERMAL, ELECTRICAL AND MECHANICAL ENERGY
Thermal energy derived from biogas is obtained through its burning, and can be
used in boilers and heaters. Its industrial use potential is broad in heat-demanding
processes, while its home use allows to replace cooking gas and water heating
systems (YABE et al., 2018).
Basically the electricity derived from biogas is obtained when it is used to trigger
motogenerators.
Thermal energy and electricity applications from biogas, can be used together, which
it is called Cogeneration, and can be applied in two ways. According to CIBiogas and
Unido (2020), the first is path is called topping, when the biogas energy is first used
to generate electrical energy and then the recovered heat is used. The second path
is called bottoming, when the energy from the fuel is first used to generate heat, and
then the residual steam is used to generate electromechanical energy.
Biogas also can be used as a fuel for generating mechanical energy in an engine. In
Brazil the largest application is for pumping the digestate to the crop areas, such as
the use of biofertilizer (CIBIOGAS; UNIDO, 2020).
2.3.2 BIOMETHANE
Biogas, as mentioned previously, is a mixture of different types of gases. The main
ones being methane and carbon dioxide, in addition to trace gases. If the carbon
dioxide and trace gases are removed, the so-called Biomethane is obtained, whose
composition resembles natural gas in terms of methane content. This process is
known as Purification or biogas upgrade (EBA, 2019; CIBIOGAS; UNIDO, 2020).
Biogas purification makes it a perfect substitute for natural gas in all its applications,
opening up a great potential for use, it can even be injected into the natural gas
network, with practically no modification to the infrastructure (EBA, 2019).
Biomethane also can be used as a fuel substitute of gasoline or diesel, particularly in
agricultural machinery and urban or road vehicles (FIGURE 3) (YABE et al., 2018).

30
FIGURE 3 – BIOMETHANE DEMONSTRATION IN AUTOMOBILES BY ITAIPU BINACIONAL
SOURCE: H2FOZ (2019).
The use of biomethane in automobiles, in addition to significantly reducing the
emission of carbon dioxide compared to traditional petroleum-based fuels, has a
higher octane rating (MLC,2017; AGENCIAS, 2020). By having a higher octane
rating, it reduces the intensity of combustion explosions, reducing in turn, engine
vibrations. This reduction in vibrations reduces friction between parts, which implies
less wear, helping to extend the useful life of components and reducing the noise
level of vehicles, which also helps to reduce noise pollution (MLC, 2017).
In order to use biomethane in cars, first it must be modified. According to Blanco
(2018) cited by Soage (2018) is a simple process. It is necessary to install a gas tank
normally in the spare wheel compartment and some accessories that bring the
biomethane to the gas injectors in the engine.
2.3.3 FERTILIZER
A by-product of the anaerobic digestion process, it is known as digestate, and due to
its properties, it can be used as a fertilizer.
According to the Encyclopaedia Britannica (2020), fertilizer is a “natural or artificial
substance containing the chemical elements that improve growth and
productiveness of plants”.

31
In the case of a biofertilizer, it consists of non-organic residue generated in the
biodigestion process. It can be diluted in water to be used directly in crops, grass
(fertigation) (FIGURE 4) or undergo drying/composting processes to be stored or
sold in solid form (YABE et al., 2018). Its content of beneficial nutrients for the soil,
depends on the quality and composition of the substrate. Its use depends on its
composition and the characteristics of the soil where it will be applied, but as in the
case of the biogas, the biofertilizer can be further upgraded in order to obtain a
higher quality fertilizer (EBA, 2019).
FIGURE 4 – APLICATION OF BIOFERTILIZER
SOURCE: CIBIOGAS; UNIDO (2020).
The following diagram (FIGURE 5) represents the possible uses of the biogas
already described.

32
FIGURE 5 – GENERAL BIOGAS PRODUCTION AND USE SCHEME
SOURCE: ELY et al. (2016).
2.4 BIOGAS PRODUCTION AND TREATMENT
2.4.1 TYPES OF BIODIGESTERS
According to Kunz et al. (2019) biodigesters can be characterized by the feeding
regime (batch or continuous), form of feeding (ascending or laminar), concentration
of solids in the reactor (solid digestion > 20%, semi-solid 10 to 15% and wet <10%)
and agitation system (complete, partial or without mixing).
Nowadays, there are different types of biodigesters, for different types of substrates
and for different purposes, they also present modifications depending on the
conditions and requirements. Some types of biodigesters are:

33
2.4.1.1 Indian Model
This type of biodigester is very common in rural areas. It is characterized by having a
floating metal hood as a gasometer that can be submerged over the fermenting
biomass or in an external water seal, in order to reduce losses during the gas
production process (CIBIOGAS; UNIDO, 2020). Within the structure has a central
wall, making the fermentation tank a double chamber tank, as can be seen in
FIGURE 6. As biogas is produced, the gasometer tends to move vertically,
increasing its volume and keeping the operating pressure constant. The supply is
continuous, and according to Deganutti et al. (2002) cited by Araújo (2017), the
substrate used in this model must contain a concentration of total solids of up to 8%,
so that its circulation inside the chamber is facilitated, and also to avoid clogging of
the inlet and outlet pipes with the material.
FIGURE 6 – INDIAN BIODIGESTER MODEL
SOURCE: BIOGASPLANT (2014).

34
2.4.1.2 Chinese model
It is formed by a cylindrical masonry chamber for fermentation process, with a roof
serving to store part of the biogas produced (FIGURE 7). Since in this type of
digesters there is no gasometer, the biogas is stored inside the system, working
based on the principle of hydraulic press, that is, if there is a pressure increase
inside it due to the accumulation of biogas, a displacement of the effluent from the
gas chamber to the outlet box will occur, and in the opposite direction if there is
decompression (CIBIOGAS; UNIDO, 2020). Similar to the Indian model, the
substrate must be supplied continuously, with a concentration of total solids of
around 8%, to avoid clogging in the system and facilitate the circulation of the
material (DEGANUTTI et al., 2002 cited by ARAÚJO, 2017).
FIGURE 7 – CHINESE BIODIGESTER MODEL
SOURCE: GREGORY (2010).
2.4.1.3 Tubular flow biodigester (plug flow)
This type of biodigester is know as Canadian, Covered pond, Tubular flow or Plug
flow biodigester model. It is more modern than the biodigesters mentioned above,
despite its simple design. The model differs by the fact that it is of the horizontal
35
type, presenting a cargo box made of masonry and with a width greater than the
depth, thus having a greater area of exposure to the sun, allowing for a great
production of biogas and also avoiding clogging (FIGURE 8) (CASTANHO;
HARRUDA, 2008 cited by FRIGO et al., 2015).
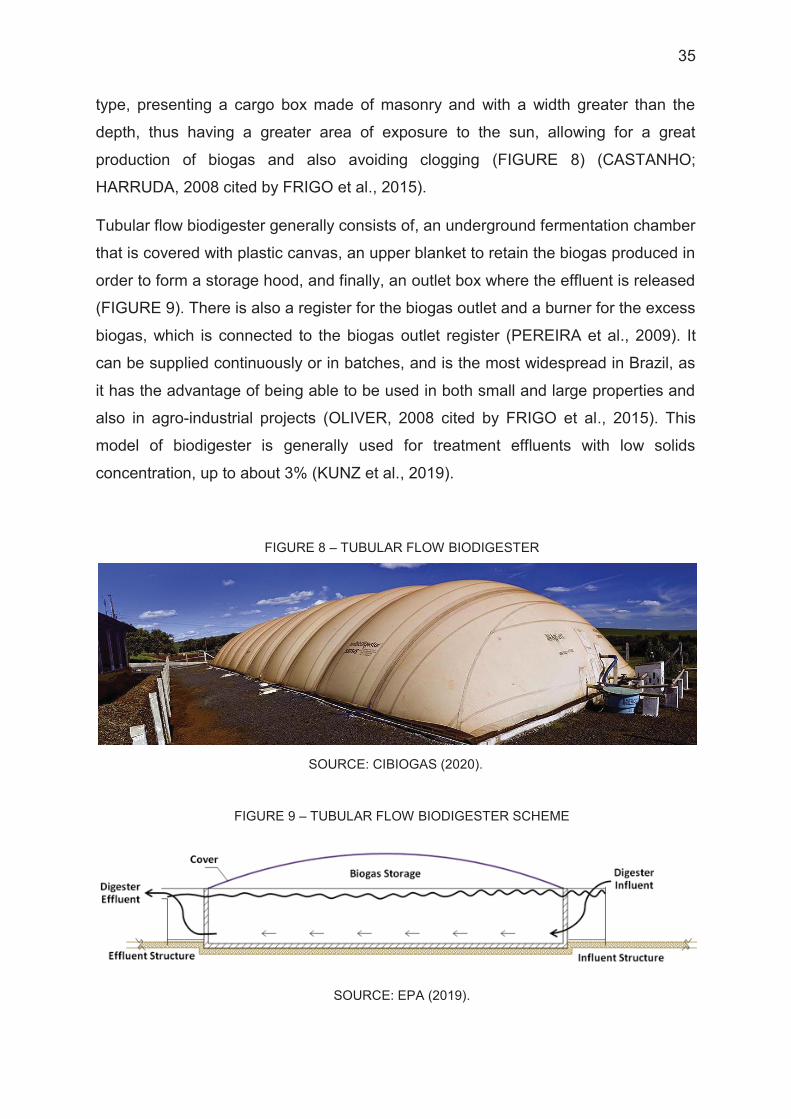
Tubular flow biodigester generally consists of, an underground fermentation chamber
that is covered with plastic canvas, an upper blanket to retain the biogas produced in
order to form a storage hood, and finally, an outlet box where the effluent is released
(FIGURE 9). There is also a register for the biogas outlet and a burner for the excess
biogas, which is connected to the biogas outlet register (PEREIRA et al., 2009). It
can be supplied continuously or in batches, and is the most widespread in Brazil, as
it has the advantage of being able to be used in both small and large properties and
also in agro-industrial projects (OLIVER, 2008 cited by FRIGO et al., 2015). This
model of biodigester is generally used for treatment effluents with low solids
concentration, up to about 3% (KUNZ et al., 2019).
FIGURE 8 – TUBULAR FLOW BIODIGESTER
SOURCE: CIBIOGAS (2020).
FIGURE 9 – TUBULAR FLOW BIODIGESTER SCHEME
SOURCE: EPA (2019).

36
Despite the advantages, it has several disadvantages such as: Reduced durability,
sensitivity to damage (cuts) what can cause loss of biogas, need for high hydraulic
retention time and sludge accumulation at the bottom of the tank (FIEP, 2016; KUNZ
et al., 2019).
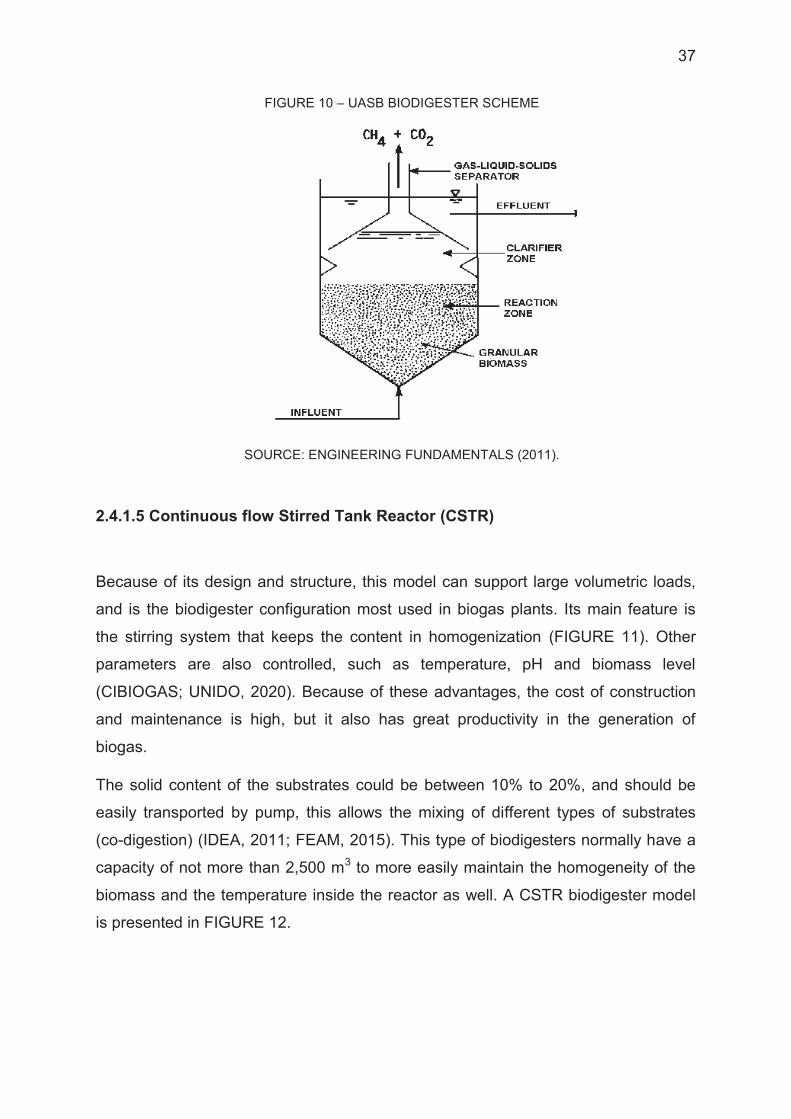
2.4.1.4 Upflow Anaerobic Sludge Blanket (UASB)
The Upflow Anaerobic Sludge Blanket biodigester is characterized by the upward
flow of effluents (FIGURE 10). This type of reactors belongs to the high rate
anaerobic treatment (KUNZ et al., 2019).
The success of this type of reactor relies on the formation of granules of easy
sedimentation. These granules consist of the agglomeration of anaerobic bacteria,
which causes an biomass agglomeration, and therefore an effective retention of
bacteria within the reactor, which speeds up the digestion process (AKUNNA;
KLARK, 2000 cited by KUHAD; SINGH, 2013).
A device for separating gases, solids and liquids, prevents the upward flow of gases
formed in the stabilization processes loading up with particles that comes off the
sludge blanket, allowing them to return to the digestion chamber, instead of being
dragged out of the system along with the digestate (CIBIOGAS; UNIDO, 2020).
This model requires greater control in the operation, since the formation of granules
is not a simple process, in addition it has a more complex structural construction
(JUNQUEIRA, 2014 cited by CIBIOGAS; UNIDO, 2020). For hydrodynamic reasons,
the affluent of the UASB reactor must have a low concentration of total solids less
than 2% (KUNZ et al., 2019).
37
FIGURE 10 – UASB BIODIGESTER SCHEME
SOURCE: ENGINEERING FUNDAMENTALS (2011).
2.4.1.5 Continuous flow Stirred Tank Reactor (CSTR)
Because of its design and structure, this model can support large volumetric loads,
and is the biodigester configuration most used in biogas plants. Its main feature is
the stirring system that keeps the content in homogenization (FIGURE 11). Other
parameters are also controlled, such as temperature, pH and biomass level
(CIBIOGAS; UNIDO, 2020). Because of these advantages, the cost of construction
and maintenance is high, but it also has great productivity in the generation of
biogas.
The solid content of the substrates could be between 10% to 20%, and should be
easily transported by pump, this allows the mixing of different types of substrates
(co-digestion) (IDEA, 2011; FEAM, 2015). This type of biodigesters normally have a
capacity of not more than 2,500 m3 to more easily maintain the homogeneity of the
biomass and the temperature inside the reactor as well. A CSTR biodigester model
is presented in FIGURE 12.

38
FIGURE 11 – CSTR BIODIGESTER SCHEME
SOURCE: CIBIOGAS; UNIDO (2020).
FIGURE 12 – CSTR BIODIGESTER
SOURCE: REIS (2020b).
Agitation technologies can be divided into mechanical, hydraulic or pneumatic (IDAE,
2011). In the FIGURE 13, it can be observed an example of a mechanical agitator.
According to Karim et al. (2005), the use of a stirring system results in a 15 to 30%
gain in biogas productivity comparing with biodigesters that do not have a stirring
system.

39
FIGURE 13 – MECHANICAL VERTICAL AGITATOR FOR CSTR
SOURCE: AAT (2020).
Maintenance of temperature by heating systems guarantees a greater biogas
production capacity, since it contributes to the stabilization of the reactor and
maintenance of the microorganism population. According to Kunz et al. (2019) there
are several possibilities for heating the biomass in a CSTR biodigester: heating the
substrate, direct heating of the biomass and circulation of heated water through coils
inside of the reactor, this last one is the most used system among the continuos
stirring tank reactors.
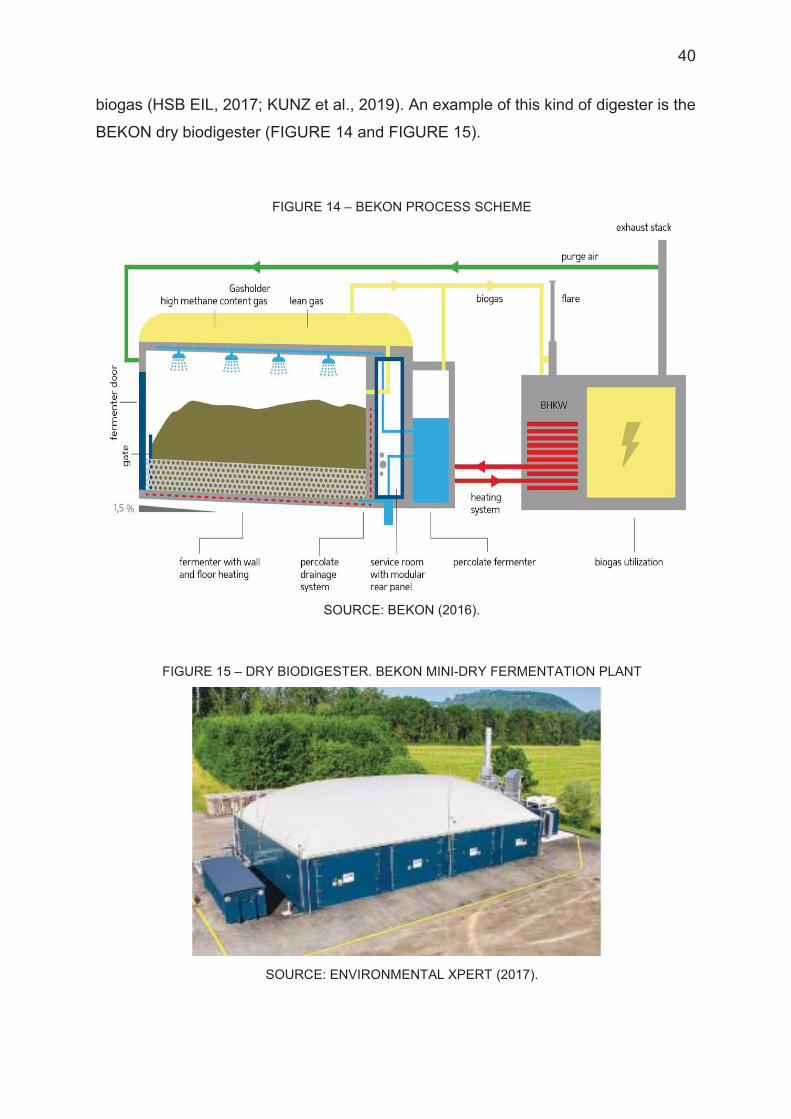
2.4.1.6 Dry digesters (Dry fermentation)
What characterizes this type of reactor is that it can work with substrates with a high
percentage in solids, between 20 - 40%. Despite having less productivity than wet
digesters (around 40% less), the content of methane in biogas can have a maximum
of 80% in volume concentration (REIS, 2020b).
These systems work with a percolate, which is added to the system continuously to
maintain the necessary bacterial load. This type of reactor works commonly in batch
process and it need to be opened to be filled and/or emptied. Because of this, the
risk of explosion is high due to the increase in concentration of air in the mix with
40
biogas (HSB EIL, 2017; KUNZ et al., 2019). An example of this kind of digester is the
BEKON dry biodigester (FIGURE 14 and FIGURE 15).
FIGURE 14 – BEKON PROCESS SCHEME
SOURCE: BEKON (2016).
FIGURE 15 – DRY BIODIGESTER. BEKON MINI-DRY FERMENTATION PLANT
SOURCE: ENVIRONMENTAL XPERT (2017).

41
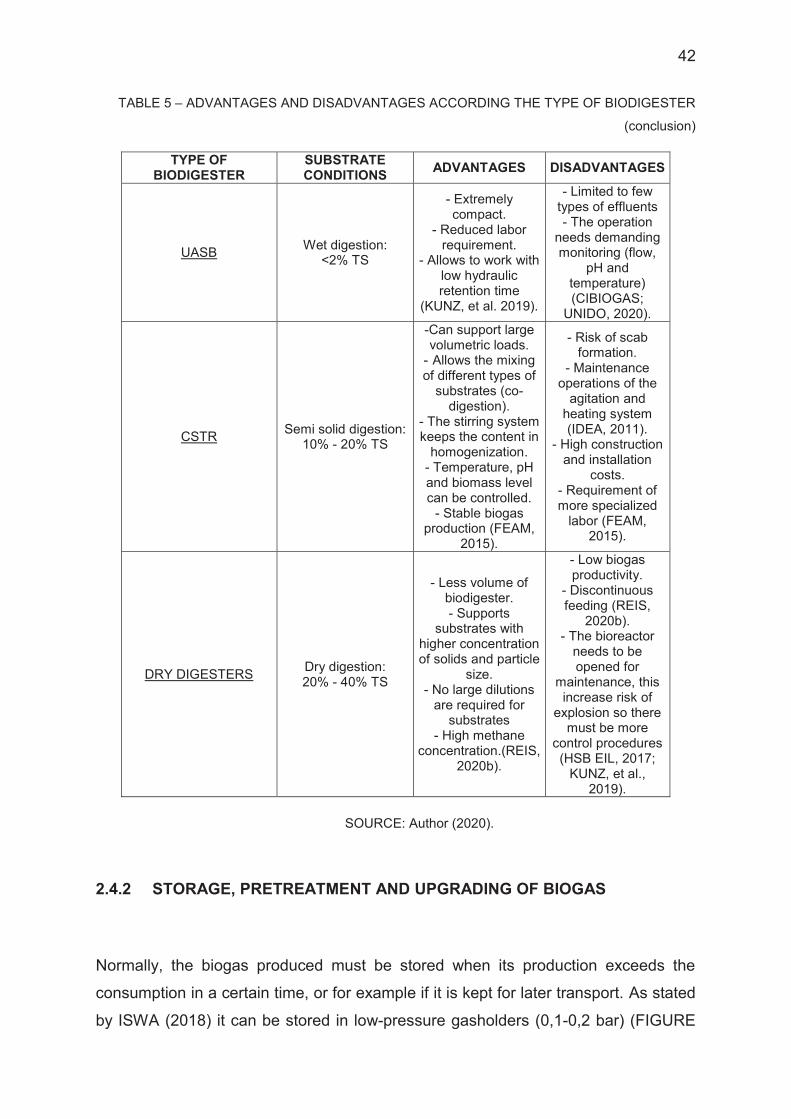
In TABLE 5, are presented in a summarized way and as a complement to what is
described above, the conditions of the substrate regarding the percentage of solids
and the advantages and disadvantages of the different types of biodigesters.
TABLE 5 – ADVANTAGES AND DISADVANTAGES ACCORDING THE TYPE OF BIODIGESTER
(continue)
TYPE OF BIODIGESTER
SUBSTRATE CONDITIONS ADVANTAGES DISADVANTAGES
INDIAN MODEL Wet digestion: ˂8%Total Solids
- Low construction and installation
price. - As it is buried in
the ground, there is little variation in
temperature (FIEP, 2016).
- The maintenance cost is high, mainly
due to the metal hood gasometer. - Low rate biogas
generation - It is not suitable
for large installations.
CHINESE MODEL Wet digestion: ˂8% Total Solids
- Low construction and installation
price. - No moving parts
and no metallic parts, which allows a longer useful life of
the biodigester. - As it is buried in
the ground, there is little variation in
temperature (FIEP, 2016).
- It is not suitable for large
installations. - Low rate biogas
generation
TUBULAR FLOW Wet digestion: ˂3% TS
- Simple design and operation.
- Greater area of exposure to the sun, allows to increase
the temperature and the same time increase the
production of biogas (FRIGO et al. 2015).
- Large area of construction.
- Limited to few types of effluents
and low volumetric load.
- Lack of heating and agitation
system (REIS, 2020b).
- Reduced durability of equipment.
-Sensitivity to damage (cuts) (FIEP, 2016).
- Need for high hydraulic retention
time. - Sludge
accumulation at the bottom of the tank (KUNZ et al.,
2019.
42
TABLE 5 – ADVANTAGES AND DISADVANTAGES ACCORDING THE TYPE OF BIODIGESTER
(conclusion)
TYPE OF BIODIGESTER
SUBSTRATE CONDITIONS ADVANTAGES DISADVANTAGES
UASB Wet digestion: ˂2% TS
- Extremely compact.
- Reduced labor requirement.
- Allows to work with low hydraulic retention time
(KUNZ, et al. 2019).
- Limited to few types of effluents - The operation
needs demanding monitoring (flow,
pH and temperature) (CIBIOGAS;
UNIDO, 2020).
CSTR Semi solid digestion: 10% - 20% TS
-Can support large volumetric loads.
- Allows the mixing of different types of
substrates (co-digestion).
- The stirring system keeps the content in
homogenization. - Temperature, pH and biomass level can be controlled.
- Stable biogas production (FEAM,
2015).
- Risk of scab formation.
- Maintenance operations of the
agitation and heating system (IDEA, 2011).
- High construction and installation
costs. - Requirement of more specialized
labor (FEAM, 2015).
DRY DIGESTERS Dry digestion: 20% - 40% TS
- Less volume of biodigester. - Supports
substrates with higher concentration of solids and particle
size. - No large dilutions
are required for substrates
- High methane concentration.(REIS,
2020b).
- Low biogas productivity.
- Discontinuous feeding (REIS,
2020b). - The bioreactor
needs to be opened for
maintenance, this increase risk of
explosion so there must be more
control procedures (HSB EIL, 2017;
KUNZ, et al., 2019).
SOURCE: Author (2020).
2.4.2 STORAGE, PRETREATMENT AND UPGRADING OF BIOGAS
Normally, the biogas produced must be stored when its production exceeds the
consumption in a certain time, or for example if it is kept for later transport. As stated
by ISWA (2018) it can be stored in low-pressure gasholders (0,1-0,2 bar) (FIGURE

43
16), in medium-pressure tanks (1-100 m³; 1-2 bar), in high-pressure gas cylinders
(30-50 L; 20 bar) or as liquefied gas below the critical temperature of methane (-82.5
ºC). Low-pressure gasholders can be divided into wet and dry gasholders. Wet
gasholders consist of floating rigid bells, usually of steel with a capacity of 50–5000
m³. Dry gasholders are made of rubber or plastics and store from 1-1000 m³ of
biogas (ISWA, 2018) (FIGURE 17).
FIGURE 16 – BIOGAS LOW PRESSURE GASHOLDER
SOURCE: RULSEH (2015).
FIGURE 17 – DRY BIOGAS GASHOLDER
SOURCE: G1 PR (2017).

44
Biogas usually must be pretreated before end use, that means, mainly removing the
water vapor and trace gases that biogas may have. In any case, water vapor content
must be condensed, as water is a major source of corrosion. Among the most used
methods are the physical separation of water by condensation (cyclone separators;
defrosters with fine mesh screen) or chemical drying (KUNZ, et al., 2019). Within
chemical drying includes the use of cylindrical reactors containing adsorbent
materials such as triethylene glycol or hygroscopic or adsorbent salts such as
zeolites (FIGURE 18), silica gel or aluminum oxide in their internal volume (NOVAK
et al., 2016; RYCKEBOSCH et al., 2011 cited by KUNZ, et al., 2019).
FIGURE 18 – DESICCATOR TO REMOVE WATER FROM BIOGAS: REACTOR FILLED WITH ADSORBENT MATERIAL (ZEOLITES)
SOURCE: AVP (2019).
A common trace gas in biogas is hydrogen sulfide, whenever present must be
removed, since it represents a danger for human health, the environment, decreases
the calorific power of biogas and causes significant damage to piping, equipment
and instrumentation. (PRICE; CHEREMISINOFF, 1995 cited by FRARE et al., 2009;
ZAFAR, 2019). In order to remove this, chemical absorption of hydrogen sulfide is
one of the possible treatment (LOHANI, 2010).
For upgrading biogas into biomethane to be used as a substitute or a complement of
natural gas, as town gas or as a motor fuel, carbon dioxide must be removed.
According to Lohani (2010) carbon dioxide could be removed by absorption in water
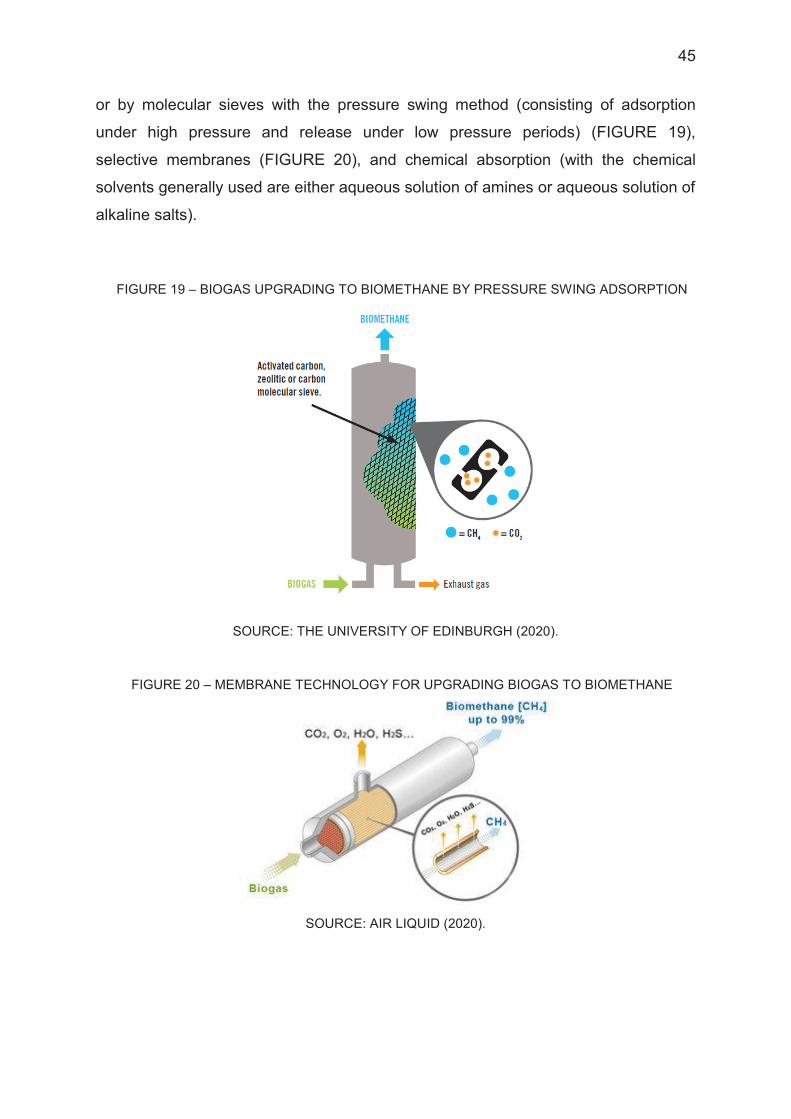
45
or by molecular sieves with the pressure swing method (consisting of adsorption
under high pressure and release under low pressure periods) (FIGURE 19),
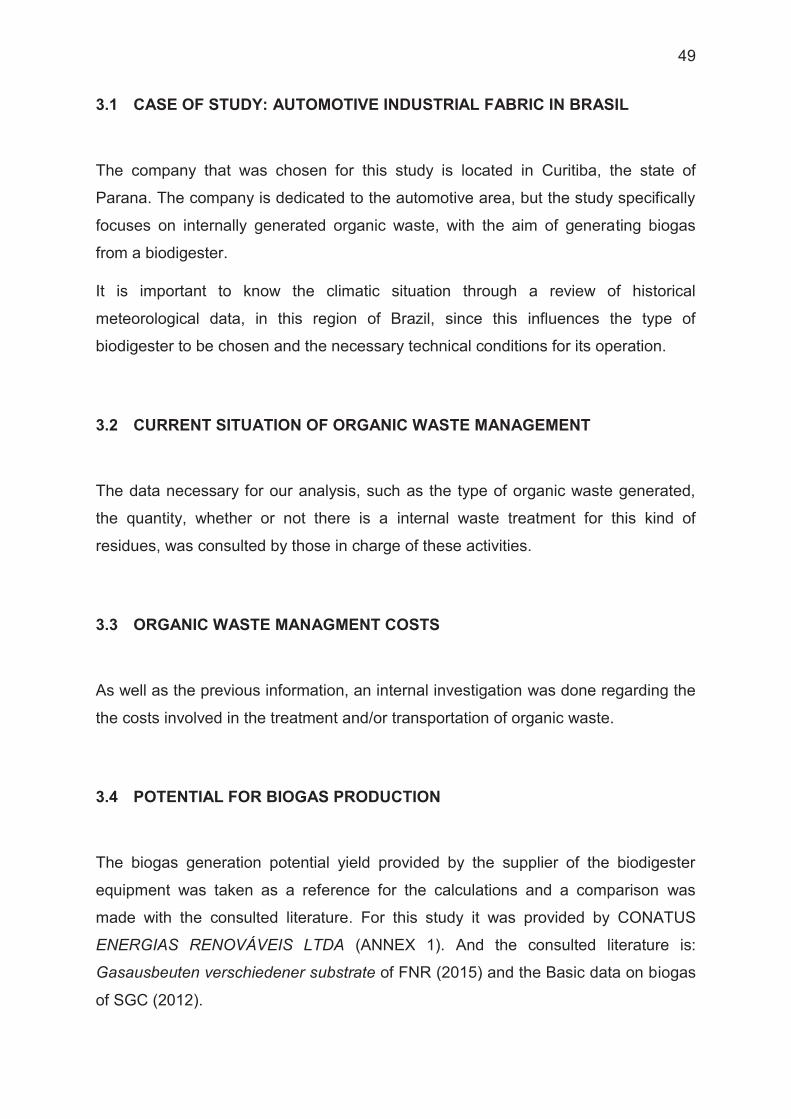
selective membranes (FIGURE 20), and chemical absorption (with the chemical
solvents generally used are either aqueous solution of amines or aqueous solution of
alkaline salts).
FIGURE 19 – BIOGAS UPGRADING TO BIOMETHANE BY PRESSURE SWING ADSORPTION
SOURCE: THE UNIVERSITY OF EDINBURGH (2020).
FIGURE 20 – MEMBRANE TECHNOLOGY FOR UPGRADING BIOGAS TO BIOMETHANE
SOURCE: AIR LIQUID (2020).

46
2.5 BIOGAS AND ENVIRONMENT
During the 21st Conference of the Parties (COP 21) of the United Nations
Framework Convention on Climate Change (UNFCCC) in Paris at the end of the
year 2015, more than 190 countries met to formalize a climate agreement to reduce
greenhouse gas emissions. Each nation, according to its possibilities, presented its
commitments to the emission reduction targets, known as Intended Nationally
Determined Contribution (INDC) (YABE et al., 2018).
Considering the size of the national territory, Brazil's contribution to global GHG
emissions is relatively small, but it is still the seventh largest emission on the planet
(SEEG, 2019). Based on the volume of greenhouse gas emissions of 2005, Brazil
committed to reduce them by 37% by the year 2025, and a reduction of 43% by the
year 2030 (USAID, 2019). In order to achieve this, specific measures were
presented, such as: increase the share of sustainable biofuels in the energy matrix to
18%, zero illegal deforestation in the Brazilian Amazon, restore 12 million ha of
forests, achieve 45% of renewable energies, especially solar, wind and biomass in
the energy matrix, and achieve 10% electricity efficiency gains. (YABE et al.; 2018;
USAID, 2019).
Biogas has an important role to play in this new sustainable energy matrix, for its
positive contribution to the environment and its energy potential. There is a drastic
reduction of carbon present in biomass due the digestion process, organic matter
loses carbon exclusively in the form of methane and carbon dioxide, which methane
can then be converted into energy, and with this reduce dependency on fossil fuels
(YABE et al., 2018).
The benefits to the environment of biogas are not only positive in terms of
greenhouse gas reduction, that may be considerable depending on the technology
used for their production. Biodigestion process is also an effective way to treat
effluents from different activities and industries, such as: agrobusiness, food, sludge
from water treatment plants, cattle, pig farming, etc. and at the same time prevents
soil, ground, or any surface water contamination, due to inadequate management of
effluents, that is not only harmful to humans, but for fauna and flora.

47
Since in the biodigestion process does not remove the nutrients that can be found in
the substrate, a by-product is generated, usually named digestate, a valuable soil
fertilizer rich in nitrogen, phosphorus, potassium and micronutrients, than can be use
used mainly in agriculture, gardening, for soil recovery, landscaping. (AL SEADI et
al., 2008). This also allows to substitute agrochemicals that can be harmful to the
ecosystem.
Biogas generation has several simultaneously benefits, making it an excellent
substitute for non-renewable energy, and an attractive option for solid waste
treatment.

48
3 METHODOLOGY
In order to assess whether the installation of a biodigester inside the factory is
technically and economically feasible, there are certain aspects that were taken into
account.
First was necessary to consider the climatic conditions, to be able to choose the right
type of biodigester and the necessary technology. Then, the current situation was
analyze regarding the management of solid waste in the company. This was carried
out with an internal investigation of all the required details, for example: type of
waste, quantity, treatment, transportation, final disposal, costs, etc.
With this, was possible to define which biodigester and technology is suitable for the
different types of substrates. The installation in case the project is viable, will be
carried out by third parties, so an investigation of suppliers was done.
After the type of biodigester was selected, the potential for biogas production was
calculated. This was done from the information of the type of substrate and the
amounts that will be treated in the biodigester. For this, the biogas yield was taken
from the supplier of the biodigester equipment. In order to confirm the given data, a
comparison was made with the available literature.
Once the biogas production potential was obtained, the electrical and thermal energy
generation potential was calculated. The way it was done will be explained in each
subchapter.
As part of the feasibility evaluation, biofertilizer/compost generation calculations were
made, gas reduction calculations were carried out and the pertinent legislation
regarding the project for the installation and use of biodigesters was reviewed.
At the end, after all the considerations and calculations made, an evaluation if the
project is viable mainly from the economic point of view was made.
49
3.1 CASE OF STUDY: AUTOMOTIVE INDUSTRIAL FABRIC IN BRASIL
The company that was chosen for this study is located in Curitiba, the state of
Parana. The company is dedicated to the automotive area, but the study specifically
focuses on internally generated organic waste, with the aim of generating biogas
from a biodigester.
It is important to know the climatic situation through a review of historical
meteorological data, in this region of Brazil, since this influences the type of
biodigester to be chosen and the necessary technical conditions for its operation.
3.2 CURRENT SITUATION OF ORGANIC WASTE MANAGEMENT
The data necessary for our analysis, such as the type of organic waste generated,
the quantity, whether or not there is a internal waste treatment for this kind of
residues, was consulted by those in charge of these activities.
3.3 ORGANIC WASTE MANAGMENT COSTS
As well as the previous information, an internal investigation was done regarding the
the costs involved in the treatment and/or transportation of organic waste.
3.4 POTENTIAL FOR BIOGAS PRODUCTION
The biogas generation potential yield provided by the supplier of the biodigester
equipment was taken as a reference for the calculations and a comparison was
made with the consulted literature. For this study it was provided by CONATUS
ENERGIAS RENOVÁVEIS LTDA (ANNEX 1). And the consulted literature is:
Gasausbeuten verschiedener substrate of FNR (2015) and the Basic data on biogas
of SGC (2012).

50
3.5 POWER GENERATION POTENTIAL
The method indicated by Blanco et al. (2017) estimates the power generation
potential in three possible cases scenarios. The following formula (3) will be used for
calculations (MIMIAGA, 2019):
(3)
Where:
ηt: Thermal efficiency of the electricity generation. Assuming values of 25, 33 and 40
% for the low, middle and high scenarios, respectively.
LHVCH4: 13.9 kWh/kg (MIMIAGA, 2019) density methane 0.716 kg/m3
(ENGINEERING TOOLBOX, 2003a). Converting in relation to volume: 9.95 kWh/m3.
VCH4: Volume of the methane in m³ out of the biogas production of each feedstock.
3.6 FERTILIZER/COMPOST PRODUCTION CALCULATION
From a mass balance, the part that is not converted into biogas, will remain as
biofertilizer/compost (digestate). Since the anaerobic digestion process is a closed
cycle it can be assumed that all the substrate that enters, comes out in the form of
biogas and digestate, as it is represented in the equation (4).
Msubstrate = Mbiogas + Mdigestate (4)
Following the same criteria as Berhorst (2018) in his study on swine waste, with a
simple difference in masses, it is possible to obtain the estimated amount of
digestate using the equation (5).
Mdigestate = Msubstrate – Mbiogas (5)

51
3.7 CALCULATION OF AVOIDED GHG EMISSIONS
The greenhouse gas that will be avoided by the generation and use of biogas is
methane. According to Brander (2012), the amount of CH4 that will no longer be
emitted into the atmosphere can be calculated as CO2 equivalent. The quantity
expressed in mass of CH4 should be multiplied by the global warming potential
(GWP). Therefore the following equation (6) was used:
CO2 eq = Mass of CH4 x GWP (6)
3.8 SAVINGS BY NATURAL GAS SUBSTITUTION WITH BIOGAS
In the case where part of the energy obtained by natural gas is replaced by biogas,
the savings were evaluated. From the amount of thermal energy generated by the
biogas, the amount of natural gas necessary for this must be discounted, multiplying
the cost by the amount.
3.9 ELECTRICAL ENERGY SAVINGS
If part of the electrical energy consumed inside the company would be replaced by
the electrical energy generated by the biogas, through a motor generator, the
savings must be evaluated. The amount of electrical energy generated by the
biogas, was multiplied by the cost of the electrical energy. This represents a possible
savings to the company.
3.10 VEHICLE FUEL SUBSTITUTION
Another possibility that should be studied is to replace part of the petroleum-based
fuels with biomethane. An internal investigation of the number of vehicles and their

52
route for internal use was carried out. After this investigation, the economic feasibility
study must be done.
3.11 PROJECT ECONOMIC FEASIBILITY ANALYSIS
To assess economic feasibility, it is necessary to know the necessary investment for
the installation of the biodigester, as well as all the necessary expenses for its
operation and maintenance, and compare it with the economic benefits given by the
generation of biogas. According to CIBiogas and Unido (2020), in order to carry out
this analysis, there must be taken into account some indicators such as:
Cash Flow
Cash flow is a control instrument provided to accompany the financial movement in a
certain period of time, where money inflows and outflows are considered for a more
efficient project feasibility analysis.
Taking into account the income and expenses, the cash flow was calculated with the
equation (7).
CF = Incomes – Expenses (7)
Present Value
Whit the mathematical-financial formula (8), the present value of a series of future
payments discounted at a stipulated cost of Minimum Attractiveness Rate can be
calculated.
(8)
Where:
53
PV: Present Value;
FV: Future cash value;
i: Discount rate chosen or Minimum Attractiveness Rate (MAR);
j: term in years of the period evaluated.
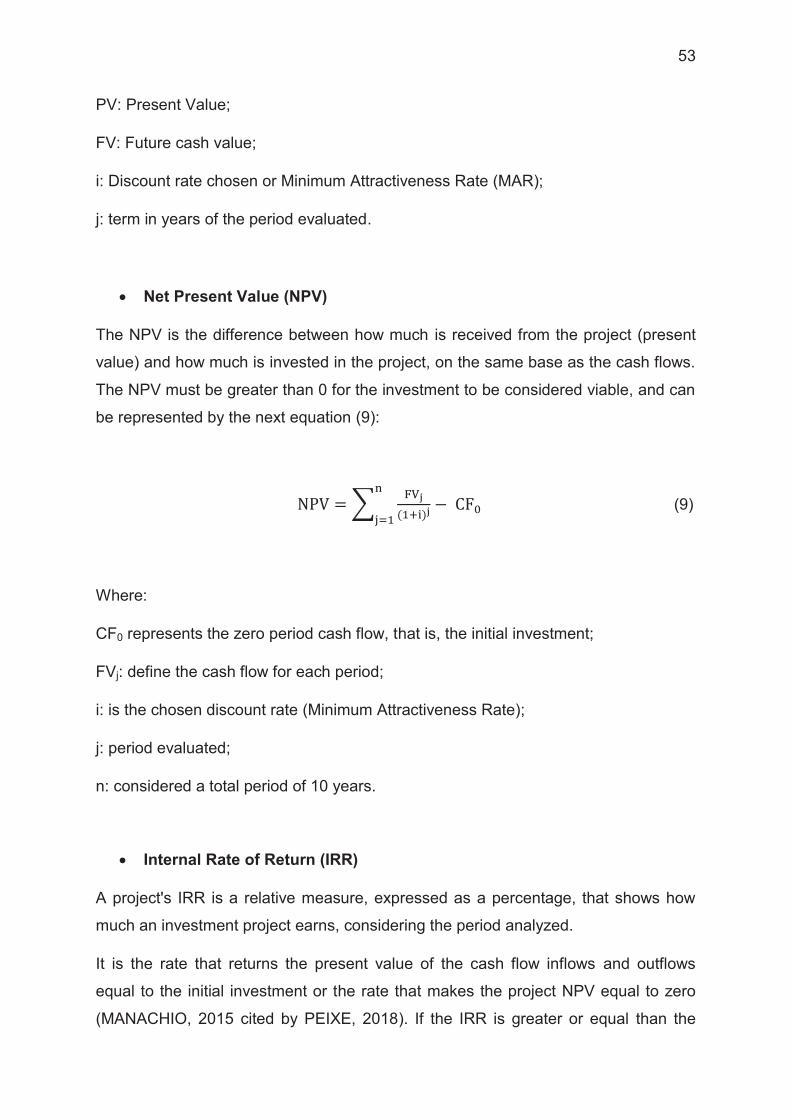
Net Present Value (NPV)
The NPV is the difference between how much is received from the project (present
value) and how much is invested in the project, on the same base as the cash flows.
The NPV must be greater than 0 for the investment to be considered viable, and can
be represented by the next equation (9):
(9)
Where:
CF0 represents the zero period cash flow, that is, the initial investment;
FVj: define the cash flow for each period;
i: is the chosen discount rate (Minimum Attractiveness Rate);
j: period evaluated;
n: considered a total period of 10 years.
Internal Rate of Return (IRR)
A project's IRR is a relative measure, expressed as a percentage, that shows how
much an investment project earns, considering the period analyzed.
It is the rate that returns the present value of the cash flow inflows and outflows
equal to the initial investment or the rate that makes the project NPV equal to zero
(MANACHIO, 2015 cited by PEIXE, 2018). If the IRR is greater or equal than the

54
cost of capital (adopted attractiveness rate), the project must be accepted
(SAMANEZ, 2007 cited by PEIXE, 2018; PASSOLONGO, 2011).
Payback
Basically payback, is the return time of the invested capital, that is, the time required
for the project to pay back to its investor, the initial investment. One of the
requirements of the company for the case of study is that the payback for projects
must be a maximum of two years, in order to be considered viable.
Shortage in the project
The start of the project does not coincide with the start of the operation. There is a
time after the capital is disbursed where the project is being built, and is not
generating cash inflows. This must be considered.
Capital Expenditure (CAPEX)
CAPEX, an expression used for capital expenditure or investment in capital goods, is
the term used to demonstrate the amount of money spent on the acquisition,
adequacy or improvement of capital goods in a given project. It refers to costs
incurred at the time of installation of the project, everything it needs to enter into
operation, including inputs and labor.
Operational Expenditure (OPEX)
OPEX is the capital used to maintain or improve physical assets. It refers to the
project's operation and maintenance costs, that is, all labor and inputs necessary for
operation throughout the project's useful life.

55
Income
It is the amount received for negotiating a product or service. It can even be the cost
avoided in a project, where the revenue will be a cost that will cease to occur after
the project is implemented.
Depreciation
Depreciation is the loss of value of an asset due to its use, natural wear or
obsolescence. According to Casarotto Filho & Kopittke cited by Junges et al. (2009),
the loss of the good's value represent a cost, which can be deducted from the
revenues, reducing the profit.
Life cycle
The project and the equipment that make up the CAPEX have an estimated useful
life that needs to be indicated, in order to determine the period for analyzing the
investment and to establish the need for reinvestment in equipment.
Profitability
The profit margin, also called profitability, is obtain by dividing the cash flow by the
total income for each period (BERHORST, 2018).
Most of the economic feasibility studies available for the construction of biodigesters
are focused on animal waste from farms or industrial and municipal effluents, but in
general, in the evaluated works were found that economic tools and feasibility
indicators mentioned above were used.
3.12 LEGISLATION
It must be investigated state and municipal laws, to ensure that there is no
restrictions for the installation or management of biodigesters.

56
4 RESULTS AND ANALYSIS
The city of Curitiba has a very variable weather throughout the year, whose average
temperatures fluctuate according to FIGURE 21.
FIGURE 21 – AVERAGE TEMPERATURE CURITIBA
SOURCE: WEATHER ATLAS (2020).
Due to these variations, it is necessary to have equipment to control the temperature
of the substrate, and keep it stable to the necessary conditions of the process.
4.1 CURRENT SITUATION OF ORGANIC WASTE MANAGEMENT
Regarding the current situation of solid waste management in the company selected
as a case of study, the organic waste is directed into different companies and
facilities, depending on the nature of the type of waste, meeting the zero landfill.
Generally, third parties are hired to collect and transport organic waste for final
disposal.
Regarding the type of organic waste that can be used in the biodigestion processes
and the amount generated, according to company records are shown in TABLE 6:
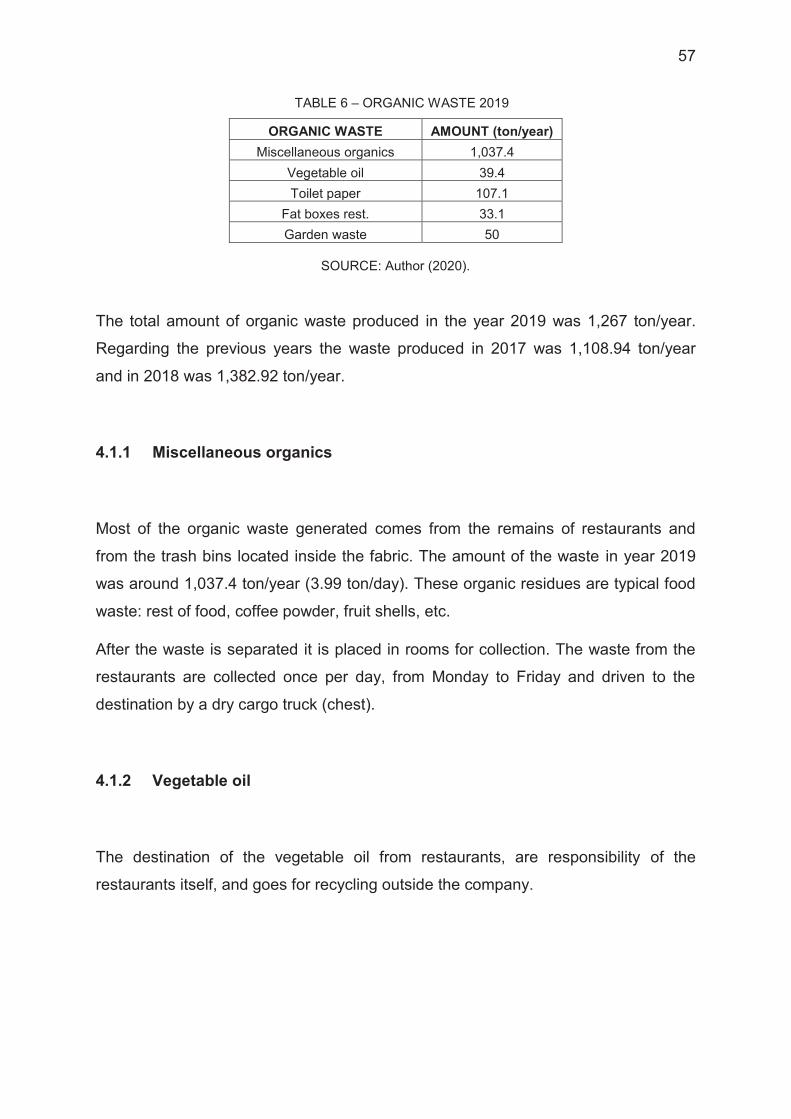
57
TABLE 6 – ORGANIC WASTE 2019
ORGANIC WASTE AMOUNT (ton/year) Miscellaneous organics 1,037.4
Vegetable oil 39.4 Toilet paper 107.1
Fat boxes rest. 33.1 Garden waste 50
SOURCE: Author (2020).
The total amount of organic waste produced in the year 2019 was 1,267 ton/year.
Regarding the previous years the waste produced in 2017 was 1,108.94 ton/year
and in 2018 was 1,382.92 ton/year.
4.1.1 Miscellaneous organics
Most of the organic waste generated comes from the remains of restaurants and
from the trash bins located inside the fabric. The amount of the waste in year 2019
was around 1,037.4 ton/year (3.99 ton/day). These organic residues are typical food
waste: rest of food, coffee powder, fruit shells, etc.
After the waste is separated it is placed in rooms for collection. The waste from the
restaurants are collected once per day, from Monday to Friday and driven to the
destination by a dry cargo truck (chest).
4.1.2 Vegetable oil
The destination of the vegetable oil from restaurants, are responsibility of the
restaurants itself, and goes for recycling outside the company.

58
4.1.3 Toilet paper
The hygienic paper is collected internally in different areas of the fabric, but mostly
from toilets. The problem with this type of substrate to be used in the biodigester, is
that it would need an additional subsequent step to sanitize the digestate before it
can be used as a biofertilizer. This would cause an increase in cost, so it was not
considered in this study.
4.1.4 Fat boxes from restaurants
A company collects the fat residue of the fat boxes from restaurants four times a
year, and then takes it to a plant for co-processing.
4.1.5 Garden waste
The garden waste after being cut, is used at the moment as natural fertilizer.

59
4.2 ORGANIC WASTE CURRENT MANAGMENT COSTS
The FIGURE 22 shows the actual process that the company has regarding the
organic waste produced internally. All of the organic waste is transported and treated
by third parties, where the company pays for its transportation, with the exception of
garden waste that is used internally.
FIGURE 22 – ACTUAL ORGANIC WASTE PROCESS DIAGRAM
SOURCE: Author (2020).
The cost of the transportation for all the organic waste are presented in the TABLE 7:

60
TABLE 7 – ORGANIC WASTE MANAGMENT COSTS 2019
TYPE OF WASTE COSTS AMOUNT
(ton/year) ANUAL TOTAL
COST Miscellaneous
organics R$ 3,800 per month 1,037.4 R$ 45,600
Vegetable oil - 39.4 - Toilet paper R$390/ton 107.1 R$ 41,769
Fat boxes rest. R$ 54/ton + R$1050 truck (4 times per year) 33.1 R$ 5,987.40
Garden waste - 50 -
TOTAL 1,267 R$ 93,356.40
SOURCE: Author (2020).
The garden waste, does not represent any cost for the company, although the
services of caring of the green areas do, the waste is used internally and it is not
redirected by third parties.
4.3 CHARACTERIZATION OF THE BIODIGESTER
Based on the climate and temperature variations of the region, the amount and type
of organic waste to be treated, the type of biodigester that best suits the needs is the
CSTR model.
The CSTR model was chosen for its versatility in treating different types of
substrates and with a higher percentage of solids. In addition it has an agitation
system which optimizes the process, as well as a temperature controller, necessary
for the variation of the ambient temperature, which helps to guarantee an optimal
and stable generation of biogas.
After a search for suppliers, it was found a company that offers construction services
for biodigester facilities and equipment. The name of the company is CONATUS
Energias Renováveis LTDA located in Foz do Iguaçu-PR. The company provided a
general quote for the implementation of the biodigester (biomass and biogas
treatment equipment), and annual operating costs. The document with the
information can be seen in ANNEX 1.
The FIGURE 23 is a representation of a CSTR partially buried biodigester, and some
of the equipment provided by CONATUS.

61
FIGURE 23 – CSTR BIODIGESTER PARTIALLY BURIED
SOURCE: CONATUS ENERGIAS RENOVÁVEIS (2020).
The FIGURE 24 shows the process proposal for the organic waste produced
internally with the installation of a biodigester, where the organic waste produces
biogas (subsequently upgraded to biomethane) and fertilizer to be used internally
with the aim of generating savings for the company.
FIGURE 24 – ORGANIC WASTE PROCESS PROPOSAL DIAGRAM
SOURCE: Author (2020).
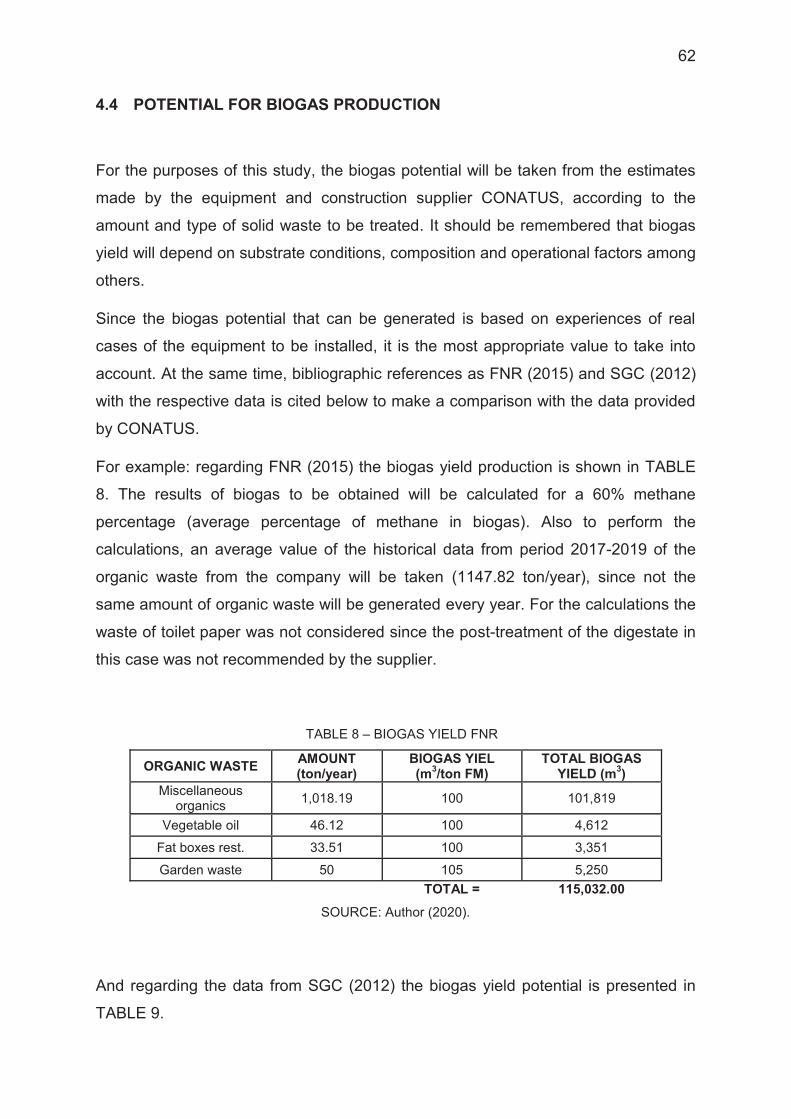
62
4.4 POTENTIAL FOR BIOGAS PRODUCTION
For the purposes of this study, the biogas potential will be taken from the estimates
made by the equipment and construction supplier CONATUS, according to the
amount and type of solid waste to be treated. It should be remembered that biogas
yield will depend on substrate conditions, composition and operational factors among
others.
Since the biogas potential that can be generated is based on experiences of real
cases of the equipment to be installed, it is the most appropriate value to take into
account. At the same time, bibliographic references as FNR (2015) and SGC (2012)
with the respective data is cited below to make a comparison with the data provided
by CONATUS.
For example: regarding FNR (2015) the biogas yield production is shown in TABLE
8. The results of biogas to be obtained will be calculated for a 60% methane
percentage (average percentage of methane in biogas). Also to perform the
calculations, an average value of the historical data from period 2017-2019 of the
organic waste from the company will be taken (1147.82 ton/year), since not the
same amount of organic waste will be generated every year. For the calculations the
waste of toilet paper was not considered since the post-treatment of the digestate in
this case was not recommended by the supplier.
TABLE 8 – BIOGAS YIELD FNR
ORGANIC WASTE AMOUNT (ton/year)
BIOGAS YIEL (m3/ton FM)
TOTAL BIOGAS YIELD (m3)
Miscellaneous organics 1,018.19 100 101,819
Vegetable oil 46.12 100 4,612
Fat boxes rest. 33.51 100 3,351
Garden waste 50 105 5,250 TOTAL = 115,032.00
SOURCE: Author (2020).
And regarding the data from SGC (2012) the biogas yield potential is presented in
TABLE 9.

63
TABLE 9 – BIOGAS YIELD SGC
ORGANIC WASTE AMOUNT (ton/year)
BIOGAS YIEL (m3/ton FM)
TOTAL BIOGAS YIELD (m3)
Miscellaneous organics 1,018.19 204 207,710.76
Vegetable oil 46.12 204 9,408.48
Fat boxes rest. 33.51 204 6,836.04
Garden waste 50 175 8,750 TOTAL = 232,705.28
SOURCE: Author (2020).
For the fat boxes from restaurants and vegetable oil an estimate was used, since it
does not appear specifically detailed in the cited references. The estimate is taken
according to different studies where co-digestion is used. The studies cited in the
case of vegetable oil, and fat boxes from restaurants were: Li et al. (2011) and
Marchetti et al. (2020). According to this studies, the use of those substrates in co-
digestion promotes the production of biogas.
For the data from TABLE 9, the biogas yield potential was performed by laboratory
tests, in which all the parameters are controlled in a more efficient way, therefore the
biogas yield is higher in this case.
As can be seen, the difference in the potential for biogas generation may vary
between one author and another, this is an issue since the potential of biogas
calculations are very critical to determine if the project will be economically viable or
not, so choosing an indicated value for the study is very important. Due to this, the
best alternative is to use the data provided by the company in charge of building the
biodigester and the installation of the equipment, since they are realistic data
observed in other similar projects.
Comparing other studies of economic feasibility for biodigester installation for organic
waste, mainly food waste, Arati (2009) in his study in an open air market in Kenya,
chose a biogas rate generation of 48 m3 per ton of waste for a Indian type
biodigester; Nascimento et al. (2017) in their study in the hospital sector, also for an
Indian type biodigester, use 40.11 m3 per ton of waste; and Naami (2017) in
Indonesia, for a dry digester type chose a biogas yield rate of 109.94 m3 per ton.
In general, according to CONATUS the biogas potential yield for 1,147.82 ton/year of
organic waste is 139,377.81 m3/year (121.43 m3/ton). Also, for the following

64
calculations, a methane percentage of 60% will be assumed, which corresponds to
an average value of the methane content in biogas.
4.5 POWER GENERATION POTENTIAL
The results are shown in TABLE 10. The formula (3) was used for calculations:
TABLE 10 – POWER GENERATION POTENTIAL
THERMAL EFFICIENCY OF ELECTRICITY
GENERATION (ηt) %
LHVCH4 (kWh/m3) VCH4 (m3)
POWER POTENTIAL
(kWh)
25 9.95 83,626.69 208,021.39 33 9.95 83,626.69 274,588.24 40 9.95 83,626.69 332,834.23
SOURCE: Author (2020).
4.6 FERTILIZER/COMPOST PRODUCTION CALCULATION
Usign equation (5), the part that is not converted into biogas will remain as
biofertilizer/compost (digestate). Therefore, data from subsection 4.4 will be used.
Mdigestate = Msubstrate – (ρbiogas x Vbiogas)
The substrate will be considered with a solid content of 33% for sorted food waste
(SGC, 2012). The CSTR biodigester works with a substrate of solid content of 15%,
so it will have to be diluted with water. Assuming that the initial substrate and the
substrate after dilution maintain the same density, the calculations using equation
(10), for a year would be:
C1V1 = C2V2 (10)
65
C1m1 = C2m2
0.33 x 1,147.83 ton = 0.15 x m2
m2 = 2,525.23 ton
Using the equation (11), with a difference of the masses of substrate, it is possible to
know the quantity of water needed.
mwater = m2 –m1 (11)
mwater = 2,525.23 – 1,147.83
mwater = 1,377.4 ton
The substrate will have to be diluted with 1,377.4 tons of water or 1,377.4 m3 per
year. The density of the biogas according to Brasil (2015) is 1.21 kg/m3. The total
digestate mass generated will be:
Mdigestate = 2,525.23 ton/year – (1.21 kg/m3x 139,377.81 m3)
Mdigestate = (2,525.23 – 168.65) ton/year
Mdigestate = 2,356.58 ton/year
The digestate produced can be used for the green areas inside the company of the
case of study, whose total area is 135.4 hectares.

66
4.7 CALCULATION OF AVOIDED GHG EMISSIONS
To calculate the avoided GHG emissions it is possible to use the equation (6).
According to the IPCC (2014), in the Fifth Assessment Report (AR5), CH4 has an
GWP of cumulative forcing over 100 years about 28 times greater than CO2.
CO2 eq = Mass of CH4 x 28
For our calculations, a methane content of 60% in the biogas produced will be taken.
The density of methane according to Engineering Toolbox (2003a) is 0.716 kg/m3.
Therefore the amount of avoided GHG would be:
CO2 eq = (83,626.69 m3/year x 0.716 kg/m3) x 28
CO2 eq = 1,676,547.88 kg/year
CO2 eq = 1,676.55 ton/year
According to the World Bank Group (2020), on 23th of December, 2019, the
Brazilian Ministry of Economy announced advances in discussions about carbon
pricing in Brazil. This advances include. participation of representatives from
government, the private sector and international organizations, with the aim of
pledged to accelerate studies on the creation of a carbon pricing system based on
national greenhouse gas emissions trading.
Since until now there is no a carbon pricing system established in Brazil, it will not be
a determining factor for the viability of this project, but it should be taken into account
in a hypothetical case that the carbon market exists.
The High-Level Commission on Carbon Prices estimated that carbon prices of at
least US$ 40–80/ton of CO2eq by 2020 and US$ 50–100/ton of CO2eq by 2030 are
required to cost-effectively reduce emissions in line with the temperature goals of the
Paris Agreement. As of today, less than 5 percent of GHG emissions currently
67
covered by a carbon price are within this range with about half of covered emissions
priced at less than US$ 10/ton of CO2eq. The International Monetary Found
calculates the global average carbon price in only US$ 2/ton of CO2eq (WORLD
BANK GROUP, 2020).
In order for the companies can receive benefits from trading carbon credits from a
project, first it must be registered as a Clean Development Mechanism (CDM) to the
executive council of each country (CDM WATCH, 2010). This registration requires
several steps and entails expenses that must be considered, from the beginning to
the end of the project.
For this study, if it is considered the average carbon price of US $2/ton of CO2eq, the
annual revenue of the project for the trading of carbon credits would be US$
3,353.10 annually. This amount is not enough to help make the project economically
feasible. According to Neto (2009), just for the post registration are estimated costs
between US$ 15,000.00 and US$ 45,000.00 per year, so it was not taken into
account for this study.
4.8 INCOME BY NATURAL GAS SUBSTITUTION WITH BIOGAS
According to internal company data, the total consumption of natural gas in 2019
was 2,940,960 m³ at the price of R$ 6.75/m³.
These data are recorded for the internal gas conditions on the network with a
Temperature and Pressure of:
P = 2.6 atm
T = 22°C
The biogas conditions when generated will be considered as a normal ambient
conditions:
P = 1 atm
T = 20°C

68
First the thermal energy will be calculated for the biogas generated, in order to be
able to relate biogas with natural gas (TABLE 11).
TABLE 11 – THERMAL ENERGY OF BIOGAS
BIOGAS GENERATION (m3/year)
LOW CALORIFIC VALUE (kWh/m3)
THERMAL ENERGY (kWh/year)
139,377.81 6* 836,266.86 NOTE: * Methane content in biogas (60%).
SOURCE: Author (2020).
According to the company's natural gas distributor COMPAGAS (2020), the low
calorific value for natural gas is 10.1 kWh/m3 . The amount of natural gas equivalent
to produce the amount of thermal energy would be (TABLE 12):
TABLE 12 – NATURAL GAS VOLUME
THERMAL ENERGY (kWh/year)
NATURAL GAS (m3/year)
836,266.86 82,798.70
SOURCE: Author (2020).
The amount of natural gas equivalent in this case is considered to have the normal
ambient conditions. To calculate the savings, it is necessary to convert to the internal
network conditions (TABLE 13), by the equation of ideal gases to simplify our
calculations (the compressibility factor in this case is Z = 1). So it is possible to use
the equation (12):
(12)
Where:
P1 = 1 atm
V1 = Volume of natural gas at normal ambient conditions
T1 = 20°C (293.15 K)
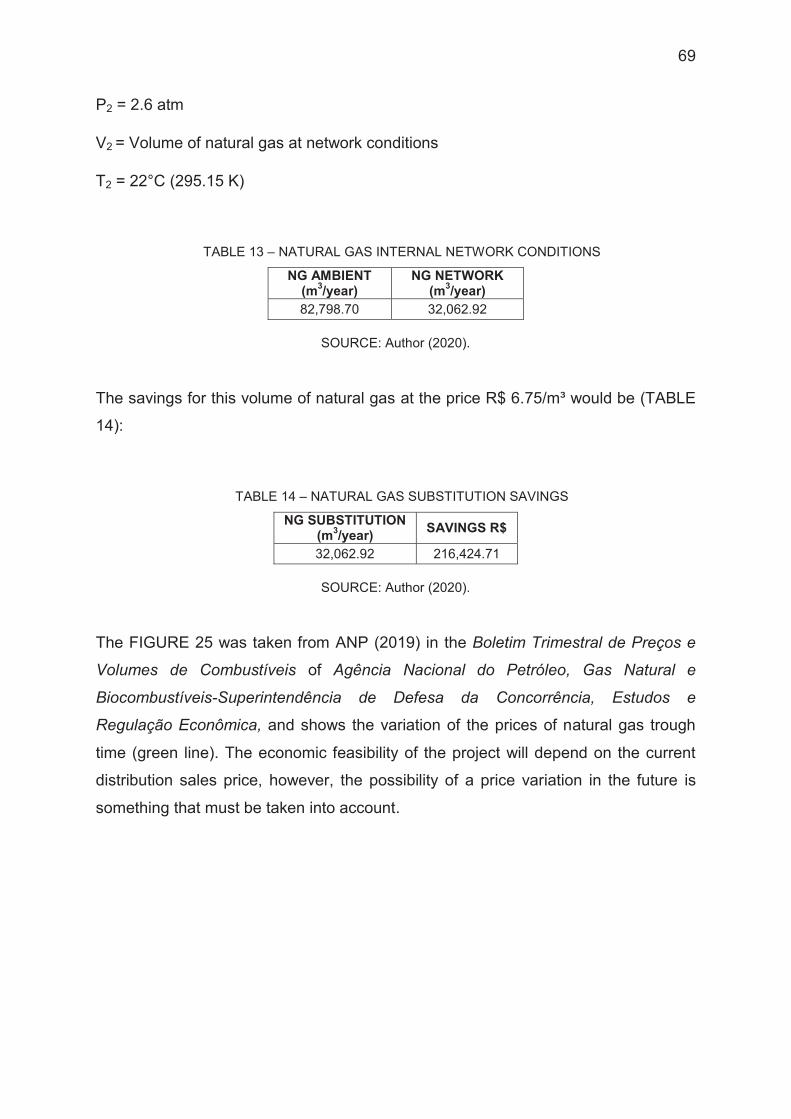
69
P2 = 2.6 atm
V2 = Volume of natural gas at network conditions
T2 = 22°C (295.15 K)
TABLE 13 – NATURAL GAS INTERNAL NETWORK CONDITIONS
NG AMBIENT (m3/year)
NG NETWORK (m3/year)
82,798.70 32,062.92
SOURCE: Author (2020).
The savings for this volume of natural gas at the price R$ 6.75/m³ would be (TABLE
14):
TABLE 14 – NATURAL GAS SUBSTITUTION SAVINGS
NG SUBSTITUTION (m3/year) SAVINGS R$
32,062.92 216,424.71
SOURCE: Author (2020).
The FIGURE 25 was taken from ANP (2019) in the Boletim Trimestral de Preços e
Volumes de Combustíveis of Agência Nacional do Petróleo, Gas Natural e
Biocombustíveis-Superintendência de Defesa da Concorrência, Estudos e
Regulação Econômica, and shows the variation of the prices of natural gas trough
time (green line). The economic feasibility of the project will depend on the current
distribution sales price, however, the possibility of a price variation in the future is
something that must be taken into account.

70
FIGURE 25 – COMPARISON OF THE PRICE OF US PROPANE WITH NATURAL GAS AND OIL
SOURCE: ANP (2019).
4.9 ELECTRICAL ENERGY SAVINGS
According to internal company data, the total energy consumption in 2019 was
153,261 MWh, and the price paid by the company for energy consumption is R$
260/MWh. In TABLE 15 is presented the results of the calculations for each case.
TABLE 15 – ENERGY SAVINGS BY ELECRICITY GENERATION
THERMAL EFFICIENCY
OF ELECTRICITY GENERATION
(ηt) %
LHVCH4 (kWh/m3)
VCH4 (m3/year)
POWER POTENTIAL (kWh/year)
POWER POTENTIAL (MWh/year)
ENERGY CONSUMPTION
SAVINGS R$/year
25 9.95 83,626.69 208,021.39 208.02 54,085.2
33 9.95 83,626.69 274,588.24 274.59 71,393.4
40 9.95 83,626.69 332,834.23 332.83 86,535.8
SOURCE: Author (2020).

71
4.10 VEHICLE FUEL SUBSTITUTION
In the TABLE 16, is presented the equivalence between the biogas, gasoline and
diesel in terms of power potential, and the savings that this would represent to the
company if it is replaced by biogas.
TABLE 16 – EQUIVALENCE BIOGAS, GASOLINE, DIESEL AND SAVINGS
TYPE OF FUEL
ENERGY CONTENT
(kWh) QUANTITY
POWER POTENTIAL
(kWh) PRICE (R$/L)
SAVINGS (R$/year)
1 m3 BIOGAS 6 139,377.81 m3 836,266.86 - -
1 LITRE GASOLINE (PETROL)
9.06 92,303.19 L 836,266.86 3.65 336,906.64
1 LITRE DIESEL 9.8 85,333.35 L 836,266.86 2.86 244,053.38
SOURCE: Adapted from SGC (2012).
According internal data of the company the consumption of Gasoline (petrol) in the
year 2019 was 2,840,000 liters and for Diesel was 485,000 liters. This data
corresponds to internal consumption for new vehicles that go to dealers, for engine
tests and for vehicles used internally for the transport of collaborators.
The project will be focus for vehicles used internally for the collaborators. To be able
to use biomethane in the vehicles first they must be modified in order to run with the
upgraded biogas. The cost of the system varies depending on type and size of
motor. According to Icarros (2018); PortoRio (2019) and Oliveira (2018) the cost for
the kit is around R$ 3000.00 –R$ 6000.00 per car. According to Takar (2018) for
diesel engines, cost can reach up to 25% of the total cost of the vehicle, but for our
calculations we will use the average value mentioned above, both for gasoline and
diesel based vehicles.
The exact number of cars used by employees is not available, only the number of
cars VAN type transport. The total number of VAN cars are eight, three of them have
a continuous use in the schedule from 8:00 to 17:00 hours, and the remaining five,
for transport personnel at the time of entry and exit.

72
An estimate of the route of each vehicle is approximately 100 km per day, using 260
working days of use, annually 26,000 km are traveled per vehicle. The VAN cars use
diesel as a fuel, according to Oliveira (2020) the average consumption is
approximately 10 km/L. Annually the amount of diesel consumption by the 8 VANs
for internal transportation is 20,800 L. To be able to consume all the biogas in diesel
cars it is necessary to modified around 33 vehicles, and for gasoline-based cars
around 36.
In FIGURE 26 is shown the average in prices per liter of common gasoline, diesel
and ethanol in Brazil for the period 2004-2017.
FIGURE 26 – AVERAGE PRICES PER LITER OF COMMON GASOLINE, DIESEL AND ETHANOL FOR PERIOD 2004-2017
SOURCE: SOARES (2017).
As can be seen the increase of price in the period 2004-2017 was double for the
aforementioned fuels, this should be considered when making a decision to accept
or reject the project. One of the advantages of producing part of the fuel internally is
that is not influenced by the variation of external increases in fuel costs.

73
4.11 ECONOMIC FEASIBILITY ANALYSIS
The use of biogas that generates more benefits as it was shown in the previous
section and in FIGURE 27, is to use it as a substitute for gasoline or diesel. The
drawback in this case is that until now, the complete data on the routes and the
number of cars that can be modified in order to use biomethane have not been
obtained. So an estimate will be made to have an idea if it can be viable or not.
FIGURE 27 – REVENUES FROM THE USE OF BIOGAS
SOURCE: Author (2020).
The other use of biogas that generates more income besides from fuel, is to
substitute part of natural gas. In this case, all the necessary data are available, so its
economic feasibility will also be evaluated.
Internally, the company has a policy of accepting projects with a return time of no
more than 2 years, but the study will be carried out up for a period of 10 years, in
order to have more information on the economic viability of the project.
In addition to the scenarios mentioned, in the case the project is not viable within the
first two years, the data of the quantity of substrate will be obtained for this purpose.
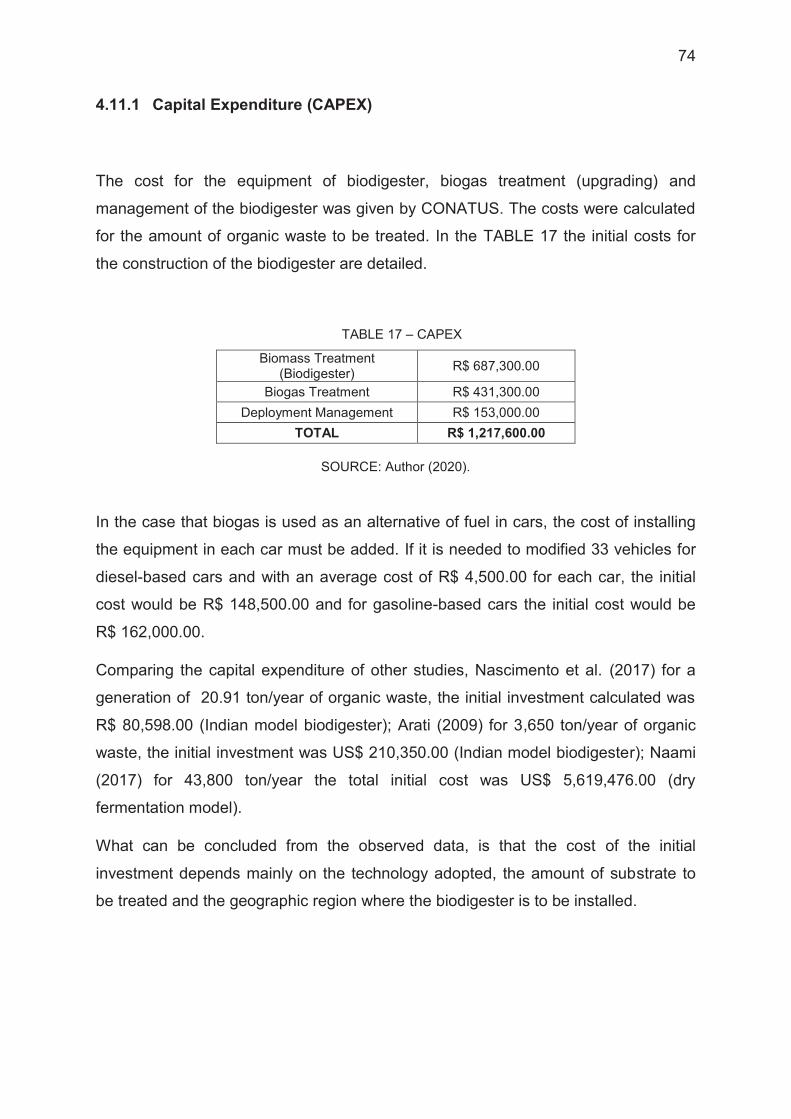
74
4.11.1 Capital Expenditure (CAPEX)
The cost for the equipment of biodigester, biogas treatment (upgrading) and
management of the biodigester was given by CONATUS. The costs were calculated
for the amount of organic waste to be treated. In the TABLE 17 the initial costs for
the construction of the biodigester are detailed.
TABLE 17 – CAPEX
Biomass Treatment (Biodigester) R$ 687,300.00
Biogas Treatment R$ 431,300.00 Deployment Management R$ 153,000.00
TOTAL R$ 1,217,600.00
SOURCE: Author (2020).
In the case that biogas is used as an alternative of fuel in cars, the cost of installing
the equipment in each car must be added. If it is needed to modified 33 vehicles for
diesel-based cars and with an average cost of R$ 4,500.00 for each car, the initial
cost would be R$ 148,500.00 and for gasoline-based cars the initial cost would be
R$ 162,000.00.
Comparing the capital expenditure of other studies, Nascimento et al. (2017) for a
generation of 20.91 ton/year of organic waste, the initial investment calculated was
R$ 80,598.00 (Indian model biodigester); Arati (2009) for 3,650 ton/year of organic
waste, the initial investment was US$ 210,350.00 (Indian model biodigester); Naami
(2017) for 43,800 ton/year the total initial cost was US$ 5,619,476.00 (dry
fermentation model).
What can be concluded from the observed data, is that the cost of the initial
investment depends mainly on the technology adopted, the amount of substrate to
be treated and the geographic region where the biodigester is to be installed.

75
4.11.2 Operational Expenditure (OPEX)
An estimate of the operating cost for the biodigester according to CONATUS
ENERGIAS RENOVAVEIS (2020) are R$ 148,723.00 per year. Within the
operational expenditure includes maintenance, labor and energy costs necessary for
operation.
In addition it must to be considered the necessary cost for reducing the percentage
of solids in the substrate. As detailed in section 4.6, the substrate must be diluted
with water to obtain the amount of solids suitable for the biodigester.
The water provider is the Sanitation Company of the State of Paraná (SANEPAR),
and the actual cost per cubic meter is R$ 8.76. The total amount of water need to
dilute the substrate is 1,377.4 m3, so the total cost per year will be R$ 12,066.02.
4.11.3 Incomes
The different incomes of the projects could be:
- Costs avoided by payments to third parties for the treatment of organic waste
(Miscellaneous organics, Fat boxes from restaurants).
- Costs avoided due to the reduction in natural gas consumption (TABLE 18).
TABLE 18 – INCOMES PER YEAR BIOGAS - NATURAL GAS
Miscellaneous organics R$ 45,600.00 Fat boxes rest. R$ 5,987.40
Biogas – Natural Gas R$ 216,424.71 Total R$ 268,012.11
SOURCE: Author (2020).
- Or costs avoided due to the reduction of automobile fuel (Gasoline TABLE 19 and
diesel TABLE 20).

76
TABLE 19 – INCOMES PER YEAR BIOGAS - GASOLINE
Miscellaneous organics R$ 45,600.00 Fat boxes rest. R$ 5,987.40
Biogas - Gasoline R$ 336,906.64 Total R$ 388,494.04
SOURCE: Author (2020).
TABLE 20 – INCOMES PER YEAR BIOGAS - DIESEL
Miscellaneous organics R$ 45,600.00 Fat boxes rest. R$ 5,987.40 Biogas - Diesel R$ 244,053.38
Total R$ 295,640.78
SOURCE: Author (2020).
4.11.4 Depreciation
According to CONATUS, the full depreciation of the biodigester occurs in 20 years,
and for the biogas treatment equipment in 10 years, therefore using the equation
(13) was calculated the annually costs represented in TABLE 21.
(13)
TABLE 21 – EQUIPMENT DEPRECIATION PER YEAR
Biomass treatment (Biodigester) R$ 34,365.00
Biogas treatment equipment R$ 43,130.00 TOTAL R$ 77,495.00
SOURCE: Author (2020).
Regarding the equipment needed to use biomethane in cars, the vehicular natural
gas kit (VNG), according to Revista o mecânico (2019) the life cycle of the kit is 15
years. Therefore a depreciation value of R$ 9,900.00 (33 vehicles) for diesel and R$
10,800.00 (36 vehicles) for gasoline-based cars per year must be added in this case.

77
4.11.5 Expenses
The expenses for the different projects are presented in TABLE 22, TABLE 23 and
TABLE 24.
TABLE 22 – NATURAL GAS SUBSTITUTION EXPENSES PER YEAR
Depreciation biodigester R$ 34,365.00 Depreciation biogas treatment equipment R$ 43,130.00
OPEX R$ 148,723.00 Water for dilution of substrate R$ 12,066.22
TOTAL R$ 238,284.22
SOURCE: Author (2020).
TABLE 23 – GASOLINE SUBSTITUTION EXPENSES PER YEAR
Depreciation biodigester R$ 34,365.00 Depreciation biogas treatment equipment R$ 43,130.00
Depreciation VNG kit R$ 10,800.00 OPEX R$ 148,723.00
Water for dilution of substrate R$ 12,066.22 TOTAL R$ 249,084.22
SOURCE: Author (2020).
TABLE 24 – DIESEL SUBSTITUTION EXPENSES PER YEAR
Depreciation biodigester R$ 34,365.00 Depreciation biogas treatment equipment R$ 43,130.00
Depreciation VNG kit R$ 9,900.00 OPEX R$ 148,723.00
Water for dilution of substrate R$ 12,066.22 TOTAL R$ 248,184.22
SOURCE: Author (2020).
4.11.6 Economic Evaluation
Comparing some economic feasibility studies in Brazil, carried out by other authors,
differ from each other in values and in the way the minimum attractiveness rate its

78
selected. For example the study carried out by Silva and Cirani (2016), the MAR rate
selected was 10.90% (SELIC rate of September of 2014). According to Peixe (2018)
the equivalent of the basic interest rate currently used as a reference in Brazil at that
time was 7%. Berhorst (2018), chose the value of 10.8% of the MAR, the average of
the Basic Interest Rate in Brazil (SELIC) in the last ten years. Passolongo (2011),
the interest rate considered was 12%, in line with the Brazilian economic scenario at
that time. Speck (2019) use the SELIC rate of 6% according to the Central Bank at
the moment of the analysis
For this study it will be used 3.2% as the minimum attractiveness rate, the average
interest Sistema Especial de Liquidação e de Custódia (SELIC) for January-
September of the year 2020 (BRASIL, 2020). The data can be seen in ANNEX 2.
To calculate the IRR, the NPV formula is used. The NPV equals zero and resolves it
to find the “i” rate. In this work, like the study made by Berhorst (2018) the
calculations in order to find IRR were made with the Microsoft Office Excel tool
(EXCEL).
For the economic evaluation, calculations for 12 different scenarios were made.
Three scenarios one for Biogas-Natural Gas, Biogas-Gasoline and Biogas-Diesel,
with the average substrate produced in the company. The other nine scenarios were
made with the purpose of finding the conditions for each of the projects to be
economically viable in 2, 5 and 10 years, using the goal seek tool of Microsoft Excel.
This tool was used to have a NPV equal to 0 in the corresponding year, changing the
income for each case. With the income value in R$, it was converted then to know
how much substrate is necessary. As an estimate, the expenses were considered
the same in every case and the avoided waste management costs was not taken
into account to facilitate calculations and to have a less adjusted data.
The type of financing for this kind of projects in the company, is made as an internal
financing, so the CAPEX will be made in the year 0. The evaluation were performed
in a 10 year period, according to Berhorst (2018), projects with a payback more than
10 years are not attractive for investment.
Although the Internal Rate of Return and Profitability were calculated, for this study,
the most relevant economic indicator to accept or reject the project is the payback.
The company has a maximum payback to accept projects of two years.

79
4.11.6.1 Biogas-Natural Gas
The initial investment of the project is R$ 1,217,600.00. The incomes will start in year
1, generating the amount of R$ 268,012.11 in incomes and R$ 238,284.22 of
expenses per year (TABLE 25).
TABLE 25 – CASH FLOW, PRESENT VALUE AND NET PRESENT VALUE FOR BIOGAS-NATURAL GAS
PERIOD (year) CF PV NPV 0 -R$ 1,217,600.00 -R$ 1,217,600.00 -R$ 1,217,600.00 1 R$ 29,727.89 R$ 28,806.09 -R$ 1,188,793.91 2 R$ 29,727.89 R$ 27,912.88 -R$ 1,160,881.02 3 R$ 29,727.89 R$ 27,047.37 -R$ 1,133,833.66 4 R$ 29,727.89 R$ 26,208.69 -R$ 1,107,624.97 5 R$ 29,727.89 R$ 25,396.02 -R$ 1,082,228.95 6 R$ 29,727.89 R$ 24,608.54 -R$ 1,057,620.41 7 R$ 29,727.89 R$ 23,845.49 -R$ 1,033,774.92 8 R$ 29,727.89 R$ 23,106.09 -R$ 1,010,668.83 9 R$ 29,727.89 R$ 22,389.62 -R$ 988,279.20 10 R$ 29,727.89 R$ 21,695.37 -R$ 966,583.83
SOURCE: Author (2020).
As can be seen in TABLE 25, in all the 10 year period the NPV values are negative.
The payback and internal rate of return cannot be calculated. Therefore the project is
not feasible. The profitability in this case is 11.09%. Although the profitability is
positive since the incomes are greater than the expenses, it is not enough to decide
if the project is viable or not.
2 Years
For the project to be viable in a period of 2 years, keeping the same initial investment
and annual expenses, it is necessary a substrate quantity of 4,634.8 ton/year to
generate 562,804.19 m3/year of biogas. The IRR in this case would be 51.59% and
profitability 72.81%. The cash flow, present value and net present value for each
period are presented in TABLE 26.
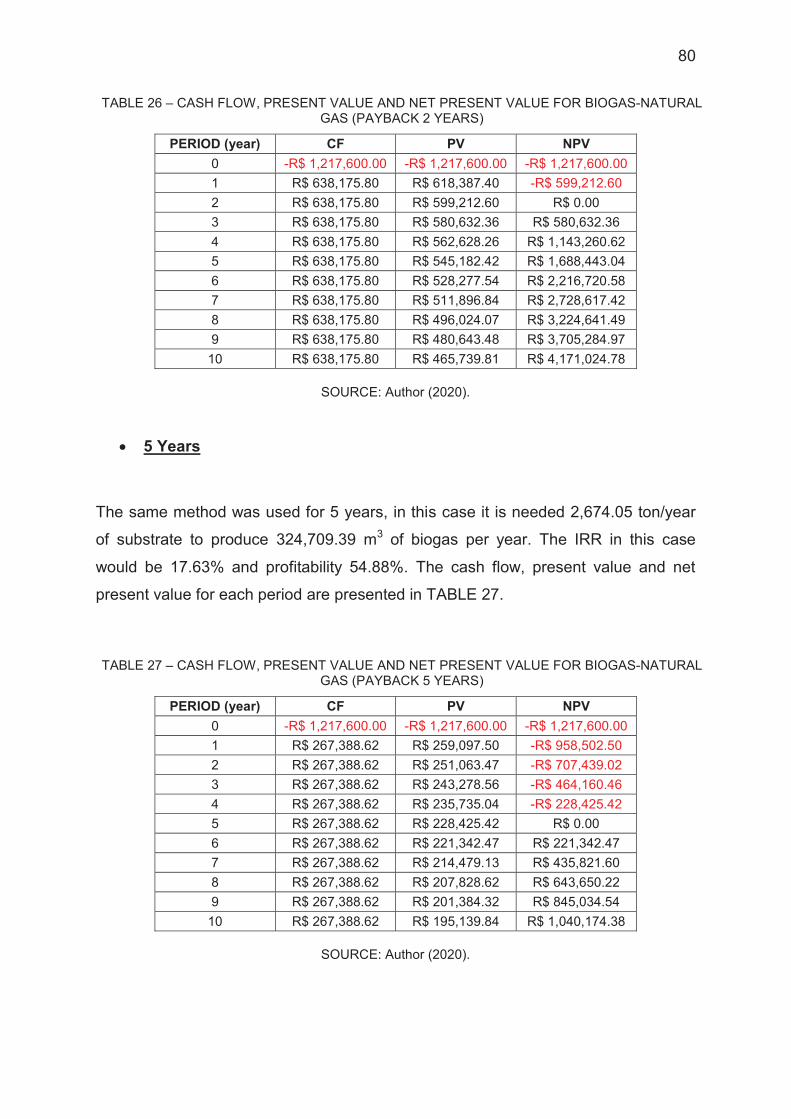
80
TABLE 26 – CASH FLOW, PRESENT VALUE AND NET PRESENT VALUE FOR BIOGAS-NATURAL GAS (PAYBACK 2 YEARS)
PERIOD (year) CF PV NPV 0 -R$ 1,217,600.00 -R$ 1,217,600.00 -R$ 1,217,600.00 1 R$ 638,175.80 R$ 618,387.40 -R$ 599,212.60 2 R$ 638,175.80 R$ 599,212.60 R$ 0.00 3 R$ 638,175.80 R$ 580,632.36 R$ 580,632.36 4 R$ 638,175.80 R$ 562,628.26 R$ 1,143,260.62 5 R$ 638,175.80 R$ 545,182.42 R$ 1,688,443.04 6 R$ 638,175.80 R$ 528,277.54 R$ 2,216,720.58 7 R$ 638,175.80 R$ 511,896.84 R$ 2,728,617.42 8 R$ 638,175.80 R$ 496,024.07 R$ 3,224,641.49 9 R$ 638,175.80 R$ 480,643.48 R$ 3,705,284.97 10 R$ 638,175.80 R$ 465,739.81 R$ 4,171,024.78
SOURCE: Author (2020).
5 Years
The same method was used for 5 years, in this case it is needed 2,674.05 ton/year
of substrate to produce 324,709.39 m3 of biogas per year. The IRR in this case
would be 17.63% and profitability 54.88%. The cash flow, present value and net
present value for each period are presented in TABLE 27.
TABLE 27 – CASH FLOW, PRESENT VALUE AND NET PRESENT VALUE FOR BIOGAS-NATURAL GAS (PAYBACK 5 YEARS)
PERIOD (year) CF PV NPV 0 -R$ 1,217,600.00 -R$ 1,217,600.00 -R$ 1,217,600.00 1 R$ 267,388.62 R$ 259,097.50 -R$ 958,502.50 2 R$ 267,388.62 R$ 251,063.47 -R$ 707,439.02 3 R$ 267,388.62 R$ 243,278.56 -R$ 464,160.46 4 R$ 267,388.62 R$ 235,735.04 -R$ 228,425.42 5 R$ 267,388.62 R$ 228,425.42 R$ 0.00 6 R$ 267,388.62 R$ 221,342.47 R$ 221,342.47 7 R$ 267,388.62 R$ 214,479.13 R$ 435,821.60 8 R$ 267,388.62 R$ 207,828.62 R$ 643,650.22 9 R$ 267,388.62 R$ 201,384.32 R$ 845,034.54 10 R$ 267,388.62 R$ 195,139.84 R$ 1,040,174.38
SOURCE: Author (2020).
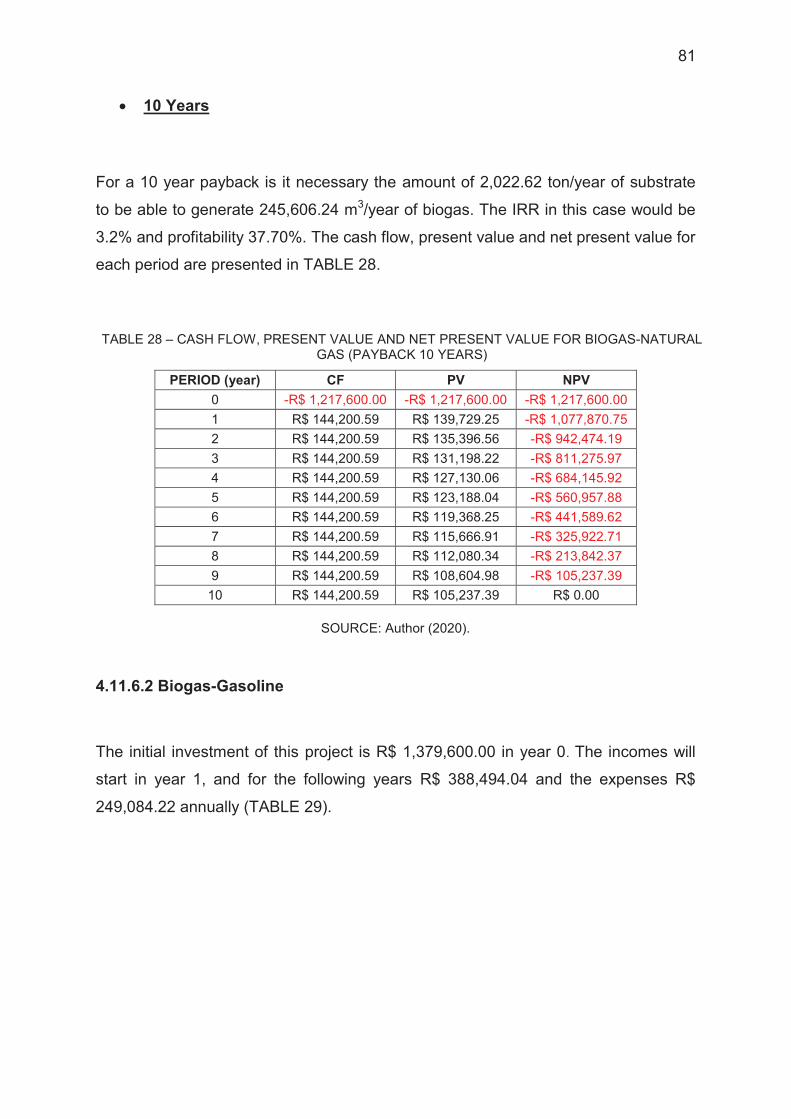
81
10 Years
For a 10 year payback is it necessary the amount of 2,022.62 ton/year of substrate
to be able to generate 245,606.24 m3/year of biogas. The IRR in this case would be
3.2% and profitability 37.70%. The cash flow, present value and net present value for
each period are presented in TABLE 28.
TABLE 28 – CASH FLOW, PRESENT VALUE AND NET PRESENT VALUE FOR BIOGAS-NATURAL GAS (PAYBACK 10 YEARS)
PERIOD (year) CF PV NPV 0 -R$ 1,217,600.00 -R$ 1,217,600.00 -R$ 1,217,600.00 1 R$ 144,200.59 R$ 139,729.25 -R$ 1,077,870.75 2 R$ 144,200.59 R$ 135,396.56 -R$ 942,474.19 3 R$ 144,200.59 R$ 131,198.22 -R$ 811,275.97 4 R$ 144,200.59 R$ 127,130.06 -R$ 684,145.92 5 R$ 144,200.59 R$ 123,188.04 -R$ 560,957.88 6 R$ 144,200.59 R$ 119,368.25 -R$ 441,589.62 7 R$ 144,200.59 R$ 115,666.91 -R$ 325,922.71 8 R$ 144,200.59 R$ 112,080.34 -R$ 213,842.37 9 R$ 144,200.59 R$ 108,604.98 -R$ 105,237.39 10 R$ 144,200.59 R$ 105,237.39 R$ 0.00
SOURCE: Author (2020).
4.11.6.2 Biogas-Gasoline
The initial investment of this project is R$ 1,379,600.00 in year 0. The incomes will
start in year 1, and for the following years R$ 388,494.04 and the expenses R$
249,084.22 annually (TABLE 29).
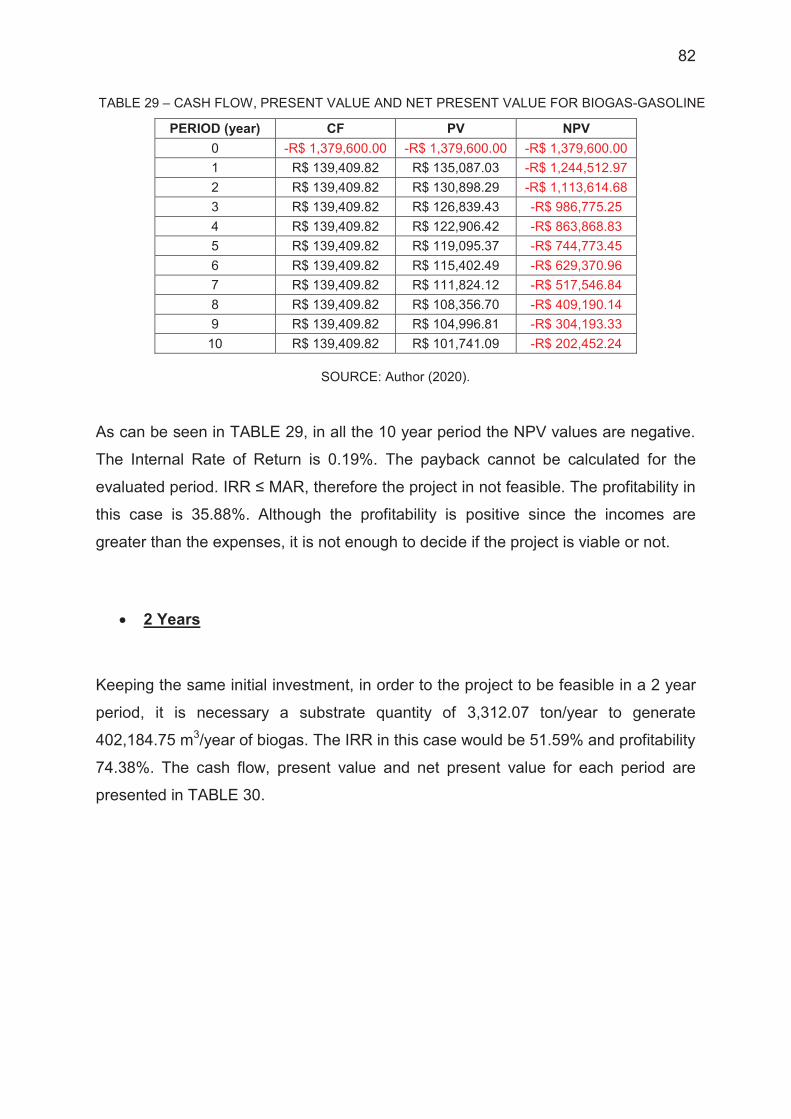
82
TABLE 29 – CASH FLOW, PRESENT VALUE AND NET PRESENT VALUE FOR BIOGAS-GASOLINE
PERIOD (year) CF PV NPV 0 -R$ 1,379,600.00 -R$ 1,379,600.00 -R$ 1,379,600.00 1 R$ 139,409.82 R$ 135,087.03 -R$ 1,244,512.97 2 R$ 139,409.82 R$ 130,898.29 -R$ 1,113,614.68 3 R$ 139,409.82 R$ 126,839.43 -R$ 986,775.25 4 R$ 139,409.82 R$ 122,906.42 -R$ 863,868.83 5 R$ 139,409.82 R$ 119,095.37 -R$ 744,773.45 6 R$ 139,409.82 R$ 115,402.49 -R$ 629,370.96 7 R$ 139,409.82 R$ 111,824.12 -R$ 517,546.84 8 R$ 139,409.82 R$ 108,356.70 -R$ 409,190.14 9 R$ 139,409.82 R$ 104,996.81 -R$ 304,193.33 10 R$ 139,409.82 R$ 101,741.09 -R$ 202,452.24
SOURCE: Author (2020).
As can be seen in TABLE 29, in all the 10 year period the NPV values are negative.
The Internal Rate of Return is 0.19%. The payback cannot be calculated for the
evaluated period. IRR ≤ MAR, therefore the project in not feasible. The profitability in
this case is 35.88%. Although the profitability is positive since the incomes are
greater than the expenses, it is not enough to decide if the project is viable or not.
2 Years
Keeping the same initial investment, in order to the project to be feasible in a 2 year
period, it is necessary a substrate quantity of 3,312.07 ton/year to generate
402,184.75 m3/year of biogas. The IRR in this case would be 51.59% and profitability
74.38%. The cash flow, present value and net present value for each period are
presented in TABLE 30.

83
TABLE 30 – CASH FLOW, PRESENT VALUE AND NET PRESENT VALUE FOR BIOGAS-GASOLINE (PAYBACK 2 YEARS)
PERIOD (year) CF PV NPV 0 -R$ 1,379,600.00 -R$ 1,379,600.00 -R$ 1,379,600.00 1 R$ 723,084.21 R$ 700,662.99 -R$ 678,937.01 2 R$ 723,084.21 R$ 678,937.01 R$ 0.00 3 R$ 723,084.21 R$ 657,884.70 R$ 657,884.70 4 R$ 723,084.21 R$ 637,485.17 R$ 1,295,369.87 5 R$ 723,084.21 R$ 617,718.19 R$ 1,913,088.06 6 R$ 723,084.21 R$ 598,564.14 R$ 2,511,652.20 7 R$ 723,084.21 R$ 580,004.01 R$ 3,091,656.21 8 R$ 723,084.21 R$ 562,019.39 R$ 3,653,675.60 9 R$ 723,084.21 R$ 544,592.43 R$ 4,198,268.03 10 R$ 723,084.21 R$ 527,705.84 R$ 4,725,973.87
SOURCE: Author (2020).
5 Years
The necessary amount of substrate for a payback of 5 years is 2,572.89 ton/year
with a generation of 312,426.48 m3/year. The IRR in this case would be 17.63% and
profitability 54.73%. The cash flow, present value and net present value for each
period are presented in TABLE 31.
TABLE 31 – CASH FLOW, PRESENT VALUE AND NET PRESENT VALUE FOR BIOGAS-GASOLINE (PAYBACK 5 YEARS)
PERIOD (year) CF PV NPV 0 -R$ 1,379,600.00 -R$ 1,379,600.00 -R$ 1,379,600.00 1 R$ 302,964.31 R$ 293,570.07 -R$ 1086,029.93 2 R$ 302,964.31 R$ 284,467.12 -R$ 801,562.81 3 R$ 302,964.31 R$ 275,646.44 -R$ 525,916.37 4 R$ 302,964.31 R$ 267,099.26 -R$ 258,817.11 5 R$ 302,964.31 R$ 258,817.11 R$ 0.00 6 R$ 302,964.31 R$ 250,791.78 R$ 250,791.78 7 R$ 302,964.31 R$ 243,015.29 R$ 493,807.06 8 R$ 302,964.31 R$ 235,479.93 R$ 729,286.99 9 R$ 302,964.31 R$ 228,178.23 R$ 957,465.22 10 R$ 302,964.31 R$ 221,102.93 R$ 1,178,568.15
SOURCE: Author (2020).

84
10 Years
The project could be economically viable if the substrate to be treated in the
biodigester is around 1,405.24 ton/year and the volume of biogas generated
170,638.48 m3/year. The IRR would be 3.2% and profitability 39.61%. The cash flow,
present value and net present value for each period are presented in TABLE 32.
TABLE 32 – CASH FLOW, PRESENT VALUE AND NET PRESENT VALUE FOR BIOGAS-GASOLINE (PAYBACK 10 YEARS)
PERIOD (year) CF PV NPV 0 -R$ 1,379,600.00 -R$ 1,379,600.00 -R$ 1,379,600.00 1 R$ 163,386.28 R$ 158,320.03 -R$ 1,221,279.97 2 R$ 163,386.28 R$ 153,410.89 -R$ 1,067,869.08 3 R$ 163,386.28 R$ 148,653.96 -R$ 919,215.12 4 R$ 163,386.28 R$ 144,044.53 -R$ 775,170.59 5 R$ 163,386.28 R$ 139,578.04 -R$ 635,592.55 6 R$ 163,386.28 R$ 135,250.04 -R$ 500,342.51 7 R$ 163,386.28 R$ 131,056.24 -R$ 369,286.28 8 R$ 163,386.28 R$ 126,992.48 -R$ 242,293.80 9 R$ 163,386.28 R$ 123,054.73 -R$ 119,239.08 10 R$ 163,386.28 R$ 119,239.08 R$ 0.00
SOURCE: Author (2020).
4.11.6.3 Biogas-Diesel
The initial investment for this project is R$ 1,366,100.00 in year 0. The incomes will
start in year 1, and for the following years R$ 295,640.78 and the expenses R$
248,184.22 annually (TABLE 33).

85
TABLE 33 – CASH FLOW, PRESENT VALUE AND NET PRESENT VALUE FOR BIOGAS-DIESEL
PERIOD (year) CF PV NPV 0 -R$ 1,366,100.00 -R$ 1,366,100.00 -R$ 1,366,100.00 1 R$ 47,456.56 R$ 45,985.04 -R$ 1,320,114.96 2 R$ 47,456.56 R$ 44,559.15 -R$ 1,275,555.82 3 R$ 47,456.56 R$ 43,177.47 -R$ 1,232,378.35 4 R$ 47,456.56 R$ 41,838.63 -R$ 1,190,539.72 5 R$ 47,456.56 R$ 40,541.31 -R$ 1,149,998.41 6 R$ 47,456.56 R$ 39,284.21 -R$ 1,110,714.19 7 R$ 47,456.56 R$ 38,066.10 -R$ 1,072,648.09 8 R$ 47,456.56 R$ 36,885.75 -R$ 1,035,762.34 9 R$ 47,456.56 R$ 35,742.01 -R$ 1,000,020.33 10 R$ 47,456.56 R$ 34,633.73 -R$ 965,386.60
SOURCE: Author (2020).
As can be seen in TABLE 33, in all the 10 year period the NPV values are negative.
The Internal Rate of Return and the payback cannot be calculated for the evaluated
period. The project in not feasible. Although the profitability is positive 16.05%, since
the incomes are greater than the expenses, it is not enough to decide if the project is
viable or not.
2 Years
For the project to be economically viable in 2 years, the biodigester must treat the
amount of 4,525.43 ton/year of substrate to generate 549,522.43 m3/year. The IRR
would be 51.59% and profitability 74.26%. The cash flow, present value and net
present value for each period is presented in TABLE 34.

86
TABLE 34 – CASH FLOW, PRESENT VALUE AND NET PRESENT VALUE FOR BIOGAS-DIESEL (PAYBACK 2 YEARS)
PERIOD (year) CF PV NPV 0 -R$ 1,366,100.00 -R$ 1,366,100.00 -R$ 1,366,100.00 1 R$ 716,008.51 R$ 693,806.69 -R$ 672,293.31 2 R$ 716,008.51 R$ 672,293.31 R$ 0.00 3 R$ 716,008.51 R$ 651,447.00 R$ 651,447.00 4 R$ 716,008.51 R$ 631,247.10 R$ 1,282,694.10 5 R$ 716,008.51 R$ 611,673.54 R$ 1,894,367.64 6 R$ 716,008.51 R$ 592,706.92 R$ 2,487,074.56 7 R$ 716,008.51 R$ 574,328.41 R$ 3,061,402.97 8 R$ 716,008.51 R$ 556,519.78 R$ 3,617,922.75 9 R$ 716,008.51 R$ 539,263.35 R$ 4,157,186.11 10 R$ 716,008.51 R$ 522,542.01 R$ 4,679,728.11
SOURCE: Author (2020).
5 Years
The amount of 2,572.89 ton/year could generate 312,426.48 m3/year of biogas
necessary for the payback of the project to be five years. The IRR would be17.63%
and profitability 54.73%. The cash flow, present value and net present value for each
period are presented in TABLE 35.
TABLE 35 – CASH FLOW, PRESENT VALUE AND NET PRESENT VALUE FOR BIOGAS-DIESEL (PAYBACK 5 YEARS)
PERIOD (year) CF PV NPV 0 -R$ 1,366,100.00 -R$ 1,366,100.00 -R$ 1,366,100.00 1 R$ 299,999.67 R$ 290,697.36 -R$ 1,075,402.64 2 R$ 299,999.67 R$ 281,683.48 -R$ 793,719.16 3 R$ 299,999.67 R$ 272,949.11 -R$ 520,770.05 4 R$ 299,999.67 R$ 264,485.57 -R$ 256,284.47 5 R$ 299,999.67 R$ 256,284.47 R$ 0.00 6 R$ 299,999.67 R$ 248,337.67 R$ 248,337.67 7 R$ 299,999.67 R$ 240,637.27 R$ 488,974.94 8 R$ 299,999.67 R$ 233,175.65 R$ 722,150.59 9 R$ 299,999.67 R$ 225,945.40 R$ 948,095.99 10 R$ 299,999.67 R$ 218,939.34 R$ 1,167,035.33
SOURCE: Author (2020).
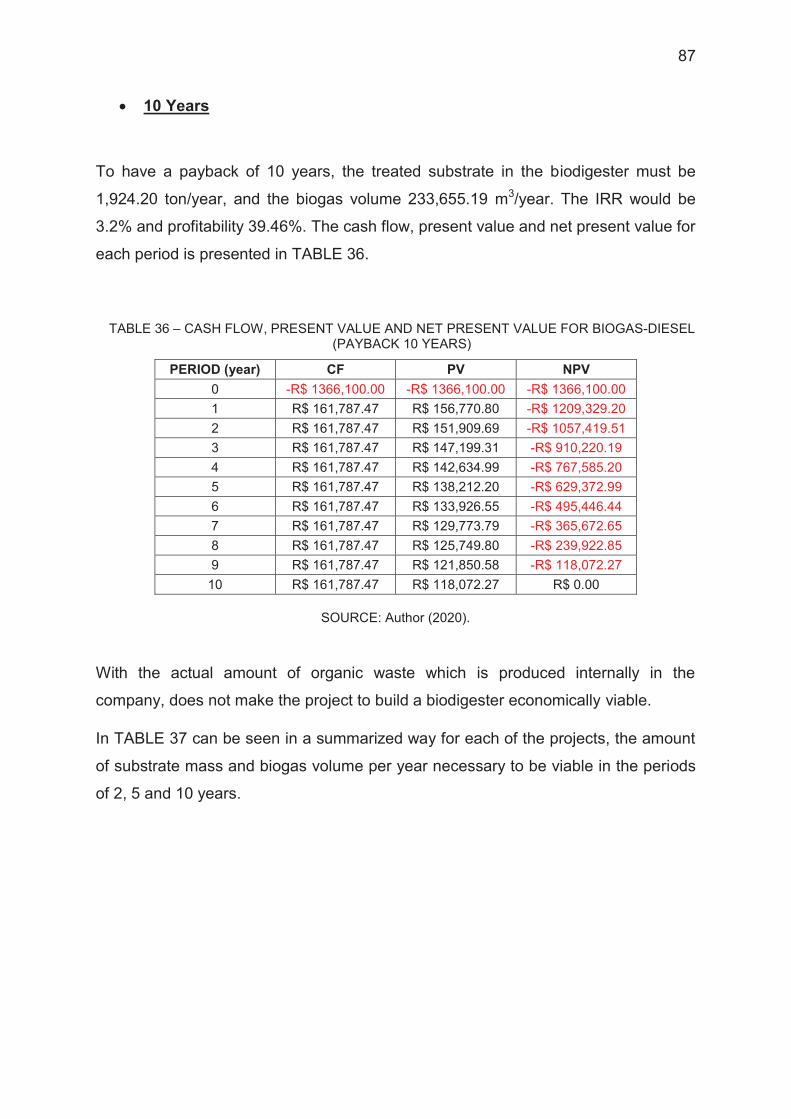
87
10 Years
To have a payback of 10 years, the treated substrate in the biodigester must be
1,924.20 ton/year, and the biogas volume 233,655.19 m3/year. The IRR would be
3.2% and profitability 39.46%. The cash flow, present value and net present value for
each period is presented in TABLE 36.
TABLE 36 – CASH FLOW, PRESENT VALUE AND NET PRESENT VALUE FOR BIOGAS-DIESEL (PAYBACK 10 YEARS)
PERIOD (year) CF PV NPV 0 -R$ 1366,100.00 -R$ 1366,100.00 -R$ 1366,100.00 1 R$ 161,787.47 R$ 156,770.80 -R$ 1209,329.20 2 R$ 161,787.47 R$ 151,909.69 -R$ 1057,419.51 3 R$ 161,787.47 R$ 147,199.31 -R$ 910,220.19 4 R$ 161,787.47 R$ 142,634.99 -R$ 767,585.20 5 R$ 161,787.47 R$ 138,212.20 -R$ 629,372.99 6 R$ 161,787.47 R$ 133,926.55 -R$ 495,446.44 7 R$ 161,787.47 R$ 129,773.79 -R$ 365,672.65 8 R$ 161,787.47 R$ 125,749.80 -R$ 239,922.85 9 R$ 161,787.47 R$ 121,850.58 -R$ 118,072.27 10 R$ 161,787.47 R$ 118,072.27 R$ 0.00
SOURCE: Author (2020).
With the actual amount of organic waste which is produced internally in the
company, does not make the project to build a biodigester economically viable.
In TABLE 37 can be seen in a summarized way for each of the projects, the amount
of substrate mass and biogas volume per year necessary to be viable in the periods
of 2, 5 and 10 years.

88
TABLE 37 – SUBSTRATE MASS, VOLUME BIOGAS FOR 2, 5 AND 10 YEARS PAYBACK
PAYBACK (years) 2 5 10 BIOGAS-NATURAL GAS
SUBSTRATE MASS (ton/year) 4,635 2,674 2,022
VOLUME BIOGAS (m3/year) 562,804 324,709 245,606
BIOGAS-GASOLINE SUBSTRATE MASS
(ton/year) 3,312 1,881 1,405
VOLUME BIOGAS (m3/year) 402,185 228,382 170,638
BIOGAS-DIESEL SUBSTRATE MASS
(ton/year) 4,525 2,573 1,924
VOLUME BIOGAS (m3/year) 549,522 312,426 233,655
SOURCE: Author (2020).
Regarding the studies which have been compared previously. The study made by
Nascimento et al. (2017), showed that it was not feasible to generate energy with
840 m3/year of biogas, since the costs of generating electricity was higher than the
costs that were currently paid for it.
Arati (2009) also showed that it was not feasible for energy production with 175,200
m3/year of biogas, but was feasible in other scenarios evaluated, like the sales of
methane, fertilizer and carbon credits. The criteria for this study in order to be
economically feasible was that the IRR should be higher than 12.6%.
Naami (2017) concluded that the two scenarios evaluated, energy production and
the sale of biogas for cooking (4,776,783 m3/year) were economically viable,
obtaining a payback between 6 and 8 years. In this study to consider that the project
was economically viable, the IRR should be higher than 4.6%.
4.12 LEGISLATION
The current legislation in the state of Parana about biogas and biodigesters, that are
related to the objectives of the project are: (Information taken from DataSebrae
Biogás, 2020).

89
Lei Nº 19500 de 21 de Maio de 2018 – Política Estadual do Biogás e Biometano
Explanation of the use of energy as an appropriate destination for waste, the need to
inspection from the fire department, minimum percentage of biomethane for piped
gas distributed in the territory, purchase of biogas in the state and biomethane for
cars, financing lines.
CONVÊNIO ICMS 42/18, DE 16 DE MAIO DE 2018
Deals with Paraná's adhesion to the ICMS Agreement 16/15, which authorizes the
granting of exemptions for internal operations related to the circulation of electric
energy, subject to billing under RN No. 482/12, of ANEEL.
Lei 17188 – 13 de Junho de 2012 – Institui a Política Estadual de Geração
Distribuída com Energias Renováveis – GDER no Estado do Paraná.
Incentive to concessionaires to aid Distributed Generation. Moreover mention the
need for environmental licensing.
Decreto 11538 – 05 de Novembro de 2018 – Trata sobre a criação do Projeto Smart
Energy Paraná e revoga o Decreto nº 8842, de 04 de setembro de 2013.
Linked to the State Secretariat for Science, Technology and Higher Education –
(SETI). Defines those responsible and participating in the Management Committee,
Scientific Committee and Executive Secretariat.
Decreto 11671 – 16 de Julho de 2014 – Dispõe sobre o Programa Paranaense de
Energias Renováveis – Iluminando o Futuro e prevê medidas de incentivo à
produção e uso de energia renovável.
It determines that the Paraná Institute of Technology - Tecpar is in charge of
coordinating the Paranaense Renewable Energy Program.
None of the above laws prevents the construction and operation of biodigester for
the studied case, nor does it affect the calculations for economic viability.
Nevertheless the legislation must offer incentives to promote the installation of
equipment for the generation of biogas, both for public and private companies.

90
5 CONCLUSION
Although the project for construction of a biodigester is technically and
environmentally feasible, it is not economically viable for the different cases, at least
with the current conditions.
From the calculations, for the project to be viable according to internal criteria with a
payback of two years, the required amount of substrate to treat in the biodigester
should be 3,312 ton/year for Biogas-Gasoline, 4,525 ton/year for Biogas-Diesel and
4,635 ton/year for Biogas-Gas Natural substitution.
As additional data, if the project is required to be viable at least in a period of 5 or 10
years, the amount of substrate to be treated in the biodigester must be between
1,405 and 2,674 ton/year.
Defining the criteria for evaluating economic viability is critical and varies from one
study to another. What may be viable for one company may not be for another.
It should be noted that factors such as the income from the commercialization of
carbon credits, can make the project viable depending on its future price, but for that
to happen, it must first exist a well established carbon pricing system in Brazil. The
same occurs with the possible increase of prices in the case of natural gas, gasoline
and diesel. Therefore, it is recommended not to rule out the possibility of a new study
in the future.
91
BIBLIOGRAPHY
AAT. 2020. BIOGAS Biogas Technology. Agitador Vertical “Homer”. Available in:
˂https://www.aat-biogas.at/br/servicos-da-
empresa/equipamento/agitadores/agitador-vertical-homer/˃. Accessed on: 20 Oct.
2020.
AIR LIQUID. 2020. Biogas. Available in:
˂https://www.airliquideadvancedseparations.com/our-membranes/biogas˃.
Accessed on: 29 Sept. 2020.
AGENCIAS. 2020. Merca2: El uso de biometano reducirá un 55% las emisiones de CO2 para 2030. Available in: ˂https://www.merca2.es/biometano-co2-2030/˃.
Accessed on: 25 Sept. 2020.
AL SEADI, T.; RUTZ, D. PRASSL, H.; KÖTTNER, M.; FINSTERWALDER, T.; VOLK,
S.; JANSSEN, R. Biogas Handbook. Esbjerg: Author. 2008. Available in:
˂https://www.lemvigbiogas.com/BiogasHandbook.pdf˃. Accessed on: 12 Apr. 2020.
ALVES, V. M. C. Análise de produção de inovação tecnológica do biogás no Brasil de 2006 a 2016. Trabalho de Conclusão de Curso (Bacharel em Engenharia
de Bioprocessos) – Departamento de Engenharia de Bioprocessos, Universidade
Federal de São João del-Rei, Ouro Branco, 2016. Available in:
˂https://biblioteca.cibiogas.org/trabalho/pdf/analise-de-producao-de-inovacao-
tecnologica-do-biogas-no-brasil-de-2006-a-2016.pdf˃. Accessed on: 14 Apr. 2020.
ANP- Agência Nacional do Petróleo, Gás Natural e Biocumbustíveis. 2019.
Superintendência de defesa da concorrência, estudos e regulação econômica: boletim trimestral de preços e volumes de combustíveis agosto 2019. Available
in: ˂http://www.anp.gov.br/arquivos/publicacoes/boletins-anp/btpvc/boletim-
trimestral-2.pdf˃. Accessed on: 01 Oct. 2020.
ARATI, J. M. Evaluating the economic feasibility of anaerobic digestion of kawangware market waste. Partial fulfillment of the requirements for master´s
degree (Master of Agribusiness) – Department of Agricultural Economics, Kansas
State University), Manhattan, 2009. Available in:
˂https://core.ac.uk/download/pdf/5166145.pdf˃. Accessed on: 14 Aug. 2020.

92
ARAÚJO, A. P.C. Produção de biogás a partir de resíduos orgânicos utilizando biodigestor anaeróbico. Monografia (Bacharel em Engenharia Química) –
Faculdade de Engenharia Química, Universidade Federal de Uberlândia. 2017.
Available in:
˂https://repositorio.ufu.br/bitstream/123456789/20292/3/Produ%C3%A7%C3%A3oBi
og%C3%A1sRes%C3%ADduos.pdf˃. Accessed on: 01 June 2020.
AVP. 2019. Air & Vacuum process: Landfill/Digester/Biogas Dryers. Available in:
˂https://airvacuumprocess.com/natural-gas-dryers/landfilldigesterbiogas-dryers/˃.
Accessed on: 29 Sept. 2020.
BEKON. 2016. The Bekon process. Available in:
˂https://www.bekon.eu/en/technology/˃. Accessed on: 05 June 2020.
BERHORST, N. L. Avaliação de retorno financeiro de um biodigestor com características pré-estabelecidas para dejetos suínos. Dissertação (Mestrado
em Meio Ambiente Urbano e Industrial) – Universidade Federal do Paraná, Curitiba,
2018. Available in:
˂https://www.prppg.ufpr.br/siga/visitante/trabalhoConclusaoWS?idpessoal=40942&i
dprograma=40001016057P5&anobase=2018&idtc=8˃. Accessed on: 01 Sep. 2020.
BGS. Equipamentos para biogás. 2017. História do biogás. Available in:
˂https://www.bgsequipamentos.com.br/historia-do-biogas/˃. Accessed on: 22 Mar.
2020.
BIOGASPLANT. 2014. Methane and biogas. Available in: ˂https://www.build-a-
biogas-plant.com/Methane-and-Biogas/˃. Accessed on: 02 June 2020.
BLANCO, G.; SANTALLA, E.; CÓRDOBA, V.; LEVY, A. Generación de electricidad a partir de biogás capturado de residuos sólidos urbanos: Un análisis teórico-práctico. Buenos Aires: Banco Interamericano de Desarrollo.
2017. E-book. Available in:
˂https://publications.iadb.org/publications/spanish/document/Generaci%C3%B3n-
de-electricidad-a-partir-de-biog%C3%A1s-capturado-de-residuos-s%C3%B3lidos-
urbanos-Un-an%C3%A1lisis-te%C3%B3rico-pr%C3%A1ctico.pdf˃. Accessed on: 06
June 2020.

93
BLEY Jr., C. Biogás a energia invisível. 2nd Ed. São Paulo: Planeta Sustentável,
2015. p. 170-171.
BRASIL. Governo do Brasil. Banco Central do Brasil. 2020. Taxas de juros básicas – Histórico. Available in:
˂https://www.bcb.gov.br/controleinflacao/historicotaxasjuros˃. Accessed on: 21
Sept. 2020.
BRASIL. Secretaria Nacional de Saneamento Ambiental. PROBIOGAS. Guia técnico de aproveitamento energético de biogás em estações de tratamento de esgoto. 1st Ed. Brasília: Ministério das Cidades. 2015. E-book. Available in:
˂https://www.giz.de/en/downloads/probiogas-guia-etes.pdf˃. Accessed on: 20 Apr.
2020.
CARVALHO, R. G. A influência da temperatura na produção de biogás a partir da decomposição de restos de comida em biodigestores caseiros. –Trabalho de
Conclusão de Curso (Bacharel em Engenharia Civil) – Departamento de Engenharia
Civil, Pontifícia Universidade Católica do Paraná, Curitiba, 2017. Available in:
˂https://biblioteca.cibiogas.org/trabalho/pdf/a-influencia-da-temperatura-na-
producao-de-biogas-a-partir-da-decomposicao-de-restos-de-comiga-em-
biodigestores-caseiros.pdf˃. Accessed on: 05 Mar. 2020.
CDM WATCH. 2010. Manual del Mecanismo de Desarrollo Limpio (MDL) un recurso para ciudadanos, activistas y ONGs. Available in:
˂https://carbonmarketwatch.org/wp-content/uploads/2012/03/CDM-
Toolkit_Espanol.pdf˃. Accessed on: 26 Sept. 2020.
CENTRO INTERNACIONAL DE ENERGIAS RENOVÁVEIS (CIBIOGAS);
ORGANIZAÇÃO DAS NAÇÕES UNIDAS PARA O DESENVOLVIMENTO
INDUSTRIAL (UNIDO). 2020. Ficha técnica: Fundamentos do biogás. Foz de
Iguazu: author.
CIBIOGAS, 2020. Nota técnica: Panorama do biogás no Brazil em 2019. Available in: ˂https://biblioteca.cibiogas.org/biblioteca/notatecnica/pdf/panorama-do-
biogas-no-brasil-em-2019.pdf˃. Accessed on: 23 Mar. 2020.

94
COMPAGAS. 2020. Gas natural: Especificação técnica medidor de vazão de gás tipo rotativo e tipo turbina. Available in:
˂http://licitacoes.compagas.com.br/edital.php?id=5307&idev=763&show=lc˃.
Accessed on: 19 Oct. 2020.
CONATUS ENERGIAS RENOVAVEIS. Estudo biodigestor [Personal message].
Message received by: ˂[email protected]˃. 14 Aug. 2020.
DATASEBRAE BIOGÁS. 2020. Biblioteca de legislação do biogás. Available in:
˂https://datasebrae.com.br/biblioteca-legislacao-biogas/˃. Accessed on: 01 Sept.
2020.
EDWIGES, T. 2017. Biodigestão anaeróbia de resíduos vegetais provenientes de central de abastecimento. –Tese (Doutorado em Engenharia Agrícola) – Área
de concentração de Recursos Hídricos e Saneamento, Universidade Estadual do
Oeste do Paraná, Cascavel, 2017. Available in:
˂https://biblioteca.cibiogas.org/trabalho/pdf/biodigestao-anaerobia-de-residuos-
vegetais-provenientes-de-central-de-abastecimento.pdf˃. Accessed on: 18 Apr.
2020.
ELY, C.; WILLIAMS, R.; MARTYNOWICZ, T.; KOSUSKO, M. 2016. BIOCYCLE: The
Organics Recycling Authority. Evaluating biogas management technologies. Available in: ˂https://www.biocycle.net/2016/10/24/evaluating-biogas-management-
technologies/˃. Accessed on: 02 June 2020.
ENCYCLOPAEDIA BRITANNICA. 2020. Agriculture: Fertilizer. Available in:
˂https://www.britannica.com/topic/fertilizer˃. Accessed on: 22 May 2020.
ENGINEERING FUNDAMENTALS. 2011. Dewatering Fundamentals. Fundamentals. Available in:
˂http://www.engineeringfundamentals.net/DewateringFundamentalsMobile/fundame
ntals.html˃. Accessed on: 05 June 2020.
ENGINEERING TOOLBOX. 2003a. Fuels - Higher and Lower Calorific Values. Available in: ˂https://www.engineeringtoolbox.com/fuels-higher-calorific-values-
d_169.html˃. Accessed on: 01 Aug. 2020.

95
ENVIRONMENTAL XPERT. 2017. Bekon mini-dry fermentation plant. Available
in: ˂https://www.environmental-expert.com/products/bekon-mini-dry-fermentation-
plant-565819˃. Accessed on: 05 June 2020.
EPA. United States Environmental Protection Agency. 2019. How does anaerobic digestion work? Available in: ˂https://www.epa.gov/agstar/how-does-anaerobic-
digestion-work˃. Accessed on: 04 June 2020.
European Biogas Association (EBA). 2019. Biogas basics. Available in:
˂https://www.europeanbiogas.eu/wp-content/uploads/2019/08/Biogas-Basics-
v6.pdf˃. Acessed on: 15 May 2020.
Federação das Indústrias do Estado do Paraná (FIEP). 2016. Oportunidades da cadeia produtiva de biogás para o estado do Paraná. Available in: ˂
https://www.sistemafiep.org.br/relacoes-
internacionais/uploadAddress/Biogas[73656].pdf˃. Accessed on: 08 Aug. 2020.
FISCHER, K. 2019. Solid waste treatment. Stuttgart: Institute for Sanitary
Engineering, Water Quality and Solid Waste Management (ISWA). Universitӓt
Stuttgart.
FNR. 2015. Fachagentur Nachwachsende Rohstoffe e.V. Gasausbeuten verschiedener substrate (FM). Available in:
˂https://mediathek.fnr.de/grafiken/daten-und-
fakten/bioenergie/biogas/gasausbeuten-verschiedener-substrate-fm.html˃. Accessed
on: 15 Aug. 2020.
FNR. Fachagentur Nachwachsende Rohstoffe e.V. Guia prático do biogás: geração e utilização. Translation by: ZATTAR, M. de M. 5th Ed. Gülzow:
Fachagentur Nachwachsende Rohstoffe e. V. (FNR), 2010. Available in: ˂http://web-
resol.org/cartilhas/giz_-_guia_pratico_do_biogas_final.pdf˃. Accessed on: 07 Mar.
2020.
FRARE, L. M.; GIMENES, M. L.; PEREIRA, N. C. 2009. Artigo técnico. Processo para remoção de ácido sulfídrico de biogás. Available in:
˂https://www.scielo.br/pdf/esa/v14n2/a04v14n2.pdf˃. Accessed on: 31 May 2020.

96
FRIGO, K. D. A.; FEIDEN, A.; GALANT, N. B. SANTOS, R. F.; MARI, A. G.
ELISANDRO, FRIGO, E. P. 2015. Acta Iguazu. Biodigestores: seus modelos e aplicações. Available in: ˂http://e-
revista.unioeste.br/index.php/actaiguazu/article/view/12528/8708˃. Accessed on: 02
June 2020.
Fundação Estadual de Meio Ambiente (FEAM). 2015. Guia técnico ambiental de biogás na agroindústria. Available in: ˂https://docplayer.com.br/44331354-Guia-
tecnico-ambiental-de-biogas-na-agroindustria.html˃. Accessed on: 13 Aug. 2020.
G1 PR. 2017. Itaipu inaugura unidade de produção de biogás a partir de esgoto e restos orgânicos. Available in: ˂https://g1.globo.com/pr/oeste-
sudoeste/noticia/itaipu-inaugura-unidade-de-producao-de-biogas-a-partir-de-esgoto-
e-restos-organicos.ghtml˃. Accessed on: 29 Sept. 2020.
GEHM, S. C. Estudo da capacidade de geração de energia elétrica a partir de biogás produzido através do lixo doméstico do município de Ijuí-Rs. Trabalho
de Conclusão de Curso (Bacharel em Engenharia Elétrica) – Universidade Regional
do Noroeste do Estado do Rio Grande do Sul, Ijuí, 2016. Available in:
˂https://bibliodigital.unijui.edu.br:8443/xmlui/bitstream/handle/123456789/4132/Sand
i%20da%20Costa%20Gehm.pdf?sequence=1&isAllowed=y˃. Acsessed on: 18 Apr.
2020.
GREGORY, R. 2010. The EcoTipping Points Project. Models for success in a time of
crisis. China-Biogas. Available in: ˂http://www.ecotippingpoints.org/our-
stories/indepth/china-biogas.html˃. Accessed on: 01 June 2020.
H2FOZ. 2019. "Veículos a biometano de Itaipu deram o equivalente a cinco voltas no planeta em 2018". Available in:
˂https://www.h2foz.com.br/noticia/veiculos-a-biometano-de-itaipu-deram-o-
equivalente-a-cinco-voltas-no-planeta-em-2018. Accessed on: 17 Sept. 2020.
HSB EIL. Anaerobic digestion: plant operation risk management. Available in:
˂https://www.munichre.com/content/dam/munichre/global/content-
pieces/documents/HSBEI-1728.pdf/_jcr_content/renditions/original./HSBEI-
1728.pdf˃. Accessed on: 09 Nov. 2020.
97
ICARROS. 2018. GNV: vale a pena ter o kit gás no carro? Available in:
˂https://www.icarros.com.br/noticias/manutencao-e-servicos/gnv:-vale-a-pena-ter-o-
kit-gas-no-carro-
/24732.html#:~:text=O%20kit%20pode%20ser%20colocado,%24%203.000%20e%2
0R%24%205.000.˃. Accessed on: 17 Sept. 2020.
IDEA. 2011. Situación y potencial de generación de biogás: Estudio técnico per 2011-2020. Available in:
˂https://www.idae.es/uploads/documentos/documentos_11227_e16_biogas_db43a6
75.pdf˃. Accessed on: 12 Aug. 2020.
ISWA. 2018. Institute for Sanitary Engineering, Water Quality and Solid Waste
Managment. Solid waste management. Universitӓt Stuttgart. Stuttgart: Author.
JØRGENSEN, P. J.; PLANENERGI. 2nd Ed. Tjele: Author. 2009. Biogas- green energy: process, design, energy supply, environment. Available in:
˂https://www.lemvigbiogas.com/BiogasPJJuk.pdf˃. Accessed on: 13 Apr. 2020.
JUNGES, D. M.; KLEINSCHMITT, S. C.; SCHIKIDA, P. F. A.; SILVA, J. R. 2009.
Análise econômico-financeira da implantação do sistema de biodigestores no Município de Toledo (PR). Revista de Economia, v. 35, n. 1 (ano 33), p. 7-30,
jan./abril 2009. Editora UFPR.
KARIM, K.; HOFFMANN, R.; KLASSON, K. T.; AL DAHHAN, M. H. 2005. Anaerobic digestion of animal waste: Effect of mode of mixing. Available in: ˂ https://sci-
hub.st/https://doi.org/10.1016/j.watres.2005.06.019˃. Accessed on 20 Oct. 2020.
KUHAD, R. C.; SINGH A. Biotechnology for environmental managment and resource recovery. New Delhi: Springer. 2013. p.266. E-book. Available in:
˂https://books.google.com.br/books?id=rYJEAAAAQBAJ&pg=PA266&lpg=PA266&d
q=Fixed+film+type+reactors+%E2%80%93+UASB&source=bl&ots=VqZlVdoo9l&sig
=ACfU3U0mP78rV2M9BvBxQY7FvzJmrycxuQ&hl=es&sa=X&ved=2ahUKEwi2xIjfj-
fpAhVzILkGHWscCCEQ6AEwBHoECAoQAQ#v=onepage&q=Fixed%20film%20type
%20reactors%20%E2%80%93%20UASB&f=false˃. Accessed on: 23 May 2020.
98
KUNZ, A.; STEINMETZ, R. L. R.; AMARAL, A. C. Fundamentos da digestão anaeróbia, purificação do biogás, uso e tratamento do digestato. 1st Ed.
Concordia, S.C.: Sbera. 2019. Available in:
˂https://www.alice.cnptia.embrapa.br/alice/handle/doc/1108617˃. Accessed on: 07
Apr. 2020.
LI, C.; CHAMPAGNE, P.; ANDERSON, B. C. 2011. Evaluating and modeling biogas production from municipal fat, oil, and grease and synthetic kitchen waste in anaerobic co-digestions. Available in:
˂https://scihub.wikicn.top/https://doi.org/10.1016/j.biortech.2011.07.103˃. Accessed
on: 16 Aug. 2020.
LOHANI, S. P. 2010. Department of Mechanical Engineering, Kathmandu University,
Nepal. Biogas purification, compression and storage: a promising energy recovery and delivery technology for nepal. Available in:
˂https://open.lnu.se/index.php/eco-tech/article/view/645/574˃. Accessed on: 04 June
2020.
MARCHETTI, R.; VASMARA, C.; BERTIN, L.; FIUME, F. 2020. Conversion of waste cooking oil into biogas: perspectives and limits. Applied Microbiology and Biotechnology. Available in: ˂https://scihub.wikicn.top/10.1007/s00253-020-
10431-3˃. Accessed on: 16 Aug. 2020.
MATHERI, A. N.; MBOHWA, C.; BELAID, M.; NGILA, J. C. 2018. Design technology for bioenergy conversion of organic fraction of municipal solid waste. Springer International Publishing. Available in: ˂ https://sci-
hub.tw/https://doi.org/10.1007/978-3-319-63612-2_12˃. Accessed on: 07 June 2020.
MERRIAM-WEBSTER. In: DICTIONARY. Biodigester. Available in:
˂https://www.merriam-webster.com/dictionary/biodigester˃. Accessed on: 05 Mar.
2020.
MIMIAGA, F. E. M. Energy crops alternatives to corn for biogas production - case study Mexico. Thesis (Master in Air Quality Control, Solid Waste and Waste
Water Process Engineering) – Stuttgart University, Stuttgart, 2020.

99
MLC.2017. Clúster de movilidad y logística mugikortasun eta logistika klusterra: Estudio de viabilidad de sustitución de flotas a gas natural. Available
in: ˂https://issuu.com/monicafanlo2/docs/estudio_gas_natural˃. Accessed on: 04
Oct. 2020.
MORENO, M. T. V. Manual de biógas. Santiago de Chile: Proyecto CHI/00/G32.
2011. E-book. Available in: ˂http://www.fao.org/3/as400s/as400s.pdf˃. Accesed on:
25 Mar. 2020.
NAAMI, A. A. Techno-economic Feasibility Study of a Biogas Plant for Treating Food Waste Collected from Households in Kartamantul Region, Yogyakarta. Thesis (Master of Science) – Division of Energy and Climate, KTH School of
Industrial Engineering and Management, Stockholm, 2017. Available in:
˂https://kth.diva-portal.org/smash/get/diva2:1209090/FULLTEXT02.pdf˃. Accessed
on: 12 Aug. 2020.
NASCIMENTO, K. L. S.; MAIA, S. M. F.; SILVA, S. J. C.; SANTOS, E. L. Geração de
energia elétrica e viabilidade técnico-econômica de um biodigestor no setor
hospitalar. Pubvet. v.11, n.12, p.1263-1273, Dez., 2017. Available in:
˂https://www.pubvet.com.br/uploads/1194dfc45f5aee9788c8e7e64d1d4247.pdf˃.
Accessed on: 01 Aug. 2020.
NETO, R. L. de C. S. Viabilidade de projetos de créditos de carbono: uma abordagem sobre as eficiências e os benefícios do mercado de carbono no MDL (Mecanismo de Desenvolvimento Limpo). Monografia de final de curso –
Departamento de Economia, Pontifícia Universidade Católica Do Rio De Janeiro,
2009. Available in: ˂http://www.econ.puc-
rio.br/uploads/adm/trabalhos/files/Renato_Luiz_de_Castro_Santos_Neto.pdf˃.
Accessed on: 25 Sept. 2020.
OLIVEIRA, R. 2018. Noticias automotivas: GNV vale a pena?. Available in:
˂https://www.noticiasautomotivas.com.br/gnv-vale-a-pena/˃. Accessed on 14 Sept.
2020.
OLIVEIRA, R. 2020. Renault Master 2020: preço, consumo, revisão, motor (e detalhes). Available in: ˂https://www.noticiasautomotivas.com.br/renault-master/˃.
Accessed on: 27 Sept. 2020.

100
PASSOLONGO, R. Avaliação termodinâmica, termoeconômica e econômica da integração de sistemas de gaseificação da biomassa em uma usina sucroalcooleira. Dissertação (Mestrado em Engenharia Mecânica) – Universidade
Estadual Paulista “Julho de Mesquita Filho”, Ilha Solteira, 2011. Avialable in:
˂https://repositorio.unesp.br/bitstream/handle/11449/88865/passolongo_r_me_ilha.p
df?sequence=1&isAllowed=y˃. Accessed on: 21 Sept. 2020.
PEIXE, V. P. Análise da viabilidade técnica e econômica da queima do biogás em uma usina sucroenergética. Dissertação (Mestrado Profissional em Inovação
Tecnológica) – Universidade Federal do Triângulo Mineiro, Uberaba, 2018.
PENN STATE EXTENSION. College of Agricultural Sciences. 2012. A short history of anaerobic digestion. Available in: ˂https://extension.psu.edu/a-short-history-of-
anaerobic-digestion˃. Accessed on: 07 Mar. 2020.
PENN STATE. 2018. College of Eart and Mineral Sciences. EGEE 439, Alternative
Fuels from Biomass Sources: Anaerobic digestion. Available in: ˂https://www.e-
education.psu.edu/egee439/node/727˃. Accesed on: 10/04/2020. Accessed on: 16
Mar. 2020.
PEREIRA; E. R.; DEMARCHI; J. J. A.; BUDIÑO, F. E. L. 2009. BIODIGESTORES – Tecnologia para o manejo de efluentes da pecuária. Available in: ˂
http://www.iz.sp.gov.br/pdfs/1255981651.pdf˃. Accessed on: 03 June 2020.
PORTORIO. 2019. Kit GNV tudo o que você precisa saber. Available in:
˂https://portoriognv.com.br/kit-gnv-tudo-o-que-voce-precisa-saber/#˃. Accessed on
14 Sept. 2020.
REIS, L. 2020a. CIBiogas. Biogás no Brasil, história e perspectiva de futuro. Available in: ˂https://cibiogas.org/blog-post/biogas-no-brasil-historia-e-perspectiva-
de-futuro/˃. Accesed on: 22 Mar. 2020.
REIS, L. 2020b. CIBiogas. Produção de Biogás: o que são biodigestores e como produzir biogás?. Available in: ˂https://cibiogas.org/blog-post/producao-de-biogas-
o-que-sao-biodigestores-e-como-gerar-biogas/˃. Accessed on: 04 June 2020.
REVISTA O MECÂNICO. 2019. Alimentação: Instalação do Kit GNV de 5ª Geraçã. Available in: ˂https://omecanico.com.br/ed-296-alimentacao-instalacao-do-
kit-gnv-de-5-geracao/˃. Accessed on: 05 Sept. 2020.
101
RICO, J. 2019. Biogas: Solo se aprovecha el dos por ciento del potencial mundial de producción de biogás. Available in: ˂https://www.energias-
renovables.com/biogas/solo-se-aprovecha-el-dos-por-ciento-20190717˃. Accessed
on: 09 June 2020.
RIO, R. S. Compostaje Red Española. De residuo a recurso: El camino hacia la sostenibilidad. Madrid: Mundi Prensa. 2014. p.111. E-book. Available in:
˂https://books.google.com.br/books?id=7b3-
CAAAQBAJ&pg=PA111&lpg=PA111&dq=cuales+son+los+nutrientes+para+una+dig
estion+anaerobica&source=bl&ots=OscN1kfFdy&sig=ACfU3U0Y_kxYaWoXxoRIvSL
iX20htrg8rg&hl=es&sa=X&ved=2ahUKEwj3jc__kOLpAhWtG7kGHVj3DmIQ6AEwBX
oECAwQAQ#v=onepage&q=cuales%20son%20los%20nutrientes%20para%20una
%20digestion%20anaerobica&f=false˃. Accessed on: 28 Apr. 2020.
RULSEH, T. J. 2015. Q&A: learn about the tecon biogas storage system. Available in:
˂https://www.tpomag.com/editorial/2015/05/qa_learn_about_the_tecon_biogas_stor
age_system˃. Accessed on: 29 Sept. 2020.
SCARLAT, N.; DALLEMAND, J.F.; FAHL, F. 2018. Biogas: Developments and perspectives in Europe. Available in:
˂https://www.sciencedirect.com/science/article/pii/S096014811830301X˃. Accessed
on: 06 Mar. 2020.
SEEG. 2019. BRASIL. Sistema de Estimativa de Emissões de Gases de Efeito
Estufa. Context. Retrieved from: ˂http://seeg.eco.br/en/contexto˃. Accessed on: 15
Apr. 2020.
SGC. SWEDISH GAS TECHNOLOGY CENTRE. 2nd Ed. Malmö: author. 2012.
Basic data on biogas. E-book. Available in:
˂http://www.sgc.se/ckfinder/userfiles/files/BasicDataonBiogas2012.pdf˃. Accessed
on: 04 June 2020.

102
SILVA, A. R.; CIRANI, C. B. S. 2016. Viabilidade econômica e benefícios ambientais
de tecnologia aplicada a biodigestores em empresas processadoras de mandioca do
Paraná. Revista Eletrônica de Estratégia & Negócios. Florianópolis, v.9, n.3,
set./dez. 2016. Available in:
˂http://www.portaldeperiodicos.unisul.br/index.php/EeN/article/view/3846/pdf˃.
Accessed on: 15 Oct. 2020.
SOAGE, N. 2018. ABC Motor: Qué tienes que hacer para adaptar tu coche a gas. Available in: ˂https://www.abc.es/motor/reportajes/abci-tienes-hacer-para-
adaptar-coche-201712291626_noticia.html˃. Accessed on: 03 Oct. 2020.
SOARES, M. 2017. Imagem que compara combustíveis sob dilma e temer distorce preços. Available in: ˂https://www.aosfatos.org/noticias/imagem-que-
compara-combustiveis-sob-dilma-e-temer-distorce-precos/˃. Accessed on 01 Sept.
2020.
SOARES, R. C.; SILVA, S. R. C. M. Evolução histórica do uso de biogás como combustível. 2010. Available in:
˂http://www.congressos.ifal.edu.br/index.php/connepi/CONNEPI2010/paper/viewFile
/843/570˃. Accessed on: 06 Mar. 2020.
SPECK, R. A. Geração e aproveitamento energético de biogás pela biodigestão de manipueira – Um estudo de caso. Dissertação (Mestrado em Tecnologia de
Bioprodutos) – Universidade Federal do Paraná, Palotina, 2019. Available in:
˂https://acervodigital.ufpr.br/bitstream/handle/1884/65520/R%20-%20D%20-
%20RAFAEL%20ANGELO%20SPECK.pdf?sequence=1&isAllowed=y˃. Accessed
on: 17 Apr. 2020.
SUÇUARANA, M. S. 2016. Biodigestores. Available in:
˂https://www.infoescola.com/energia/biodigestores/˃. Accessed on: 01/04/2020.
IPCC. Climate Change 2014: Synthesis Report. Contribution of Working Groups I, II and III to the Fifth Assessment Report of the Intergovernmental Panel on Climate Change. Geneva, Switzerland: L.A. Meyer, 2014. Available in: ˂
https://archive.ipcc.ch/pdf/assessment-
report/ar5/syr/SYR_AR5_FINAL_full_wcover.pdf˃. Accessed on: 09 Nov. 2020.
103
TAKAR, T. 2018. Gás natural em caminhão economizaria R$ 1 em vez de R$ 0,46; o que impede? Available in: ˂
https://economia.uol.com.br/noticias/redacao/2018/08/04/caminhao-gas-natural-
mais-economico-diesel.htm˃. Accessed on: 08 Nov. 2020.
THE UNIVERSITY OF EDINBURGH. 2020. School of engineering: biogas upgrading to biomethane by pressure swing adsorption. Available in: ˂https://www.eng.ed.ac.uk/studying/postgraduate/research/phd/biogas-upgrading-
biomethane-pressure-swing-adsorption˃. Accessed on: 29 Sept. 2020.
USAID. 2019. Greenhouse gas emissions factsheet: Brazil. Available in:
˂https://www.climatelinks.org/sites/default/files/asset/document/2019_USAID_Brazil
%20GHG%20Emissions%20Factsheet.pdf˃. Accessed on: 14 Apr. 2020.
WEATHER ATLAS. 2020. Monthly weather forecast and climate Curitiba, Brazil. Available in: ˂https://www.weather-atlas.com/en/brazil/curitiba-climate˃. Accessed
on: 17 June 2020.
WORLD BANK GROUP. 2020. State and trades of carbon pricing, Washington DC, May 2020. Available in:
˂https://openknowledge.worldbank.org/bitstream/handle/10986/33809/97814648158
67.pdf?sequence=4&isAllowed=y˃. Accessed on: 22 Sept. 2020.
WORLD BIOENERGY ASSOCIATION (WBA). 2019. Global bioenergy statistics 2019. Available in:
˂https://worldbioenergy.org/uploads/191129%20WBA%20GBS%202019_HQ.pdf˃.
Accessed on: 10 June 2020.
YABE, A. ; DUQUE, D.; SILVA, G. B.; PEREIRA, J. A.; FREITAS, M. L. Biogás de
resíduos agroindustriais: panorama e perspectivas. In: ______. Biogás. BNDES
setorial 47. 2018. p.221-276. Available in:
˂https://www.saneamentobasico.com.br/wp-
content/uploads/2020/02/BS47__Biogas__FECHADO.pdf˃. Accessed on: 20 Apr.
2020.
ZAFAR, S. (2019). BioEnergy Consult: Methods for hydrogen sulphide removal from biogas. Available in: ˂ https://www.bioenergyconsult.com/hydrogen-sulphide-
removal-from-biogas/˃. Accessed on: 05 Oct. 2020.

104
ZAVADINACK, M. Perspectiva da produção de biogás no estado do Paraná. -
Trabalho de Conclusão de Curso (Bacharel em Engenharia Florestal) – Setor de
Ciências Agrárias, Universidade Federal do Paraná, Curitiba, 2016. Available in:
˂https://acervodigital.ufpr.br/bitstream/handle/1884/45578/MURILO%20ZAVADINAC
K.pdf?sequence=1&isAllowed=y˃. Accessed on: 17 Apr. 2020.

105
ANNEX 1 – CONATUS ENERGIAS RENOVÁVEIS LTDA QUOTATION
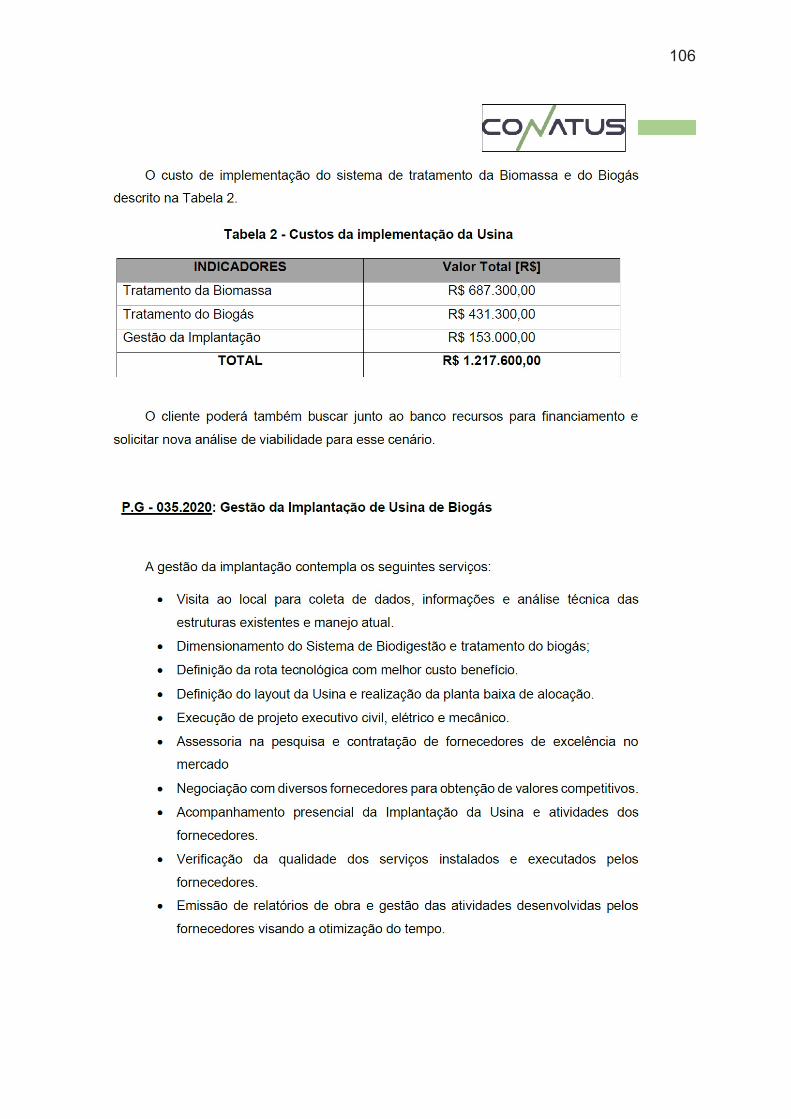
106

107

108
ANNEX 2 – HISTORICAL SELIC RATES 2020
MEETING PERIOD SELIC RATE
N° START - END (% per year)
232 06/08/2020 - 16/09/2020 1.9
231 18/06/2020 - 05/08/2020 2.15
230 07/05/2020 - 17/06/2020 2.90
229 19/03/2020 - 06/05/2020 3.65
228 06/02/2020 - 18/03/2020 4.15
227 12/12/2019 - 05/02/2020 4.40


