

Illinois State University Illinois State University
ISU ReD: Research and eData ISU ReD: Research and eData
Theses and Dissertations
6-4-2015
Feasibility study of an alternative approach to recycle shipping Feasibility study of an alternative approach to recycle shipping
containers containers
Tofig Mammadov Illinois State University, [email protected]
Follow this and additional works at: https://ir.library.illinoisstate.edu/etd
Part of the Business Administration, Management, and Operations Commons
Recommended Citation Recommended Citation Mammadov, Tofig, "Feasibility study of an alternative approach to recycle shipping containers" (2015). Theses and Dissertations. 433. https://ir.library.illinoisstate.edu/etd/433
This Thesis is brought to you for free and open access by ISU ReD: Research and eData. It has been accepted for inclusion in Theses and Dissertations by an authorized administrator of ISU ReD: Research and eData. For more information, please contact [email protected].

FEASIBILITY STUDY OF AN ALTERNATIVE
APPROACH TO RECYCLE SHIPPING
CONTAINERS
Tofig Mammadov
118 Pages August 2015
In this research, the author proposes to study the feasibility of applying ISO
shipping containers as alternative construction materials. Using retired shipping
containers for dwellings, offices or other construction purposes is an environmentally
friendly idea. The “green generation” constitutes a battle against harmful effects of
industrial developments. Motivated by the green movement, this research addressed the
recycling of shipping containers in the construction market. Particularly, this research
studied the recycling of shipping containers for the purpose of student housing
construction.
The design and justification of the implementation of the innovative construction
materials was achieved through the application of Building Information Modeling (BIM)
systems. The research contribution includes the analysis of the feasibility of the
application of the alternative structural components. This research discussed the
development of an alternative sustainable method of construction. The author studied if
the application of shipping containers as a structural component of a building can
significantly reduce construction cost in addition to the decrease of

energy consumption. The author found that it is feasible to use shipping containers to
develop midrise student residences with 4-7 stories living quarters.

FEASIBILITY STUDY OF AN ALTERNATIVE
APPROACH TO RECYCLE SHIPPING
CONTAINERS
TOFIG MAMMADOV
A Thesis Submitted in Partial
Fulfillment of the Requirements
for the Degree of
MASTER OF SCIENCE
Department of Technology
ILLINOIS STATE UNIVERSITY
2015

© 2015 Tofig Mammadov

FEASIBILITY STUDY OF AN ALTERNATIVE
APPROACH TO RECYCLE SHIPPING
CONTAINERS
TOFIG MAMMADOV
COMMITTEE MEMBERS:
Haiyan Xie, Chair
Klaus Schmidt
Pranshoo Solanki
i
ACKNOWLEDGMENTS
It was an honor for me to work on the research, through which I learned so much
about construction and the technology of Building Information Modeling. I was inspired
and motivated to keep working on the research by the Lord, my God, who never left me.
His presence and support was noticeable throughout the years of my study. To Him, I am
most thankful.
I want to express special thankfulness to the Chair of my thesis committee, Dr.
Haiyan Xie. It is even hard to appreciate enough for all the efforts she invested in this
research. God bless her heart. I also want to appreciate Dr. Klaus Schmidt for his timely
and wise recommendations and his support during the time of this research. I am grateful
for Dr. Pranshoo Solanki, who supported me while developing the structural design for
the research.
I thank the managerial personnel of Young America Realty, Inc. and Crosswalk
Project, Inc., who so generously provided me with the information regarding the
properties they manage. I am thankful to Bob Lukowski, the rental coordinator at Great
Lakes Kwik Space, who agreed to conduct a phone interview with me regarding the
prices of retired shipping containers.
Finally, I want to write a few sentences about dedication of the current research.
In this day and age it is crucial to help American students to understand that there are
other than using alcohol and prohibited drugs ways to spend their leisure time. A lot of

ii
times lack of life experience limits college students to foresee future consequences of
their actions. Therefore this thesis is mainly dedicated to motivate property developers
who deal with student housing to care not only about their profits, but also about college
students by providing them with an option to live in a place where their social and
spiritual values can be developed and strengthened.
T. M.
iii
CONTENTS
Page
ACKNOWLEDGMENTS i
CONTENTS iii
TABLES vi
FIGURES viii
CHAPTERS
I. INTRODUCTION 1
Problem Statement 1
Proposed Alternative Approach 3
Research Question and Significance 5
Quantification of the Project 7
II. LITERATURE REVIEW 9
Student Residence Types 9
Sustainable Architecture 11
Building Information Modeling 13
Thermal Properties of Materials 15
Energy Consumption and Parametric Simulations 16
Return Evaluation 18
Simple Payback Method 18
Time Value of Money 19
Discounted Payback Method 19
Shipping Containers’ Structural Integrity 19
III. METHODOLOGY 22
Materials, Tools, Software and Data 22

iv
Application of Autodesk Revit Architecture 22
Simulation Process 24
Economic Analyses of the Residence 24
Data 25
Research Limitation 27
Chapter Summary 27
IV. RESEARCH DESIGN 29
Case Study 29
Residence Design Methodology 34
Design and Modifications 34
Insulation 39
The HVAC, Plumbing, Electrical and Fire Sprinkling
System Design 42
Connections 44
Structural Design 46
Building Foundation and Load Bearing Model 52
Gym, Fellowship Hall, and Studying Rooms Design 57
Model for Economic Analysis 59
V. DATA, ANALYSIS AND CONCLUSION 62
Budget Estimates 62
Energy Consumption Estimates 67
Construction and Energy Data Analysis 70
Financial Data 72
Economic Analysis 73
Recommendations for Future Research and Conclusion 76
REFERENCES 78
APPENDIX A: Justification of the Student Housing With Community Fellowship
Elements 82
APPENDIX B: Interviews 84
APPENDIX C: Case Studies 90
APPENDIX D: Residence Budget Estimate 96
APPENDIX E: Financial Analysis 112

v
APPENDIX F: Distributions of NPV Generated Through Monte Carlo Simulation 116
APPENDIX G: Construction and Insulation Materials R Value 118

vi
TABLES
Table Page
1. National Center for Education Statistics, Number of Admissions 7
2. Comparison of Container’s Components Durability against General Wind
Loading Requirements 21
3. Adjusted Construction Cost of Analyzed Properties 31
4. General Information about Analyzed Properties and Their Analytical
Coefficients 32
5. Specification of Dimensions and Weights of Shipping Containers 34
6. Insulation Requirements for Zone#5 39
7. Insulated Wall Assembly’s R Value 41
8. R Value of The Roof that is above Shipping Containers 42
9. R Value of The Roof that is not above Shipping Containers 42
10. Dead and Life Load Table 55
11. Load Applied per Load Bearing Components 56
12. Assumptions for Economic Analysis 59
13. Derivation of Monthly Rental Price per Bed 60
14. Other Components of Economic Analysis 61
15. Complete Budget Estimate of the Student Residence 66
16. Case Studies’ Energy Simulation Results 67

vii
Table Page
17. Energy Simulation Results of Covington Apartments 69
18. Alternative Student Residence Energy Simulation Results 70
19. Comparison Analysis of General Data of Alternative Residence 71
20. Derivation of Monthly Rental Price per Bed with Alternative
Student Residence Included 72
21. Monte Carlo Simulation Results #1 75
22. Sensitivity Analysis for Associated Increase in Return of Investments 75
23. Monte Carlo Simulation Results #2 76

viii
FIGURES
Figure Page
1. 20’ ISO Shipping Container’s Elements 20
2. Apartment Layout (Plan View) 36
3. Apartment Layout (Perspective View) 37
4. First Modified 40’ Shipping Container 37
5. Second Modified 20’ Shipping Containers 37
6. Third Modified 40’ Shipping Container 38
7. Apartment’s Conventional Flooring for Bathroom Area 39
8. Insulated Wall (Plan View) 41
9. Ceiling Drop in a Hall (Cut View) 43
10. Apartment Ductwork 43
11. Plumbing System 44
12. Containers Stacked on Connection Device 45
13. Double Ended Twist Lock 45
14. Double Ended Twist Lock Dimensions 46
15. Residence (Plan and Elevation Views) 47
16. Structural Framing (Plan View) 47
17. Structural Framing (3D view, 2nd, 3rd, and 4th levels) 48

ix
Figure Page
18. Recreational Area Floor Design 48
19. Fellowship Hall, Floor Framing (Plan View, Level 4) 49
20. Fellowship Hall, Floor Framing (3D View, Level 4) 49
21. Elevator Shaft Design 50
22. Stairwell Concrete Structure 50
23. Stairwell Design 50
24. Wood Framing on Structural Concrete as a Roof Support 51
25. Roof above Fellowship Hall Design 51
26. Roof above Shipping Containers Design 52
27. Foundation Design (Plan View) 53
28. Foundation Design (3D View) 53
29. Recreational Area (Plan View) 57
30. Fellowship Hall (Render) 57
31. Fellowship Hall (Plan View) 58
32. Studying Rooms (Plan View) 58
33. Studying Rooms (Render) 59
34. 3D View of the Residence with Siding 65
35. The Lodge on Willow Energy Model 69
36. Covington Apartments Energy Model 69
37. Crosswalk Commons Energy Model 70
38. Normally Distributed Inflation 73
1
CHAPTER I
INTRODUCTION
Problem Statement
The United States of America is one of the top education providers in the
world (Ranking Web of Universities, 2014, January). Student housing has developed for
almost four centuries since approximately 1650. Today, education it is a multi-billion
dollar business in the United States. Drummer (2013) stated in his report that investors
and developers spent millions of dollars on student housing or dormitory buildings.
Housing characteristics and options affect consumer choices. For example, the
characteristics of student housing include the number of bedrooms or bathrooms of a
house, the age of the building, or the distance from the building to the campus. College
students and their parents consider all the features of the options and select the ones that
fit their needs.
In this research, an off-campus area of Illinois State University (ISU) is
considered for detailed analysis. ISU is located at the town of Normal in Illinois.
According to the demographics of 2014, the total population of the town was 52,497 (US
Census, 2015). In 2014, the total student population in ISU was 19,924 (ISU, 2015),
which was 37.95% of the town’s total population. Hence, student housing in Normal, IL,
is one of the essential parts of local realty business.

2
After the development for many decades, the town hardly has any vacant space
for new projects. From the real estate perspective, a similar situation can be observed
around many other college campuses in the United States. For that reason, property
owners invest millions of dollars in reconstruction and remodeling of the existing units of
student housing.
Many of the investors of the student housing projects are interested in making
changes to the inside of the buildings. Although the properties will appear new and
attractive from the inside, their exterior appearances would still be old or even weathered.
Many student-housing properties still don’t have centralized and efficient cooling and
heating systems. The properties may need the perimeter wiring for Internet to go all-
around the buildings, .It is hard to balance the need to increase the amount of bathrooms
and the requirement to maintain the other useful areas in those apartments. The decision
of reducing the size of one area to improve the function of another may cause challenges.
Though there are a lot of constraints regarding the aforementioned investments, property
owners still do not want to demolish their old (but still profitable) buildings and build
modern, efficient, and environmental-friendly buildings. Newly-constructed student-
housing usually has a significantly higher rental price than that of an old building. The
associated risk for the owners of the properties is that they may have difficulties leasing
their new projects. Therefore, property owners often prefer to just keep maintaining their
old buildings.
In Normal, Illinois, large realty businesses that are dealing with student
housing, such as First Site and The Flats, are trying to conquer the commercial areas that
are relatively close to campuses for their new multimillion-dollar projects. For example

3
in 2014, First Site Company completed the new Uptown North project near the ISU
campus; the Flats Company completed their third student-apartment building at 709
South Main Street. Both projects were approximately 5 minutes walking distance from
campus. The main reason that those companies were able to develop those new projects
is that they were able to tolerate the relatively small margins. Compared to the average
monthly rental payments around ISU campus, which are $400-$450 for old construction
(Realtor.com, n.d.), the minimum charge of Uptown North is $709 per month (First Site,
n.d.). The substantial difference in price is the main reason that property owners do not
want to start new construction, but keep updating the existing ones instead. This research
suggests examining the alternative construction methodologies against the traditional
ones for the purpose of encouraging new, comfortable, affordable, and environmentally-
friendly buildings. The research has possibly the social impact in helping college students
to reduce their financial burden. Many students undertake huge loan debts for higher
education. After graduation, many are struggling to pay off their student loans, which
significantly affects their lives. That also causes a lot of stress after graduation.
Sometimes people may need to spend 10 or more years to clear off their student-loan
debts. However, if housing expenses were reduced, it would reduce the pressure of
paying back loans.
Proposed Alternative Approach
Herr (2011) estimated that over 17 million shipping containers are scattered all
around the world (Herr, 2011). However, due to the economic instability of recent
decades, there is a surplus on the shipping container market. There are around 1 million
containers sitting unused (HL Design Group, 2010). Although the main purpose of using

4
shipping containers is the transportation of goods, containers are found to be useful in
many other ways.
The main benefits of steel shipping-containers are their durability and the
ability to be modified for numerous uses. Containers are made to endure extreme loads
and heavy wear and tear (Zuiderwyk, 2014). Built from weathering steel, containers can
resist harsh environments, such as weather or salt corrosion etc. (HL Design Group,
2010).
The use of retired containers in affordable construction is growing
exponentially for the following reasons: (1) it seems to be cheaper to build houses using
containers; (2) the durability and strength of containers make them an ideal structural
component of a building; (3) containers are made according to standard measurements,
which simplifies design, planning, delivery, and assembly; (4) due to its simplicity in
construction, container buildings can be finished up to 40% faster comparing to
traditional construction (HL Design Group, 2010); (5) because of its structural strength,
containers are ideal for multi-story dwellings.
Giriunas, Sezen, and Dupaix (2012) provided research about the structural
integrity of both modified and non-modified containers. Their research offered
information about the structural strength of containers and mentioned that shipping-
container buildings can be economical, durable, and fast to.
Although it seems to be a brilliant idea to use shipping containers in
construction, a lot of developers prefer not to deal with them for the following concerns:
A building made out of shipping containers requires special insulation due to thermal
conductivity of steel. It’s rough-in works for heating and cooling system, plumbing and

5
electrical, and in some cases sprinkling systems can take a lot of efforts. The rough-in
work requires steel-cutting which is very expensive. Design flexibility is another issue.
The building design is restricted to the cubic shape of containers. In some cases floors of
shipping containers treated with harmful chemicals that need to be removed.
Research Question and Significance
The question of current research is whether shipping containers could be used
to replace the traditional structural components and construction materials for student
housing projects.
Without proper insulation, the high thermal conductivity of steel can result in
raised energy cost of a building. This can significantly increase utility expenses, which in
turn increases the life-cycle cost of the residence. The production of steel material is also
energy intensive. An enormous amount of energy is required by the metallurgical
industry (Sultanguzin, Isaev, & Kurzanov, 2010). Steel is a very common material that is
used for making structural components of a building. Based on the amount of CO2 that is
formed due to annual steel production, the industry generates 5-25 million tons of
greenhouse gases (Sultanguzin, Isaev, & Kurzanov, 2010). The energy consumption is
more crucial now than ever and will be even more important as energy sources continue
to be exhausted by the worlds’ dependence on resources of energy suppliers (Estes,
2011).
The application of shipping containers as a structural component of a building
can reduce the market’s demand for structural steel and therefore reduce the amount of
environmental pollution. Another significant aspect of the research is the potential to
satisfy student housing demand. Table 1 shows that based on the data provided by the

6
National Center for Education Statistics (n.d.), on average, the universities in the US
admit 164,872 more students each year. The 20th Annual Residence Hall Construction
Report showed that median price of Construction Cost per Resident in 2008 is $35,124
(Argon, 2008). Therefore, the student-housing industry potentially requires $5.8 billion
annual investment into new construction. A reduction of the Cost/Resident ratio by 1%
will save $58 million in investments. In addition, the research significance is also
reflected in the fact that current research will equip housing developers with valid
methodologies to evaluate alternative construction materials. The third significant aspect
of this research is that concepts of sustainability can be integrated in prefabricated
construction without harming the affordability of it.
In summary, if the usage of shipping containers as a structural component of a
building does not increase energy consumption and results in a reduction of construction
costs and faster project delivery, the adoption of the methodology and design can benefit
society in three main directions: (1) reduction of environmental pollution through
reduction of demand on structural steel; (2) property owners can be motivated to start
new construction with higher density dwelling to help to meet student housing demand;
(3) reduction of unutilized shipping containers.

7
Table 1. National Center for Education Statistics, Number of Admissions.
Year Number of Admissions Growth Rate
2002 3,017,870
2003 3,172,478 5.12%
2004 3,276,922 3.29%
2005 3,418,336 4.32%
2006 3,571,114 4.47%
2007 3,734,199 4.57%
2008 3,934,730 5.37%
2009 4,178,895 6.21%
2010 4,295,306 2.79%
2011 4,407,954 2.62%
2012 4,575,888 3.81%
2013 4,776,460 4.38%
Average 3,863,346 4.27%
Average Annual Increase* 164,872
Note: Average Annual Increase is Average Number of admissions
multiplied by Average Growth rate.
Quantification of the Project
Developers pay close attention to the return of a project. They must understand
each investment so that they are able to make educated decisions. Companies hesitate
with alternative constructions due to the large set of uncertainties. Using the concept of
Building Information Modeling (BIM) and computerized analysis, it is possible to design
construction projects as parametric models. The BIM models are parametric models,
which help not only in visualization of the projects, but also show very detailed project
timelines and budgets. Integrated systems of schedules and quantity takeoffs serve as a
solid base for computer aided project management. Moreover, modern technologies can
make energy consumption simulations on heating and cooling systems. These
technologies provide developers with powerful tools for conducting comparisons and
analyses and help them make educated decisions regarding their future projects. In
8
addition to the comparison analyses this research offers to developers some economic
analyses that will help to evaluate returns on their investments.
Some of those methods will be discussed further in Chapters II and III. In
Chapter II, along with the discussion about different types of student housing, sustainable
architecture, and BIM concepts, the author reviews methodologies to evaluate financial
returns. The author also provided some discussions about the structural integrity of
shipping containers and the energy simulation techniques in Chapter II. In Chapter III,
the author discussed the research methodology and the limitations of this research. In
Chapter IV, the author provided the description of the design of the parametric model of
student residence. He provided the description of three case studies for comparison
analysis. In Chapter V, the author analyzed the data for the research and arrived at the
conclusion.

9
CHAPTER II
LITERATURE REVIEW
Student Residence Types
There are four widely-used student-housing types: (1) dorms or residence halls,
(2) student apartments, (3) private houses, and (4) community houses. Usually
universities provide dormitory service as an accommodation for freshmen or international
students. Dorm life is often dynamic and noisy - for example, neighbors, friends and
visitors come and go throughout a day; the social aspect of dorm life means that students
would not feel lonely, but it also cuts into their studies (Frost, 2014). Dorms typically are
more expensive comparing to other accommodations of student housing. Therefore, most
of the students living in dorms switch to other types of living facilities once they are no
longer considered as a freshman.
College students need to consider a lot of things before making decisions on
accommodations. Such decision can be arrived after comparing location, physical
condition, number of roommates, number of bathrooms, bedroom size and so on (Riker
and DeCoster, 2008). Most students are found to live in apartment buildings, simply
because that type of student residences are prevailing around college campuses.
There are several reasons why developers chose to build apartment buildings.
One of them is that it allows higher density of tenants, comparing to private housing.
10
However, density of tenants is not the only factor that developers are concerned while
making a decision about their future projects. Although community housing allows even
higher density of tenants, developers are very hesitant to build that type of housing, and
the following paragraph describes the main one.
There are two types of community houses that are well-known in the United
States: fraternity and sorority houses (Greek membership organizations). Although the
goal of those communities is to enhance members’ educational experience by
emphasizing intellectual, interpersonal and social development, they are known for their
“partying” life style (Page and O’Hegarty, 2006). Page and O’Hegarty (2006) surveyed
college students consistently and concluded that fraternity and sorority members reported
heavier and more problematic drinking patterns than the general college population.
Therefore, that type of student housing is known for property abuse problems. For that
reason it considered harder to maintain and develops hesitant attitudes of developers
while making decisions about their new projects. Appendix B contains interview with
local realty company manager, who another time supports this idea.
Frederiksen (1979) was emphasizing the significance of a student residence
being developed not only as a place for students to eat and sleep, but also as a place that
promotes students personal, scholastic, and social improvement through guided group
living. Wallace (2012) in his research examined a philosophy of student housing, how it
affects students’ personal and intellectual growth, and development of a sense of
community. He emphasized that housing management must develop a programs that
supports living environment in which students’ behavior is considered, and learning can
take place (Wallace, 2012).

11
DeCoster and Mable (1974) stressed that physical nature of a residence highly
contributes to student interaction and academic achievements. A few decades later Riker
and DeCoster (2008) stressed that the educational role in college housing was found in
two very basic but important assumptions. They are listed as follows: (1) environment
influences behavior; and (2) learning is a total process. Riker and DeCoster (2008)
showed that physical facilities can support educational process and contribute in
important ways to student learning. That develops an idea that students need appropriate
study, fellowship and recreational areas within their residences. The second assumption
of Riker and DeCoster (2008) states the necessity to develop a students’ personality and
intellectual capacities and help students to grow culturally, spiritually and
psychologically in societies and avoid isolation. Appendix A and Chapter 4 provide
further deliberations on how to meet mentioned in this section recommendations for
student housing.
Sustainable Architecture
Nowadays sustainable design is probably one of the hottest topics. Enormous
amount of research have been done in that area. Keitsch (2012) stated that sustainable
architecture challenged new and ingenious architectural design at various levels. Spheres
of contemporary research in sustainable design include minimizing the negative
environmental impact of buildings by enhancing efficiency and moderating the use of
materials, energy and development space (Keitsch, 2012). Keitsch (2012) stated that
sustainable architecture shall be well built, easy to use, and beautiful. But it is still hard to
determine a set of characteristics that would clearly recognize one structure as sustainable
and another as not sustainable (Maxman, 1993). Maxman (1993) emphasized -
12
“Sustainable architecture isn’t a prescription. It’s an approach, an attitude. It shouldn’t
really even have a label. It should just be architecture”.
In architecture design, sustainability is a way to reduce houses’ impacts to the
environment (Keitsch, 2012). Edwards and Hyett (2002) stated that it was not what
buildings were but what they did and how they did it that was the major concerns to
sustainable development. Housing is often identified as a reasonable contributor to
concerns about energy consumption (Estes, 2011). Due to those concerns the technology
market constantly tries to provide new technologies that are safe, efficient in energy
consumption, and with reduced environmental impacts (Marsh, 2010). Governments
provide guidance for these concerns which calls attentions from designers and engineers
to implement sustainable technologies (Marsh, 2010).
Meanwhile, the technology market was so concerned with producing energy
efficient tools and energy generating systems, some researches came to conclusion that
different behavioral patterns can significantly reduce efficiency of those innovations
(Guy, 2000). Example of using Compact Fluorescents (CFL) versus Light Emitting
Diodes (LED) can give better understanding how user behavior affects efficiency. LED is
considered extremely efficient lightening tool. But if there are two different users that
behave differently, then even inefficient CFL can last longer in the hands of efficiently
behaving user as appose to efficient LED in the hands of inefficiently behaving user. This
issue raised a new wave on the technology market. Researchers started to pay attentions
to users’ behavior factors during technology development process. For example, motion
sensors would be a good solution to prevent over-usage of artificial lighting in houses.

13
Building Information Modeling
Architectural Design is not an easy task. In the conceptual design or design
development processes, designers and architects might make a lot of mistakes. And those
mistakes might be due to the lack of information or professionalism of the design team.
Currently, computer model integration helps people to reduce errors and increase
performance of the design and development process (Merschbrock & Munkvold, 2012).
Software programs allow architects to hand-draw their ideas on paper and scan them into
digital pictures start CAD drawings. With the increasing use of iPads and other tablet
computers, designers can use the touch screen as paper and directly draw plans on the
screens. Three dimensional modeling helped designers and architects to reduce time
spend on sketching. Another significant benefit of 3D design is that it becomes easier to
handle changes in design. There is no need to redraw all the drawings if a design is
changed. With that aid, architect makes changes in one drawing and those changes
automatically would be adjusted to all other drawings.
In the last few decades, construction world was able to observe significant
involvement of Information Technologies (IT) in construction design (Merschbrock and
Munkvold, 2012). Traditional paper-based approach was shifted into two-dimensional
Computer Aided Design (CAD) and then the later one was shifted into three-dimensional
technologies (Merschbrock and Munkvold, 2012). However, even three-dimensional
technologies were not sufficient to meet the great needs of the construction industry.
Building Information Modeling (BIM) technology can answer the demand for something
more powerful than just visualization. Merschbrock and Munkvold (2012) discussed that
BIM could be best described as a IT tool made to design virtual models that present
14
physical and functional characteristics of it. According to Kensek and Noble (2014), BIM
has gained rapid acceptance in architecture and engineering schools, by building design
and delivery professions, by the manufacturing and construction industries, and by
building owners and managers. The main purpose of BIM is to integrate knowledge from
various project participants that traditionally work in different phases of the building and
maintaining processes.
Sebastian (2010) discussed that, the decisions made during design phase
affected, on average, 70% of the life-cycle cost of a building. It is essential for
collaborative design to rely on multidisciplinary knowledge for a building’s life cycle.
Traditionally, construction design services were delivered by multiple organizations
when each party prepared paper drawings to cover one’s particular area of expertise
(Merschbrock and Munkvold, 2012). Using digital BIM platforms allows designers to
associate data with geometry. Through that, designers can build parametric models for
building design. BIM system developers designed the platforms so that architects,
structural engineers, electrical engineers, plumbing and ventilation engineers, landscape
architects, construction firms, and specialized subcontractors can be involved at design
stage and provide benefits to projects with their knowledge (Merschbrock and Munkvold,
2012).
This methodology of integrated design opened wide horizons in developing
more precise schedules and budgets for projects. Merschbrock and Munkvold (2012)
discussed that in the late 1990s, the term 4D CAD was coined to describe applications
combining BIM and scheduling functionality. Today this technology reached the level
where users can view simulations of their project’s schedule. Follower researchers argued
15
that by linking 4D animated schedules to cost information people can get benefits from
5D BIM.
BIM developers pay close attentions to different energy simulation software.
Kensek and Nobel (2014) argued that there were significant improvements in building
performance simulations over the past two decades. As a result of those improvements
current BIM platforms can conduct not only energy consumption tests which help people
to make optimal lighting solutions but also many other different simulations (i.e., wind
load simulation) that all together contribute to efficient decision-making process.
Examples of widely used BIM software include: Autodesk Revit, Bentley
Systems and Graphisoft. In this research the author will use Revit to develop student
residences and conduct simulations to understand the best choice of materials for that
type of project.
Autodesk Revit allows users to build digital models of their construction
projects. Nassar (2012) mentioned that the use of Revit in construction estimating is
gaining more ground as more contractors are using it to perform detailed construction
estimates. A quantity takeoff is one of the most powerful and promising advantages that
construction market can benefit while using Revit (Nassar, 2012).
Thermal Properties of Materials
Thermal conductivity is an ability of materials to conduct heat. The faster heat
flows through material the higher conductivity it has. Thermal resistance of a material is
calculated as an R-value to show its ability to resist heat flow (Gooch, 2010). It is
measured in hours needed for 1 Btu to flow through 1 ft2 of a given thickness of a
material when the temperature difference is 1ºF (Gooch, 2010). Thicker material has

16
higher R-value than a thin one. U factor is the reciprocal of R-value and usually used for
assemblies Autodesk provides basic information about material’s thermal properties.
Every material used in an envelope assembly has fundamental physical properties that
determine their energy performance such as conductivity and resistance. In order to make
efficient design decisions designers should be aware of these properties.
Energy Consumption and Parametric Simulations
There are several factors that can affect energy consumption, including:
heating-degree days, appliance efficiency, fuel substitution for space and domestic water
heating, windows, energy-efficient lighting and heating, ventilation, air conditioning
(HVAC) systems (Shrestha & Kulkarni, 2013), building envelope shape (Granadeiro, et
al., 2013), and building materials (thermal mass) (Andjelković, et al., 2012). Andjelković,
et al. (2012) concluded that simulation results indicated that by adding thermal mass to
building envelope and structure, the following improvements can be achieved: (1) 100%
of all simulated cases experienced reduced annual space heating energy requirements; (2)
67% of all simulated cases experienced reduced annual space cooling energy
requirements; (3) 83% of all simulated cases experienced reduced peak space heating
demand; and (4) 50% of all simulated cases experienced reduced peak space cooling
demand (Andjelković, et al., 2012).
Construction cost of a concrete building is significantly higher than a building
made out of wood (Mohamad, et al., 2009) or shipping containers. For the energy use in a
building’s life-cycle, it has been estimated that approximately 80% to 90% of energy use
is consumed in the use phase of conventional buildings, while 10% to 20% is consumed
by the material extraction and production and less than 1% is consumed through the end-
17
of-life treatments (Mohamad, et al., 2009). Therefore, when studying the feasibility of
using shipping containers as a cheap source of construction materials, the author will
calculate both the energy consumption to sustain indoor comfort and the construction cost
of using shipping containers as building envelope.
When evaluating new construction materials, reduction of energy consumption
is one of the main requirements (Bolotin, et al., 2013). Because modeling for energy
simulation is a time-consuming task, frequently this process was simply overlooked
(Granadeiro, et al., 2013). Nowadays developers now can receive benefits from all sorts
of simulation software systems.
Examples of simulation software include: Green Building Studio, BEopt,
Building Energy Modeling and Simulation, etc. In this research, the author will use Green
Building Studio (GBS) to simulate energy consumption of a student residence. GBS is an
Autodesk product that allows architects and designers to perform an extended building
energy and water consumption analysis, and helps to make optimal decisions regarding
carbon-neutral building designs (Green Building Studio, n.d.). The functions of GBS
include; (1) it analyzes the entire energy-usage of the systems and provides energy cost
projections; (2) it takes into consideration weather data based on the location of the
project; (3) process is web based, therefore, it simulation process is rapid; (4) it is able to
compare design alternative (Autodesk, n.d.).
Following is the lists of the advantages of GBS web service; (1) interface of
the software is very user-friendly; (2) it saves designers time and effort to calculate a
significant amount of information; (3) all of the simulations are carried out on remote
servers; (4) provided results are easy to understand and can be easily compare with

18
results of different buildings design (Autodesk, n.d.). In the proposed research, GBS’s
ability to provide results for design alternatives is crucial. Using the results, the author
can study how materials with different R-values can affect a building’s annual energy
consumption.
Return Evaluation
Simple Payback Method
Payback method is often used to find a breakeven point for financial analysis.
The method shows how fast investments will be recovered by cash inflows.
Payback = Investment/Annualized Cash Inflows.
Park (1997) mentioned that the payback method evaluates projects on the basis of how
long it took net receipts to equal investment outlays without including any time value
analysis. Usually managers would use this method for its simplicity (Estes, 2011).
However, this method is not profitability metric (Russell, 2009). The simplicity of the
method comes with a significant disadvantage. It assumes that an asset doesn’t
depreciate. In reality an asset depreciates over the time of exploitation. Also there should
be an interest on the money spent on the investment. But payback method doesn’t
consider the interest or the depreciation of an asset.
Narayanan (1985) argued that “managers who use the payback method
apparently prefer projects with quick returns”. He proposed that there were some
instances where only the quickest payback was important to managers. But it may not in
fact be the best for the managers or the company.

19
Time Value of Money
Due to its earning capacity, money available today is worth more than the same
amount in the future. Vanek and Albright (2008) argued that the change in value of
money due to its depreciation over time span called time value of money. Some well-
known time value of money analyses are: internal rate of return (IRR), modified internal
rate of return (MIRR), and net present value (NPV). NVP time value of money method
include: present worth, annual cash flow, future worth, inflation, depreciation, interest
rates (Newnan, et al., 2004).
Discounted Payback Method
Discounted payback method (DPM) is more accurate in predicting time an
investment takes for the owner to break even (Estes, 2011). This method takes into
account time value of money (Estes, 2011). The difference between simple payback and
DPM is that the cost and savings of an investment are discounted in DPM. “DPM is often
correctly used as a supplementary measure when project life is uncertain” (Kreith &
Goswami, 2007). Simplicity is a major advantage of DPM method over other time value
of money analyses. However, Ester (2011) concluded that DPM method and simple
payback method neglect any profit the asset will bring to the company after the
breakeven point is reached.
Shipping Containers’ Structural Integrity
There is very limited literature about feasibility of using shipping containers
for dwelling purposes (Giriunas, Sezen, & Dupaix, 2012). Figure 1 shows the structural
elements of 20’ ISO shipping containers. Containers are designed to make vertical
contact with each other through discrete corner fittings (Cooper, et al., 2003). A safe way

20
to make a multistory building out of containers should take the contact points into
consideration. According to ISO Standard 1496/1, corner post should be able to bear up
to 190 kip loads (Cooper, et al., 2003). Typically a steel corner-post corresponds to the
specification of American Society for Testing and Materials (ASTM) A-572 steel with a
yield stress of 47 ksi (Cooper, et al., 2003). Corner fittings are actively involved in
vertical contact as well. Those elements are made out of A-216 steel with a yield stress of
40 ksi (Cooper, et al., 2003). The maximum load that one corner can bear is 200 kip
(Cooper, et al., 2003). Giriunas, et al. (2012) analyzed shipping container’s structural
integrity under different structural modifications for different loading patterns. Analysis
reveals that non-modified container’s post (under equally distributed loading scenario) is
going to yield only at 212 kip (Giriunas, et al., 2012).
Figure 1. 20’ ISO Shipping Container’s Elements.

21
Table 2. Comparison of Container’s Components Durability against General Wind
Loading Requirements (Residential Shipping Container Primer, n.d.).
20’ container’s capacity Required
Wind loads requirements
(buildings less than 50’ tall)
Side walls 196 psf 20 psf
End wall/doors 370 psf 20 psf
Containers have box shapes and require some modifications when used as
structural components for residential dwellings. There are two main problems when
modifying the structure of a container. The first is that the container may lose its
structural strength. The second is that steel modifications are usually very expensive.
Therefore, in the design of the proposed residence, the author considered the minimum
amount of containers’ structural modifications.
Giriunas, et al. (2012) revealed that with equally distributed loads on the four
corner posts of a container, the complete removal of the end-wall panels and door
assemblies (Figure 1) is the less desirable type of modification compared to the removal
of the side-wall panels. A container with only the side-wall panels removed is able to
withstand the loads up to 212 kip; but a container with the end-wall panels and door
assemblies removed is able to withstand only up to 168 kip (Giriunas, et al., 2012). This
information was considered as a basis for the structural design of the student residence in
this research. The author presented the detailed information of the load-bearing structure
in Chapter IV.

22
CHAPTER III
METHODOLOGY
Materials, Tools, Software and Data
Application of Autodesk Revit Architecture
A construction estimating process can be performed in two steps:
quantification and pricing. Autodesk Revit provides a quantification function. However,
the software does not generate automatic cost estimates. The more details the digital
design can get, the more precise quantity takeoffs of the project will be. Revit still needs
certain level of abstraction of the real building or facility (Nassar, 2012). This means that
some form of cost aggregation has to take place at a certain level (Nassar 2012).
Nassar (2012) listed several cost estimating techniques in his work. However,
he emphasized two basic categories: (1) element based estimation, (2) activity based
estimation. The second type of estimation is a mimic of a real life project where project
managers break down projects into tasks or services and assign materials, labor, and
equipment requirement to each activity. This method provides accurate estimates, but it is
very detailed and requires much effort for the conceptual design stage. Nassar (2010)
discussed the application of RS Means construction data base. This database has cost
elements for tasks based on quantity. It offers information about the crews required for
the performance of certain tasks and their productivities, which allows users to estimate

23
the tasks’ durations. In this research the author will use the data provided by RS Means
database.
Autodesk Revit has the functions of element development. For instance, a wall
creation process consists of several steps. First, a user needs to understand how many
layers a wall should consist of. For example, Revit offers heavy structured walls, such as
2’ 2½’’ thick; and “Exterior - Insulated Concrete Masonry” wall that consists of 7 layers
including 2 layers of concrete masonry, two types of thermal insulation, water resisting
membrane, metal furring, and gypsum. The next step would be to assign function,
material, and thickness to each layer. The element development function of Revit is going
to be used in this research to create desired insulation for exterior walls, floors and roofs
of the residence.
Another helpful feature of Revit is that the software allows the creation of
desired components in the forms of separated families that can be loaded in the
parametric model of the residence. This feature will be used in order to create modified
shipping containers and assign materials to these components.
The consistency feature of Revit allows the different crews that are working on
the design of the parametric model to work independently from each other; and then
share their work with each other. For example, using this feature, civil engineers work on
the development of a project’s structural design. Meanwhile, electrical, plumbing, and
HVAC contractors work on the development of their portions of the project. Eventually
they can submit their portions of the project model to the design coordinator or architect
in form of separate links. Next, an architectural crew links all these separate pieces to the
main model or master file and analyzes the entire project design. This feature of Revit is

24
very helpful if a project file becomes very large in size as new elements are added into it.
In this research, the author will develop three separate files that can be linked to form the
whole residence design.
Simulation Process
After the completion of the 3D models of the residence with all areas and
volumes being defined, the author will perform the energy consumption simulations. It is
a web-based external building performance simulation that is performed using GBS. GBS
is a web-based application which can analyze gbXML type files that are exported form
Autodesk Revit. All the building geometry comes from the Revit model, including the
number of rooms and their relationship to the exterior. The user needs to provide some
building information like building type and postal code.
After all the information is collected, GBS would be used to provide a
complete building energy analysis, carbon-emission estimates, water use, and cost
estimates, Energy Star scoring, LEED daylight credit potential, natural ventilation, and
thermal performance (Autodesk, n.d.). The most important piece of data provided by
GBS is the annual and lifetime energy costs. The author would use this data to develop a
series of cash outflows in the economic model of the research.
Economic Analyses of the Residence
The author will apply an analytical tool to help investors to understand: (1) the
investment return period, (2) profitability, and (3) the profit region (Estes, 2011). The
focus of this research is on the analytical tools that consider time value of money analysis
(TVM). One of those tools is NVP. NVP economic analysis was discussed by Lucko
(2013) as a valid way to value the cash flows for TVM. Internal Rate of Return (IRR),

25
Discounted Payback Method (DPM) and Profitability Index (PI) are three additional tools
that help measure profitability, its range, and investment return period.
In order to determine the lifetime of a project, the author uses a system adopted
by the United States Internal Revenue Service. The system is known as Modified
Accelerated Cost Recovery System (MACRS) and is used for calculating the depreciation
of an investment (Newnan, et al., 2004).
Determining the cost of capital is not easy. This is especially true for small
realty companies or even individual investors. The author will use S&P Capita IQ
statistics as an approximation for discount rates for TVM analysis.
The author will also consider inflation rates in the investment analyses. Even
small rates of inflation over time can have significant effects on a project’s value (Estes,
2011). Consumer price index (CPI) is a well-known parameter that is used to measure
inflation. The author will incorporate the inflation rate in the TMV analyses by adjusting
each of annual cash inflows/outflows to CPI index. CPI index will be selected on random
out of normal distribution generated based on 30 years CPI mean and standard deviation.
Data
The author will use Autodesk Revit in order to create two parametric models of
the residence (see Chapter II, Section Student Residence Types). One of these models
will serve as a model for visualization and budget estimation purposes. This model
consists of a main file and two linked files. The main file is developed using standard
features of Revit. The first link is a residence model that contains only modified shipping
containers that are used for the design of a residence for the current research. The second
link is a structural design of the residence.
26
The second model will be created to conduct an energy simulation for the
current residence. In this model, the walls, floors, ceilings and roof of the building imitate
the design of the residence. For example, if the design requires having an exterior wall of
R-20 for thermo-resistance, then R-20 wall is placed instead of the shipping container’s
wall. This approach allows creating a proper parametric model that is going to be
understood and recognized by GBS. The complication is that in order to make a full
building energy simulation, all the rooms, areas and volumes have to be recognized by
the GBS. However, the proposed model will contain shipping containers and a significant
amount of nontraditional walls, floors and ceilings, the software may not be able to
recognize. For that reason, it is impossible to run a GBS simulation on the same model.
Using BIM technologies, the author will obtain cost estimates for the initial investment
and energy cost data for the life time of the project. Further the author will use this data
as a cash outflows for economic analysis. For economic analysis the author will use
Microsoft Excel. Other missing parts for that analysis would be project life time, discount
rates, inflation and projects’ income. Chapters IV and V contain further details on these
components of analysis.
MACRS is a system that determines the depreciation period of an asset. In
accordance with this system, Residential Rental Property assumed to be depreciated
within 27.5 years. The author will round this period to 28 years for simplification
purposes. After the calculation of NPV, IRR, DPM, and PI figures for the alternative
materials of student residence, the author will analyze the same analytical tools of the
existing properties that are made in a conventional way. The data about existing
properties is obtained from case studies (see Chapter IV, Section Case Study). Based on

27
the results of the economic analyses the research question of whether shipping containers
could be used to replace the structural components of traditional construction for student
housing will be answered.
Research Limitation
There are three limitations in this research. The first is the approximation of
using consistent thicknesses on walls, floors, and roofs for all the shipping containers
used in the simulation model. Though Autodesk Revit is a very flexible program, it is
challenging to build a parametric model of student residence made out of ISO shipping
containers.
The second limitation is to use fixed numbers for project life-cycle duration and
annual interest rate of return. In reality, those figures can change throughout time. To
simplify analysis the author will use figures for annualized cash flows.
The third limitation of this research is that there are certain uncertainties for the
cost estimates of construction. For example, this research doesn’t provide detailed design
of plumbing, mechanical, electrical, HVAC and sprinkling systems. The author will
conduct cost estimates based on square footage of the building or based on the average
percentages of the building elements in budget estimates of similar projects.
Chapter Summary
This research investigates the benefits of implying alternative construction
method in student housing. The author will develop a student residence using ISO
shipping containers as an alternative structural component. The author will use Autodesk
Revit to build parametric models of the residence. He will use Green Building Studio for
energy simulation analyses and comparing energy usage by alternative building types
28
versus that by traditional buildings. He will use economic evaluation models to calculate
the project financial breakeven and project profitability.

29
CHAPTER IV
RESEARCH DESIGN
Case Study
In this section, the author will present case studies on existing properties. All of
the buildings in the case studies were built after 2008. The first two projects were located
at the off-campus area of Illinois State University. Both of them were in approximately 5
minutes walking distance from the campus. These two properties were managed by
Young America Realty, Inc.
The first property was called “The Lodge on Willow” and located at 214 W.
Willow in Normal, Illinois. This property was constructed during the period of May 2011
to June 2012. It was considered as a luxury student housing with an outdoor pool and a
4600 ft2 clubhouse as a form of a common fellowship areas (for details see Appendix C,
Case study #1).
The second property was “Covington Apartments”. It was located at 102 W.
Cherry, Normal, Illinois (for details see Appendix C, Case study #2). It was built during
the period of October 2012 to August 2013. This residence was also considered as a
luxury student-living facility with covered parking located under the residence.
The third property was called “Crosswalk Commons”, managed by Crosswalk
Project, Inc. with a support of Salt and Light Christian Fellowship (SLCF). It was located

30
at 925 Hilltop Drive, West Lafayette, Indiana (for details see Appendix C, Case study
#3). It was built during the period of September 2012 to August 2013. This property had
managerial personal who was working on students’ social and spiritual development.
Although the rental policy of Crosswalk Commons was very narrow and focused mainly
on international students (see Appendix A), it did not have many vacancies. The
residence was known for its very friendly and loving atmosphere and highly desired by
the international students of Purdue University.
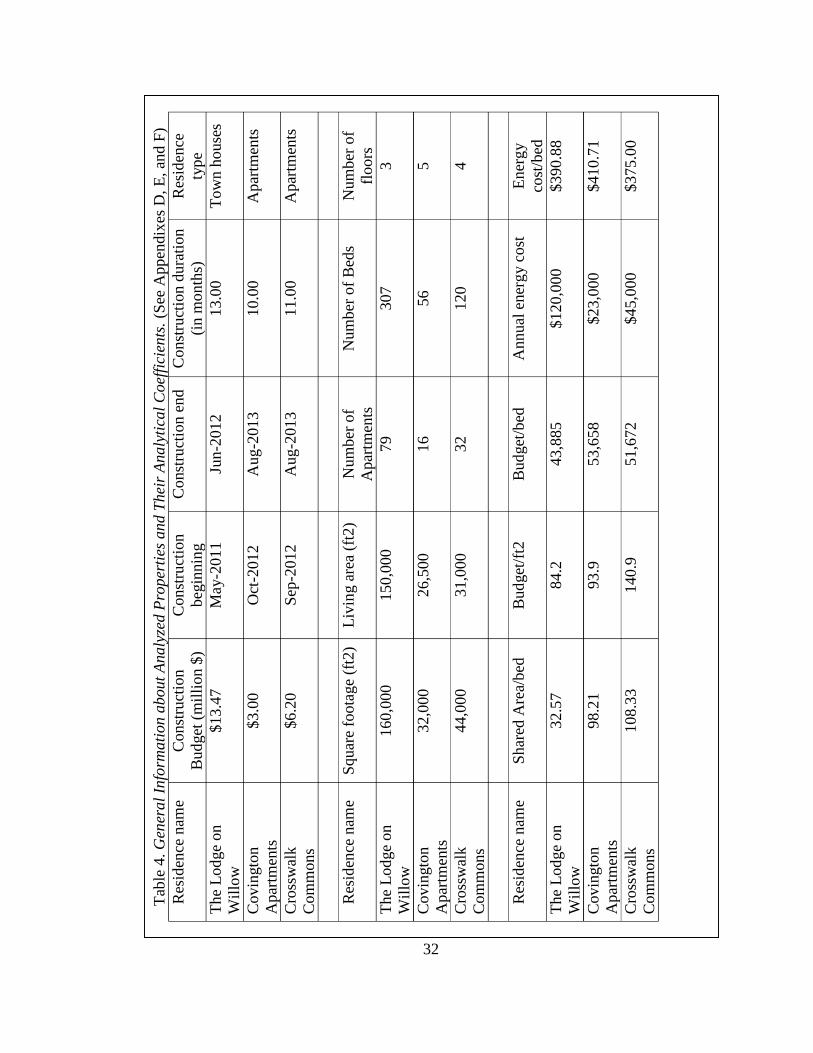
Tables 3 and 4 provide comparisons of the three aforementioned residences.
This information, together with Appendix C, will be used to calculate analytical
coefficients. Due to the inconsistency of the residencies’ construction periods and
locations, RS Means’ historical and location indexes were used to derive the national
average project costs in 2014 (see Table 3). More detailed information about rental costs,
rental conditions and the pictures of those three student-residences can be found by
following the links provided in Appendix C.

31
Tab
le 3
. A
dju
sted
Const
ruct
ion C
ost
of
Analy
zed P
roper
ties
.
Res
iden
ce n
ame
and t
he
yea
r of
com
ple
tion
Const
ruct
ion
Bud
get
(mil
lion $
)
His
tori
cal
Cost
Index
Const
ruct
ion
Bud
get
(mil
lion $
) as
of
2014
Cit
y
Cost
Ind
ex
Const
ruct
ion
Bud
get
(m
illi
on $
)
as o
f 2014,
Nat
ional
aver
age
The
Lod
ge
on
Wil
low
as
of
2012
$13.4
0
194.6
$13.9
6
103.6
$13.4
7
Covin
gto
n
Apar
tmen
ts a
s of
2013
$3.0
9
201.2
$3.1
1
103.6
$3.0
0
Cro
ssw
alk
Com
mons
as o
f
2013
$5.5
7
201.2
$5.6
1
90.5
$6.2
0
Est
imat
ed H
isto
rica
l C
ost
Index
as
of
2014 -
202.7
Cit
y C
ost
Index
as
of
20
14 f
or
Nat
ional
av
erag
e -
100.0
His
tori
cal
and C
ity C
ost
index
es o
bta
ined
fro
m R
S M
eans
buil
din
g c
onst
ruct
ion c
ost
dat
a 2014 (
2013
). C
ity C
ost
Ind
ex i
f
Cham
pai
gn,
IL i
s use
d a
s an
appro
xim
atio
n f
or
Norm
al,
IL.
32
Tab
le 4
. G
ener
al
Info
rmati
on a
bout
Analy
zed P
roper
ties
and T
hei
r A
naly
tica
l C
oef
fici
ents
. (S
ee A
ppen
dix
es D
, E
, an
d F
)
Res
iden
ce n
ame
Const
ruct
ion
Bud
get
(m
illi
on $
)
Const
ruct
ion
beg
innin
g
Const
ruct
ion e
nd
C
onst
ruct
ion d
ura
tion
(in m
onth
s)
Res
iden
ce
type
The
Lod
ge
on
Wil
low
$13.4
7
May
-2011
Ju
n-2
012
13.0
0
Tow
n h
ouse
s
Covin
gto
n
Apar
tmen
ts
$3.0
0
Oct
-2012
A
ug-2
013
10.0
0
Apar
tmen
ts
Cro
ssw
alk
Com
mons
$6.2
0
Sep
-2012
Aug-2
013
11.0
0
Apar
tmen
ts
Res
iden
ce n
ame
Squar
e fo
ota
ge
(ft2
) L
ivin
g a
rea
(ft2
) N
um
ber
of
Apar
tmen
ts
Num
ber
of
Bed
s N
um
ber
of
floors
The
Lod
ge
on
Wil
low
160,0
00
150,0
00
79
307
3
Covin
gto
n
Apar
tmen
ts
32,0
00
26,5
00
16
56
5
Cro
ssw
alk
Com
mons
44,0
00
31,0
00
32
120
4
Res
iden
ce n
ame
Shar
ed A
rea/
bed
B
ud
get
/ft2
B
ud
get
/bed
A
nnual
ener
gy c
ost
E
ner
gy
cost
/bed
The
Lod
ge
on
Wil
low
32.5
7
84.2
43,8
85
$120,0
00
$390.8
8
Covin
gto
n
Apar
tmen
ts
98.2
1
93.9
53,6
58
$23,0
00
$410.7
1
Cro
ssw
alk
Com
mons
108.3
3
140.9
51,6
72
$45,0
00
$375.0
0

33
The Lodge property had the best budget per square foot and per bedroom
coefficients. The building had mostly wood framing sheeted with stone veneer.
Covington was made of the same type of siding as The Lodge. They all had wood
framing and brick veneer. However, the square footage cost of Covington was 10.3%
more expensive because of the parking on the ground level of the residence. Covington
had combustible barrier built between the parking level and the upper levels.
The most expensive case was the Crosswalk project for two main reasons. The
first reason was that developers used a large amount of stone masonry and aluminum
siding materials. The second reason was that the residence had the largest Shared Area
per Bed Coefficient. The developers of the Crosswalk project dedicated a lot of the
building’s space to fellowship purposes. Crosswalk had relatively comparable Budget per
Bed Coefficient due to very small Square Footage of apartments.
The Lodge project was three stories tall all around and included 307 beds. It
had a larger footprint of the property than those of the other two. It is not the best solution
for the areas with expensive land. On average all the residences were built in 11 month
and its average cost was $106.3 per square foot or $49,738 per bed.
Those averages are targets of the proposed research. If it is possible to build a
student residence using the alternative structural components without exceeding those
coefficients, it is important to continue to develop this study for the reduction of
environmental pollution, reduction of unused shipping containers that are currently stored
at the areas that potentially can be used in more efficient ways, and motivating
developers to build new student housing and meet market demands.

34
Residence Design Methodology
Following the studies of Frederiksen (1979), DeCoster and Mable (1974),
Wallace (2012), and Riker and DeCoster (2008) it was decided to design a building with
following facilities: (1) multi-purposeful fellowship areas, (2) studying areas, and (3)
physical recreational areas.
When designing the student residence, the author decided to make minimum
structural modifications to the shipping containers to keep its structural durability. The
author used the high cube 40’ ISO shipping containers to design the structural framing of
the residence. Table 5 shows the specification of dimensions and weights of shipping
containers. The idea is to combine conventional construction with alternative structural
component of the building. This approach allows the partial elimination of the difficulties
of rough-in work and achieves the benefit of cheap structural elements of a building.
Table 5. Specification of Dimensions and Weights of Shipping Containers (Giriunas,
Sezen, and Dupaix, 2012).
Container type Length Width Height Empty weight
External dimensions
40’ High Cube 40 ft. 8 ft. 9 ft.-6 in. 8645 lb.
Internal dimensions
40’ High Cube 39 ft.-4.375 in. 7 ft.-7.75 in. 8 ft.-8.5 in.
Minimum door openings
Height Width
8 ft.-5 in. 7 ft.-6 in.
Design and Modifications
Inspired by the interviews with a general manager of a local realty business,
the author decided that each apartment should have 4 bedrooms, 2 full bathrooms and a
kitchen. None of the apartments would have living rooms, which would motivate students
to spend more time using the common areas of the residence.

35
For customer satisfaction, the author decided to equip each apartment with a
stackable washer and dryer system instead of having a common laundry room. The
selection of the stackable system was for the purposes of efficient internal areas usage. In
order to meet the requirements of “The American with Disabilities Act (ADA)”, one of
the bathrooms in a unit would have a 60’’ diameter circle in the middle to accommodate
the wheelchair inside the bathroom (Rodriguez, n.d.).
Every bedroom would have a twin size bed, a desk, a chair, and a closet. This
bedroom configuration would be optimal to meet the daily needs of a student. The
bedrooms would have large windows for natural light. The internal height of a high cube
shipping container is 8ft.-8.5in. The author designed a dropped ceiling with a 12-inch
offset for electrical and ductwork to be installed above the ceiling. A containers’ width is
only 7ft.-7.75in. The corrugated side walls of a shipping container can serve as a great
base for the internal finish such as a gypsum drywall. Therefore, the author decided to
install drywalls directly on the corrugated steel, except for those areas where insulation is
needed. The plan view of the designed apartment is shown in Figure 2.
As shown in Figure 2 and Figure 3 the apartment design consists of three 40’
containers. The second 40’ container sticks out by 8’ to the left of the other two 40’
containers. This design idea makes space for a 13’ long and 8’ wide area at the right part
of the apartment for 2 full bathrooms. The average footprint of the 4 bedrooms would be
of 150 ft2.
To avoid the removal of end walls and door assemblies, the first 40’ container
that has two bedrooms has two large 6’ by 3’ windows opening along one of the side
walls. Also this container has a 12’ by 8.5’ opening along another side wall. Figure 4

36
shows the details of the 12’ X 8.5’ opening. This large modification is to connect the
three containers into one apartment.
Container 2 in Figure 5 has one bedroom, one small hall-way area and a part of
a bathroom with a shower. As shown in Figure 5, this container’s door assembly has been
completely removed. Both side walls have the large 12’ X 8.5’ openings. One side wall
has 6’ X 3’ window opening. As it can be seen from Figure 2 there is a containers front
bottom framing component sticks out by approximately 2 inches. Due to floor level
requirements of this design it was not possible to cover this element under the floor
finishing material. This component can be decoratively painted to fit the interior design
of the bathroom.
Figure 2. Apartment Layout (Plan View).
1
2
3 Front bottom
framing

37
Figure 3. Apartment Layout (Perspective View).
Figure 4. First Modified 40’ Shipping Container.
Figure 5. Second Modified 20’ Shipping Containers.

38
Figure 6. Third Modified 40’ Shipping Container.
Figure 6 shows the details of Container 3. This container has one opening
along one side wall and two 3’-8’’ wide openings for an entry door and a bathroom door.
There is another 6’x3’ window opening on the end wall of the container.
The interior design of the project reflects a minimalistic approach. Gypsum
drywalls are used as walls’ and ceilings’ finish material. Shipping containers usually have
marine plywood, with possible toxic treatment applied to it. In that case, the material
cannot be used for dwelling purposes. The information of the material can be found by
checking the data on the container’s data plate. Although in this research, the author
assumed that the flooring plywood is not treated with any of the harmful chemicals,
budget estimates will allow some room for that type of expenses. The flooring plywood
can serve as a perfect rough floor itself. But it would be esthetically pleasurable to apply
some flooring finishes. The proposed design offers carpet finish for bedrooms and vinyl
tiles for kitchen. There is a 10 ¾’’floor that is made in traditional way in between
containers 1 and 3. It serves as a platform for the bathrooms of the apartment. As shown
in Figure 7, this area has a ceramic finish material. The floor is structured with 9 ¼’’
wide wooden-joists installed on heavy joist-hangers, which are respectively installed on
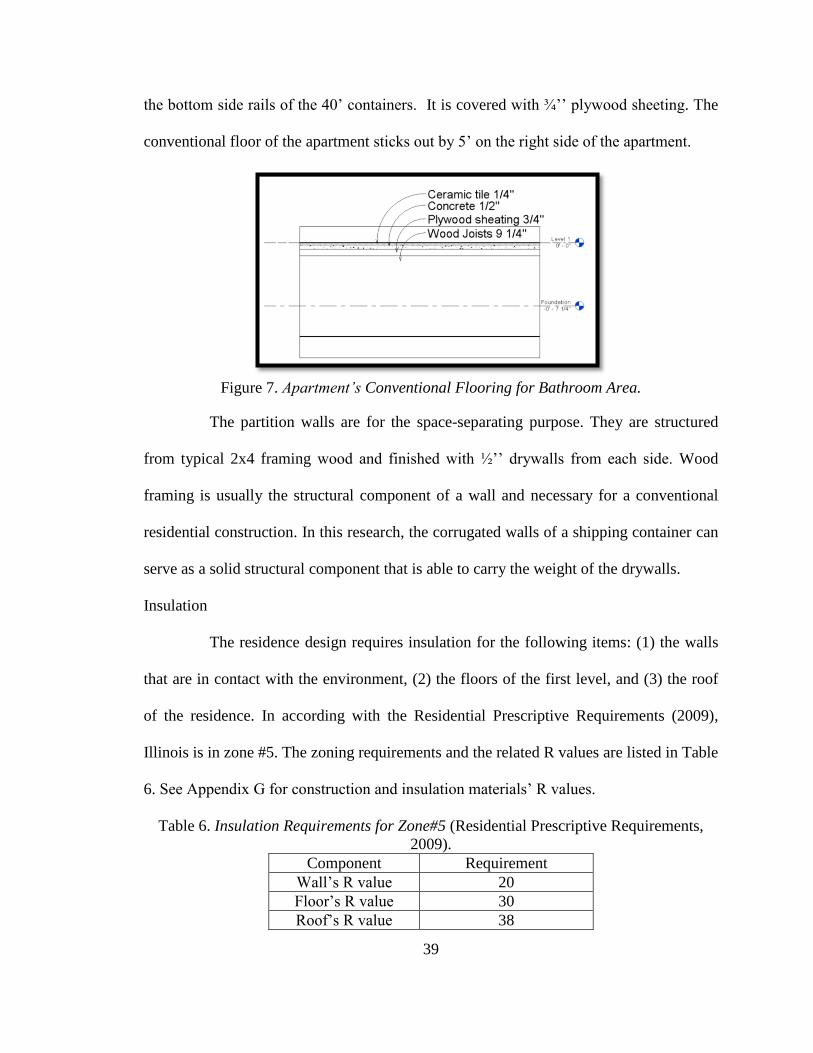
39
the bottom side rails of the 40’ containers. It is covered with ¾’’ plywood sheeting. The
conventional floor of the apartment sticks out by 5’ on the right side of the apartment.
Figure 7. Apartment’s Conventional Flooring for Bathroom Area.
The partition walls are for the space-separating purpose. They are structured
from typical 2x4 framing wood and finished with ½’’ drywalls from each side. Wood
framing is usually the structural component of a wall and necessary for a conventional
residential construction. In this research, the corrugated walls of a shipping container can
serve as a solid structural component that is able to carry the weight of the drywalls.
Insulation
The residence design requires insulation for the following items: (1) the walls
that are in contact with the environment, (2) the floors of the first level, and (3) the roof
of the residence. In according with the Residential Prescriptive Requirements (2009),
Illinois is in zone #5. The zoning requirements and the related R values are listed in Table
6. See Appendix G for construction and insulation materials’ R values.
Table 6. Insulation Requirements for Zone#5 (Residential Prescriptive Requirements,
2009).
Component Requirement
Wall’s R value 20
Floor’s R value 30
Roof’s R value 38

40
There are several ways to achieve R20 level of insulation of exterior walls. A
traditional way is to use wood studs and fiberglass insulation. Usually fiberglass provides
R11 at the thickness of 3 ½’’ (Energy.gov, 2015). In that case, it needs to have
approximately 6 ½’’ thick of fiberglass as the insulation layer in order to achieve R20
requirement. To maintain the dimensions of the constrained inner volumes, it would be
rational to minimize the thickness of the insulated walls. For example, R20 would be
achieved at 5 ¼’’ thickness if high density fiberglass is used (Energy.gov, 2015). But the
significant drawback of that type of insulation is that the walls of a shipping container are
made out of corrugated steel. With fiberglass insulation, there will be cavities that will
cause condensation.
An alternative idea of insulation is to use spray-foam insulation. Although
spray-foam insulation (i.e. Polyurethane foamed-in-place) is one of the most expensive
alternatives, it provides R6.25 per inch of thickness (Professionals Corner, n.d.) and R20
can be achieved at 3 ½’’ of thickness. This type of insulation will take care of the cavity
problems and create solid continuous insulation. For details of the discussion on the
spray-foam insulation, see Appendix B, Interview#2. The combination of both types of
insulation materials, i.e. spray foam and high density fiber-batt, takes care of the cavity
problems and provides the required level of insulation at reduced cost.
In this design, the drywalls for the internal walls can be installed directly on the
corrugated steel walls of a shipping container. But it is difficult for the exterior walls to
have the same installation due to insulation requirement. Therefore, the framing for the
exterior insulated walls is still required for the support of drywalls. Figure 8 show the
section view of a typical insulated wall of the design. Table 7 lists the R value.

41
Figure 8. Insulated Wall (Plan View).
Table 7. Insulated Wall Assembly’s R Value (Professionals Corner, n.d.).
For the floors on the first level a shipping-container building, if a concrete slab
is installed below the container floor, there is almost 6’’ cavity between the slab and the
container floor (Crepeau, 2009). This cavity can be filled with foam spray, to obtain R30-
R32.5 insulation, the thickness of the foam spray should be at 5 inch (Professionals
Corner, n.d.). R30-R32.5 satisfies the insulation requirements for exterior floors.
In the designed BIM model, the author decided to build a flat roof that consists
of two different roofing types. One type is lying on the top of a shipping containers and
Thickness in
inches
Component R value
of a stud
R value of
a cavity
Assembly
R value
N/A Outside Air Film 0.17 0.17
2/25’’ Steel Corrugation 0.33 0.33
1 Spray foam 6.25 6.25
3 ½’’ High-density Fiberglass 15.00
3 ½’’ Wood stud (2x4) 4.38
½’’ Drywall 0.45 0.45
N/A Inside Air Film 0.68 0.68
N/A Percent for 24" o.c. + Additional
studs
6.25% 93.75%
Total wall Component R value 6.00 22.88
5 2/25’’ Total Wall Assembly R Value 21.82

42
the other is hanging above fellowship area of the residence. The main differences
between the two types of roofing are roof thicknesses, types of insulation, and interior
finish materials. Thus the following tables present the roof assemblies of both roof types.
Table 8. R Value of The Roof that is above Shipping Containers (Professionals Corner,
n.d.)
Table 9. R Value of The Roof that is not above Shipping Containers (Professionals
Corner, n.d.)
The HVAC, Plumbing, Electrical and Fire Sprinkling System Design
Several HVAC (a.k.a. heating, ventilation and air conditioning) options were
considered for the development of the apartment building of this research. The whole
residence is not large enough to install a centralized system with zoning. For that reason,
Thickness
in inches
Component R value
of a stud
R value of
a cavity
Assembly
R value
Outside Air Film 0.17 0.17
¼’’ EPDM* 0.44 0.44
¾’’ Plywood 0.94 0.94
7 ¼’’ Wood Joists 9.06
7 ¼’’ High-density Fiber Batt 31.18
2 Spray foam 12.50 12.50
Percent for 24" o.c. + Additional
studs
6.25% 93.75%
Total wall Component R value 23.11 45.23
10 ¼’’ Total Wall Assembly R Value 43.84
Thickness
in inches
Component R value
of a stud
R value of
a cavity
Assembly
R value
Outside Air Film 0.17 0.17
¼’’ EPDM 0.44 0.44
¾’’ Plywood 0.94 0.94
11 ¼’’ Wood Joists 14.06
11 ¼’’ High-density Fiber Batt 48.38
½’’ Drywall 0.45 0.45
Inside Air Film 0.68 0.68
Percent for 24" o.c. + Additional
studs
6.25% 93.75%
Total wall Component R value 16.74 51.06
12 ¾’’ Total Wall Assembly R Value 48.91
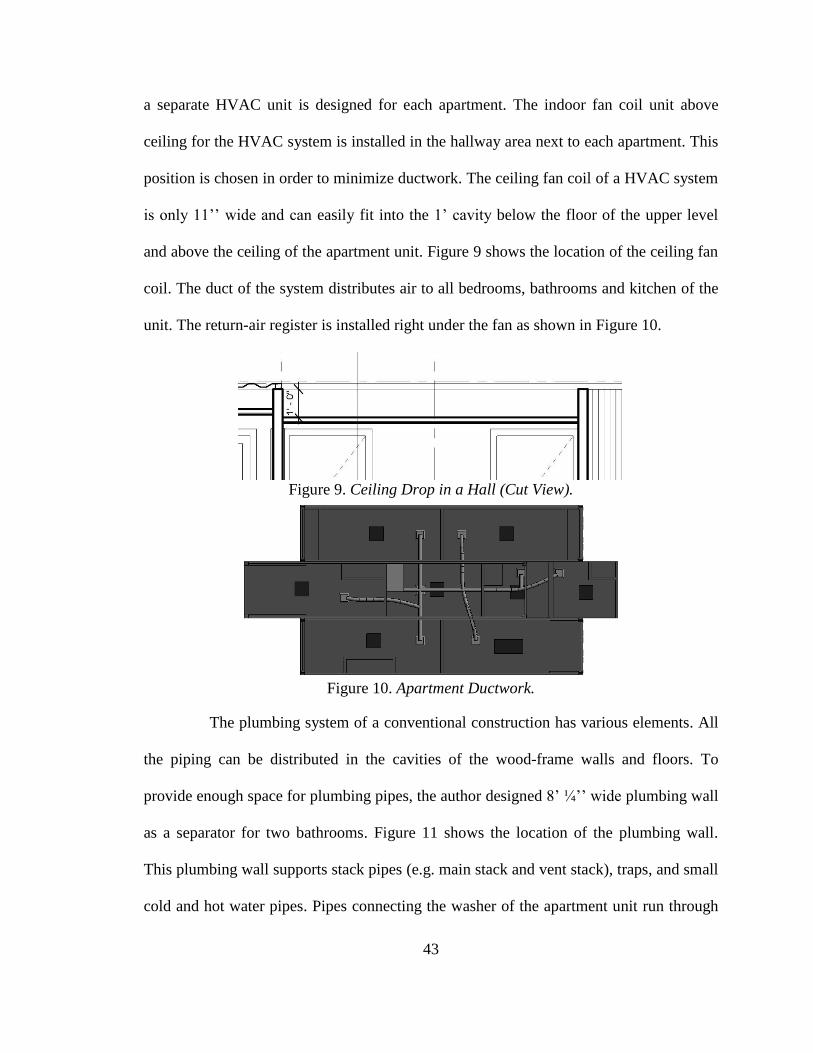
43
a separate HVAC unit is designed for each apartment. The indoor fan coil unit above
ceiling for the HVAC system is installed in the hallway area next to each apartment. This
position is chosen in order to minimize ductwork. The ceiling fan coil of a HVAC system
is only 11’’ wide and can easily fit into the 1’ cavity below the floor of the upper level
and above the ceiling of the apartment unit. Figure 9 shows the location of the ceiling fan
coil. The duct of the system distributes air to all bedrooms, bathrooms and kitchen of the
unit. The return-air register is installed right under the fan as shown in Figure 10.
Figure 9. Ceiling Drop in a Hall (Cut View).
Figure 10. Apartment Ductwork.
The plumbing system of a conventional construction has various elements. All
the piping can be distributed in the cavities of the wood-frame walls and floors. To
provide enough space for plumbing pipes, the author designed 8’ ¼’’ wide plumbing wall
as a separator for two bathrooms. Figure 11 shows the location of the plumbing wall.
This plumbing wall supports stack pipes (e.g. main stack and vent stack), traps, and small
cold and hot water pipes. Pipes connecting the washer of the apartment unit run through

44
the location of Connection A as shown in Figure 11. Those pipes go above the ceiling
into the plumbing wall. A 23-gallon residential water-heater is installed in the ADA
bathroom. It is connected to the main water line through the cavity in floor framing. The
pipes from kitchen sink and dishwasher run to the plumbing wall at Connection B as
indicated in Figure 11. The wall is 2’’x4’’ wood-framed wall that is installed along the
container’s wall (Connection B).
Figure 11. Plumbing System.
For the purposes of simplification, the author didn’t include the detailed design
of fire sprinkling system. However, with the integration of the conventional construction
components and shipping containers, the sprinkling system can be installed in a very
similar way to the rough-in work of the ductwork and plumbing system.
Connections
There are two types of connections: (1) vertical connection and (2) horizontal
connection. Double-ended twist locks are used as vertical connectors for the shipping
containers. The connection devices can lock containers together through their corner
fittings. Figures 12, 13, and 14 show the details of the connections (Giriunas, et al.,
2012).

45
There are many different types of horizontal connections that are widely used
during stacking and transportation using shipping containers. However, it is impossible to
apply those connections in this BIM model because containers are not aligned with each
other in a horizontal line. Therefore, the author decided to use bolts and nuts system to
connect containers through the side walls of the containers.
Figure 12. Containers Stacked on Connection Device (HEDD engineered design, n.d.).
Figure 13. Double Ended Twist Lock (HEDD engineered design, n.d.).
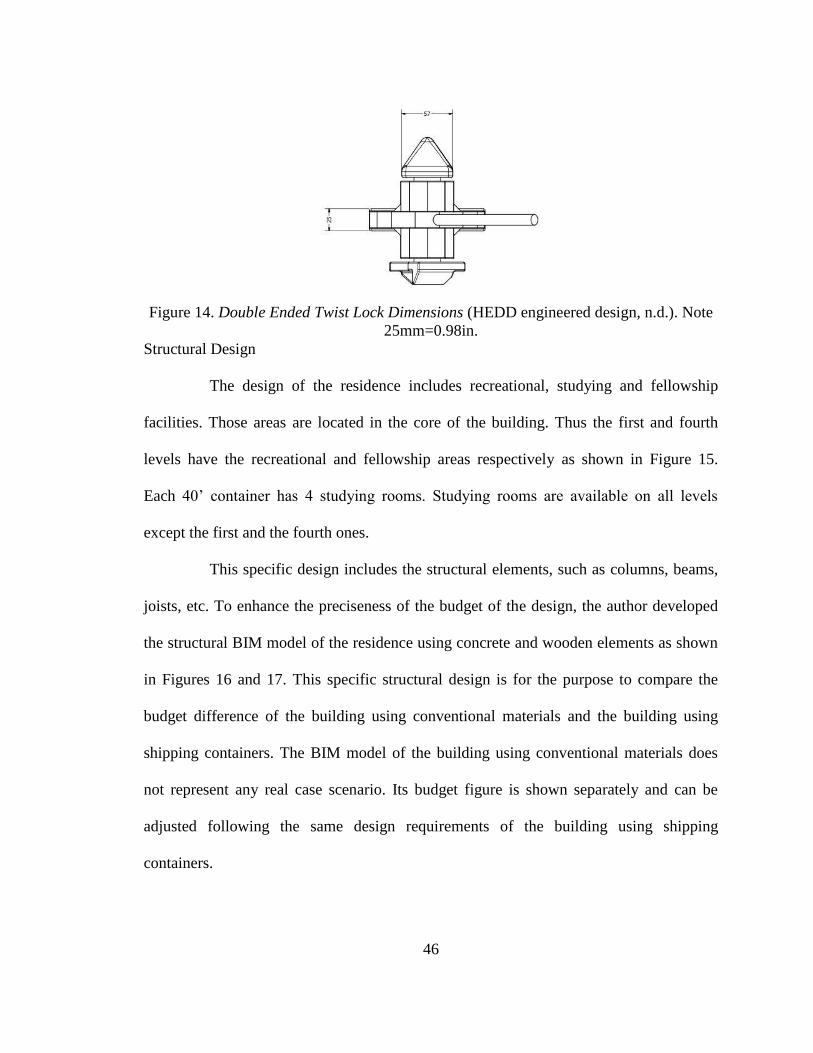
46
Figure 14. Double Ended Twist Lock Dimensions (HEDD engineered design, n.d.). Note
25mm=0.98in.
Structural Design
The design of the residence includes recreational, studying and fellowship
facilities. Those areas are located in the core of the building. Thus the first and fourth
levels have the recreational and fellowship areas respectively as shown in Figure 15.
Each 40’ container has 4 studying rooms. Studying rooms are available on all levels
except the first and the fourth ones.
This specific design includes the structural elements, such as columns, beams,
joists, etc. To enhance the preciseness of the budget of the design, the author developed
the structural BIM model of the residence using concrete and wooden elements as shown
in Figures 16 and 17. This specific structural design is for the purpose to compare the
budget difference of the building using conventional materials and the building using
shipping containers. The BIM model of the building using conventional materials does
not represent any real case scenario. Its budget figure is shown separately and can be
adjusted following the same design requirements of the building using shipping
containers.

47
Figure 15. Residence (Plan and Elevation Views).
Figure 16. Structural Framing (Plan View).
Living quarters
Living quarters
Recreational area
(1st floor)
Fellowship area
(2nd floor)

48
Figure 17. Structural Framing (3D view, 2nd, 3rd, and 4th levels).
The BIM model of the conventional building has recreational facilities and
corridors on the first floor of the residence. Its floor slab doesn’t require any structural
support. This design of the floor slab includes 4’’ thick slab on 4’’ thick sand, reinforced
by metal rolled-mesh and finished with ¾’’ of a rubber cover as shown in Figure 18 for
the gym area and with ½’’ carpet for corridors.
Figure 18. Recreational Area Floor Design.
The floor of the fourth level of the residence has the common fellowship area.
There are ¾’’ thick plywood sheeting installed above 14’’ wide wooden I-beams for the
areas of 21’ wide span. There are 2x12 dimensional lumbers for the areas with 12’ span.

49
All lumber materials are placed on 24’’ distance on center. Figures 19 and 20 show the
details of those areas. The flooring finish of those areas is ½’’ thick carpet.
Figure 19. Fellowship Hall, Floor Framing (Plan View, Level 4).
Figure 20. Fellowship Hall, Floor Framing (3D View, Level 4). Note: Brown and gray
colored elements represent wood and concrete framing materials respectively.
The elevator is placed between two containers and supported by the corner
posts of the load-bearing containers from two sides. The back side of the elevator isn’t
supported. In order to support the elevator, the author designed a concrete column with
joists. Figure 21 shows that this system also secures containers through horizontal
connections by welding. Stairwell rests on the concrete structure as shown in Figure 22.
There are two stairwells in the residence. They are locked in the 6’’ nonstructural wood-
framed walls as shown in Figure 23.

50
Figure 21. Elevator Shaft Design.
Figure 22. Stairwell Concrete Structure.
Figure 23. Stairwell Design.
There are two types of roofing materials in the BIM model. Both roofs are
wood framed. The roof above shipping containers needs only 7 ¼’’ cavities for fiberglass
insulation. The 2’’ foam insulation is sprayed over the steel roof of each shipping

51
container. This solution takes care of cavity problems due to corrugation of steel. For the
roof hanging above the area of the fellowship hall, it doesn’t have any spray foam
insulation. It requires 12-¼’’ wide cavities to reach the optimal insulation. It rests on the
wood-framing system that is attached to structural concrete. Figure 24 shows the detail of
the framing system of the roofs. Figure 25 shows a 2D section view of the roof that is
above the fellowship hall. Figure 26 shows the 2D section view of the roof that is above
shipping containers.
Figure 24. Wood Framing on Structural Concrete as a Roof Support.
Figure 25. Roof above Fellowship Hall Design.

52
Figure 26. Roof above Shipping Containers Design.
Building Foundation and Load Bearing Model
There are three widely used types of foundation for the shipping container
buildings: (1) shallow foundation, (2) deep foundation, and (3) pile foundation (Giriunas,
et al., 2012). Geotechnical investigation is needed in order to design the foundation that
fits the specific soil and location for a container building. This research uses pile
foundation type for the student residence. All the load-bearing columns rest on the
concrete caps at the tops of the piles (as shown in Figure 27 and 28). The steel piles have
the dimensions of 16’’ diameter and 20’ depth. The concrete caps have the dimensions of
39’’x39’’x35’’. All together there are 70 steel piles and 2,156 CF of concrete caps used
for the foundation of the residence.
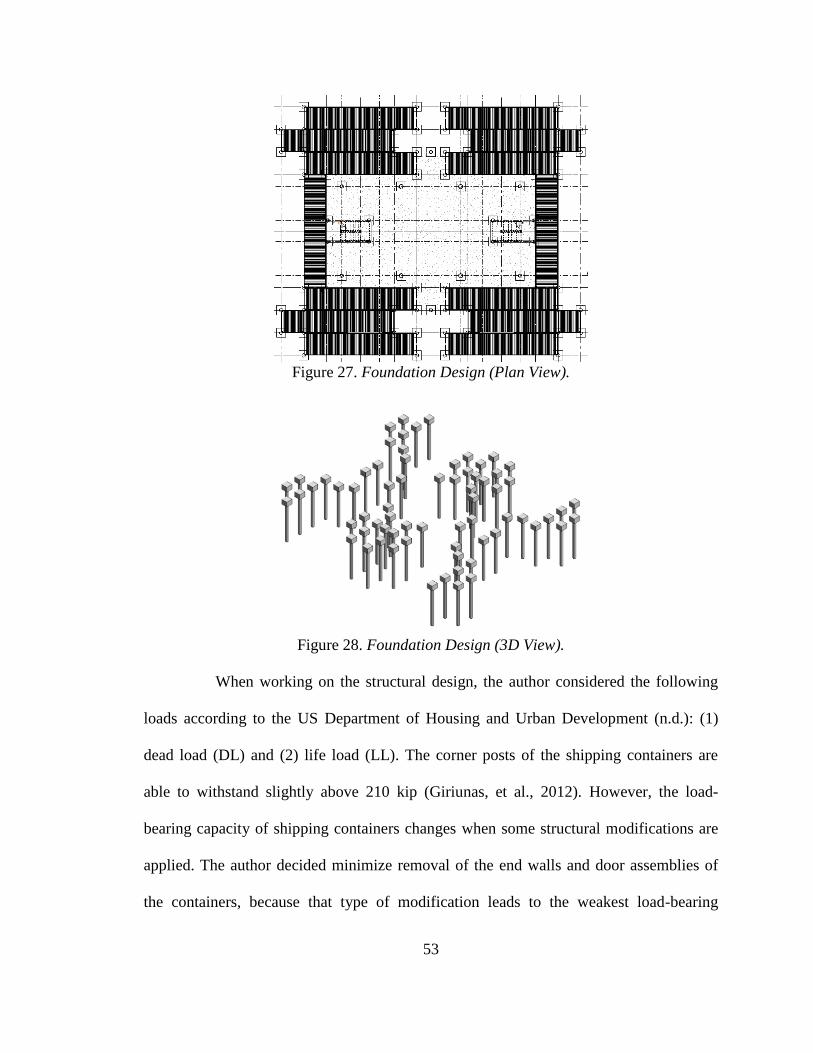
53
Figure 27. Foundation Design (Plan View).
Figure 28. Foundation Design (3D View).
When working on the structural design, the author considered the following
loads according to the US Department of Housing and Urban Development (n.d.): (1)
dead load (DL) and (2) life load (LL). The corner posts of the shipping containers are
able to withstand slightly above 210 kip (Giriunas, et al., 2012). However, the load-
bearing capacity of shipping containers changes when some structural modifications are
applied. The author decided minimize removal of the end walls and door assemblies of
the containers, because that type of modification leads to the weakest load-bearing
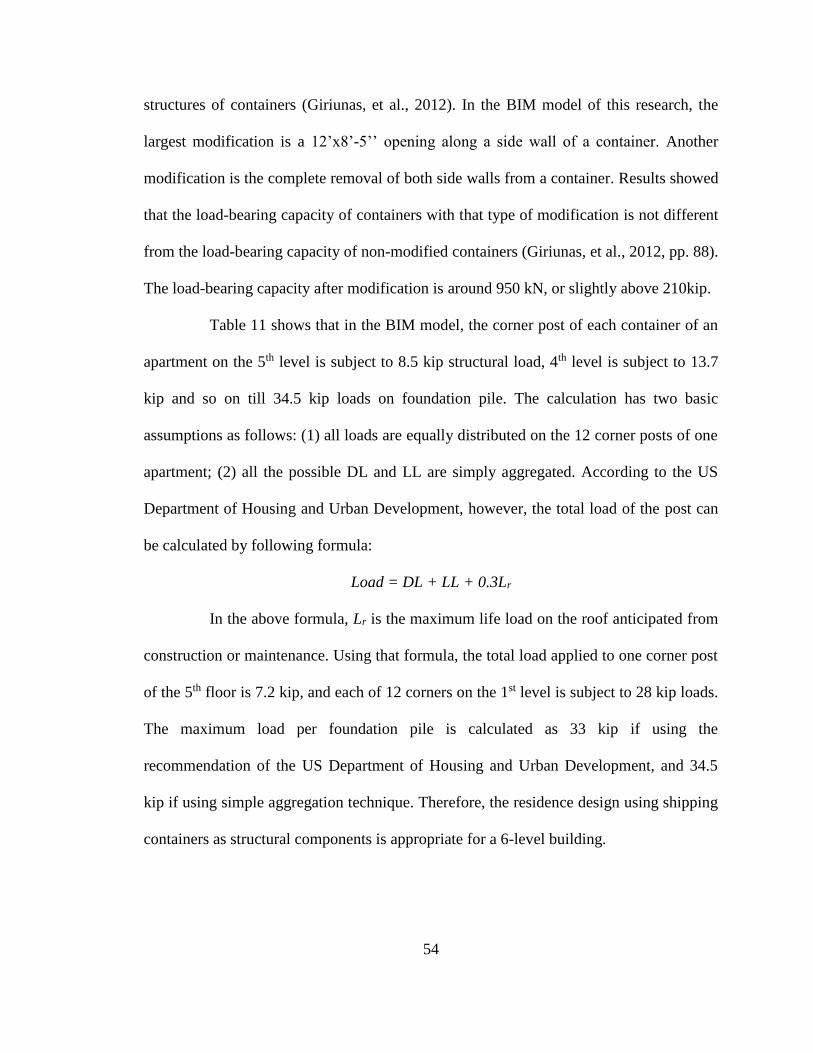
54
structures of containers (Giriunas, et al., 2012). In the BIM model of this research, the
largest modification is a 12’x8’-5’’ opening along a side wall of a container. Another
modification is the complete removal of both side walls from a container. Results showed
that the load-bearing capacity of containers with that type of modification is not different
from the load-bearing capacity of non-modified containers (Giriunas, et al., 2012, pp. 88).
The load-bearing capacity after modification is around 950 kN, or slightly above 210kip.
Table 11 shows that in the BIM model, the corner post of each container of an
apartment on the 5th level is subject to 8.5 kip structural load, 4th level is subject to 13.7
kip and so on till 34.5 kip loads on foundation pile. The calculation has two basic
assumptions as follows: (1) all loads are equally distributed on the 12 corner posts of one
apartment; (2) all the possible DL and LL are simply aggregated. According to the US
Department of Housing and Urban Development, however, the total load of the post can
be calculated by following formula:
Load = DL + LL + 0.3Lr
In the above formula, Lr is the maximum life load on the roof anticipated from
construction or maintenance. Using that formula, the total load applied to one corner post
of the 5th floor is 7.2 kip, and each of 12 corners on the 1st level is subject to 28 kip loads.
The maximum load per foundation pile is calculated as 33 kip if using the
recommendation of the US Department of Housing and Urban Development, and 34.5
kip if using simple aggregation technique. Therefore, the residence design using shipping
containers as structural components is appropriate for a 6-level building.
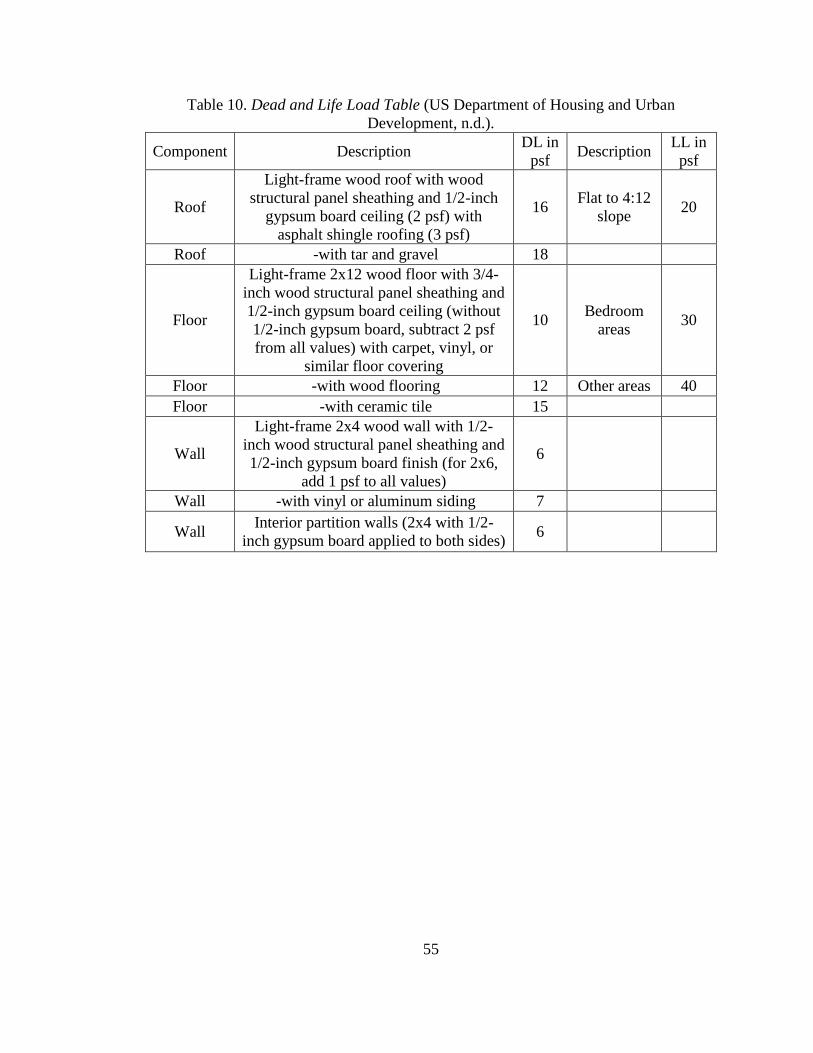
55
Table 10. Dead and Life Load Table (US Department of Housing and Urban
Development, n.d.).
Component Description DL in
psf Description
LL in
psf
Roof
Light-frame wood roof with wood
structural panel sheathing and 1/2-inch
gypsum board ceiling (2 psf) with
asphalt shingle roofing (3 psf)
16 Flat to 4:12
slope 20
Roof -with tar and gravel 18
Floor
Light-frame 2x12 wood floor with 3/4-
inch wood structural panel sheathing and
1/2-inch gypsum board ceiling (without
1/2-inch gypsum board, subtract 2 psf
from all values) with carpet, vinyl, or
similar floor covering
10 Bedroom
areas 30
Floor -with wood flooring 12 Other areas 40
Floor -with ceramic tile 15
Wall
Light-frame 2x4 wood wall with 1/2-
inch wood structural panel sheathing and
1/2-inch gypsum board finish (for 2x6,
add 1 psf to all values)
6
Wall -with vinyl or aluminum siding 7
Wall Interior partition walls (2x4 with 1/2-
inch gypsum board applied to both sides) 6
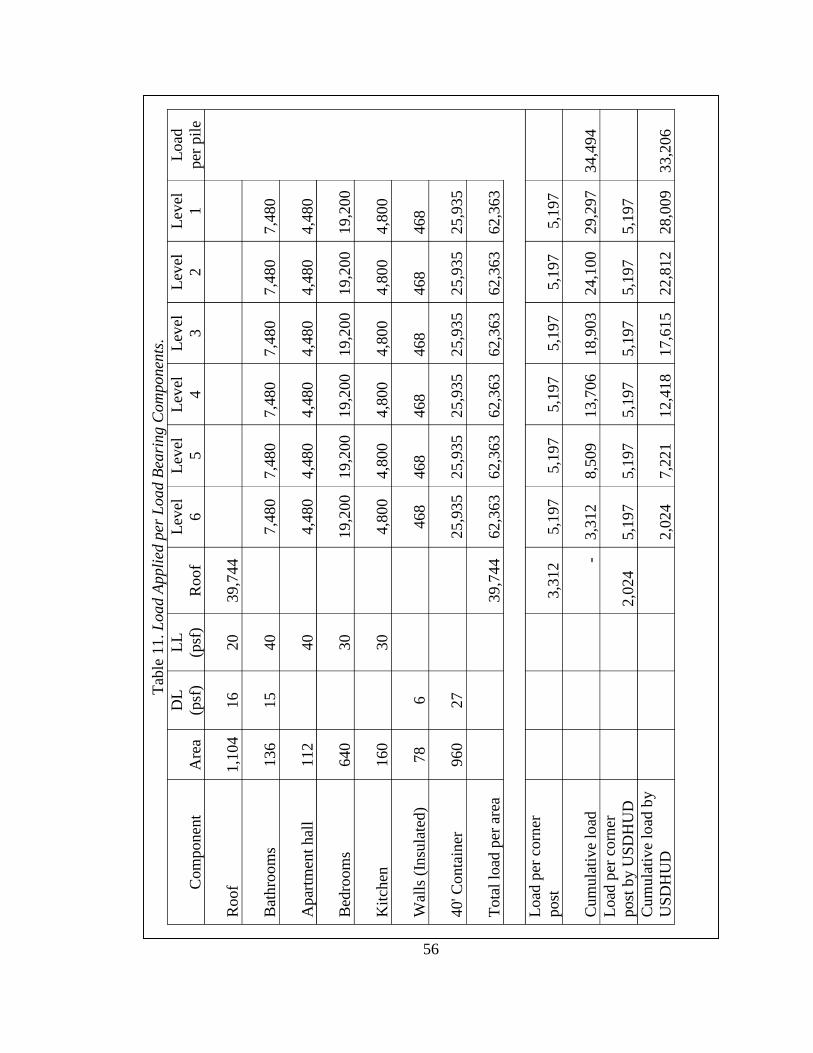
56
Tab
le 1
1. L
oad A
ppli
ed p
er L
oad B
eari
ng
Com
pon
ents
.
Com
ponen
t A
rea
DL
(psf
)
LL
(psf
) R
oof
Lev
el
6
Lev
el
5
Lev
el
4
Lev
el
3
Lev
el
2
Lev
el
1
Load
per
pil
e
Roof
1,1
04
16
20
39,7
44
Bat
hro
om
s 136
15
40
7,4
80
7,4
80
7,4
80
7,4
80
7,4
80
7,4
80
Apar
tmen
t hal
l 112
40
4,4
80
4,4
80
4,4
80
4,4
80
4,4
80
4,4
80
Bed
room
s 640
30
19,2
00
19,2
00
19,2
00
19,2
00
19,2
00
19,2
00
Kit
chen
160
30
4,8
00
4,8
00
4,8
00
4,8
00
4,8
00
4,8
00
Wal
ls (
Insu
late
d)
78
6
468
468
468
468
468
468
40' C
onta
iner
960
27
25,9
35
25,9
35
25,9
35
25,9
35
25,9
35
25,9
35
Tota
l lo
ad p
er a
rea
39,7
44
62,3
63
62,3
63
62,3
63
62,3
63
62,3
63
62,3
63
Load
per
corn
er
post
3,3
12
5,1
97
5,1
97
5,1
97
5,1
97
5,1
97
5,1
97
Cu
mu
lati
ve
load
-
3,3
12
8,5
09
13,7
06
18,9
03
24,1
00
29,2
97
34,4
94
Load
per
corn
er
post
by U
SD
HU
D
2,0
24
5,1
97
5,1
97
5,1
97
5,1
97
5,1
97
5,1
97
Cum
ula
tive
load
by
US
DH
UD
2,0
24
7,2
21
12,4
18
17,6
15
22,8
12
28,0
09
33,2
06

57
Gym, Fellowship Hall, and Studying Rooms Design
The minimalistic design is used for the residence’s recreational area. It is
located on the first level of the residence. The area of the gym is 2,758 ft2 as shown in
Figure 29. The budget figure of the fitness equipment in the gym is discussed in the
Chapter V of this research.
Figure 29. Recreational Area (Plan View).
The fellowship hall of the residence has several sets of table tennis and billiard
tables. The fellowship hall has wood finishes as shown in Figure 30. The area of the
fellowship hall is 3,535 ft2 and is presented in Figure 31.
Figure 30. Fellowship Hall (Render).

58
Figure 31. Fellowship Hall (Plan View).
The studying rooms are placed in the 40’ HC shipping containers as shown in
Figure 32. Each studying room is 70 ft2. It has a large window opening for a significant
amount of natural light. There are a table and a couple of chairs in each studying room.
Carpet is installed above the plywood floors of shipping containers. Drywall finishes are
applied on walls and ceilings as shown in Figure 33.
Figure 32. Studying Rooms (Plan View).

59
Figure 33. Studying Rooms (Render).
Model for Economic Analysis
In this section of the current research the author describes an approach to
extrapolate life cycle financial data of the alternative residence and 3 case studies for
comparison analysis.
First step is to make some assumptions about residences operation cycle. The
first assumption is that all 4 cases are financed through a mortgage with 20% down
payment and 6% annual rate. Next assumption is that project developers desire to earn
11% return on down payment they invest. Vacancy and annual maintenance expenses
other than energy cost assumed to be 5% and 36% respectively (Table 12). The last
assumption is that residence will be occupied all 12 month of the year.
Table 12. Assumptions for Economic Analysis.
Assumption Rate
Initial investment (down payment) 20%
Loan interest rate (annual) 6%
Return on Investment 11%
Vacancy 5%
Annual expenses 36%

60
The next step is to derive monthly rent per bed. Rent per bed tightened directly
to Construction Cost per Bed ratio. Table 13 shows rent derivation procedure. After
derivation of monthly rental prices it is possible to perform economic comparison of the
residences. As it was briefly described in Chapter III, Section Materials, Tools, Software
and Data of the current research the author uses Modified Accelerated Cost Recovery
System (Newnan, et al., 2004), S&P Capita IQ statistics and Consumer Price Index in
order to come up with project life cycle period, discount rate and inflation rate
respectively. Though aforementioned tools provide some fixed numbers (Table 14) it is
rational to include some randomness in the life cycle extrapolation of them. The author
describes this procedure in details in the Section Energy Consumption Estimates of the
current research.
Table 13. Derivation of Monthly Rental Price per Bed.
Line
number Item The Lodge
Covington
Apartments
Crosswalk
Commons
1 Number of Beds 307 56 120
2 $ Constr./bed $43,885 $53,658 $51,672
3
Total Constr. Cost (Line1 *
Line2) (Table 4) $13,472,695 $3,004,848 $6,200,640
4
Down payment 20% (Line3 *
20%) $2,694,539 $600,970 $1,240,128
5
Annual Interest + Principle
Payment at 6% $795,588 $177,442 $366,160
6 ROI on down payment at 11% $296,399 $66,107 $136,414
7
Annual expenses 36% ([Line5
+Line6] / 64% * 36%) $614,243 $136,996 $282,698
8
Vacancy 5%
([Line5+Line6+Line7] / 95% *
5%) $89,802 $20,029 $41,330
9 Energy cost (Table 4) $120,000 $23,000 $45,000
10
Annual Revenue (Line5 + Line6
+ Line7 + Line8 + Line9) $1,916,032 $423,573 $871,601
11
Monthly Rent Per Bed (Line10 /
Line1 / 12 month) $520 $630 $605

61
Table 14. Other Components of Economic Analysis.
Tool Value
MACRS 28 years
S&P Capita IQ 8.33%
CPI 2.79%
Further based on aforementioned in Tables 12, 13 and 14 numbers the author
develops annual cash flow models based on 28 years of projects’ life cycle. Cash flow
models include revenue and expenses adjusted by inflation, further cash flow figures are
discounted and based on that discounted figures the author gets NPV, IRR, PI and DPM
values (see Chapter III, Section Economic Analyses of the Residence). Further those
values are subjected to the Monte Carlo data simulation process to get more realistic
averages and standard deviations that are used for the economic comparison analysis of
the alternative student residence with three factual student residences.

62
CHAPTER V
DATA, ANALYSIS AND CONCLUSION
Budget Estimates
The author used RS Means Building Construction Cost Data 2014 edition to
calculate the budget estimates of the project. This tool is widely used by construction
companies and education institutions as a reliable source of construction cost data. The
RS Means publishes wide varieties of construction data. In this research, the construction
is in the category of commercial projects and large multi-family housing (RS Means,
2013). The data item of RS Means provides information about performing crew, its
productivity, materials used, labor and equipment cost.
The data set in RS Means provides project location factor and time factor. In
this research, the author used 3 case studies for comparison analysis. Two case studies
were built mostly during 2012 and one was built in 2011. However, the budget estimates
of the current student residence will be calculated using 2014 data. Therefore, the data in
the case studies needs to be adjusted by the time index and the national average index in
order to make it equivalent to the current budget estimates. Tables 3 in Chapter IV show
the adjustments.
Based on the data provided by RS Means (2013), Table 15 shows the budget
estimate for the student residence. RS Means (2013) recommends including 10% of

63
General Contractor (GM) markup and 5% of contingency fund. Proposed in the Table 15
budget estimate includes a division for other expenses that accounts for 5% of gross
project cost estimate. This division is included to reflect some omitted expenses like
landscaping, removal of harmful chemicals of shipping containers floors, fluctuations in
containers delivery prices etc. The calculation of the contingency fund also considered
the GM markup. Appendix D has more detailed tables of the budget estimate.
There are 70 piles, 2 157 CF of concrete caps, 40 480 CF of excavation and 1
pile set up included in foundation cost estimate (for details see Table D1). Table 15
shows that the foundation accounts 3.8% of the total budget estimate. There are two
superstructures integrated in the structural design of the residence. The first is composed
of shipping containers secured to each other (for details see Table D2). The second is
made of reinforced concrete and wood elements (see Table D3). The overall share of the
superstructure system of the model in the total budget is 11.5%. Although the stairwells
can be considered as the structural components of the building, the author decided to
show them as separate budget figures (see Table D4). The building superstructure plus
the stairwells are 13.9% of the budget estimate.
Stairwells are enclosed with 2-hour fire-rated interior walls on 2x4 wood studs.
The RS means (2013) doesn’t provide the estimate data for that type of walls. The author
used the cost data of partition wall fished with a drywall on both sides for the stairwell
walls. Drywall component was subtracted from the cost and recalculated separately with
the consideration of 2-hour fire rating. The design includes monolithic concrete stairs and
3’’ concrete on metal deck for landings. One stairwell is extended to the roof. The

64
additional walls that rise above the roof are made of 2x4 wood stood with plywood
sheeting and finished with brick vinyl.
The budget of the integrated common fellowship, recreational and studying
areas makes 11.4% of the residence budget estimate. Table 15 shows the cost estimate for
common areas including: (1) plumbing, HVAC, and electrical estimates, and (2) furniture
and equipment cost estimates. RS Means (2013) provides cost for those systems per
square footage of the residence. The plumbing cost of the common area assumed to be
no more than the plumbing cost of the 2 apartments. Tables D5 and D6 have detailed
discussion on the systems. Elevator cost estimate makes 2.3% of the budget.
The apartment’s cost makes up 39.7% of the overall budget. The floors of the
apartments on the first level are insulated with spray foam insulation, which makes up
0.6% of the budget. The cost of one apartment is $56 114, all together there are 24
apartments in the residence that are able to accommodate 96 students. Tables 15, D7 and
D8 have further discussion on the apartment costs.
Next component of the budget estimate is roofing. It is 2.2% of the total
budget. Detailed roofing budget is shown in Table D9. Siding is another large component
of the budget which is 13.0% of the total building cost. It significantly contributes to the
exterior appearance of the building. Figure 34 shows the images of the exterior
appearances of the designed building. Table D10 shows that the siding mainly made of
two components: (1) thin brick veneer and (2) lightweight natural stone.
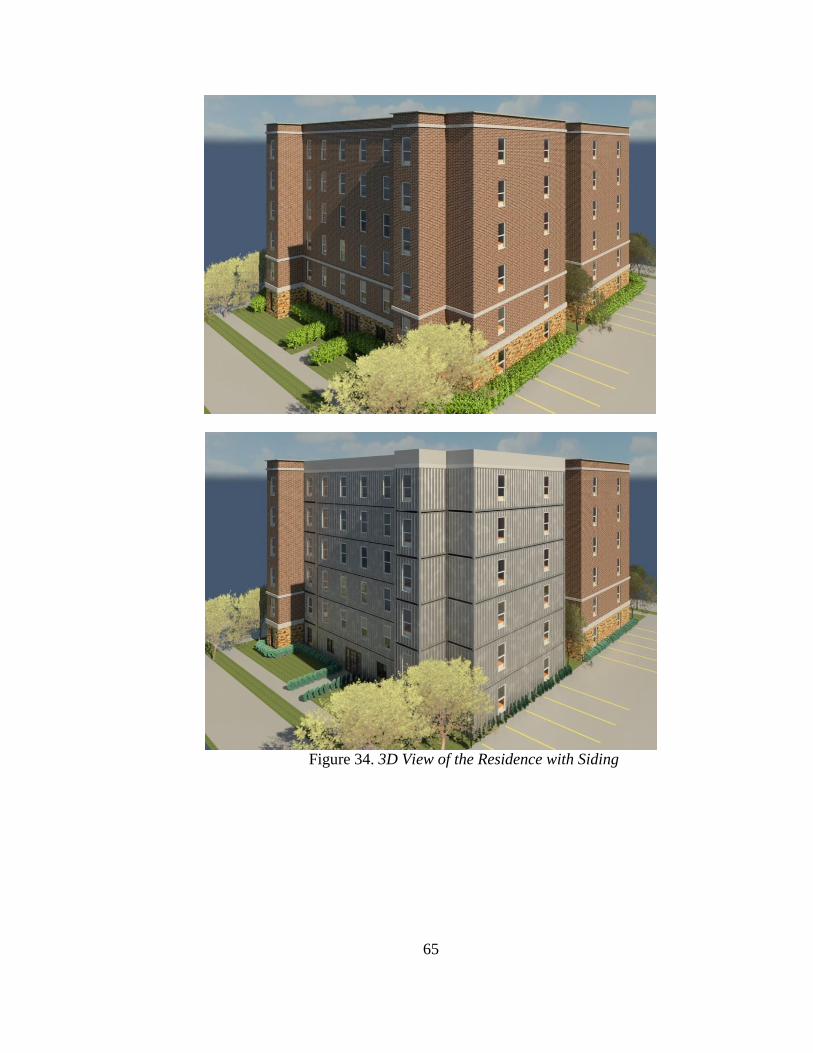
65
Figure 34. 3D View of the Residence with Siding
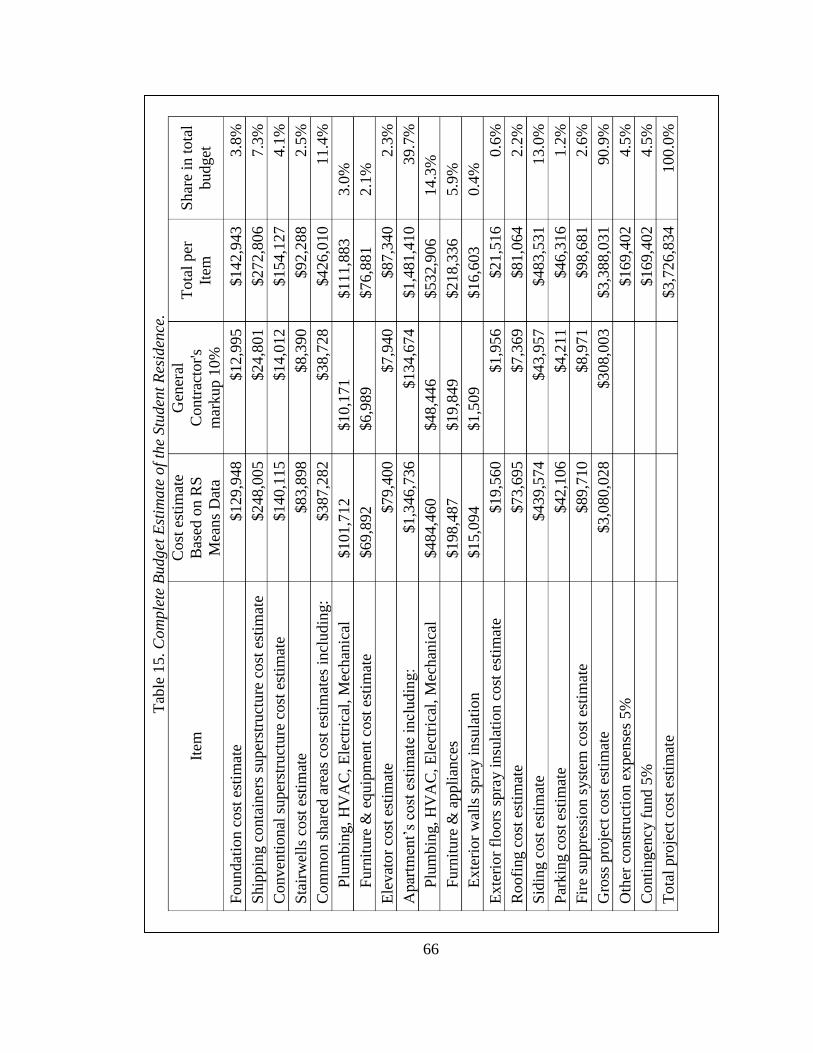
66
Tab
le 1
5. C
om
ple
te B
udg
et E
stim
ate
of
the
Stu
den
t R
esid
ence
.
Item
Cost
est
imat
e
Bas
ed o
n R
S
Mea
ns
Dat
a
Gen
eral
Contr
acto
r's
mar
kup 1
0%
Tota
l per
Item
Shar
e in
tota
l
budget
Foundat
ion c
ost
est
imat
e $129,9
48
$12,9
95
$142,9
43
3.8
%
Ship
pin
g c
onta
iner
s su
per
stru
cture
cost
est
imat
e
$248,0
05
$24,8
01
$272,8
06
7.3
%
Con
ven
tional
super
stru
cture
cost
est
imat
e
$140,1
15
$14,0
12
$154,1
27
4.1
%
Sta
irw
ells
cost
est
imat
e $83,8
98
$8,3
90
$92,2
88
2.5
%
Com
mon s
har
ed a
reas
co
st e
stim
ates
incl
udin
g:
$387,2
82
$38,7
28
$426,0
10
11.4
%
Plu
mbin
g, H
VA
C, E
lect
rica
l, M
echan
ical
$101,7
12
$10,1
71
$111,8
83
3.0
%
Furn
iture
& e
quip
men
t co
st e
stim
ate
$69,8
92
$6,9
89
$76,8
81
2.1
%
Ele
vat
or
cost
est
imat
e $79,4
00
$7,9
40
$87,3
40
2.3
%
Apar
tmen
t’s
cost
est
imat
e in
cludin
g:
$1,3
46,7
36
$134,6
74
$1,4
81,4
10
39.7
%
Plu
mbin
g, H
VA
C, E
lect
rica
l, M
echan
ical
$484,4
60
$48,4
46
$532,9
06
14.3
%
Furn
iture
& a
ppli
ance
s $198,4
87
$19,8
49
$218,3
36
5.9
%
Ex
teri
or
wal
ls s
pra
y i
nsu
lati
on
$15,0
94
$1,5
09
$16,6
03
0.4
%
Ex
teri
or
floors
spra
y i
nsu
lati
on c
ost
est
imat
e $19,5
60
$1,9
56
$21,5
16
0.6
%
Roo
fing c
ost
est
imat
e $73,6
95
$7,3
69
$81,0
64
2.2
%
Sid
ing c
ost
est
imat
e $439,5
74
$43,9
57
$483,5
31
13.0
%
Par
kin
g c
ost
est
imat
e $42,1
06
$4,2
11
$46,3
16
1.2
%
Fir
e su
ppre
ssio
n s
yst
em c
ost
est
imat
e $89,7
10
$8,9
71
$98,6
81
2.6
%
Gro
ss p
roje
ct c
ost
est
imat
e $3,0
80,0
28
$308,0
03
$3,3
88,0
31
90.9
%
Oth
er c
onst
ruct
ion e
xpen
ses
5%
$169,4
02
4.5
%
Con
tingen
cy f
und 5
%
$169,4
02
4.5
%
Tota
l pro
ject
cost
est
imat
e
$3,7
26,8
34
100.0
%

67
Last two components of the budget are parking and fire suspension systems.
Although all three case studies don’t include the cost of land, their lump sum budgets
include overall parking cost estimates, therefore it also include in the current research.
Parking is 1.2% of the total budget. The residence’s parking includes 50 parking spots
which exceeds minimum parking requirements by 2 spots. For the fire suspension system,
it is approximately 3% of the budget’s estimate. The number shown in the Table 15
constitutes 2.6% of the total budget.
Energy Consumption Estimates
In this research, the author used GBS energy simulation tool in order to obtain
the annual figure for the new residence’s annual energy usage. In order to check whether
GBS delivers reliable results, energy simulation on the three case studies were conducted.
For that reason the author modeled the 3 buildings. The 3 models of case studies were
made using Revit Architecture. The author kept similar external shapes of the buildings
and their internal areas. Figures 35, 36 and 37 show the details. Energy simulation test
were made for the two building types: (1) dormitory building type, and (2) multifamily
building type (Table 16).
Table 16. Case Studies’ Energy Simulation Results.
Residences Factual Simulated
as a dorm
Differential
index
Simulated
as a multi-
family
Differential
index
The Lodge on
Willow $120,000 $171,503 30.0% $116,544 -3.0%
Covington
Apartments $23,000 $50,300 54.3% $32,659 29.6%
Crosswalk
Commons $45,000 $65,445 31.2% $45,448 1.0%

68
Simulation results show that it would be misleading to use dormitory building
type while running simulation on alternative residence. Table 16 shows that selecting that
building type makes the difference when study actual annual energy consumption of the
buildings.
Therefore, the author decided to use multifamily type of building while
running energy simulation for the residence designed. Another problem is that the
Covington Apartments energy simulations results exceed factual energy cost by 29.6%
even when multifamily type of building is selected. There is no certainty where this
difference comes from. However some assumptions can be made: (1) residence has the
largest square footage per tenant; it means that there are less energy consuming elements
like light fixtures or kitchen appliances per square foot of residence, (2) the residence is
mostly rented by American students. They don’t live in their apartments during the
summer. During summer time the largest amount of electricity is used for cooling.
However, if no one lives in the apartments, the HVAC systems are inactive. It is
impossible to include seasonality of building usage into GBS. Therefore the simulation
results returned are based on the whole annual building usage. However, excluding June,
July and August, the energy costs from total energy cost generates a figure of $24 582
which differentiates only by 6.88% from $23 000 of factual energy cost.
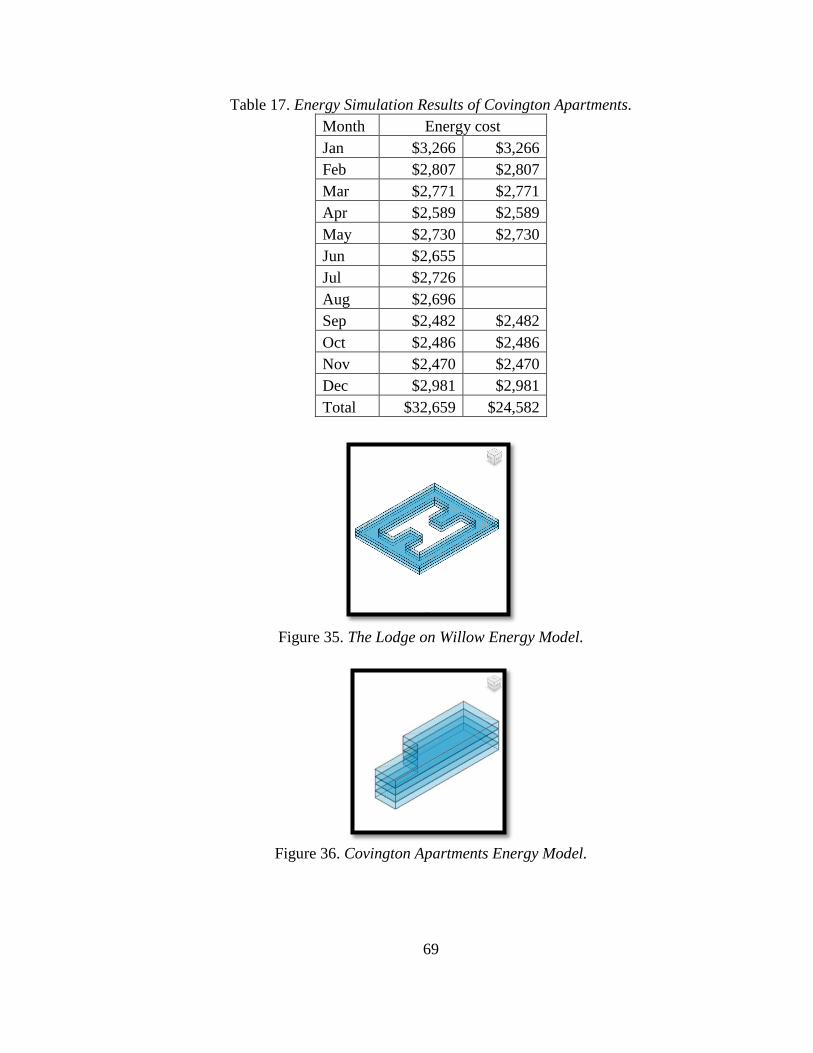
69
Table 17. Energy Simulation Results of Covington Apartments.
Month Energy cost
Jan $3,266 $3,266
Feb $2,807 $2,807
Mar $2,771 $2,771
Apr $2,589 $2,589
May $2,730 $2,730
Jun $2,655
Jul $2,726
Aug $2,696
Sep $2,482 $2,482
Oct $2,486 $2,486
Nov $2,470 $2,470
Dec $2,981 $2,981
Total $32,659 $24,582
Figure 35. The Lodge on Willow Energy Model.
Figure 36. Covington Apartments Energy Model.
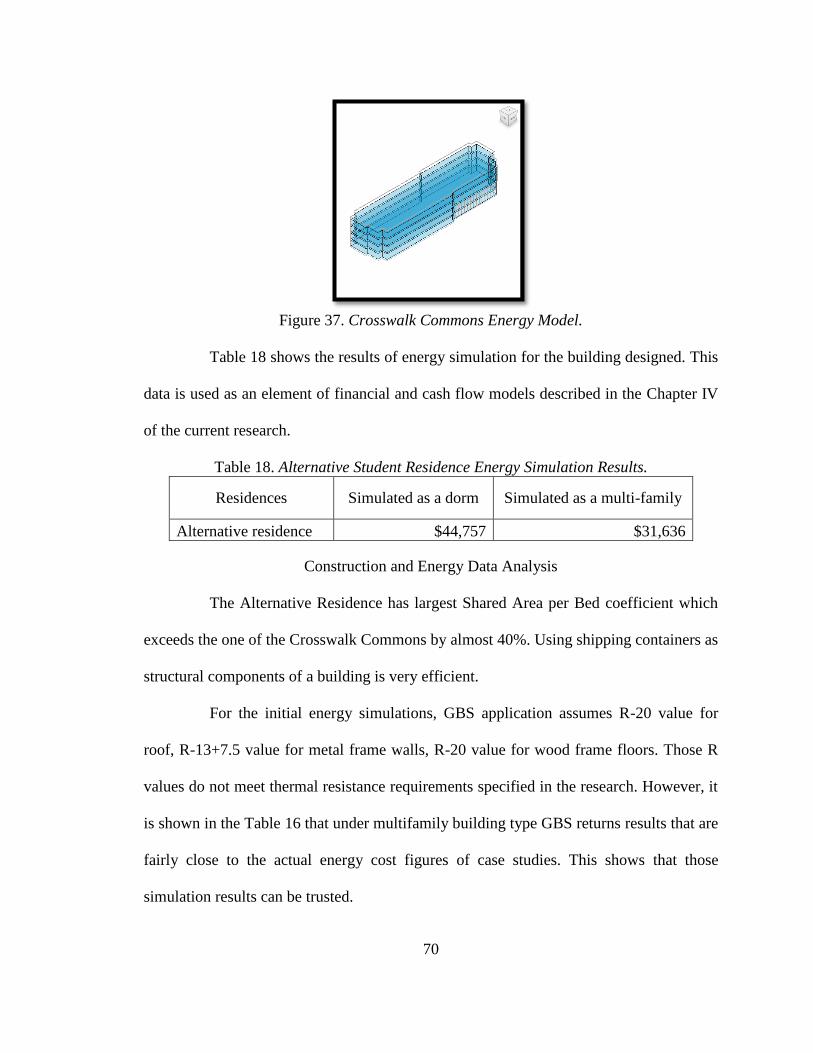
70
Figure 37. Crosswalk Commons Energy Model.
Table 18 shows the results of energy simulation for the building designed. This
data is used as an element of financial and cash flow models described in the Chapter IV
of the current research.
Table 18. Alternative Student Residence Energy Simulation Results.
Residences Simulated as a dorm Simulated as a multi-family
Alternative residence $44,757 $31,636
Construction and Energy Data Analysis
The Alternative Residence has largest Shared Area per Bed coefficient which
exceeds the one of the Crosswalk Commons by almost 40%. Using shipping containers as
structural components of a building is very efficient.
For the initial energy simulations, GBS application assumes R-20 value for
roof, R-13+7.5 value for metal frame walls, R-20 value for wood frame floors. Those R
values do not meet thermal resistance requirements specified in the research. However, it
is shown in the Table 16 that under multifamily building type GBS returns results that are
fairly close to the actual energy cost figures of case studies. This shows that those
simulation results can be trusted.

71
In the research, the author developed a design for exterior components of the
building that meets the basic requirements for thermal resistance. It implies that
exceeding energy consumption should not be expected. Although that type of insulation
could be slightly expensive, the cost of the project as a whole shows that it is possible to
build that type of buildings with reduced amount of financing comparing to conventional
construction. GBS energy simulation reveals that due to fairly small apartment volumes
the Energy per Bed coefficient of the new residence is the smallest in the group (Table
19).
Table 19. Comparison Analysis of General Data of Alternative Residence.
Residence
name
Construction
Budget
(million $)
Square
footage
(SF)
Living area
(SF)
Number
of Beds
Number
of floors
The Lodge
on Willow $13.47 160,000 150,000 307 3
Covington
Apartments $3.00 32,000 26,500 56 5
Crosswalk
Commons $6.20 44,000 31,000 120 4
Alternative
Residence $3.73 38,572 24,210 96 6
Residence
name
Shared
Area/bed
(SF)
Budget/SF Budget/bed
Annual
energy
cost
Energy
cost/bed
The Lodge
on Willow 32.57 $84.2 $43,885 $120,000 $390.88
Covington
Apartments 98.21 $93.9 $53,658 $23,000 $410.71
Crosswalk
Commons 108.33 $140.9 $51,672 $45,000 $375.00
Alternative
Residence 149.60 $96.6 $38,821 $31,636 $329.54

72
Financial Data
The identical concept to the one discussed in Chapter IV is used to identify
monthly rental cost per bed of the alternative student residence. Cost figures of the
project budget and energy consumption are included in the following derivation of Table
20.
Table 20. Derivation of Monthly Rental Price per Bed with Alternative Student Residence
Included.
Item Alternative
residence The Lodge
Covington
Apartments
Crosswalk
Commons
Number of Beds 96 307 56 120
$ Constr./bed $38,821 $43,885 $53,658 $51,672
Total Constr. Cost $3,726,834 $13,472,695 $3,004,848 $6,200,640
Down payment 20% $745,367 $2,694,539 $600,970 $1,240,128
Annual Interest +
Principle Payment at 6% $220,077 $795,588 $177,442 $366,160
ROI at 11% $81,990 $296,399 $66,107 $136,414
Annual expenses 36% $169,913 $614,243 $136,996 $282,698
Vacancy 5% $24,841 $89,802 $20,029 $41,330
Energy cost $31,636 $120,000 $23,000 $45,000
Annual Revenue $528,457 $1,916,032 $423,573 $871,601
Monthly Rent Per Bed $459 $520 $630 $605
The next step is to derive realistic procedure for extrapolated revenue and
expenses from Table 20, taking into consideration the inflation rates. In accordance with
US Department of Labor Bureau of Labor Statistic (2015), the CPI of last 30 years
reveals 2.79% average and 1.14% standard deviation for years 1985 - 2014. Assuming
that inflation falls under the rules of normal distribution as shown in Figure 38, the
authors generated the 28 years of projection of future inflation values using MS Excel
application. Figure E1 shows the details of the calculation. The “NORMINV ()” and
“RAND ()” functions of MS Excel are used to calculate the data in Figure E1. For
example, NORMINV(RAND(), 2.79%, 1.14%) returns the value “X” which is a normal

73
randomized variable with the mean of 2.79% and the standard deviation of 1.14%. “X” is
selected at random using “RAND ()” function of Excel, which returns any number
between 0 and 1 every time any changes made to the Excel file. All the 28 extrapolated
inflation values are generated under the rules of normal distribution. The cost of capital
for the next 28 years is assumed to be a fixed number of 8.33% (Damodaran, 2015).
Figure 38. Normally Distributed Inflation.
The cash flows of the 4 case models are projected for 28 years forward. The
returned values of NPV, IRR, PI, and DPM of the 4 projects are used in the Monte Carlo
simulations with 500 observations. The averages of the simulated values of NPV, IRR,
PI, and DPM are used to draw conclusions.
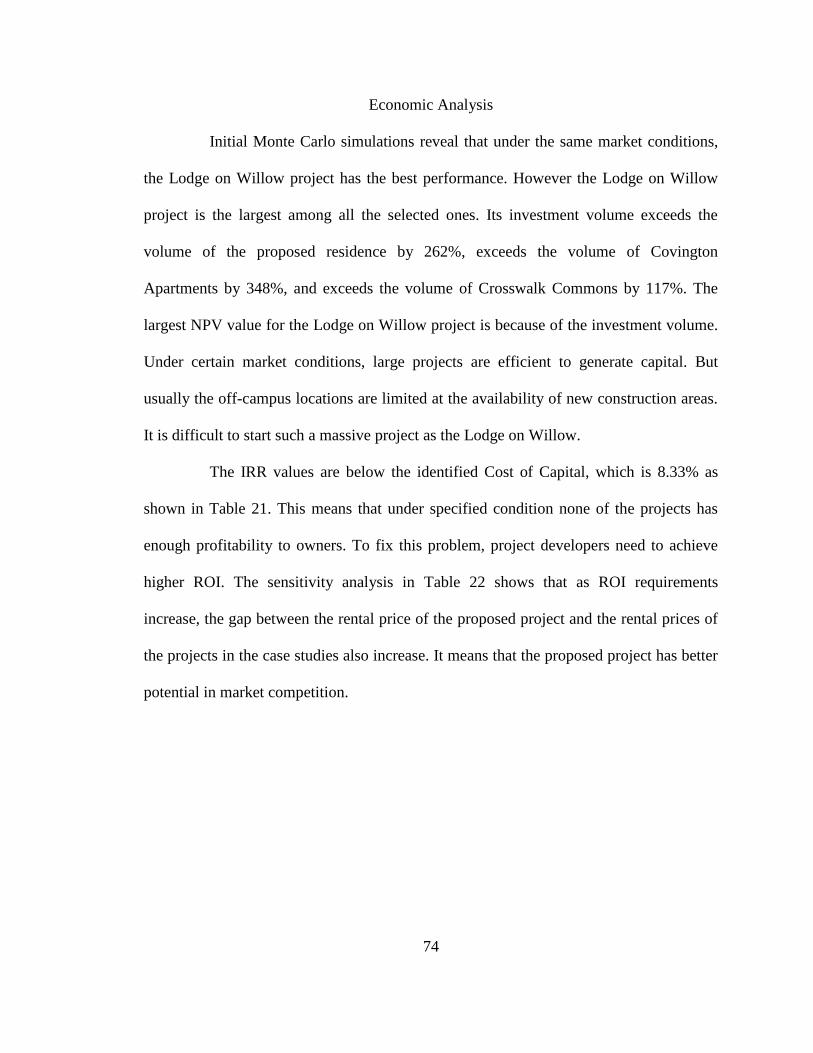
74
Economic Analysis
Initial Monte Carlo simulations reveal that under the same market conditions,
the Lodge on Willow project has the best performance. However the Lodge on Willow
project is the largest among all the selected ones. Its investment volume exceeds the
volume of the proposed residence by 262%, exceeds the volume of Covington
Apartments by 348%, and exceeds the volume of Crosswalk Commons by 117%. The
largest NPV value for the Lodge on Willow project is because of the investment volume.
Under certain market conditions, large projects are efficient to generate capital. But
usually the off-campus locations are limited at the availability of new construction areas.
It is difficult to start such a massive project as the Lodge on Willow.
The IRR values are below the identified Cost of Capital, which is 8.33% as
shown in Table 21. This means that under specified condition none of the projects has
enough profitability to owners. To fix this problem, project developers need to achieve
higher ROI. The sensitivity analysis in Table 22 shows that as ROI requirements
increase, the gap between the rental price of the proposed project and the rental prices of
the projects in the case studies also increase. It means that the proposed project has better
potential in market competition.
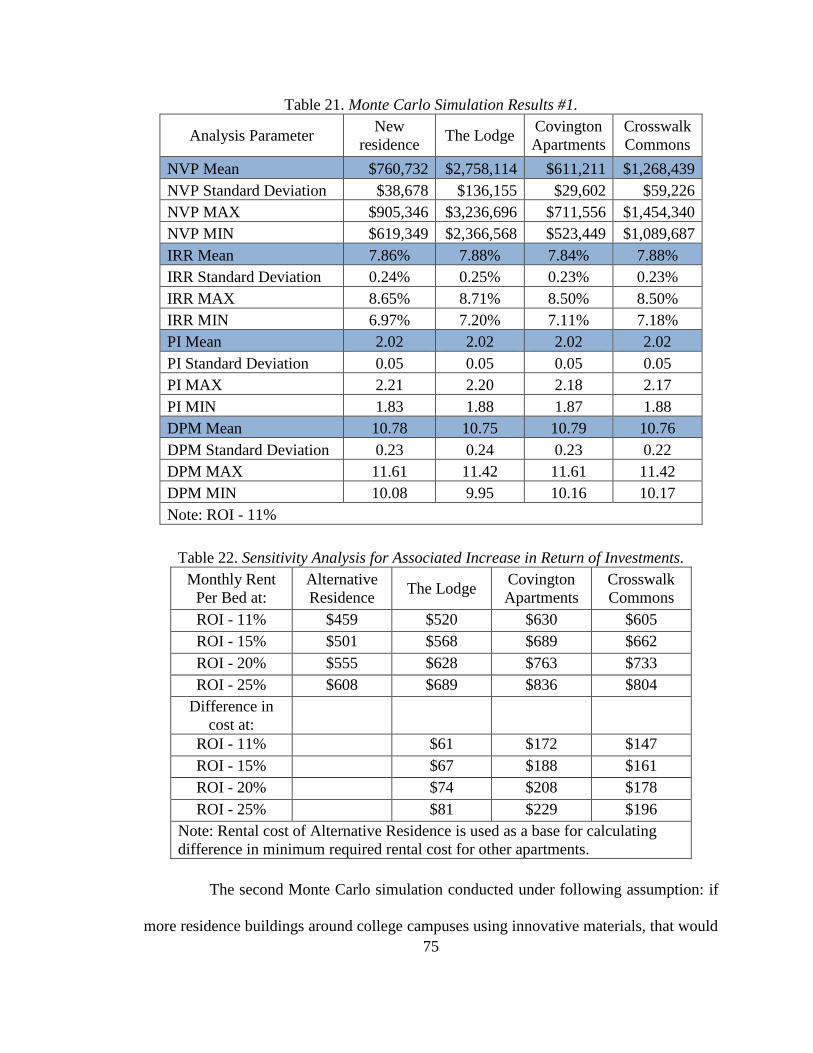
75
Table 21. Monte Carlo Simulation Results #1.
Analysis Parameter New
residence The Lodge
Covington
Apartments
Crosswalk
Commons
NVP Mean $760,732 $2,758,114 $611,211 $1,268,439
NVP Standard Deviation $38,678 $136,155 $29,602 $59,226
NVP MAX $905,346 $3,236,696 $711,556 $1,454,340
NVP MIN $619,349 $2,366,568 $523,449 $1,089,687
IRR Mean 7.86% 7.88% 7.84% 7.88%
IRR Standard Deviation 0.24% 0.25% 0.23% 0.23%
IRR MAX 8.65% 8.71% 8.50% 8.50%
IRR MIN 6.97% 7.20% 7.11% 7.18%
PI Mean 2.02 2.02 2.02 2.02
PI Standard Deviation 0.05 0.05 0.05 0.05
PI MAX 2.21 2.20 2.18 2.17
PI MIN 1.83 1.88 1.87 1.88
DPM Mean 10.78 10.75 10.79 10.76
DPM Standard Deviation 0.23 0.24 0.23 0.22
DPM MAX 11.61 11.42 11.61 11.42
DPM MIN 10.08 9.95 10.16 10.17
Note: ROI - 11%
Table 22. Sensitivity Analysis for Associated Increase in Return of Investments.
Monthly Rent
Per Bed at:
Alternative
Residence The Lodge
Covington
Apartments
Crosswalk
Commons
ROI - 11% $459 $520 $630 $605
ROI - 15% $501 $568 $689 $662
ROI - 20% $555 $628 $763 $733
ROI - 25% $608 $689 $836 $804
Difference in
cost at:
ROI - 11% $61 $172 $147
ROI - 15% $67 $188 $161
ROI - 20% $74 $208 $178
ROI - 25% $81 $229 $196
Note: Rental cost of Alternative Residence is used as a base for calculating
difference in minimum required rental cost for other apartments.
The second Monte Carlo simulation conducted under following assumption: if
more residence buildings around college campuses using innovative materials, that would

76
drive the average rental price down. The simulation analysis revealed that the breakeven
of ROI requirement is slightly above 11%. Therefore developers would require at least
12% ROI. The minimum required rental price is $469 per bed per month. Table 23 shows
the results of NPV analysis.
Table 23. Monte Carlo Simulation Results #2.
Analysis Parameter
Alternative
residence
(AR)
The Lodge Covington
Apartments
Crosswalk
Commons
NVP Mean $913,615 ($32,971) ($967,754) ($1,599,674)
NVP Standard Deviation $42,012 $66,891 $9,060 $8,415
NVP MAX $1,076,374 $188,798 ($944,771) ($1,575,521)
NVP MIN $805,978 ($237,518) ($998,450) ($1,631,324)
IRR (AR) - 9.29%
PI (AR) - 2.23
DPM (AR) - 9.50
Recommendations for Future Research and Conclusion
Results shown in the Table 23 reveal that conventional buildings don’t have
the same economic competitiveness with the innovative building (See Appendix E and F
for details). It doesn’t mean that conventional student residences shouldn’t be built. The
owners of conventional buildings won’t necessarily have financial losses if innovative
residences gain more market.
One recommendation for future research is to study customer preferences. It is
important to know whether customers would prefer to live in provided innovative
housing. The research reveals that from economical point of view the idea of integrating
shipping containers as structural components of buildings is practical and sound, but it
won’t help developers earn profit if students prefer to live in conventional housing.
Further research recommendations are: (1) developing detailed design and budget

77
estimates of the project for such components as plumbing, electrical, HVAC and fire
suspension systems. (2) Though it was mentioned that usage of shipping containers can
allow for faster project delivery, it is still a question how long will it take to build the
residence developed in the research. To answer this question it would be rational to
develop detailed project schedules and integrate them into BIM 4D software. (3) Develop
methodologies of prefabricated construction. Prefabrication will provide a way for more
efficient project delivery in terms of time and money. Theoretically modified, insulated,
and finished containers with integrated electrical, plumbing and duct work can be
delivered on project site and assembled together.
The analysis show that shipping containers could be used to replace the
traditional structural components and construction materials for student housing
purposes. Energy simulation doesn’t reveal any significant increases in energy
consumption of the building. Residence design methodology shows that it is absolutely
feasible to build mid-rise buildings integrating shipping containers as a structural
component. Project cost estimation supports the idea that the usage of shipping containers
can significantly reduce construction cost.

78
REFERENCES
Andjelković, B. V., Stojanović, B. V., Stojiljković, M. M., Janevskić, J. N., & Stojanović,
M. B. (2012). Thermal mass impact on energy performance of a low, medium,
and heavy mass building in Belgrade. Thermal Science, 16(2), S447.
Argon, J. (2008). Annual Residence Hall Construction Report. American School and
University, 20, 6. Retrieved December 14, 2014, from
http://asumag.com/Construction/res_halls/residence-hall-construction-report-
200906?page=6
Autodesk. (n.d.). Green building studio user guide - using Green Building Studio with
Revit Architecture and Revit MEP. Retrieved December 15, 2014 from
http://images.autodesk.com/adsk/files/using_green_building_studio_with__revit.p
df
Bolotin, S. A., Gurinov, A. I., Dadar, A. H., & Oolakay, Z. H. (2013). An energy
efficiency evaluation of architectural and construction solutions of an initial
design stage in Autodesk REVIT Architecture. (English). Magazine of Civil
Engineering, (8), 64-91.
Cooper, J., Kilmer, J., Wands, B. (2003). Stacking shipping containers on land for an off-
axis detector. Fermi National Accelerator Laboratory, Batavia, IL 60510.
Retrieved December 14, 2014, from http://nova-
docdb.fnal.gov/0003/000308/001/nova0008.pdf
Crepeau, R. L. (2009) Shipping Container Drawings. Retrieved February 2, 2015 from
http://www.arktist.com/ArkPhoenix/ShippingContainerDwgs/containerdwgs.html
Crosswalk Project, Inc. (2015). Crosswalk commons. Retrieved March 23, 2015 from
http://www.crosswalkcommons.com/about-international-living-learning-
community
De Coster, D. A., & Mable, P. (1974). Student development and education in college
residence halls, David A. De Coster and Phyllis Mable, editors. Washington,
American College Personnel Association [c1974].
Damodaran, A. (2015). Cost of Capital by Sector. Retrieved June 3, 2015 from:
http://pages.stern.nyu.edu/~adamodar/New_Home_Page/datafile/wacc.html.htm
Drummer, R. (2013, February 13). Boom in student housing construction stokes concerns
of oversupply. Retrieved January 9, 2015 from
http://www.costar.com/News/Article/Boom-In-Student-Housing-Construction-
Stokes-Concerns-of-Oversupply/145715
Edwards, B., Hyett, P. (2002). Rough guide to sustainability, London: RIBA.
Energy.gov. (2015, January 23). Types of insulation. Retrieved January 29, 2015 from
http://energy.gov/energysaver/articles/types-insulation
Estes, H. M. (2011). Economic analysis of energy retrofit of buildings. (Unpublished
thesis). The University of Alabama, Tuscaloosa Alabama.

79
First Site. (n.d.). Uptown North. Retrieved January 9, 2015 form
http://www.firstsiteapartments.com/on-campus/apartment-
listings/bedrooms/3/property/uptown-north
Frederiksen, C. F. (1979). Managing college and university housing. Business Officer, 12,
22-24.
Frost, S. (2014). The disadvantages to staying in dorms. Retrieved January 11, 2015 from
http://education.seattlepi.com/disadvantages-staying-dorms-2614.html
Giriunas, K., Sezen, H., & Dupaix, R. B. (2012). Evaluation, modeling, and analysis of
shipping container building structures. Engineering Structures, 43, 48-57.
doi:10.1016/j.engstruct.2012.05.001
Gooch, J. W. (2010). Encyclopedic dictionary of polymers [electronic resource] / edited
by Jan W. Gooch. New York; London: Springer, 2010
Granadeiro, V., Duarte, J., Correia, J., & Leal, V. (2013). Building envelope shape design
in early stages of the design process: Integrating architectural design systems and
energy simulation. Automation in Construction, 32, 196-209.
Green Building Studio. (n.d.). Cloud-based energy analysis software. Retrieved
December 15, 2014 from http://www.autodesk.com/products/green-building-
studio/overview
Guy, S. (2000). A sociology of energy, buildings and the environment: constructing
knowledge, designing practice. Routledge.
Hardeman, R., Gerrard, M. D., & Owe, G. (2011). Minnesota Teen Challenge follow - up
study. Retrieved December, 2104 from http://teenchallengeusa.com/about/studies
HEDD Engineered Design. (n.d.). Double ended twist locks. Retrieved April 7, 2015
from http://www.cornercastings.com.au/double-ended-twist-locks/
Herr, R. (2011, April 12). 10 Facts about shipping containers. Retrieved January 12, 2015
from http://containerauction.com/read-news/10-facts-about-shipping-containers
HL Design Group. (2010). Research for proposed guest house / hotel project. Research
document on shipping container architecture. Retrieved December 14, 2014 from
http://www.slideshare.net/PB4000XL/shipping-container-architecture-research
ISU. (2015). Quick facts of Illinois State University. Office of Admissions. Retrieved
January 9, 2015 from http://admissions.illinoisstate.edu/freshman/about/facts.php
Keitsch, M. (2012). Sustainable architecture, design and housing. Sustainable
Development, 20(3), 141-145.
Kensek, K. M., & Noble, D. (2014). Building information modeling: BIM in current and
future practice / [edited by] Karen M. Kensek, Douglas Noble. Hoboken, New
Jersey: Wiley, [2014].
Kreith, F., Goswami, D. (2007) Handbook of energy efficiency and renewable energy
[Electronic Resource] / Edited by Frank Kreith, D. Yogi Goswami [e-book]. Boca
Raton: CRC Press.
Lucko, G. (2013). Supporting financial decision-making based on time value of money
with singularity functions in cash flow models. Construction Management &
Economics, 31(3), 238-253.
Marsh, P. (2010). Sustaining technical efficiency and the socialized home: examining the
social dimension within sustainable architecture and the home. International
Journal of Interdisciplinary Social Sciences, 5(5), 287-298.
80
Maxman, S. (1993). Shaking the Rafters. Earthewatch, 11.
Merschbrock, C., Munkvold, B. (2012). A research review on building information
modeling in construction-an area ripe for is research. Communications of the
Association for Information Systems, 31, 207-228.
Mohamad, K., Phillip, B., Gillian, M. (2009). Life-cycle assessment and the
environmental impact of buildings: a review. Sustainability [serial online].
(3):674.
Narayanan, M. (1985). Observability and the Payback Criterion. Journal of Business,
58(3), 309-323.
Nassar, K. (2012). Assessing Building Information Modeling estimating techniques using
data from the classroom. Journal of Professional Issues in Engineering Education
& Practice, 138(3), 171-180.
National Center for Education Statistics. (n.d.). Admission trends [Data file]. Retrieved
December 16, 2014 from http://nces.ed.gov/ipeds/datacenter
Newnan, D. G., Lavelle, J. P., & Eschenbach, T. (2004). Engineering economic analysis /
Donald G. Newnan, Ted G. Eschenbach, Jerome P. Lavelle. New York: Oxford
University Press, 2004.
Park, C. S. (1997). Contemporary Engineering Economics, 2nd ed. Menlo Park: Addison-
Wesley Longman, Inc.
Professionals Corner. (n.d.). R-Value Table. Retrieved January 29, 2015 form
http://www.coloradoenergy.org/procorner/stuff/r-values.htm
Ranking Web of Universities. (2014, January). Countries arranged by Number of
Universities in Top Ranks. Retrieved January 9, 2015 from
http://www.webometrics.info/en/node/54
Page, R. M., & O'Hegarty, M. (2006). Type of student residence as a factor in college
students' alcohol consumption and social normative perceptions regarding alcohol
use. Journal of Child & Adolescent Substance Abuse, 15(3), 15-31.
Realtor.com. (n.d.). Rental rates for Normal Illinois. Retrieved January 10, 2015 from
http://www.realtor.com/local/Normal_IL/rent-prices
Riker, C. H., & DeCoster, A. D. (2008). The educational role in college student housing.
The journal of college and university student housing, 35(2), 80-85.
Residential Prescriptive Requirements. (2009) International Energy Conservation Code
(IECC). Retrieved January 28, 2015 from
https://energycode.pnl.gov/EnergyCodeReqs/?state=Illinois.
Residential Shipping Container Primer. (n.d.) ISO shipping containers and building code
requirements. Retrieved December 15, 2014 from
http://www.residentialshippingcontainerprimer.com/ISO%20Shipping%20Contai
ners%20and%20Building%20Code%20Requirements.
Rodriguez, J. (n.d.). ADA Guidelines for Handicapped Bathrooms. Retrieved March 25,
2015 from http://construction.about.com/od/Inspection/a/Ada-Regulations-For-
Handicapped-Bathrooms.htm
RSMeans building construction cost data 2014. (2013). Norwell, MA : RSMeans, 2013
Russell, C. (2009). Energy Cost Control: How the Money Works, Internet Presentation to
the U.S. Department of Energy Industrial Technologies Program.

81
Sebastian, R. (2010). Integrated design and engineering using building information
modelling: a pilot project of small-scale housing development in the Netherlands.
Architectural Engineering & Design Management, 6(2), 103-110.
doi:10.3763/aedm.2010.0116
Shrestha, P. P., & Kulkarni, P. (2013). Factors influencing energy consumption of energy
star and non-energy star homes. Journal of Management in Engineering, 29(3),
269-278.
Sultanguzin, I., Isaev, M., & Kurzanov, S. (2010). Optimizing the production of coke,
coal chemicals, and steel on the basis of environmental and energy criteria.
Metallurgist, 54(9/10), 600-607. doi:10.1007/s11015-011-9346-1
US Census. (2015). Population Demographics for Normal, Illinois in 2014 and 2015
[Data file]. Retrieved January 9, 2015 from
https://suburbanstats.org/population/illinois/how-many-people-live-in-normal
US Department of Housing and Urban Development. (n.d.) Design Loads for Residential
Buildings. Retrieved March 26, 2015 from www.huduser.org/portal/home.html
US Department of Labor Bureau of Labor Statistic. (2015). Consumer Price Index Data
from 1913 to 2015. Retrieved June 2, 2015 from:
http://www.usinflationcalculator.com/inflation/consumer-price-index-and-annual-
percent-changes-from-1913-to-2008/
Vanek, F., Albright, L. (2008). Energy Systems Engineering [Electronic Resource]:
Evaluation and Implementation / Francis M. Vanek, Louis D. Albright [e-book].
New York: McGraw-Hill
Wallace, J. A. (2012). The Philosophy of University Housing. Journal Of College &
University Student Housing, 38/39(2/1), 94-99.
Zuiderwyk, C. (2014, January 28). Average port container life span and wear and tear.
Retrieved January 12, 2015 from
http://www.portcontainerservices.com.au/blog/2014/01/average-port-container-
life-span-wear-tear/
82
APPENDIX A
JUSTIFICATION OF THE STUDENT HOUSING
WITH COMMUNITY FELLOWSHIP
ELEMENTS
In order to help students to grow culturally, spiritually, and psychologically in
community, the proposed student residence should have an administrative personnel.
Hiring the paid management personnel would take care of the students’ social and
psychological development. But the method still has pitfalls. For example, it could not
stop students from seeking opportunities for alcohol abuses. In addition, it has very
limited function in help students with spiritual growth. A better solution could be a
Christian administration. In Chapter IV, the author presented a case study of “Crosswalk
Commons” student residence that had a Christian administration. The administration of
“Crosswalk Commons” extended welcoming hands to residents through housing. The
housing was specifically designed for international students (Crosswalk Project, Inc.,
2015). With the support of Salt and Light Christian Fellowship the residence
administration was able to guide students thought life issues and help them to understand
other cultures and ways of life (Crosswalk Project, Inc., 2015).
It showed that the students under that type of leadership would most likely start
seeking satisfaction in developing their spirituality instead of ruining their life through
alcohol or drug abuse (Hardeman, et al., 2011). Wilder Research is an independent
83
evaluator, it conducted a research for “Teen Challenge” - the Christian drug and alcohol
rehab centers (Hardeman, et al., 2011). They sampled and conducted one-year follow-up
telephone interviews with “Teen Challenge” graduates (Hardeman, et al., 2011).
Researchers found that 74% of graduates reported “no use of drug or alcohol in the 6
months prior to follow-up, while 62% of graduates reported no relapses since graduation
nor use in the past 6 months” (Hardeman, et al., 2011). Those successful rates are
significantly higher than the rates of non-faith based rehab centers. That shows the
success of Christian leadership in helping young generation to make right decisions for
their future. The Christian leadership could be trusted as a management method for
student residence. The above data support the author’s decision to design a fellowship
hall in the proposed project.

84
APPENDIX B
INTERVIEWS
Interview #1 (January 28, 2015)
Interviewer: Tofig Mammadov - Graduate student at Department of
Technology in Illinois State University
Interviewee: Andy Netzer - Licensed Managing Broker of Young America
Realty, Inc. since 2013.
Andy was managing approximately 35 employees. He oversaw approximately
1600 living units - 3300 beds. He has experiences in construction project management
and project development. The following is the questionnaire used in the interview.
Please complete the following questions to reflect your opinions as accurately
as possible and to answer factual questions to the best of your knowledge.
1. Average rental price per person for old buildings (before 2008) $509 (4BR)
2. Average rental price per person for new buildings (since January 2008) $706
3. Average square footages of the following areas:
a. Bedroom: 100-150 ft2 (new buildings targeting 150 ft2)
b. Living room and kitchen: 300-700 ft2
c. Bathrooms: 40-50 ft2
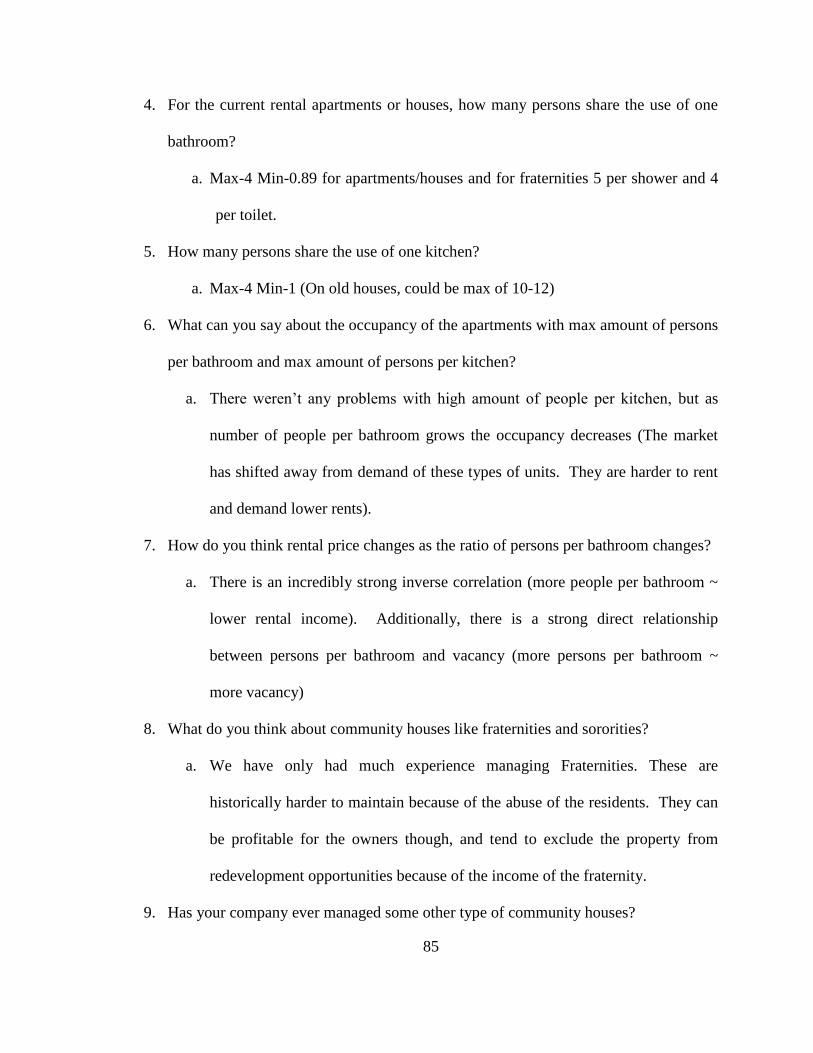
85
4. For the current rental apartments or houses, how many persons share the use of one
bathroom?
a. Max-4 Min-0.89 for apartments/houses and for fraternities 5 per shower and 4
per toilet.
5. How many persons share the use of one kitchen?
a. Max-4 Min-1 (On old houses, could be max of 10-12)
6. What can you say about the occupancy of the apartments with max amount of persons
per bathroom and max amount of persons per kitchen?
a. There weren’t any problems with high amount of people per kitchen, but as
number of people per bathroom grows the occupancy decreases (The market
has shifted away from demand of these types of units. They are harder to rent
and demand lower rents).
7. How do you think rental price changes as the ratio of persons per bathroom changes?
a. There is an incredibly strong inverse correlation (more people per bathroom ~
lower rental income). Additionally, there is a strong direct relationship
between persons per bathroom and vacancy (more persons per bathroom ~
more vacancy)
8. What do you think about community houses like fraternities and sororities?
a. We have only had much experience managing Fraternities. These are
historically harder to maintain because of the abuse of the residents. They can
be profitable for the owners though, and tend to exclude the property from
redevelopment opportunities because of the income of the fraternity.
9. Has your company ever managed some other type of community houses?

86
a. We manage 3 large houses for Christian groups that choose to use the house
for ministry. There was no property abuse as appose to fraternities. One
concern of the Christian groups is to have cheapest available housing option
closer to campus. Tenants take good care of the house.
10. What are common problems with managing apartment buildings?
a. Single family houses
i. Issues with vacancy or large maintenance costs can wipe out the profit
for a full year or more.
b. Apartments
i. Noisy neighbors, keeping property clean and respectable. In student
housing, parties, litter, damage due to student party behavior.
11. Which apartments are easier to lease?
a. Apartments with greater amenities (more bathrooms, nicer features, larger
square footage), that are close to campus
12. Why property owners don’t want to demolish their old buildings and build new
projects?
a. Even though the property may look junky, if the income is substantial, it may
not make economic sense to demolish for redevelopment. A value based on
income must be established for the existing building, and when it will be
demolished this value should be ascribed to the cost of land for the new
project. In many cases, the high cost of land makes redevelopment not
feasible.

87
13. Would you be interested to build a property using alternative construction materials
(shipping containers)?
i. I would be highly skeptical
b. What would you be concerned about (most to least)?
i. Cost (first, always is cost); steel work requires union steel workers and
erectors-two very expensive trades compared to residential
construction. Other trades may struggle as this type of construction
would be unconventional.
ii. Aesthetics and Architectural creativity would be limited
iii. How to insulate? (Thermal and acoustic insulation)
iv. How to maintain?
v. Would this be a type of construction that would be "timeless" and
would last many years?

88
Interview #2 (January 30, 2015)
Interviewer: Tofig Mammadov - Graduate student at Department of Technology
in Illinois State University
Interviewee: Byron Stoller -Manager of Maintenance Department, Young
America Realty, Inc. since 1976.
1. What is the current market price of square foot of construction?
a. approximately $125
2. What types of insulation are most popular in residential construction?
i. Most expensive, but the best R value per inch: spray foam
ii. Less expensive, but lower R value per inch: cellulose
iii. Cheapest and lowest R value per inch: fiberglass
a. Can we insulate our buildings from the outside?
iv. Yes, but in the modern world it is not common. If there is outside
insulation then it should not exceed 2 inch thickness, otherwise it is
hard to finish.
b. How to finish outside insulation?
v. Vinyl siding would be considered the cheapest
c. How to insulate from the inside if the construction is made out of shipping
containers?
vi. The interior finishing would be the greatest concern. As long as
there is something that allows installing drywalls then any type of
insulation can be used.
3. How to install drywalls without framing

89
i. As long as it is possible to insert screws into steel walls of a shipping
container, there should be no problems with drywalls installation.
Interview #3 (May 6, 2015)
Interviewer: Tofig Mammadov - Graduate student at Department of
Technology in Illinois State University
Interviewee: Bob Lukowski - Rental Coordinator at Great Lakes Kwik Space,
since 2014.
1. Price of 40’ high cube shipping container approximately $2 200 per unit
2. Price of delivery approximately $350 per unit

90
APPENDIX C
CASE STUDIES
Case study #1: The Lodge on Willow
1. Location: 214 W. Willow, Normal IL 61761
2. Purpose: Student Housing (Residential only, no commercial)
3. Envelope materials: Wood framing with wood exterior sheeting, moisture barrier, and
mostly brick and stone veneer. Small amount of wood siding. Also small amount of
vinyl siding.
4. Residence is managed by: Young America Realty, Inc.
5. Do you think that this residence affects student’s studying performance?
i. There may be some benefit derived from the clubhouse, which has study tables,
computers, and printer. However, this may be offset by the distraction a pool
provides as an alternative to studying.
6. Date of the beginning of construction: May, 2011
7. Date of the beginning of exploitation: June, 2012
8. Number of floors (including ground level):3
9. Number of apartments: 79
10. Numerical data
i. Section A:
1. Total cost of the building (not including price of the lot): $13.4 Million

91
2. Total square footage of the building (ft2): 160,000
3. Share of the building allocated for apartments (ft2): 150,000
4. Total number of beds: 307
ii. Section B:
1. Construction cost (subtract price of the lot) per bed:$43,650
2. Construction cost (subtract price of the lot) per ft2:$84
11. Fellowship hall: Yes, in Clubhouse, 4500 ft2;
12. Studying rooms: Yes, in clubhouse
13. Other features:
i. Pool, Hot tub, Clubhouse, conference room, Wi-Fi at pool/clubhouse, computers
and printer provided, grill center, and fire pit.
14. Average annual electrical expenses in US dollars: $120,000
15. If possible, please attach some interior and exterior pictures of the residence to the
email.
i. http://www.thelodgeonwillow.com
16. Feel free to make any advices for similar building design:
i. This property turned out very well. I’m not sure I’d change much about it. We
would love to have additional land to build a second Lodge!
Questions are answered by: Andy Netzer, General Manager & Managing Broker of
Young America Realty
Date: March 11, 2015

92
Case study #2: Covington Apartments
1. Location: 102 W. Cherry, Normal IL 61761
2. Purpose: Student Housing (Residential only, no commercial)
3. Envelope materials: Wood framing and exterior sheeting with moisture barrier. Brick
veneer.
4. Residence is managed by: Young America Realty, Inc.
5. Do you think that this residence affects student’s studying performance?
ii. I do not think the quality of housing affects the students’ ability to study
effectively.
6. Date of the beginning of construction:October, 2012
7. Date of the beginning of exploitation: August, 2013
8. Number of floors (including ground level):5
9. Number of apartments: 16
10. Numerical data
iii. Section A:
1. Total cost of the building (not including price of the lot): $3.09 Million
2. Total square footage of the building (ft2): 32,000
3. Share of the building allocated for apartments (ft2): 26,500
4. Total number of beds: 56
iv. Section B:
1. Construction cost (subtract price of the lot) per bed$55,200
2. Construction cost (subtract price of the lot) per ft2:$96.56
11. Fellowship hall: No

93
12. Studying rooms: No
13. Other features:
v. Covered parking
14. Average annual electrical expenses in US dollars: $23,000
15. If possible, please attach some interior and exterior pictures of the residence to the
email.
vi. http://yarealty.com/student/apartments/bedrooms/3/property/untitled-amsd-item-27
16. Feel free to make any advices for similar building design:
i. Cost was significantly high. I would like to find a way to avoid having to create a
non-combustible barrier between the parking level and the upper levels. This code
requirement costs significantly.
Questions are answered by: Andy Netzer, General Manager & Managing Broker of
Young America Realty
Date: March 11, 2015

94
Case study #3: Crosswalk Commons
1. Location: 925 Hilltop Drive, West Lafayette, IN 47906
2. Purpose: International learning and living community
3. Envelope materials: Wood frame with Stone masonry/aluminum metal siding
4. Residence is managed by: Crosswalk Project, Inc.
5. Do you think that this residence affects student’s studying performance?
i. We seek to provide a quiet community-oriented environment which contributes to
the success of our residents.
6. Date of the beginning of construction:September 2012
7. Date of the beginning of exploitation: August 2013
8. Number of floors (including ground level):4
9. Number of apartments: 32
10. Numerical data
i. Section A:
1. Total cost of the building (not including price of the lot): $5.57 Million
2. Total square footage of the building (ft2): 44,000
3. Share of the building allocated for apartments (ft2): 31,000
4. Total number of beds: 120
ii. Section B:
5. Construction cost (subtract price of the lot) per bed$46,417
6. Construction cost (subtract price of the lot) per ft2:$126.6
11. Fellowship hall: Yes
12. Studying rooms: Yes

95
13. Other features:
i. Ping pong table, fireplace, community kitchen area, learning center/theater room.
14. Average annual electrical expenses in US dollars: $45,000
15. If possible, please attach some interior and exterior pictures of the residence to the
email.
http://www.crosswalkcommons.com/gallery/
16. Feel free to make any advices for similar building design:
ii. Instead of two larger study rooms, I would include smaller study rooms for
individual use. Floors 2, 3 and 4 at Crosswalk have an open lounge/study area at
the end of each hall...if I had an opportunity to redesign, these areas would be
smaller.
Questions are answered by: Paul Briggs, Secretary/Treasurer, Crosswalk Project, Inc.
Date: March 11, 2015.

96
AP
PE
ND
IX D
RE
SID
EN
CE
BU
DG
ET
ES
TIM
AT
E
Tab
le D
1. F
oundati
on C
ost
Est
imate
.
Item
A
mount
RS
Mea
ns
Dat
a
line
num
ber
U
nit
Cost
per
unit
incl
udin
g
O&
P
Cost
Pil
e C
ap-1
Pil
e: 3
9"x
39"x
35"
2156.7
03 3
0 5
3.4
0.5
900
C
ubic
Foot
$12.0
4
$25,9
60
Pil
e-S
teel
Pip
e: 1
6"
Dia
met
er
1400.0
31 6
2 2
3.1
3.3
800
F
oot
$60.5
0
$84,7
00
Ex
cavat
ion
40480.0
31 2
3 1
6.4
6.5
200
C
ubic
Foot
$0.1
1
$4,5
88
Pil
e dri
vin
g s
et u
p
1.0
31 0
6 6
0.1
4.1
100
E
ach
$14,7
00.0
0
$14,7
00
Tota
l
$129,9
48
O&
P -
Ov
erhea
d a
nd P
rofi
t

97
Tab
le D
2. Ship
pin
g C
onta
iner
s Super
stru
cture
Cost
Est
imate
.
Type
Am
ount
Req
uir
ed S
teel
cutt
ing i
n F
T
Cost
of
modif
icat
ion
Cost
of
Del
iver
ed
Conta
iner
s
Tota
l
Cost
40' H
C f
or
two B
R
24
78
$3,9
12
$61,2
00
$65,1
12
40' H
C f
or
BR
, H
all
and B
ath
24
132
$6,6
21
$61,2
00
$67,8
21
40' H
C f
or
BR
and K
itch
en
24
108
$5,4
17
$61,2
00
$66,6
17
40' H
C f
or
Entr
ance
2
154
$644
$5,1
00
$5,7
44
40' H
C f
or
Fel
low
ship
Hal
l 2
168
$702
$5,1
00
$5,8
02
40' H
C f
or
Stu
dyin
g A
rea
8
150
$2,5
08
$20,4
00
$22,9
08
Tw
ist
Lock
s 280
$14,0
00
Tota
l 84
$19,8
05
$214,2
00
$248,0
05
HC
- h
igh c
ub
e | B
R -
bed
room
Cost
of
1 d
eliv
ered
40’
HC
conta
iner
: $ 2
550
(in
cludes
del
iver
y c
har
ge
of
$35
0 p
er c
onta
iner
, fr
om
Chic
ago,
Il
to N
orm
al,
Il.)
RS
mea
ns
line
num
ber
fo
r st
eel
cutt
ing:
05 0
5 2
1.1
0.0
050 (
Cost
per
FT
: $2.0
9).
Bas
ed o
n o
nli
ne
sear
ch a
ver
age
pri
ce o
f tw
ist
lock
s is
ass
um
ed t
o b
e $50 p
er u
nit
.
Cost
of
bolt
s an
d n
uts
is
not
incl
uded
, 5%
of
oth
er e
xpen
ses
is c
over
ing t
his
type
of
cost
s.

98
Tab
le D
3. C
onve
nti
onal
Super
stru
cture
Cost
Est
imate
.
Type
RS
Mea
ns
Dat
a
line
nu
mber
D
escr
ipti
on
U
nit
s
Cost
per
unit
incl
udin
g
O&
P
Am
ount
Cost
per
elem
ent
Rei
nfo
rced
Concr
ete
Co
lum
ns
03 3
0 5
3.4
0.1
100
4000 p
si, 12''
dia
met
er, le
ss t
han
2%
rein
forc
emen
t C
Y
$1,0
50
16.7
1
$17,5
43
Rei
nfo
rced
Concr
ete
Colu
mns
03 3
0 5
3.4
0.1
200
4000 p
si, 16''
dia
met
er, le
ss t
han
2%
rein
forc
emen
t C
Y
$785
11.8
8
$9,3
27
Rei
nfo
rced
Concr
ete
Colu
mns
03 3
0 5
3.4
0.1
300
4000 p
si, 20''
dia
met
er,
less
than
2%
rein
forc
emen
t C
Y
$675
18.5
6
$12,5
31
Rei
nfo
rced
Concr
ete
Cas
t in
pal
ace
03 3
0 5
3.4
0.0
500
Bea
ms
35
00 p
si, 5 k
ip/L
F, sp
an 2
5'
CY
$1,1
75
8.8
2
$10,3
62
Rei
nfo
rced
Concr
ete
Cas
t in
pal
ace
03 3
0 5
3.4
0.0
300
Bea
ms
35
00 p
si, 5 k
ip/L
F, sp
an 1
0'
CY
$1,3
25
6.3
5
$8,4
15
Rei
nfo
rced
Concr
ete
Pre
cast
03 4
1 3
3.1
0.1
400
bea
ms,
30
' span
, I
chan
ged
the
unit
s L
F
$184
126.5
0
$23,2
97
Rei
nfo
rced
Concr
ete
Pre
cast
03 4
1 3
3.1
0.0
050
jois
ts, 8''
dee
p,1
6' s
pan
L
F
$50
719.0
5
$35,5
93
Rei
nfo
rced
Concr
ete
Pre
cast
03 4
1 3
3.1
0.0
015
jois
ts, 6''
dee
p,1
2' s
pan
L
F
$33
572.8
8
$18,6
18
Wood F
ram
ing
06 1
1 1
0.1
0.3
585
I-B
eam
s [2
x14]
MB
F
$1,7
00
0.4
7
$796
Wood F
ram
ing
06 1
1 1
0.1
8.2
745
Dim
ensi
onal
lum
ber
[2x12]
MB
F
$1,4
25
2.5
5
$3,6
33
Tota
l
$140,1
15
CY
- C
ubic
yar
d |
LF
- L
inea
r fo
ot
| MB
F -
Thousa
nd b
oar
d f
eet
Note
: W
ood f
ram
ing i
s u
sed t
o d
esig
n s
tru
ctura
l su
pport
for
the
floori
ng o
f th
e fe
llow
ship
hal
l an
d t
he
roof
that
is
above
it.

99
Tab
le D
4. Sta
irw
ells
Cost
Est
imate
.
Type
RS
Mea
ns
Dat
a
line
num
ber
D
escr
ipti
on
U
nit
s A
mount
Cost
per
unit
incl
udin
g
O&
P
Cost
per
elem
ent
Sta
irs
and r
aili
ngs
03 3
0 5
3.4
0.6
800
Sta
irs:
3500 p
si, 3'-
6''
wid
e F
T
187
$46.5
0
$8,6
96
Sta
irs
and r
aili
ngs
05 5
2 1
3.5
0.0
500
Rai
ling:
Han
dra
il -
Pip
e on s
tair
s F
T
205
$46.5
0
$9,5
13
Sta
irs
and r
aili
ngs
05 5
2 1
3.5
0.0
930
Rai
ling:
Han
dra
il -
Pip
e on w
alls
F
T
198
$31.0
0
$6,1
38
Flo
ors
and l
andin
gs
03 3
1 1
3.2
5.0
125
Concr
ete
han
d m
ix f
or
smal
l
quan
titi
es
CF
144
$8.2
5
$1,1
87
Flo
ors
and l
andin
gs
05 3
1 1
3.5
0.5
200
2''
dee
p m
etal
dec
kin
g, 2
2 g
a.
SF
341
$2.8
5
$972
Flo
ors
and l
andin
gs
03 3
0 5
3.4
0.7
000
Sta
ir l
andin
g f
ree
stan
din
g
SF
231
$21.5
0
$4,9
67
Wal
ls
03 3
0 5
3.4
0.4
200
Concr
ete
3000 p
si, W
all
free
stan
din
g
CF
112
$18.1
5
$2,0
32
Wal
ls
04 2
1 1
3.1
4.0
140
Thin
bri
ck v
enee
r, s
uper
em
per
or,
8''x
3/4
''x16''
met
al p
anel
support
syst
em i
ncl
uded
SF
299
$15.7
5
$4,7
09
Wal
ls
06 1
6 3
6.1
0.0
705
Ply
wood s
hea
thin
g,
5/8
'',
pneu
mat
ic n
aile
d
SF
299
$1.6
9
$505
Wal
ls
09 2
1 1
6.3
3.0
500.2
P
arti
tion w
all,
incl
. 2x
4 w
ood s
td.,
tape
and f
inis
h
SF
4,8
95
$1.7
2
$8,4
19
Wal
ls
09 2
9 1
0.3
0.0
450
Gypsu
m b
oar
d, fi
re r
esis
tant,
taped
and f
inis
hed
(le
vel
4 f
inis
h)
SF
18,6
75
$1.5
8
$29,5
07
Doors
and w
indow
s 08 1
3 1
3.1
3.0
060
Sta
ndar
d h
oll
ow
met
al d
oors
E
A
11
$450.0
0
$4,9
50
Doors
and w
indow
s 08 5
3 1
3.3
0.0
310
Win
dow
, F
ixed
, vin
yl,
3'x
4'
EA
8
$288.0
0
$2,3
04
Tota
l
$83,8
98
FT
- F
eet
| CF
- C
ubic
fo
ot
| SF
- S
quar
e fo
ot
| EA
- E
ach
Note
: 09 2
1 1
6.3
3.0
500.2
Lin
e num
ber
was
gen
erat
ed m
anual
ly, p
rice
of
dry
wal
l fi
nis
hes
was
subtr
acte
d, 09 2
9 1
0.3
0.0
450
line
num
ber
was
use
d a
s a
bas
e.
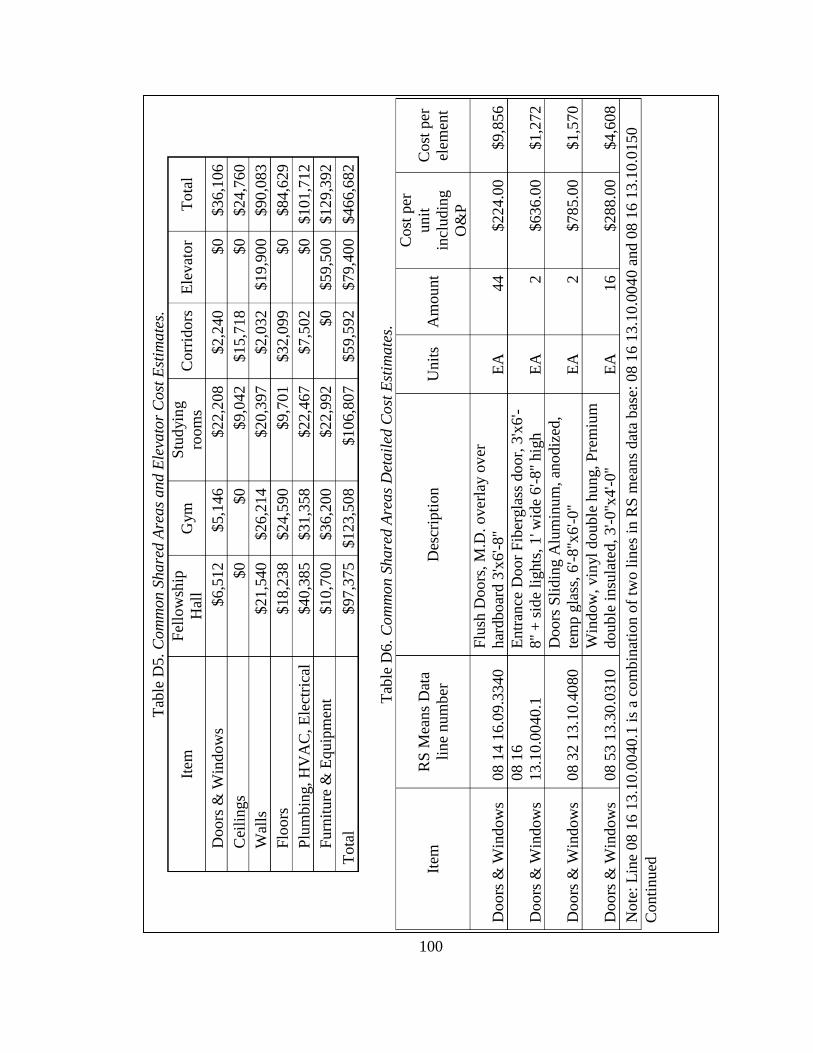
100
Tab
le D
5. C
om
mon S
hare
d A
reas
and E
leva
tor
Cost
Est
imate
s.
Item
F
ello
wsh
ip
Hal
l G
ym
S
tud
yin
g
room
s C
orr
idors
E
levat
or
Tota
l
Doors
& W
indow
s $6,5
12
$5,1
46
$22,2
08
$2,2
40
$0
$36,1
06
Cei
lings
$0
$0
$9,0
42
$15,7
18
$0
$24,7
60
Wal
ls
$21,5
40
$26,2
14
$20,3
97
$2,0
32
$19,9
00
$90,0
83
Flo
ors
$18,2
38
$24,5
90
$9,7
01
$32,0
99
$0
$84,6
29
Plu
mbin
g, H
VA
C, E
lect
rica
l $40,3
85
$31,3
58
$22,4
67
$7,5
02
$0
$101,7
12
Furn
iture
& E
quip
men
t $10,7
00
$36,2
00
$22,9
92
$0
$59,5
00
$129,3
92
Tota
l $97,3
75
$123,5
08
$106,8
07
$59,5
92
$79,4
00
$466,6
82
Tab
le D
6. C
om
mon S
hare
d A
reas
Det
ail
ed C
ost
Est
ima
tes.
Item
R
S M
ean
s D
ata
line
num
ber
D
escr
ipti
on
U
nit
s A
mount
Cost
per
unit
incl
udin
g
O&
P
Cost
per
elem
ent
Doors
& W
indow
s 08 1
4 1
6.0
9.3
340
Flu
sh D
oors
, M
.D. over
lay o
ver
har
dboar
d 3
'x6'-
8''
EA
44
$224.0
0
$9,8
56
Doors
& W
indow
s
08 1
6
13.1
0.0
040.1
Entr
ance
Door
Fib
ergla
ss d
oor,
3'x
6'-
8''
+ s
ide
lights
, 1
' wid
e 6
'-8
'' hig
h
EA
2
$636.0
0
$1,2
72
Doors
& W
indow
s 08 3
2 1
3.1
0.4
080
Doors
Sli
din
g A
lum
inum
, an
odiz
ed,
tem
p g
lass
, 6
'-8
''x6'-
0''
EA
2
$785.0
0
$1,5
70
Doors
& W
indow
s 08 5
3 1
3.3
0.0
310
Win
dow
, vin
yl
double
hu
ng, P
rem
ium
double
insu
late
d, 3'-
0''x
4'-
0''
EA
16
$288.0
0
$4,6
08
Note
: L
ine
08 1
6 1
3.1
0.0
040.1
is
a co
mbin
atio
n o
f tw
o l
ines
in R
S m
eans
dat
a bas
e: 0
8 1
6 1
3.1
0.0
04
0 a
nd 0
8 1
6 1
3.1
0.0
150
Conti
nued
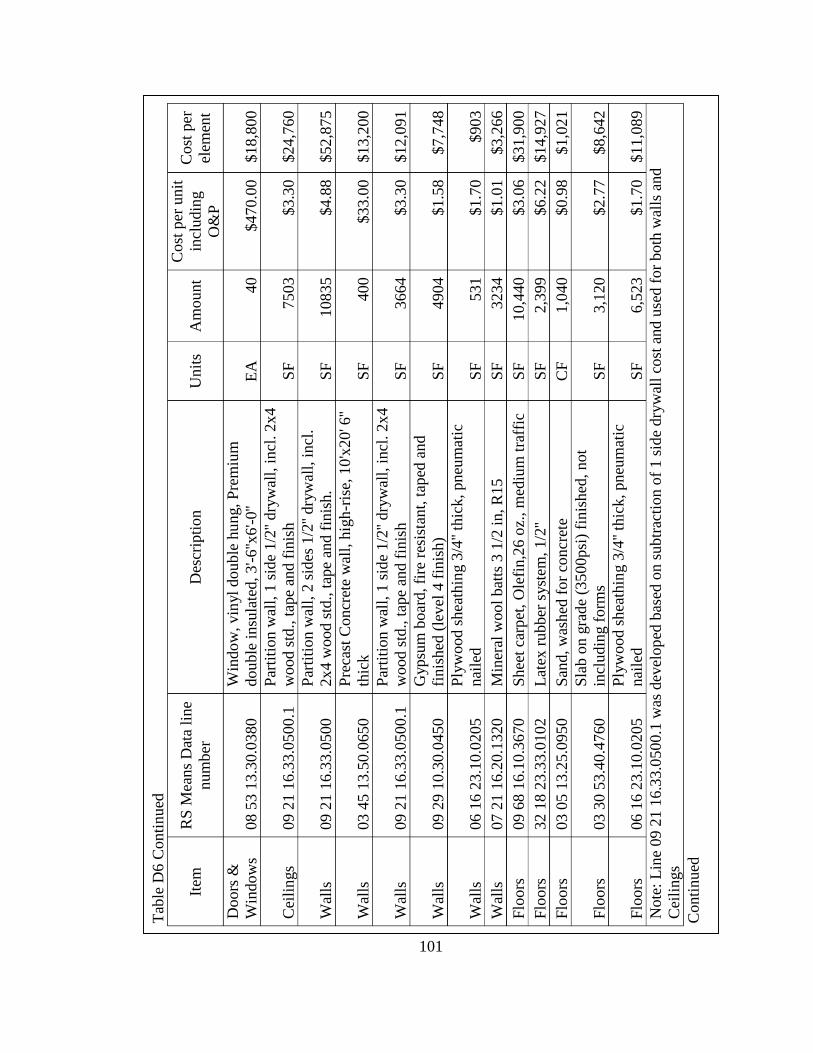
101
Tab
le D
6 C
onti
nued
Item
R
S M
eans
Dat
a li
ne
num
ber
D
escr
ipti
on
U
nit
s A
mount
Cost
per
unit
incl
udin
g
O&
P
Cost
per
elem
ent
Doors
&
Win
dow
s 08 5
3 1
3.3
0.0
380
Win
dow
, vin
yl
double
hu
ng, P
rem
ium
double
insu
late
d, 3'-
6''x
6'-
0''
EA
40
$470.0
0
$18,8
00
Cei
lin
gs
09 2
1 1
6.3
3.0
500.1
Par
titi
on w
all,
1 s
ide
1/2
'' dry
wal
l, i
ncl
. 2x
4
wood s
td.,
tap
e an
d f
inis
h
SF
7503
$3.3
0
$24,7
60
Wal
ls
09 2
1 1
6.3
3.0
500
Par
titi
on w
all,
2 s
ides
1/2
'' dry
wal
l, i
ncl
.
2x
4 w
ood s
td., t
ape
and f
inis
h.
SF
10835
$4.8
8
$52,8
75
Wal
ls
03 4
5 1
3.5
0.0
650
Pre
cast
Concr
ete
wal
l, h
igh
-ris
e, 1
0'x
20' 6
''
thic
k
SF
400
$33.0
0
$13,2
00
Wal
ls
09 2
1 1
6.3
3.0
500.1
Par
titi
on w
all,
1 s
ide
1/2
'' dry
wal
l, i
ncl
. 2x
4
wood s
td., t
ape
and f
inis
h
SF
3664
$3.3
0
$12,0
91
Wal
ls
09 2
9 1
0.3
0.0
450
Gypsu
m b
oar
d, fi
re r
esis
tant,
tap
ed a
nd
finis
hed
(le
vel
4 f
inis
h)
SF
4904
$1.5
8
$7,7
48
Wal
ls
06 1
6 2
3.1
0.0
205
Ply
wood
shea
thin
g 3
/4''
thic
k, pneu
mat
ic
nai
led
S
F
531
$1.7
0
$903
Wal
ls
07 2
1 1
6.2
0.1
320
Min
eral
wool
bat
ts 3
1/2
in, R
15
S
F
3234
$1.0
1
$3,2
66
Flo
ors
09 6
8 1
6.1
0.3
670
Shee
t ca
rpet
, O
lefi
n,2
6 o
z., m
ediu
m t
raff
ic
SF
10,4
40
$3.0
6
$31,9
00
Flo
ors
32 1
8 2
3.3
3.0
102
Lat
ex r
ubber
syst
em, 1/2
'' S
F
2,3
99
$6.2
2
$14,9
27
Flo
ors
03 0
5 1
3.2
5.0
950
San
d, w
ashed
fo
r co
ncr
ete
CF
1,0
40
$0.9
8
$1,0
21
Flo
ors
03 3
0 5
3.4
0.4
760
Sla
b o
n g
rade
(3500psi
) fi
nis
hed
, not
incl
udin
g f
orm
s S
F
3,1
20
$2.7
7
$8,6
42
Flo
ors
06 1
6 2
3.1
0.0
205
Ply
wood s
hea
thin
g 3
/4''
thic
k, pneu
mat
ic
nai
led
S
F
6,5
23
$1.7
0
$11,0
89
Note
: L
ine
09 2
1 1
6.3
3.0
500.1
was
dev
elop
ed b
ased
on s
ubtr
acti
on o
f 1 s
ide
dry
wal
l co
st a
nd u
sed f
or
both
wal
ls a
nd
Cei
lings
Conti
nued

102
Tab
le D
6 C
onti
nued
Item
R
S M
eans
Dat
a
line
num
ber
D
escr
ipti
on
U
nit
s A
mount
Cost
per
unit
incl
udin
g
O&
P
Cost
per
elem
ent
Flo
ors
06 1
1 1
0.1
8.2
725
Jois
t fr
amin
g 2
x10, pneu
mat
ic
nai
led
C
F
451
$17.1
0
$7,7
12
Flo
ors
09 6
8 1
0.1
0.9
000
S
ponge
rubb
er p
ad m
inim
um
S
F
10,4
40
$0.8
9
$9,3
38
Plu
mbin
g, H
VA
C,
Ele
ctri
cal
50 1
7 0
0 2
720
Plu
mbin
g A
par
tmen
ts L
ow
ris
e
(1 t
o 3
) M
in
SF
2016
$5.7
0
$11,4
91
Plu
mbin
g, H
VA
C,
Ele
ctri
cal
22 4
1 1
3.4
0.1
102
Wat
er c
lose
t ec
onom
y, fl
oor
mounte
d
EA
4
$380.0
0
$1,5
20
Plu
mbin
g, H
VA
C,
Ele
ctri
cal
22 4
1 1
6.1
0.1
000
Lav
atori
es, S
ink, C
ult
ure
d
mar
ble
E
A
4
$390.0
0
$1,5
60
Plu
mbin
g, H
VA
C,
Ele
ctri
cal
50 1
7 0
0 2
770
HV
AC
Apar
tmen
ts L
ow
ris
e (1
to 3
) M
in
SF
8688
$3.6
3
$31,5
37
Plu
mbin
g, H
VA
C,
Ele
ctri
cal
50 1
7 0
0 2
900
Ele
ctri
cal
Ap
artm
ents
Lo
w r
ise
(1 t
o 3
) M
in
SF
8688
$6.4
0
$55,6
03
Furn
iture
& E
quip
men
t 12 2
1 1
3.1
3.0
020
Win
dow
bli
nds,
met
al,
hori
zonta
l S
F
144
$6.2
5
$900
Furn
iture
& E
quip
men
t N
ot
found
Bil
liar
d t
able
E
A
2
$1,0
00.0
0
$2,0
00
Furn
iture
& E
quip
men
t N
ot
found
Ten
nis
tab
le
EA
2
$250.0
0
$500
Furn
iture
& E
quip
men
t N
ot
found
L s
hap
e so
fa
EA
6
$1,0
00.0
0
$6,0
00
Furn
iture
& E
quip
men
t N
ot
found
Coff
ee t
able
E
A
3
$200.0
0
$600
Furn
iture
& E
quip
men
t N
ot
found
Pro
ject
or
EA
1
$700.0
0
$700
No
te:
Som
e of
the
furn
iture
& e
quip
men
t co
sts
wer
e der
ived
str
aight
from
web
sourc
es
RS
Mea
ns
(2013)
does
n’t
pro
vid
e use
rs w
ith P
lum
bin
g, H
VA
C, an
d E
lect
rica
l dat
a fo
r M
id-r
ise
bu
ildin
gs.
Ther
efore
Low
rise
sq
uar
e fo
ot
dat
a w
as u
sed.
Conti
nued

103
Tab
le D
6 C
onti
nued
Item
R
S M
ean
s D
ata
line
num
ber
D
escr
ipti
on
U
nit
s A
mo
un
t
Cost
per
unit
incl
udin
g
O&
P
Cost
per
elem
ent
Furn
iture
&
Equip
men
t 12 2
1 1
3.1
3.0
020
Win
dow
bli
nds,
met
al,
hori
zonta
l S
F
576
$6.2
5
$3,6
00
Furn
iture
&
Equip
men
t 12 5
2 2
3.1
3.2
280
C
hai
r, T
ask m
inim
um
E
A
64
$178.0
0
$11,3
92
Furn
iture
&
Equip
men
t N
ot
found
T
able
s E
A
32
$250.0
0
$8,0
00
Furn
iture
&
Equ
ipm
ent
12 2
1 1
3.1
3.0
020
Win
dow
bli
nds,
met
al,
hori
zonta
l S
F
144
$6.2
5
$900
Furn
iture
&
Equip
men
t 11 6
6 1
3.1
0.1
340
T
read
mil
l, e
lect
ronic
E
A
4
$4,0
75.0
0
$16,3
00
Furn
iture
&
Equip
men
t 11 6
6 1
3.1
0.1
280
R
ow
ing m
achin
e
EA
2
$1,9
25.0
0
$3,8
50
Furn
iture
&
Equip
men
t 11 6
6 1
3.1
0.1
200.1
Mult
i-st
atio
n g
ym
mac
hin
e,
#2
EA
1
$2,2
00.0
0
$2,2
00
Furn
iture
&
Equip
men
t 11 6
6 1
3.1
0.4
390
W
eight
lift
ing
E
A
2
$1,2
75.0
0
$2,5
50
Furn
iture
&
Equip
men
t 11 6
6 1
3.1
0.0
820
D
um
bbel
l E
A
1
$620.0
0
$620
Furn
iture
&
Equip
men
t 11 6
6 1
3.1
0.1
200.2
Mult
i-st
atio
n g
ym
mac
hin
e,
#1
EA
1
$1,1
00.0
0
$1,1
00
Furn
iture
&
Equip
men
t 11 6
6 1
3.1
0.1
200
Mult
i-st
atio
n g
ym
mac
hin
e,
#5
EA
1
$5,5
00.0
0
$5,5
00
Note
: C
ost
est
imat
es o
f 11 6
6 1
3.1
0.1
200.1
and 1
1 6
6 1
3.1
0.1
200.2
wer
e d
eriv
ed f
rom
11 6
6 1
3.1
0.1
200
Conti
nued
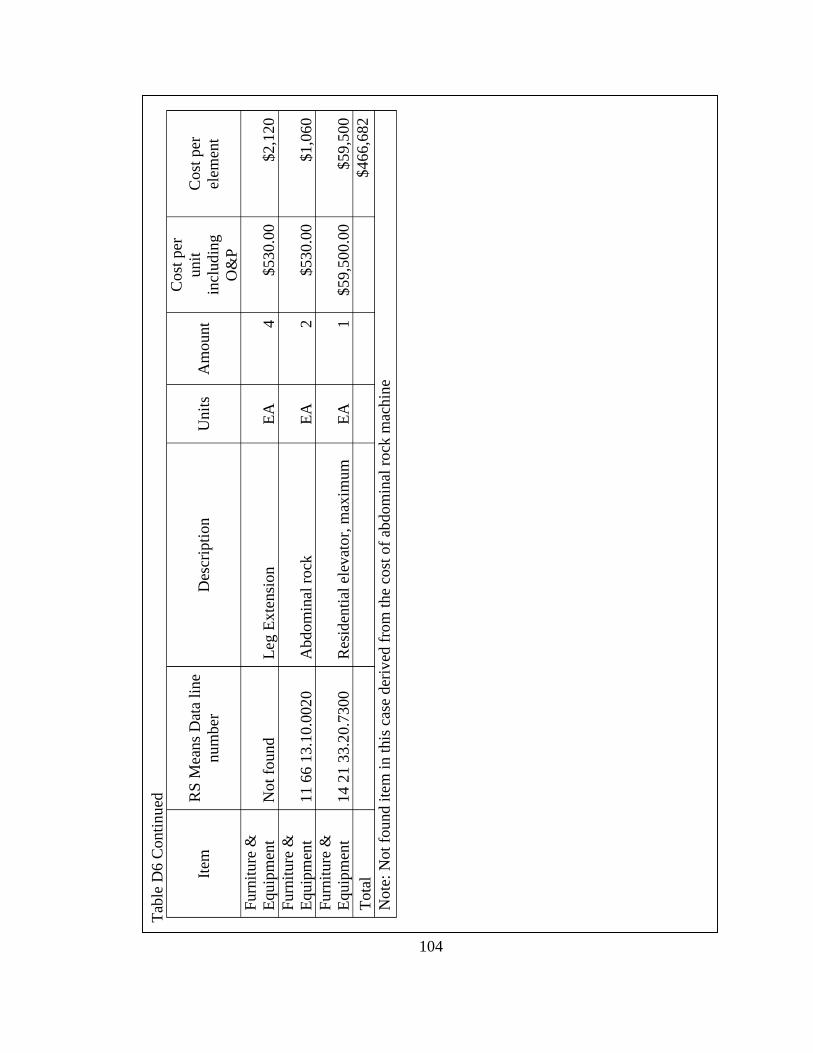
104
Tab
le D
6 C
onti
nued
Item
R
S M
eans
Dat
a li
ne
num
ber
D
escr
ipti
on
U
nit
s A
mo
un
t
Cost
per
unit
incl
udin
g
O&
P
Cost
per
elem
ent
Furn
iture
&
Equip
men
t N
ot
found
L
eg E
xte
nsi
on
EA
4
$530.0
0
$2,1
20
Furn
iture
&
Equip
men
t 11 6
6 1
3.1
0.0
020
A
bdom
inal
rock
E
A
2
$530.0
0
$1,0
60
Furn
iture
&
Equip
men
t 14 2
1 3
3.2
0.7
300
R
esid
enti
al e
levat
or,
max
imum
E
A
1
$59,5
00.0
0
$59,5
00
Tota
l
$466,6
82
No
te:
Not
found i
tem
in t
his
cas
e der
ived
fro
m t
he
cost
of
abdom
inal
rock
mac
hin
e

105
Tab
le D
7. A
part
men
t’s
Cost
Est
imate
.
Apar
tmen
t's
elem
ents
RS
Mea
ns
Dat
a li
ne
num
ber
Des
crip
tio
n
Unit
s A
mount
Cost
per
unit
incl
udin
g
O&
P
Cost
of
elem
ent
Cost
mult
ipli
ed
by n
um
ber
of
apar
tmen
ts
Door
& W
indow
08 1
4
33.1
0.0
160
Inte
rior
doors
, si
x p
anel
,
hal
low
core
, 2
'-6
''x6'-
8''
EA
2.0
$137.0
$274
$6,5
76
Door
& W
indow
08 1
4
33.2
0.2
760
Inte
rior
bi-
fold
doors
,
4'x
6'-
8''
EA
4.0
$215.0
$860
$20,6
40
Door
& W
indow
08 1
4
16.0
9.3
340
Flu
sh D
oors
, M
.D. over
lay
over
har
dbo
ard 3
'x6'-
8''
EA
6.0
$224.0
$1,3
44
$32,2
56
Door
& W
indow
08 1
6
13.1
0.0
040
Entr
ance
Door
Fib
ergla
ss
door,
3'x
6'-
8''
EA
1.0
$360.0
$360
$8,6
40
Do
or
& W
indow
08 5
3
13.3
0.0
380
Win
dow
, vin
yl
double
hung, P
rem
ium
double
insu
late
d,
3'-6
''x6'-
0''
EA
4.0
$470.0
$1,8
80
$45,1
20
Cei
lings
09 2
1
16.3
3.0
500.1
Par
titi
on w
all,
1/2
dry
wal
l
1 s
ide
incl
. 2x
4 w
ood s
td.,
tape
and f
inis
h
SF
935.0
$3.3
$3,0
86
$74,0
52
Wal
ls
06 1
1
10.4
0.5
885
Wal
l fr
amin
g S
tuds
8' h
igh
2x
4
CF
5.7
$33.9
$193
$4,6
38
Wal
ls
07 2
1
16.2
0.1
320
Min
eral
wool
bat
ts 3
1/2
in, R
15
S
F
662.0
$1.0
$669
$16,0
47
Wal
ls
07 2
1
29.1
0.0
310
1''
Clo
sed c
ell,
spra
y
poly
ure
than
e fo
am, 2
pounds
per
cubic
foot
den
sity
S
F
662.0
$1.0
$629
$15,0
94
Note
: L
ine
09 2
1 1
6.3
3.0
500.1
was
dev
elop
ed b
ased
on s
ubtr
acti
on o
f 1 s
ide
dry
wal
l co
st
Conti
nued

106
Tab
le D
7 C
onti
nued
Apar
tmen
t's
elem
ents
RS
Mea
ns
Dat
a li
ne
num
ber
Des
crip
tio
n
Unit
s A
mount
Cost
per
unit
incl
udin
g
O&
P
Cost
of
elem
ent
Cost
mult
ipli
ed
by n
um
ber
of
apar
tmen
ts
Wal
ls
09 2
1
16.3
3.0
500
Par
titi
on w
all,
1/2
dry
wal
l 2
sides
incl
. 2x
4 w
ood s
td., t
ape
and f
inis
h
SF
662.0
$4.9
$3,2
31
$77,5
33
Wal
ls
09 2
1
16.3
3.0
500.1
Par
titi
on w
all,
1/2
dry
wal
l 1
side
incl
. 2x
4 w
ood s
td., t
ape
and f
inis
h
SF
662.0
$3.3
$2,1
85
$52,4
30
Wal
ls
09 2
9
10.3
0.0
450
Gypsu
m b
oar
d, fi
re r
esis
tant,
taped
and f
inis
hed
(le
vel
4
finis
h)
SF
1,4
96.0
$1.6
$2,3
64
$56,7
28
Flo
ors
09 6
8
16.1
0.3
670
Shee
t ca
rpet
, O
lefi
n,2
6 o
z.,
med
ium
tra
ffic
S
F
686.0
$3.1
$2,0
96
$50,3
07
Flo
ors
09 6
5
16.1
0.8
000
Vin
yl
shee
t goods,
bac
ked
,
0,6
5''
thic
k, m
inim
um
S
F
150.0
$6.5
$975
$23,4
00
Flo
ors
30 3
1
13.2
5.0
125
Concr
ete
han
d m
ix f
or
smal
l
quan
titi
es
CF
5.1
$8.3
$42
$1,0
04
Flo
ors
09 3
0
13.1
0.3
255
Flo
ors
, gla
zed, th
in s
et, 6x
6,
colo
r gro
up 1
S
F
140.0
$7.9
$1,0
99
$26,3
76
Flo
ors
06 1
6
23.1
0.0
205
Subfl
oori
ng, P
lyw
ood 3
/4''
thic
k,
pneu
mat
ic n
aile
d
SF
104.0
$1.7
$177
$4,2
43
Flo
ors
06 1
1
10.1
8.2
725
Jois
t fr
amin
g 2
x10, pneu
mat
ic
nai
led
C
F
80.2
$17.1
$1,3
71
$32,9
02
Flo
ors
09 6
8
10.1
0.9
000
S
ponge
rubb
er p
ad m
inim
um
S
F
686.0
$0.9
$614
$14,7
26
Conti
nued

107
Tab
le D
7 C
onti
nued
Ap
artm
ent's
elem
ents
RS
Mea
ns
Dat
a li
ne
num
ber
Des
crip
tion
U
nit
s A
mount
Cost
per
un
it
incl
udin
g
O&
P
Co
st o
f
elem
ent
Cost
mu
ltip
lied
by
num
ber
of
apar
tmen
ts
Flo
ors
03 3
5
13.3
0.0
100
C
oncr
ete
finis
hin
g, bull
flo
at
SF
104.0
$0.4
$38
$924
Cas
ework
12 3
2
23.1
0.4
700
Cas
ework
, kit
chen
wal
l, t
wo
doors
, 24x
30
EA
4.0
$390.0
$1,5
60
$37,4
40
Cas
ework
12 3
2
23.3
0.8
050
V
anit
y b
ases
, 2 d
oors
, 30
x30
EA
2.0
$460.0
$920
$22,0
80
Cas
ework
12 3
6
19.1
0.2
900
Map
le c
ounte
rtops,
soli
d,
lam
inat
ed, 1 1
/2''
thic
k, n
o
spla
sh
LF
11.5
$102.0
$1,1
73
$28,1
52
Cas
ework
12 3
2
23.1
0.1
580
Cas
ework
, ra
nge
or
sink b
ase,
two d
oors
, 48 w
ide
EA
1.0
$520.0
$520
$12,4
80
Plu
mbin
g,
HV
AC
,
Ele
ctri
cal
22 4
1
13.4
0.1
102
Wat
er c
lose
t ec
onom
y, fl
oor
mounte
d
EA
2.0
$380.0
$760
$18,2
40
Plu
mbin
g,
HV
AC
,
Ele
ctri
cal
22 4
1
16.1
0.1
000
Lav
atori
es, S
ink, C
ult
ure
d
mar
ble
E
A
2.0
$390.0
$780
$18,7
20
Plu
mbin
g,
HV
AC
,
Ele
ctri
cal
22 4
1
16.3
0.2
000
Sin
k,
kit
chen
, co
unte
r to
p
style
E
A
1.0
$525.0
$525
$12,6
00
Plu
mbin
g,
HV
AC
,
Ele
ctri
cal
11 3
1
33.2
3.6
900
Ele
ctri
cal
hea
ter,
gla
ss l
ined
,
30 g
allo
n
EA
1.0
$735.0
$735
$17,6
40
Conti
nued

108
Tab
le D
7 C
onti
nued
Ap
artm
ent's
elem
ents
RS
Mea
ns
Dat
a li
ne
num
ber
Des
crip
tio
n
Unit
s A
mount
Cost
per
un
it
incl
udin
g
O&
P
Co
st o
f
elem
ent
Cost
mu
ltip
lied
by
num
ber
of
apar
tmen
ts
Plu
mbin
g,
HV
AC
,
Ele
ctri
cal
22 4
1
19.1
0.2
000
Bat
h, en
amel
ed, fo
rmed
ste
el,
4'-6
'' lo
ng
E
A
1.0
$760.0
$760
$18,2
40
Plu
mbin
g,
HV
AC
,
Ele
ctri
cal
22 4
1
23.2
0.3
000
S
how
er, fi
ber
gla
ss, 32''x
32''
EA
1.0
$770.0
$770
$18,4
80
Plu
mbin
g,
HV
AC
,
Ele
ctri
cal
50 1
7 0
0 2
720
Plu
mbin
g A
par
tmen
ts L
ow
rise
(1 t
o 3
) M
in
SF
1,0
08 .0
$5.7
$5,7
46
$137,8
94
Plu
mbin
g,
HV
AC
,
Ele
ctri
cal
50 1
7 0
0 2
900
Ele
ctri
cal
Ap
artm
ents
Lo
w
rise
(1 t
o 3
) M
in
SF
1,0
08 .0
$6.4
$6,4
51
$154,8
29
Plu
mbin
g,
HV
AC
,
Ele
ctri
cal
50 1
7 0
0 2
770
HV
AC
Apar
tmen
ts L
ow
ris
e
(1 t
o 3
) M
in
SF
1,0
08 .0
$3.6
$3,6
59
$87,8
17
Furn
iture
&
Ap
pli
ance
s
11 3
1
13.1
3.0
900
C
ounte
rtop c
ookto
ps,
4burn
er
EA
1.0
$425.0
$425
$10,2
00
Furn
iture
&
Appli
ance
s
11 3
1
13.1
3.1
250
M
icro
wav
e ov
en
EA
1.0
$291.0
$291
$6,9
84
Furn
iture
&
Appli
ance
s
11 3
1
13.2
3.5
500
R
efri
ger
atio
n, no f
rost
10 C
.F.
EA
1.0
$550.0
$550
$13,2
00
Note
: R
S M
eans
(2013)
does
n’t
pro
vid
e use
rs w
ith P
lum
bin
g, H
VA
C, E
lect
rica
l dat
a fo
r M
id-r
ise
buil
din
gs.
Ther
efore
Lo
w
rise
squar
e fo
ot
dat
a w
as u
sed.
Conti
nued

109
Tab
le D
7 C
onti
nued
Apar
tmen
t's
elem
ents
RS
Mea
ns
Dat
a li
ne
num
ber
Des
crip
tio
n
Unit
s A
moun
t
Cost
per
unit
incl
udin
g
O&
P
Cost
of
elem
ent
Cost
mult
ipli
ed
by n
um
ber
of
apar
tmen
ts
Furn
iture
&
Appli
ance
s
11 3
1
13.3
3.2
750
Dis
hw
asher
E
A
1.0
$595.0
$595
$14,2
80
Furn
iture
&
Appli
ance
s
11 3
1
13.5
3.4
150
Ven
tila
tion s
yst
em 2
spee
d
EA
1.0
$320.0
$320
$7,6
80
Furn
iture
&
Appli
ance
s
11 3
1
23.1
3.6
764
Was
her
, to
p-l
oad
ing
EA
1.0
$720.0
$720
$17,2
80
Furn
iture
&
Appli
ance
s
11.3
1.2
3.2
3.6
770
Ele
ctri
cal
dry
er, fr
ont
load
ing,
ener
gy s
tar
qu
alif
ied
E
A
1.0
$750.0
$750
$18,0
00
Furn
iture
&
Appli
ance
s
12 2
1
13.1
3.0
020
Win
dow
bli
nds,
met
al,
hori
zonta
l S
F
78.0
$6.3
$488
$11,7
00
Furn
iture
&
Appli
ance
s
12 2
1
13.3
3.0
320
Vin
yl
hori
zonta
l lo
uver
bli
nds
72''
x 9
6''
EA
2.0
$315.0
$630
$15,1
20
Furn
iture
&
Appli
ance
s
12 5
1
16.1
6.0
800
Des
k w
ood c
ase,
30
''x60''
EA
4.0
$535.0
$2,1
40
$51,3
60
Fu
rnit
ure
&
Appli
ance
s
12 5
2
23.1
3.2
280
Chai
r, T
ask m
inim
um
E
A
4.0
$178.0
$712
$17,0
88
Furn
iture
&
Appli
ance
s N
ot
found
Tw
in w
ood f
ram
e bed
E
A
4.0
$99.0
$396
$9,5
04
Furn
iture
&
Appli
ance
s N
ot
found
Wood c
hai
r E
A
4.0
$33.0
$132
$3,1
63
Furn
iture
&
Appli
ance
s N
ot
found
Wood T
able
-Rec
tan
gula
r E
A
1.0
$122.0
$122
$2,9
28
Tota
l
$56,1
14
$1,3
46,7
36
Note
: S
om
e of
the
furn
iture
ele
men
ts w
eren
’t f
ou
nd i
n t
he
RS
Mea
ns
(2013).
Cost
dat
a fo
r th
at e
lem
ents
was
der
ived
fro
m
web
sourc
es

110
Tab
le D
8. E
xter
ior
Flo
ors
Spra
y In
sula
tion C
ost
Est
imate
.
Com
ponen
ts
RS
Mea
ns
Dat
a li
ne
num
ber
Des
crip
tio
n
Unit
s A
mount
Cost
per
unit
incl
udin
g
O&
P
Cost
of
elem
ent
Flo
or
insu
lati
on
07 2
1
29.1
0.0
350
5''
Clo
sed c
ell,
spra
y p
oly
ure
than
e
foam
, 2 p
ounds
per
cubic
foot
den
sity
S
F
4144
$4.7
2
$19,5
60
Tab
le D
9. R
oofi
ng C
ost
Est
imate
.
Com
ponen
ts
RS
Mea
ns
Dat
a li
ne
num
ber
D
escr
ipti
on
U
nit
s A
mount
Cost
per
unit
incl
udin
g
O&
P
Cost
of
elem
ent
Roofi
ng
06 1
6 2
3.1
0.0
205
P
lyw
ood s
hea
thin
g
SF
7,9
97.0
0
$1.7
0
$13,5
95
Roofi
ng
07 2
1 2
9.1
0.0
320
2''
Clo
sed c
ell,
spra
y p
oly
ure
than
e
foam
, 2 p
ounds
per
cubic
foot
den
sity
S
F
4,8
98.0
0
$1.8
9
$9,2
57
Roofi
ng
06 1
1 1
0.1
8.2
705
Jo
ist
fram
ing 2
x8, pneu
mat
ic n
aile
d
CF
384.0
2
$16.8
0
$6,4
52
Roofi
ng
07 2
1 1
6.1
0.2
150
Bla
nket
insu
lati
on, fi
ber
gla
ss, 6
-1/4
'',
R19
S
F
4,4
48.3
8
$1.4
7
$6,5
39
Roofi
ng
07 5
3 2
3.2
0.3
700
EP
DM
, 45 m
ils,
0.2
8 p
sf.,
mec
han
ical
ly a
ttac
hed
S
F
7,9
97.0
0
$1.6
1
$12,8
75
Roofi
ng
09 2
9 1
0.3
0.0
450
Gypsu
m b
oar
d, fi
re r
esis
tant,
tap
ed
and f
inis
hed
(le
vel
4 f
inis
h)
SF
3,0
99.0
0
$1.5
8
$4,8
96
Ro
ofi
ng
06 1
1 1
0.1
8.2
745
Jo
ist
fram
ing 2
x12,
pneu
mat
ic n
aile
d
CF
302.3
1
$17.1
0
$5,1
70
Roofi
ng
07 2
1 1
6.1
0.2
220
Bla
nket
insu
lati
on, fi
ber
gla
ss, 12'',
R38
S
F
2,8
14.5
2
$2.1
2
$5,9
67
Roofi
ng
07 5
3 2
3.2
0.3
700
EP
DM
, 45 m
ils,
0.2
8 p
sf.,
mec
han
ical
ly a
ttac
hed
S
F
1,3
29.0
0
$1.6
1
$2,1
40
Roofi
ng
09 2
1 1
6.3
3.0
500.2
Par
titi
on w
all,
3/4
ply
wo
od s
hea
thin
g
2 s
ide
incl
. 2x
4 w
ood s
td.,
S
F
1,3
29.0
0
$5.1
2
$6,8
04
Tota
l
$73,6
95
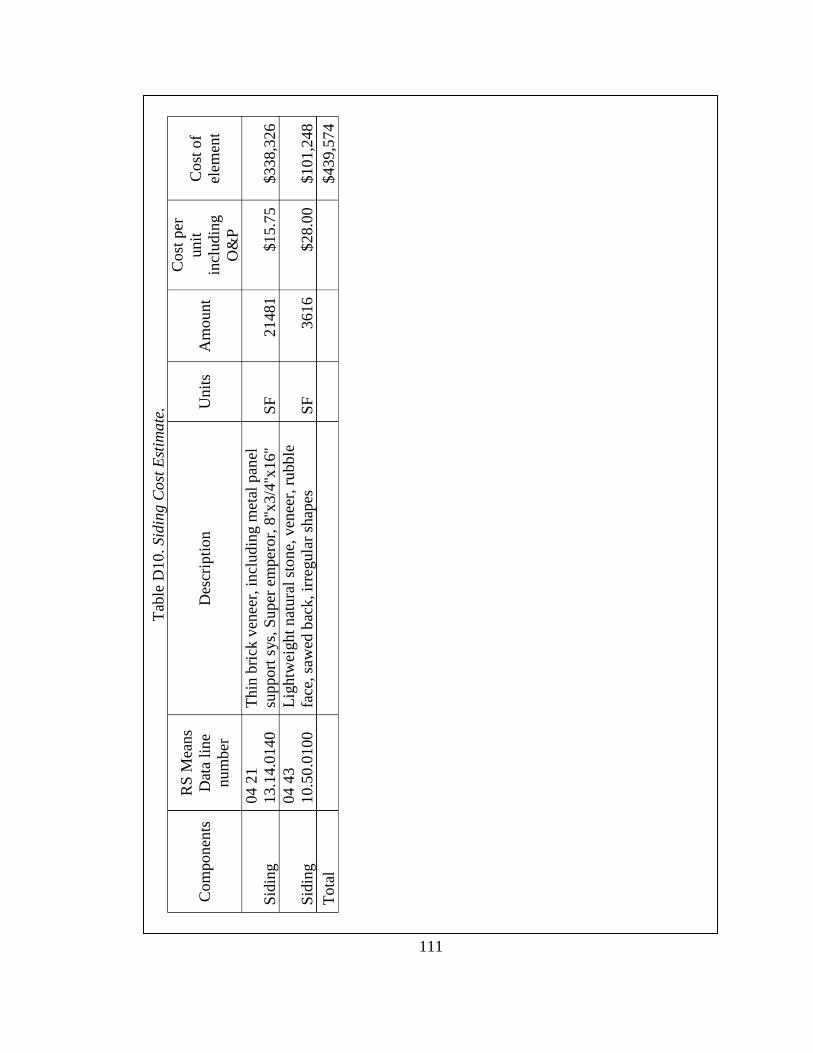
111
Tab
le D
10. Sid
ing C
ost
Est
imate
.
Com
ponen
ts
RS
Mea
ns
Dat
a li
ne
num
ber
Des
crip
tio
n
Unit
s A
mount
Cost
per
unit
incl
udin
g
O&
P
Cost
of
elem
ent
Sid
ing
04 2
1
13.1
4.0
140
Thin
bri
ck v
enee
r, i
ncl
ud
ing m
etal
pan
el
support
sys,
Super
em
per
or,
8''x
3/4
''x16''
SF
21481
$15.7
5
$338,3
26
Sid
ing
04 4
3
10.5
0.0
100
Lig
htw
eight
nat
ura
l st
one,
ven
eer,
rubble
face
, sa
wed
bac
k, ir
regula
r sh
apes
S
F
3616
$28.0
0
$101,2
48
Tota
l
$439,5
74

112
AP
PE
ND
IX E
FIN
AN
CIA
L A
NA
LY
SIS
F
igu
re E
1. E
xcel
Form
ula
s U
sed t
o E
xtra
po
late
Cash
Flo
ws.
Note
: N
um
ber
s use
d i
n t
he
curr
ent
sam
ple
form
are
rel
ated
to t
he
alte
rnat
ive
resi
den
ce w
ith a
ssum
pti
on t
hat
11%
RO
I is
req
uir
ed.

113
Figure E2. Cash Flow Projections under the Assumption of no Market Competition.
Note: Flexible rental price, ROI-11%.
Covington Apartments
Lodge on Willow
Alternative Residence
Crosswalk Commons

114
Figure E3. Cash Flow Projections under the Assumption of the Competitive Market.
Note: Rental price $469 for all projects, ROI - 12%.
Alternative Residence
Lodge on Willow
Covington Apartments
Crosswalk Commons

115
Figure E3 shows a graphical representation of the cash flow projections. The
analysis of those graphs reveals that under specified market conditions, even the Lodge
on Willow is not able to break even for the discounted payback curve. It means that
investors will not be able to get their money back in 28 years. The graphical analysis of
the Covington Apartments and the Crosswalk Commons reveals that those projects will
not be able to generate positive revenue.

116
APPENDIX F
DISTRIBUTIONS OF NPV GENERATED THROUGH
MONTE CARLO SIMULATION
Figure F1. NPV Distributions at 11%.
Note: The current simulation was conducted under the assumptions of 11%
ROI and every residence operate under desired rental prices.

117
Figure F2. NPV Distributions at 12%.
Note: The current simulation was conducted under the assumptions of 12%
ROI and every residence compete for lower rental prices.
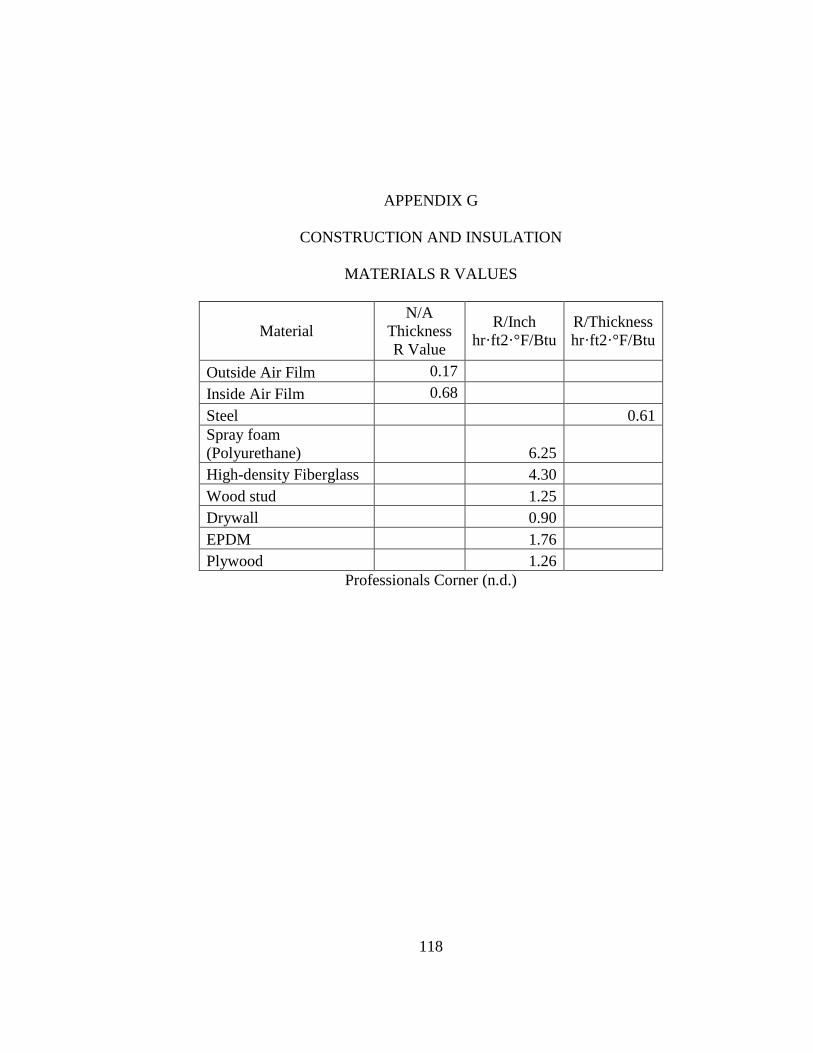
118
APPENDIX G
CONSTRUCTION AND INSULATION
MATERIALS R VALUES
Material
N/A
Thickness
R Value
R/Inch
hr·ft2·°F/Btu
R/Thickness
hr·ft2·°F/Btu
Outside Air Film 0.17
Inside Air Film 0.68
Steel 0.61
Spray foam
(Polyurethane) 6.25
High-density Fiberglass 4.30
Wood stud 1.25
Drywall 0.90
EPDM 1.76
Plywood 1.26
Professionals Corner (n.d.)


