
Federal Sector Renewable Energy Project Implementation ldquoWhatrsquos Working and WhyrdquoImplementation What s Working and Why
DOD-DOE Waste-to-Energy and Fuel Cell Workshop January 13 2011
Bob Westby Bob Westby NREL Laboratory Program Manager Federal Energy Management Program
NREL is a national laboratory of the US Department of Energy Office of Energy Efficiency and Renewable Energy operated by the Alliance for Sustainable Energy LLC
Innovation for Our Energy Future
Contents
Federal Sector Renewable Energy Project Implementation ldquoWhatrsquos Working and WhyrdquoldquoWhatrsquos Working and Whyrdquo
Commercially viable RE technologies RE project economic drivers Project construct scenarios Implementation mechanismsImplementation mechanisms
DOE FEMP Mission The Department of Energys Federal Energy Management Programs (FEMP) mission is to facilitate the Federal Governments implementation of sound cost-effective energy management and investment practices to enhance the nations energy security and environmental stewardship security and environmental stewardship
Innovation for Our Energy Future
Innovation for Our Energy Future
Commercially Viable RE Technologies (Large scale)
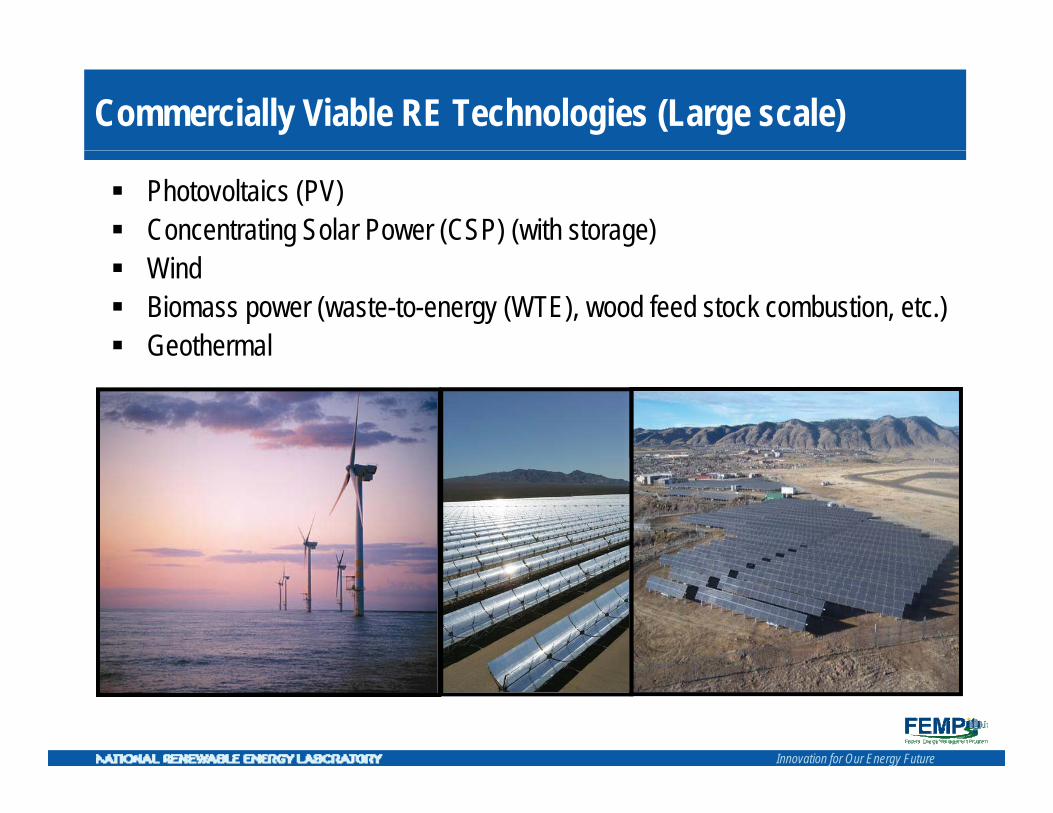
Photovoltaics (PV) Concentrating Solar Power (CSP) (with storage) Wind Biomass power (waste-to-energy (WTE) wood feed stock combustion etc) GeothermalGeothermal
Innovation for Our Energy Future
Innovation for Our Energy Future
RE Project Economic Drivers (ldquoShow me the moneyrdquo)
In general Federal RE projects are economically viable when three revenue sources can be leveragedsources can be leveraged Federal tax credits (investment tax credit (ITC) or production tax credit (PTC)) Salepurchase of power produced State incentives (ldquomake or breakrdquo project revenue source)project revenue source)State incentives ( make or break
Bottom line RE project economics are in general ldquorazor thinrdquo (incremental ldquoproject costsrdquo are potential show stoppers)
Ownership by private sector required (eg developers including investor owned utilities)
Innovation for Our Energy Future
p
Innovation for Our Energy Future
Power Purchase Agreement (PPA) ldquoWiring Diagramrdquo (ldquoBehind the Meterrdquo Project)
A tAgreements PPA Site (Agency) ndash Developer Lease or EasementAccess
A D l
$RECS REBATE Utility
Agency - Developer REC Purchase Developer - Utility R
EC
S
Site (Agency) Developer
POWER PURCHASE ($)
POWER (MWH) (Agency) POWER (MWH)
FEDERAL TAX INCENTIVES
Innovation for Our Energy Future
$
Innovation for Our Energy Future
14
$18M $54M 64
22
PV PPA Economics Example (Revenue Source Sensitivity Analysis)( y y )
Actual Project Economics
$12M 14 Project State Incentive
$225MWh 20 years PV 720 kW 1200 MWhyear Federal Tax Credits CO (Xcel Energy) CO (Xcel Energy) 30 ITC ACRS ldquoBehind the meterrdquo
Sale of Power Cost estimate$70M $005+kWh 2 escalation Circa 2007
$84M (not adjusted for time value of money)
Innovation for Our Energy Future
Innovation for Our Energy Future
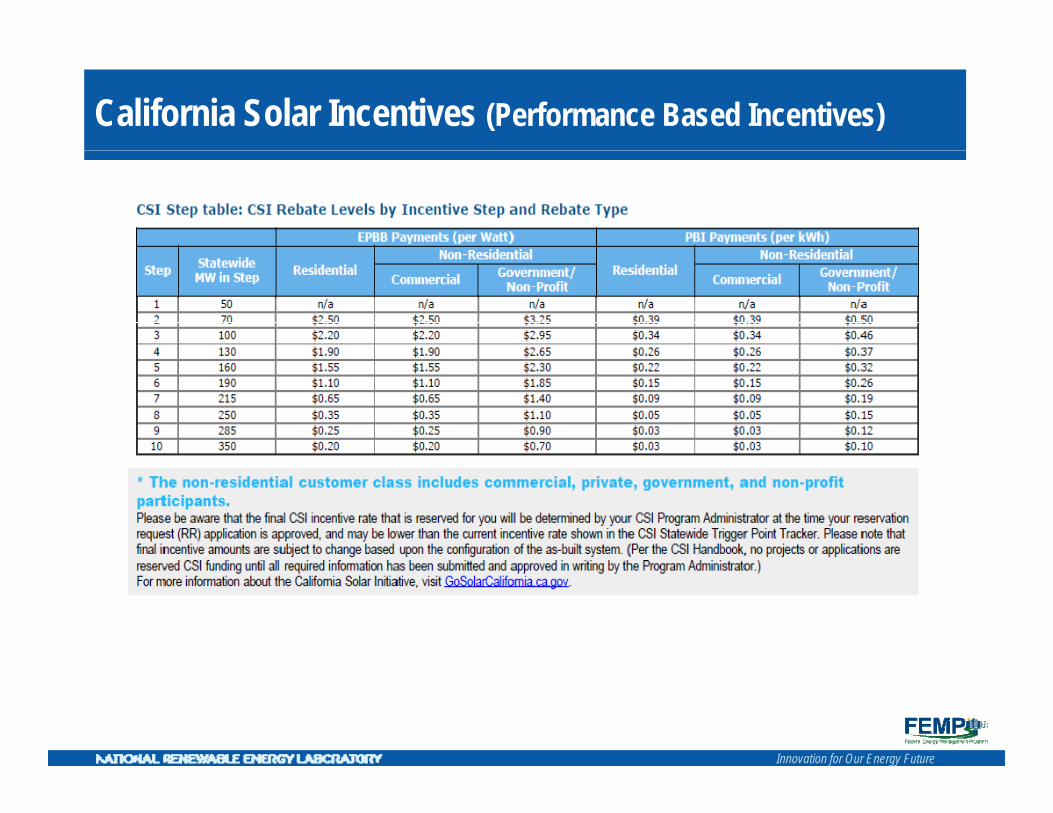
California Solar Incentives (Performance Based Incentives)
Innovation for Our Energy Future
Innovation for Our Energy Future
Fuel Cell Project Financing (generalized observations for stationary applications)stationary applications)
General bull Tri-generation applications attractive combined heat hydrogen and power
(CHHP) facilities applications maximize revenues and state incentives bull Offsetsale of power and natural gas and offers H2 source bull Maximizes capture of available state incentives
bull CA incentives particularly attractive bull Self Generation Incentive Program (SGIP) bull Biofuels feedstock incentive bull Manufacturing incentive
Project costs (stationary application-molten carbonate technology) bull Equipment and installation (first costs and installation costs indicative of Equipment and installation (first costs and installation costs indicative of
early market) bull Cost of capital (debt to equity ratio (debt level interest) early market perceived
risk)risk)
Innovation for Our Energy Future
Innovation for Our Energy Future
Fuel Cell Project Financing (cont)
Project costs (cont) bullbull Operation and maintenance Operation and maintenance
bull Fuel cost (biofuel opportunity (vs natural gas)) bull Maintenance (not insignificant)
P j tProject revenues bull Federal and state incentives
bull Federal tax credits (Investment Tax Credit (ITC) and accelerated cost recovery) bull State incentives (decreasing levels-market based varying term)
bull Sale of power revenue bull Local electric rate key (higher rates support project economics) bull Dispatchable power source (significant revenue source)
Innovation for Our Energy Future
Innovation for Our Energy Future
RE Project Construct Alternatives (Initial project development consideration) (Initial project development consideration)
Load offset alternative Developer sells power to site S l f t it t it rsquo t il t (ldquob hi d h rdquo iSale of power to site at sitersquos retail rate (ldquobehind the meterrdquonet metering))
bull Starting point for PPA price negotiation Avoids sale of power complexities
Load offsetsale of power alternative Developer sells power to site and off taker Sale of power to site based on project economics and to off taker at competitively
determined whole sale rate Project complexitiescosts (whole sale power purchaser transmission availability NEPA mission
mitigation etc)
SSalle off power altlternatitive DD evelloper selllls power tt o off tff takker Agency leases land to developer for whole sale of power by developer Public lands (BLM ldquobrownfieldsrdquo DOE Environmental Management etc)
Innovation for Our Energy Future
NREL R bl F l H ti Pl t
Innovation for Our Energy Future
Implementation Mechanisms (Whatrsquos working)
Power Purchase Agreements (PPA) bull Multiple projects across the agencies bull Project examples (Nellis AFB (14MW) USCG-Petaluma (855
kW) Ft Carson (2MW) NREL (4MW ) etc
Energy Savings Performance Contracting (ESPC) bull U t 25 t th iUp to 25 year term authorizedd bull Tax credit issue (agency retains project ownership)-Energy Services
Agreement (ESA) embedded in ESPC bull ldquoBundled solutionsrdquo (Hill AFB (210 kW)) bullbull Projects examples (biomass combustion)Projects examples (biomass combustion)
9 NREL Renewable Fuel Heating Plant (6-8mmBtuhr hot water boiler-displaces natural gas use)
9 Savannah River Site biomass CHP (240000 pph 20 MW) 9 Oak Ridge National Laboratory biomass gasification
bull Hill AFB Landfill Gas to Energy Electrical Generation ((2250 kW))gy
Utility Energy Service Contracts bull Project examples
9 Marine Corps BarstowSCE-15 MW wind turbine 9 Camp PendletonSDGampE-75 KW PV system
Nellis Air Force Base Nevada
NREL Renewable Fuel Heating Plant
Innovation for Our Energy Future
bull
Innovation for Our Energy Future
Implementation Mechanisms (Whatrsquos working) - continued
Enhanced Use Lease (EUL) Real estate transaction (ldquounder utilized landrdquo
requirement lt50 year term) Current agency authorities ( DoD10 USC 2667 NASA)
Coso Geothermal Development (NAWS China Lake)
Current agency authorities ( DoD10 USC 2667 NASA) Benefit ldquofair market valuerdquo plus ldquoin kindrdquo value (competitive determination) Project example (NASA Kennedy Space Center (10 MW PV FPampL 990 kW in kind PV system)) Proposed projects (Air Force Real Property Agency (AFRPA) actively promoting (proposed Edwards AFB project)
Army COE (proposed Ft Irwin project) DOE B kh N ti l L b t (37 MW 0 5 1 0MW i ki d PV t (ldquo ffrdquo LIPA l t)DOE Brookhaven National Laboratory (37 MW 05-10MW in kind PV system (ldquoone offrdquo LIPA lease arrangement)
ldquoEnergy Joint Venturerdquo Contracting authority for energy related procurements (10 USC 2922a (DoD) lt30 year term) Benefit Agency takes project development riskscosts in exchange for financial benefits commensurate with project
value Project example Navy China Lake (Coso Geothermal-270 MW site power and significant sale of energy to SCE
[some $17M annually])
Innovation for Our Energy Future
Innovation for Our Energy Future
NREL Project Development Financial Evaluation Capabilitiesp
bullbull Fuel Cell Power Model facilitates analysis of fuel cell technologies with Fuel Cell Power Model-facilitates analysis of fuel cell technologies with facilities Allows analysis of combined heat hydrogen and power (CHHP) systems
bull To facilitate agency site project development and negotiations NREL project development services include development of tailored project financial pro forma spreadsheetsfinancial pro forma spreadsheets
bull Solar Advisor Model (SAM)-evaluates utility scale financing for a variety t h l ifi t d l S li k b l f d l d bltechnology specific cost models See link below for down loadable version
httpswwwnrelgovanalysissam
Innovation for Our Energy Future
Q S O S
Thank You QUESTIONS
For more information DOE Federal Energy Management Program 202-586-5772 wwweereenergygovfemp
Bob Westby 303-384-7534 robertwestbynrelgov
- - -
Innovation for Our Energy Future
RE Use Requirements (Primary)
Executive Order 13514 (all Agencies) Incorporates EPAct 2005 (RE use 2 52005 (RE use 25-2007 52007 5-2010 7 52010 75-2013)2013) Incorporates EPAct Federal agency GHG reduction goals (more stringent-drives more aggressive RE
use) National Defense Authorization Act (NDAA) (DoD)National Defense Authorization Act (NDAA) (DoD) 25 renewable energy use by 2025 (2008 ldquoelectric energy userdquo 2010 ldquoall energyrdquo)
Innovation for Our Energy Future
50 o a s o e based e e e e ts be et o a te at e
Innovation for Our Energy Future
RE Use Requirements (Primary) - continued
Army Five Army installations will be net zero by 2020 25 installations by 2030 and all
AArmy iinstalllatiions bby 2058l 2058
Air Force 25 percent of base energy needs will be met with renewable energy sources by
2025
Navy 50 of all shore-based energy requequirements will be met from algy ternative
sources and 50 of all bases will be net-zero in energy consumption by 2020
Marines Increase renewable electric energy use to 25 percent by 2025Increase renewable electric energy use to 25 percent by 2025
Net Zero Energy Installation(NZEI) compliance and security goals focus on maximizing use of RE Alternative sourcesrdquo definition pendingAlternative sources definition pending
Innovation for Our Energy Future
Innovation for Our Energy Future
States Offering RPS Incentives
State Policies Advance Renewable Energy Renewable Portfolio Standards
Source DSIRE database January 2010
Innovation for Our Energy Future
e t t S e State st So a 0 50
Innovation for Our Energy Future
BLM Fast Track RE Projects (102010) (ldquoSale of Powerrdquo Project Examples)j p )(
Developer Tessera Tessera Chevron Brightsource Nextlightg Tessera
Project Imperial Valley Imperial Valley Lucerne valley Ivanpah Silver State Calico
State CACA CA CA NV CA
Technology Dish Stirling Dish Stirling Thin film PV Power Tower First Solar PV Dish Stirling
BLM Acres 6 140 6140
516 4073 78408 8230
26799
MW 709709 45
380 50
663 1847
Stirling Energy Systems Stirling Energy Systems (SES) - Solar Two
BrightSource Energy
Innovation for Our Energy Future
rdquo
Innovation for Our Energy Future
PV Project Financing ConsiderationsUpdates
Project costs bull EEquiipmentt and id insttallllatition (( economiics ldquodldquod riiver currenrdquo tt projjectt costts= $4-5watt)tt)$4 5 bull Cost of capital (perceived risks trending down-maturing market) bull Resourcefuel (free) bull OampM (OampM (miiniimall repaiir andd repllacement) t)
Project Revenues bull Project incentives
bull Tax credits (Investment Tax Credit (ITC) and accelerated cost recovery) bull State incentives (decreasing levels-market based varying term)
bull Sale of power bull Local electric rate key (higher rates support project economics) bull Intermittent system output (capacity factor key (11-19))
Innovation for Our Energy Future
Innovation for Our Energy Future
Contents
Federal Sector Renewable Energy Project Implementation ldquoWhatrsquos Working and WhyrdquoldquoWhatrsquos Working and Whyrdquo
Commercially viable RE technologies RE project economic drivers Project construct scenarios Implementation mechanismsImplementation mechanisms
DOE FEMP Mission The Department of Energys Federal Energy Management Programs (FEMP) mission is to facilitate the Federal Governments implementation of sound cost-effective energy management and investment practices to enhance the nations energy security and environmental stewardship security and environmental stewardship
Innovation for Our Energy Future
Innovation for Our Energy Future
Commercially Viable RE Technologies (Large scale)
Photovoltaics (PV) Concentrating Solar Power (CSP) (with storage) Wind Biomass power (waste-to-energy (WTE) wood feed stock combustion etc) GeothermalGeothermal
Innovation for Our Energy Future
Innovation for Our Energy Future
RE Project Economic Drivers (ldquoShow me the moneyrdquo)
In general Federal RE projects are economically viable when three revenue sources can be leveragedsources can be leveraged Federal tax credits (investment tax credit (ITC) or production tax credit (PTC)) Salepurchase of power produced State incentives (ldquomake or breakrdquo project revenue source)project revenue source)State incentives ( make or break
Bottom line RE project economics are in general ldquorazor thinrdquo (incremental ldquoproject costsrdquo are potential show stoppers)
Ownership by private sector required (eg developers including investor owned utilities)
Innovation for Our Energy Future
p
Innovation for Our Energy Future
Power Purchase Agreement (PPA) ldquoWiring Diagramrdquo (ldquoBehind the Meterrdquo Project)
A tAgreements PPA Site (Agency) ndash Developer Lease or EasementAccess
A D l
$RECS REBATE Utility
Agency - Developer REC Purchase Developer - Utility R
EC
S
Site (Agency) Developer
POWER PURCHASE ($)
POWER (MWH) (Agency) POWER (MWH)
FEDERAL TAX INCENTIVES
Innovation for Our Energy Future
$
Innovation for Our Energy Future
14
$18M $54M 64
22
PV PPA Economics Example (Revenue Source Sensitivity Analysis)( y y )
Actual Project Economics
$12M 14 Project State Incentive
$225MWh 20 years PV 720 kW 1200 MWhyear Federal Tax Credits CO (Xcel Energy) CO (Xcel Energy) 30 ITC ACRS ldquoBehind the meterrdquo
Sale of Power Cost estimate$70M $005+kWh 2 escalation Circa 2007
$84M (not adjusted for time value of money)
Innovation for Our Energy Future
Innovation for Our Energy Future
California Solar Incentives (Performance Based Incentives)
Innovation for Our Energy Future
Innovation for Our Energy Future
Fuel Cell Project Financing (generalized observations for stationary applications)stationary applications)
General bull Tri-generation applications attractive combined heat hydrogen and power
(CHHP) facilities applications maximize revenues and state incentives bull Offsetsale of power and natural gas and offers H2 source bull Maximizes capture of available state incentives
bull CA incentives particularly attractive bull Self Generation Incentive Program (SGIP) bull Biofuels feedstock incentive bull Manufacturing incentive
Project costs (stationary application-molten carbonate technology) bull Equipment and installation (first costs and installation costs indicative of Equipment and installation (first costs and installation costs indicative of
early market) bull Cost of capital (debt to equity ratio (debt level interest) early market perceived
risk)risk)
Innovation for Our Energy Future
Innovation for Our Energy Future
Fuel Cell Project Financing (cont)
Project costs (cont) bullbull Operation and maintenance Operation and maintenance
bull Fuel cost (biofuel opportunity (vs natural gas)) bull Maintenance (not insignificant)
P j tProject revenues bull Federal and state incentives
bull Federal tax credits (Investment Tax Credit (ITC) and accelerated cost recovery) bull State incentives (decreasing levels-market based varying term)
bull Sale of power revenue bull Local electric rate key (higher rates support project economics) bull Dispatchable power source (significant revenue source)
Innovation for Our Energy Future
Innovation for Our Energy Future
RE Project Construct Alternatives (Initial project development consideration) (Initial project development consideration)
Load offset alternative Developer sells power to site S l f t it t it rsquo t il t (ldquob hi d h rdquo iSale of power to site at sitersquos retail rate (ldquobehind the meterrdquonet metering))
bull Starting point for PPA price negotiation Avoids sale of power complexities
Load offsetsale of power alternative Developer sells power to site and off taker Sale of power to site based on project economics and to off taker at competitively
determined whole sale rate Project complexitiescosts (whole sale power purchaser transmission availability NEPA mission
mitigation etc)
SSalle off power altlternatitive DD evelloper selllls power tt o off tff takker Agency leases land to developer for whole sale of power by developer Public lands (BLM ldquobrownfieldsrdquo DOE Environmental Management etc)
Innovation for Our Energy Future
NREL R bl F l H ti Pl t
Innovation for Our Energy Future
Implementation Mechanisms (Whatrsquos working)
Power Purchase Agreements (PPA) bull Multiple projects across the agencies bull Project examples (Nellis AFB (14MW) USCG-Petaluma (855
kW) Ft Carson (2MW) NREL (4MW ) etc
Energy Savings Performance Contracting (ESPC) bull U t 25 t th iUp to 25 year term authorizedd bull Tax credit issue (agency retains project ownership)-Energy Services
Agreement (ESA) embedded in ESPC bull ldquoBundled solutionsrdquo (Hill AFB (210 kW)) bullbull Projects examples (biomass combustion)Projects examples (biomass combustion)
9 NREL Renewable Fuel Heating Plant (6-8mmBtuhr hot water boiler-displaces natural gas use)
9 Savannah River Site biomass CHP (240000 pph 20 MW) 9 Oak Ridge National Laboratory biomass gasification
bull Hill AFB Landfill Gas to Energy Electrical Generation ((2250 kW))gy
Utility Energy Service Contracts bull Project examples
9 Marine Corps BarstowSCE-15 MW wind turbine 9 Camp PendletonSDGampE-75 KW PV system
Nellis Air Force Base Nevada
NREL Renewable Fuel Heating Plant
Innovation for Our Energy Future
bull
Innovation for Our Energy Future
Implementation Mechanisms (Whatrsquos working) - continued
Enhanced Use Lease (EUL) Real estate transaction (ldquounder utilized landrdquo
requirement lt50 year term) Current agency authorities ( DoD10 USC 2667 NASA)
Coso Geothermal Development (NAWS China Lake)
Current agency authorities ( DoD10 USC 2667 NASA) Benefit ldquofair market valuerdquo plus ldquoin kindrdquo value (competitive determination) Project example (NASA Kennedy Space Center (10 MW PV FPampL 990 kW in kind PV system)) Proposed projects (Air Force Real Property Agency (AFRPA) actively promoting (proposed Edwards AFB project)
Army COE (proposed Ft Irwin project) DOE B kh N ti l L b t (37 MW 0 5 1 0MW i ki d PV t (ldquo ffrdquo LIPA l t)DOE Brookhaven National Laboratory (37 MW 05-10MW in kind PV system (ldquoone offrdquo LIPA lease arrangement)
ldquoEnergy Joint Venturerdquo Contracting authority for energy related procurements (10 USC 2922a (DoD) lt30 year term) Benefit Agency takes project development riskscosts in exchange for financial benefits commensurate with project
value Project example Navy China Lake (Coso Geothermal-270 MW site power and significant sale of energy to SCE
[some $17M annually])
Innovation for Our Energy Future
Innovation for Our Energy Future
NREL Project Development Financial Evaluation Capabilitiesp
bullbull Fuel Cell Power Model facilitates analysis of fuel cell technologies with Fuel Cell Power Model-facilitates analysis of fuel cell technologies with facilities Allows analysis of combined heat hydrogen and power (CHHP) systems
bull To facilitate agency site project development and negotiations NREL project development services include development of tailored project financial pro forma spreadsheetsfinancial pro forma spreadsheets
bull Solar Advisor Model (SAM)-evaluates utility scale financing for a variety t h l ifi t d l S li k b l f d l d bltechnology specific cost models See link below for down loadable version
httpswwwnrelgovanalysissam
Innovation for Our Energy Future
Q S O S
Thank You QUESTIONS
For more information DOE Federal Energy Management Program 202-586-5772 wwweereenergygovfemp
Bob Westby 303-384-7534 robertwestbynrelgov
- - -
Innovation for Our Energy Future
RE Use Requirements (Primary)
Executive Order 13514 (all Agencies) Incorporates EPAct 2005 (RE use 2 52005 (RE use 25-2007 52007 5-2010 7 52010 75-2013)2013) Incorporates EPAct Federal agency GHG reduction goals (more stringent-drives more aggressive RE
use) National Defense Authorization Act (NDAA) (DoD)National Defense Authorization Act (NDAA) (DoD) 25 renewable energy use by 2025 (2008 ldquoelectric energy userdquo 2010 ldquoall energyrdquo)
Innovation for Our Energy Future
50 o a s o e based e e e e ts be et o a te at e
Innovation for Our Energy Future
RE Use Requirements (Primary) - continued
Army Five Army installations will be net zero by 2020 25 installations by 2030 and all
AArmy iinstalllatiions bby 2058l 2058
Air Force 25 percent of base energy needs will be met with renewable energy sources by
2025
Navy 50 of all shore-based energy requequirements will be met from algy ternative
sources and 50 of all bases will be net-zero in energy consumption by 2020
Marines Increase renewable electric energy use to 25 percent by 2025Increase renewable electric energy use to 25 percent by 2025
Net Zero Energy Installation(NZEI) compliance and security goals focus on maximizing use of RE Alternative sourcesrdquo definition pendingAlternative sources definition pending
Innovation for Our Energy Future
Innovation for Our Energy Future
States Offering RPS Incentives
State Policies Advance Renewable Energy Renewable Portfolio Standards
Source DSIRE database January 2010
Innovation for Our Energy Future
e t t S e State st So a 0 50
Innovation for Our Energy Future
BLM Fast Track RE Projects (102010) (ldquoSale of Powerrdquo Project Examples)j p )(
Developer Tessera Tessera Chevron Brightsource Nextlightg Tessera
Project Imperial Valley Imperial Valley Lucerne valley Ivanpah Silver State Calico
State CACA CA CA NV CA
Technology Dish Stirling Dish Stirling Thin film PV Power Tower First Solar PV Dish Stirling
BLM Acres 6 140 6140
516 4073 78408 8230
26799
MW 709709 45
380 50
663 1847
Stirling Energy Systems Stirling Energy Systems (SES) - Solar Two
BrightSource Energy
Innovation for Our Energy Future
rdquo
Innovation for Our Energy Future
PV Project Financing ConsiderationsUpdates
Project costs bull EEquiipmentt and id insttallllatition (( economiics ldquodldquod riiver currenrdquo tt projjectt costts= $4-5watt)tt)$4 5 bull Cost of capital (perceived risks trending down-maturing market) bull Resourcefuel (free) bull OampM (OampM (miiniimall repaiir andd repllacement) t)
Project Revenues bull Project incentives
bull Tax credits (Investment Tax Credit (ITC) and accelerated cost recovery) bull State incentives (decreasing levels-market based varying term)
bull Sale of power bull Local electric rate key (higher rates support project economics) bull Intermittent system output (capacity factor key (11-19))
Innovation for Our Energy Future
Innovation for Our Energy Future
RE Project Economic Drivers (ldquoShow me the moneyrdquo)
In general Federal RE projects are economically viable when three revenue sources can be leveragedsources can be leveraged Federal tax credits (investment tax credit (ITC) or production tax credit (PTC)) Salepurchase of power produced State incentives (ldquomake or breakrdquo project revenue source)project revenue source)State incentives ( make or break
Bottom line RE project economics are in general ldquorazor thinrdquo (incremental ldquoproject costsrdquo are potential show stoppers)
Ownership by private sector required (eg developers including investor owned utilities)
Innovation for Our Energy Future
p
Innovation for Our Energy Future
Power Purchase Agreement (PPA) ldquoWiring Diagramrdquo (ldquoBehind the Meterrdquo Project)
A tAgreements PPA Site (Agency) ndash Developer Lease or EasementAccess
A D l
$RECS REBATE Utility
Agency - Developer REC Purchase Developer - Utility R
EC
S
Site (Agency) Developer
POWER PURCHASE ($)
POWER (MWH) (Agency) POWER (MWH)
FEDERAL TAX INCENTIVES
Innovation for Our Energy Future
$
Innovation for Our Energy Future
14
$18M $54M 64
22
PV PPA Economics Example (Revenue Source Sensitivity Analysis)( y y )
Actual Project Economics
$12M 14 Project State Incentive
$225MWh 20 years PV 720 kW 1200 MWhyear Federal Tax Credits CO (Xcel Energy) CO (Xcel Energy) 30 ITC ACRS ldquoBehind the meterrdquo
Sale of Power Cost estimate$70M $005+kWh 2 escalation Circa 2007
$84M (not adjusted for time value of money)
Innovation for Our Energy Future
Innovation for Our Energy Future
California Solar Incentives (Performance Based Incentives)
Innovation for Our Energy Future
Innovation for Our Energy Future
Fuel Cell Project Financing (generalized observations for stationary applications)stationary applications)
General bull Tri-generation applications attractive combined heat hydrogen and power
(CHHP) facilities applications maximize revenues and state incentives bull Offsetsale of power and natural gas and offers H2 source bull Maximizes capture of available state incentives
bull CA incentives particularly attractive bull Self Generation Incentive Program (SGIP) bull Biofuels feedstock incentive bull Manufacturing incentive
Project costs (stationary application-molten carbonate technology) bull Equipment and installation (first costs and installation costs indicative of Equipment and installation (first costs and installation costs indicative of
early market) bull Cost of capital (debt to equity ratio (debt level interest) early market perceived
risk)risk)
Innovation for Our Energy Future
Innovation for Our Energy Future
Fuel Cell Project Financing (cont)
Project costs (cont) bullbull Operation and maintenance Operation and maintenance
bull Fuel cost (biofuel opportunity (vs natural gas)) bull Maintenance (not insignificant)
P j tProject revenues bull Federal and state incentives
bull Federal tax credits (Investment Tax Credit (ITC) and accelerated cost recovery) bull State incentives (decreasing levels-market based varying term)
bull Sale of power revenue bull Local electric rate key (higher rates support project economics) bull Dispatchable power source (significant revenue source)
Innovation for Our Energy Future
Innovation for Our Energy Future
RE Project Construct Alternatives (Initial project development consideration) (Initial project development consideration)
Load offset alternative Developer sells power to site S l f t it t it rsquo t il t (ldquob hi d h rdquo iSale of power to site at sitersquos retail rate (ldquobehind the meterrdquonet metering))
bull Starting point for PPA price negotiation Avoids sale of power complexities
Load offsetsale of power alternative Developer sells power to site and off taker Sale of power to site based on project economics and to off taker at competitively
determined whole sale rate Project complexitiescosts (whole sale power purchaser transmission availability NEPA mission
mitigation etc)
SSalle off power altlternatitive DD evelloper selllls power tt o off tff takker Agency leases land to developer for whole sale of power by developer Public lands (BLM ldquobrownfieldsrdquo DOE Environmental Management etc)
Innovation for Our Energy Future
NREL R bl F l H ti Pl t
Innovation for Our Energy Future
Implementation Mechanisms (Whatrsquos working)
Power Purchase Agreements (PPA) bull Multiple projects across the agencies bull Project examples (Nellis AFB (14MW) USCG-Petaluma (855
kW) Ft Carson (2MW) NREL (4MW ) etc
Energy Savings Performance Contracting (ESPC) bull U t 25 t th iUp to 25 year term authorizedd bull Tax credit issue (agency retains project ownership)-Energy Services
Agreement (ESA) embedded in ESPC bull ldquoBundled solutionsrdquo (Hill AFB (210 kW)) bullbull Projects examples (biomass combustion)Projects examples (biomass combustion)
9 NREL Renewable Fuel Heating Plant (6-8mmBtuhr hot water boiler-displaces natural gas use)
9 Savannah River Site biomass CHP (240000 pph 20 MW) 9 Oak Ridge National Laboratory biomass gasification
bull Hill AFB Landfill Gas to Energy Electrical Generation ((2250 kW))gy
Utility Energy Service Contracts bull Project examples
9 Marine Corps BarstowSCE-15 MW wind turbine 9 Camp PendletonSDGampE-75 KW PV system
Nellis Air Force Base Nevada
NREL Renewable Fuel Heating Plant
Innovation for Our Energy Future
bull
Innovation for Our Energy Future
Implementation Mechanisms (Whatrsquos working) - continued
Enhanced Use Lease (EUL) Real estate transaction (ldquounder utilized landrdquo
requirement lt50 year term) Current agency authorities ( DoD10 USC 2667 NASA)
Coso Geothermal Development (NAWS China Lake)
Current agency authorities ( DoD10 USC 2667 NASA) Benefit ldquofair market valuerdquo plus ldquoin kindrdquo value (competitive determination) Project example (NASA Kennedy Space Center (10 MW PV FPampL 990 kW in kind PV system)) Proposed projects (Air Force Real Property Agency (AFRPA) actively promoting (proposed Edwards AFB project)
Army COE (proposed Ft Irwin project) DOE B kh N ti l L b t (37 MW 0 5 1 0MW i ki d PV t (ldquo ffrdquo LIPA l t)DOE Brookhaven National Laboratory (37 MW 05-10MW in kind PV system (ldquoone offrdquo LIPA lease arrangement)
ldquoEnergy Joint Venturerdquo Contracting authority for energy related procurements (10 USC 2922a (DoD) lt30 year term) Benefit Agency takes project development riskscosts in exchange for financial benefits commensurate with project
value Project example Navy China Lake (Coso Geothermal-270 MW site power and significant sale of energy to SCE
[some $17M annually])
Innovation for Our Energy Future
Innovation for Our Energy Future
NREL Project Development Financial Evaluation Capabilitiesp
bullbull Fuel Cell Power Model facilitates analysis of fuel cell technologies with Fuel Cell Power Model-facilitates analysis of fuel cell technologies with facilities Allows analysis of combined heat hydrogen and power (CHHP) systems
bull To facilitate agency site project development and negotiations NREL project development services include development of tailored project financial pro forma spreadsheetsfinancial pro forma spreadsheets
bull Solar Advisor Model (SAM)-evaluates utility scale financing for a variety t h l ifi t d l S li k b l f d l d bltechnology specific cost models See link below for down loadable version
httpswwwnrelgovanalysissam
Innovation for Our Energy Future
Q S O S
Thank You QUESTIONS
For more information DOE Federal Energy Management Program 202-586-5772 wwweereenergygovfemp
Bob Westby 303-384-7534 robertwestbynrelgov
- - -
Innovation for Our Energy Future
RE Use Requirements (Primary)
Executive Order 13514 (all Agencies) Incorporates EPAct 2005 (RE use 2 52005 (RE use 25-2007 52007 5-2010 7 52010 75-2013)2013) Incorporates EPAct Federal agency GHG reduction goals (more stringent-drives more aggressive RE
use) National Defense Authorization Act (NDAA) (DoD)National Defense Authorization Act (NDAA) (DoD) 25 renewable energy use by 2025 (2008 ldquoelectric energy userdquo 2010 ldquoall energyrdquo)
Innovation for Our Energy Future
50 o a s o e based e e e e ts be et o a te at e
Innovation for Our Energy Future
RE Use Requirements (Primary) - continued
Army Five Army installations will be net zero by 2020 25 installations by 2030 and all
AArmy iinstalllatiions bby 2058l 2058
Air Force 25 percent of base energy needs will be met with renewable energy sources by
2025
Navy 50 of all shore-based energy requequirements will be met from algy ternative
sources and 50 of all bases will be net-zero in energy consumption by 2020
Marines Increase renewable electric energy use to 25 percent by 2025Increase renewable electric energy use to 25 percent by 2025
Net Zero Energy Installation(NZEI) compliance and security goals focus on maximizing use of RE Alternative sourcesrdquo definition pendingAlternative sources definition pending
Innovation for Our Energy Future
Innovation for Our Energy Future
States Offering RPS Incentives
State Policies Advance Renewable Energy Renewable Portfolio Standards
Source DSIRE database January 2010
Innovation for Our Energy Future
e t t S e State st So a 0 50
Innovation for Our Energy Future
BLM Fast Track RE Projects (102010) (ldquoSale of Powerrdquo Project Examples)j p )(
Developer Tessera Tessera Chevron Brightsource Nextlightg Tessera
Project Imperial Valley Imperial Valley Lucerne valley Ivanpah Silver State Calico
State CACA CA CA NV CA
Technology Dish Stirling Dish Stirling Thin film PV Power Tower First Solar PV Dish Stirling
BLM Acres 6 140 6140
516 4073 78408 8230
26799
MW 709709 45
380 50
663 1847
Stirling Energy Systems Stirling Energy Systems (SES) - Solar Two
BrightSource Energy
Innovation for Our Energy Future
rdquo
Innovation for Our Energy Future
PV Project Financing ConsiderationsUpdates
Project costs bull EEquiipmentt and id insttallllatition (( economiics ldquodldquod riiver currenrdquo tt projjectt costts= $4-5watt)tt)$4 5 bull Cost of capital (perceived risks trending down-maturing market) bull Resourcefuel (free) bull OampM (OampM (miiniimall repaiir andd repllacement) t)
Project Revenues bull Project incentives
bull Tax credits (Investment Tax Credit (ITC) and accelerated cost recovery) bull State incentives (decreasing levels-market based varying term)
bull Sale of power bull Local electric rate key (higher rates support project economics) bull Intermittent system output (capacity factor key (11-19))
Innovation for Our Energy Future
Innovation for Our Energy Future
Fuel Cell Project Financing (cont)
Project costs (cont) bullbull Operation and maintenance Operation and maintenance
bull Fuel cost (biofuel opportunity (vs natural gas)) bull Maintenance (not insignificant)
P j tProject revenues bull Federal and state incentives
bull Federal tax credits (Investment Tax Credit (ITC) and accelerated cost recovery) bull State incentives (decreasing levels-market based varying term)
bull Sale of power revenue bull Local electric rate key (higher rates support project economics) bull Dispatchable power source (significant revenue source)
Innovation for Our Energy Future
Innovation for Our Energy Future
RE Project Construct Alternatives (Initial project development consideration) (Initial project development consideration)
Load offset alternative Developer sells power to site S l f t it t it rsquo t il t (ldquob hi d h rdquo iSale of power to site at sitersquos retail rate (ldquobehind the meterrdquonet metering))
bull Starting point for PPA price negotiation Avoids sale of power complexities
Load offsetsale of power alternative Developer sells power to site and off taker Sale of power to site based on project economics and to off taker at competitively
determined whole sale rate Project complexitiescosts (whole sale power purchaser transmission availability NEPA mission
mitigation etc)
SSalle off power altlternatitive DD evelloper selllls power tt o off tff takker Agency leases land to developer for whole sale of power by developer Public lands (BLM ldquobrownfieldsrdquo DOE Environmental Management etc)
Innovation for Our Energy Future
NREL R bl F l H ti Pl t
Innovation for Our Energy Future
Implementation Mechanisms (Whatrsquos working)
Power Purchase Agreements (PPA) bull Multiple projects across the agencies bull Project examples (Nellis AFB (14MW) USCG-Petaluma (855
kW) Ft Carson (2MW) NREL (4MW ) etc
Energy Savings Performance Contracting (ESPC) bull U t 25 t th iUp to 25 year term authorizedd bull Tax credit issue (agency retains project ownership)-Energy Services
Agreement (ESA) embedded in ESPC bull ldquoBundled solutionsrdquo (Hill AFB (210 kW)) bullbull Projects examples (biomass combustion)Projects examples (biomass combustion)
9 NREL Renewable Fuel Heating Plant (6-8mmBtuhr hot water boiler-displaces natural gas use)
9 Savannah River Site biomass CHP (240000 pph 20 MW) 9 Oak Ridge National Laboratory biomass gasification
bull Hill AFB Landfill Gas to Energy Electrical Generation ((2250 kW))gy
Utility Energy Service Contracts bull Project examples
9 Marine Corps BarstowSCE-15 MW wind turbine 9 Camp PendletonSDGampE-75 KW PV system
Nellis Air Force Base Nevada
NREL Renewable Fuel Heating Plant
Innovation for Our Energy Future
bull
Innovation for Our Energy Future
Implementation Mechanisms (Whatrsquos working) - continued
Enhanced Use Lease (EUL) Real estate transaction (ldquounder utilized landrdquo
requirement lt50 year term) Current agency authorities ( DoD10 USC 2667 NASA)
Coso Geothermal Development (NAWS China Lake)
Current agency authorities ( DoD10 USC 2667 NASA) Benefit ldquofair market valuerdquo plus ldquoin kindrdquo value (competitive determination) Project example (NASA Kennedy Space Center (10 MW PV FPampL 990 kW in kind PV system)) Proposed projects (Air Force Real Property Agency (AFRPA) actively promoting (proposed Edwards AFB project)
Army COE (proposed Ft Irwin project) DOE B kh N ti l L b t (37 MW 0 5 1 0MW i ki d PV t (ldquo ffrdquo LIPA l t)DOE Brookhaven National Laboratory (37 MW 05-10MW in kind PV system (ldquoone offrdquo LIPA lease arrangement)
ldquoEnergy Joint Venturerdquo Contracting authority for energy related procurements (10 USC 2922a (DoD) lt30 year term) Benefit Agency takes project development riskscosts in exchange for financial benefits commensurate with project
value Project example Navy China Lake (Coso Geothermal-270 MW site power and significant sale of energy to SCE
[some $17M annually])
Innovation for Our Energy Future
Innovation for Our Energy Future
NREL Project Development Financial Evaluation Capabilitiesp
bullbull Fuel Cell Power Model facilitates analysis of fuel cell technologies with Fuel Cell Power Model-facilitates analysis of fuel cell technologies with facilities Allows analysis of combined heat hydrogen and power (CHHP) systems
bull To facilitate agency site project development and negotiations NREL project development services include development of tailored project financial pro forma spreadsheetsfinancial pro forma spreadsheets
bull Solar Advisor Model (SAM)-evaluates utility scale financing for a variety t h l ifi t d l S li k b l f d l d bltechnology specific cost models See link below for down loadable version
httpswwwnrelgovanalysissam
Innovation for Our Energy Future
Q S O S
Thank You QUESTIONS
For more information DOE Federal Energy Management Program 202-586-5772 wwweereenergygovfemp
Bob Westby 303-384-7534 robertwestbynrelgov
- - -
Innovation for Our Energy Future
RE Use Requirements (Primary)
Executive Order 13514 (all Agencies) Incorporates EPAct 2005 (RE use 2 52005 (RE use 25-2007 52007 5-2010 7 52010 75-2013)2013) Incorporates EPAct Federal agency GHG reduction goals (more stringent-drives more aggressive RE
use) National Defense Authorization Act (NDAA) (DoD)National Defense Authorization Act (NDAA) (DoD) 25 renewable energy use by 2025 (2008 ldquoelectric energy userdquo 2010 ldquoall energyrdquo)
Innovation for Our Energy Future
50 o a s o e based e e e e ts be et o a te at e
Innovation for Our Energy Future
RE Use Requirements (Primary) - continued
Army Five Army installations will be net zero by 2020 25 installations by 2030 and all
AArmy iinstalllatiions bby 2058l 2058
Air Force 25 percent of base energy needs will be met with renewable energy sources by
2025
Navy 50 of all shore-based energy requequirements will be met from algy ternative
sources and 50 of all bases will be net-zero in energy consumption by 2020
Marines Increase renewable electric energy use to 25 percent by 2025Increase renewable electric energy use to 25 percent by 2025
Net Zero Energy Installation(NZEI) compliance and security goals focus on maximizing use of RE Alternative sourcesrdquo definition pendingAlternative sources definition pending
Innovation for Our Energy Future
Innovation for Our Energy Future
States Offering RPS Incentives
State Policies Advance Renewable Energy Renewable Portfolio Standards
Source DSIRE database January 2010
Innovation for Our Energy Future
e t t S e State st So a 0 50
Innovation for Our Energy Future
BLM Fast Track RE Projects (102010) (ldquoSale of Powerrdquo Project Examples)j p )(
Developer Tessera Tessera Chevron Brightsource Nextlightg Tessera
Project Imperial Valley Imperial Valley Lucerne valley Ivanpah Silver State Calico
State CACA CA CA NV CA
Technology Dish Stirling Dish Stirling Thin film PV Power Tower First Solar PV Dish Stirling
BLM Acres 6 140 6140
516 4073 78408 8230
26799
MW 709709 45
380 50
663 1847
Stirling Energy Systems Stirling Energy Systems (SES) - Solar Two
BrightSource Energy
Innovation for Our Energy Future
rdquo
Innovation for Our Energy Future
PV Project Financing ConsiderationsUpdates
Project costs bull EEquiipmentt and id insttallllatition (( economiics ldquodldquod riiver currenrdquo tt projjectt costts= $4-5watt)tt)$4 5 bull Cost of capital (perceived risks trending down-maturing market) bull Resourcefuel (free) bull OampM (OampM (miiniimall repaiir andd repllacement) t)
Project Revenues bull Project incentives
bull Tax credits (Investment Tax Credit (ITC) and accelerated cost recovery) bull State incentives (decreasing levels-market based varying term)
bull Sale of power bull Local electric rate key (higher rates support project economics) bull Intermittent system output (capacity factor key (11-19))
Innovation for Our Energy Future

Innovation for Our Energy Future
RE Project Construct Alternatives (Initial project development consideration) (Initial project development consideration)
Load offset alternative Developer sells power to site S l f t it t it rsquo t il t (ldquob hi d h rdquo iSale of power to site at sitersquos retail rate (ldquobehind the meterrdquonet metering))
bull Starting point for PPA price negotiation Avoids sale of power complexities
Load offsetsale of power alternative Developer sells power to site and off taker Sale of power to site based on project economics and to off taker at competitively
determined whole sale rate Project complexitiescosts (whole sale power purchaser transmission availability NEPA mission
mitigation etc)
SSalle off power altlternatitive DD evelloper selllls power tt o off tff takker Agency leases land to developer for whole sale of power by developer Public lands (BLM ldquobrownfieldsrdquo DOE Environmental Management etc)
Innovation for Our Energy Future
NREL R bl F l H ti Pl t
Innovation for Our Energy Future
Implementation Mechanisms (Whatrsquos working)
Power Purchase Agreements (PPA) bull Multiple projects across the agencies bull Project examples (Nellis AFB (14MW) USCG-Petaluma (855
kW) Ft Carson (2MW) NREL (4MW ) etc
Energy Savings Performance Contracting (ESPC) bull U t 25 t th iUp to 25 year term authorizedd bull Tax credit issue (agency retains project ownership)-Energy Services
Agreement (ESA) embedded in ESPC bull ldquoBundled solutionsrdquo (Hill AFB (210 kW)) bullbull Projects examples (biomass combustion)Projects examples (biomass combustion)
9 NREL Renewable Fuel Heating Plant (6-8mmBtuhr hot water boiler-displaces natural gas use)
9 Savannah River Site biomass CHP (240000 pph 20 MW) 9 Oak Ridge National Laboratory biomass gasification
bull Hill AFB Landfill Gas to Energy Electrical Generation ((2250 kW))gy
Utility Energy Service Contracts bull Project examples
9 Marine Corps BarstowSCE-15 MW wind turbine 9 Camp PendletonSDGampE-75 KW PV system
Nellis Air Force Base Nevada
NREL Renewable Fuel Heating Plant
Innovation for Our Energy Future
bull
Innovation for Our Energy Future
Implementation Mechanisms (Whatrsquos working) - continued
Enhanced Use Lease (EUL) Real estate transaction (ldquounder utilized landrdquo
requirement lt50 year term) Current agency authorities ( DoD10 USC 2667 NASA)
Coso Geothermal Development (NAWS China Lake)
Current agency authorities ( DoD10 USC 2667 NASA) Benefit ldquofair market valuerdquo plus ldquoin kindrdquo value (competitive determination) Project example (NASA Kennedy Space Center (10 MW PV FPampL 990 kW in kind PV system)) Proposed projects (Air Force Real Property Agency (AFRPA) actively promoting (proposed Edwards AFB project)
Army COE (proposed Ft Irwin project) DOE B kh N ti l L b t (37 MW 0 5 1 0MW i ki d PV t (ldquo ffrdquo LIPA l t)DOE Brookhaven National Laboratory (37 MW 05-10MW in kind PV system (ldquoone offrdquo LIPA lease arrangement)
ldquoEnergy Joint Venturerdquo Contracting authority for energy related procurements (10 USC 2922a (DoD) lt30 year term) Benefit Agency takes project development riskscosts in exchange for financial benefits commensurate with project
value Project example Navy China Lake (Coso Geothermal-270 MW site power and significant sale of energy to SCE
[some $17M annually])
Innovation for Our Energy Future
Innovation for Our Energy Future
NREL Project Development Financial Evaluation Capabilitiesp
bullbull Fuel Cell Power Model facilitates analysis of fuel cell technologies with Fuel Cell Power Model-facilitates analysis of fuel cell technologies with facilities Allows analysis of combined heat hydrogen and power (CHHP) systems
bull To facilitate agency site project development and negotiations NREL project development services include development of tailored project financial pro forma spreadsheetsfinancial pro forma spreadsheets
bull Solar Advisor Model (SAM)-evaluates utility scale financing for a variety t h l ifi t d l S li k b l f d l d bltechnology specific cost models See link below for down loadable version
httpswwwnrelgovanalysissam
Innovation for Our Energy Future
Q S O S
Thank You QUESTIONS
For more information DOE Federal Energy Management Program 202-586-5772 wwweereenergygovfemp
Bob Westby 303-384-7534 robertwestbynrelgov
- - -
Innovation for Our Energy Future
RE Use Requirements (Primary)
Executive Order 13514 (all Agencies) Incorporates EPAct 2005 (RE use 2 52005 (RE use 25-2007 52007 5-2010 7 52010 75-2013)2013) Incorporates EPAct Federal agency GHG reduction goals (more stringent-drives more aggressive RE
use) National Defense Authorization Act (NDAA) (DoD)National Defense Authorization Act (NDAA) (DoD) 25 renewable energy use by 2025 (2008 ldquoelectric energy userdquo 2010 ldquoall energyrdquo)
Innovation for Our Energy Future
50 o a s o e based e e e e ts be et o a te at e
Innovation for Our Energy Future
RE Use Requirements (Primary) - continued
Army Five Army installations will be net zero by 2020 25 installations by 2030 and all
AArmy iinstalllatiions bby 2058l 2058
Air Force 25 percent of base energy needs will be met with renewable energy sources by
2025
Navy 50 of all shore-based energy requequirements will be met from algy ternative
sources and 50 of all bases will be net-zero in energy consumption by 2020
Marines Increase renewable electric energy use to 25 percent by 2025Increase renewable electric energy use to 25 percent by 2025
Net Zero Energy Installation(NZEI) compliance and security goals focus on maximizing use of RE Alternative sourcesrdquo definition pendingAlternative sources definition pending
Innovation for Our Energy Future
Innovation for Our Energy Future
States Offering RPS Incentives
State Policies Advance Renewable Energy Renewable Portfolio Standards
Source DSIRE database January 2010
Innovation for Our Energy Future
e t t S e State st So a 0 50
Innovation for Our Energy Future
BLM Fast Track RE Projects (102010) (ldquoSale of Powerrdquo Project Examples)j p )(
Developer Tessera Tessera Chevron Brightsource Nextlightg Tessera
Project Imperial Valley Imperial Valley Lucerne valley Ivanpah Silver State Calico
State CACA CA CA NV CA
Technology Dish Stirling Dish Stirling Thin film PV Power Tower First Solar PV Dish Stirling
BLM Acres 6 140 6140
516 4073 78408 8230
26799
MW 709709 45
380 50
663 1847
Stirling Energy Systems Stirling Energy Systems (SES) - Solar Two
BrightSource Energy
Innovation for Our Energy Future
rdquo
Innovation for Our Energy Future
PV Project Financing ConsiderationsUpdates
Project costs bull EEquiipmentt and id insttallllatition (( economiics ldquodldquod riiver currenrdquo tt projjectt costts= $4-5watt)tt)$4 5 bull Cost of capital (perceived risks trending down-maturing market) bull Resourcefuel (free) bull OampM (OampM (miiniimall repaiir andd repllacement) t)
Project Revenues bull Project incentives
bull Tax credits (Investment Tax Credit (ITC) and accelerated cost recovery) bull State incentives (decreasing levels-market based varying term)
bull Sale of power bull Local electric rate key (higher rates support project economics) bull Intermittent system output (capacity factor key (11-19))
Innovation for Our Energy Future

Innovation for Our Energy Future
NREL Project Development Financial Evaluation Capabilitiesp
bullbull Fuel Cell Power Model facilitates analysis of fuel cell technologies with Fuel Cell Power Model-facilitates analysis of fuel cell technologies with facilities Allows analysis of combined heat hydrogen and power (CHHP) systems
bull To facilitate agency site project development and negotiations NREL project development services include development of tailored project financial pro forma spreadsheetsfinancial pro forma spreadsheets
bull Solar Advisor Model (SAM)-evaluates utility scale financing for a variety t h l ifi t d l S li k b l f d l d bltechnology specific cost models See link below for down loadable version
httpswwwnrelgovanalysissam
Innovation for Our Energy Future
Q S O S
Thank You QUESTIONS
For more information DOE Federal Energy Management Program 202-586-5772 wwweereenergygovfemp
Bob Westby 303-384-7534 robertwestbynrelgov
- - -
Innovation for Our Energy Future
RE Use Requirements (Primary)
Executive Order 13514 (all Agencies) Incorporates EPAct 2005 (RE use 2 52005 (RE use 25-2007 52007 5-2010 7 52010 75-2013)2013) Incorporates EPAct Federal agency GHG reduction goals (more stringent-drives more aggressive RE
use) National Defense Authorization Act (NDAA) (DoD)National Defense Authorization Act (NDAA) (DoD) 25 renewable energy use by 2025 (2008 ldquoelectric energy userdquo 2010 ldquoall energyrdquo)
Innovation for Our Energy Future
50 o a s o e based e e e e ts be et o a te at e
Innovation for Our Energy Future
RE Use Requirements (Primary) - continued
Army Five Army installations will be net zero by 2020 25 installations by 2030 and all
AArmy iinstalllatiions bby 2058l 2058
Air Force 25 percent of base energy needs will be met with renewable energy sources by
2025
Navy 50 of all shore-based energy requequirements will be met from algy ternative
sources and 50 of all bases will be net-zero in energy consumption by 2020
Marines Increase renewable electric energy use to 25 percent by 2025Increase renewable electric energy use to 25 percent by 2025
Net Zero Energy Installation(NZEI) compliance and security goals focus on maximizing use of RE Alternative sourcesrdquo definition pendingAlternative sources definition pending
Innovation for Our Energy Future
Innovation for Our Energy Future
States Offering RPS Incentives
State Policies Advance Renewable Energy Renewable Portfolio Standards
Source DSIRE database January 2010
Innovation for Our Energy Future
e t t S e State st So a 0 50
Innovation for Our Energy Future
BLM Fast Track RE Projects (102010) (ldquoSale of Powerrdquo Project Examples)j p )(
Developer Tessera Tessera Chevron Brightsource Nextlightg Tessera
Project Imperial Valley Imperial Valley Lucerne valley Ivanpah Silver State Calico
State CACA CA CA NV CA
Technology Dish Stirling Dish Stirling Thin film PV Power Tower First Solar PV Dish Stirling
BLM Acres 6 140 6140
516 4073 78408 8230
26799
MW 709709 45
380 50
663 1847
Stirling Energy Systems Stirling Energy Systems (SES) - Solar Two
BrightSource Energy
Innovation for Our Energy Future
rdquo
Innovation for Our Energy Future
PV Project Financing ConsiderationsUpdates
Project costs bull EEquiipmentt and id insttallllatition (( economiics ldquodldquod riiver currenrdquo tt projjectt costts= $4-5watt)tt)$4 5 bull Cost of capital (perceived risks trending down-maturing market) bull Resourcefuel (free) bull OampM (OampM (miiniimall repaiir andd repllacement) t)
Project Revenues bull Project incentives
bull Tax credits (Investment Tax Credit (ITC) and accelerated cost recovery) bull State incentives (decreasing levels-market based varying term)
bull Sale of power bull Local electric rate key (higher rates support project economics) bull Intermittent system output (capacity factor key (11-19))
Innovation for Our Energy Future
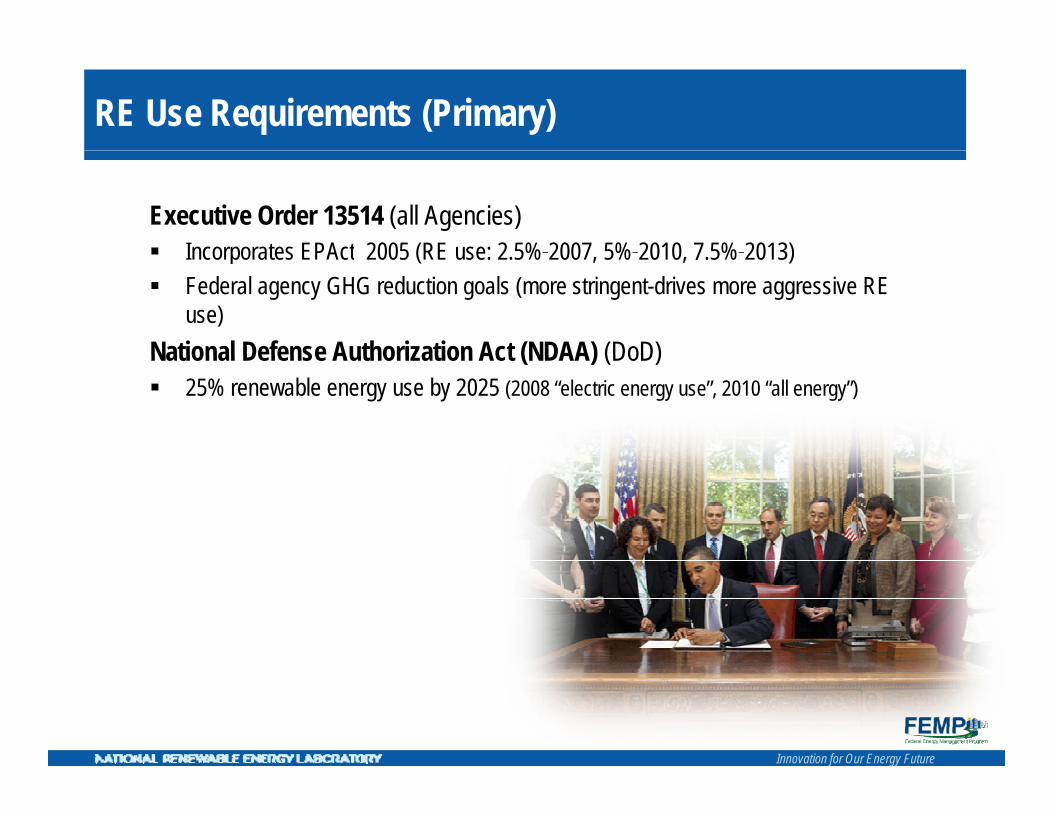

Innovation for Our Energy Future
States Offering RPS Incentives
State Policies Advance Renewable Energy Renewable Portfolio Standards
Source DSIRE database January 2010
Innovation for Our Energy Future
e t t S e State st So a 0 50
Innovation for Our Energy Future
BLM Fast Track RE Projects (102010) (ldquoSale of Powerrdquo Project Examples)j p )(
Developer Tessera Tessera Chevron Brightsource Nextlightg Tessera
Project Imperial Valley Imperial Valley Lucerne valley Ivanpah Silver State Calico
State CACA CA CA NV CA
Technology Dish Stirling Dish Stirling Thin film PV Power Tower First Solar PV Dish Stirling
BLM Acres 6 140 6140
516 4073 78408 8230
26799
MW 709709 45
380 50
663 1847
Stirling Energy Systems Stirling Energy Systems (SES) - Solar Two
BrightSource Energy
Innovation for Our Energy Future
rdquo
Innovation for Our Energy Future
PV Project Financing ConsiderationsUpdates
Project costs bull EEquiipmentt and id insttallllatition (( economiics ldquodldquod riiver currenrdquo tt projjectt costts= $4-5watt)tt)$4 5 bull Cost of capital (perceived risks trending down-maturing market) bull Resourcefuel (free) bull OampM (OampM (miiniimall repaiir andd repllacement) t)
Project Revenues bull Project incentives
bull Tax credits (Investment Tax Credit (ITC) and accelerated cost recovery) bull State incentives (decreasing levels-market based varying term)
bull Sale of power bull Local electric rate key (higher rates support project economics) bull Intermittent system output (capacity factor key (11-19))
Innovation for Our Energy Future
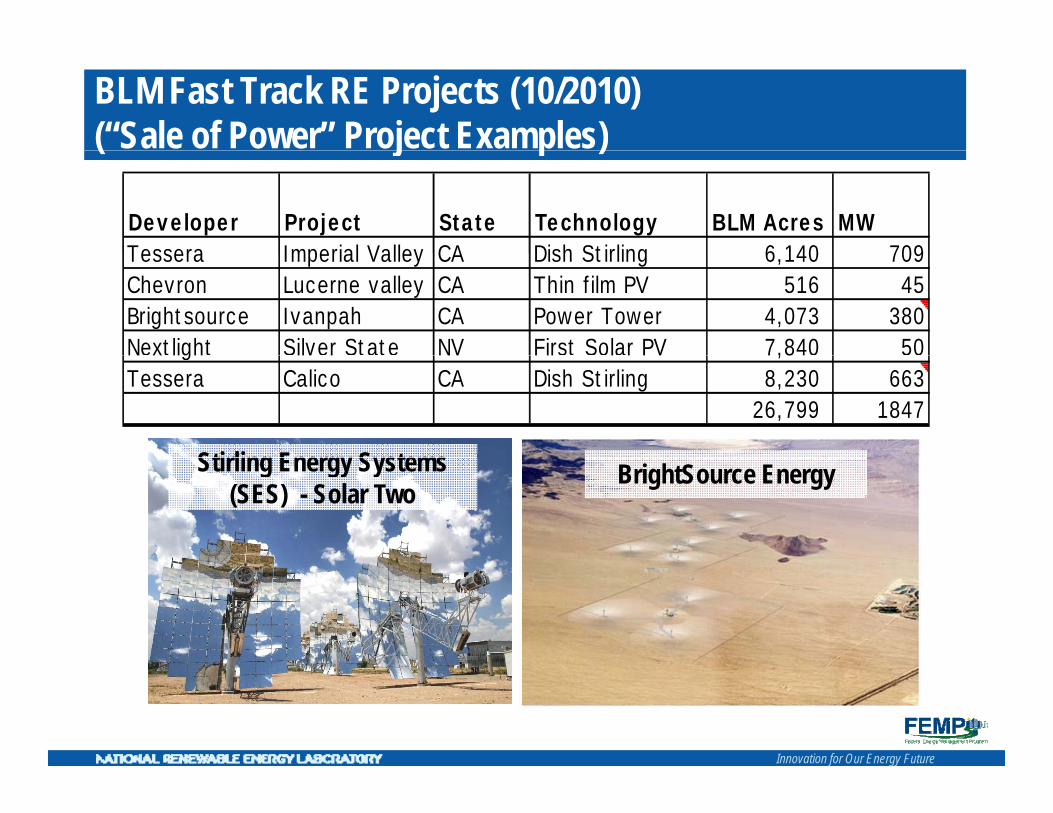


