
SD-90-07-F
SD Department of Transportation Office of Research
Field Performance of Abutment Tiebacks
Study SD90-07 Final Report
Prepared by South Dakota Department of Transportation

Office of Research 700 East Broadway Avenue Pierre, SD 57501-2586 December, 1996


DISCLAIMER The contents of this report reflect the views of the authors who are responsible for the facts and accuracy of the data presented herein. The contents do not necessarily reflect the official views or policies of the South Dakota Department of Transportation, the State Transportation Commission, or the Federal Highway Administration. This report does not constitute a standard, specification, or regulation.
ACKNOWLEDGEMENTS This work was performed under the supervision of the SD90-07 Technical Panel: Elmer Alksnitis ...................... Bridge DesignJon Becker....................... Office of Research
Vernon Bump.......... Materials and SurfacingDaris Ormesher ............... Office of Research


ii
TECHNICAL REPORT STANDARD TITLE PAGE 1. Report No. SD90-07-F
2. Government Accession No.
3. Recipient's Catalog No.
4. Title and Subtitle Field Performance of Abutment Tiebacks
5. Report Date December, 1996
6. Performing Organization Code
7. Author(s) Paul Orth and Sangchul Bang
8. Performing Organization Report No.
9. Performing Organization Name and Address South Dakota Department of Transportation Office of Research 700 East Broadway Avenue Pierre, SD 57501-2586 South Dakota School of Mines and Technology 501 East Saint Joseph Street Rapid City, SD 57701-3995
10. Work Unit No.
11. Contract or Grant No. 310199
12. Sponsoring Agency Name and Address South Dakota Department of Transportation Office of Research 700 East Broadway Avenue Pierre, SD 57501-2586
13. Type of Report and Period Covered Final; May. 1990 to May, 1996
14. Sponsoring Agency Code
15. Supplementary Notes 16. Abstract The South Dakota Department of Transportation has experienced problems with rotation of sill type bridge abutments resulting in abutment backwalls jamming against the ends of girders and bridge decks. A sill tieback system to prevent displacement and rotation of bridge abutments has been designed for use in new construction and abutment retrofitting. The tieback system consists of a series of drilled-in concrete anchors placed behind an abutment backwall. Sleeves are cast in the anchors and abutment backwall to allow threaded rods to be passed through and locked off at a predetermined tension. In an earlier project, software was developed defining tieback system design parameters using finite element analysis. This software, called BART, uses soil and foundation survey information and bridge design parameters as input. Because the design parameters produced by the software are theoretical, there was a desire to verify its accuracy. This project was initiated to monitor actual loads and movements on newly constructed sill tieback systems for comparison of predictions from the design program. The research results indicated that for the structures tested, adequate correlation could be seen. In addition, there was interest in developing a simple method for monitoring tension in each tie rod as an integrity test of sill tieback systems. A method was established whereby measuring the torque of the lock-off nut with a torque wrench, the load can be estimated by comparing the values obtained with a torque/load chart included in this report.

iii
17. Keyword bridge, abutment, tieback, sill
18. Distribution Statement No restrictions. This document is available to the public from the sponsoring agency.
19. Security Classification (of this report) Unclassified
Security Classification (of this page) Unclassified
21. No. of Pages 66
22. Price

iv
Table of Contents
Executive Summary1 Problem Description2 Objectives4 Task Description4
Task 1: Select Sites4 Task 2: Instrument Tendons5 Task 3: Instrument Anchors9 Task 4: Measure Abutment Movements9 Task 5: Determine Torque / Tension Correlation14 Task 6: Report Progress14 Task 7: Collect and Report Data14
Conclusions and Recommendations24 APPENDIX 26
A-Instrumentation Information and Specifications27 B-Bridge Test Data34 C-Load Versus Torque Chart43 D-BART Input/Output Data for Analysis of the Sioux Falls Bridge44

v
List of Figures Figure 1 Typical Sill Tieback Design3 Figure 2 Plastic Sheathing Removed6 Figure 3 Surface Prepared for Gage6 Figure 4 Gage Placed and Ready for Spot-Welding7 Figure 5 Spot-Welding Gage In Place7 Figure 6 Gage Cover Installed and Corrosion Inhibitor Replaced8 Figure 7 Protective Cover Installed8 Figure 8 Plastic Fitting Cast In Backwall Allowing Instrument Cable Access10 Figure 9 Completed Instrumentation and Cable Protection Prior to Back fill10 Figure 10 Load Testing Tieback With Jack and Load Cell11 Figure 11 Applied vs Measured Tie Rod Load12 Figure 12 Displacement Conversion Diagram17 Figure 13 Tieback Axial Stress Comparison20

vi
List of Tables Table 1 Sioux City Load Test Data12 Table 2 Sioux Falls Load Test Data13 Table 3 Sioux Falls Bridge Tieback Displacements and Stress Comparison18 Table 4 Sioux Falls Bridge Abutment Lateral Deformation Comparison21 Table 5 Sioux City Bridge Abutment Comparison23


0
Executive Summary The South Dakota Department of Transportation (SDDOT) has experienced problems with rotation of sill type bridge abutments resulting in abutment backwalls jamming against the ends of bridges. A sill tieback system to prevent displacement and rotation of bridge end abutments has been designed for use in new construction and abutment retrofitting. The tieback system consists of a series of drilled shaft concrete anchors placed behind an abutment backwall. Sleeves are cast in the anchors and abutment backwall to allow threaded rod to be passed through and locked off at a predetermined tension (see figure 1 on next page). SDDOT sponsored Dr. Sangchul Bang of the South Dakota School of Mines and Technology (SDSM&T) to develop software defining tieback systems design parameters using finite element analysis. This software, called BART (Bridge Abutment Reinforcement with Tie Rods), uses soils and foundations survey information and bridge design parameters as input. Because the design parameters produced by the software are theoretical, a field testing program was undertaken to verify its accuracy. This research project monitored actual loads and movements on two newly constructed sill type abutment bridges for comparison with predictions from the design program. These data were analyzed and tested for correlation with the BART data and a recommendation was made to continue the use of BART as a sill tieback design tool with a minor modification. In addition, there was interest in developing a simple method for monitoring tension in each tie rod as an integrity test of sill tieback systems. A method using a measurement of torque to estimate tension was proposed.

1
Problem Description The South Dakota Department of Transportation (SDDOT) has experienced problems with rotation of sill type bridge abutments resulting in abutment backwalls jamming against the ends of girders and bridge decks. A sill tieback system to prevent displacement and rotation of bridge end abutments has been designed for use in new construction and abutment retrofitting. The tieback system consists of a series of drilled shaft concrete anchors placed behind an abutment backwall. Sleeves are cast in the anchors and abutment backwall allowing threaded rod to be passed through and locked off at a predetermined tension. SDDOT sponsored Dr. Sangchul Bang of the South Dakota School of Mines and Technology (SDSM&T) for development of software using finite element analysis to design tieback systems for sill type abutments. This software, called BART (Bridge Abutment Reinforcement with Tie Rods), uses soils engineering properties and bridge design parameters as input. Because the design parameters produced by the software are theoretical and have not been field verified, this research project was initiated to monitor actual loads and movements on newly constructed bridges for comparison with predictions from the design program.

2

3
In addition, the SDDOT’s Geotechnical Activity expressed interest in developing a simple method for monitoring tension or load in each tie rod as an integrity test of sill tieback systems. One potential method may be to measure the torque on the tie rod nut and correlate it to actual load. An objective of this project was to determine if such a method is possible.

4
Objectives The primary objective of this research project was to determine whether the actual forces and movements in a tied back sill type abutment designed using BART correlate with the theoretical forces and movements. To do this, key points on the structure were instrumented and monitored during the initial load testing of the sill tieback system and periodically thereafter. Field data collected during the initial load testing was used primarily for verification of the installed instrumentation. These data along with periodic post construction measurements were submitted to Dr. Bang, who was contracted to compare them to the BART theoretical data and provide a report of the results. The secondary objective of this project was to identify a simple inexpensive method of measuring the post construction load on the tie rods of a sill tieback system. The tie rods or threaded bars (DYWIDAG, for example) are used in a typical sill tieback system, nutted at each end and locked off at a predetermined load. Theoretically, a measurement of the torque on the nut at the abutment wall should correlate with the actual tie rod load. It was understood that this might not be the best method for determining tension but might be adequate for this application. This project tested that theory.
Task Description The numbered tasks listed below were specified in the original problem statement developed by the project's technical panel. Below each task is an explanation of how the researcher addressed the task.
Task 1: Select Sites A minimum of three sites will be selected from the construction program for study. Testing will proceed on an “as available for construction basis.” In the time period allotted for the project, only two bridges were designed using the sill tieback system. Typically, steel girder bridges of up to 90 meters (300 feet) or concrete girder bridges up to 180 meters (600 feet) can be of the integral abutment type and do not require sill type

5
abutments. No additional bridges of sufficient length to require sill type abutments were scheduled during this research period so tests on only two bridges could be conducted. The first structure, number 61-164-405 (MRM 0.05), on Interstate 29 S over the Big Sioux River was scheduled for completion by the end of 1990. This was an excellent structure for evaluation with the exception of the 480 kilometer (300 mile) distance from the SDDOT Office of Research. Some of the desirable factors were no skew, soils engineering properties availability and a construction schedule convenient for instrumentation purposes. Also it was the only bridge with tied back abutments scheduled to be constructed for at least two years. The instrumentation was to be installed on the north end of the bridge as the south end is in Iowa. The second sill tieback type bridge to be monitored as part of this project was on Interstate 229 S south of Sioux Falls, structure number 50-188-239 (MRM 1.88). The instrumentation of this bridge took place in the summer of 1994. Some of the details of this bridge were 45 degree skew and short piling, approximately 8 meters (27 feet), resting on quartzite. It was determined that the critical forces and movements necessary to meet the objectives in this study were: · abutment wall translation · abutment wall tilt · drilled-in anchor tilt
· drilled-in anchor translation · tie rod tension · tie rod elongation
Translation seemed the most difficult to monitor. Because the anchors would be buried and no additional post construction measurements could be taken, it was decided that anchor tilt would suffice. Measuring translation at the abutment wall was also a problem. Although it was a simple matter to monitor it during the initial load testing, it was not possible to establish a reference point from which to measure post construction movements with the sub millimeter accuracy necessary. It was decided that tilt would suffice there also.
Task 2: Instrument Tendons Instrument all tendons of one structure per site location for force analysis.

To measure tension in the tie rods, strain gages were used. Vibrating wire strain gages were chosen because of their ability to monitor static strain levels over long periods of time. Additional information for these gages can be found in Appendix A. Two gages were attached on each of the six tie rods. By placing the gages on opposite sides of a tie rod (top and bottom), both elongation (the average of top and bottom strains) and bending (the difference between top and bottom strains) can be computed. An added benefit of this method is the ability to estimate fill settlement. To protect against corrosion, the tie rods are encased in a plastic pipe filled with grease. To gain access to the rods, it was necessary to remove a small section of plastic pipe. After cleaning the tie rod, a flat, smooth surface was made by grinding lightly. The gages were spot welded in place and grease was replaced to insure protection. A rigid watertight cover was installed over the exposed area to protect it during back-filling and compaction. Figures 2
through 7 illustrate the strain gage
installation procedure.
6

7

8

9
Task 3: Instrument Anchors Instrument drilled shaft anchors to measure displacement at same location. A practical method for measuring actual anchor displacement could not be identified. However, tilt could be measured and was determined to be adequate. The tilt measurement instrumentation is described under Task 4.
Task 4: Measure Abutment Movements Measure abutment movements by tilt analysis or by direct displacement method. The researcher chose inclinometers to measure rotation (tilt) of the anchors and abutment. Since the primary concern was tilt in a plane parallel to centerline, single axis inclinometers were selected. A total of eight were used on the first structure, one on each end of the north abutment and on each of the six drilled-in anchors. Because the inclinometers would be cast in concrete and unrecoverable, cost was a factor in the selection of a device. The Lucas Schaevitz company provided the answer with the Accustar Clinometer at a cost of approximately $115 each. The clinometer has a range of plus or minus 45 degrees and a resolution of one thousandth of a degree. Additional information can be found in Appendix A. The tilt angle can be determined by reading the clinometer output with a high accuracy voltmeter and applying a scaling factor, eliminating the need to purchase additional signal conditioning equipment. Because the inclinometers were to be cast into the concrete, they had to be protected from moisture and physical damage during the pour. To accomplish this, they were individually mounted in plastic electrical enclosures cast full of epoxy. The enclosures were bolted to the inside of the plywood forms prior to concrete placement. When the forms were removed, the electrical leads from the clinometer were accessible. The leads from the strain gages and inclinometers were routed through 25 mm (one inch), schedule 80 PVC pipe. The pipes were assembled to form three runs which extended through the abutment.

10

A fitting with a removable cap was cast in place on the abutment face to gain access to the three wire runs (Figures 8 and 9). The instrumentation of the first bridge (Sioux City) was completed and tested on August 2, 1990. The load testing and tensioning of the tie rods took place on August 9, 1990. The intention was to monitor all sensors during each step of the tensioning procedure. Because of the lack of quality voltmeters, it was impossible to continuously measure north end abutment tilt during the load testing. Lateral translation was measured at each end of the abutment with dial indicators mounted on tripods. However, movement was so slight that it was difficult to determine whether actual movement or thermal expansion was measured. During construction, the sill tieback system undergoes a load testing procedure. Creep of theanchors and elongation of the tie rods were measured to verify compliance as defined in the plans. This was accomplished using a jack and load cell (Figure 10) to place and maintain predetermined loads on each tie rod. These loads were maintained for an established time period while measuring the extension of the tie rod end (creep) at the abutment wall.
The measurements taken during this process confirmed that the instrumentation was working well as can be seen in the chart in Figure 11. The chart was created from the data table for tie rod number one (Table 1). Actual tie rod load in pounds was computed as the average change in strain multiplied by the modulus of elasticity of steel and the cross sectional area of the tie rod:
inches 1.56_ psi 1029__ 2
)+( = Load 2621 εε ΔΔ
11
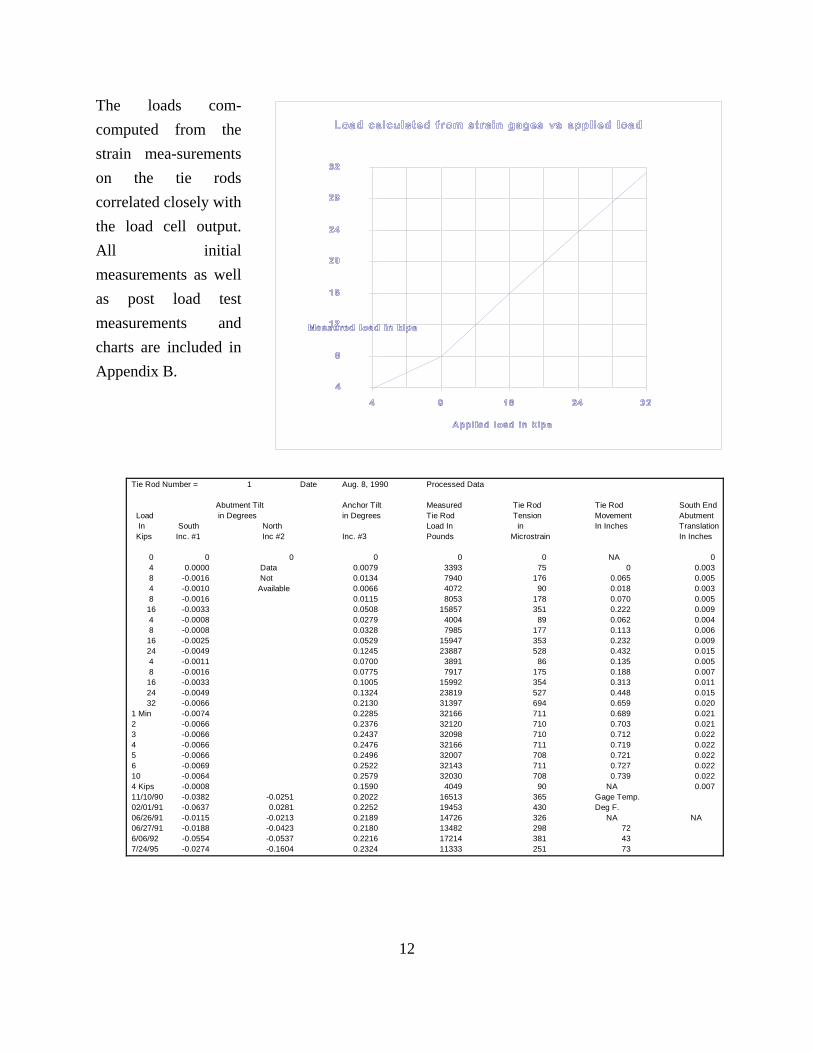
The loads com- computed from the strain mea-surements on the tie rods correlated closely with the load cell output. All initial measurements as well as post load test measurements and charts are included in Appendix B.
Tie Rod Number = 1 Date Aug. 8, 1990 Processed Data
Abutment Tilt Anchor Tilt Measured Tie Rod Tie Rod South End Load in Degrees in Degrees Tie Rod Tension Movement Abutment In South North Load In in In Inches Translation Kips Inc. #1 Inc #2 Inc. #3 Pounds Microstrain In Inches
0 0 0 0 0 0 NA4 0.0000 Data 0.0079 3393 75 0 0.0038 -0.0016 Not 0.0134 7940 176 0.065 0.0054 -0.0010 Available 0.0066 4072 90 0.018 0.0038 -0.0016 0.0115 8053 178 0.070 0.005
16 -0.0033 0.0508 15857 351 0.222 0.0094 -0.0008 0.0279 4004 89 0.062 0.0048 -0.0008 0.0328 7985 177 0.113 0.006
16 -0.0025 0.0529 15947 353 0.232 0.00924 -0.0049 0.1245 23887 528 0.432 0.0154 -0.0011 0.0700 3891 86 0.135 0.0058 -0.0016 0.0775 7917 175 0.188 0.007
16 -0.0033 0.1005 15992 354 0.313 0.01124 -0.0049 0.1324 23819 527 0.448 0.01532 -0.0066 0.2130 31397 694 0.659 0.020
1 Min -0.0074 0.2285 32166 711 0.689 0.0212 -0.0066 0.2376 32120 710 0.703 0.0213 -0.0066 0.2437 32098 710 0.712 0.0224 -0.0066 0.2476 32166 711 0.719 0.0225 -0.0066 0.2496 32007 708 0.721 0.0226 -0.0069 0.2522 32143 711 0.727 0.02210 -0.0064 0.2579 32030 708 0.739 0.0224 Kips -0.0008 0.1590 4049 90 NA 0.00711/10/90 -0.0382 -0.0251 0.2022 16513 365 Gage Temp.02/01/91 -0.0637 0.0281 0.2252 19453 430 Deg F.06/26/91 -0.0115 -0.0213 0.2189 14726 326 NA NA06/27/91 -0.0188 -0.0423 0.2180 13482 298 726/06/92 -0.0554 -0.0537 0.2216 17214 381 437/24/95 -0.0274 -0.1604 0.2324 11333 251 73
0
12

Some design changes from the previous instrumentation methods were made for the second bridge (Sioux Falls). Since the data form all the tendons on the Sioux City bridge correlated it was determined that it was not necessary to instrument all tie rods and anchors. Instead, the two central tie rods and their anchors were instrumented along with one location on the abutment. Dr. Bang requested that instrumentation be placed to measure pile translation. Therefore, a slope inclinometer casing was placed next to piling and later cast through the concrete pile cap. Strain gages used were vibrating wire type identical to those on the first bridge. Alternative clinometers with lower long term drift were selected. These units, 900 series Applied Geomechanics clinometers were biaxial with a plus or minus 20 degree range. Additional information can be found in Appendix B. The clinometers were read with a high accuracy volt meter by applying the output voltage value to a polynomial calibration curve. They were mounted in a plastic enclosure and cast full of epoxy for protection. A sample of the data from tieback 3 can be seen in Table 2.
13
Although all clinometers tested fine before installation, they would not provide valid measurements after concrete was placed. The failure mode could not be determined.
Northern tierod #3November 17,1994
#22 Bot. #23 Top Calculated Tie Rod Tie Rod Applied Gage Out. Gage Out. load in Movement MovementLoad in in uStrain in uStrain pounds in inches in inches
KIPs (Ref. Zero) (Raw)0 1104 2113 04 973 2421 4004 0.000 0.1798 1067 2508 8098 0.037 0.2164 ? ? ? 0.015 0.1948 1070 2507 8143 0.042 0.221
16 1259 2686 16467 0.149 0.3284 1001 2439 5044 0.022 0.2018 1077 2507 8302 0.051 0.230
16 1259 2686 16467 0.152 0.33124 1449 2863 24769 0.267 0.4464 1001 2439 5044 0.031 0.2108 1084 2513 8596 0.057 0.236
16 1263 2686 16558 0.161 0.34024 1450 2861 24746 0.270 0.44932 1644 3031 32980 0.385 0.564
minute 1 1651 3033 33184 0.391 0.5702 1651 3033 33184 0.392 0.5713 1651 3033 33184 0.394 0.5734 1652 3031 33161 0.395 0.5745 1653 3031 33184 0.395 0.5746 1655 3029 33184 0.395 0.574
10 1656 3029 33206 0.397 0.576Kips 4 1001 2446 5203 0.038 0.21703/20/95 1077 2478 7646 0.038 0.21707/10/95 1111 2496 8822 0.038 0.217

14
Task 5: Determine Torque / Tension Correlation Determine if measurement of torque on tendon head nut with a torque wrench can be a method of monitoring post construction tendon tension. The threaded steel rods used in this sill tieback construction are DYWIDAG rods provided by DYWIDAG Systems International (DSI). DSI conducted torque/tension correlation testing in conjunction with Carleton Laboratory, Columbia University and the results were provided. A chart in Appendix C shows the torque/tension relationship for the type of tie rods used by SDDOT. The values in the chart for the lubricated condition should be applicable to our standard practice, enabling an estimate of the tie rod load by measuring torque of the lock-off nut with a torque wrench rated to 138 kilogram meters (1,000 foot pounds).
Task 6: Report Progress Following a measurement period of one year a report will be written that summarizes the progress. A preliminary comparison of field data vs BART generated data for the Sioux City bridge was provided by Dr. Bang in May of 1991. This information was forwarded to the technical panel and is included in this report under Task 7.
Task 7: Collect and Report Data The above procedure will be used on three structures as they are available for construction. A final report will be written summarizing the entire project. Anchor parameter data collection will continue throughout the entire project and the data will be summarized for future analysis if desired. As previously explained, only two bridges were designed with sill tiebacks during this project. These two bridges were instrumented to measure load, tilt and displacement. During initial load testing, these parameters were monitored and logged. Periodic measurements of load and tilt were made after construction and all data were forwarded to Dr Sangchul Bang of the South Dakota School of Mines and Technology. Dr. Bang was contracted to analyze the collected data

15
and compare it with the theoretical output of BART. Dr. Bang's report is presented here. INTRODUCTION
This report presents the results of a study that
compares the field instrumentation on bridge
abutments reinforced with tiebacks with those
calculated from the analytical finite element
solution method. The study was performed at the
South Dakota School of Mines and Technology,
Rapid City, South Dakota, from July 1, 1993 to
Dec. 31, 1995.
The comparisons include two bridge abutments: a
prestressed, skew girder bridge in Sioux Falls
and a non-skew girder bridge in Sioux City.
The former bridge abutments comparison
includes a brief description of the input and a
complete output of the analytical solution as
well as the comparison with the field
measurements. The latter includes comparison
of analytical predictions with five field
measurements taken over a period of
approximately five years.
The analytical predictions were made with the
finite element computer program, BART, which was
developed by Sangchul Bang of the South Dakota
School of Mines and Technology for the analysis
and design of a tieback system for reinforcing
distressed bridge abutments (Design and
Analysis of Reinforcing Distressed Bridge
Abutment and Analytical Parametric Study of a
Tied-back System for reinforcing Distressed
Bridge Abutments, reports to the South Dakota
Department of Transportation, by S. Bang, 1988

16
and 1990). This program utilizes the concept of
�generalized plane strain," with which certain
three dimensional structures can be analyzed
for three dimensional stresses, strains,
forces, moments, and displacements without
resorting to full three dimensional analysis.
SIOUX FALLS BRIDGE ABUTMENTS
The prestressed girder bridge over the Big
Sioux River, Sioux Falls, South Dakota
(structure number 50-188-239 on I-229), was
analyzed to compare stresses within the skew
tieback and lateral displacements of the
abutment determined analytically against
those observed in the field.
Information on the instrumented tiebacks,
i.e., the northern tieback #3 and the southern
tieback #4, were provided and stresses and
displacements were measured and calculated by
the South Dakota Department of Transportation.
In addition to the tiebacks, data on lateral
deformation from a slope inclinometer located
near these tiebacks were also available.
The computer program BART analyzed the
abutments based on the generalized plane
strain finite element approach in three
dimensions. Details of input parameters for the
program were determined from the bridge plans
and supporting documentation provided by the
South Dakota Department of Transportation. Pile
lengths beneath the abutments at the locations
in question were determined to be 9.1 and 11.3
meters (30 and 37 ft). for the southern and

17
northern abutments, respectively. Cross-
sections of the northern tieback #3 and the
southern tieback #4 differed very slightly
only in the thickness of the abutment base.
Therefore, the cross section of the northern
tieback #3 was used in the analysis.
Attached in this report as Appendix D are the
input and output of the program BART for the
analysis of the northern tieback #3. The output
shows the details of the geometric and material
properties used in the analysis. The back fill
material behind the abutment, Sioux Quartzite,
has internal friction angle of 47 degrees. The
foundation soil beneath the abutment, silty to
clayey sand (SM to SC based on the Unified Soil
Classification System), was classified to have
a relative density of 95 % of the Standard
AASHTO compaction method. This soil has
cohesion of 400 psf and internal friction angle
of 33 degrees.
Measurements were taken by Paul Orth, research
engineer of the South Dakota Department of
Transportation. Since the locations where the
measurements were made did not exactly
coincide with the nodal point coordinates where
the analytical solutions were obtained,
calculated results were linearly interpolated
between the nearest nodes.

Results of the comparisons are included in
Tables 3 and 4, and Figure 13. As can be seen
from Table 3, measured movements of the
tiebacks range from 0.965 mm (0.038 in) for the
northern tieback #3 to 3.53 mm (0.139 in) for the
southern tieback #4. The calculated
displacements of the tieback are 5.79 mm
(0.228 in) and 1.35 mm (0.053 in) along the
directions of x and z coordinates,
respectively. The cross-section of the
abutment lies on a plane defined by the x and z
coordinates, with the x coordinate being
perpendicular to the abutment. The axial
directional displacement of the tieback can
18

therefore be obtained from the vector analysis
of the x and z directional displacements with
the known bridge skew angle of 45 degrees. It
shows the tieback axial displacement of 5.05 mm
(0.199 in). Please refer to Figure 12 for the
details of this conversion of displacements.
This calculated axial displacement of the
tiebacks compares reasonably well with the
field measurement of the southern tieback #4,
which recorded a movement of 3.53 mm (0.139 in).
However, this comparison is inconclusive in
view of the fact that the field measurements
did not include the movement of the tiebacks
for the initial 1814 kg (4 kips) of axial load
application during the proof test. The true
field tieback axial displacement therefore
must be greater than 3.53 mm (0.139 in), but the
exact magnitude is impossible to determine.
If a direct extrapolation is used among 0, 1814,
3628 kg (0, 4 and 8 kips) of axial load, the
corrected axial displacement of the tiebacks
would be 4.32 and 1.91 mm (0.170 and 0.075 in)
for the southern tieback #4 and the northern
tieback #3, respectively.
Sioux Falls Bridge Tiebacks Displacements and Stresses Comparison
19

DISPLACEMENTS Measured: 0.038 inches for northern tieback #3
0.139 inches for southern tieback #4 Calculated: 0.199 inches (node 13) STRESSES Measured:
Northern tieback #3, at 11 ft. from the abutment.
5,203 psi on 11/17/94 7,646 psi on 3/20/95 8,822 psi on 7/10/95
Southern tieback #4, at 3 ft. from the abutment.
4,795 psi on 11/17/94 7,012 psi on 3/20/95 3,099 psi on 7/10/95
Calculated:
0.85 ft. from abutment (middle of element 80) = 0 psi
6.54 ft. from abutment (middle of element 81) = 15,015 psi
17.06 ft. from abutment (middle of element 82) = 11,949 psi
28.43 ft. from abutment (middle of element 83) = 1,269 psi
Average = 8,660 psi
Table 3 also shows the values of measured and
calculated axial stresses within the
tiebacks. It is noted that the program BART
calculates the axial forces (axial stresses
can be obtained by dividing the axial force by
the cross-sectional area of the tie rod)
assuming that a full contact is maintained
between the tiebacks and the surrounding soil
all the time. The actual tiebacks used (#11
DYWIDAG bars) were encapsulated with corrosion
inhibitor between the rod and the plastic
sleeve, which allowed a uniform distribution
20

21
of the axial stress. The Sioux Falls Bridge
Tiebacks Displacements and Stresses Comparison
calculated axial stresses were therefore
converted into a uniform axial stress by the
weighted average method, i.e., the sum of the
product of calculated axial stress and the
element length was divided by the total length
of the tieback. This shows the average axial
stress of 59,711 kPa (8,660 psi) developing over
the entire length of the tieback.
Figure 13 shows the comparison of the calculated
average tieback axial stress with the measured
axial stresses at three different occasions.
As can be seen, the measurements of both
tiebacks made on March 20, 1995, agree very well
with the prediction. The measurement of the
northern tieback #3 on July 10, 1995 agrees
extremely well with the calculated value.
However, the measurement of the southern
tieback #4 on the same day indicates a drop of
nearly 27,580 kPa (4,000 psi) over a period of
four months. This sudden drop in the tieback
axial stress is totally unexpected. Typical
long-term soil behaviors such as settlement and
creep usually increase the tieback axial
stress with time. Possible explanations for
such a sudden drop in tieback axial stress
include; (1) excessive tilt of the deadman
anchor due to insufficient back fill
compaction, (2) structural degradation or
loosening of the tieback connection with the
abutment, and (3) instrumentation error,
failure, or malfunction.

0
1000
2000
3000
4000
5000
6000
7000
8000
9000
10000
0 5 10 15 20 25 30Distance from Abutment (ft)
Tie-
Bac
k St
ress
(psi
)
Southern Tie-Back #4
Northern Tie-Back #3
Calculated
(3/20/95)
(11/17/94)
(7/10/95)
(7/10/95)
(3/20/95)
(11/17/94)
22
Table 4 shows a comparison between the
calculated and measured lateral deformations
along the slope inclinometer located beneath
the northern abutment. The first three columns
of the table show the node numbers and their
coordinates used in the finite element
analysis. The fourth column indicates the
corresponding inclinometer vertical
coordinates of the nodes. The fifth column
shows the calculated lateral deformations at
the nodes directly from the finite element
analysis. Since the inclinometer location does
not coincide with any specific node, linear
interpolations have been made with the lateral
deformations of two adjacent finite element
nodes between which the inclinometer is
located. The interpolated lateral
deformations are listed in column six. These
were adjusted once again to indicate only the

23
relative lateral deformations to the
inclinometer tip in column seven. Finally, the
measured lateral deformations from the
inclinometer are shown in column eight.
The comparison shows that the magnitudes of the
measured and calculated lateral deformations
are within the same order of magnitude.
However, the calculated values indicate that
the mode of lateral deformation is outward
bulging near the middle of the slope
inclinometer, whereas the measured values
indicate an increasing mode of lateral
deformation toward the abutment.

Finite Element
24
SIOUX CITY BRIDGE ABUTMENT
The non-skew bridge over the Big Sioux River
located in Sioux City (structure number 46-164-
405 on I-29) was analyzed and compared with the
field measurements taken over a period of
Calculated
Correc
ted for
Measured
Coordinate System
Inclin.
Lateral
Interpolated latera
l Deformation
zero
bottom
later
al
Node
X
Coord
Y
Coord
Y
Coord
Deformation from FEM
@ x=-3'
deformation
deformation
(ft)
(ft)
(ft)
(ft) (in)
(in)
(in)
29
-
4.000
0.000
-
4.000
0.0570
0.684
0.121
0.20
30
-1.500
0.000
-
4.000
0.0570
41
-
3.833
-
9.124
-
13.124
0.0742
0.904
0.341
0.13
42 0.021
-
9.124
-
13.124
0.0794
53
-3.66
7
-
18.248
-
22.248
0.0633
0.772
0.209
0.08
0.0713
54 1.541
-18.248
-22.248
Interpot
-.0
-8.0
0.563 0.000 0.00

25
approximately five years. An initial
comparison was made with the field measurements
and reported to the South Dakota Department of
Transportation in a letter on May 15, 1991.
Subsequent field measurements were later added
in the comparison and reported to the South
Dakota Department of Transportation in a letter
dated Dec. 19, 1995.
Table 5 summarizes the comparisons between the
analytical calculation and five field
measurements made by the South Dakota Department
of Transportation to date. The table indicates
that the calculated and measured tieback axial
forces agree very well. On the other hand,
rotations of the abutment and the deadman do not
agree as well. However, the magnitudes of
rotations are so small that both the measured
and calculated rotations fall practically
within the range of allowable error limits. The
accuracy of the clinometer used in field
measurement was 0.001 degrees (0.0000175
radians), but the error could be as high as 0.05
degrees (0.00087 radians) for measurements
taken after a long period of time.

Tieback
Axial Force at 2 ft. from Abutment (lbs)
Rotation of Abutment at 3 ft. 9 in. from Top (rad)
Rotation of Deadman at 3 ft. 9 in. from Top (rad)
Field Measurement
13,572 0.000666 0.00273
(Nov. 1, 1990) Field Measurement
14,503 0.001112 0.00292
(Feb. 1, 1991) Field Measurement
13,546 0.00027 0.0034
(June 27, 1991) Field Measurement
14,273 0.000918 0.0030
(March, 1992) Field Measurement
10,281 0.000272 0.0038
(July 1995) Analysis #1
12,662 0.006659
KCODE=2, back fill KCODE=11, soi
0.001533
26

27
Conclusions and
Recommendations
The results of comparisons presented in this
report indicate that in general there exist
reasonable agreements between the BART
calculated and field measured performance of
the sill tieback bridge abutment
reinforcement system, considering the
uncertainties involved in field measurements
and instrumentation accuracy. Therefore, it is
recommended that the Office of Bridge Design
continue the use of BART as design tool.
However, due to the limited number of
measurements, it is difficult to draw any
overall quantitative conclusion with regard to
the effectiveness of the program BART.
It is recommended that if any future
performance studies are conducted on the sill
tieback bridge abutment reinforcement system,
they should include additional
instrumentation to measure the following:
lateral earth pressures acting on the abutment
and deadman anchors, surface settlements, out-
of-plane deformations of the abutment (if
skewed), bending moments within the abutment
and base, and abutment tilts. The program BART
is fully capable of analyzing three
dimensional responses of the tieback bridge
abutment reinforcement system. In addition, if
slope inclinometers are to be used as part of
the instrumentation, the inclinometer casings
need to be embedded completely within the
abutment backwall so that continuous lateral

28
deformations from the tip of the inclinometer to
the top of the abutment can be measured.
During the course of this project, it was
determined that the BART program assumes that
friction will occur between the tie rod and the
surrounding soil. This may introduce small
errors in the design output because the
department uses tie rods encased in sleeves
filled with grease for corrosion resistance
thus eliminating any soil friction. It is
recommended that the BART program be modified
to accommodate this free slip between the tie
rods and soil. Additional effort involved in
this program modification may be significant.
Although it does not provide a high degree of
accuracy (± 8 %), it is recommended that the
method of estimating tie rod load by
correlating measured tie rod nut torque with
the torque/load chart in Appendix C is adequate
for the purpose of testing sill tieback tie rod
tension and should be used as such..

29
APPENDIX

30

31
A-Instrumentation Information and
Specifications

32

33

34

35

36

37
B-Bridge Test Data

38

39

40

41

42

43

44

45

46
C-Load Versus Torque Chart

47

48
D-BART Input/Output Data for Analysis
of the Sioux Falls Bridge

49
INPUT
11.480000
5.730000
2.500000E-01
6.500000E+02
30.000000
45.000000
11.310000
90000.000000
1.500000
2.500000000
2
30
12.000000000
1.167000000
48.250000000
650.000000000
9
.800000000
.120000000
1
6.000000
2.000000
1.000000E+01
2.800000
5.500000E+01
1.730000000
6.000000000
6.000000000
37.000000000
37.000000000
0
1.500000
1.500000
Y
6.800000E+03
Y
Y
0
0
0
2
12.400000
210.000000
71.700000
2.900000E+07
11.310000
Y
5.000000E-01
1.500000
2.900000E+07
3.630000
Y

50
Y
Y
Y

51
OUTPUT
INPUT DATA FILE NAME =N3IN3
OUTPUT DATA FILE NAME =N3OUT3
**INPUT DATA AS FOLLOWS**
HEIGHT OF ABUTMENT WALL = 11.480 FT
DEPTH TO Tie rod = 5.730 FT
BACKFILL SLOPE (V/H) = .250
SURCHARGE LOADING = 650.000 PSF
WALL FRICTION ANGLE = 30.000 DEG
BRIDGE SKEW ANGLE = 45.000 DEG
Tie rod SPACING = 11.310 FT
ALLOWABLE STRESS OF Tie rod = .900E+05 PSI
BACKFILL SOIL PROPERTIES
UNIT WEIGHT = 103.500 PCF
FRICTION ANGLE = 47.000 DEG
FOUNDATION SOIL PROPERTIES
UNIT WEIGHT = 130.000 PCF
COHESION = 400.000 PSF
FRICTION ANGLE = 33.000 DEG
UNDRAINED SHEAR STRENGTH = 743.402 PSF AT .0 FT
CONCRETE ANCHOR DIAMETER = 2.500 FT
FACTOR OF SAFETY = 1.500
**OUTPUT DATA AS FOLLOWS**
MINIMUM DIAMETER OF Tie rod = 1.062 IN
MINIMUM REQUIRED DIMENSIONS ARE
LENGTH OF Tie rod = 43.891 FT
LENGTH OF CONCRETE ANCHOR = 12.000 FT
******* FINAL DESIGN SELECTION *******
Tie rod TENSION = 79721.180 LBS PER TIE
Tie rod DIAMETER = 1.167 IN
TIE ROD LENGTH = 48.250 FT
CONCRETE ANCHOR LENGTH = 12.000 FT
CONCRETE ANCHOR DIAMETER = 2.500 FT

52
**GENERALIZED PLANE STRAIN FINITE ELEMENT ANALYSIS**
RELAXATION = .80
MAXIMUM ERROR FOR ITERATION = .12
MAXIMUM NO. OF ITERATION = 9
**SOLUTION HAS TWO INCREMENTS
IN INCR 1 ONLY FOUNDATION SOIL STRESSES ARE CALCULATED
GEOMETRIC PARAMETERS
WIDTH OF ABUTMENT BASE = 6.000 FT
DISTANCE FROM ABUTMENT TO GIRDER SUPPORT= 2.000 FT
HORIZ EXTENSION OF BERM IN FRONT OF ABUT= 10.000 FT
SLOPE OF SOIL BEYOND BERM (H/V) = 2.800
HORIZ EXTENSION OF SLOPE BEYOND BERM = 55.000 FT
DEPTH TO TOP OF DRILLED-IN ANCHOR = 1.730 FT
FRONT ROW PILE BATTER (V/H) = 6.000
REAR ROW PILE BATTER (V/H) = 6.000
LENGTH OF FRONT ROW PILES = 37.000 FT
LENGTH OF REAR ROW PILES = 37.000 FT
**POINT BEARING PILES**
DIST FROM FRONT OF BASE TO FRONT PILES = 1.500 FT
DIST FROM REAR OF BASE TO REAR PILES = 1.500 FT
NODAL POINT DATA
NODAL POINT COORDINATES BOUNDARY CONDITION CODES GLOBAL
EQUATION NUMBER
**IN INCREMENT 2**
NODE X(N) Y(N) D-X D-Y D-Z TH-X TH-Y TH-Z D-X D-Y D-Z
TH-X TH-Y TH-Z
1 .000 11.480 0 0 0 0 0 0 1 2 3 4 5 6
2 1.706 11.480 0 0 0 1 1 1 7 8 9 0 0 0
3 11.373 11.480 0 0 0 1 1 1 10 11 12 0 0 0
4 22.745 11.480 0 0 0 1 1 1 13 14 15 0 0
0
5 34.118 11.480 0 0 0 0 0 0 16 17 18 19 20
21
6 51.177 11.480 1 1 1 1 1 1 0 0 0 0 0 0
7 .000 8.615 0 0 0 0 0 0 22 23 24 25 26
27
8 1.706 8.615 0 0 0 1 1 1 28 29 30 0 0

53
0
9 11.373 8.615 0 0 0 1 1 1 31 32 33 0 0 0
10 22.745 8.615 0 0 0 1 1 1 34 35 36 0 0
0
11 34.118 9.750 0 0 0 0 0 0 37 38 39 40 41
42
12 51.177 8.615 1 1 1 1 1 1 0 0 0 0 0 0
13 .000 5.750 0 0 0 0 0 0 43 44 45 46
47 48
14 1.706 5.750 0 0 0 0 0 0 49 50 51 52 53
54
15 11.373 5.750 0 0 0 0 0 0 55 56 57 58 59
60
16 22.745 5.750 0 0 0 0 0 0 61 62 63 64
65 66
17 34.118 5.750 0 0 0 0 0 0 67 68 69 70 71
72
18 51.177 5.750 1 1 1 1 1 1 0 0 0 0 0 0
19 .000 2.875 0 0 0 0 0 0 73 74 75 76
77 78
20 1.706 2.875 0 0 0 1 1 1 79 80 81 0 0
0
21 11.373 2.875 0 0 0 1 1 1 82 83 84 0 0
0
22 22.745 2.875 0 0 0 1 1 1 85 86 87 0 0
0
23 34.118 2.875 0 0 0 0 0 0 88 89 90 91 92
93
24 51.177 2.875 1 1 1 1 1 1 0 0 0 0 0 0
25 -16.000 .000 0 0 0 1 1 1 94 95 96 0 0
0
26 -11.000 .000 0 0 0 1 1 1 97 98 99 0 0
0
27 -6.000 .000 0 0 0 0 0 0 100 101 102 103 104
105
28 -4.500 .000 0 0 0 0 0 0 106 107 108 109 110
111
29 -4.000 .000 0 0 0 0 0 0 112 113 114 115 116
117
30 -1.500 .000 0 0 0 0 0 0 118 119 120 121 122
123
31 .000 .000 0 0 0 0 0 0 124 125 126 127 128
129
32 1.706 .000 0 0 0 1 1 1 130 131 132 0 0 0
33 11.373 .000 0 0 0 1 1 1 133 134 135 0 0 0
34 22.745 .000 0 0 0 1 1 1 136 137 138 0 0
0
35 34.118 .000 0 0 0 0 0 0 139 140 141 142 143
144
36 51.177 .000 1 1 1 1 1 1 0 0 0 0 0 0
37 -32.000 -5.714 0 0 0 1 1 1 145 146 147 0
0 0
38 -23.340 -6.851 0 0 0 1 1 1 148 149 150 0 0
0
39 -14.680 -7.988 0 0 0 1 1 1 151 152 153 0 0

54
0
40 -6.021 -9.124 0 0 0 0 0 0 154 155 156 157
158 159
41 -3.833 -9.124 0 0 0 1 1 1 160 161 162 0 0
0
42 .021 -9.124 0 0 0 0 0 0 163 164 165 166
167 168
43 2.480 -9.124 0 0 0 1 1 1 169 170 171 0 0
0
44 5.112 -9.124 0 0 0 1 1 1 172 173 174 0 0
0
45 14.377 -9.124 0 0 0 1 1 1 175 176 177 0
0 0
46 25.064 -9.124 0 0 0 1 1 1 178 179 180 0 0
0
47 34.118 -.520 0 0 0 0 0 0 181 182 183 184 185
186
48 51.177 -9.124 1 1 1 1 1 1 0 0 0 0 0
0
49 -48.000 -11.429 0 0 0 1 1 1 187 188 189 0 0
0
50 -34.514 -13.702 0 0 0 1 1 1 190 191 192 0 0
0
51 -21.028 -15.975 0 0 0 1 1 1 193 194 195 0 0
0
52 -7.541 -18.248 0 0 0 0 0 0 196 197 198 199
200 201
53 -3.667 -18.248 0 0 0 1 1 1 202 203 204 0
0 0
54 1.541 -18.248 0 0 0 0 0 0 205 206 207 208
209 210
55 4.961 -18.248 0 0 0 1 1 1 211 212 213 0 0
0
56 8.518 -18.248 0 0 0 1 1 1 214 215 216 0 0
0
57 17.382 -18.248 0 0 0 1 1 1 217 218 219 0 0
0
58 27.383 -18.248 0 0 0 1 1 1 220 221 222 0
0 0
59 37.385 -13.946 0 0 0 1 1 1 223 224 225 0
0 0
60 51.177 -18.248 1 1 1 1 1 1 0 0 0 0 0 0
61 -64.000 -17.143 1 1 1 1 1 1 0 0 0 0 0
0
62 -45.687 -20.553 0 0 0 1 1 1 226 227 228 0
0 0
63 -27.375 -23.963 0 0 0 1 1 1 229 230 231 0
0 0
64 -9.062 -27.372 0 0 0 0 0 0 232 233 234
235 236 237
65 -3.500 -27.372 0 0 0 1 1 1 238 239 240 0
0 0
66 3.062 -27.372 0 0 0 0 0 0 241 242 243
244 245 246
67 7.441 -27.372 0 0 0 1 1 1 247 248 249 0
55
0 0
68 11.924 -27.372 0 0 0 1 1 1 250 251 252 0
0 0
69 20.387 -27.372 0 0 0 1 1 1 253 254 255 0
0 0
70 29.702 -27.372 0 0 0 1 1 1 256 257 258 0
0 0
71 39.018 -27.372 0 0 0 1 1 1 259 260 261 0
0 0
72 51.177 -27.372 1 1 1 1 1 1 0 0 0 0 0
0
73 -64.000 -35.944 1 1 1 1 1 1 0 0 0 0 0
0
74 -46.194 -36.128 0 0 0 1 1 1 262 263 264 0
0 0
75 -28.389 -36.312 0 0 0 1 1 1 265 266 267 0
0 0
76 -10.583 -36.497 1 1 1 1 1 1 0 0 0 0 0
0
77 -3.000 -36.497 0 0 0 1 1 1 268 269 270 0
0 0
78 4.583 -36.497 1 1 1 1 1 1 0 0 0 0 0
0
79 11.162 -36.497 0 0 0 1 1 1 271 272 273 0
0 0
80 17.033 -36.497 0 0 0 1 1 1 274 275 276 0
0 0
81 24.894 -36.497 0 0 0 1 1 1 277 278 279 0
0 0
82 33.181 -36.497 0 0 0 1 1 1 280 281 282 0 0
0
83 41.468 -36.497 0 0 0 1 1 1 283 284 285 0
0 0
84 51.177 -36.497 1 1 1 1 1 1 0 0 0 0 0
0
85 -64.000 -54.745 1 1 1 1 1 1 0 0 0 0 0
0
86 -47.208 -54.745 1 1 1 1 1 1 0 0 0 0 0
0
87 -30.416 -54.745 1 1 1 1 1 1 0 0 0 0 0
0
88 -13.624 -54.745 1 1 1 1 1 1 0 0 0 0 0
0
89 -3.000 -54.745 1 1 1 1 1 1 0 0 0 0 0
0
90 7.624 -54.745 1 1 1 1 1 1 0 0 0 0 0
0
91 14.883 -54.745 1 1 1 1 1 1 0 0 0 0 0
0
92 22.142 -54.745 1 1 1 1 1 1 0 0 0 0 0
0
93 29.400 -54.745 1 1 1 1 1 1 0 0 0 0 0
0
94 36.659 -54.745 1 1 1 1 1 1 0 0 0 0 0
0

56
95 43.918 -54.745 1 1 1 1 1 1 0 0 0 0 0
0
96 51.177 -54.745 1 1 1 1 1 1 0 0 0 0 0
0
**TOTAL NUMBER OF EQUATIONS = 285 IN INCR= 2
NODAL POINT LOAD TO BE INCLUDED IN INCREMENT 2
NODE PN(X) PN(Y) PN(Z) M(X)
M(Y) M(Z)
29 .00000E+00 -.68000E+04 .00000E+00
.00000E+00 .00000E+00 .00000E+00
MATERIAL NUMBERS AS FOLLOWS
1 = BACKFILL SOIL
2,3= FOUNDATION SOIL
4 = FRONT ROW PILES
5 = REAR ROW PILES
6 = ABUTMENT STEM
7 = TIE ROD
8 = DRILLED-IN CONCRETE ANCHOR
9 = ABUTMENT BASE
MATERIAL PROPERTIES
MAT. K KUR N RF C PHI DPHI KB M PA FX
FY
1 525.00 1050.00 .95 .76 .00 47.00 12.00 150.00 .20
2116.80 .0000 -103.5000
2 200.00 400.00 .60 .70 400.00 33.00 .00 100.00 .50
2116.80 .0000 -130.0000
3 200.00 400.00 .60 .70 400.00 33.00 .00 100.00 .50
2116.80 .0000 -130.0000
FRONT ROW PILE PROPERTIES
GENERAL SHAPE PILE
NO OF PILES PER GROUP = 2
CROSS SECTIONAL AREA = 12.400 IN**2
MAJOR AXIS MOMENT OF INERTIA= 210.000 IN**4
MINOR AXIS MOMENT OF INERTIA= 71.700 IN**4
PILE MATERIAL MODULUS = .290E+08 PSI
PILE GROUP SPACING = 11.310 FT
MAT. AE GJ1 EI2 EI3 E POIS FX FY
4 .64E+08 .40E+07 .75E+07 .26E+07 .42E+10 .25 .0000 .0000
5 .32E+08 .20E+07 .37E+07 .13E+07 .42E+10 .25 .0000 .0000

57
ABUTMENT STEM THICKNESS = 1.500 FT
6 .86E+09 .94E+08 .16E+09 .72E+08 .58E+09 .25 .0000 .0000
TIE-ROD MATERIAL MODULUS = .290E+08 PSI
7 .27E+07 .13E-04 .16E-04 .16E-04 .42E+10 .25 .0000 .0000
8 .25E+09 .78E+08 .98E+08 .98E+08 .58E+09 .25 .0000 .0000
ABUTMENT BASE THICKNESS = 3.630 FT
9 .21E+10 .99E+09 .23E+10 .17E+09 .58E+09 .25 .0000 .0000
ELEMENT DATA
IN INCR=1 ONLY ELEMENT 1 THRU 55 ARE CONSIDERED
ELEM NODE1 NODE2 NODE3 NODE4 REINF MAT ANGLE TX TY
1 85 86 74 73 0 3 .00 .00 .00
2 86 87 75 74 0 3 .00 .00 .00
3 87 88 76 75 0 3 .00 .00 .00
4 88 89 77 76 0 3 .00 .00 .00
5 89 90 78 77 0 3 .00 .00 .00
6 90 91 79 78 0 3 .00 .00 .00
7 91 92 80 79 0 3 .00 .00 .00
8 92 93 81 80 0 3 .00 .00 .00
9 93 94 82 81 0 3 .00 .00 .00
10 94 95 83 82 0 3 .00 .00 .00
11 95 96 84 83 0 3 .00 .00 .00
12 73 74 62 61 0 3 .00 .00 .00
13 74 75 63 62 0 3 .00 .00 .00
14 75 76 64 63 0 3 .00 .00 .00
15 76 77 65 64 0 3 .00 .00 .00
16 77 78 66 65 0 3 .00 .00 .00
17 78 79 67 66 0 3 .00 .00 .00
18 79 80 68 67 0 3 .00 .00 .00
19 80 81 69 68 0 3 .00 .00 .00
20 81 82 70 69 0 3 .00 .00 .00
21 82 83 71 70 0 3 .00 .00 .00
22 83 84 72 71 0 3 .00 .00 .00
23 61 62 50 49 0 2 .00 .00 .00
24 62 63 51 50 0 2 .00 .00 .00
25 63 64 52 51 0 2 .00 .00 .00

58


