

No: 500-95-0040
FINAL REPORT
MOVING TO MEDICAID MANAGED CARE:
LESSONS FROM STATE EXPERIENCES UNDER THE SECTION 1115 WAIVER AUTHORITY
September 2004
Authors Teresa A. Coughlin
Sharon K. Long
Based on reports prepared by:
Urban Institute Teresa A. Coughlin, Sharon K. Long, Alicia Berkowitz, Susan Goldenson,
Stephanie J. Kendall, Jessica Kasten, Jennifer King, Amy Westphal Lutzky, Jill A. Marstellar, Barbara Ormond, Shruti Rajan, Suresh Rangarajan, Alshadye
Yemane and Stephen Zuckerman
Research Triangle Institute Janet B. Mitchell, William J. Bartosch, Anupa Bir, Gregory Todd French, Barbara
Gage, Boyd Gilman, Jeremy Green, Susan G. Haber, Sonja Hoover, Caren Kramer, Elizabeth D. Kulas and Carol Urato
Mathematica Policy Research
Anne B. Ciemnecki, Karen CyBulski and Nancy Clusen
Editor Felicity Skidmore
Submitted to: Submitted by: Office of Research and Demonstrations The Urban Institute Centers for Medicare & Medicaid Services 2100 M Street, N.W. 7500 Security Boulevard, C-3018-26 Washington, D.C. 20037 Baltimore, Maryland 21244-18509 Project Officer: Project Director: Paul Boben Teresa A. Coughlin
EXECUTIVE SUMMARY
This final report from the Evaluation of Medicaid Health Reform Demonstrations, sponsored by the Centers for Medicare and Medicaid Services (CMS), synthesizes the findings from a major body of research on the experiences of four states that applied for federal Section 1115 waiver authority to move their Medicaid programs towards managed care and other related studies. The four states included as project sites were Kentucky, Minnesota, New York, and Vermont. A fifth project site was Los Angeles County, for which the State of California was granted an 1115 Medicaid waiver under special circumstances. The work was conducted by The Urban Institute, and its subcontractors-- Research Triangle Institute (RTI) and Mathematica Policy Research (MPR).
Medicaid Managed Care Goals for the Project Sites Section 1115 of the Social Security Act allows the Secretary of the U.S. Department of Health and Human Services (DHHS) to waive specified requirements of Medicaid law to carry out demonstration projects that are “likely to help in promoting the objectives” of the program. The Medicaid waiver plans of the four states whose experiences are included in this report illustrate the types of changes envisioned by states as they think about moving their Medicaid programs towards managed care:
• Kentucky. Kentucky’s Health Care Partnership Program was designed to create eight partnerships (one per geographic region in the state) of public and private providers to deliver Medicaid acute care services through managed care arrangements to Temporary Assistance for Needy Families (TANF) and poverty-related eligible women and children, Supplemental Security Income (SSI) beneficiaries and medically needy enrollees.
• Minnesota. The Prepaid Medical Assistance Program Plus (PMAP+) built on an existing
1115 waiver program by extending mandatory managed care from 8 counties largely located in the Twin Cities metropolitan area to all 87 counties in the state. The PMAP+ waiver also included an eligibility expansion where the state was able to collect Medicaid federal financial participation for TANF and poverty-related beneficiaries in families with incomes at or below 275 percent of the federal poverty line. Under PMAP+, TANF and poverty-related populations were mandatorily enrolled in capitated managed care plans; the disabled were generally excluded.
• New York. The New York State Partnership Plan was designed to move most TANF,
poverty-related and SSI beneficiaries in the state into managed care plans. New York also planned to develop special needs plans or SNPs for persons with serious mental illness and for persons with HIV/AIDS. New York’s initial waiver also called for expanding coverage to the state’s general assistance population. The expansion was later broaden to include enrollees in Family Health Plus, a state sponsored health insurance program for low-income families.
i

• Vermont. The Vermont Health Access Plan (VHAP) was designed to move most TANF, poverty-related and SSI beneficiaries into managed care, expand Medicaid eligibility to low-income adult residents of the state, and implement a prescription drug benefit for low-income elderly and disabled residents.
In addition to these four state waivers, the Medicaid managed care evaluation project included a waiver granted specifically for Los Angeles County. The Los Angeles County (LAC) 1115 waiver provided a federal financial relief package in addition to waiver authority. In return for the federal funds, LAC agreed to fundamentally restructure its delivery of care to the indigent by increasing access to county-funded ambulatory care services and reducing the number of inpatient beds in county hospitals.
Beneficiary Experiences Under Medicaid Before Managed Care A key component of the project reviewed the experiences of Medicaid beneficiaries before the introduction of managed care (i.e., under fee-for-service Medicaid) to help inform states about potential beneficiary access and care quality problems that might be ameliorated by managed care, and provide a benchmark against which any changes produced by Medicaid managed care could be measured.
TANF and Poverty-Related Beneficiaries. Our information on the Medicaid experiences of TANF and poverty-related beneficiaries under fee-for-service comes from a representative telephone survey of Minnesota beneficiaries living in rural counties served by fee-for-service Medicaid in 1998. TANF beneficiaries in rural Minnesota were not badly off under fee-for-service Medicaid. Conspicuous is the fact that almost all of them reported having a usual source of care other than the emergency room and a doctor visit over the past year. In several areas, however, considerable proportions of the Medicaid population gave answers that suggest where Medicaid beneficiaries might be better served through a move to managed care. Unmet need appears to be the area where the greatest improvements for the TANF and poverty-related populations might be achieved by managed care. More than half of adult beneficiaries and one-quarter of children reported some type of unmet need in the last 12 months. Further, about one-quarter of the adults and one-quarter of the children visited an emergency room in the last 12 months.
Disabled Non-Elderly Beneficiaries. Given their typically low health and functional status, persons with disabilities are heavy users of health care and thus are costly to serve. Managed care strategies could potentially realize major savings by increasing the cost-effectiveness of care for this group. However, the extent and range of their needs must be carefully calibrated if managed care is to succeed. Project data on disabled beneficiary experiences under fee-for-service Medicaid for urban and suburban SSI beneficiaries come from beneficiary surveys in two sites in New York State and for rural SSI beneficiaries from surveys in two regions in Kentucky. For both urban and rural SSI beneficiaries, findings indicate that the vast majority had a usual source of care and had seen a physician in the past 12 months. Nearly half of both adults and children had at least one ER visit in the past year, however. Respondents also reported
ii
considerably longer travel and wait times in the office before being seen than did the TANF and poverty-related beneficiaries. Finally, despite being frequent users of health care services and having a usual source of care, 40 percent of urban and 25 percent of rural adult SSI beneficiaries reported an unmet need in the past year. On all these measures, managed care could bring potential improvements. Lessons Learned. For TANF and related populations, our findings indicate that Medicaid fee-for-service is generally doing an adequate job of linking beneficiaries to the health care system at least in rural Minnesota. The major areas where an effective managed care system might achieve cost-effective improvements appear to be; reducing ER use for non-immediate needs, particularly for adults, reducing travel times to care and wait times in office before being seen, and reducing unmet need for doctor and dental care. The situation is more complex for disabled beneficiaries. This is a highly vulnerable and costly population about which relatively little is known, particularly in a managed care context. Project data collected but not shown here indicate a wide diversity in the types of health conditions among this population of both adults and children, from physical afflictions such as muscular dystrophy, cerebral palsy, and AIDS to mental health conditions including mental retardation, schizophrenia, and paranoia. States need to have solid information on the needs of this population if they are to develop sound managed care systems, particularly in the area of capitation rates. Our data show that managed care has the potential to benefit this population, if based on a clear understanding of the issues to be confronted—with urban beneficiaries in New York currently having less satisfactory experiences under fee-for-service Medicaid than Kentucky rural beneficiaries. This difference may be due, at least in part, to Kentucky beneficiaries who are in poorer health. Thus, the fact that they receive more care may be because they need more care. It remains true, however, that Kentuckians report less unmet need and more satisfaction with their care than do their New York counterparts. The main areas states should focus on in their efforts to improve care for Medicaid beneficiaries with disabilities--adults and children, urban and rural--appear to be improving ease of access (travel time and office wait times), reducing unnecessary ER use, and reducing unmet need, particularly for adults in the areas of medical/physician and dental care. Program Implementation and Operational Experiences under Medicaid Managed Care The experiences of project states can potentially help other states as they think about how best to maximize their chances of successful managed care implementation. We begin with Minnesota, which was ultimately successful in bringing capitation to the state’s Medicaid program. We then discuss the experiences of New York, Kentucky, and Vermont, none of which was able to sustain mandatory capitation on a statewide basis during the project period. Minnesota’s PMAP+. Project site visits were made to Minnesota in September 1996, May 1998, and October 2000. The new waiver program was to begin program phase-in by geographic area in early 1996, and extend coverage to the whole state by 1997. By the end of
iii
1996, however, PMAP+ had added only 8 more counties to the original 8 under managed care as the state faced significant resistance from a range of powerful stakeholders. Counties, the most prominent critics, had two major concerns. The first was that managed care would result in a cost shift to them, reducing needed care to some and forcing counties to provide services that Medicaid was no longer covering entirely at county expense. The second was resentment at the imposition of a single program model on all counties when local authorities felt they knew what worked best for their communities. Providers echoed these concerns, and some consumer groups also feared the effects of “rationing” care. Stakeholders went to the state legislature during the1995-1996 session, which introduced two changes to ameliorate their concerns. The first was introduction of a county role in plan selection and in the capitation implementation timetable. The second was the granting of authority to design county-based purchasing (CBP) models as an alternative to PMAP+. CBP—which was facilitated by provisions of the 1997 Balanced Budget Act—granted counties the option of running their own Medicaid demonstration projects with advance payment from the state, as long as they accepted full risk and met state and federal requirements. As of 2003, the state had successfully implemented PMAP+ in 70 of its 87 counties, with the remaining counties having implemented CBP (or being in the process of doing so). New York’s Partnership Plan. Project site visits were made in 1998 and 1999. As of April 1999, New York had made substantial progress in implementing the Partnership Plan, with all major urban areas in the upstate area having started mandatory managed care for their TANF/safety net population. However, emplementation in New York City and implementation for other beneficiary groups upstate had moved more slowly than planned. No mandatory enrollment of the SSI populations had taken place, and the state had made only limited progress in moving forward with the SNPs. What were the major barriers slowing progress toward capitation in the early phases of New York’s waiver? Four were cited by site visit respondents. The first, similar to the situation in Minnesota, was resistance by local government. Second, the strong state economy at the time, along with declining Medicaid enrollment, reduced the fiscal imperative for managed care. Third, New York City hospitals gave the program only lukewarm support because they viewed the capitation rates as too low for viability. Finally, a strained relationship between the state and the Health Care Financing Administration (now CMS) in the beginning phases of waiver implementation was also viewed as impediment. Despite these challenges, as of January 2003, the Partnership Plan had been implemented in 21 of the state’s 57 counties and all parts of New York City. But only TANF and poverty-related populations had mandatory enrollment. The Kentucky Health Care Partnership Program. Project site visits took place in May 1999 and October 2000. When the waiver was approved, most of the state’s urban beneficiaries were already in a primary care case management program (PCCM), which paid physicians a monthly case management fee but reimbursed all services on a fee-for-service basis. The intent was to build on this system by introducing capitated managed care statewide and extend
iv

managed care to the SSI population, by dividing the state into 8 regions—each with its own services delivery network (Partnership). At the time of the first site visit, Partnerships had been implemented in the two most urban regions of the state—surrounding the cities of Louisville (Region 3) and Lexington (Region 5). Their partnerships had begun enrolling TANF and poverty-related eligibles in late 1997 and the SSI population in spring 1998. By October 2000, however, none of the other regions had formed partnerships and Region 5 had decided to dissolve its partnership. General reasons for failure included the fact that creating a monopoly plan in each region reduced the state’s leverage in subsequent rate negotiations. In addition, many of the regions were so sparsely populated that they had difficulty generating the necessary capital to initiate a partnership agreement with the state. A comparative analysis of Region 3 and Region 5—both regions with adequate catchment areas—suggests further that Region 3’s success was due to (a) designing a payment plan that was less onerous to providers in its risk-bearing provisions than Region 5’s turned out to be, (b) making extensive public relations and administrative services efforts to accommodate provider concerns, and (c) having a long history of providers working together on indigent care. The Vermont Health Access Plan (VHAP). Project site visits took place in October 1997 and November 1999. The state began the waiver process in August 1995 with a solicitation for Medicaid capitated managed care plan proposals. Because of delayed response, however, in early 1996 Vermont began providing limited benefits on a fee-for-service basis to uninsured Vermonters below the poverty line (the “expansion” population). The state was able to execute contracts with two plans later that year, which began enrolling both traditional and expansion populations around the end of the year. Mandatory enrollment in capitated managed care began in March 1997 and was completed in all areas of the state except one by May. Though fully implemented, Vermont’s capitated system of Medicaid managed care proved unsustainable in Vermont, however, and within a couple years the state transitioned to a Primary Care Case Management managed care program for its enrollees. Several factors contributed to the demise of Vermont’s effort to establish a capitated managed care program, including having trouble maintaining health plan participation and having a health system with few inefficiencies even before capitation.
Lessons Learned. All four project states—Minnesota, Kentucky, New York, and Vermont—have substantial rural areas. The common problems faced by all four in their efforts to introduce Medicaid capitation applied in large part to their efforts in the rural parts of their states. Beyond the challenges of implementing managed care in rural areas, the states faced other obstacles as well. These can be encapsulated in the following considerations for states contemplating Medicaid managed care, particularly capitation:
• Ensure that the area has a sufficient number of covered lives • Be prepared to allow some flexibility for provider networks • Be realistic in assessing potential cost-savings • Set feasible capitation rates • Allow for local differences and local input.
v
Effects of Medicaid Managed Care on Beneficiaries Project analyses examined effects on beneficiary access to, and satisfaction with care for three groups: the rural TANF and poverty-related populations, rural low-income populations more generally, and SSI beneficiaries (beneficiaries with disabilities). Rural TANF and TANF- Related Beneficiaries. The effects of Medicaid capitated managed care on rural TANF and poverty-related beneficiaries were analyzed by comparing their experiences with the experiences of similar beneficiaries in counties under Medicaid fee for service. The analysis is based on data from beneficiary surveys fielded in 1998 and 2000. Our findings show that the introduction of PMAP+ had virtually no significant impact on beneficiaries’ access to and quality of care. The one notable exception is that parents in Medicaid families were significantly less likely to find it easy to obtain prescription drugs for their children in managed care than in fee for service counties. There was no increase in unmet need for drugs among children, however, implying that children under managed care were able to get the drugs they needed, even if obtaining them was more difficult. State Medicaid staff maintained that program costs were lower under managed care than they would have expected under fee for service. Even though the state has no hard data to support this finding, it is consistent with national findings from other studies. Thus, the major achievement of Medicaid managed care in rural Minnesota may have been to maintain the same level of care as under fee for service but at lower cost. Rural Health Care Experiences under Medicaid. The findings in this section are based primarily on the 1997, 1999, and 2002 waves of the National Survey of America’s Families, covering adults ages 19 to 64. For the population as a whole, it is well known that rural residents fare worse than their urban counterparts in securing access to care. For Medicaid beneficiaries, however, project analyses find rural-urban differences to be much smaller than they are for either low-income privately insured individuals or those who are uninsured. When population and health care market characteristics are held constant, rural-urban differences among Medicaid beneficiaries totally disappear. The analysis shows, further, that Medicaid managed care holds additional promise for rural beneficiaries. Rural beneficiaries in counties with Medicaid managed care were more likely to have a usual source of care and to have had a doctor visit in the past year and less likely to have an emergency room visit than rural beneficiaries under fee-for-service Medicaid. Urban and Rural Disabled Beneficiaries. In the search for Medicaid cost saving, disabled beneficiaries are particularly prominent, given that they account for about 15 percent of the beneficiary population but more than 40 percent of program expenditures nationally. Our findings on Medicaid managed care impacts for SSI beneficiaries are based on five years of the National Health Interview Survey. Urban SSI beneficiaries, regardless of type of Medicaid managed care, were significantly less likely than those under fee for service to report any contact with health care providers in the past year, and also less likely to report having had an office visit in the past year. Further,
vi

beneficiaries in urban counties with mandatory Medicaid HMO coverage were significantly less likely to have had a specialist visit in the past 12 months than urban beneficiaries under weaker forms of managed care or under fee for service. Although the reduction in specialist visits may reflect great efficiency, it is more likely to reflect increased access problems—suggesting that decision-makers and consumers are right to be cautious in extending managed care to this population in urban areas. SSI beneficiaries in rural areas, in contrast, fared considerably better under managed care than their fee-for-service counterparts. They were more likely to have a usual source of care other than an ER. They were also more likely to have had contact with physician extenders such as nurse practitioners and a dental visit within the past year.
Lessons Learned. The Minnesota experience reported here applies to Medicaid managed care for TANF and TANF-related adults and children living in rural areas. Findings suggest that for this population, managed care may not have much effect on improving access to care or care delivery patterns compared with Medicaid fee-for-service. Medicaid officials in that state maintained, however, that their managed care system did increase the cost-effectiveness of the care delivered to its rural beneficiaries. In addition, our national look at rural health care experiences under Medicaid revealed a somewhat different picture on the potential for managed care in rural areas. With a national perspective we find that Medicaid managed care improved access to ambulatory care providers and reduced emergency room use.
Our national examination of access to care and satisfaction in urban compared with rural areas yields the encouraging finding that Medicaid managed care does have some potential for improving health care delivery, particularly for primary care services, for rural Medicaid beneficiaries with disabilities (i.e., the SSI population). This finding does not carry over to urban areas, however, suggesting that states should be cautious about extending managed care coverage to disabled Medicaid beneficiaries in urban areas. Access to care for this population is typically problematic under fee-for-service. And characteristics of the urban SSI population and/or the health care system in low-income metropolitan areas may make it harder for managed care to make improvements than in more sparsely populated rural areas. More research is needed to better understand the implications of Medicaid managed care and the factors behind the differences found in the research reported here. Commercial Plan Choices in a Changing Medicaid Market If states are to keep commercial plans in the Medicaid managed care market, it is important for them to understand the factors that influence such plans’ decisions to continue in or exit that market. Project findings are based on analysis of two years of InterStudy data on county Medicaid enrollment levels. Comparing data for 2000 with data from 2001 allows us to identify plans that were participating in one year but not in the next. Plan characteristics are strong predictors of plan decisions, other things equal. Plan with a large share of the local Medicaid managed care market, for example, and plans serving large proportions of Medicaid enrollees in the state are less likely to quit the Medicaid market. Plans affiliated with Blue Cross/Blue Shield, provider-sponsored plans, and for-profit plans are also
vii
less likely to leave the Medicaid market. Medicaid policies also have a major influence on plan decisions. Higher capitation rates reduce the likelihood that a plan will exit Medicaid. Mandatory enrollment in managed care increases the likelihood of exiting Medicaid. Finally, a strong managed care presence in the private market seems to help plans continue participating in Medicaid managed care.
Lessons Learned. Our analysis of factors influencing health plan decisions about whether or not to participate in the Medicaid program suggests that many of these factors are within the control of state policymakers and program administrators. The first lesson is that states need to establish sound capitation rates that reflect the true costs of serving the Medicaid population enrolled in managed care, as well as to ensure that service carve-outs and similar policies are not interfering with the ability of plans to manage care in a cost-effective way. The other major lesson is that states should work to ensure that plans can enroll an adequate number of Medicaid enrollees to operate effectively. Reconfiguring the Safety Net: The Experience of Los Angeles County Los Angeles Country has the largest county population in the nation. One-third of its non-elderly population lacks health insurance, and another fifth is covered by California’s Medicaid program (Medi-Cal). By 1995, years of shrinking revenue streams, health service demand increases, and the cost of maintaining the county’s deteriorating health system infrastructure had culminated in a funding crisis for the county. In response, it applied for and was granted a five-year financial relief package in federal Medicaid funding, in return for which it agreed to fundamentally restructure its delivery of health care to the indigent. The project’s analysis of LA county’s experiences under its waiver are based on two case-study site visits, one in 1997, the second in 2001. The primary goal of the waiver was the restructuring ambulatory care via two major components: a public-private partnership (PPP) program, which extended county-funded indigent care provision to the private sector, and better integration of the system of care. The PPPs were universally considered one of the big successes of the waiver program, resulting in 81 private partners delivering primary care at over 100 sites. The major contribution of the integration effort was creation of a system of referral centers, whereas previously all access to specialty care for the indigent had come through the ER. In addition, plans were made to increase the efficiency of hospital-based care was to be increased by reducing inpatient beds and admissions (by downsizing the county’s major medical center and privatizing two hospitals) and by hospital “reengineering.” While the medical center was effectively downsized, the effort to privatize two hospitals failed due to a lack of potential buyers and community opposition. With respect to the reengineering efforts, considerable savings were achieved from purchasing improvements, although, auditors were not confident that even these savings could be sustained in the future.
Lessons Learned. The major lesson to be learned from the waiver experience of Los Angeles County is that substantial financial relief and a serious restructuring effort may not be enough to restore financial viability to a public safety-net health care system on the brink of
viii

collapse. Waiver efforts did succeed in expanding geographic access to non-hospital indigent care; cutting the number of inpatient beds, inpatient days, and average length of stay; and implementing a hospital reengineering system that produced some savings through better purchasing of supplied, equipment, and prescription drugs. Observers also agreed that the culture of indigent care provision had improved, bringing more attention to patient care quality and communication among providers throughout the system. But the large number of uninsured in the county has not been reduced and the obligation to meet their health care needs remains. A new waiver is providing $900 million in federal funding over the 2001-2005 period, which is scheduled to phase out over that period. The state is providing an additional $300 million in combined state and federal matching funds through cost-based reimbursements to all county clinics and private clinics with country contracts for Medi-Cal ambulatory care. Further, the county has committed $400 million. Whether or not actions under the new waiver will stimulate enough additional financing and operational reforms in the LACDHS system to make it financially stable remains an open question. But if past is prologue, it is hard to be optimistic. Pharmacy Assistance Programs and Determinants of Enrollment and Impacts of Enrollment on Use and Costs of Drugs and Medical Services Vermont offers three pharmacy benefit programs to low-income elderly and disabled residents—VHAP Pharmacy, VScript and VScript Expanded. Only expenditures under VHAP Pharmacy and VScript are eligible for the federal match under Vermont’s VHAP Section 1115 waiver program. Script Expanded is supported entirely by state appropriations. Using a combination of medical and pharmacy claims and a survey of enrolled and eligible or near-eligible beneficiaries for Vermont’s pharmacy assistance programs, project analyses focused on three questions: to identify the primary determinants of enrollment; to assess the impact of enrollment on the use and cost of drugs, and unmet needs; and to analyze the impact of enrollment on the use and cost of non-drug medical services. Our findings show the pharmacy assistance programs enrolled a substantial minority (16 percent) of Vermont’s Medicare beneficiaries. Further, the programs are enrolling the most vulnerable individuals. For example, compared to people who are eligible for, but not enrolled, enrollees are more likely to be older, have less education, have lower income, live alone, and be sicker. We also found that people with drug coverage have 85 percent lower odds of enrolling compared to people without coverage. Similar to other public health program, lack of awareness is a barrier to enrolling people, although 43 percent of eligible nonenrollees were familiar with the program. Analyses also suggest that the pharmacy assistance programs appear to have lowered the rate at which beneficiaries spend down to full Medicaid benefits. The proportion of dually eligible beneficiaries fell from nearly one-quarter in 1994 to less than 20 percent in 2000. The proportion of newly enrolled dual eligibles was reduced by half, from 2.9 percent to 1.4 percent. Once in a pharmacy assistance programs, enrollees were twice as likely to have more than 20 prescriptions filled per year than nonenrollees. Further, 65 percent of enrollees had more than 20 prescriptions filled within the year. Enrollees were 82 percent less likely than nonenrollees to have out of pocket costs of 200+/month. This effect varied across the three programs in a way
ix

that is consistent with the enrollee cost sharing and benefit rules. Finally, enrollees were 48 percent less likely than nonenrollees to have skipped drugs or taken fewer than prescribed, and 62 percent less likely to not fill a prescription because of cost. We found that enrollment in a pharmacy assistance program was associated with a 17 percent reduction in annual expenditures for inpatient services and a 19 percent increase in annual expenditures for professional services. Enrollment in VScript and VScript Expanded was associated with a 35 percent increase in annual expenditures for professional services. Enrollees in VScript Expanded also exhibited a 25 percent increase in outpatient facility costs.
Lessons Learned. Our analysis of Vermont’s pharmacy assistance programs has important implications, especially for the recently enacted new drug benefit under Medicare. First, state pharmacy assistance programs and, ultimately, Part D, play an extremely important role in providing outpatient prescription drug coverage to one of the most vulnerable and least insured groups of Medicare beneficiaries. Subsidies provided under Part D to the non-dually eligible low-income population will be crucial for building on the achievements made by states and ensuring continued access to outpatient prescription drugs among the near-poor.
Participants in publicly subsidized drug programs also tend to be those with the greatest needs. However, late enrollment penalties imposed under Part D should help limit the deleterious impact of adverse selection on future plan costs. Finally, while the new Medicare drug benefit may help reduce the number of unnecessary hospitalizations and lower inpatient expenditures, Part D may conversely lead to higher outpatient and Part B expenditures. The potential for savings is likely to be greatest among beneficiaries with chronic conditions where outpatient prescription medication is particularly effective for avoiding illness and preventing unnecessary medical service use. It may, thus, be useful to consider condition- and drug-specific factors when Part D and Medicare Advantage plans develop their drug formularies and cost sharing rules. Suggestions for Future Research The Evaluation of Medicaid Health Reform Demonstrations addressed a number of issues related to state 1115 waiver initiatives, providing new information on a range of issues. As with any research project, the findings from those research efforts raise new questions. Areas that would benefit from additional work include:
• Exploring the impacts of Medicaid managed care for TANF and poverty-related
populations in states beyond Minnesota. In particular, what is the impact of MMC for populations in rural areas in states without a strong health care system and a generous Medicaid program (for which Minnesota is known)?
• Examining if there is a qualitative difference in beneficiaries’ satisfaction or a
quantitative difference in access to acute and preventative care for enrollees in regular PMAP and those enrolled in CBP.
x
• Expanding the analysis of the impacts of MMC on disabled populations. How do the effects of MMC on disabled beneficiaries vary in different states (with different MMC programs) and for different populations of disabled persons? What is driving differences in the effects of MMC for this population in urban and rural areas?
• Baseline studies of access and use for beneficiaries with disabilities under fee-for-service
Medicaid. Much of the policy concern has focused on how Medicaid managed care may affect these beneficiaries, but little is known about how these beneficiaries are faring under the current fee-for-service delivery system.
• Expanding the analysis of commercial plan participation in Medicaid managed care to
consider quality of care and plan entry. How does the quality of care provided by commercial plans compare to that of Medicaid-dominated plans? How can states attract additional commercial plans into county MMC markets?
• Expanding the analysis of the impacts of new safety net funding to look at the effects on
beneficiaries as well as providers in Los Angeles County. Expanding the analysis of the health care safety net to other urban markets that have received substantial safety net funding as part of 1115 waivers (e.g., New York City).
• Exploring the impact of Part D implementation on the design of state pharmacy
assistance programs, who enrolls, and the costs of these programs. Do states eliminate their pharmacy assistance programs and, if so, why? Do states that continue offering such programs change the benefit to wrap-around Part D or do they continue to offer independent programs? Does enrollment in state programs decline following implementation of Part D? How do total and per enrollee program costs change following the implementation of Part D?
• Understanding the impact of Part D on low-income individuals previously eligible for
state coverage. What is rate of enrollment in Part D among low-income populations previously eligible for state coverage? Do out-of-pocket costs change following implementation of Part D for people previously eligible for coverage through a state program? Do patterns of utilization change? Do individuals change drugs (either within a therapeutic class or between brand-name and generic) after they enroll in Part D? Are there changes in access to prescription drugs and unmet need for low-income individuals who enroll in Part D plans?
• Investigating the impact of Medicare Part D on Medicaid spend-down, on prescription
drug needs and out-of-pocket spending, and on use and cost of prescription medications and non-drug medical costs.
Finally, the findings from the Evaluation of Medicaid Health Reform Demonstrations highlights the challenges states and communities face in transforming their health care systems, whether that transformation involves switching from fee-for-service to Medicaid managed care or, as in the case of Los Angeles County, trying to reconfiguring a complex urban health care safety net system. In-depth case studies of program change are needed whenever states make system
xi

changes, both to document what has been changed and to understand the process of change. Information on the challenges and successes that are faced by states as they implement change is critical to policymakers and program administrators in other states as they contemplate reforms to their Medicaid program or health care safety net.
xii

TABLE OF CONTENTS Page
CHAPTER I .................................................................................................................................... 1
INTRODUCTION ....................................................................................................................... 1 Medicaid Managed Care Goals for the Project Sites .............................................................. 2 Project Findings in Brief......................................................................................................... 6 Rest of the Report ................................................................................................................... 7
CHAPTER II................................................................................................................................... 8
BENEFICIARY EXPERIENCES ............................................................................................... 8 UNDER MEDICAID BEFORE MANAGED CARE ................................................................. 8
Beneficiaries on Medicaid via Temporary Assistance for Needy Families (TANF) and Poverty-Related Expansions ................................................................................................... 9 Disabled Non-Elderly Beneficiaries on Supplemental Security Income.............................. 11
Urban Beneficiaries with Disabilities ............................................................................... 13 Rural Beneficiaries with Disabilities ................................................................................ 15
Cross-State Differences for Beneficiaries with Disabilities ................................................. 17 Conclusions and Lessons Learned ........................................................................................ 17
CHAPTER III ............................................................................................................................... 26
PROGRAM IMPLEMENTATION AND ................................................................................. 26 OPERATIONAL EXPERIENCES............................................................................................ 26 UNDER MEDICAID MANAGED CARE................................................................................ 26
Minnesota’s PMAP+............................................................................................................. 27 New York’s Partnership Plan................................................................................................ 29 The Kentucky Health Care Partnership Program.................................................................. 31 The Vermont Health Access Plan (VHAP) .......................................................................... 34 Key Lessons from Project Sites’ Implementation Experiences............................................ 36
CHAPTER IV ............................................................................................................................... 40
EFFECTS OF MANAGED CARE ON..................................................................................... 40 BENEFICIARIES AND HEALTH PLAN DECISIONS.......................................................... 40
Managed Care Impacts on TANF and Poverty-related Beneficiaries in Rural Areas .......... 41 Rural Health Care Experiences under Medicaid................................................................... 43 Managed Care Impacts on Medicaid SSI Beneficiaries ....................................................... 45 Commercial Plan Choices in a Changing Medicaid Market................................................. 46 Lessons Learned.................................................................................................................... 48
CHAPTER V ................................................................................................................................ 58
RECONFIGURING THE SAFETY NET: ................................................................................ 58 THE EXPERIENCE OF LOS ANGELES COUNTY............................................................... 58

Waiver Outcomes.................................................................................................................. 59 Restructuring Ambulatory Care........................................................................................ 59 Increasing the Efficiency of Hospital-Based Care............................................................ 61 Cultural Change ................................................................................................................ 62 Bringing Financial Stability.............................................................................................. 63
Lessons Learned.................................................................................................................... 63
CHAPTER VI ............................................................................................................................... 65
EVALUATION OF THE VERMONT PHARMACY ASSISTANCE PROGRAMS FOR LOW-INCOME MEDICARE BENEFICIARIES..................................................................... 65
Vermont’s Pharmacy Benefit Programs ............................................................................... 66 Methodology and Data.......................................................................................................... 67 Major Findings...................................................................................................................... 68 Lessons Learned.................................................................................................................... 76
CHAPTER VII.............................................................................................................................. 79
LESSONS LEARNED AND..................................................................................................... 79 DIRECTIONS FOR FUTURE RESEARCH............................................................................. 79
Potential for Managed Care to Improve Medicaid Services................................................. 79 Implementation and Operations under Medicaid Managed Care ......................................... 80 Impacts of Managed Care on Medicaid Beneficiaries.......................................................... 82 Impacts on Health Plan Participation Decisions................................................................... 83 Potential for Reconfiguring the Health Care Safety Net ...................................................... 84 Implications of Vermont Drug Analyses .............................................................................. 85 Suggestions for Future Research .......................................................................................... 85
APPENDIX A—LIST OF PROJECT REPORTS, PUBLICATIONS AND PRESENTATIONS APPENDIX B—PROJECT EVOLUTION AND CHANGE APPENDIX C—EXECUTIVE SUMMARY FOR “REMOVING THE BARRIERS:
MODIFYING TELEPHONE SURVEY METHODOLOGY TO INCREASE SELF-RESPONSE AMONG PEOPLE WITH DISABILITIES”

LIST OF TABLES AND FIGURES
Table II.1: Experiences Under Fee-for-Service Medicaid—Rural TANF and Poverty-Related
Beneficiaries Table II.2: Experiences Under Fee-for-Service Medicaid—Urban SSI Beneficiaries Table II.3: Experiences Under Fee-for-Service Medicaid-Child Urban SSI Beneficiaries, by
Disabling Condition Table II.4: Experiences Under Fee-for-Service Medicaid—Adult Urban SSI Beneficiaries, by
Disabling Condition Table II.5: Experiences Under Fee-for-Service Medicaid—Rural SSI Beneficiaries Table II.6: Experiences Under Fee-for-Service Medicaid in Four States—Adult SSI Beneficiaries Table II.7: Experiences Under Fee-for-Service Medicaid in Four States—Child SSI Beneficiaries Table IV.1: Estimates of the Impacts of Medicaid Managed Care on Access to and Use of
Care—Adult and Child TANF and Poverty-Related Beneficiaries Table IV.2: Differences in Access to Care in Rural and Urban Areas Among Low-Income
Adults—by Insurance Status Table IV.3: Access to Care in Rural Areas for Adult Medicaid Enrollees—Managed Care versus
Fee for Service Table IV.4: Estimates of the Effect of MMC—Adult SSI Beneficiaries in Urban Areas Table IV.5: Estimates of the Effect of MMC—Adult SSI Beneficiaries in Rural Areas Table IV.6: Factors Associated with Commercial Plan Exits in Medicaid Managed Care Figure IV.1: Factors Influencing the Medicaid Managed Care Participation Decision by
Commercial Plans

CHAPTER I
INTRODUCTION
This final report from the Evaluation of Medicaid Health Reform Demonstrations,
sponsored by the Centers for Medicare and Medicaid Services (CMS), synthesizes the findings
from a major body of research on the experiences of four states that applied for federal Section
1115 waiver authority to move their Medicaid programs towards managed care, and other related
studies. The work was conducted by The Urban Institute, and its subcontractors, Research
Triangle Institute (RTI) and Mathematica Policy Research. The data for the study came from a
wide range of sources including case studies of particular sites, state-specific beneficiary
surveys, Medicare and Medicaid claims data and analyses using national probability sample
survey data. This report summarizes findings project reports on a wide range of topical issues
(see Appendix A for full listing of project reports, publications and presentations.) At the
beginning of each chapter we identify which specific reports were used in drafting the chapter.
Readers are referred to individual reports for more details on project findings highlighted in this
summary volume. Project reports used for this chapter are listed in the attached footnote.1
The case study and beneficiary survey data were collected for a sample of states that
planned, with varying degrees of success, to implement Medicaid managed care and related
reforms under the Social Security Act’s Section 1115 waiver authority. The four states included
as project sites were Kentucky, Minnesota, New York, and Vermont. A fifth project site was Los
Angeles County, for which the State of California was granted its own 1115 Medicaid waiver
1 This chapter draws on the following project reports: Long et al. (1996) “Designing an Evaluation of the Medicaid Health Reform Demonstrations;” Coughlin, Marstellar, Rajan and Zuckerman (1997) “Expanding Medicaid Managed Care in Minnesota, 1st Site Visit Report;” and Bartosch, Urato, French and Kulas (2003) “Medicaid Managed Care in Vermont,” as well as the site reports on which Chapter III’s discussion is based. See Chapter III footnote 3 and Appendix A.
1

under special circumstances. Because the study sites were at very different stages of Medicaid
managed care implementation during the project period, the types of data collected also varied
by site.2
Medicaid Managed Care Goals for the Project Sites Section 1115 of the Social Security Act allows the Secretary of the U.S. Department of
Health and Human Services (DHHS) to waive specified requirements of Medicaid law to carry
out demonstration projects that are “likely to help in promoting the objectives” of the program.
Programs performed under an 1115 waiver must be approved by DHHS and must be budget
neutral to the federal government—i.e., have an overall cost to DHHS that is no greater than
what the federal cost of the program’s operation would have been in the absence of the waiver.
Many key dimensions of a state’s Medicaid program can be changed under an 1115
waiver. These include eligibility, benefits, financing, and freedom of choice. States can, for
example, promote mandatory enrollment in fully capitated managed care plans and expand
coverage to populations or services not otherwise permitted under Medicaid.
Although 1115 Medicaid waivers have been available for many years, few states had
applied for such waivers until the early 1990s when DHHS, in an effort to make 1115 waivers
more accessible to states, substantially changed the waiver approval process. A central theme of
1115 waivers developed during the early 1990s was to control program spending by mandating
enrollment of current Medicaid beneficiaries into managed care. Another was to use cost
savings realized from the shift to managed care and extend Medicaid eligibility to previously
uninsured individuals. As of June 2003, about 25 percent of the nation’s Medicaid beneficiaries
2 See Appendix B for detail on the project’s evolution and change.
2

was covered by 1115 waiver authority.3 Section 1115 program experience, therefore, has far-
reaching implications for the future of the Medicaid program.
The Medicaid waiver plans of the states whose experiences are included in this report
illustrate the types of changes envisioned by states as they think about moving their Medicaid
programs towards managed care:
Kentucky. The state’s main objective in its Health Care Partnership Program, a waiver
project approved in October 1995, was to create eight partnerships (one per geographic region in
the state) of public and private providers to deliver Medicaid acute care services through
managed care arrangements. Most current non-institutionalized Medicaid beneficiaries were to
be covered by the demonstration, including Temporary Assistance for Needy Families (TANF)
and poverty-related eligible women and children, Supplemental Security Income (SSI)
beneficiaries and medically needy enrollees. Exempted groups included institutionalized
individuals, those in other long-term care programs, and other eligibility categories. Most acute
and primary care services were part of the waiver benefit, including inpatient and outpatient
hospital, physician services, clinic, pharmacy, dental and home health. The one major exception
to this was behavioral health services, which were slated to be capitated to separate behavioral
health organizations. Like most managed care programs, long-term care services were largely
excluded from the benefit package provided through capitated plans, but continued to be
reimbursed by the state on a fee-for-service (FFS) basis. An important distinction of Kentucky’s
waiver program was that the state planned to contract with one Partnership entity in each
geographic area; thus there would be no beneficiary choice of health plan as in most other states’
managed care programs.
3 This is an Urban Institute estimate based on Medicaid managed care enrollment posted CMS’s website and Medicaid enrollment reports (HCFA-2082) maintained by the Institute.
3

Minnesota. Through their Prepaid Medical Assistance Program Plus (PMAP+)
demonstration, approved in April 1995, Minnesota planned to build on an existing 1115 waiver
program by extending mandatory managed care from 8 counties (largely located in the Twin
Cities metropolitan area) to all 87 counties in the state. The PMAP+ waiver also included an
eligibility expansion, where the state was able to collect Medicaid federal financial participation
for children and pregnant women in families with incomes at or below 275 percent of the federal
poverty line.4 Under PMAP+, TANF and poverty-related populations were mandatorily enrolled
in capitated managed care plans; the disabled were generally excluded.5 A broad range of
services is provided under PMAP+, including most acute and primary care services, including
dental, drugs and mental health services.
New York. The New York State Partnership Plan was designed to use waiver authority,
approved in July 1997, to move most TANF and poverty-related and SSI Medicaid-eligible
individuals in the state into partially or fully capitated managed care plans. Services covered by
capitated health plans include both primary and acute care services. Most long-term care services
such as institutional and personal care are excluded from the capitated plans and are reimbursed
on a FFS basis. Although initially included in the captiated benefit package, prescription drugs
were eventually carved out and were paid on a FFS basis. For the TANF populations mental
health and substance abuse (MH/SA) services are included in the capitated benefit package but
plans are subject to a stop loss provision for these services. By contrast, MH/SA services are
completely carved out for the SSI population. New York had also planned to develop special
needs plans (or SNPs) for persons with serious mental illness and for persons with HIV/AIDS.
4 More recently, Minnesota included parents and caretaker adults in their waiver expansion population. As of 2004, the state covers as additional 130,000 individuals through their PMAP. 5 Though not the focus of this evaluation, the PMAP waiver also includes individuals 65 and over, including those dually enrolled in Medicaid and Medicare.
4

The state went forward with HIV/AIDS SNPs (and as of summer 2004 has five such plans
operating) but abandoned its efforts to establish SNPs for persons with mental illness. Finally,
New York’s waiver program included an eligibility expansion so that the state received federal
Medicaid matching dollars for its state General Assistance (Safety Net) enrollees.6
Vermont. The Vermont Health Access Plan (VHAP) was designed to use waiver
authority, approved in July 1995, to move much of the traditional Medicaid population
(including SSI beneficiaries) into managed care, expand Medicaid eligibility for low-income
adult residents of the state, and implement a prescription drug benefit for low-income elderly and
disabled residents.7 Distinct from the other states, VHAP health plans initially sought to provide
the full array of Medicaid-covered services through prepaid plans—primary, acute, and long-
term care services, including prescription drugs, hospice services, and mental health and
substance abuse services. The state continued to pay for a few services on a FFS basis, including
dental care, family planning, and eventually pharmaceuticals.
Los Angeles County. In addition to these four state waivers, as noted, the Medicaid
managed care evaluation project included a waiver granted specifically to Los Angeles County.
The Los Angeles County (LAC) 1115 waiver, approved in April 1996, was different from the
other waivers covered in this report, not only because it was granted to a substate area, but more
fundamentally because it provided a federal financial relief package in addition to waiver
authority. Although not a managed care waiver in any direct sense, the fundamental intent of the
waiver was similar—to produce cost-savings to the Medicaid program through increased
efficiency in the care delivery process. In return for the federal funds, LAC agreed to
6 New York’s expansion population was later expanded to include enrollees in Family Health Plus, a state-sponsored program that provided health insurance to low-income families. As of summer 2004, the expansion population under the waiver totals 440,000 individuals. 7 Details of the prescription drug benefit are provided in Chapter VI.
5

fundamentally restructure its Department of Health Services and delivery of care to the indigent
through increasing access to county-funded ambulatory care services, and reducing inpatient
beds in county hospitals.
Project Findings in Brief
Project analyses cast new light on several major issue areas important to policymakers
and program administrators interested in moving their Medicaid programs toward managed care:
• Operational Considerations. Project sites encountered five common operational issues in their efforts to implement a financially viable managed care program: (a) ensuring an area has enough covered lives to make managed care financially viable, (b) setting feasible capitation rates, (c) being realistic in assessing whether potential cost-savings in the catchment area are actually likely, (d) allowing enough network flexibility to make beneficiary coverage in the area feasible with available resources, and (e) allowing for local differences and local input to avoid loss of key providers.
• Impacts of Managed Care on Beneficiaries. Our findings indicate that moving to
managed care for TANF and TANF-related beneficiaries in rural areas is unlikely to have much impact on improving care, although it may achieve some cost savings for Medicaid without compromising existing care levels. For beneficiaries with disabilities (the SSI population), however—particularly in rural areas—the potential for improvement in health care delivery exists, especially in access to primary care services.
• Health Plan Participation Decisions. Our findings indicate three factors that can increase
the chances that health plans will participate in Medicaid managed care: (a) establishing capitation rates that reflect the full costs of serving the enrolled population, (b) ensuring that plans can enroll enough beneficiaries to operate effectively, and (c) implementing policies that support managed care in the private market.
Project analyses also inform policymakers and program administrators interested in
changing other parts of Medicaid and the health care safety net.
• Potential for Reconfiguring the Health Care Safety Net. Our project findings highlight the challenges that arise in attempts to reconfigure a fragile safety net in an area with a large number of uninsured and an institution-based health care delivery system. Substantial financial relief and a serious restructuring effort have not been enough to restore the financial viability of a health care system on the brink of collapse.
6

• Pharmacy Assistance Program. Our project findings highlight the importance of pharmacy assistance programs for a highly vulnerable population of Medicare beneficiaries. The findings also have important implications for the newly enacted Medicare Part D, including the potential impact on insurance crowd out and service use and costs.
Rest of the Report
Chapter II provides context for the study findings by reviewing Medicaid beneficiary
experiences in the study sites before waiver implementation (i.e., under FFS). Chapter III
describes the implementation and operational experiences of states as they moved to implement
Medicaid managed care. Chapter IV presents study findings on the effects of managed care on
beneficiaries and on health plan participation decisions to participate in the Medicaid program.
Of the study sites, only in Minnesota was a systematic evaluation of its managed care
experience conducted. The project, therefore, augmented those findings with two analyses using
national databases that provide detailed information on Medicaid beneficiary experiences under
FFS and under managed care, also presented in Chapter IV. Chapters V and VI focus,
respectively, on two unique programs introduced under section 1115 waiver authority. Chapter V
describes Los Angeles County’s efforts to restructure its health care safety net under 1115 waiver
authority and the results of that restructuring. Chapter VI looks at the prescription drug benefit
introduced by Vermont as part of its 1115 waiver program. We conclude with Chapter VII,
which summarizes the lessons learned from the project and provides suggestions for future
research.
7
CHAPTER II
BENEFICIARY EXPERIENCES UNDER MEDICAID BEFORE MANAGED CARE
States look toward managed care, not only as a way to control Medicaid program costs,
but also as a potentially promising way to improve beneficiary access to care and quality of care.
States hope that managed care will provide Medicaid beneficiaries with a medical home, where
preventive care is promoted and primary care is readily available. Having such care is hoped to
improve beneficiaries’ continuity of care and reduce their use of costly services such as
emergency rooms and inpatient hospital care. Managed care is not without risks, however,
because it could reduce access to care—because it limits choice of provider and/or because it
embodies incentives for providers to reduce health care use (including limiting medically
necessary services).
This chapter summarizes the experiences of Medicaid beneficiaries before the
introduction of managed care (i.e., under fee-for-service Medicaid) to (a) help inform states
about potential beneficiary access and care quality problems that might be ameliorated by
managed care, and (b) provide a benchmark against which any changes produced by Medicaid
managed care can be measured. Information for this chapter comes from several reports written
under the project; for more details on findings readers are referred to these reports.8
8 This chapter is based on a number of project reports and publications. The project reports are: Coughlin and Long (1999) “Impacts of Medicaid Managed Care on Adults: Evidence from Minnesota’s PMAP Program;” Long and Coughlin (2000) “Effects of Medicaid Managed Care on Children: Evidence from Minnesota’s PMAP Program;” Coughlin, Long and Kendall (2001) “Health Care Access, Use, and Satisfaction Among Disabled Working Age Adults in New York under FFS Medicaid;” Coughlin and Long (2003) “Health Care Experiences of Disabled Children Receiving Medicaid;” Mitchell, Hoover and Bir (2003) “Poor and Disabled in Rural Kentucky: Access to Care for SSI Adults and Children;” and Mitchell, Hoover and Bir (2003) “Poor and Disabled in Rural Kentucky: Access to Care for SSI Adults and Children.” The project publications are: Coughlin and Long (2000) “Effects of Medicaid Managed Care on Adults” Medical Care; Long and Coughlin (2001) “Impacts of Medicaid Managed Care on Children” Health Services Research; Coughlin, Long, and Kendall (2002) “Health Care Access, Use and Satisfaction Among Disabled Medicaid Beneficiaries.” Health Care Financing Review; Long, Coughlin and
8

The discussion is divided into the Medicaid experiences of the TANF and poverty
populations (hereafter referred to as the TANF population) and of the SSI (non-elderly disabled)
population. The TANF results are for rural residents. The SSI findings focus on urban and rural
dwellers separately. For both groups, adults and children are considered separately.
Beneficiaries on Medicaid via Temporary Assistance for Needy Families (TANF) and Poverty-Related Expansions Our information on the experiences of TANF beneficiaries under fee-for-service
Medicaid comes from a representative telephone survey of Minnesota beneficiaries living in
rural counties served by fee-for-service Medicaid in 1998.9 We focus on measures generally
agreed to depict important dimensions of quality of care: continuity of care, use of care, access to
care, unmet need, and beneficiary ratings of service quality. Table II.1 summarizes the
experiences of TANF beneficiary adults (ages 19 to 64) and children (ages 0 to 18) under fee-
for-service Medicaid in the Minnesota survey. The tables for each chapter are included at the
end of the relevant chapter.
As can be seen, on most of the measures shown—as well as on a multitude of similar
measures gathered in the survey—TANF beneficiaries in rural Minnesota were not badly off
under fee-for-service Medicaid. Conspicuous is the fact that almost all of them reported having a
usual source of care other than the emergency room (94.8 percent for adults, 98.3 percent for
children). In several areas, however, considerable proportions of the Medicaid TANF population
Kendall (2002) “Unmet Need Among Rural Medicaid Beneficiaries,” Journal of Rural Health; Long, Coughlin, and Kendall (2002) “Access to Care Among Disabled Adults on Medicaid” Health Care Financing Review; Long and Coughlin (2004, forthcoming) “Access to Care for Disabled Children.” Health Care Financing Review; and Long, Coughlin and King (2004, forthcoming) “Capitated Medicaid Managed Care In A Rural Area: The Impact of Minnesota’s PMAP Program” Journal of Rural Health. 9 The reason for the rural nature of the sample was to be comparable (for a pre-post analysis) with a sample drawn from Minnesota counties that had been transferred to Medicaid managed care two years previously, which were rural counties.
9

gave answers that suggest potential areas in which Medicaid beneficiaries might be better served
through a move to managed care.
Continuity of Care. As noted above, the overwhelming majority of TANF beneficiaries
in fee-for-service Medicaid reported having a usual source of care outside the emergency room
(ER). Furthermore, about three-fourths of both adults and children see the same health care
professional for most or all of their visits to their usual source of care. This is encouraging
because having a usual source of care and seeing the same provider over time are regarded as a
good indicator of continuity of care. However, one-quarter of the adults and one-quarter of the
children had visited an emergency room in the last 12 months. By instead emphasizing
preventive and primary care, this suggests that an effective managed care system could
potentially increase cost-effectiveness without reducing quality, by reducing the number of
beneficiary ER visits for non-emergency conditions.10
Use of Care. Use of care statistics such as those shown can provide at least suggestive
evidence of the extent of preventive care. Large majorities of both adults and children in the
TANF population, for example, had a doctor visit in the past year. By itself this statistic suggests
that the population may have a relatively high rate of regular (i.e., preventive) health care use.
Most beneficiaries (adults and children) saw a dentist at least once in the last two years.
Access to Care. Relatively few had to wait in the office for one hour or more before they
were seen. But one in five (of both adults and children) had to travel 30 minutes or more for their
health care visit. An effective managed care system might be able to improve on this
performance through better assignment of beneficiaries to primary care providers near their
10 The data do not allow us to know what proportion of these visits were for conditions that could have been treated adequately (and at lower cost) in a non-emergency setting, but it is unlikely that such a high proportion of visits was medically necessary.
10

homes. However, given the rural nature of the survey sample, the travel times, though long, may
be in keeping with those of the general rural population.
Unmet Need. Unmet need appears to be the area where the greatest improvements for the
TANF population might be achieved by managed care. More than half of adult beneficiaries
reported some type of unmet need in the last 12 months. The same was true of nearly one-quarter
of the children. Given the possibility that childhood illness or injury can have lifetime
consequences, focusing managed care efforts on this unmet need promises to be especially
beneficial. The need seems to be mainly in the areas of doctor and dental care, with little unmet
need reported for hospital or specialist care.
Perceived Service Quality. As noted, TANF beneficiary perceptions of the health care
received from their usual provider were typically overwhelmingly positive—an encouraging
finding for the Medicaid program. With respect to wait time in the office, however, more than
one in four judged their experiences (for adults and children) as less than good. And nearly half
of the adults and one-third of the children found it not very easy to get evening or weekend care.
An effective managed care system could potentially increase quality of care for Medicaid
beneficiaries by focusing on office wait times and on greater access to non-emergency care in the
evenings and on weekends.
Disabled Non-Elderly Beneficiaries on Supplemental Security Income The disabled population is particularly important for Medicaid because it is a vulnerable
group with very complex medical and health conditions. In addition to physical disability, these
beneficiaries include persons with developmental disabilities and serious mental illness.
Nationally, within the non-aged adults with disabilities group, about 40 percent have physical or
sensory disabilities, 36 percent have mental illness, and the remainder has mental
11

retardation/developmental disabilities (U.S. House of Representatives 2004). Within the children
with disabilities population, about 37 are physically disabled, 33 percent have developmental
disabilities, about 30 percent are physically disabled, and the remaining 30 percent have a mental
illness (Social Security Administration 2001).
Given their typically low health and functional status, persons with disabilities are heavy
users of health care and thus are costly to serve. While they constitute less than 20 percent of the
national Medicaid caseload, for example, they account for upwards of 40 percent of program
spending (Kaiser Commission on Medicaid and the Uninsured 2001). Managed care strategies
could potentially realize major savings by increasing the cost-effectiveness of care for this group.
However, the extent and range of their needs must be carefully calibrated if managed care,
particularly capitated managed care, is to succeed.
The data on urban SSI beneficiaries’ experiences under fee-for-service come from
beneficiary telephone surveys in two sites in New York (New York City and Westchester
County) and two geographic areas in Kentucky (Regions 4 and 8 in the state’s waiver).11 The
survey instruments were identical and the surveys were both fielded in 1999/2000. The New
York survey provides data for urban and suburban beneficiaries; the Kentucky survey provides
data for rural beneficiaries. Both were restricted to non-aged adults (ages 19 to 64) and children
(ages 0 to 18) who were SSI beneficiaries living in the community. The surveys excluded
beneficiaries who were also enrolled in Medicare (“dual eligibles”).
11 For a discussion on the special methods used to conduct the survey of SSI beneficiaries see Appendix C, which provides an executive summary of a report completed as part of the project.
12

Urban Beneficiaries with Disabilities
The findings for the New York sample are summarized in Table II.2. Since the results for
New York City and Westchester County are very similar, for simplicity we focus our discussion
on the New York City findings.
Continuity of Care. Over 90 percent of both adults and children are reported to have a
usual source of care, and over 80 percent see the same provider all or most of the time. Both
findings suggest a high degree of continuity of care for disabled beneficiaries under the Medicaid
fee-for-service system.
Use of Care. Hardly surprising, given their precarious health status, disabled beneficiaries
are heavy users of health care services. More than 80 percent of adults and more than 90 percent
of children had a physical health care visit during the past year. Fewer had a mental health visit,
in large part because only a minority of SSI beneficiaries had a mental health problem.
One measure of health care use that may be cause for particular concern is the substantial
use of emergency rooms by this population. More than half of the adults and almost half of the
children had at least one ER visit in the 12 months preceding the survey. These high levels of
use might be reduced under a managed care system, if access to primary care for non-emergency
health care needs can be improved.
Access to Care. Even though most beneficiaries with disabilities reported having a usual
source of care, they reported long wait times in the office and travel times. Waits of 30 minutes
or more in the office were the norm for 70 percent of adults and 56 percent of children with
disabilities. In addition, four out of ten disabled adult beneficiaries (and three out of ten of the
children) had to travel 30 minutes or more to their place of care. Though not shown here, project
analyses revealed that respondents with long travel times also reported more difficulty finding a
13

doctor who accepts Medicaid, strongly suggesting that these wait times are not voluntary, and
that an effective managed care system could substantially improve access for Medicaid
beneficiaries with disabilities.
Unmet Need. As with the TANF population, unmet need is an area where an effective
managed care system might achieve substantial improvements in service delivery for
beneficiaries with disabilities. Despite being frequent users of health care services and having a
usual source of care, almost 40 percent of adults and over 30 percent of children were reported to
have had an unmet need in the past year--with medical and dental care the most common unmet
needs reported. Limited availability of providers was reported to be a key factor across all types
of unmet need.
Perceived Service Quality. Unlike the TANF beneficiaries, substantial minorities of
urban SSI beneficiaries were not satisfied with the care they received, with finding a doctor
appearing to be the most important single source of dissatisfaction.
Differences Among SSI Beneficiaries. Project analyses also revealed evidence of gaps in
care for subgroups of disabled persons under the Medicaid program, particularly for adults and
children with mental disability. Among children, those with mental disabilities (mental illness or
MR/DD) are less likely than those with physical disabilities to have had an outpatient visit for
physical health, a preventive care visit, or a dental visit in the past year, all else equal (Table
II.3). Further, nearly 35 percent of children with mental illness do not have a usual source of
care for mental health (data not shown). Similarly, among adults, we found that 25 percent of
adults with mental illness did not have a usual source of care for mental health and only 75
percent had an outpatient visit for mental health in the past year (Table II.4). After controlling
for health care needs, we found that adults with mental illness are less likely than the physically
14

disabled to have a usual source of care for physical health and are more likely to report unmet
need for care (not shown in the table).
The multivariate analysis on the data for adult beneficiaries with disabilities revealed two
additional noteworthy differences within this group. Not surprisingly, those in worse health (and
presumably in greatest need) had the greatest difficulty getting care. More surprisingly, older
beneficiaries with disabilities were better off than younger ones on most measures, suggesting
that over time beneficiaries are able to develop a network of providers who offer them greater
continuity of care.
Although we did find evidence of some differences in access to care for subgroups of
disabled adults and children, the general finding from the multivariate analysis was that many of
the barriers to care faced by disabled Medicaid beneficiaries are broad. For the most part, we
found relatively little association between the characteristics of children or adults and the
measures of access to care and unmet need.
Rural Beneficiaries with Disabilities
The data on rural Medicaid SSI beneficiaries under fee-for-service come from a
telephone survey of beneficiaries in two areas of Kentucky--Region 4 (16 counties in north
central Kentucky) and Region 8 (21 counties in east central Kentucky) of the state’s waiver
program. The surveys were fielded in 1999. These regions are very rural and together include 43
percent of the non-dual SSI population of Kentucky. Their experiences under Medicaid managed
care are summarized in Table II.5.
15

Continuity of care. Along this dimension of care, fee-for-service Medicaid seems to do a
good job for disabled beneficiaries. Virtually all have a usual source of care and almost nine out
of ten see the same provider all or most of the time.
Use of care. As with urban disabled beneficiaries, rural SSI beneficiaries use a great deal
of health care. Particularly dramatic is their considerable use of ER care. Almost half of the
adults and children had an emergency room visit last year, even though nine out of ten of the
children also had a preventive care visit and the vast majority had a usual source of care. The
data do not show how many of these ER visits were of a non-emergency nature. But the very
high incidence of ER use, combined with the fact that almost a quarter of adult beneficiaries had
an unmet need for care last year, suggests that at least some of it could be prevented with an
effective managed care system.
Access to care. One out of four adults and children had to travel more than 30 minutes to
get care. And five out of ten adults (four out of ten children) had to wait in the office more than
an hour before being seen. An effective managed care system should be able to improve these
access statistics. While travel time is more of a challenge in rural areas, waiting time in an office
is an area where managed care plans could make a difference.
Unmet need.. With respect to unmet need, disabled adult beneficiaries fare substantially
less well than the children on two major measures. More than one in ten of disabled adults had
an unmet need for medical or surgery care in the last year (even though almost all of them had a
usual source of care) and almost a quarter had an unmet need for prescription drugs.
Service ratings. Most beneficiaries rated most their care as good, very good, or excellent,
with more than four out of five adults and children rating each category of health care service
that way.
16

Cross-State Differences for Beneficiaries with Disabilities Combining surveys conducted by two other CMS-sponsored Section 1115 evaluations
with surveys collected in this evaluation, a comparison of SSI beneficiaries in areas in four
states—Kentucky (Regions 5 and 8), New York (New York City and Westchester County),
Oregon (entire state), and Tennessee (urban and rural areas),12 showed that disabled adults
(Table II.6) and children (Table II.7) generally have access to a usual source of care and do
receive care. However, there were significant differences in access to care for these populations
across the states. For example, only about 80 percent of disabled children and adults in
Tennessee had a physician visit in the past year, as compared to about 90 percent in the other
states. Unmet need for doctor care ranged from 14 percent of disabled adults in New York to 22
percent in Kentucky and Tennessee. There was greater consistency in satisfaction with care
across states, with around 20 percent of disabled adult beneficiaries and around 14 percent of
disabled children rating the quality of medical care they received as fair or poor.
Conclusions and Lessons Learned For adult TANF beneficiaries and their children, our findings indicate that Medicaid fee-
for-service is generally doing an adequate job of linking beneficiaries to the health care system,
at least in rural Minnesota. The major areas where an effective managed care system might
achieve cost-effective improvements appear to be reducing ER use for non-immediate needs,
particularly for adults, following up to ensure preventive care appointments are made and kept,
12 The surveys in Oregon and Tennessee were conducted under other CMS funded projects. Research Triangle Institute conducted the survey in Oregon and Mathematica Policy Research conducted the survey in Tennessee.
17

reducing travel times to care and wait times in office before being seen, and reducing unmet need
for doctor and dental care.
The situation is more complex for disabled beneficiaries. This is a highly vulnerable and
costly population about which relatively little is known, particularly in a managed care context.
Project data collected but not shown here indicate a wide diversity in the types of health
conditions among this population, both adults and children, from physical afflictions such as
muscular dystrophy, cerebral palsy, and HIV/AIDS to mental health conditions including mental
retardation, schizophrenia, and paranoia. States need to have solid information on the needs of
this population if they are to develop sound managed care systems, particularly in the area of
capitation rates.
Our data show that managed care can have potential benefits for this population, if based
on a clear understanding of the issues to be confronted—with urban beneficiaries in New York
currently having less satisfactory experiences under fee-for-service Medicaid than Kentucky
rural beneficiaries. This difference may be due, at least in part, to Kentucky beneficiaries who
are in poorer health. Thus, the fact that they receive more care may be because they need more
care. It remains true, however, that Kentuckians report less unmet need and more satisfaction
with their care than do their New York counterparts.
The main areas states should focus on in efforts to improve care for Medicaid
beneficiaries with disabilities--adults and children, urban and rural--appear to be improving ease
of access (travel time and office wait times), reducing unnecessary ER use, and reducing unmet
need, particularly for adults in the areas of medical/physician and dental care.
18

TABLE II.1: EXPERIENCES UNDER FEE-FOR-SERVICE MEDICAID—RURAL TANF AND POVERTY-RELATED BENEFICIARIES
Percent with “Yes” Response Dimension of Care/Specific Measures
Adults Children
Continuity of Care
Usual source of care (other than ER) 94.8 98.3
Same health care provider for most/all visits 78.2 76.3
Use of Care
ER visit in last 12 months 25.0 25.5
Doctor visit in past year 85.8 90.7
Dentist visit in past 2 years 76.0 87.2
Access to Care
Travel time 30 minutes or more 21.2 20.7
Wait time in office one hour or more 12.5 11.8
Unmet Need
Any 56.6 23.6
Hospital care 6.9 1.3
Doctor care 32.5 9.0
Specialist care 9.0 4.3
Dental care 41.2 14.8
Perceived Service Quality
Rates care as fair or poor
Health care from usual source 7.5 12.2
Wait time for appointment 17.3 17.5
Wait time in office 27.8 28.6
Ease of getting evening/weekend care 43.0 37.3 Source: 1998 Minnesota TANF Beneficiary Survey
19

TABLE II.2: EXPERIENCES UNDER FEE-FOR-SERVICE MEDICAID—URBAN SSI BENEFICIARIES
Percent with “Yes” Response Dimension of Care/Specific Measures
Adults Children
Continuity of Care
Usual source of care (other than ER) 93.3 95.5
Same health care provider for most/all visits 82.4 82.1
Use of Care
ER visit in last 12 months 52.7 45.3
Physical health visit 81.1 91.7
Preventive visit --- 87.3
Mental health visit 32.0 35.6
Dental visit 69.6 84.8
Access to Care
Travel time 30 minutes or more 41.3 33.9
Wait time in office one hour or more 70.1 56.4
Unmet Need
Any 47.5 31.2
Medical 14.5 10.4
Mental 7.5 8.6
Dental 17.0 12.9
Physical, speech, occupational therapy 6.0 10.3
Prescription drugs 11.4 6.2
Perceived Service Quality
Rates care as fair or poor
Overall quality of medical care 17.8 16.0
Ease of finding doctor who accepts Medicaid 28.8 21.1
Ease of getting medical specialist care 14.5 10.4
Ease of getting mental health care 7.5 8.6 Source: 1999/2000 New York City Working-Age Adult and Child SSI Beneficiary Surveys
20

Table II.3: Experiences Under Fee-for-Service Medicaid--Child Urban SSI Beneficiaries, by Disabling Condition Percent with “Yes” Response
Dimension of Care/Specific Measure Mental Disability Physical
Disability Continuity of Care Has Usual Source of Care (other than ER) for Physical Health 96.0 94.4 Sees Same Provider at All or Most Visits 80.0 87.1 Use of Care in Last 12 months Hospital Stay 14.3 ** 28.5 Multiple Hospital Stays 4.2 ** 15.6 Emergency Room Visit 42.1 ** 53.0 Visit for Fall or Accident 10.5 10.3 Visit for Mental or Emotional Health 1 5.9 2.9 Multiple Visits to Emergency Room 26.0 ** 42.1 Outpatient Visit for Physical Health Care 89.0 ** 98.5 Outpatient Visit for Preventative Care 83.8 ** 95.5 Mental Health Care Visit 40.9 ** 22.4 Dental Care Visit 82.6 * 90.7 Access to Care Travel Time to Provider of 30 Minutes or More 28.5 ** 46.1 Wait in Office is 30 Minutes or More 61.6 ** 44.5 Unmet Need Medical Care or Surgery (including Doctor Care) 10.8 9.6 Mental Health Care 10.7 ** 2.9 Dental Care 1 12.2 14.8 Physical, Occupational or Speech Therapy 11.2 8.1 Prescription Drugs 7.0 3.5 Special Medical Equipment 7.8 9.3 One or More of the Above 31.7 30.0 Perceived Service Quality
Problems Communicating with Providers Due to Language Differences 14.5 13.3
Parent Rates Ease of Access as Fair or Poor for: Finding a Doctor Who Accepts Medicaid 21.6 20.1 Getting Specialist Medical Care 2 26.2 * 18.1 Getting Emergency Medical Care 2 22.9 17.0 Getting Mental Health Care 2 21.7 26.0 One or More of the Above 38.1 36.8 Source: 1999/2000 New York City Child SSI Beneficiary Survey. *(**) Indicates value for children with a mental disability is significantly different from that for children with a physical disability at the .05 (.01) level. 1 Limited to children aged two or older. 2 Limited to children who needed that particular type of care.
21

Table II.4: Experiences Under Fee-for-Service Medicaid--Adult Urban SSI Beneficiaries, by Disabling Condition
Percent with "Yes" Response
Dimension of Care/Specific Measure Mental Illness MR/DD Physical
Disability Continuity of Care Has Usual Source of Care (other than ER) for Physical Health 88.8 ** 91.9 ** 96.9 Has Usual Source of Care (other than ER) for Mental Health 74.8 ** 43.9 ** 22.8 Use of Care in Last 12 Months Hospital Stay 25.8 15.3 ** 32.8 Hospital Stay for Psychiatric Treatment 8.3 ** 4.7 ** 0.4 Multiple Hospital Stays 13.3 7.4 * 13.8 ER Visit 46.4 39.0 ** 52.7 ER Visit for Mental/Emotional Problems 12.6 ** 7.6 * 2.9 Multiple ER Visits 27.8 22.2 27.2 Outpatient Visit in Last 12 Months 95.3 92.0 * 96.8 Outpatient Visit for Physical Health Care 88.5 ** 88.8 ** 95.5 Outpatient Visit for Mental Health Care 74.8 ** 42.9 ** 25.9 Dental Visit 70.8 76.3 * 66.0 Flu Shot 35.9 32.7 * 41.9 Pap Smear (women) 71.3 59.9 ** 75.6 Unmet Need Any Unmet Need 47.1 ** 26.5 33.6 Medical care or surgery 18.2 * 7.6 10.8 Mental health care 11.2 ** 5.8 3.9 Prescription drugs 17.4 ** 5.7 8.9 Dental care 20.3 * 11.3 12.2 Physical, occupational, or speech therapy 4.6 6.4 3.9 Special medical equipment 8.9 4.2 7.1 Perceived Service Quality Rates One or More Aspects of Care as Fair or Poor: 65.0 62.8 * 72.9 Ease of finding a doctor who accepts Medicaid 29.5 26.3 29.0 Ease of getting: 23.1 25.0 26.0
Specialist medical care 1 36.5 29.4 32.0
Emergency medical care 1 17.9 17.2 19.7
Mental health care1 44.0 40.0 43.4 Source: 1999/2000 New York City Working-Age Adult SSI Beneficiary Survey Note: Only respondents who had had a health care encounter over the past year were asked to rate the ease of finding a doctor or getting care. (*) (**) Significantly different from individuals with a physical disability at the .05 (.01) level. 1 Those indicating they did not need a particular type of care were excluded from this calculation.
22

TABLE II.5: EXPERIENCES UNDER FEE-FOR-SERVICE MEDICAID—RURAL SSI BENEFICIARIES
Percent with “Yes” Response Dimension of Care/Specific Measures
Adults Children
Continuity of Care
Usual source of care (other than ER) 96.6 99.2
Same health care provider for most/all visits 89.5 87.0
Use of Care in Last 12 Months
ER visit 48.7 45.5
Physical health visit 91.9 93.0
Preventive visit --- 91.9
Mental health visit 36.4 35.8
Dental visit 53.7 64.5
Access to Care
Travel time 30 minutes or more 24.7 26.1
Wait time in office one hour or more 52.6 42.4
Unmet Need
Any N/A N/A
Medical care or surgery 12.0 7.8
Mental 6.7 6.7
Dental 10.9 8.5
Physical, speech, occupational therapy 3.8 8.9
Prescription drugs 22.5 11.8
Perceived Service Quality
Rates as fair or poor:
Overall quality of medical care 16.6 12.3
Ease of finding doctor who accepts Medicaid 18.9 16.4
Ease of getting medical specialist care 19.5 18.8
Ease of getting mental health care 19.7 19.8 Source: 1999 Kentucky SSI Beneficiary Survey
23
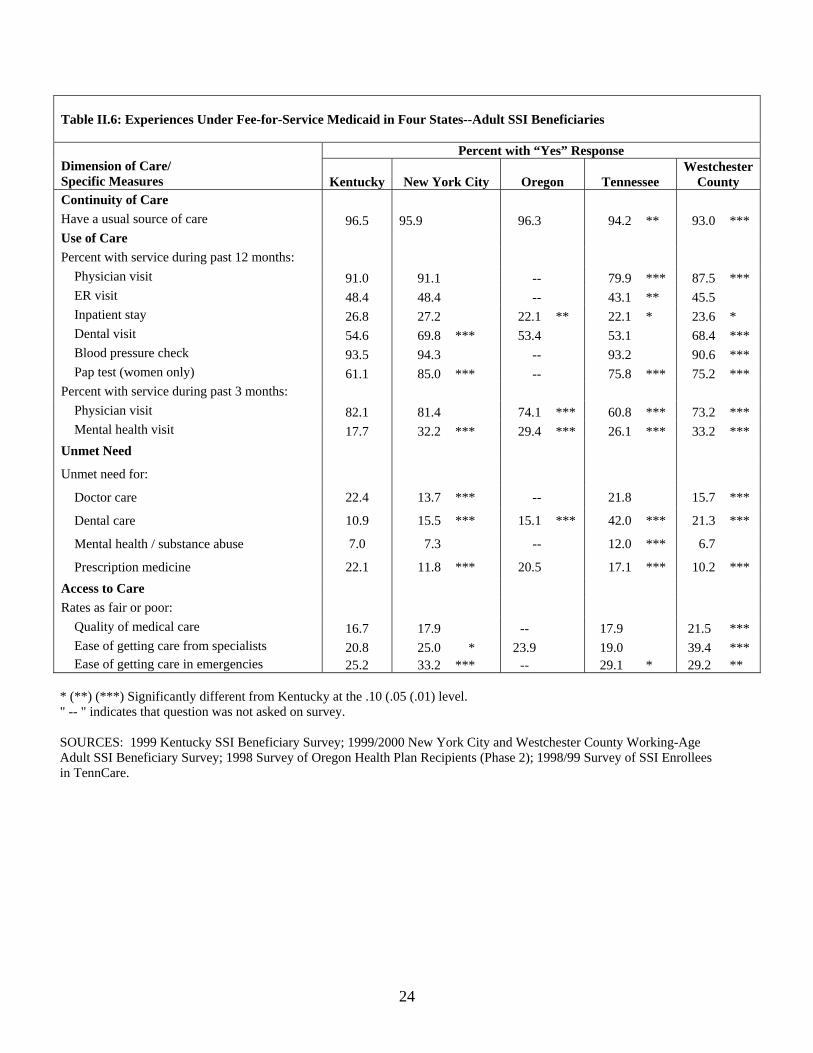
Table II.6: Experiences Under Fee-for-Service Medicaid in Four States--Adult SSI Beneficiaries
Percent with “Yes” Response Dimension of Care/ Specific Measures Kentucky New York City Oregon Tennessee
Westchester County
Continuity of Care Have a usual source of care 96.5 95.9 96.3 94.2 ** 93.0 *** Use of Care Percent with service during past 12 months:
Physician visit 91.0 91.1 -- 79.9 *** 87.5 *** ER visit 48.4 48.4 -- 43.1 ** 45.5 Inpatient stay 26.8 27.2 22.1 ** 22.1 * 23.6 * Dental visit 54.6 69.8 *** 53.4 53.1 68.4 *** Blood pressure check 93.5 94.3 -- 93.2 90.6 *** Pap test (women only) 61.1 85.0 *** -- 75.8 *** 75.2 ***
Percent with service during past 3 months: Physician visit 82.1 81.4 74.1 *** 60.8 *** 73.2 *** Mental health visit 17.7 32.2 *** 29.4 *** 26.1 *** 33.2 ***
Unmet Need Unmet need for: Doctor care 22.4 13.7 *** -- 21.8 15.7 ***
Dental care 10.9 15.5 *** 15.1 *** 42.0 *** 21.3 ***
Mental health / substance abuse 7.0 7.3 -- 12.0 *** 6.7
Prescription medicine 22.1 11.8 *** 20.5 17.1 *** 10.2 *** Access to Care Rates as fair or poor: Quality of medical care 16.7 17.9 -- 17.9 21.5 *** Ease of getting care from specialists 20.8 25.0 * 23.9 19.0 39.4 *** Ease of getting care in emergencies 25.2 33.2 *** -- 29.1 * 29.2 **
* (**) (***) Significantly different from Kentucky at the .10 (.05 (.01) level. " -- " indicates that question was not asked on survey. SOURCES: 1999 Kentucky SSI Beneficiary Survey; 1999/2000 New York City and Westchester County Working-Age Adult SSI Beneficiary Survey; 1998 Survey of Oregon Health Plan Recipients (Phase 2); 1998/99 Survey of SSI Enrollees in TennCare.
24

Table II.7: Experiences Under Fee-for-Service Medicaid in Four States--Child SSI Beneficiaries
Percent with “Yes” Response Dimensions of Care/Specific Measures Kentucky
New York City Oregon Tennessee
Continuity of Care Has a usual source of care 99.2 98.2 98.5 96.2**
Use of Care Use of care in last 12 months:
Physician visit 93.0 91.8 -- 81.5*** ER visit 45.2 45.7 -- 31.5*** Inpatient stay 19.0 18.6 19.6 13.2** Dental visit 82.0 84.6 65.9*** 67.6***
Use of care in last 3 months:
Physician visit 33.4 26.8** 32.7 62.9*** Mental health visit 21.7 19.9 19.0 18.4
Unmet Need Unmet need for: Doctor care 6.7 6.4 -- 9.7 Dental care 8.2 13.9** 14.4*** 24.4***
Mental health /substance abuse 6.9 8.9 -- 4.9
Prescription medicine 11.4 5.8*** 11.0 11.5 Access to Care
Rates as fair or poor: Quality of medical care 12.5 16.2 -- 14.8
Ease of getting care from specialists 19.2 24.4* 50.5** 21.9 Ease of getting care in emergencies 19.7 20.8 -- 30.8***
* (**) (***) Significantly different from Kentucky at the .10 (.05) (.01) level. " -- " indicates that question was not asked on survey. SOURCES: 1999 Kentucky SSI Beneficiary Survey; 1999/2000 New York City Child SSI Beneficiary Survey; 1998 Survey of Oregon Health Plan Recipients (Phase 2); 1998/99 Survey of SSI Enrollees in TennCare.
25

CHAPTER III
PROGRAM IMPLEMENTATION AND OPERATIONAL EXPERIENCES
UNDER MEDICAID MANAGED CARE
Converting a Medicaid program from one operating system or payment system to another
is inevitably complex. States should always expect to run into unanticipated issues, however
carefully they may have planned the transition. This chapter summarizes the experiences of
several states as they worked to implement capitated managed care in their Medicaid programs
under Section 1115 waiver authority—experiences that can be of potential help to states as they
think about how to maximize their chances of successful managed care implementation.
Information for this chapter comes from several reports written under the project; for more
details on findings readers are referred to these reports.13 Given the nature of our study states,
our study findings provide a special focus on implementing Medicaid managed care in rural
areas. We begin with Minnesota, which was ultimately successful in bringing Medicaid managed
care to the state as a whole. We then discuss the experiences of New York, Kentucky, and
Vermont, none of which has been able to implement capitation on a statewide basis. We finish
with a brief review of lessons for other states to consider as they approach the task of introducing
Medicaid managed care.
13This chapter draws on the following reports: Coughlin, Marstellar, Rajan and Zuckerman (1997) “Expanding Medicaid Managed Care in Minnesota, 1st Site Visit Report;” Marstellar, Coughlin Long, and Rangararajan (1999) “Minnesota PMAP: 2nd Round Site Visit Report;” Coughlin, Long, Kasten and Goldenson (2000) “NY’s Partnership Plan: An Early Look at Program Implementation;” Long, Kendall, Coughlin and Ormond (2001) “Minnesota PMAP: 3rd Round Site Visit Report;” French, Bartocsch, Donoghue, Hoover, Walsh and Mitchell (2003) “Medicaid Managed Care in Kentucky;” Mitchell, Bartocsch and Haber (2004) “Evaluation of the Kentucky Health Care Partnership Program: A Comparison of the Managed Care Experiences in Regions 3 and 5;” and Coughlin, Long and Ormond (2004) “Rural Medicaid Managed Care: The Case of Four States.”
26

Minnesota’s PMAP+ Minnesota has long been a leader in promoting managed care for its Medicaid population,
and in its health sector more generally. The state received its first 1115 Medicaid waiver in 1985,
which it used to introduce its Prepaid Medical Assistance Program (PMAP). Ten years later
PMAP had been extended to eight Minnesota counties, all but one of which were located in the
Twin Cities metropolitan area--an urban catchment area that covered about one-third of all
Minnesota Medicaid clients. In 1995, the state obtained another 1115 waiver to create PMAP+, a
program to extend capitated Medicaid managed care to the remaining 79 counties, predominately
rural counties of the state.
The PMAP+ plan was to introduce statewide mandatory capitation to all TANF and
poverty-related populations, generally excluding the disabled. Prepaid health plans were to cover
most acute and primary care services, including dental, drugs, and mental health. The plans
(which are nonprofit by Minnesota state law) were to be paid a capitated rate based on age, sex,
eligibility group, county of residence, and case mix.
The new waiver program was to begin its phase-in by geographic area in early 1996, and
extend coverage to the whole state by 1997. By the end of 1996, however, the state had fallen far
short of its goal, with PMAP+ covering only an additional 8 counties and 13,000 beneficiaries.
While enrollees living in the new expansion areas expressed general satisfaction with the new
system, the state faced significant resistance from a range of powerful stakeholders—including
county officials, physicians and hospitals, and consumer advocacy groups.
Counties were the most prominent critics of PMAP+. Interestingly, state officials
underestimated the opposition they would encounter from this quarter, even though similar
tensions had emerged when the first managed care waiver went into effect 10 years earlier. The
27

counties had two major concerns. The first was that managed care would result in a cost shift to
them, actually reducing access to needed care for some beneficiaries and forcing counties, as the
legally obligated “payer of last resort,” to provide services at county expense that Medicaid was
no longer covering. The second was that counties resented what they felt was the imposition of a
single program model on all counties, when local authorities felt they knew what worked best for
their communities. Providers echoed these concerns, feeling that imposition of PMAP+ in their
areas would encroach on their ability to direct the provision of care. Some consumer groups also
feared the effects of “rationing” care.
Stakeholders took their concerns to the Minnesota state legislature during the 1995-1996
session, which introduced two changes. The first was a 1996 redefinition (called “enhanced
PMAP”) of the county’s role in the expansion, which included a voice in plan selection and in
setting the timetable for implementation in their area. The second was the granting in 1997 of
authority to design county-based purchasing (CBP) models as an alternative to PMAP. CBP
granted counties the option of running their own Medicaid demonstration projects with advance
payment from the state, as long as they accepted full risk and met state and federal requirements.
As of July 1998, 28 counties had implemented PMAP, with 38 counties proposing to
adopt CBP by October 1999 (including some that had already transitioned to PMAP). Many
observers questioned, however, whether CBP would in fact be viable for counties with little
experience in assuming risk or managing care.
By October 2000, the state had successfully implemented enhanced PMAP in 60
counties, with a total enrollment of 183,000, with three more scheduled for 2001. The 24
counties that had not yet adopted it were still pursuing CBP options, although some observers
continued to question the viability of these plans. CMS was raising concerns about allowing
28

counties to become the sole purchaser of health care without a competitive procurement process,
for example. In addition, many counties felt that the state was being less than supportive of CBP,
making them apprehensive about the likelihood of success. Provider support of CBP plans was
also waning, calling into question CBP plan viability even if implemented. As of summer 2004,
Minnesota had successfully implemented PMAP in 67 of its 87 counties, and entered into CBP
arrangements with the remaining 20 counties.14
New York’s Partnership Plan The motivation behind New York’s 1115 waiver plan was to reduce Medicaid costs and
improve access to care through enrollment of more than two million beneficiaries across the state
into mandatory capitated managed care. Eligibility was to include TANF, poverty-related, and
SSI populations, plus “special needs plans (SNPs)” for high need/high cost beneficiaries, and
coverage of the state’s Safety Net (SN) program, which allowed receipt of federal Medicaid
matching dollars to cover health care for general assistance recipients. Project site visits in 1998
and 1999 documented early waiver program experiences.
Under the Partnership Plan, captiated health plans were to cover primary and acute care
services, including prescription drugs (which were later withdrawn from the captivated benefit
packaged and returned to FFS). Mental health and substance abuse services were included in the
benefit package for the TANF populations but plans were subject to a stop loss provision for
their enrollees. For the SSI population, these services were completely carved out. Finally,
institutional and personal care services were excluded, and mental health and substance abuse
services were largely carved out. Capitation rates were originally set by competitive bidding, but
14 It should be noted that the 1997 Balanced Budget Act (BBA), by allowing a single Medicaid plan in rural counties, helped move CBP forward.
29

were later set by negotiation to take into account managed care experiences, age, sex, eligibility
group, and geographic region.
As of April 1999, New York had made substantial progress in implementing the
Partnership Plan. All major urban areas in upstate New York had started mandatory managed
care for their TANF/SN populations, with 140,000 recipients enrolled statewide. Implementation
in New York City and implementation for non-TANF-related groups upstate had moved more
slowly than planned, however. No mandatory enrollment of the SSI populations had taken place,
for example, although several upstate counties were positioned to move forward with mandatory
SSI enrollment under the waiver’s terms and conditions and subject to CMS’s approval. The
state had also made only limited progress in moving forward with the SNPs. Those plans, which
were intended to serve persons with HIV/AIDS and persons with serious mental illness (children
and adults), were still in the development phase as of April 1999.15
What were the major barriers slowing progress, in addition to the problems inherent in
any public program promoting wide-scale change? Four issues were particularly prominent. The
first was similar to the situation in Minnesota—resistance by local government. New York has a
strong local government structure, and counties pay about 25 percent Medicaid program costs.
Officials in some upstate counties simply told the state they were unable to implement the
Partnership Plan. Second, the strong state economy at the time, along with declining Medicaid
enrollment, reduced the fiscal imperative for managed care, and there was no strong political or
administrative voice speaking up for the waiver program at a critical implementation point.
Third, there was federal-state tension over how to handle the managed care provisions of
the 1997 Balanced Budget Act (BBA)--with New York believing, contrary to CMS’s
15 Eventually, authorizing legislation for SNPs for serious mental illness lapsed and these plans were never implemented.
30

interpretation, that the waiver exempted them from the BBA provisions. Finally, New York City
hospitals, though not actively fighting the waiver, gave it lukewarm support at best, because they
viewed Medicaid capitation rates as too low for viability.
As of January 2003, the Partnership Plan had been implemented in 21 of the state’s 62
counties (three of which are rural) and in New York City. But only TANF-related populations
are mandatorily enrolled.
The Kentucky Health Care Partnership Program Kentucky’s 1115 waiver proposal, which was approved in October 1995, was also
intended to introduce capitated managed care to its Medicaid program statewide. The state
expected capitated payment systems and coordination of care to control or even reduce the rate
of Medicaid expenditure growth, while improving the focus on preventive care and possibly
improving quality of care. This discussion is based on two project site visits--the first in May
1999, the second in October 2000.
When the waiver was approved, most of the state’s urban beneficiaries were already in a
primary care case management (PCCM) program, which paid physicians a monthly case
management fee but reimbursed all services on a fee-for-service basis. The intent was to build
upon this system (called the Kentucky Patient Access and Care System or KenPac) to introduce
capitated Medicaid managed care statewide and extend eligibility beyond the TANF-related
population to the SSI population, excluding residents of nursing homes and psychiatric facilities.
Most acute and primary care services were covered, including pharmacy, dental, and home
health. Behavioral health was slated for capitation by separate organizations.
31

The waiver plan divided the state into eight Partnership regions with one Partnership
entity to be formed in each region. The intent was to enable providers in a region (explicitly
including academic medical centers, local health departments, primary care centers, and safety
net clinics) to design a services delivery network tailored to the regional health care
infrastructure and the needs of its Medicaid population. Thus, there would be no beneficiary
choice of plan and the Partnership would bear the full risk of health services in its region,
although it could negotiate different risk sharing arrangements with different provider groups.
At the time of the first site visit, Partnerships had been successfully implemented in two
regions in the state—the areas in which KenPac had been successfully operating when the waiver
was approved. These were the most urban areas in the state—surrounding the cities of Louisville
(Region 3) and Lexington (Region 5). Their partnerships had begun enrolling TANF-related
eligibles in November 1997 and the SSI population in April 1998. The six other regions—all
predominantly rural—were in varying states of contract development and negotiation.
By October 2000, none of the other six regions had been able to form partnerships or
initiate managed care contracts with the state. And only one of the two regions that had done so
(Region 3) was still in operation. Region 5 decided to terminate its partnership after its third
year of operation.
A brief discussion of the general problems with the Partnership experience highlights the
challenges that such an ambitious approach brought with it. This is followed by a comparison of
the experiences of the two regions that did form successful partnerships--highlighting why
Region 3’s partnership survived while Region 5’s did not.
General Opportunities and Problems. Kentucky’s innovative approach was designed to
avoid certain potential problems. First, by encouraging providers and consumers to become
32

integrally involved in the development of a managed care entity they hoped to circumvented any
tough political battles that might have accompanied a direct solicitation of commercial plans.
They also hoped to diffuse distrust of managed care in the many areas that had had no experience
with it. Second, contracting with a single entity in each region eliminated concerns about
marketing practices and selection bias in plan enrollment. Third, the plans had a greater incentive
to focus on preventive care, because they did not have to worry about enrollees switching to new
plans.
Kentucky’s approach came with its own set of challenges, however. Creating a monopoly
plan in each region reduced the state’s leverage in subsequent rate negotiations. In addition,
many of the regions were so sparsely populated that they had difficulty generating the necessary
capital to initiate a partnership agreement with the state—and might, in any case, have had a
membership base too small to be financially viable. Several observers speculated, indeed, that
the partnership concept might have worked if the state had been divided into fewer (larger)
regions. Two of the more populous regions with some managed care experience (Regions 3 and
5) were able to implement capitated managed care. But Region 5 had problems that finally led it
to abandon capitated managed care, making a comparison between Region 3 and Region 5 quite
instructive about factors that importantly influence success.
Region 3 versus Region 5. Site visit informants identified a variety of factors that
influenced the success of Region 3 and the failure of Region 5. First, payment rates were set
higher in Region 3, and it is probable that Region 3 also had greater initial excess utilization,
facilitating the achievement of savings. Second, Region 5 had a higher proportion of SSI
enrollees—a group that both regions found difficult to serve at the rates that were set. Third,
Region 5 chose to reimburse all providers on a FFS basis with a 20 percent withhold. Region 3
33
capitated primary care physicians and used FFS reimbursement with a 10 percent withhold for
other providers. Although providers initially preferred the Region 5 system, they in fact bore
more of the risk and ended up disenchanted with the system.16 Fourth, although both regions had
administrative problems in their first year, Region 3 (unlike Region 5) used an Administrative
Services Organization and engaged managers with extensive Medicaid and commercial care
experience to help them, and made successful efforts to cultivate good relations with politicians,
providers, and beneficiaries. Fifth, providers in Region 3 had a long history of working together
on indigent care giving them an advantage on forming a partnership. Finally, and perhaps most
important of all, Region 5 is somewhat more rural than Region 3, which brought the inherent
problems of smaller scale.
The Vermont Health Access Plan (VHAP) The stated motivation behind Vermont’s 1115 waiver plan was not primarily cost control.
Rather it was to move toward universal health care coverage in the state.17 Specific goals were
to: increase access for the uninsured, move from a fee-for-service to a managed care delivery
system, remove some of the stigma attached to Medicaid beneficiaries by enrolling them in plans
similar to the non-Medicaid population, and to improve Medicaid cost predictability. This
16 As discussed in Mitchell Bartocsch and Haber 2004, Region 3 capped its PCPs for primary care services (adjusting for age, gender, and eligibility) and paid them 95 percent of the Medicaid fee schedule for lab and radiology. They also got FFS reimbursement for certain preventive services that the plan wanted to encourage (e.g. prenatal care, EPSDT, immunizations). Plus, they received bonuses for submitting encounter data. Region 3 specialists were paid FFS at 105 percent of the fee schedule with a 10 percent withhold, and hospital's were paid on a per diem basis with a 10 percent withhold. During Region 3's first year, none of the withhold was returned to hospitals or specialists. By 1999, 85 percent was returned. Region 3 was planning to return 100% in 2000. By contrast, Region 5 paid on a FFS basis using the current Medicaid free schedule with a 20 percent withhold. (PCPs were assigned to groups with budget targets that determined the portion of the withhold that would be returned.) After its first year, none of the providers received withholds, so PCPs were operating at 80 percent of their fee schedule. FFS reimbursement with a 20 percent withhold proved riskier than Region 3's reasonable cap for primary care. Initially, PCPs were attracted to the FFS system in Region 5, but the 20 percent withhold, which was never returned, ultimately angered them. 17 In this section we focus on VHAP Medicaid managed care effort. In Chapter VI findings from Vermont’s pharmacy assistance program for low-income Medicare beneficiaries are highlighted.
34

discussion is based on two project site visits—the first in October 1997, the second in November
1999.
VHAP managed care plans covered a full set of services, including long-term care
services, prescription drugs, hospice, and mental health and substance abuse. Dental care
continued on a fee-for-service basis and Vermont, as in New York, took over responsibility for
pharmaceuticals soon after implementation. Vermont used a negotiated rate setting process with
their plans with rates based on age, sex, and eligibility group. There was no geographic rate
adjustment.
In August 1995, the state released their solicitation for Medicaid capitated managed care
plans. After a significant delay, Vermont state was able to execute contracts with two plans later
in that year –Community Health Plan (CHP) in May 1996 (which was acquired by Kaiser
Permanente within the next month or so) and Blue Cross Blue Shield of Vermont in October
1996. CHP-Kaiser began enrolling both the traditional and expansion Medicaid populations in
October of that year. Blue Cross followed suit in January 1997. Mandatory enrollment began in
March 1997 and by May had extended to all areas in the state but one, the Brattleboro area. Both
plans were paid on a fully capitated basis, with rates adjusted for age and sex and varying
somewhat by plan.
Although fully implemented, Vermont’s capitated system of Medicaid managed care
proved unsustainable in Vermont. A key factor in the demise of Vermont’s effort to develop a
captivated managed care program for Medicaid beneficiaries was maintaining plan participation.
For reasons unrelated to the Vermont waiver demonstration, Kaiser decided to exit the whole
New England market in June 1999, leaving Blue Cross Blue Shield as the only private Medicaid
managed care plan in the state as of the end of that year.
35

The state responded to the gap left by Kaiser by turning to its primary care case
management (PCCM) program to take over the management of Kaiser’s enrollees. This
program—PC Plus—reimburses most providers directly on a fee-for-service basis with an
additional $5 per member month going to primary care physicians for care management. The
state eventually decided not to renew its contract with BlueFirst because they were unable to
reach an agreement on capitation rates. Vermont then integrated the Blue Cross Blue Shield
enrollees into PC Plus, just as it had for the Kaiser enrollees. PC Plus now serves all the
traditional Medicaid and expansion population except for individuals whose primary care
physician is not in the PC Plus network.
Another principal factor contributing to lack of success in Vermont’s captiated Medicaid
managed care efforts was that there were few pre-managed care inefficiencies in the state’s
health care system. Historically, Vermont has had a lower a hospital use rate compared to the
national average (American Hospital Association 1994). And Vermont had below average
health care expenditures per capita (U.S. Bureau of Census 1993). Overlaying these is the lack
of competition among Vermont hospitals. Each community is served by a single hospital.
Almost all of the state’s 14 acute care hospitals are rural, and most are located 30 miles or more
from each other. Together, these environmental characteristics offered few cost savings to
managed care plans.
Key Lessons from Project Sites’ Implementation Experiences All four project states—Minnesota, Kentucky, New York, and Vermont—faced a range
of challenges in implementing their Medicaid managed care programs. These can be
encapsulated in the following considerations for states contemplating Medicaid managed care,
particularly when it involves implementing capitated health plans in rural areas.
36

Ensure that the area has a sufficient number of covered lives. A key question is whether
there are enough beneficiaries to support a capitated managed care program, especially in rural
areas. New York’s strategy (partially successful) was to set minimum population standards for
counties to shift to managed care. Minnesota’s successful experience “bundled” Medicaid
beneficiaries with other publicly-covered groups (e.g. enrollees in MinnesotaCare, the state’s
public insurance program for low-income individuals) and required plans that wanted to serve
public populations to serve all public programs in a county. Kentucky’s strategy (ultimately
unsuccessful except in one geographic area) was to divide the state into regions that combined
several counties and to allow only one plan to serve each region. Vermont’s approach (finally
abandoned) was to solicit plans whose catchment areas were statewide.
Be prepared to allow some flexibility for provider networks. In an effort to have a
sufficient numbers of providers (especially mental health providers) in rural areas and to meet
state access requirements, Minnesota plans allowed some relaxation of provider credentialing.
For similar reasons, Vermont relaxed standards for beneficiary travel time to providers. While
Vermont’s experience was too limited to determine whether the longer travel times was an
effective strategy, there was a mixed assessment among Minnesota site visit respondents about
the success of letting less credentialed providers serve Medicaid beneficiaries: On the one hand,
plans were able to bring in new providers to their networks, especially specialists, that rural
residents did not have ready access to. At the same time, though, plans were concerned about
potential quality of care issues.
Be realistic in assessing potential cost-savings. If the primary motivation is cost savings,
success will depend in large part on whether there are obvious places where resources can be cut
without compromising quality of care. States make several assessments to determine if there are
37

ways to cut costs. For example, they can determine if their program has a heavy reliance on
emergency room or hospital care? They can also ensure that the expansion area is large enough
to support plan and provider competition to drive down costs. These are all pertinent questions.
In the case of Vermont, for example, the system in place when the waiver demonstration was
implemented was already comparatively cost-effective with a particularly low hospital use rate.
Alternatively, Minnesota has been able to glean sufficient enough savings from moving to
managed care statewide to finance coverage for an additional 130,000 individuals each year.
Set feasible capitation rates. Developing sound capitation rates is another important
factor in making a successful managed care program. States need to consider and be prepared
for all the various costs (including direct medical costs as well as administrative and reporting
costs) that plans incur in serving Medicaid beneficiaries. Without sound rates, states run the risk
of having trouble getting plans to participate in the Medicaid managed care as in the case of
Vermont. States can use a range of strategies to help set practical capitation rates, including risk-
adjusted rates (which Minnesota ultimately adopted), adding stop loss provisions and developing
rate bands.
Allow for local differences and local input. In some areas, health care providers are core
community participants. States need to be prepared to consider trading off some of the gains of
capitation against the loss of key providers. They also need to be prepared to make operational
and programmatic changes to accommodate the range of local areas and their governments that
participate in the managed care initiative. Minnesota, for example, began its waiver program by
implementing the same program statewide. Eventually, though, the state began to allow counties
to customize its Medicaid managed care program to meet the needs of the local community. For
Minnesota, this flexibility proved successful as PMAP+ or CBP programs are operating
38

statewide. By contrast, a central feature of Kentucky’s waiver program was local control and
input and this model proved to be largely unsuccessful at least in this state. Our findings suggest
that state Medicaid programs need to critically assess their local communities to determine what
would work and, equally important, what would not.
39

CHAPTER IV
EFFECTS OF MANAGED CARE ON BENEFICIARIES AND HEALTH PLAN DECISIONS
States embrace Medicaid managed care for a number of reasons, as evidenced by the
1115 waiver plans of our project sites, reviewed in Chapter III. Many states view managed care
as a way to control Medicaid program costs while potentially improving beneficiary access to
quality care. Care management and coordination is hoped to provide beneficiaries with a medical
home where preventive care is promoted and primary care readily available. Having such care, in
turn, is hoped to improve beneficiary continuity of care—reducing the use of such costly services
as inpatient and emergency room care. Many states also hoped that managed care would provide
medically vulnerable and low-income populations with access to mainstream health care
providers as a way of eliminating a two-tiered system of care (where vulnerable populations are
in the lower tier). The hope is that commercial plans, with provider networks broader than
traditional Medicaid fee-for-service systems, will increase access to and quality of care for
beneficiaries by moving them into the same care settings as available to those with private
insurance.
This chapter discusses the extent to which Medicaid managed care has achieved these
goals. Effects on beneficiary access and quality of care and cost savings are reviewed for the
rural TANF population (adults and children in low-income households) in Minnesota and SSI
recipients (beneficiaries with disabilities). We also examine access to care under Medicaid for
rural beneficiaries. These discussions are followed by an analysis of changes in commercial plan
activity in the Medicaid market nationwide. The final section focuses on policy lessons learned.
40

Information for this chapter comes from several reports written under the project; for more
details on findings readers are referred to these reports. 18
Managed Care Impacts on TANF and Poverty-related Beneficiaries in Rural Areas The effects of capitated Medicaid managed care on TANF and poverty-related
beneficiaries (adults and children) reviewed here are based on a study of Minnesota’s PMAP
program. The experiences of rural beneficiaries under capitated managed care are compared with
the experiences of similar beneficiaries under fee-for-service. The analysis is based on data from
beneficiary surveys fielded in the state in 1998 and 2000. Changes in the health care access, use
and satisfaction for a set of counties where Medicaid remained under fee-for-service in both
years are compared with changes in the same outcome indicators for those counties where PMAP
was introduced between 1998 and 2000, controlling for individual and area characteristics
through multivariate regression.19 The comparison is restricted to rural counties (the focus of
Minnesota’s 1115 waiver application) to maximize comparability.
Access and Use. Our regression analysis shows that introduction of PMAP+ had virtually
no impact on beneficiaries’ access to and satisfaction with care for either adults or children
18 This chapter draws on a number of project reports and publications. The project publications include: Coughlin and Long (1999)“Impacts of Medicaid Managed Care on Adults: Evidence from Minnesota’s PMAP Program;” Long and Coughlin (2000) “Effects of Medicaid Managed Care on Children: Evidence from Minnesota’s PMAP Program;” Long, Coughlin, and King (2003) “Estimating the Impacts of Medicaid Managed Care in Rural Minnesota;” Long and Yemane (2004) “Commercial Plans in Medicaid Managed Care: Understanding Who Stays and Who Leaves in a Changing Market;” Coughlin and Long (2004) “Estimating the Impacts of Medicaid Managed Care on Medicaid SSI Beneficiaries: A National Study;” and Long, King and Coughlin (2004) “The Health Care Experiences of Rural Medicaid Beneficiaries.” The project publications include: Coughlin and Long (2000) “Effects of Medicaid Managed Care on Adults” Medical Care; Long and Coughlin (2001) “Impacts of Medicaid Managed Care on Children” Health Services Research; and Long, Coughlin, and King (2003)“Estimating the Impacts of Medicaid Managed Care in Rural Minnesota.” 19 For additional information on the regression models estimated as part of this analysis, see the report, Long, Coughlin, and King (2003) “Estimating the Impacts of Medicaid Managed Care in Rural Minnesota” or the article Long, Coughlin, and King (2004) “Capitated Medicaid Managed Care in a Rural Area: The Impact of Minnesota’s PMAP Program,” The Journal of Rural Health.
41

(Table IV.1).20 This may not be very surprising given case study findings that revealed many of
the physicians practicing in counties that switched to MMC continued participating in Medicaid
after the transition to managed care. The share of adults and children with a usual source of care
did not change. There were also no changes in the shares of adults and children linked to a
physician as their usual source of care, and no change in continuity of care. Consistent with the
lack of impact on access, there were no significant impacts on health care use for either adults or
children, no increase in the proportion with a doctor visit in the past year, and no decrease in
emergency room use. Unmet need remained high for both groups, as did the proportion rating
different aspects of their health care experiences as fair or poor.
The one notable exception is that parents in Medicaid families were significantly less
likely to find it easy to obtain prescription drugs for their children in managed care than in fee-
for-service counties. This is consistent with several changes that occurred under PMAP+. Some
pharmacies that had supplied prescription drugs to Medicaid beneficiaries under fee-for-service
were not included in managed care networks. In addition, some managed care plans required
beneficiaries to use mail-order pharmacies for refills, and a few plans introduced drug
formularies that restricted the specific drugs readily available under Medicaid. There was no
increase in unmet need for drugs among children, however, implying that children under
managed care were able to get the drugs they needed, even if obtaining them was more difficult.
Program Costs. State Medicaid staff maintained that program costs were lower under
managed care than they would have expected under fee-for-service. Even though Minnesota has
no hard data to support this finding, it is consistent with national findings from other studies.
20 An analysis that compared the experiences of rural beneficiaries living in Medicaid fee-for-service counties in 1998 with those living in PMAP counties in the same year yielded very similar findings.
42

Thus, the major achievement of Medicaid managed care in rural Minnesota may have been to
maintain the same access to and quality of care as under fee-for-service but at lower cost.
Two major caveats to the generalizability of these finding to other states should be noted
here. First, the cost savings attributed to managed care in the Minnesota study are limited to
Medicaid program costs. Case study evidence suggests that some of the services provided to
Minnesota beneficiaries may have been paid for by non-Medicaid sources (such as public health
clinics) after managed care was introduced. Second, most of the Minnesota physicians who had
participated in Medicaid continued to do so after the switch to managed care and were typically
paid higher fees under managed care than under fee-for-service--providing little incentive to
change practice patterns. The limited overall capacity of most rural health systems may have
further limited the potential for change under managed care.
Rural Health Care Experiences under Medicaid
Medicaid plays a vital role in rural America, yet little research exists on the health care
experiences of low-income rural adults. In large part this is because of data limitations. This
analysis of rural health care experiences under Medicaid is based on the 1997, 1999, and 2002
waves of the National Survey of America’s Families, covering adults ages 19 to 64. This
information was supplemented with health care provider supply data by county from the Area
Resource File, and Medicaid managed care program status by county from CMS managed care
summaries: National Summary of State Medicaid Managed Care Programs and Medicaid
Managed Care Enrollment Report, Medicaid Managed Care Summary (available at
www.cms.hhs.gov/medicaid/managedcare). For an individual on Medicaid through the
Supplemental Security Income (SSI) program (which provides assistance to low-income
43

individuals with serious disabilities), he or she is coded as residing in a MMC county if the
county operates any form of voluntary or mandatory MMC (e.g., capitated HMOs or primary
care case management) for physical health care for its SSI population.21 Similarly, for an
individual on Medicaid though other routes, he or she is coded as residing in a MMC county if
the county operates MMC for its Temporary Assistance for Needy Families (TANF) or poverty-
related populations. It is important to note that individuals residing in a MMC county may not
themselves be enrolled in MMC. Consequently, the comparisons reported here should not be
interpreted as comparing MMC enrollees to FFS Medicaid enrollees, rather the comparison
focuses on the environment in place in counties with MMC programs and FFS Medicaid
programs.
For the population as a whole, it is well known that rural residents fare worse than their
urban counterparts in securing access to care. Regardless of income, for example, the number of
poor rural residents getting care, especially primary care, is notably lower than for the population
as a whole and well below national targets. For Medicaid beneficiaries, however, we found rural-
urban differences turn out to be much smaller than they are for either low-income privately
insured individuals or those who are uninsured (Table IV.2). Further, when individual
characteristics and the local supply of providers are held constant through regression models, the
rural-urban differences among Medicaid beneficiaries totally disappear, unlike the case for those
with private insurance and the uninsured.22
The national-level analysis reported on here also suggests that Medicaid managed care
may hold promise for rural beneficiaries. When comparing rural beneficiaries living in counties
21 Managed care programs that are limited to mental health care services, dental care, family planning, long-term care, or other special services are not included in our measure of MMC. 22 For additional information on the regression models estimated as part of this analysis, see the report Long, King and Coughlin (2004) “The Health Care Experiences of Rural Medicaid Beneficiaries.”
44

under fee-for-for service Medicaid with their counterparts under managed care, we found that
beneficiaries under managed care were significantly more likely to have a usual source of care
and to have had a doctor visit in the past year (see Table IV.3).23
Managed Care Impacts on Medicaid SSI Beneficiaries Increasingly states are shifting disabled Medicaid beneficiaries from fee-for-service
Medicaid to Medicaid managed care. Our findings on the impacts of Medicaid managed care on
SSI beneficiaries are based on multivariate regression models estimated using five years of the
National Health Interview Survey (1997-2001).24 This is an annual cross-sectional survey that
provides detailed health and related data on individuals. Managed care status was determined by
county of residence (as described in the previous section), which allows differentiation by type
of managed care. We focus on capitated managed care programs and other forms of managed
care versus fee-for-service Medicaid.
Urban SSI Beneficiaries. Regardless of type of managed care, this analysis shows that
urban SSI beneficiaries under Medicaid managed care were significantly less likely than those
under fee-for-service to report any contact with health care providers in the past year, and also
less likely to report having had an office visit in the past year, after controlling for individual and
family characteristics, county and state characteristics, and year of the survey (Table IV.4).
Further, beneficiaries in counties with mandatory Medicaid HMO coverage were significantly
less likely to have had a specialist in the past 12 months than beneficiaries under weaker forms
of managed care or under fee-for-service. We find no effects of managed care on other
23 Unlike the estimates of the impacts of Medicaid managed care in Minnesota (above) and the estimates of the impacts on SSI beneficiaries (below), these comparisons should not be considered estimates of the impacts of Medicaid managed care since this analysis does not attempt to adjust for other factors (beyond Medicaid managed care) that could be driving the differences between the two groups of beneficiaries. 24 For additional information on the regression models estimated as part of this analysis, see Coughlin and Long (2004) “Estimating the Impacts of Medicaid Managed Care on Medicaid SSI Beneficiaries: A National Study.”
45

outcomes, including emergency room use: Urban SSI beneficiaries under all types of Medicaid
coverage continued to report high levels of emergency room use. Nearly half reported at least
one ER visit in the past year, and more than a quarter reported more than one visit. This evidence
suggests that decision-makers and consumers need to be cautious in extending managed care to
this population, at least in urban areas.
Rural SSI Beneficiaries. SSI beneficiaries living in rural areas appear to fare better under
managed care than their urban counterparts (Table IV.5). Rural SSI beneficiaries under managed
care were more likely to report contact with physician extenders such as nurse practitioners in
the past year. While we observed no significant effects of mandatory HMO programs for this
population, we find that under other types of Medicaid managed care rural beneficiaries were
more likely to have a visit to a general physician and a visit to a physician extender in the past
year.
Commercial Plan Choices in a Changing Medicaid Market If states are to keep commercial plans in the Medicaid managed care market, it is
important for them to understand the factors that influence such plans’ decisions to continue in or
exit that market. This is of interest because the share of commercial plans participating in
Medicaid has been declining since the mid-1990s (Felt-Lisk 1999). The findings discussed below
are based on two years of InterStudy data on county Medicaid enrollment levels. Data for 2000
allow us to identify plans participating in a given county on January 1, 2000. Data for 2001 allow
us to identify plans that were no longer participating in that county a year later.
Potentially Important Factors. Figure IV.1 illustrates the factors that can be expected to
influence commercial plan decisions to participate in Medicaid managed care. The underlying
assumption is that a plan will continue to participate so long as the financial returns from
46

participation allow the plan to meet its goals—which may be profit maximization, enrollment
maximization, market share growth, market diversification, or some other objective. Whatever
the objective, it obviously needs to be pursued within the constraint of at least breaking even, or
the plan will fail financially.
Plan characteristics (top left-hand box) include structure, size, ownership, and market
position. Plans that are more closely tied to the local health care market and plans that have an
organizational mission to serve vulnerable populations, for example, can be expected to be more
likely to continue participating in Medicaid, other things equal. Also relevant is the extent to
which a plan has invested in the Medicaid market and its share of Medicaid enrollment. Higher
investment and a greater share of Medicaid’s enrollment should make it less likely that a plan
will leave Medicaid. Medicaid policies are also likely to be important (middle left-hand box).
Higher capitation rates, for example, will make Medicaid participation more profitable. Local
market characteristics (bottom left-hand box) that can be expected to influence plan decisions
include the relative price of Medicaid managed care compared with the returns to alternative
insurance arrangements—such as Medicare or private insurance. Also important are the degree
of competition in the local managed care market and in the local provider market. More
competition makes the market less attractive for a given plan.
Findings. Multivariate regression analysis allows estimation of the effect of a particular
factor on the probability of exiting from Medicaid managed care, controlling for the impact of
other factors (Table IV.6).25 Plan characteristics, as expected, are significant predictors of plan
decisions, other things equal. Plans with a large share of the local Medicaid managed care
25 Since the dependent variable in the model is a 0/1 variable, where an exit=1, we estimate a logit model. For additional information on the regression models estimated as part of this analysis, see Long and Yemane (2004) “Commercial Plans in Medicaid Managed Care: Understanding Who Stays and Who Leaves in a Changing Market.”
47

market, for example, and plans serving Medicaid enrollees in a greater share of the state are less
likely to quit the Medicaid market. Provider-sponsored plans and non-profit plans are also less
likely to leave the Medicaid market.
Medicaid policies also have a major influence on plan decisions, according to a majority
of the indicators measured. Higher capitation rates reduce the likelihood that a plan will exit
Medicaid, for example. And different carve-outs have different effects (with mental health carve-
outs reducing the probability of exit and pharmacy carve-outs increasing it).
Local market characteristics have fewer effects on plan decisions. Exits are more likely in
less populated counties. However, plan exits are less likely in counties where private capitation
rates are high relative to Medicaid rates—a finding suggesting that higher rates in the private
market may actually be subsidizing the costs of care in the Medicaid market, thus helping plans
to continue in Medicaid managed care.
Lessons Learned As states consider moving their Medicaid programs towards managed care, several of the
findings reported here can help them maximize the potential that their managed care approach
will improve beneficiary access to care and to mainstream health plans.
Beneficiary Impacts. The Minnesota experience reported here applies to Medicaid
managed care for TANF and TANF-related adults and children living in rural areas. Findings
suggest that for this population, managed care may not have much effect on improving access to
care or care delivery patterns compared with the situation under Medicaid fee-for-service.
Medicaid officials in that state believe, however, that the managed care system did increase the
cost-effectiveness of the care delivered to its rural beneficiaries.
48

Our national examination of access to care for SSI beneficiaries suggests that Medicaid
managed care improves care for rural Medicaid beneficiaries with disabilities. This finding does
not carry over to urban areas, however, suggesting that states should be cautious about extending
managed care coverage to disabled Medicaid beneficiaries in urban areas. Access to care for this
population is typically problematic under fee-for-service. And characteristics of the urban SSI
population and/or the health care system in low-income metropolitan areas may make it harder
for managed care to make improvements than in the more sparsely population rural areas. More
research is needed to understand what role differences in beneficiary characteristics, managed
care models, and local health care markets may play in the differences in the impacts of
Medicaid managed care in urban and rural areas for SSI beneficiaries.
Overall, the findings from the studies summarized in this chapter suggest that the impacts
of Medicaid managed care are not homogenous, rather the effects vary by Medicaid subgroup,
geographic area and type of managed care. Medicaid policymakers should be mindful of these
differences when developing managed care program policies. More research is needed to better
understand the implications—including health outcomes—of Medicaid managed care and the
factors behind the differences reported here.
Impacts on Health Plan Participation Decisions. Our analysis of factors influencing
health plan decisions about whether or not to participate in the Medicaid program suggests that
many of these factors are within the control of state policymakers and program administrators.
Most importantly, states need to establish sound capitation rates that reflect the true costs of
serving the Medicaid population enrolled in managed care, as well as to ensure that service
carve-outs and similar policies are not interfering with the ability of plans to manage care in a
cost-effective way. In addition, states should work to ensure that plans are able to enroll an
49

adequate number of Medicaid enrollees to operate effectively. This could be achieved by limiting
the number of plans that are awarded contracts within a county and/or by contracting for care for
groups of counties within the state.
50
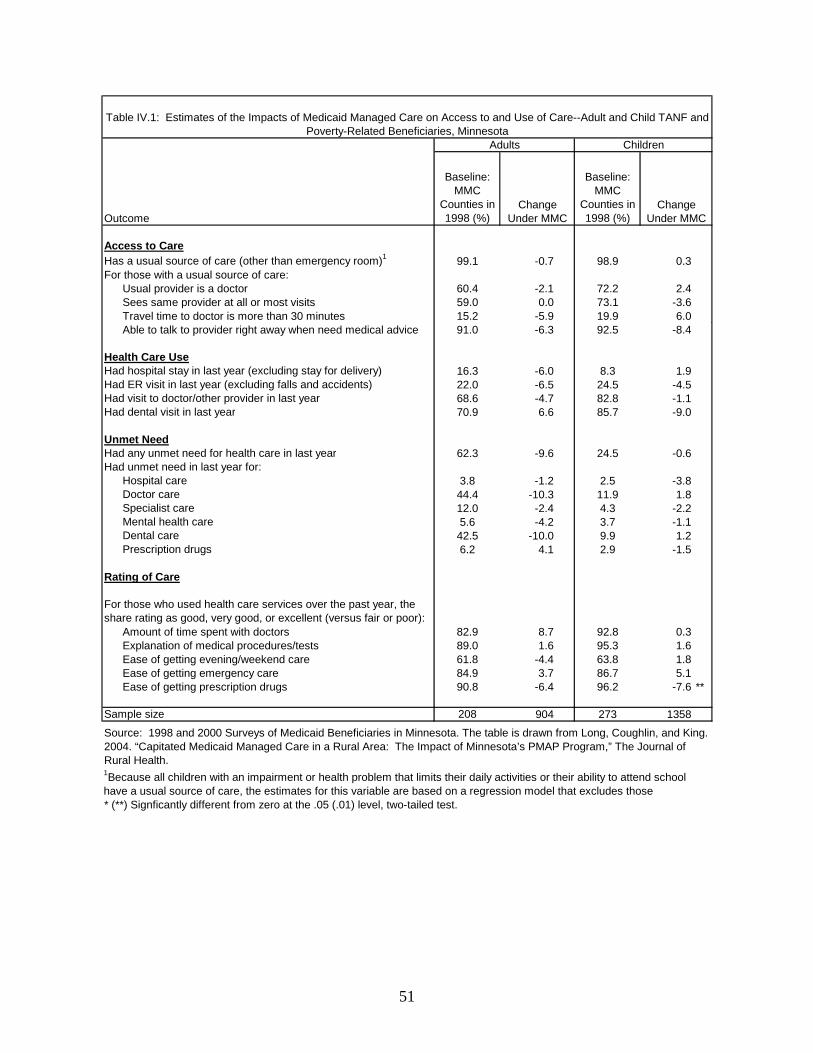
Baseline: MMC
Counties in 1998 (%)
Baseline: MMC
Counties in 1998 (%)
Access to CareHas a usual source of care (other than emergency room)1 99.1 -0.7 98.9 0.3For those with a usual source of care:
Usual provider is a doctor 60.4 -2.1 72.2 2.4Sees same provider at all or most visits 59.0 0.0 73.1 -3.6Travel time to doctor is more than 30 minutes 15.2 -5.9 19.9 6.0Able to talk to provider right away when need medical advice 91.0 -6.3 92.5 -8.4
Health Care UseHad hospital stay in last year (excluding stay for delivery) 16.3 -6.0 8.3 1.9Had ER visit in last year (excluding falls and accidents) 22.0 -6.5 24.5 -4.5Had visit to doctor/other provider in last year 68.6 -4.7 82.8 -1.1Had dental visit in last year 70.9 6.6 85.7 -9.0
Unmet NeedHad any unmet need for health care in last year 62.3 -9.6 24.5 -0.6Had unmet need in last year for:
Hospital care 3.8 -1.2 2.5 -3.8Doctor care 44.4 -10.3 11.9 1.8Specialist care 12.0 -2.4 4.3 -2.2Mental health care 5.6 -4.2 3.7 -1.1Dental care 42.5 -10.0 9.9 1.2Prescription drugs 6.2 4.1 2.9 -1.5
Rating of Care
For those who used health care services over the past year, the share rating as good, very good, or excellent (versus fair or poor):
Amount of time spent with doctors 82.9 8.7 92.8 0.3Explanation of medical procedures/tests 89.0 1.6 95.3 1.6Ease of getting evening/weekend care 61.8 -4.4 63.8 1.8Ease of getting emergency care 84.9 3.7 86.7 5.1Ease of getting prescription drugs 90.8 -6.4 96.2 -7.6 **
Sample size 208 904 273 1358
1Because all children with an impairment or health problem that limits their daily activities or their ability to attend school have a usual source of care, the estimates for this variable are based on a regression model that excludes those
Source: 1998 and 2000 Surveys of Medicaid Beneficiaries in Minnesota. The table is drawn from Long, Coughlin, and King. 2004. “Capitated Medicaid Managed Care in a Rural Area: The Impact of Minnesota’s PMAP Program,” The Journal of Rural Health.
* (**) Signficantly different from zero at the .05 (.01) level, two-tailed test.
Table IV.1: Estimates of the Impacts of Medicaid Managed Care on Access to and Use of Care--Adult and Child TANF and Poverty-Related Beneficiaries, Minnesota
Adults
Change Under MMC
Children
Change Under MMCOutcome
51
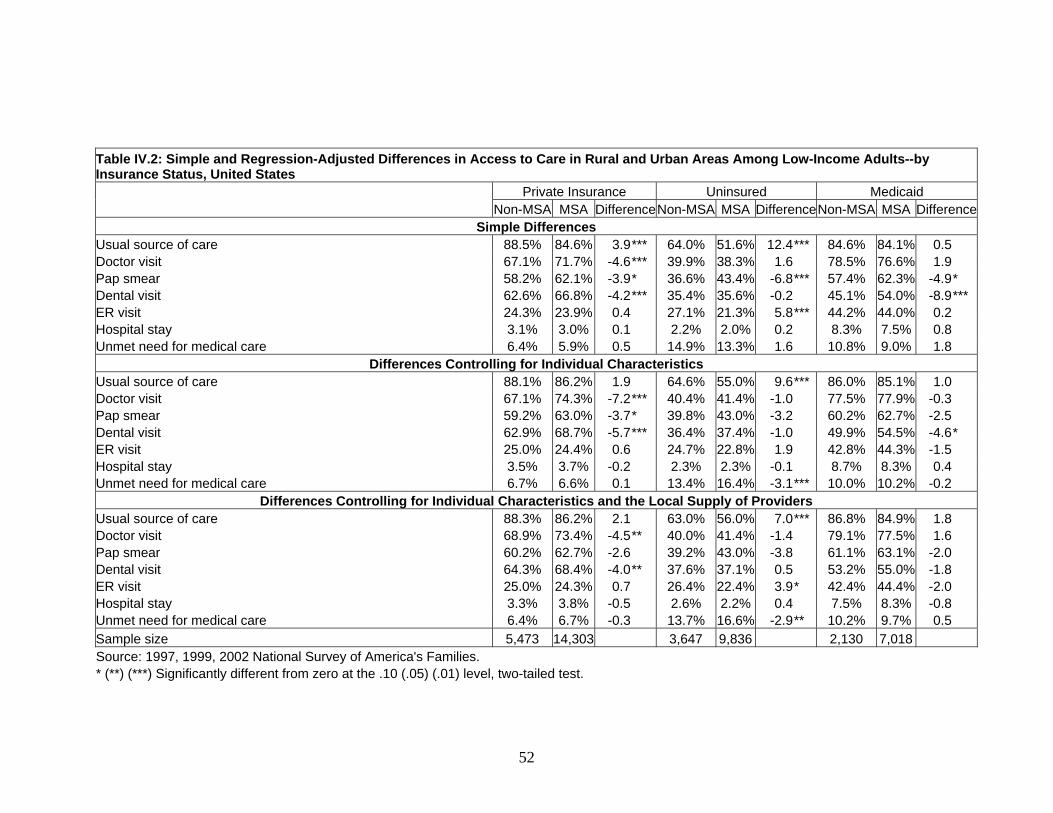
Table IV.2: Simple and Regression-Adjusted Differences in Access to Care in Rural and Urban Areas Among Low-Income Adults--by Insurance Status, United States
Private Insurance Uninsured Medicaid Non-MSA MSA DifferenceNon-MSA MSA DifferenceNon-MSA MSA Difference
Simple Differences Usual source of care 88.5% 84.6% 3.9*** 64.0% 51.6% 12.4*** 84.6% 84.1% 0.5 Doctor visit 67.1% 71.7% -4.6*** 39.9% 38.3% 1.6 78.5% 76.6% 1.9 Pap smear 58.2% 62.1% -3.9* 36.6% 43.4% -6.8*** 57.4% 62.3% -4.9* Dental visit 62.6% 66.8% -4.2*** 35.4% 35.6% -0.2 45.1% 54.0% -8.9*** ER visit 24.3% 23.9% 0.4 27.1% 21.3% 5.8*** 44.2% 44.0% 0.2 Hospital stay 3.1% 3.0% 0.1 2.2% 2.0% 0.2 8.3% 7.5% 0.8 Unmet need for medical care 6.4% 5.9% 0.5 14.9% 13.3% 1.6 10.8% 9.0% 1.8
Differences Controlling for Individual Characteristics Usual source of care 88.1% 86.2% 1.9 64.6% 55.0% 9.6*** 86.0% 85.1% 1.0 Doctor visit 67.1% 74.3% -7.2*** 40.4% 41.4% -1.0 77.5% 77.9% -0.3 Pap smear 59.2% 63.0% -3.7* 39.8% 43.0% -3.2 60.2% 62.7% -2.5 Dental visit 62.9% 68.7% -5.7*** 36.4% 37.4% -1.0 49.9% 54.5% -4.6* ER visit 25.0% 24.4% 0.6 24.7% 22.8% 1.9 42.8% 44.3% -1.5 Hospital stay 3.5% 3.7% -0.2 2.3% 2.3% -0.1 8.7% 8.3% 0.4 Unmet need for medical care 6.7% 6.6% 0.1 13.4% 16.4% -3.1*** 10.0% 10.2% -0.2
Differences Controlling for Individual Characteristics and the Local Supply of Providers Usual source of care 88.3% 86.2% 2.1 63.0% 56.0% 7.0*** 86.8% 84.9% 1.8 Doctor visit 68.9% 73.4% -4.5** 40.0% 41.4% -1.4 79.1% 77.5% 1.6 Pap smear 60.2% 62.7% -2.6 39.2% 43.0% -3.8 61.1% 63.1% -2.0 Dental visit 64.3% 68.4% -4.0** 37.6% 37.1% 0.5 53.2% 55.0% -1.8 ER visit 25.0% 24.3% 0.7 26.4% 22.4% 3.9* 42.4% 44.4% -2.0 Hospital stay 3.3% 3.8% -0.5 2.6% 2.2% 0.4 7.5% 8.3% -0.8 Unmet need for medical care 6.4% 6.7% -0.3 13.7% 16.6% -2.9** 10.2% 9.7% 0.5 Sample size 5,473 14,303 3,647 9,836 2,130 7,018 Source: 1997, 1999, 2002 National Survey of America's Families. * (**) (***) Significantly different from zero at the .10 (.05) (.01) level, two-tailed test.
52

Table IV.3: Access to Care in Rural Areas for Adult Medicaid Enrollees--Managed Care versus Fee-for-Service
Outcome Measure
Living in County with
Medicaid Managed Care
Living in County with
FFS Medicaid Difference Usual source of care 89.6% 80.2% 9.4*** Doctor visit 81.9% 73.8% 8.0** Pap smear 57.9% 58.8% -0.9 Dental visit 47.6% 45.1% 2.5 ER visit 41.5% 47.3% -5.8 Hospital stay 9.3% 6.5% 2.8 Unmet need for medical care 10.1% 10.3% -0.2 Sample size 1,235 895
Note: Regression estimates, adjusted to control for individual characteristics and local provider supply. Source: 1997, 1999, 2002 National Survey of America's Families. * (**) (***) Significantly different from zero at the .10 (.05) (.01) level, two-tailed test.
53

Has usual source of care other than the ER 91.2 0.5 2.8 -0.1 1606
Over the last 12 monthsAny contact with any health care provider 96.4 -3.6 ** -4.7 ** -3.4 ** 1589Any office visit to any provider 94.1 -5.2 *** -6.5 *** -4.9 ** 1565
Over the last 12 months, contact withPhysician 48.4 5.6 5.5 5.6 1573Specialist 42.3 -3.8 -8.8 * -2.7 1595Nurse practioner, physician's assistant or midwife 10.4 3.4 2.2 3.7 1595
Hospital stay in last 12 months 20.5 2.8 -0.5 3.5 1615
ER visit in last 12 months 46.2 -4.7 -1.4 -5.4 1620 More than 1 ER visit in last 12 months 26.6 -2.9 3.5 -4.3 1620
Flu shot in last 12 months 34.5 -6.1 -10.3 -5.2 1583
Model 2
Outcome
Source: 1997-2001 National Health Interview Survey* (**) (***) Significantly different from zero at the .10 (.05) (.01) level, two-tailed test.
Model 1
Sample Size
Change Under MMC
Change Under
Mandatory HMO
Assuming All Under FFS (%)
Change Under
Other MMC
Table IV.4: Estimates of the Effect of Medicaid Managed Care--Adult SSI Beneficiaries in Urban Areas, United States
54

Has usual source of care other than the ER 90.8 -0.3 1.0 -0.7 513
Over the last 12 monthsAny contact with any health care provider 93.5 1.6 3.8 0.7 511Any office visit to any provider 91.4 1.3 -0.1 1.8 508
Over the last 12 months, contact withPhysician 39.0 7.1 -2.9 11.3 * 513Specialist 34.2 0.3 6.3 -2.4 517Nurse practioner, physician's assistant or midwife 10.0 9.3 ** 9.7 9.1 ** 513
Hospital stay in last 12 months 25.1 3.0 2.3 3.3 517
ER visit in last 12 months 49.9 -7.8 -7.7 -7.9 519 More than 1 ER visit in last 12 months 24.1 3.4 6.8 1.8 519
Flu shot in last 12 months 28.3 -4.2 3.9 -7.9 511
Model 2
Outcome
Source: 1997-2001 National Health Interview Survey* (**) (***) Significantly different from zero at the .10 (.05) (.01) level, two-tailed test.
Model 1
Sample Size
Change Under MMC
Change Under
Mandatory HMO
Assuming All Under FFS (%)
Change Under
Other MMC
Table IV.5: Estimates of the Effect of Medicaid Managed Care--Adult SSI Beneficiaries in Rural Areas, United States
55
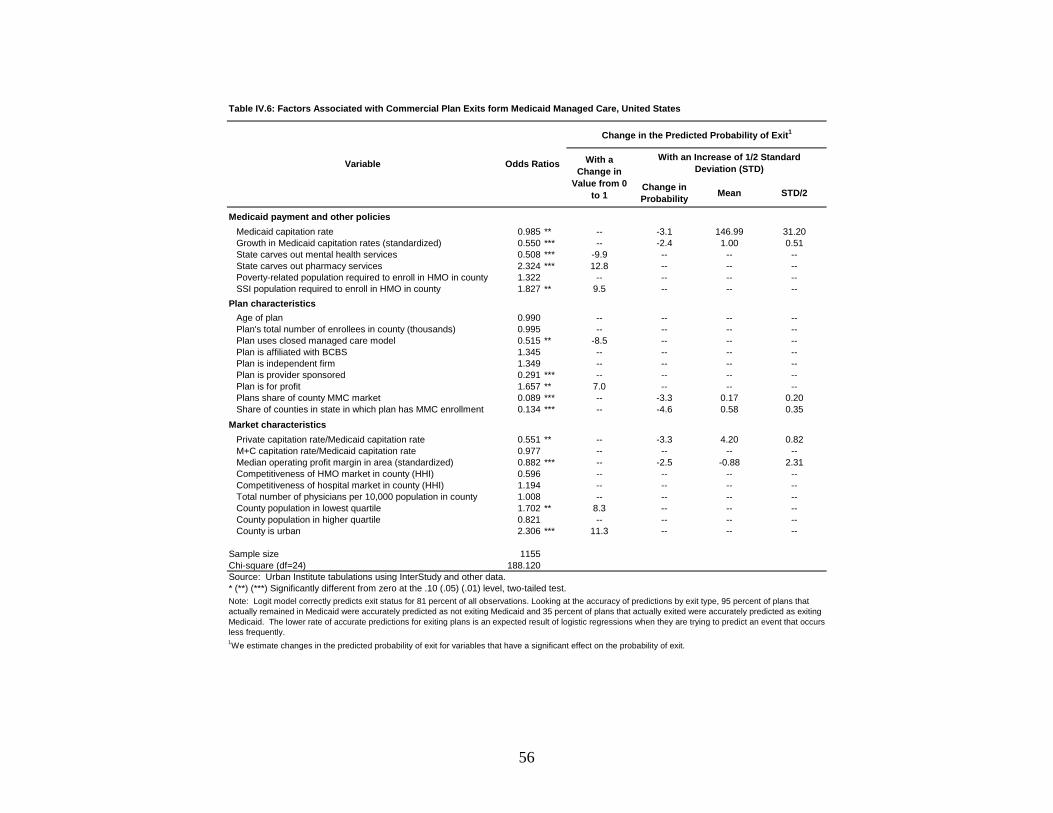
Change in Probability Mean STD/2
Medicaid payment and other policiesMedicaid capitation rate 0.985 ** -- -3.1 146.99 31.20Growth in Medicaid capitation rates (standardized) 0.550 *** -- -2.4 1.00 0.51State carves out mental health services 0.508 *** -9.9 -- -- --State carves out pharmacy services 2.324 *** 12.8 -- -- --Poverty-related population required to enroll in HMO in county 1.322 -- -- -- --SSI population required to enroll in HMO in county 1.827 ** 9.5 -- -- --
Plan characteristicsAge of plan 0.990 -- -- -- --Plan's total number of enrollees in county (thousands) 0.995 -- -- -- --Plan uses closed managed care model 0.515 ** -8.5 -- -- --Plan is affiliated with BCBS 1.345 -- -- -- --Plan is independent firm 1.349 -- -- -- --Plan is provider sponsored 0.291 *** -- -- -- --Plan is for profit 1.657 ** 7.0 -- -- --Plans share of county MMC market 0.089 *** -- -3.3 0.17 0.20Share of counties in state in which plan has MMC enrollment 0.134 *** -- -4.6 0.58 0.35
Market characteristicsPrivate capitation rate/Medicaid capitation rate 0.551 ** -- -3.3 4.20 0.82M+C capitation rate/Medicaid capitation rate 0.977 -- -- -- --Median operating profit margin in area (standardized) 0.882 *** -- -2.5 -0.88 2.31Competitiveness of HMO market in county (HHI) 0.596 -- -- -- --Competitiveness of hospital market in county (HHI) 1.194 -- -- -- --Total number of physicians per 10,000 population in county 1.008 -- -- -- --County population in lowest quartile 1.702 ** 8.3 -- -- --County population in higher quartile 0.821 -- -- -- --County is urban 2.306 *** 11.3 -- -- --
Sample size 1155Chi-square (df=24) 188.120
1We estimate changes in the predicted probability of exit for variables that have a significant effect on the probability of exit.
Note: Logit model correctly predicts exit status for 81 percent of all observations. Looking at the accuracy of predictions by exit type, 95 percent of plans that actually remained in Medicaid were accurately predicted as not exiting Medicaid and 35 percent of plans that actually exited were accurately predicted as exiting Medicaid. The lower rate of accurate predictions for exiting plans is an expected result of logistic regressions when they are trying to predict an event that occurs less frequently.
Source: Urban Institute tabulations using InterStudy and other data.* (**) (***) Significantly different from zero at the .10 (.05) (.01) level, two-tailed test.
Table IV.6: Factors Associated with Commercial Plan Exits form Medicaid Managed Care, United States
With a Change in
Value from 0 to 1
Odds RatiosVariable
Change in the Predicted Probability of Exit1
With an Increase of 1/2 Standard Deviation (STD)
56
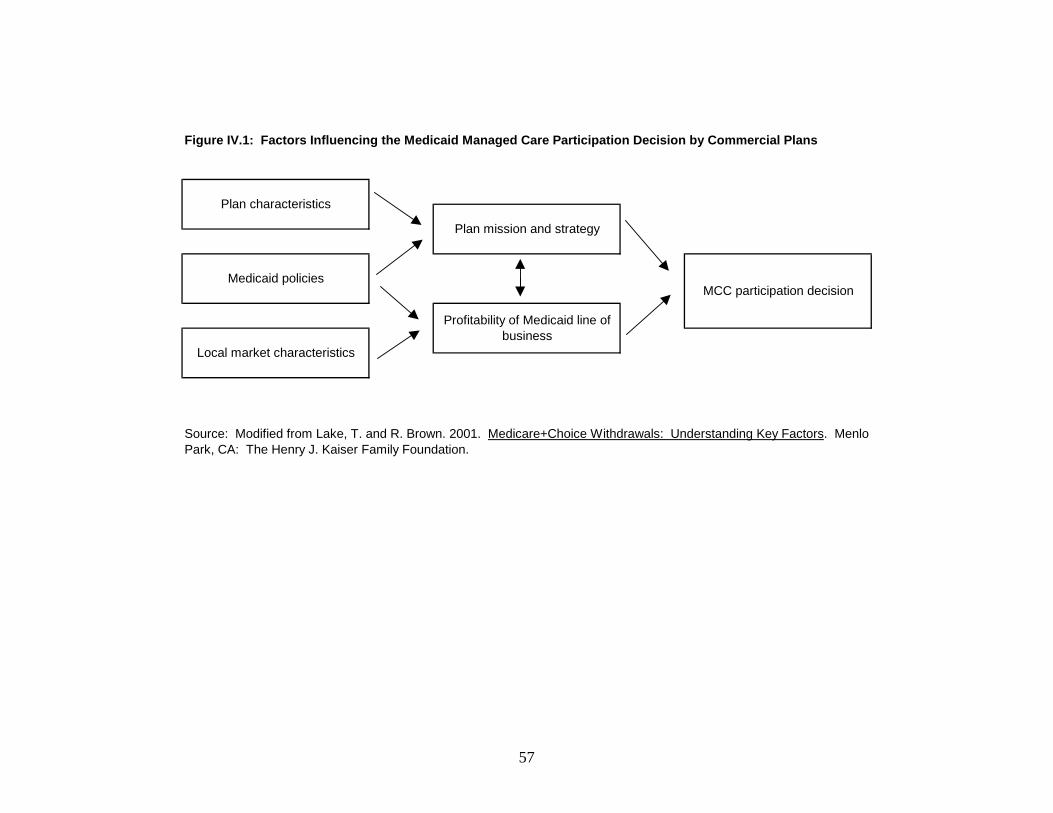
Source: Modified from Lake, T. and R. Brown. 2001. Medicare+Choice Withdrawals: Understanding Key Factors. Menlo Park, CA: The Henry J. Kaiser Family Foundation.
MCC participation decision
Local market characteristics
Figure IV.1: Factors Influencing the Medicaid Managed Care Participation Decision by Commercial Plans
Plan mission and strategy
Plan characteristics
Medicaid policies
Profitability of Medicaid line of business
57

CHAPTER V
RECONFIGURING THE SAFETY NET: THE EXPERIENCE OF LOS ANGELES COUNTY
Los Angeles County, with 9.8 million people and covering over 4000 square miles, has
the largest county population in the nation and covers more than 13 times the area covered by the
five counties that make up New York City. Over one-fifth of the county’s population lives
below the poverty line, one-third of its non-elderly population lacks health insurance, and
another fifth is covered by California’s Medicaid program (Medi-Cal). The county’s state-
mandated burden of serving as the health care provider of last resort, therefore, is massive (Long
et al. 1999; Zuckerman and Lutzky 2001).
By 1995—shortly before the county’s 1115 waiver application was submitted and
approved--years of shrinking revenue streams, health service demand increases, and the cost of
maintaining the county’s deteriorating health system infrastructure had culminated in a funding
crisis for the Los Angeles County Department of Health Services (LACDHS). This crisis was so
severe that the deficit for the department had grown to over 28 percent of its operating budget,
accounting for about half of the total county deficit. The budget-cutting proposals that were the
inevitable result of this state of affairs varied in detail, but all involved closing parts of the
county’s extensive network of hospitals and clinics—which provided a large share of the health
care for the county’s uninsured and Medicaid population.
The county was awarded a five-year financial relief package of about $1.2 billion in
federal Medicaid funding, in return for which it agreed to fundamentally restructure the
LACDHS and the delivery of health care to the indigent. This chapter reviews LAC experiences
58

under its 1995-2000 1115 waiver, based on two case-study site visits—one in 1997, the second
in 2001.26
Waiver Outcomes
The waiver provisions focused on four major objectives: (1) to improve access to county-
funded ambulatory care, (2) to make hospital care more efficient, in part by reducing beds in
county hospitals, (3) to foster cultural change, and (4) to bring financial stability to the
LACDHS. Progress has been made on the first three fronts, but these restructuring efforts had
not achieved the fourth objective by the end of the first waiver period in 2000. (Because of
continuing financial instability, the waiver was renewed for an additional five years).
Restructuring Ambulatory Care
One of the primary goals of the waiver was to rebuild and expand the county’s indigent
ambulatory care system. The three major components of this effort were (a) a public-private
partnership program (PPP), which the planners hoped would lead to a 50 percent expansion in
the number of ambulatory care visits through extending county-funded indigent care provision to
private facilities, (b) better integration of the system of care, and (c) cultural change.
The PPP Program. These partnerships were universally considered one of the big
successes of the waiver program. Over the waiver period LACDHS contracted with more than
81 private partners to deliver primary care at over 100 sites. The initial act in the PPP program
was to offer private providers the opportunity to take over six public clinics slated for closure in
26 This chapter draws on two project reports and one project publication. The project reports are: Long, et al. (1999) “A Case Study of the Medicaid Demonstration Project for Los Angeles County;” and Zuckerman and Lutzky (2001) “The Medicaid Demonstration Project in Los Angeles County, 1995-2000: Progress, but Room for Improvement.” The project publication is: Long and Zuckerman (1998) “Urban Health Care in Transition: Challenges Facing Los Angeles County.” Health Care Financing Review.
59

1995. Three took up the offer, taking responsibility for two public clinics each. To fully
appreciate the importance of the change brought about by the PPP, one needs to remember that
there was little or no coordination between the public and private providers before the waiver.
Beyond increasing ambulatory care access, the program seems to have improved communication
across both public and private safety net providers—giving, among other benefits, more
flexibility to the LACDHS to contract, expand, or shift the distribution of providers depending
on perceived need.
These successes have led to only modest expansion in the number of ambulatory care
visits, however—in the neighborhood of 8-10 percent as of 2000, rather than the 50 percent
planned. Constraints included problems with reimbursement levels and the method of
establishing total payment (which may result in clinics providing greater access to visits being
penalized), and inadequate monitoring, in the early waiver years at least, of provider
performance.
Integrating the System of Care. Key to this effort was the transformation of the county’s
fragmented and hospital-based system of care into a linked system of community-based primary,
specialty, and preventive care. Initiatives included relocating some hospital-based outpatient
specialty care into the county’s clinics and providing both primary and public health services in
the same clinics.
Creation of a system of referral centers is cited as the major contribution of the
integration effort. Prior to the waiver, all access to specialty care for the county’s indigent came
through the emergency room, regardless of whether the referring primary care physician was at a
public health center or private clinic. To reduce emergency room use, LACDHS created referral
centers at each of its five acute care hospitals, as a gateway for primary care providers to access
60

specialty and inpatient services in the network. The primary care provider submits a request to a
referral center, which, if it approves the request, schedules an appointment date and sends a
notification card to the patient. These referral centers are viewed as a significant step toward
improving specialty care, and the flow of patients and information between primary and specialty
care providers.
Increasing the Efficiency of Hospital-Based Care
Increased efficiency of hospital-based care was to be achieved by (a) reducing inpatients
beds and admissions, and (b) hospital “reengineering”.
Reducing Hospital Use. Waiver plans envisioned reducing the number of hospital beds
over the waiver period by nearly 40 percent. This was to be achieved by downsizing the
county’s major medical center and privatizing two of its other hospitals. Privatization did not
materialize, however, due to a lack of interest among potential buyers and strong resistance by
unions and some LAC Board of Supervisor members. Downsizing of the major medical center
was achieved, however, with budgeted beds reduced by 29 percent, inpatient days by 27 percent,
and average length of stay from 6.4 to 6.1 days during the waiver period. These reductions were
accompanied by a drop in full-time positions of about 16 percent.
Hospital Reengineering. This effort focused on four major areas: (a) more prudent
purchasing of supplies, equipment, and pharmaceuticals, (b) standardizing, centralizing, and
outsourcing services; (c) improving clinical efficiency and service use by Clinical Resource
Management (CRM); and (d) redesigning health services administration. There were over 450
individual reengineering projects over the waiver period, with initial projections of cost savings
of over $250 million. These efforts produced estimated cost savings of only about $110 million.
61

The greatest share of the savings (over 20 percent) came from purchasing improvements and
participation in a public health service drug discount program.
Does the fact that savings were less than expected mean that reengineering was not a
success? Not necessarily. After a slow start, the savings grew more in line with the original
projections. But even this level of savings was unlikely to guarantee future financial viability for
LACDHS, particularly given the fact that county auditors were not certain that all the areas of
savings could be maintained into the future. With respect to CRM, although savings were
uncertain (given the likelihood of substantial losses in federal and state revenues because of the
decline in inpatient days, discussed further below), it was generally agreed to be a significant
step toward improving management and quality of care, because it moved the focus of the
system to outcome-based measures and quality-of-care standards for inpatient and outpatient
services alike.
Cultural Change
Although assessments of waiver implementation varied, there was universal agreement
that the county was better off as a result of the waiver because it had caused a cultural change
among stakeholders in the indigent health care system. Examples given included more focus on
meeting patient needs, becoming more culturally and linguistically sensitive, and redesigning
processes to do more with the same or fewer resources. The waiver experience also led to
recognition that other county departments may need reorganization, particularly human resources
and other support departments.
62
Bringing Financial Stability
The financial package that accompanied the waiver included some components that were
clearly one-time solutions to the crisis. But others were included to foster longer term system
change with an eye to restoring its financial stability. The one-time components included a
supplemental Medi-Cal payment, an increase in the county’s Medicaid DSH payments, and a
Public Health Service grant. The longer term relief effort included making the county eligible to
receive a federal match for indigent patient services in non-hospital settings; allowing LACDHS
to claim DSH funding for private hospitals as uncompensated care expenses when computing
DSH payment caps; and a supplemental project pool (SPP), funded equally from federal and
local funds, that allowed the county to receive federal matching funds for care to indigent
patients (whether inside or outside the hospital), once the number of clinic visits had reached a
certain level.
Of the longer term relief provisions, only the indigent care match actually provided a
clear incentive to move indigent care out of the hospital. The DSH provision provided the
opposite incentive, with revenues slated to fall if the county was successful in moving patients
out of the hospital (dubbed the “catch-22 effect” by some case study respondents). On paper, the
SPP provided some incentive to move patient care out of the hospital. But because it was a lump-
sum payment, and because the number of clinic visits already exceeded the threshold level to
qualify for the full payment, the intended incentive was in fact nonexistent.
Lessons Learned The major lesson to be learned from the waiver experience of Los Angeles County is that
substantial financial relief and a serious restructuring effort is unlikely to be enough to restore
63

financial viability to a Medicaid system on the brink of collapse. Waiver efforts did succeed in
expanding geographic access to non-hospital indigent care; cutting the number of inpatient beds,
inpatient days, and average length of stay; and implementing a hospital reengineering system that
produced some savings through better purchasing of supplies, equipment, and prescription drugs.
Observers also agreed that the culture of indigent care provision had improved, bringing more
attention to patient care quality and communication among providers throughout the system.
But the large number of uninsured in the county has not been reduced and the obligation
to meet their health care needs remains. The new waiver provides about $1.6 billion over five
years. The federal government is providing $900 million in funding over the 2001-2005 period,
scheduled to phase out over that period. The state is providing an additional $300 million in
combined state and federal matching funds through cost-based reimbursements to all county
clinics and private clinics with county contracts for Medi-Cal ambulatory care. The county has
committed $400 million. Whether or not actions under the new waiver will stimulate enough
additional financing and operational reforms in the LACDHS system to make it financially stable
remains an open question. But if past is prologue, it is hard to be optimistic.
64

CHAPTER VI
EVALUATION OF THE VERMONT PHARMACY ASSISTANCE PROGRAMS FOR LOW-INCOME MEDICARE BENEFICIARIES27
This chapter summarizes two sets of analyses to evaluate Vermont’s state pharmacy
assistance programs for low-income disabled and elderly beneficiaries. Two of Vermont’s three
publicly subsidized drug programs for low-income elderly and disabled beneficiaries were
incorporated into the state’s 1115 Medicaid waiver and are, therefore, eligible for federal
matching dollars. The first study was based on a longitudinal analysis of medical (Medicare) and
pharmacy (Medicaid) claims data and is publicly available on the CMS Website. The second
study was based primarily on information collected from a survey of enrolled and eligible or
near-eligible but nonenrolled beneficiaries in Vermont conducted between March and June 2004.
A more complete presentation of study findings is available in the full report. 28
The two sets of analyses provided an opportunity to consider the implications of
enrollment in a voluntary publicly subsidized prescription drug program for the soon-to-be
implemented Part D Medicare drug benefit. The findings from these analyses only apply to low-
income, aged Medicare beneficiaries who are not dually eligible for Medicaid and, therefore, are
not generalizable to the entire Medicare population. However, the low-income population
covered by Vermont’s pharmacy assistance programs is the group most likely to lack
prescription drug coverage and to have difficulty paying for medications. As such, they are a
key target of the Part D program. Furthermore, a program adopted by a single state, particularly 27 This chapter was written by Boyd Gilman, Barbara Gage, Susan Haber, Sonja Hoover and Jeremy Green. 28 Gilman, BH, B Gage and JB Mitchell. “Evaluation of Vermont’s Pharmacy Assistance Programs for Low-Income Medicare Beneficiaries: First Round Evaluation Report,” Contract No. 500-95-0040, Centers for Medicare and Medicaid Services, February 28, 2003. Gilman, B, B Gage, S Haber, S Hoover and J Greene. “Evaluation of the Vermont Pharmacy Assistance Programs for Low-Income Medicare Beneficiaries: Findings from the Enrollee and Nonenrollee Surveys,” Contract No. 500-95-0040, Centers for Medicare and Medicaid Services, September 24, 2004.
65

a small one such as Vermont, does not have the potential of a program like Medicare Part D to
exert profound influences on the health care market. Nonetheless, the experience in Vermont
may provide important lessons for Medicare as it moves toward implementing the Part D benefit.
The three principal objectives of both studies were:
• to identify the primary determinants of enrollment, including an examination of the
evidence of adverse selection and crowd out;
• to assess the impact of enrollment on the use and cost of drugs, as well as unmet drug
needs; and
• to analyze the impact of enrollment on the use and cost of non-drug medical services.
In both studies, we compared the major outcomes between enrollees and non-enrollees. The
comparison group in the claims-based analysis included all non-dually eligible Medicare
beneficiaries who were not enrolled in any of the state pharmacy assistance programs. The
comparison group in the survey-based analysis included nonenrolled beneficiaries with incomes
below 300 percent of poverty who lacked prescription drug coverage. We also investigate the
differences between enrollees in each of the three state pharmacy assistance programs. Finally,
in the survey-based analysis, we examine the differential effects of drug coverage for selected
chronic conditions.
Vermont’s Pharmacy Benefit Programs
Vermont currently offers three pharmacy benefit programs to its low-income elderly and
disabled residents. The first, called VScript was started in 1989 as a state-funded program to
offer low-income Medicare beneficiaries a subsidy on maintenance prescription drugs. The
second, called VHAP Pharmacy was introduced seven years later under the state’s 1115
Medicaid waiver. It employed both state and federal dollars to provide a more generous drug
66

benefit package with less enrollee cost-sharing to seniors and disabled residents with slightly
lower incomes. In 1999, VScript program became absorbed into the Medicaid waiver as well
and, as a result, the state-funded portion was extended to a higher income population. The
expanded state-only program is referred to as VScript Expanded.
The eligibility and cost sharing rules have changed quite dramatically during the course
of study.29 During the most recent year under review, VHAP Pharmacy included beneficiaries
with incomes up to 150 percent of the Federal Poverty Level (FPL), required a nominal two-tier
copayment based on the cost of the prescription, and covered all drugs. Expenditures were
eligible for federal matching dollars. The VScript program included beneficiaries between 150
and 175 percent of poverty, also used a nominal two-tier copayment, and covered only
maintenance drugs. Expenditures under VScript were also eligible for the federal match. The
third program, VScript Expanded, included beneficiaries between 175 and 225 percent of
poverty, required a $275 deductible and a 41 percent coinsurance payment, and covered only
maintenance drugs. Money spent under VScript Expanded was not eligible for federal matching
dollars.
Methodology and Data
The initial study was based on an analysis of medical claims from Medicare and
pharmacy claims from Medicaid, plus an assessment of VHAP Pharmacy and VScript
enrollment data between 1993 and 2000. VScript Expanded had not yet been implemented at the
time of the initial evaluation and was excluded from the analyses. Descriptive analyses were
29 In summary, Vermont expanded the income eligibility threshold for the 1115 waiver component from 100 percent to 175 percent of poverty and, subsequently, expanded the income eligibility threshold for the state-only component from 175 percent of poverty to 225 percent of poverty. At the same time, the state replaced the high coinsurance rate with a lower two-tier copayment structure for VHAP Pharmacy and VScript, but maintained the coinsurance rate for VScript Expanded. More recently, however, the state eliminated all enrollee cost sharing and introduced a sliding scale monthly premium for all three programs.
67

used to examine program enrollment patterns and changes in the Medicaid spend-down rate over
time. Descriptive analyses were also used evaluate the use and cost of prescription medications
for both enrollees and beneficiaries who were also eligible for full drug benefits under Medicaid.
Descriptive and multivariate regressions analyses were also used to compare the use and cost of
Medicare-covered services for enrollees and non-dually eligible nonenrolled beneficiaries.
The follow-up analysis was based primarily on a 2004 telephone survey of two groups of
Medicare beneficiaries: those enrolled in the state pharmacy assistance programs; and those who
met or nearly met the programs’ income eligibility criteria, but who were not enrolled in either
these programs. Beneficiaries who were younger than 65 years of age, diagnosed end-stage renal
disease; under hospice care; and dually eligible for full Medicaid benefits were excluded from
the sample. The survey responses were merged with Medicare claims data for the medical offset
analysis.
Major Findings
The major findings for each of the three principal research questions are summarized
below.
Findings on Enrollment. Nearly 16 percent of the roughly 93,000 Medicare beneficiaries
in Vermont received some form of outpatient drug coverage through the state pharmacy
assistance programs in 2000. Of the 14,659 enrollees, 9,748 (66 percent) were in VHAP
Pharmacy, 2,892 (20 percent) in VScript and 2,019 (14 percent) in VScript Expanded. An
additional 17 percent of the state’s Medicare beneficiaries received outpatient drug coverage
through Medicaid. The longitudinal analysis of state eligibility data suggests that the Vermont
pharmacy assistance programs helped lower the rate at which low-income beneficiaries spend
down to full Medicaid benefits. The proportion of Medicare beneficiaries who were dually
68

eligible for full benefits under Medicaid fell from nearly one-quarter in 1994 to less than 20
percent in 2000. During the same period, the proportion of newly enrolled dually eligible
beneficiaries who spent down to full Medicaid benefits was reduced by half, from 2.9 percent to
1.4 percent.
Evidence further suggests that Vermont’s pharmacy assistance programs are enrolling the
most vulnerable individuals among the population eligible for coverage. Compared to people
who are eligible for, but not enrolled in the program, enrollees are more likely to be older, have
less education, have lower income, and live alone. Sicker individuals are also more likely to
enroll in the programs. People who report themselves as being in fair or poor health have 75
percent greater odds of enrolling than those in excellent or very good health. Having certain
chronic conditions, including hypertension, heart disease, and arthritis also increases the
likelihood of enrolling. This adverse selection suggests that the programs enroll people with
higher than average needs for prescription drugs and, potentially, higher than average costs.
Although VScript and VScript Expanded target drugs for selected chronic conditions, there are
few differences in health status across programs. This is consistent with the claims-based
findings that showed little difference between programs in the types of medications purchased.
Further, people for whom purchasing prescription medications poses the greatest
financial burden are substantially more likely to enroll in the pharmacy assistance programs.
Having to forgo basic needs such as food or heat triples the odds of enrolling, while needing
assistance from family or friend to pay for medications more than doubles the odds of
enrollment. Descriptive analyses show that people with higher out-of-pocket expenses prior to
enrollment are more likely to enroll, but the level of out-of-pocket spending was not significant
in multivariate analyses. Surprisingly, greater utilization of prescription drugs prior to enrolling
69

does not increase the likelihood that a person will join the programs. Given their poorer health
status, lower pre-enrollment utilization may indicate greater unmet needs in the enrollee
population, whereas people with high levels of prescription drug utilization may have found
ways to access needed medications without this assistance.
Crowd-out does not appear to be a problem in Vermont’s pharmacy assistance programs.
Having prescription drug coverage dramatically reduces the likelihood of enrolling and people
with coverage have 85 percent lower odds of enrolling compared to people without coverage.
Only 20 percent of enrollees had any type of prescription drug coverage in the year prior to
enrolling and 60 percent had never had coverage. Given the low levels of prior prescription drug
coverage among enrollees, there is minimal potential for crowd-out. We estimate that the
maximum potential crowd-out is only about 7 percent of enrollees. This includes all people who
said they voluntarily dropped their Medigap or employment-based insurance to join the
pharmacy assistance program or who said they involuntarily lost their employment-based
coverage.
Enrollment in the pharmacy assistance programs is very stable and more than two-thirds
have been enrolled two or more years. A variety of factors drive the decision to enroll in the
pharmacy assistance programs. Nearly all (90 percent) said they wanted the future protection
provided by drug coverage. Many people enroll because they have no alternative for receiving
coverage. Over 80 percent said they enrolled because they did not have prescription drug
coverage and close to 80 percent indicated that they could not afford other forms of coverage.
For three-fifths of the enrollees, the decision to apply was precipitated by a specific medical
need, either the diagnosis of new condition or a change in treatment for an existing condition.
70

Like other public assistance programs, lack of awareness is a barrier to enrolling people
in the pharmacy assistance programs, although 43 percent of eligible nonenrollees were familiar
with the program. Unlike many other public assistance programs, the pharmacy assistance
programs appear to have widespread acceptance among the potentially eligible population and
two-thirds said they would apply if they were eligible. Most people who would not apply either
already have coverage or do not feel they need it. Burdensome application procedures and
welfare stigma are not significant deterrents to applying.
Findings on the Impact of Enrollment on Use and Costs of Prescription Drugs.
Enrollment in one of the state pharmacy assistance plans is associated with an increase in the
number of outpatient prescription drugs purchased. Following enrollment in the state’s
pharmacy assistance programs, enrollees were almost twice as likely to have more than 20
prescriptions filled per year compared with nonenrollees, although the finding was not
statistically significant at the 10 percent level. Further, 65 percent of enrollees had more than 20
prescriptions filled within the year. While the survey did not allow us to compare the change in
the total number of prescriptions filled before versus after enrollment, pre-enrollment evidence
on the number of unique prescriptions filled nonetheless suggests that the state pharmacy
assistance programs greatly improved access to outpatient prescription drugs.
In addition to higher prescription drug purchases, enrollees had lower out of pocket costs.
Enrollees were 82 percent less likely than nonenrollees to have out of pocket costs of
200+/month. This effect varies across the three pharmacy assistance programs with VHAP
Pharmacy enrollees being 90 percent less likely than nonenrollees to have those high costs,
VScript enrollees 85 percent less likely, and VScript Expanded only 48 percent less likely than
nonenrollees. These findings are consistent with the structure of the enrollee cost sharing rules
71

between the three programs, with VHAP Pharmacy being the most generous program and
VScript Expanded being the least generous. Restrictions on the types of drugs covered under
VScript and VScript Expanded may also have led to greater out-of-pocket spending relative to
VHAP Pharmacy enrollees.
Enrollees were also less likely to have unmet needs than nonenrollees. In the 12 months
before the survey, enrollees were 48 percent less likely than nonenrollees to have skipped drugs
or taken fewer than prescribed, although this finding was mostly attributable to VHAP Pharmacy
enrollees who were 65 percent less likely than nonenrollees to answer yes to either of these
questions. Similarly, enrollees were 62 percent less likely to not fill a prescription item because
of cost. Again, this effect is greatest for VHAP Pharmacy enrollees who were 77 percent less
likely to not fill a prescription because of cost. However, VScript enrollees were also less likely
to have unmet needs, with the enrollees being 55 percent less likely to not fill a script.
The earlier analysis of pharmacy claims data for prescriptions purchased in 1999 revealed
that the total cost of the Vermont pharmacy assistance programs, including both state and federal
dollars, was $13.3 million. Of that amount, 82 percent was incurred by the VHAP Pharmacy
program ($10.9 million) and 18 percent by the VScript program ($2.4 million). An additional
$33.5 million was spent on outpatient drugs for dually eligible Medicare beneficiaries under
Medicaid. Moreover, over 83 percent of the 9,598 VHAP Pharmacy enrollees submitted an
outpatient drug claim, resulting in average drug payments of $1,131 per enrollee and $1,358 per
user. A total of 79 percent of the 3,001 VScript enrollees submitted a claim, with an average
payment of $809 per enrollee and $1,024 per user. In comparison, 89 percent of the 16,809 dual
eligible beneficiaries submitted a drug claim, with an average cost of $1,935 per dual eligible
and $2,176 per user. The claims analysis further showed that VHAP Pharmacy claimants
72

submitted an average of 35 claims. Claimants in VScript, which covers only longer-term
prescriptions for chronic diseases, submitted an average of 18 claims. In comparison, dual
eligible beneficiaries who purchased drugs submitted on average 50 claims.
The types of drugs most commonly purchased under both VHAP Pharmacy and VScript
were used to treat chronic conditions such as stomach acids or ulcers, cholesterol, heart disease,
diabetes and mental disorders. In contrast, Medicaid prescriptions were dominated by treatments
for mental health and related disorders. Three drugs used for treating stomach acids and ulcers
(Prilosec, Prevacid and Pepcid) accounted for over ten percent of total expenditures. Another
seven percent of spending was for two cholesterol drugs (Lipitor and Zocor), four percent for
two heart disease drugs (Norvasc and Vasotec), three percent for two mental disorder drugs
(Zoloft and Prozac), and two percent for one diabetes drug (Glucophage). Total expenditure on
these drugs is driven by both high numbers of users and high costs per pill. The drug with the
highest number of users was Furosemide, a diuretic that is essential for treating congestive heart
failure and kidney and liver disease. However, despite its high use, it ranked 48th in terms of
total VHAP Pharmacy expenditures because of its low cost per pill. The similarity in drug use
patterns between the programs, despite differences in coverage, was supported by findings from
the survey as well. The survey showed few statistical differences in the prevalence of selected
chronic conditions between the three programs.
Findings on the Impact of Enrollment on Use and Costs of Medical Services. The results
of the survey analysis provide evidence that consistent and timely access to outpatient
prescription drugs among Medicare beneficiaries may serve as a substitute for acute inpatient
services. Enrollment in Vermont’s state pharmacy assistance programs was associated with a 17
percent reduction in annual expenditures for inpatient services, although the offset at the overall
73

program level was statistically insignificant at the 10 percent level. The results further suggest
that drug coverage among the elderly may be a complement to outpatient services, particularly
those administered in a physician’s office. Enrollment in the state pharmacy assistance programs
was associated with a 19 percent increase in annual expenditures for professional services and
this result was significant at the ten percent level. While access to prescription medications may
help prevent avoidable hospitalizations, they may also require regular monitoring of drug
treatment regimes and carry potential side effects that require the services of a physician or other
professional health care provider.
The complementarity effects appear strongest among beneficiaries who suffer from
particular chronic conditions. Enrollment in VScript and VScript Expanded, programs whose
benefits are limited to maintenance medications for chronic conditions, was associated with a
statistically significant 35 percent increase in annual expenditures for professional services.
Enrollees in VScript Expanded also exhibited a statistically significant 25 percent increase in
facility costs for services administered in an outpatient setting. These results suggest that,
despite the higher cost sharing required under VScript and, in particular, VScript Expanded,
complementarities between drugs and outpatient services may be more likely among
beneficiaries who suffer from chronic conditions requiring consistent and timely use of
outpatient medications. In contrast, the offsets observed on the inpatient side were higher among
VHAP Pharmacy enrollees, but the results were not statistically significant.
The enhanced effects of drug coverage on medical service use and costs among
beneficiaries with chronic conditions are further evidenced when the models were estimated over
subgroups with specific diseases. Enrollment in a state pharmacy assistance program was
correlated with lower inpatient spending for people with two of the three conditions we
74

examined in survey study: hypertension and arthritis. However, none of the inpatient offsets for
the disease-specific analyses was statistically significant. In contrast, annual expenditures for
professional services increased 19 percent for enrollees with hypertension and 24 percent for
those with a heart condition. Both of these complementarities with services covered under Part
B were statistically significant at the ten percent level or higher. However, it should be reiterated
that earlier analyses using pharmacy claims data indicated a remarkable similarity in both the
types and amounts of drugs purchased by VHAP Pharmacy and VScript and enrollees. The eight
most commonly purchased drugs in terms of both number of prescriptions and expenditures were
the same for VHAP Pharmacy and VScript. As noted above, these included drugs for such
common chronic conditions as stomach acids or ulcers, cholesterol, heart disease, diabetes, and
mental disorders.
Given the opposing relationship between drug coverage and the use and cost of outpatient
versus inpatient services, the net effect of drug coverage on total medical spending is difficult to
ascertain and depends on the magnitude of the individual service-level effects. The only total
effect from the survey analysis that was statistically significant was for beneficiaries who
reported having heart disease. For people with heart disease, drug coverage was associated with
higher medical spending for inpatient, outpatient and professional services. The net effect was a
statistically significant $1,266 increase in annual medical expenditures.
In contrast, the first-round longitudinal claims-based analysis using a non-dually eligible
nonenrolled beneficiary control group found no significant association between drug coverage
and use of non-drug medical services. The lack of a statistical difference was due in part to the
inability to control fully for selection and the drug coverage status of the nonenrollee group. The
results from the longitudinal analysis, however, suggested that beneficiaries are most likely to
75

enroll in a voluntary prescription drug program without late enrollment penalties following an
acute illness. Average Medicare spending for inpatient, outpatient and physician services
increased by nearly $1,000 during the initial year of enrollment in VHAP Pharmacy or VScript
compared to the spending trend amount non-enrolled beneficiaries. Inpatient expenditures
increased by $850, outpatient expenditures by $72, and physician payments by $62 for VHAP
Pharmacy enrollees and by comparable amounts for VScript enrollees during their first year of
enrollment. These findings were statistically significant at the one percent level. However,
following the initial spike in expenditures, average spending amounts among program
participants returned to pre-enrollment levels during the subsequent VHAP Pharmacy and
VScript enrollment years. This pattern held true for both programs and for all types of services.
The relative changes in spending during subsequent years of participation were largely not
statistically significantly different from zero, suggesting a regression to the mean.
Lessons Learned
Our analyses of Vermont’s pharmacy assistance program provides important insights
regarding who is most likely to enroll in the Medicare Part D program and the program’s
potential for serving people with the greatest needs.
Implications for Enrollment. The Vermont pharmacy assistance program serves those
individuals within the eligible population that have the greatest need and that can most benefit
from publicly-provided prescription drug coverage. The enrolled population is in poor health
and likely expensive to serve. Although it is a voluntary program, it is not clear whether the Part
D program will be subject to the same adverse selection. Because Congress was cognizant of the
potential adverse selection in Part D, the Medicare Modernization Act requires a penalty for late
76

enrollment in Part D to discourage individuals from delaying enrollment until they become ill
and have high prescription drug needs.
Like other public assistance programs, lack of awareness is a barrier to enrolling people
in the pharmacy assistance program. Unlike many other public assistance programs, Vermont’s
pharmacy assistance program appears to have widespread acceptance among the potentially
eligible population and two-thirds said they would apply if they were eligible. While plan
complexity and benefit design under Part D may make it more challenging to enroll potentially
eligible, low-income beneficiaries, Vermont’s experience provides encouraging evidence that
low-income people who can benefit most from Part D will be successfully enrolled.
Implications for Use and Costs of Drugs and Non-Drug Medical Services. The analyses
show that the provision of a publicly subsidized outpatient prescription drug benefit among the
low-income elderly has a profound and beneficial effect on access to prescription medications.
Subsidies provided under Part D for non-dually eligible low-income beneficiaries will be
important for maintaining access among this vulnerable population.
The study further shows that the Part D drug benefit may help lower Medicare spending
under Part A. At the same time, the Medicare drug benefit may lead to higher spending under
Part B. The medical spending effects (both Part A offsets and Part B complements) of a
Medicare drug benefit are likely to be most pronounced among selected populations, particularly
those suffering from chronic conditions requiring the regular use of effective maintenance
medications. Substantial savings may, in fact, be realized among beneficiaries with certain
chronic conditions where outpatient prescription medication is particularly effective for avoiding
illness and preventing unnecessary medical service use. It may, thus, be useful to consider
77

condition- and drug-specific factors when Part D and Medicare Advantage plans develop their
drug formularies and cost sharing rules.
78

CHAPTER VII
LESSONS LEARNED AND DIRECTIONS FOR FUTURE RESEARCH
The Evaluation of Medicaid Health Reform Demonstrations project produced a wide
range of analyses based on case studies of specific sites, state-specific beneficiary surveys,
Medicare and Medicaid claims data, national probability sample survey data, and data from
managed care plans. Findings, and therefore lessons learned, fall into five major categories:
• Implementation and operations under managed care
• Impacts on beneficiaries
• Impacts on health plan decisions about Medicaid participation
• Potential for reconfiguring the safety net
• Prescription drug use and costs under a Medicaid drug program for low-income seniors
This chapter’s review of lessons learned from project findings is divided into sections
that correspond to these major issues. The chapter concludes with suggested directions for future
research. We begin with a brief review of the potential for Medicaid managed care to improve
health care delivery.
Potential for Managed Care to Improve Medicaid Services For adults and children on Medicaid via TANF or poverty-related expansions in
Minnesota, our findings indicate that fee-for-service Medicaid is generally doing an adequate job
in many areas in providing health care to beneficiaries. The major areas where an effective
managed care system might achieve cost-effective improvements appear to be: reducing
emergency room use for non-immediate needs, particularly for adults; following up to ensure
79
preventive care appointments are made and kept; reducing travel times to care and wait times in
the office before being seen; and reducing unmet need for doctor and dental care.
The situation is more complex for disabled beneficiaries. This is a highly vulnerable and
costly population about which relatively little is known, particularly in a managed care context.
Project data indicate a wide diversity in the types of health conditions among this population,
both adults and children--from physical afflictions such as muscular dystrophy, cerebral palsy,
and HIV/AIDS to mental retardation and such mental health conditions as schizophrenia and
paranoia. Our findings indicate that there are many opportunities for improvements in access to
care under fee-for-service Medicaid for this population, and that managed care can potentially
help, if based on a sound understanding of the issues to be confronted.
Implementation and Operations under Medicaid Managed Care All our project states (Minnesota, New York, Kentucky, and Vermont) made efforts to
introduce Medicaid capitation, with three of the four states concentrating their efforts primarily
in rural areas of the state. Their implementation experiences can be encapsulated in five key
lessons for states considering Medicaid capitation.
Ensure that the area has a sufficient number of covered lives. A key question is whether
there are enough beneficiaries to support a capitated managed care program, especially in rural
areas. New York’s strategy (partially successful) was to set minimum population standards for
counties to shift to managed care. Minnesota’s successful experience “bundled” Medicaid
beneficiaries with other insurance groups. Kentucky’s strategy (ultimately unsuccessful except in
one geographic area) was to divide the state into regions that combined several counties and to
80

allow only one plan to serve each region. Vermont’s approach (finally abandoned) was to solicit
plans whose catchment areas were statewide.
Be prepared to allow some flexibility for provider networks. In an effort to have a
sufficient numbers of providers (especially mental health providers) in rural areas and to meet
state access requirements, Minnesota allowed some relaxation of provider credentialing. For
similar reasons, Vermont relaxed standards for beneficiary travel time to providers. While
Vermont’s experience was too limited to determine whether the longer travel times was an
effective strategy, there was a mixed assessment among Minnesota site visit respondents about
the success of letting less credentialed providers serve Medicaid beneficiaries: On the one hand,
plans were able to bring in new providers to their networks, especially specialists, that rural
residents did not have ready access to. At the same time, though, plans were concerned about
potential quality of care issues.
Be realistic in assessing potential cost-savings. If the primary motivation is cost savings,
success will depend in large part on whether there are obvious places where resources can be cut
without compromising quality of care. To determine this, states will need to assess a number of
issues. Is there heavy reliance on emergency room or hospital care? Is the area large enough to
support plan and provider competition to drive down costs? Or is there, in contrast, pent-up
demand for care that could lead to initial cost increases? In the case of Vermont, for example, the
fee-for-service system in place when the waiver demonstration was implemented was already
comparatively cost-effective.
Set feasible capitation rates. Developing sound capitation rates is another important
factor in making a successful managed care program. States need to consider and be prepared
for all the various costs (including direct medical costs as well as administrative and reporting
81

costs) that plans incur in serving Medicaid beneficiaries. Without sound rates, states run the risk
of having trouble getting plans to participate in the Medicaid managed care as in the case the
Vermont.
Allow for local differences and local input. In some areas, health care providers are core
community participants. States need to be prepared to consider trading off some of the gains of
capitation against the loss of key providers. They also need to be prepared to make operational
and programmatic changes to accommodate the range of local areas and their governments that
participate in the managed care initiative.
Impacts of Managed Care on Medicaid Beneficiaries As states consider moving their Medicaid programs towards managed care, several
project findings can help them maximize the potential that their managed care approach will
improve beneficiary access to care.
For TANF and poverty-related Medicaid beneficiaries, findings from our formal impact
evaluation for rural Minnesota suggest that managed care may not have much effect on
improving access to care or care delivery patterns compared with the situation under Medicaid
fee-for-service. Medicaid officials in that state believed, however, that their managed care
system did increase the cost-effectiveness of the care delivered to its rural beneficiaries under
Medicaid.
For Medicaid beneficiaries with disabilities (i.e., the SSI population), we found that
Medicaid managed care does lead to some improvements in access to care for rural beneficiaries
with disabilities. This finding does not carry over to the SSI population in urban areas, however,
suggesting that states should be cautious about extending managed care coverage to urban
82

disabled Medicaid beneficiaries. Access to care for the disabled beneficiary population, as noted,
is typically problematic under fee-for-service. And differences in the characteristics of the urban
SSI population, the version of Medicaid managed care implemented in urban areas and/or the
health care system in urban areas may make it harder to make improvements in care than is the
case in rural areas.
Overall, the findings summarized here suggest that the impacts of Medicaid managed
care are not homogenous, rather the effects vary by Medicaid subgroup, geographic area and
type of managed care. Medicaid policymakers should be mindful of these differences when
developing managed care program policies. More research is needed to better understand the
implications of Medicaid managed care and the factors behind the differences found in the
research reported here.
Impacts on Health Plan Participation Decisions
Participation of commercial health plans in Medicaid managed care is an objective for
many policymakers and program administrators wishing to increase access to and quality of care
for beneficiaries by moving them into the mainstream health care delivery system. Our analysis
of factors influencing health plan decisions about whether or not to participate in the Medicaid
program suggests two major lessons for state policymakers and program administrators as they
seek commercial plan participation.
The first lesson is that states need to establish sound capitation rates that reflect the true
costs of serving the Medicaid population enrolled in managed care, as well as to ensure that
service carve-outs and similar policies are not interfering with the ability of plans to manage care
in a cost-effective way. Second, states should work to ensure that plans can enroll an adequate
83

number of Medicaid enrollees to operate effectively. This could be achieved by limiting the
number of plans that are awarded contracts within a county and/or contracting care for groups of
counties within the state.
Potential for Reconfiguring the Health Care Safety Net Project findings on this issue come from a study of the 1115 waiver experience of Los
Angeles County, which (in return for a major federal subsidy) agreed to fundamentally
restructure the county’s delivery of health care to the indigent. The major lesson to be learned
from the waiver experience of Los Angeles County is a sobering one. Substantial financial relief
and a serious restructuring effort may not be enough to restore financial viability to a safety net
health care system on the brink of collapse. Waiver efforts did succeed in expanding geographic
access to non-hospital indigent care; cutting the number of inpatient beds, inpatient days, and
average length of stay; and implementing a hospital reengineering system that produced some
savings through better purchasing of supplies, equipment, and prescription drugs. Observers also
agreed that the culture of indigent care provision had improved, bringing more attention to
patient care quality and communication among providers throughout the system.
Despite these successes, the large number of uninsured in the county remained, along
with the obligation to meet their health care needs. The county received a new waiver with
additional subsidy for the 2001-2005 period. Whether actions under the new waiver will
stimulate enough additional financing and operational reforms in the LA County system to make
it financially stable remains an open question. But if past is prologue, it is hard to be optimistic.
84

Implications of Vermont Drug Analyses
Our analysis of Vermont’s pharmacy assistance programs has important implications,
especially for the recently enacted new drug benefit under Medicare. First, state pharmacy
assistance programs and, ultimately, Part D, play an extremely important role in providing
outpatient prescription drug coverage to one of the most vulnerable and least insured groups of
Medicare beneficiaries. Subsidies provided under Part D to the non-dually eligible low-income
population will be crucial for building on the achievements made by states and ensuring
continued access to outpatient prescription drugs among the near-poor.
Participants in publicly subsidized drug programs also tend to be those with the greatest
needs. However, late enrollment penalties imposed under Part D should help limit the
deleterious impact of adverse selection on future plan costs. Finally, while the new Medicare
drug benefit may help reduce the number of unnecessary hospitalizations and lower inpatient
expenditures, Part D may conversely lead to higher outpatient and Part B expenditures. The
potential for savings is likely to be greatest among beneficiaries with chronic conditions where
outpatient prescription medication is particularly effective for avoiding illness and preventing
unnecessary medical service use. It may, thus, be useful to consider condition- and drug-
specific factors when Part D and Medicare Advantage plans develop their drug formularies and
cost sharing rules.
Suggestions for Future Research
The Evaluation of Medicaid Health Reform Demonstrations addressed a number of issues
related to state 1115 waiver initiatives, providing new information on a range of issues. As with
any research project, the findings from those research efforts raise new questions. Areas that
would benefit from additional work include:
85
• Exploring the impacts of Medicaid managed care for TANF and poverty-related populations in states beyond Minnesota. In particular, what is the impact of MMC for populations in rural areas in states without a strong health care system and a generous Medicaid program (for which Minnesota is known)?
• Expanding the analysis of the impacts of MMC on disabled populations. How do the
effects of MMC on disabled beneficiaries vary in different states (with different MMC programs) and for different populations of disabled persons? What is driving differences in the effects of MMC for this population in urban and rural areas?
• Baseline studies of access and use for beneficiaries with disabilities under fee-for-
service Medicaid. Much of the policy concern has focused on how Medicaid managed care may affect these beneficiaries, but little is known about how these beneficiaries are faring under the current fee-for-service delivery system.
• Expanding the analysis of commercial plan participation in Medicaid managed care to
consider quality of care and plan entry. How does the quality of care provided by commercial plans compare to that of Medicaid-dominated plans? How can states attract additional commercial plans into county MMC markets?
• Expanding the analysis of the impacts of new safety net funding to look at the effects
on beneficiaries as well as providers in Los Angeles County. Expanding the analysis of the health care safety net to other urban markets that have received substantial safety net funding as part of 1115 waivers (e.g., New York City).
• Exploring the impact of Part D implementation on the design of state pharmacy
assistance programs, who enrolls, and the costs of these programs. Do states eliminate their pharmacy assistance programs and, if so, why? Do states that continue offering such programs change the benefit to wrap-around Part D or do they continue to offer independent programs? Does enrollment in state programs decline following implementation of Part D? How do total and per enrollee program costs change following the implementation of Part D?
• Understanding the impact of Part D on low-income individuals previously eligible for
state coverage. What is rate of enrollment in Part D among low-income populations previously eligible for state coverage? Do out-of-pocket costs change following implementation of Part D for people previously eligible for coverage through a state program? Do patterns of utilization change? Do individuals change drugs (either within a therapeutic class or between brand-name and generic) after they enroll in Part D? Are there changes in access to prescription drugs and unmet need for low-income individuals who enroll in Part D plans?
• Investigating the impact of Medicare Part D on Medicaid spend-down, on
prescription drug needs and out-of-pocket spending, and on use and cost of prescription medications and non-drug medical costs.
86

Finally, the findings from the Evaluation of Medicaid Health Reform Demonstrations
highlight the challenges states and communities face in transforming their health care systems,
whether that transformation involves switching from fee-for-service to Medicaid managed care
or, as in the case of Los Angeles County, trying to reconfiguring a complex urban health care
safety net system. In-depth case studies of program change are needed whenever states make
system changes, both to document what has been changed and to understand the process of
change. Information on the challenges and successes that are faced by states as they implement
change is critical to policymakers and program administrators in other states as they contemplate
reforms to their Medicaid program or health care safety net.
87

REFERENCES
American Hospital Association. 1994. Hospital Statistics: The AHA Profile of United States
Hospital. Chicago: American Hospital Association. 1993. Felt-Lisk, S. 1999. The Changing Medicaid Managed Care Market: Trends In Commercial
Plans’ Participation. Menlo Park, CA: Kaiser Commission on Medicaid and the Uninsured, The Henry J. Kaiser Family Foundation.
Kaiser Commission on Medicaid and the Uninsured. 2001. “The Medicaid Program at a
Glance.” Washington, DC: Kaiser Commission on Medicaid and the Uninsured. Long, S. K., et al. 1999. “A Case Study of the Medicaid Demonstration Project for Los Angeles
County.” Report to the Centers for Medicare and Medicaid Services. Washington, DC: Urban Institute.
Social Security Administration. 2001. “Summary Children Receiving SSI December 2000.”
http://www.ssa.gov/policy/docs/statcomps/ssi_children/2000/dec/. Accessed September 2004.
U.S. House of Representative. 2004. 2002 Green Book. U.S. House of Representatives,
Committee on Ways and Means. U.S. Bureau of the Census. 1993. 1990 Census of Population and Housing, Population and
Housing Unit Counts, CHP-2. Zuckerman, S., and A. W. Lutzky. 2001. “The Medicaid Demonstration Project in Los Angeles
County, 1995-2000: Progress, but Room for Improvement.” Report to the Centers for Medicare and Medicaid Services. Washington, DC: Urban Institute.
88

APPENDIX A
LIST OF PROJECT REPORTS, PUBLICATIONS AND PRESENTATIONS
Urban Institute
REPORTS • Coughlin and Long. 2004. “Moving to Medicaid Managed Care: Lessons From State
Experiences Under Section 1115 Waiver Authority.” • Long, King and Coughlin. 2004. “The Health Care Experiences of Rural Medicaid
Beneficiaries.” • Coughlin and Long. 2004 “Estimating the Impacts of Medicaid Managed Care on Medicaid
SSI Beneficiaries: A National Study.” • Long and Yemane. 2004. “Commercial Plans in Medicaid Managed Care: Understanding
Who Stays and Who Leaves in a Changing Market.” • Coughlin, Long and Ormond. 2004. “Rural Medicaid Managed Care: The Case of Four
States.” • Coughlin and Long. 2003. “Health Care Experiences of Disabled Children Receiving
Medicaid.” • Long, Coughlin, and King. 2003. “Estimating the Impacts of Medicaid Managed Care in
Rural Minnesota.” • Long, Coughlin and King. 2002. “Barriers to Care for Disabled Medicaid Beneficiaries: A
Multivariate Analysis.” • Long, Kendall, Coughlin and Ormond. 2001. “Minnesota Prepaid Medicaid Assistance
Program: Third Round Site Visit Report.” • Zuckerman and Lutzky. 2001. “The Medicaid Demonstration Project in Los Angeles
County, 1995-2000: Progress, but Room for Improvement.” • Coughlin, Long and Kendall. 2001. “Health Care Access, Use, and Satisfaction Among
Disabled Working Age Adults in New York under FFS Medicaid.” • Long and Coughlin. 2000. “Effects of Medicaid Managed Care on Children: Evidence from
Minnesota’s PMAP Program.” • Coughlin, Long, Kasten and Goldenson. 2000. “NY’s Partnership Plan: An Early Look at
Program Implementation.” • Long, et al. 1999. “A Case Study of the Medicaid Demonstration Project for Los Angeles
County.” • Coughlin and Long. 1999. “Impacts of Medicaid Managed Care on Adults: Evidence from
Minnesota’s PMAP Program.” • Marstellar, Coughlin Long, and Rangararajan, 1999. “Minnesota Prepaid Medicaid
Assistance Program: Second Round Site Visit Report.” • Coughlin, Marstellar, Rajan and Zuckerman. 1997. “Expanding Medicaid Managed Care in
Minnesota: The First Annual Report of the Evaluation of the Medicaid Health Reform Demonstration.”
• Long et al. 1996. “Designing an Evaluation of the Medicaid Health Reform Demonstrations”
A-1

PUBLICATIONS AS OF AUGUST 2004
• Long, Coughlin and King. 2004 (forthcoming). “Capitated Medicaid Managed Care in a Rural Area: The Impact of Minnesota’s PMAP Program” Journal of Rural Health
• Long and Coughlin. 2004 (forthcoming). “Access to Care for Disabled Children.” Health Care Financing Review.
• Coughlin, Long, and Kendall. 2002. “Health Care Access, Use and Satisfaction Among Disabled Medicaid Beneficiaries.” Health Care Financing Review
• Long, Coughlin, and Kendall. 2002. “Access to Care Among Disabled Adults on Medicaid” Health Care Financing Review
• Long, Coughlin and Kendall. 2002. “Unmet Need Among Rural Medicaid Beneficiaries,” Journal of Rural Health
• Long and Coughlin. 2001. “Impacts of Medicaid Managed Care on Children” Health Services Research.
• Coughlin and Long. 2000. “Effects of Medicaid Managed Care on Adults” Medical Care. • Long and Zuckerman. 1998. “Urban Health Care in Transition: Challenges Facing Los
Angeles County.” Health Care Financing Review.
PRESENTATIONS • Long, King, and Coughlin. 2004. “Understanding Rural-Urban Differences in Access to
Care: Is It Who You Are or Where You Live?” presentation at the American Public Health Association meeting, Washington, DC.
• Long and Yemane. 2004. “Factors That Contribute To Commercial Health Plan Exits From Medicaid Managed Care” presentation at the American Public Health Association meeting, Washington, DC.
• Coughlin and Long. 2004. “Impacts of Medicaid Managed Care on SSI Beneficiaries,” presentation at the AcademyHealth Meeting in San Diego, CA.
• Long, King and Coughlin. 2004. “How Well Does Medicaid Work in Improving Access to Care,” presentation at the AcademyHealth Meeting in San Diego, CA.
• Long and Coughlin. 2003. “Medicaid Managed Care in New York,” presentation to New York’s Medicaid Managed Care Advisory Review Panel, New York City, New York.
• Long and Coughlin. 2002. “Health Care and Children with Disabilities,” presentation at the International Conference on Inner City Health, Toronto, Canada.
• Long and Coughlin. 2002. “Access to Care Under Medicaid for Children with Mental and Physical Disabilities in New York City,” presentation at the National Association for Welfare Research and Statistics, Albuquerque, NM.
• Coughlin and Long. 2001. “Disabled Children on Medicaid,” presentation at the Association of Public Policy and Management meeting, Washington DC.
• Coughlin and Long. 2001. “Medicaid Managed Care and Impacts on Beneficiaries,” presentation at the Center for Health Care Strategies’ conference on Operational Lessons from Recent Medicaid Managed Care Research, Washington DC.
• Coughlin and Long. 2000. “Health Care Access and Use by Disabled Medicaid Recipients,” presentation at the Association of Public Policy and Management meeting, Seattle, WA.
A-2

• Long and Coughlin. 2000. “The Impacts of Medicaid Managed Care Under an 1115 Waiver: Evidence from Minnesota,” presentation at the Annual State Health Policy Conference of the National Academy of State Health Policy, St. Paul, MN.
• Coughlin and Long. 2000. “Disabled Medicaid Recipients in New York,” presentation at the United Hospital Fund Meeting, New York, NY.
• Zuckerman. 2000. “Medicaid Demonstration Project for Los Angeles County: Background and Prospects,” presentation at the Kaiser Commission on the Future of Medicaid and the Uninsured, Menlo Park, CA.
• Long and Coughlin. 2000. “How Does Medicaid Managed Care Affect Children: A Methodological View,” presentation at the American Economic Association meeting, Boston, MA.
• Long and Coughlin. 1999. “The Effects of Medicaid Managed Care on Children,” presentation at the Association of Public Policy Analysis and Management meeting, Washington DC.
• Coughlin, Long, Kasten and Goldenson. 1999. “Implementation of New York’s Partnership Plan,” presentation at the Association of Public Policy Analysis and Management meeting, Washington DC.
• Coughlin, Long and Rajan. 1998. “Impacts of Medicaid Managed Care on Access and Use Among Adults: Evidence from Minnesota’s PMAP Program,” presentatioin at the Association form Public Policy Analysis and Management meeting, New York, NY.
• Marstellar and Coughlin. 1997. “The Expansion of Minnesota’s Medicaid Managed Care Program: Issues and Challenges,” presentation at the American Public Health Association meeting, Indianapolis, IN.
Research Triangle Institute (formerly Center for Health Economics Research)
REPORTS • Gilman, Gage, Haber, Hoover, Green, Ciemnecki, CyBulski, and Clusen. 2004. “Evaluation
of the Vermont Pharmacy Assistance Programs for Low-Income Medicare Beneficiaries: Findings from the Enrollee and Non-enrollee Surveys.”
• Mitchell, Hoover and Bir. 2004 “Access to Care for Medicaid Beneficiaries with Disabilities in Rural Kentucky.”
• Bir, Hoover and Kramer. 2004. “Four State Comparison of Access Use and Quality of Care for SSI Adults and Children.”
• Mitchell, Bartosch and Haber. 2004. “Evaluation of the Kentucky Health Care Partnership Program: A Comparison of the Managed Care Experiences in Regions 3 and 5.”
• French, Bartosch, Donoghue, Hoover, Walsh and Mitchell. 2003. “Medicaid Managed Care in Kentucky.”
• Mitchell, Hoover and Bir. 2003. “Poor and Disabled in Rural Kentucky: Access to Care for SSI Adults and Children.”
• Gilman, Gage and Mitchell. 2003. “Evaluation of Vermont’s Pharmacy Assistance Programs for Low-Income Medicare Beneficiaries.”
A-3
• Bartosch, Urato, French and Kulas. 2003. “Medicaid Managed Care in Vermont.”
PRESENTATIONS
• Gilman, Gage and Mitchell. 2004. "Will the Substitution of Drug for Non-Drug Care under a Voluntary Drug Benefit Lower Medicare Spending? Evidence from a State Pharmacy Assistance Program" presented at AcademyHealth Annual Research Meeting, San Diego, CA.
• Bir, Mitchell, and Hoover. 2003. “Access and Utilization of Health Care Services by Disabled Children in Four States.” Presented at the Children's Health Services Research Meeting, Nashville, TN.
• Gilman, Gage and Mitchell. 2002. "Can Substitution of Drug for Non-Drug Care under a Targeted Outpatient Drug Benefit Lower Medicare Spending?" presented at Academy for Health Services Research and Health Policy, Washington, DC.
• Gilman, Gage and Mitchell. 2002. "Can a Medicare Outpatient Drug Benefit Lower the use of Other Covered Medical Services?" presented at Academy for Health Services Research and Health Policy, Washington, DC.
• Gilman, Gage and Mitchell: "Adverse Selection in Voluntary Outpatient Prescription Drug Benefit Programs," presented at the Fourth World Congress of the International Health Economics Association, San Francisco, CA.
• Gage, Gilman, Mitchell, and Haber. 2002. "Outpatient Pharmacy Costs and Use Among Low-Income Elderly," presented at the Academy for Health Services Research and Health Policy, Washington, DC.
• Mitchell and Hoover. 2000. "Access to Care for the Medicaid Disabled in Rural Kentucky," presented at the Association for Public Policy Analysis and Management, Seattle, WA. Gilman, Gage and Mitchell. 2001. "Impact of Low Income Pharmacy Program on Medicaid Eligibility," Academy for Health Services Research and Health Policy, Atlanta, GA.
Mathematica Policy Research
REPORTS • Ciemnecki and CyBulski. 2004. “Removing the Barriers: Modifying Telephone Survey
Methodology to Increase Self-Response Among People with Disabilities.”
PUBLICATIONS AS OF AUGUST 2004 • CyBulski, Sinclair, Potter, et al. 2001. "Time and Costs Associated with Inaccurate
Administrative Data." 2001 proceedings of the American Statistical Association Survey Section on Research Methods, Alexandria, VA: American Statistical Association.
A-4

• CyBulski and Ciemnecki. 2000. "Interviewing Populations with Disabilities by Telephone: Survey Design and Operations." American Statistical Association 2000 Proceedings of the Section on Survey Research Methods. Alexandria, VA: American Statistical Association.
PRESENTATIONS • CyBulski, Ciemnecki, Sinclair, et al. 2001. "Recommendations for Using Administrative
Records as Sampling Frames in Surveys of Low-Income and Vulnerable Populations." Paper presented at the American Statistical Association, 161st Annual Meeting, Atlanta, GA.
• CyBulski and Ciemnecki. 2000. "Interviewing Populations with Disabilities by Telephone: Survey Design and Operations." Paper presented at the 55th American Association for Public Opinion Research and Annual Conference, Portland, OR.
• Ciemnecki, CyBulski and Wooldridge. 2000. "Consequences of Inadequate Administrative Data on Survey Response Rates and Health Policy Issues." Paper presented at The National Association for Welfare Research and Statistics, 40th Annual Workshop, Scottsdale, AZ.
• CyBulski, Ciemnecki and Wooldridge. 2000. "Consequences of Inadequate Medicaid Administrative Data on Survey Response Rates and Medicaid Health Policy Issues." Paper presented at the 128th American Public Health Association Annual Meeting, Boston, MA.
• CyBulski, Sinclair, Potter, and Ciemnecki. 1999. "Adjusting for Nonresponse Among Medicaid Households that Could Not Be Located or Were Located but Did Not Participate in the Minnesota Managed Care Survey." Paper presented at the International Conference on Survey Nonresponse, Portland, OR.
A-5

APPENDIX B
PROJECT EVOLUTION AND CHANGE

In September 1995 CMS, then HCFA, awarded the Urban Institute (and our
subcontractors Mathematica Policy Research (MPR), Inc. and Research Triangle Institute (RTI),
then Center for Health Economics Research, a contract to evaluate five Section 1115 State
Health Reform Demonstrations. It was expected that each demonstration would involve two
primary features: an expansion of eligibility to new populations not previously covered by
Medicaid and the movement of most of the state’s Medicaid population into Medicaid managed
care (MMC). Our original design involved detailed case studies and assessments of the impacts
of managed care on access, use and satisfaction with health care, using both encounter data and
beneficiary survey data.
In the early part of the evaluation we experienced a number of delays and false starts,
primarily related to numerous switching of states to be included in the evaluation. Indeed, our
roster of states was not finalized until more than two years into the five-year contract. Our five
sites are Kentucky, Los Angeles County, Minnesota, New York and Vermont. In addition to the
changing roster of states, the character of the demonstrations also changed. Among our study
states, Minnesota, New York, and Vermont undertook true eligibility expansions, but they were
small. Further, indications from preliminary data explorations by the Urban Institute and from
the experiences of Mathematica Policy Research, Inc. in the first 5-state contract (HCFA contract
number 500-94-0047) suggested that it would be quite optimistic to assume that quality
encounter data would be available to use as part of this evaluation. Finally, our assigned states
have encountered delays in implementing various parts of their waivers. New York experienced
considerable delays in implementing mandatory managed care in New York City. Kentucky is
no longer pursuing fully capitated managed care in much of the state. Vermont is no longer
B-1

pursing fully capitated managed care at all. These delays have affected the implementation of
our research plans.
Because of these and other developments the project was redesigned. The final project
included a number of studies, some of which were based on a single state or compared several
states, and some with a national focus. The project also included a survey methodology analysis.
I. STATE-SPECIFIC STUDIES
Minnesota
• Conducted case studies in1996, 1998, and 2001 • Beneficiary surveys—completed in 1998 and 2001 • Impact analyses based on matched county study using the 1998 survey • Impact analyses based on pre/post and difference-in-differences design using the 1998
and 2001 surveys
New York
• Conducted case studies in 1998 and 2000 • Beneficiary surveys—completed in New York City and Westchester County in 2000 • Analyses of Medicaid beneficiaries’ health care experiences under FFS using 2000
surveys Los Angeles County
• Conducted case studies 1998 and 2001 Vermont
• Conducted case studies 1998 and 1999 • Beneficiary surveys—completed in 2004 • Evaluation of the state’s pharmacy assistance programs using the 2004 survey and claims
data Kentucky
• Conducted case studies in 1998, 1999 and 2000 • Beneficiary survey completed in 1999 • Analyses of Medicaid beneficiaries’ health care experiences under FFS using 1999
survey data
II. CROSS-STATE STUDIES
• Analysis of how states crafted their MMC programs to accommodate rural areas based on the state case studies
B-2

• Comparison of access to care for the SSI population in Kentucky to access to care by similar individuals in New York, Oregon, and Tennessee using survey data collected in each state
III. NATIONAL STUDIES
• Analysis of how managed care, relative to fee-for-service, affects access to care and use
of medical services among disabled Medicaid beneficiaries using the National Health Interview Survey (NHIS)
• Analysis of commercial plan participation in Medicaid managed care using InterStudy data
• Analysis of the health care experiences of rural Medicaid beneficiaries using data from the 1997 and 1999 National Survey of America’s Families (NSAF)
IV. STUDIES OF SURVEY METHODOLOGY
• Assessment of the use of telephone interviews of SSI beneficiaries to evaluate access to
and use of care by disabled Medicaid beneficiaries
B-3
APPENDIX C
EXECUTIVE SUMMARY FOR
“REMOVING THE BARRIERS:
MODIFYING TELEPHONE SURVEY METHODOLOGY TO INCREASE
SELF-RESPONSE AMONG PEOPLE WITH DISABILITIES”
This report is based on Mathematica’s first telephone-only interviews with individuals
with disabilities.30 Data were collected from over 4,200 adults with disabilities solely by
telephone. The groups that were interviewed included adults with physical or sensory disabilities
(including blindness and deafness), mental retardation, and severe and persistent mental illness.
The Americans with Disabilities Act brought with it a shift in thinking regarding the level
of participation that individuals with disabilities have in decisions that affect their lives. Out of
this shift has come the self-directed care model, which puts forth that people must have the
option of shaping their own lives and determining what types of services they receive. Further,
there has been a move toward ensuring full participation by individuals with disabilities in their
lives. These changes have brought about an increase in the choice and control people have over
meeting their support needs, increasing independence and social inclusion.
Individuals with disabilities can face three broad categories of challenges when
completing an interview: communication barriers, stamina barriers, and cognitive barriers.
Because of these challenges, survey researchers often have to rely on proxy respondents or
administrative data when conducting studies of this population. However, data collected through
proxies or administrative records are often not of the highest quality, as research indicates that
the best data are collected directly from people who are being affected by the policy change or
program under study.
To overcome the challenges and to promote full participation people with disabilities in
the study, we made minor modifications to the design of the questionnaire design and survey
procedures to increase accessibility. Questionnaire design modifications included short recall
periods, concrete questions, elimination of high frequency sounds, inclusion of breaks to
30 This is the executive summary from Ciemnecki and CyBulski (2004) “Removing The Barriers: Modifying Telephone Survey Methodology To Increase Self-Response Among People With Disabilities.”
C-1
overcome fatigue, neutral encouragement, and structured probes. Procedural modifications
included sensitivity training for interviewers, compassion fatigue support for interviewers, and
modified expectations regarding time to administer questionnaires.
The overall response rate for these surveys was 66 percent. The one notable source of
non-response was the inability to locate sample members. Once sample members were located,
however, they were quite willing to participate in the telephone interview, as demonstrated by a
cooperation rate of 95 percent. Further, the majority of individuals with disabilities did not need
a proxy to complete the interview (83 percent). Even among individuals with mental retardation
or a developmental disability, the group that required the most proxy response, three-fourths of
these individuals were able to respond for themselves.
The telephone interviews produced data that were relatively complete and accurate, with
slight variations by disabling condition. Overall, item non-response was less than 3 percent.
Qualitative comparisons of patterns of answers across pairs of questions found that responses
were consistent at an aggregate level. Respondents were best able to answer salient items, such
as health status and demographics. The most difficult questions to answer were about the choice
of managed care organizations and primary care physicians.
To test the reliability of the telephone data, two smaller studies were conducted. The first
was an in-person interview with a sub-sample of respondents, and the second was a telephone
interview with a family member. These follow-up questionnaires contained some of the same
questions as the telephone questionnaire given to disabled respondents. The items that were
selected to be included in the follow-up questionnaire were those that would not change over
time or for which changes could be accounted for in a follow-up item. We found that the
C-2

information collected through the telephone questionnaire of persons with disabilities was
consistent with that collected through the in-person interviews and the family interviews.
In sum our findings suggest that it is feasible to interview large samples of disabled
beneficiaries over the telephone. Not only did the vast majority of respondents answer for
themselves, but nearly all were able to answer more than three-fourths of the questions in nearly
all topic areas. By implementing several innovative methods for overcoming the barriers that
this population faced when being interviewed, we were able to demonstrate that telephone
surveys of people with disabilities are not only feasible, but produce high-quality data as well.
C-3


