

Evacuation of bedridden building occupants
University: Department of architecture, building and planning, unit BPS
Eindhoven University of Technology, Den Dolech 2, 5612 AZ Eindhoven Project members: Name Identification number E-‐mail Niels Strating 0756661 [email protected] Date: 20-‐02-‐2013 Location: Eindhoven Subject: Final Thesis Subject code: 7SS37 Tutors: ir. R.A.P. van Herpen (Eindhoven University of Technology)
prof.ir. W. Zeiler (Eindhoven University of Technology) prof.dr.ir. B. de Vries (Eindhoven University of Technology)
ir. I.M.M.M.C. Naus (Cauberg-‐Huygen Raadgevende Ingenieurs)


III
Abstract Bedridden building occupants in hospitals and nursing homes who are not able to rescue themselves in case of a fire emergency require assistance during an evacuation. A building emergency team is usually assigned to fulfil this function and will have to remove the occupants from the room. The speed at which such an evacuation is conducted however is not documented and unknown. Assumptions are made when addressing the total evacuation time in hospitals and nursing homes, a theoretical basis on which the statutory regulations in the building code find their basis. Because this particular situation has never been properly investigated, it is also unknown if a safe evacuation of bedridden building occupants can be realized in case of fire. An experimental research is conducted in hospitals and nursing homes to obtain insight on the evacuation speed and absolute evacuation times required to judge whether a safe evacuation is possible or not. The results show that 50 percent of the measurements conducted in hospitals lay within a range of 0.81 to 1.01 metres per second, while for nursing homes the results range from 0.40 to 1.05 metres per second. The total evacuation time of one bed in a hospital will require at least 30 seconds when moving the bed outside the fire compartment. A simulation is furthermore conducted of a hospital and a nursing home, to obtain values on the available safe egress time in both a hospital and a nursing home. Different variants were simulated of the hospital model, which involve differences in heat release rate and the time constant. Comparing the experimental results with the simulation results indicates that a safe evacuation is strongly dependent on the arrival time of the building emergency team at the room in question and might cause critical situations in both hospitals and nursing homes if the arrival time were to take longer than 3 minutes. In that case, a safe evacuation from the room itself might not be possible. Furthermore the results show that many of the people who conducted the evacuations were insufficiently trained for this particular situation. The actions they performed during the experiments, e.g. opening doors and not closing them, could result in potentially dangerous situations if a real fire emergency is to occur.

Evacuation of bedridden building occupants 2
Acknowledgement This thesis serves as the end product of my master in Architecture, Building and Planning at the Eindhoven University of Technology. Within this education I have specialised myself in building physics at the department of Building, Physics and Services. First of all I wish to thank Ingrid Naus for providing me with assistance, knowledge, a graduation project, and a workstation to carry out my thesis at Cauberg-‐Huygen Raadgevende Ingenieurs in Zwolle. I also wish to thank Ruud van Herpen for sharing his knowledge on the particular subject and for his assistance during my graduation phase. I furthermore wish to thank Wim Zeiler and Bauke de Vries, for supervising my graduation project, their guidance, and sharing their knowledge. I also wish to thank Dave Hensen for his insight and knowledge of simulation models, and Frans Rikumahu for his guidance during four of the experiments executed at a nursing home. Also, I want to thank Harrie Jeurissen, Martijn Jeurissen, and Marcel van Alphen for their guidance and insight on performing evacuation drills. Furthermore I wish to thank Björn Peters for sharing his knowledge and expertise from his study on evacuation drills with bedbound patients. I am especially thankful to the people from the institutions that made this thesis possible, to mention: Ina Hamberg & Ger Bullinga from the Saxenburgh Groep, André de Lange from Leveste, Marcel Hoiting, Jan Tuinstra & Albêrt Heesink from the UMCG, Johan Schanssema from OZG, Sandra Karreman from Interzorg, Jos Heijnen from Tangenborgh, Bert van Maanen & Meeme Wubs from Refaja, Albertus Oosterhof from Noorderboog, and Henry Groeneveld & Hilde Bos from the Isala klinieken. As a last I wish to thank all the people who participated in the evacuation drills that were conducted on behalf of this project, for their cooperation and willingness to perform the evacuations. And I wish to thank my family and girlfriend for their support throughout my graduation period, together with my friends Robbin van Zanten, Dennis Oosthof & Ronald Huizinga for their help during the project.

Evacuation of bedridden building occupants 3
Table of content
Abstract ............................................................................................................................ III
Terminology ...................................................................................................................... 5
Nomenclature .................................................................................................................... 6
1 Introduction ................................................................................................................ 7 1.1 Problem statement & research question ............................................................................ 7 1.2 Research approach ............................................................................................................ 9 1.3 Boundary conditions .......................................................................................................... 9 1.4 Theoretical basis .............................................................................................................. 11
1.4.1 Applied grid ...................................................................................................................... 12
2 Method ...................................................................................................................... 13 2.1 The evacuation experiment ............................................................................................. 13
2.1.1 Outline of the evacuation experiment ............................................................................. 14 2.1.2 Measuring points ............................................................................................................. 14
2.2 The simulation of heat and smoke spread ........................................................................ 15 2.2.1 Variants ............................................................................................................................ 15 2.2.2 Untenable conditions ....................................................................................................... 15
3 Results ........................................................................................................................ 17 3.1 Experimental results ........................................................................................................ 17
3.1.1 Hospital #1 ....................................................................................................................... 18 3.1.2 Hospital #2 ....................................................................................................................... 20 3.1.3 Hospital #3 ....................................................................................................................... 22 3.1.4 Hospital #4 ....................................................................................................................... 25 3.1.5 Nursing home #1 .............................................................................................................. 27 3.1.6 Nursing home #2 .............................................................................................................. 29 3.1.7 Nursing home #3 .............................................................................................................. 31 3.1.8 Nursing home #4 .............................................................................................................. 34 3.1.9 Nursing home #5 .............................................................................................................. 36 3.1.10 Total of all measurement results ................................................................................... 39
3.2 Experimental results at the ICU ........................................................................................ 42 3.3 Simulation Results ........................................................................................................... 45
3.3.1 Simulation output ............................................................................................................ 45 3.3.2 Comparison to the measured data .................................................................................. 49
4 Discussion ................................................................................................................... 51 4.1 Discussion on the experiments (RSET) .............................................................................. 51 4.2 Comparison to other literature ........................................................................................ 52 4.3 Discussion on the simulations (ASET) ............................................................................... 54 4.4 General discussion ........................................................................................................... 55
5 Conclusions ................................................................................................................ 57 5.1 General conclusions ......................................................................................................... 57 5.2 Project-‐specific conclusions ............................................................................................. 58 5.3 Simulation conclusions .................................................................................................... 59
6 Recommendations for further research ...................................................................... 60
7 References .................................................................................................................. 61
8 Figure & Table list ....................................................................................................... 62

Evacuation of bedridden building occupants 4
Appendix A – Partners ...................................................................................................... 63
Appendix B – Survey ......................................................................................................... 64
Appendix C – FDS input data ............................................................................................. 65
Appendix D – Additional measurement results ................................................................. 67
Evacuation of bedridden building occupants 5
Terminology ASET Available Safe Egress Time: The period between the outbreak of the fire and the
point at which fatal environmental conditions have arisen. RSET Required Safe Egress Time: The period between the outbreak of the fire and the
point at which a safe place is reached. BET Building Emergency Team: A team that provides assistance to building occupants in
case of an emergency, e.g. a fire. In Dutch this is referred to as BHV (Bedrijfs Hulp Verlening).
RHR Rate of Heat Release: the rate at which heat is generated by a fire, described in
Watts per m2. FDS+EVAC Fire Dynamics Simulator + Evacuation: an evacuation simulation program that is capable of simulating a fire with smoke development and evacuation. CFD Computational Fluid Dynamics: a numerical calculation method that can simulate the fire and smoke development. NFPA National Fire Protection Agency: a United States trade association that creates and
maintains private standards and codes for usage and adoption by local governments. Flashover A situation in which a localized fire grows and the thermal radiation, hot gases, and
surfaces of the fire cause all combustible surfaces in the fire room to suddenly ignite. Backdraft A situation in which a fire is smothered due to the lack of oxygen but there is a large
amount of heat and flammable smoke still present. These gases can suddenly burst into flames or even cause a small explosion if oxygen is provided by for example opening a door or the breaking of a window.
CBUF Combustion Behaviour of Upholstered Furniture: a European project that focuses on
the fire behaviour and development of upholstered furniture. PPM Parts Per Million: the amount of particles of a gas or liquid (e.g. oxygen levels) per
million particles of a liquid or gas (e.g. smoke). LES Large Eddy Simulation: A simulation method that solves the large vortices and
excludes the small vortices. It can be used in the Fire Dynamic Simulator (FDS).

Evacuation of bedridden building occupants 6
Nomenclature Symbol Description Unit θ Mean temperature oC θ! Initial temperature oC t Time Min. Q Heat release rate kW α Growth rate factor for a particular fuel package kW/s2 t! Growth rate s R Light extinction coefficient m3/m2 K! Mass extinction coefficient m2/kg ρ Density kg/m3 γ! Soot yield g/g ρ! Density of air kg/m3 cp Specific heat kJ/kg-‐K T! Ambient temperature K g Gravity m/s2

Evacuation of bedridden building occupants 7
1 Introduction Research conducted by the Dutch Ministry of Housing, Spatial planning and the Environment (VROM) has shown that around thirty percent of the existing nursing homes and healthcare centres in the Netherlands cope with flaws in regard to structural fire safety measures, making direct governmental interference necessary (VROM, 2011). From this research it was also made clear that 81 out of the 93 investigated nursing homes and healthcare centres has some sort of shortcoming in regard to smoke and/or fire compartments. Less than half (42) out of the 93 investigated buildings has a sub-‐ fire and smoke compartment for the bedbound occupants, which is a statutory regulation. The report shows furthermore that in half of the investigated buildings, the Building Emergency Team (BET) was not properly informed. In 20 percent of the nursing homes however there were incidental shortcomings, while in the other 30 percent there were wrong and insufficient assumptions on the potential risks. Also the consciousness of fire safety of the staff is not yet sufficient and the municipal supervision is in many cases inadequate. 1.1 Problem statement & research question The trend of decreasing fire safety can be seen not only at the investigated nursing homes and healthcare centres, but also at other similar buildings throughout the country. This situation creates potentially dangerous scenarios if a fire would occur in such a building, especially for the occupants who are not capable of rescuing themselves. This particular group relies on the BET to help them evacuate the building. However, as mentioned before, in a large part of the nursing homes the BETs are insufficiently instructed and the risk assumptions are proven to be inadequate. In general though, one can say that a BET in a healthcare centre is most likely to be better organized than a BET in a nursing home, because a healthcare centre is constantly occupied and operates twenty-‐four hours a day while nursing homes generally have one person performing a night shift in a whole nursing home that sometimes house 50 occupants.
Figure 1.1 – Deaths by fire in the Netherlands. The red bars indicate the fires in dwellings; the blue bars indicate the buildings other than a dwelling. Statistics of 2009 only show the total number of deaths by fire (CBS, 2011). Figure 1.1 shows that according to statistical data on annual casualties as a result of fire, the average number of deaths in the Netherlands over a period from 2000 until 2010 is 72.6 (CBS, 2011). In the year 2010, a total of 65 deaths occurred due to fires from which 35 occurred in a residential dwelling (red bars) and 30 deaths occurred in buildings other than dwellings (blue bars). Residential dwellings in this particular case exclude the nursing homes. The statistical data of deaths in other building functions is not further specified because of a lack of data from the Centraal Bureau voor de Statistiek (CBS).

Evacuation of bedridden building occupants 8
Furthermore, according to research conducted in the United States over a period of four years (2004-‐2008), by the American National Fire Protection Association (NFPA), three out of every five victims of home fires where physical disability was a factor were over the age of 65 or older (Evarts, 2011).
Even though statistical data is not available on how many deaths have occurred in nursing homes or hospitals, data is available on the amount of fires that occurred and caused property damage in the Netherlands. This is shown for the year 2010 in figure 1.2 and is listed per building function. It is shown that in healthcare centres, 263 fires caused damage to hospital property in the year 2010. These numbers do not include nursing homes.
Special interest should be given to the smaller rooms in nursing homes, in which a fire will be more quickly out of oxygen and backdraft possibilities are far higher than in the larger hospital rooms. The arrival time of the BET is therefore of significant importance and the evacuation team will require proper instructions for this special matter. Also, a flashover situation is more plausible in the smaller nursing home rooms that generally have larger fire loads in comparison to hospital rooms, if enough oxygen is provided to the fuel by e.g. leaving a door open. Recent events such as the fire in the “Twenteborg” hospital where one person was killed in 2006, a fire in a nursing home in Valkenswaard where one person died as a cause of fire in 2011, and the nursing home “Rivierduinen” where three persons died as a cause of fire in the year 2011, have clearly shown that there still is a substantial chance for the occupants of nursing homes or healthcare facilities to become a victim of a fire. Besides these registered deaths there are numerous incidents in which people got injured as a result of a fire and there are also people who died from the consequences of smoke inhalation a few days later. It is therefore important to create a fire safe environment for these occupants, and especially for the occupants who are not able to rescue themselves in case of an emergency. For this reason, the following research question is brought up:
Can a safe evacuation of bedridden building occupants be realized in case of fire?
The research question involves bedridden building occupants in nursing homes and hospitals in a common room within a fire compartment. Safe evacuation in this case encompasses moving a person that is not capable of rescuing him-‐ or herself from the room to outside the fire compartment doors. Furthermore, the smoke conditions inside the corridor have to be taken into consideration if the room in which a fire is burning is being evacuated, because the smoke conditions inside the corridor will have an effect on the possibilities of evacuating the other rooms connected to the corridor. Smoke conditions in this case are referred to explicitly, because smoke travels faster than fire and will therefore be representative over the fire conditions inside the corridor.
Two sub-‐questions that arise with this research question are: ‘What is the evacuation speed of a bedridden building occupant and is there a difference in evacuation speeds in nursing homes and hospitals?’ and ‘How long is the Available Safe Egress Time (ASET) in a common nursing home or hospital room and corridor?’.
Figure 1.2 – Total number of fires that caused damage in the year
2010, grouped per building function (CBS, 2011).

Evacuation of bedridden building occupants 9
1.2 Research approach The research question and sub-‐questions are answered by conducting an experimental research on the evacuation speeds of bedridden building occupants, from which it is analysed whether it is possible to determine the Required Safe Egress Time (RSET). The RSET is then compared to the ASET, which is achieved by simulating a case study of a hospital and nursing home, and compared to the experimentally obtained results of that case study. An experiment is conducted because no data is yet available on the evacuation speeds of bedridden building occupants.
The experiment is conducted in a room within a fire compartment. The number of beds that have to be evacuated out of the room differs between each hospital and nursing home. Although the setting is different in every situation, figure 1.3 can be used to schematically describe the principle of this experiment. A fire is assumed to start anywhere in the room and the people inside will require to be immediately evacuated from the room, without the BET trying to extinguish the fire.
Figure 1.3 – Schematic representation of the experiment.
A simulation of a case study is conducted in the computer program ‘Fire Dynamic simulator’ (FDS). FDS (field model) is chosen over a zone model because it allows for a more detailed in-‐ and output of all influencing parameters. FDS uses the Large Eddy Simulation (LES) method to solve its input. FDS is a computational fluid dynamics (CFD) simulator. While most CFD simulators use the Reynolds Averaged Navier Stokes (RANS) to solve their vortices, FDS makes use of the LES methodology. For solving fire simulations a LES is more convenient to use than a RANS-‐simulation, because a LES calculates the turbulence itself while a RANS-‐simulation requires specific turbulence input. Furthermore the FDS simulation model makes use of properly verified and validated equations to solve the simulation and the fuel reaction parameters can be manually entered.
Two case studies, one hospital and one nursing home, are investigated with different settings to analyse the distribution in the outcome. The simulation is performed to retrieve an ASET on the case study. After the simulation is conducted, the ASET is compared to the RSET of the experiment conducted at the hospital or nursing home. The outcome of both the simulation and the experiments are then used to judge the safety of the bedridden occupants during a fire scenario.
1.3 Boundary conditions The commonly used fire curve for designing and determining the fire resistance of a construction and other building materials is the standard fire curve (NEN 6069, 2011). The standard fire curve supposes a fully developed fire and is based on the combustion of cellulose materials. It is described in the NEN 6069 and the NEN-‐EN 1363-‐1 (1).
! − !! = 345 ∗ log (8 ∗ ! + 1) (1) This standard fire curve is used in regulations of the Dutch building code and is generally used for determining the fire resistance of the building materials in the field of subject in this research. The
Evacuation of bedridden building occupants 10
current standard fire curve however shows a very steep incline in the pre-‐flashover period, which is due to the many safety factors that are included in this curve. For an evacuation study however, many of these safety factors are unwanted as they only serve to create a more fire resistant building construction. Therefore it is better to use either the ISO fire curves or the natural fire concept instead of the standard fire curve (NEN 6055, 2011). Another commonly used fire development scenario in the Netherlands is described in the ISO documents (NRC-‐CNRC, 2005) and the Dutch code NEN-‐EN 1991-‐1-‐2 (NEN-‐EN 1991-‐1-‐2-‐NB, 2010), in which a rate of heat release and a fire growth rate are defined per building function. According to this document a building with a healthcare function (hospitals and nursing homes) has a fire growth rate that is moderate (!! = 300!) and a rate of heat release of 250 kW/m2. Though the nursing homes and hospitals are assigned the same HRR and fire growth rate while the differences in HRR and fire growth rate between these two building functions can be substantial.
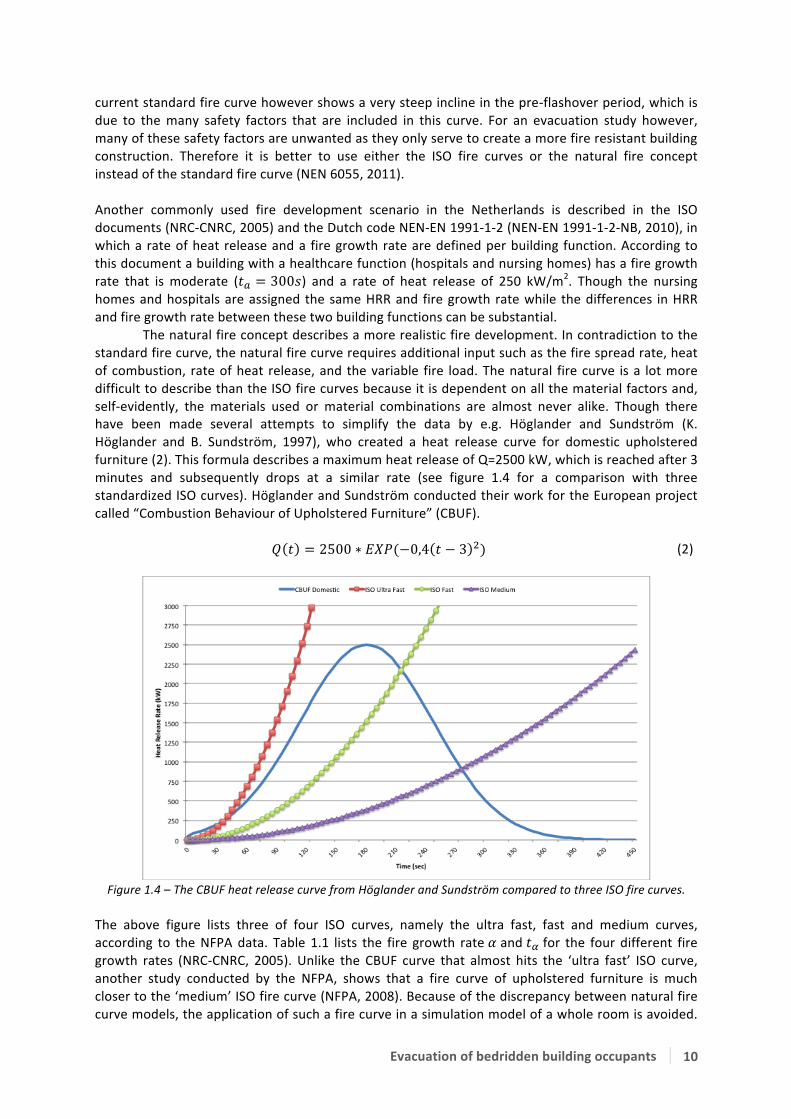
The natural fire concept describes a more realistic fire development. In contradiction to the standard fire curve, the natural fire curve requires additional input such as the fire spread rate, heat of combustion, rate of heat release, and the variable fire load. The natural fire curve is a lot more difficult to describe than the ISO fire curves because it is dependent on all the material factors and, self-‐evidently, the materials used or material combinations are almost never alike. Though there have been made several attempts to simplify the data by e.g. Höglander and Sundström (K. Höglander and B. Sundström, 1997), who created a heat release curve for domestic upholstered furniture (2). This formula describes a maximum heat release of Q=2500 kW, which is reached after 3 minutes and subsequently drops at a similar rate (see figure 1.4 for a comparison with three standardized ISO curves). Höglander and Sundström conducted their work for the European project called “Combustion Behaviour of Upholstered Furniture” (CBUF).
! ! = 2500 ∗ !"#(−0,4 ! − 3 !) (2)
Figure 1.4 – The CBUF heat release curve from Höglander and Sundström compared to three ISO fire curves.
The above figure lists three of four ISO curves, namely the ultra fast, fast and medium curves, according to the NFPA data. Table 1.1 lists the fire growth rate ! and !! for the four different fire growth rates (NRC-‐CNRC, 2005). Unlike the CBUF curve that almost hits the ‘ultra fast’ ISO curve, another study conducted by the NFPA, shows that a fire curve of upholstered furniture is much closer to the ‘medium’ ISO fire curve (NFPA, 2008). Because of the discrepancy between natural fire curve models, the application of such a fire curve in a simulation model of a whole room is avoided.
Evacuation of bedridden building occupants 11
Instead the medium fire growth curve is used according to the NEN-‐EN 1991-‐1-‐2-‐NB, because it is a widely accepted (and used) fire growth curve, which is also much applied in hospitals and nursing home fire calculations. Furthermore, the HRR can be varied in to be able to indicate the differences in fire development between nursing homes and hospitals.
Description ! (kW/s2) !! (sec.) Ultra Fast 0.190 75 Fast 0.047 150 Medium 0.012 300 Slow 0.003 600
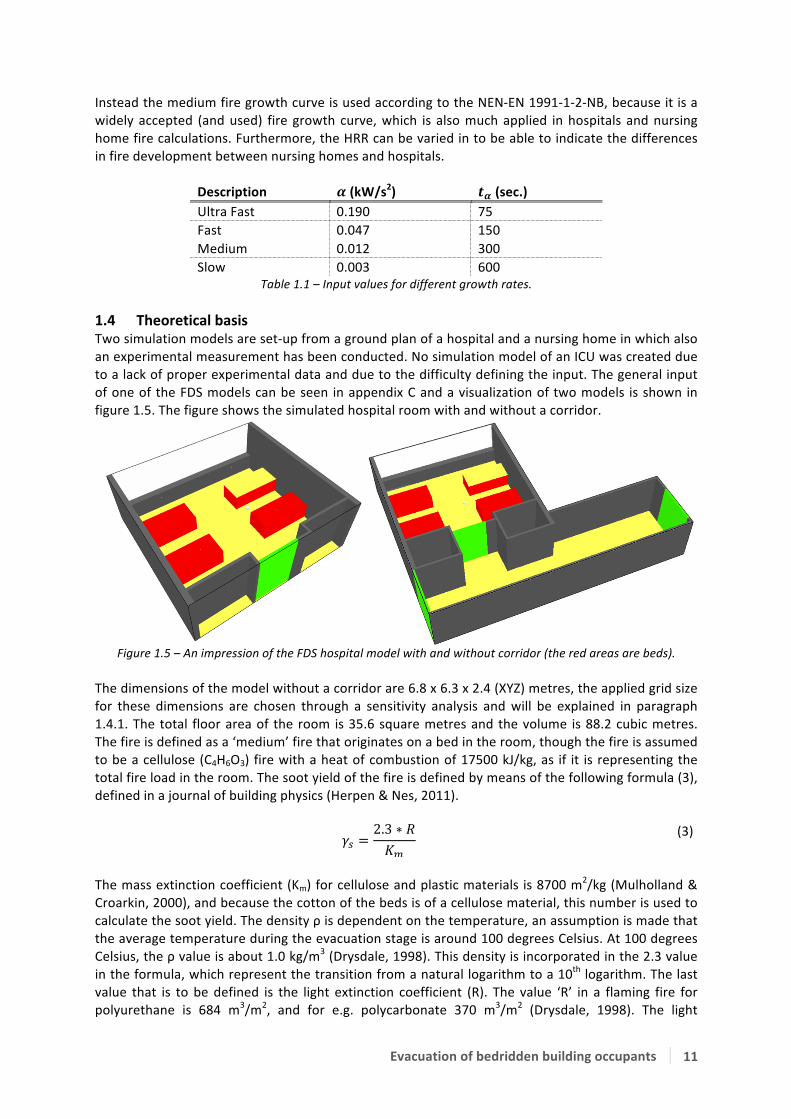
Table 1.1 – Input values for different growth rates. 1.4 Theoretical basis Two simulation models are set-‐up from a ground plan of a hospital and a nursing home in which also an experimental measurement has been conducted. No simulation model of an ICU was created due to a lack of proper experimental data and due to the difficulty defining the input. The general input of one of the FDS models can be seen in appendix C and a visualization of two models is shown in figure 1.5. The figure shows the simulated hospital room with and without a corridor.
Figure 1.5 – An impression of the FDS hospital model with and without corridor (the red areas are beds).
The dimensions of the model without a corridor are 6.8 x 6.3 x 2.4 (XYZ) metres, the applied grid size for these dimensions are chosen through a sensitivity analysis and will be explained in paragraph 1.4.1. The total floor area of the room is 35.6 square metres and the volume is 88.2 cubic metres. The fire is defined as a ‘medium’ fire that originates on a bed in the room, though the fire is assumed to be a cellulose (C4H6O3) fire with a heat of combustion of 17500 kJ/kg, as if it is representing the total fire load in the room. The soot yield of the fire is defined by means of the following formula (3), defined in a journal of building physics (Herpen & Nes, 2011).
!! =2.3 ∗ !!!
(3)
The mass extinction coefficient (Km) for cellulose and plastic materials is 8700 m2/kg (Mulholland & Croarkin, 2000), and because the cotton of the beds is of a cellulose material, this number is used to calculate the soot yield. The density ρ is dependent on the temperature, an assumption is made that the average temperature during the evacuation stage is around 100 degrees Celsius. At 100 degrees Celsius, the ρ value is about 1.0 kg/m3 (Drysdale, 1998). This density is incorporated in the 2.3 value in the formula, which represent the transition from a natural logarithm to a 10th logarithm. The last value that is to be defined is the light extinction coefficient (R). The value ‘R’ in a flaming fire for polyurethane is 684 m3/m2, and for e.g. polycarbonate 370 m3/m2 (Drysdale, 1998). The light
Evacuation of bedridden building occupants 12
extinction coefficient for cellulose materials is generally accepted around 100 m3/m2 (Herpen, 2013). It is assumed that the total of materials inside the room is mostly cellulose and some other materials like polyurethane foam. Though the value for cellulose already has some safety factors incorporated and therefore is a decent assumption for the soot yield inside the hospital room. When the above data is calculated, the soot yield will be 0.02644 g/g. This value is used in the simulation calculations. The visibility factor in the FDS model is set to ‘3’. Three in this case indicates that FDS is calculating the visibility for light reflecting object rather than light-‐emitting objects (NIST, 2010). The fire is furthermore simulated as if it would start and be detected at the moment the simulation starts running. It is simulated as if it would start at a single point on a bed, with a spread rate of 0.0027 metres per second, equal to a growth rate of 300 seconds. This value is varied in to get a certain amount of spreading on the outcome. Ventilation is simulated as a 30-‐centimetre square in the modular ceiling. The flow rate of this ventilation is about 3 times the room volume per hour, which corresponds to a speed of 0.0735 cubic metres per second. Also, as assumption to all the cracks near the door, a porous area of 10 centimetres is simulated at the bottom of the door. If smoke will come in front of this ‘crack’ it will flow out of the room at a speed defined by the pressure calculations in FDS. 1.4.1 Applied grid The grid sensitivity can be defined by a formula (4) in the FDS user guide. The formula is used to calculate grid sensitivity, where the outcome should lie between 4 (coarse) and 16 (fine).
!∗ =!
!! ∗ !! ∗ !! ∗ !
!! (4)
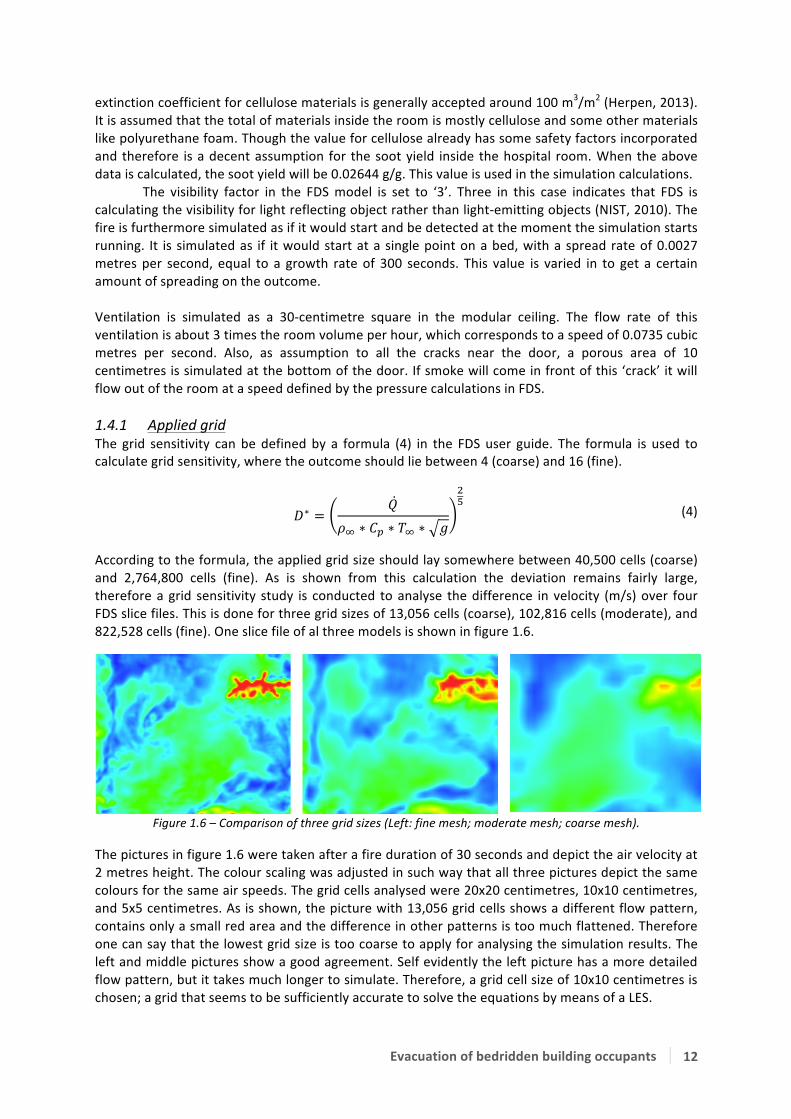
According to the formula, the applied grid size should lay somewhere between 40,500 cells (coarse) and 2,764,800 cells (fine). As is shown from this calculation the deviation remains fairly large, therefore a grid sensitivity study is conducted to analyse the difference in velocity (m/s) over four FDS slice files. This is done for three grid sizes of 13,056 cells (coarse), 102,816 cells (moderate), and 822,528 cells (fine). One slice file of al three models is shown in figure 1.6.
Figure 1.6 – Comparison of three grid sizes (Left: fine mesh; moderate mesh; coarse mesh).
The pictures in figure 1.6 were taken after a fire duration of 30 seconds and depict the air velocity at 2 metres height. The colour scaling was adjusted in such way that all three pictures depict the same colours for the same air speeds. The grid cells analysed were 20x20 centimetres, 10x10 centimetres, and 5x5 centimetres. As is shown, the picture with 13,056 grid cells shows a different flow pattern, contains only a small red area and the difference in other patterns is too much flattened. Therefore one can say that the lowest grid size is too coarse to apply for analysing the simulation results. The left and middle pictures show a good agreement. Self evidently the left picture has a more detailed flow pattern, but it takes much longer to simulate. Therefore, a grid cell size of 10x10 centimetres is chosen; a grid that seems to be sufficiently accurate to solve the equations by means of a LES.

Evacuation of bedridden building occupants 13
2 Method By means of experimental evacuation drills in hospitals and nursing homes, an attempt is made to derive an average evacuation speed of bedridden building occupants. At the very beginning of this research, volunteers were searched for participation and delivering a fire compartment where the research could be conducted. They furthermore had to collect the required personnel to execute this evacuation drill. The volunteers who were willing to cooperate and supply the required services for this experiment are shown by means of their logo in appendix A. The measurements are conducted under strict conditions, which will be explained in paragraph 2.1, to be able to compare results from different buildings with one another. Afterwards one of the compartments in which an experiment is conducted will be used as a case study in a simulation for both a hospital and a nursing home situation. The simulation is run to determine a certain ASET, which can then be compared to the experimentally defined RSET.
2.1 The evacuation experiment An experiment is set-‐up to retrieve evacuation speeds of bedridden building occupants. If an experiment deviates in any way from the master version as described in paragraph 2.1.1, a note will be added to the results in chapter 3. The experiment is performed by evacuating at least one bedridden patient from a room inside a fire compartment. A person or dummy was placed on the bed in order to imitate the real weight that is delaying the movements of the evacuating people. The bed, with the person or dummy, is moved through the hallway and is brought outside the fire compartment. The evacuation scenario can be used with one bed but also with e.g. four beds in a room, and can be replicated in different nursing homes or hospitals.
Figure 2.1 – The evacuation scenario.
The evacuation scenario of a bedridden building occupant can be divided in four steps, according to figure 2.1. The procedure will begin outside the fire compartment doors and two employees of the hospital or nursing home will conduct the evacuation of the bed(s). They will get a sign to start the evacuation and move towards the first bed they will need to evacuate from the fire compartment; this stage of the experiment is defined as the ‘arrival of assistance’ stage, later referred to as ‘arrival’ stage. Following up they will need to uncouple the imaginary patient from a drip or perhaps an artificial respiration system. It can also occur that the bed requires electricity to change its stance, then the bed will also require to be uncoupled from the electricity grid; this second stage is defined as the ‘uncoupling’ stage. Afterwards the actual evacuation can begin; during this stage the bed is moved from the room, through the hallway and finally moved through the fire compartment doors. This stage is defined as the ‘evacuation’ stage. As a last step the bed has to be positioned in such way that more beds can be evacuated and positioned behind the fire compartment doors; this part of the experiment is defined as the ‘positioning’ stage. In case more than one bed is evacuated from the room, the process is repeated as soon as the evacuating personnel move through the fire compartment doors again.
This whole scenario is recorded on three different cameras to determine the required time to evacuate one or multiple bed(s) out of the fire compartment. The evacuation speeds are later defined by measuring the travelled distances from a floor plan and divide the distance by the travelling time. The video images can furthermore be used for later analysing on the evacuation conditions and may be used, though only with similar confidentiality as was used in this thesis.

Evacuation of bedridden building occupants 14
2.1.1 Outline of the evacuation experiment The experimental research is subject to a strict outline because the results need to be reproducible. More importantly, the results must be comparable to results from other nursing homes or hospitals and therefore there should be as few variables as possible. The restrictions that apply for this experimental research are as follows: § A minimum of 1 hospital bed, 1 fire compartment, 1 room and 3 people (of which 2 conducting
the evacuation and 1 evacuee) to conduct the evacuation; § If possible the person has to be coupled to a drip or an artificial respiration device; § The hospital beds shall be placed on the brake-‐stance and coupled to the electricity grid (if
possible), before the evacuation procedure starts; § The compartment doors, and if possible the room doors, shall be self-‐closing. If the room doors
are not self-‐closing they shall be closed after every evacuation procedure; § No artificial fire-‐ or smoke apparatus shall be used during the experimental research; § Every evacuation-‐team is instructed about what is going to happen, prior to the evacuation
procedure. By conducting the experiment with help of the restrictions above, the variables are drawn back to a minimum and are only dependent on project-‐specific characteristics, such as: § Bed type and dimensions; § Compartment dimensions; § Door width; § Type of fire compartment door; § Incidental blockings/malfunctioning’s; § Experience of the BET; § Personal responses on the situation. Afterwards a survey is to be filled in by all the people who were conducting the evacuation procedure to retrieve information about their experience with similar scenarios or real fire hazards. The survey that was used for the experimental research can be seen in appendix B (in Dutch). 2.1.2 Measuring points To accurately determine the required time needed to complete each stage of the experiment, four different measurement points are defined. The first point being the start of the “arrival” stage that is defined by the moment when the compartment doors are swung open. The end point of this stage and the beginning of the “uncoupling” stage is defined at the point where one of the two people conducting the evacuation is touching the bed or the apparatus connected to the bed or person. The “evacuation” stage starts when the bed is ridden outside the room and stops when the bed is fully evacuated through the fire compartment doors. The fourth, “positioning”, stage starts at the endpoint of stage 3, and ends when the fire compartment doors are swung open. If the experiment is done with multiple beds the whole procedure starts over again. The evacuating personnel are asked to run back through the compartment doors after they have evacuated the last bed to define the endpoint of the positioning stage.

Evacuation of bedridden building occupants 15
2.2 The simulation of heat and smoke spread The hospital simulation model is simulated in different variants to get an indication of the spreading that occurs on the outcome of the results. This will not be done for the nursing home, which was only simulated once. The results of the simulation models are judged to get an indication on the ASET. Before the simulation models can be analysed, the judgement criteria have to be defined. These criteria are referred to as untenable conditions, because the untenable conditions to a human being are the best indicators if a safe evacuation is still possible. 2.2.1 Variants A couple of variants are simulated to obtain insight in the spreading on the simulation results. This is only done for the hospital simulation. Variances are created on three levels: three amounts of RHR are simulated, three time constants are simulated, and a simulation is conducted in which the door is opened and closed according to the time that the evacuation team was inside the room. Table 2.1 gives an overview of the variants that are simulated and lists a reference number that is used in chapter 3.3 to link it with the simulation results.
Variant RHR (kW/m2) Time constant (sec.) Reference no. (#)
Door closed
100 300 1 250 300 2 375 300 3 250 600 4 250 100 5
Door opened at pre-‐defined times
100 300 6 250 300 7 375 300 8 250 600 9 250 100 10
Table 2.1 – Simulation variants. The second variant is simulated as if the evacuation team was conducting an evacuation: leaving the door open while they were inside the room and closing the door behind them. The time schedule that is applied for this is: 60 seconds until arrival – 35 seconds door open – 22 seconds door closed – 35 seconds door open – 22 seconds door closed – 17 seconds door open – 22 seconds door closed – 17 seconds door open – door closed during the rest of the simulation. This time schedule is taken from one of the executed evacuation rounds during the experimental evacuation. The difference in the evacuation of 35 seconds and 17 seconds is explained by the fact that two persons were coupled to a drip. The nursing home is only simulated in one variant with a HRR of 250 kW/m2 and a time-‐constant of 300 seconds. This is done because nursing homes generally have a higher fire load than hospitals, where a HRR of 250 kW/m2 and a time constant of 300 seconds will probably a realistic assumption. The door opening and closing times are applied as if an evacuation drill was being conducted. The schedule that is applied is: 4 minutes and 10 seconds until arrival and door opening, after 4 minutes and 40 seconds the door closed again and opened again at 4 minutes and 50 seconds. The door was not closed again, not even after the victim was evacuated at 6 minutes and 17 seconds. 2.2.2 Untenable conditions Untenable conditions indicate the point at which the fire or smoke effects reach predefined limitations. This limit is described as the point after which a human being can get injured as a result of fire or smoke. The period before untenable conditions are reached is usually referred to as the ASET, or Available Safe Egress Time, but also as the pre-‐flashover period in which there is still time to

Evacuation of bedridden building occupants 16
evacuate people. The untenable conditions are defined by different researches and are usually expressed via e.g. a maximum temperature, heat flux and oxygen volume fraction. George V. Hadjisophocleous and Noureddine Benichou however, combined all these researches and listed the deterministic criteria in a table (Hadjisophocleous & Benichou, 1999). The table indicates the criteria in both an upper and a lower limit and can be used to assess simulation results. A part of the data is shown in table 2.2. The source however does not couple these numbers to any exposure duration.
Criteria Lower limit Upper limit Convection heat (oC) 65 190 Oxygen volume (%) 10 15 Carbon monoxide (ppm) 1400 1700 Carbon dioxide (%) 5 6 Hydrogen cyanide (ppm) -‐ 80 Visibility (m1):
-‐ Primary fire compartments 2 3 -‐ Other rooms 10 -‐
Table 2.2 – Summary of upper and lower limits of deterministic criteria (Hadjisophocleous & Benichou, 1999). As soon as one of the in table 2.2 listed criteria is reached, the room is considered unsound because the conditions for any human being have become untenable. The amount of toxic gases in the air is one of the most important criteria for analysing the moment at which critical conditions occur. These criteria however are different for every toxic gas inside a smoke layer, and because there are dozens of gases that can contribute to the toxicity of a gas layer during a fire it is impossible to determine all these criteria individually. Therefore, the Dutch organization for applied scientific research, TNO, has developed a table that couples the critical gas concentration to a measure of visibility (Lemaire, 2005). In total four gases have been described with the gas HCL (hydrogen chloride) as the most severe gas, reaching critical conditions at a visibility length of 6.23 metres. This value concerns only the sight length of reflective objects to the human eye and not the illuminated objects. Furthermore the paper states that a sight length above 10 metres in a fire scenario is not problematic when analysing the toxicity of a gas layer. These values do not require any coupling to exposure duration and can be used singularly to determine the untenable conditions. Besides the temperature criteria in the table 2.2, the Dutch Ministry of Infrastructure and the Environment has created a more detailed definition of when critical temperature conditions are reached (Rijkswaterstaat, 2002). A table has been created by this organization to explain the critical temperatures and their consequences. This data can be seen in table 2.3.
Temperature (oC) Response 127 Difficulty breathing 140 Tolerance limit if exposed for 5 minutes 149 Difficulty in breathing through mouth, limit during evacuations 160 Unbearable pain 182 Irreversible damage within 30 seconds 200 Human respiration system succumbs within 4 minutes
Table 2.3 – Temperature versus response (Rijkswaterstaat, 2002). The reference furthermore describes 150 degrees Celsius as a limit in which burns will appear on a person his or her skin within an exposure of 5 minutes. The criteria ‘Temperature’ and ‘Visibility’ will be used to assess the critical conditions in the fire simulation for the ASET of the evacuees rescuing bedridden building occupants. For the visibility parameter, the time to reach a visibility of 10 metres will be assessed as well as the time to reach the 6.23 metres. For the temperature criterion the time to reach 150 degrees Celsius is assessed as a limit to which the evacuation team can still operate.

Evacuation of bedridden building occupants 17
3 Results The experimental results are written down in no specific order, starting with the hospitals and thereafter the nursing homes. The experimental drill that was conducted at an intensive care unit is presented as a separate chapter. The hospitals and nursing homes are referred to as numbers to avoid linking the measured results to certain hospitals or nursing homes. The simulation is conducted of a single case study, and is compared to the gathered data from the experimental measurements. 3.1 Experimental results The measured results are presented as an arrival speed, an evacuation speed, an uncoupling time, and a positioning time. The results are shown in a Whisker plot with a mean written down in a table for each measurement. The evacuation speed measurements are presented first because these involve the most important measurement results. At the end of this paragraph the results are combined to retrieve a total of both the hospital and nursing home measurements. Additional data, such as the remarks that were made during the measurement or the kind of coupling, are written down for each evacuation drill. A Whisker plot shows the median of the results as well as the skewness. Furthermore, a Whisker plot is designed in such way that one can see the total range of the results, the 50 percent range and the peak numbers in one single graph. A short explanation on how to read a Whisker plot is given in figure 3.1.
Figure 3.1 – Explanation of an example Whisker plot.
As shown, the 50 percent range represents a blue and red part that is separated by the median. At both sides of the 50 percent range is a line with a maximum length of 1.5 times the ∆ of the 50 percent range. These lines can be shorter if there are no peak values outside the value to where the length extends. In (example) figure 3.1 however, there are two peak values: both a lower and a higher one. These peak values are shown as circles, in which each circle represent a single value. At the end of every subparagraph, a section is created in which the most critical and interesting observations or conclusions are written down.

Evacuation of bedridden building occupants 18
3.1.1 Hospital #1 The evacuation scenario was conducted by two men of 45 and 54 years old, who both had much experience in conducting evacuations (both had participated in evacuation-‐drills over 14 times). One of them conducted an actual evacuation during a fire emergency situation, and both had experienced fire emergency situations. In total they have evacuated three beds in four rounds. Furthermore, their profession at the hospital involves coordinating the hospital its BET and one of them is involved in the voluntary fire department. Three beds were evacuated from a room connected to a straight hallway, which is shown in figure 3.2. The evacuation path is indicated with a dashed line, and the beds were staged behind the compartment doors on the lower right part of the figure. The compartment doors were made self-‐closing by switching off the power to the door-‐spring. As can be seen in figure 3.2, the compartment doors can only open in one direction, which might affect the evacuation results. The door towards the room itself was not self-‐closing, but was closed after each bed was removed. This door has a width of 115 centimetres. During the evacuation period however, the door was left open. Three volunteers took place in the beds to simulate an actual emergency situation. All three beds were coupled to electricity and at one time, one person was coupled to a respiration device to analyse the difference in uncoupling time. The beds had a width of approximately 90 centimetres.
Figure 3.2 – Ground plan of the room in hospital #1, the dashed line shows the evacuation route.
Both men moved relatively slow (normal pace) towards the room that was subject to evacuation. Also, during the arrival stage at the start of each new round, one of them felt the door by hand, which is common practice for each BET member. Furthermore a wheelchair user blocked the evacuation route once and the arrival stage was hindered another two times. These results are incorporated into the graphs of figure 3.3.

Evacuation of bedridden building occupants 19
Figure 3.3 – Measured data from hospital #1, created from 12 evacuation drills. Evac. speed Arrival speed Uncoupling Positioning Total time Mean values 0.797 m/s 1.331 m/s 6.833 sec. 10.250 sec. 66.250 sec.
Table 3.1 – Mean values of all five parameters from hospital #1. Figure 3.3 gives the results of the evacuation drill held at the hospital and table 3.1 shows the mean values. The graphs were created from 12 evacuation drills in total. It is shown that the evacuation speeds and positioning times have a relatively small 50 percent range, which indicates that these numbers are much the same. The lowest peak value in the evacuation speed was a result of hindering by a wheelchair user. No relation was found for the highest peak value. The results indicate that the uncoupling time is very dependent on the experience; the first round took significantly longer than the other three rounds. The coupling to a respiration device is clearly shown as a peak value in the graph, which took them 18 seconds to fully uncouple. The coupling to the oxygen supply also resulted in the longest evacuation time of 76 seconds. Positioning the beds was done in such way that all three beds could be positioned near the central staircase. The positioning times have a relatively small 50 percent range of less than 1.5 seconds. The BET felt the door prior to entering the room as an indicator of heat, and they did open the door slowly as if a backdraft situation would be possible. They furthermore closed the door after evacuating each individual bed, which would stop the smoke from further spreading down the corridor in a real fire emergency situation. The door was not closed while they were inside the room to uncouple and evacuate the bed from the room. Incidental hindering can occur during an evacuation scenario as is shown from the lowest peak value in the evacuation speed. This will affect the total evacuation scenario and might slow the evacuation procedure in total. Experience with the evacuation scenario seems also to improve (shorten) the evacuation times and the uncoupling times.

Evacuation of bedridden building occupants 20
3.1.2 Hospital #2 Four women of 26, 30, 35, and 38 years old who had no experience at all with evacuation drills or any other emergency situation conducted the evacuation scenario. All four women have a nursing and caring profession at the hospital, in the same department in which the drill was conducted. Two women conducted the evacuation each round, for a total of five rounds. The group compositions however did not change during the rounds, so one group of two has conducted the evacuation three times while the other group did the evacuation scenario twice. Four beds were evacuated from a room connected to a straight hallway with slightly angulated compartment doors as shown in figure 3.4. The evacuation route is indicated with a dashed line, and the beds were staged behind the compartment doors on the lower right part of the figure. The compartment doors were made self-‐closing by covering the release-‐button with tape. As can be seen in figure 3.4, the compartment doors can only open in one direction, although this is the favourable direction with regard to the evacuation path. The door towards the room itself is a double door of different sizes, one door has a width of 88.5 cm and the smaller door has a width of 53.5 cm. Furthermore, one door has to be opened before the other can be pushed open and both doors were not self-‐closing. Four women other than the two evacuating were positioned on the four beds inside the room to simulate a realistic fire scenario. This does, however, imply that the two women that had to execute the evacuation in the latter round already had some prior knowledge of how to conduct the evacuation. All four beds were coupled to electricity and to a kind of service-‐remote. Furthermore, two out of four beds were coupled to a drip. The beds had a width of approximately 102 centimetres.
Figure 3.4 – Ground plan of the room in hospital #2, the dashed line shows the evacuation route.
The women conducting the evacuation were very eager to get “good results” and ran towards the room subject to evacuation. Furthermore, the uncoupling of the first bed took disproportionally long and would not be realistic in a fire scenario because e.g. the team was searching for materials to hang the drip. During one evacuation the cable jammed the wheel of the bed. Both results can be clearly distinguished in the Whisker plots that are shown in figure 3.5.
Evacuation of bedridden building occupants 21
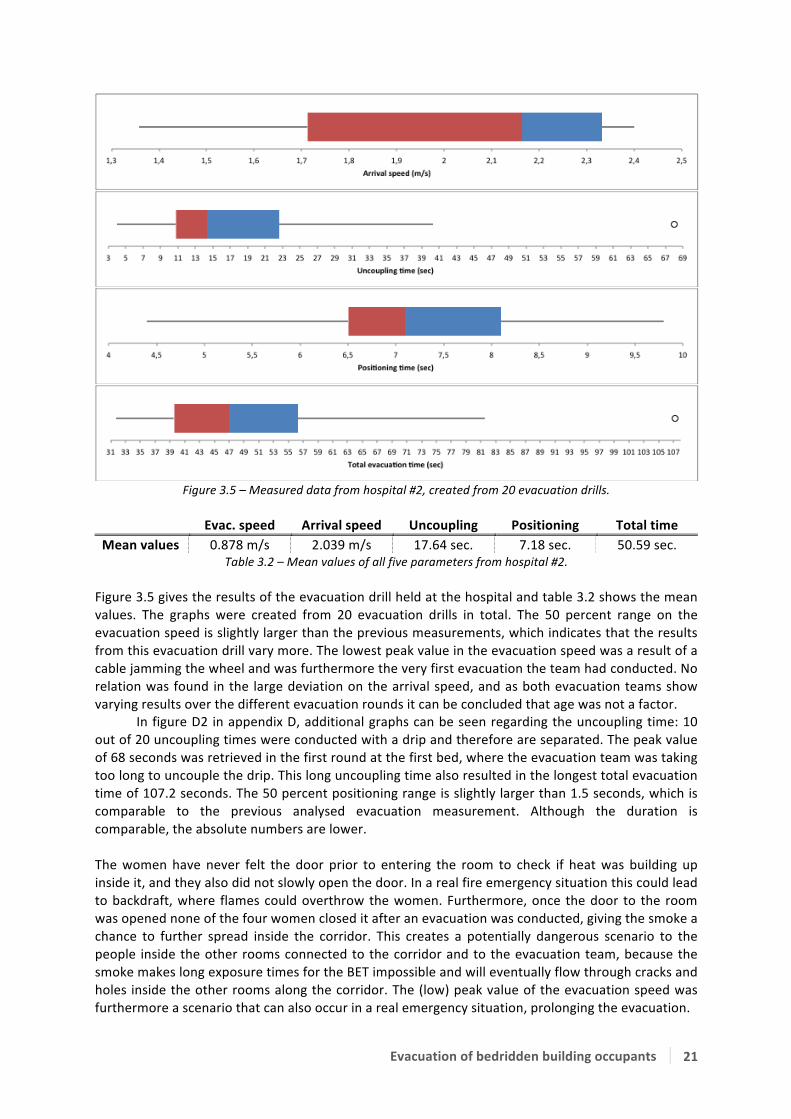
Figure 3.5 – Measured data from hospital #2, created from 20 evacuation drills. Evac. speed Arrival speed Uncoupling Positioning Total time Mean values 0.878 m/s 2.039 m/s 17.64 sec. 7.18 sec. 50.59 sec.
Table 3.2 – Mean values of all five parameters from hospital #2. Figure 3.5 gives the results of the evacuation drill held at the hospital and table 3.2 shows the mean values. The graphs were created from 20 evacuation drills in total. The 50 percent range on the evacuation speed is slightly larger than the previous measurements, which indicates that the results from this evacuation drill vary more. The lowest peak value in the evacuation speed was a result of a cable jamming the wheel and was furthermore the very first evacuation the team had conducted. No relation was found in the large deviation on the arrival speed, and as both evacuation teams show varying results over the different evacuation rounds it can be concluded that age was not a factor.
In figure D2 in appendix D, additional graphs can be seen regarding the uncoupling time: 10 out of 20 uncoupling times were conducted with a drip and therefore are separated. The peak value of 68 seconds was retrieved in the first round at the first bed, where the evacuation team was taking too long to uncouple the drip. This long uncoupling time also resulted in the longest total evacuation time of 107.2 seconds. The 50 percent positioning range is slightly larger than 1.5 seconds, which is comparable to the previous analysed evacuation measurement. Although the duration is comparable, the absolute numbers are lower. The women have never felt the door prior to entering the room to check if heat was building up inside it, and they also did not slowly open the door. In a real fire emergency situation this could lead to backdraft, where flames could overthrow the women. Furthermore, once the door to the room was opened none of the four women closed it after an evacuation was conducted, giving the smoke a chance to further spread inside the corridor. This creates a potentially dangerous scenario to the people inside the other rooms connected to the corridor and to the evacuation team, because the smoke makes long exposure times for the BET impossible and will eventually flow through cracks and holes inside the other rooms along the corridor. The (low) peak value of the evacuation speed was furthermore a scenario that can also occur in a real emergency situation, prolonging the evacuation.

Evacuation of bedridden building occupants 22
3.1.3 Hospital #3 Evacuation measurements in this hospital were conducted two times on different days, but in the same compartment and room. Two men and two women of respectively 44, 51, 29 and 34 years old, who all had relatively much experience with evacuation drills, conducted the first evacuation procedure. One woman and one man conducting the evacuation drill are employees of the BET training staff, while the other two have a managerial function within the hospital. The BET training staff conducted the first three evacuation rounds while the other two persons conducted two more evacuation rounds, totalling five evacuation rounds in which 20 beds were evacuated. Three men and three women conducted the second evacuation measurement, from whom two also participated in the first evacuation measurement. The three men and three women were respectively 25, 44, 45 and 21, 22, and 34 years old. The man and woman who also participated in the previous evacuation measurement have very much experience in evacuation drills, and from the newly added people only one has much experience, one has participated in an evacuation drill once and the other two were not familiar with the evacuation procedure at all. The woman of the first evacuation measurement conducted the first three rounds in collaboration with the man of 45 who had relatively much experience. The man who also participated in the first measurement together with the man of 25 years old conducted the following two rounds. Finally, the two women who had almost no experience in evacuation drills conducted the last round. This last round was performed with smoke production and flashing light. A total of 19 beds were evacuated, of which 3 were removed during the first five rounds and 4 were removed during the last round. During the first evacuation measurement four out of six beds were evacuated from the room, and during the first three rounds two people positioned themselves on two beds, while the other two beds were filled with dummies. During the last two evacuation rounds four people positioned themselves on all four beds. Furthermore, during the first evacuation measurement two persons were coupled to a drip during all five rounds, from which one was positioned on the electrical bed. At the second evacuation measurement, three people were positioned on three beds (and four during the last round). No drips or other couplings were used and one out of three (or four) beds was an electrical one.
Figure 3.6 – Ground plan of the room in hospital #3, the dashed line shows the evacuation route.
The compartment consists of one long corridor of 39.5 metres long with hospital rooms at one side of the hallway and facility rooms at the other side. One room with six beds, in the middle of the corridor, is used to evacuate from (see figure 3.6). The beds were moved outside the room and through the fire compartment doors as indicated by the dashed line in figure 3.6. The compartment doors were made self-‐closing by covering the release-‐button of the door magnet with tape. The

Evacuation of bedridden building occupants 23
entry door to the room itself was made self-‐closing by switching off the power to the door spring. As cannot be seen from the figure, the compartment doors can only open in one direction, which is in the opposite direction of the evacuation route. The width of the entry door of the room is 116 centimetres. Two different types of beds were used; one electrically powered and three non-‐electrical beds. The electrical bed had a width of 99 centimetres while the other three beds were 92 centimetres wide. All evacuation teams moved relatively fast (ran) towards the room to evacuate the bedridden patients. They were instructed prior to the measurement to not touch the door but directly open it. The two measurements were combined into one figure (figure 3.7) to analyse a total of 39 evacuation measurements, conducted by 8 people in total.
Figure 3.7 – Data of all evacuation measurements from hospital #3, created from 39 evacuation drills.
Evac. speed Arrival speed Uncoupling Positioning Total time Mean values 1.016 m/s 2.201 m/s 5.179 sec. 5.974 sec. 48.43 sec.
Table 3.3 – Mean values of all five parameters from hospital #3. Figure 3.7 shows the combined data of two separate measurements, taken at the same hospital at exactly the same location at a different time and table 3.3 shows the mean values. A relation in the evacuation and arrival speed can be seen between the first and succeeding evacuation rounds. It is clearly shown that during both rounds, for both groups, significantly lower evacuation speeds were achieved than the succeeding rounds. The evacuation speed graph shows a 50 percent spreading from 0.9 m/s to 1.13 m/s with a right skewed distribution, i.e. results are more probably to lay under the median rather than above the median of 1 m/s. The two nurses who conducted the evacuation

Evacuation of bedridden building occupants 24
during the last round with smoke and flashing lights were surprisingly fast in evacuating the four beds. Even though they had almost no experience with such evacuation drills, they managed to achieve evacuation speeds of 0.96 to 1.23 m/s. The total range in which the arrival speeds lie is over 1 m/s. This is due to the differences in age, but also due to the fact that teams started of slowly and ran in the latter rounds. The Whisker plot is slightly skewed to the left, indicating that the outcomes right of the median are slightly more probable. The uncoupling times in this combination include: connections to a drip or not, electrically powered beds and sometimes both. As a result, the box plot has a very wide range of outcomes from 2 to 8 seconds. Because there is more data of uncoupling a bed without drip or electricity, the plot in figure 3.7 is skewed to the right. The figure also shows that fifty percent of the positioning time is located in the range from 4 to 6.7 seconds. The four peaks are the measurements from the first round, which were not very realistic due to slow walking and positioning. The range of 2.7 seconds can be explained by the fact that the first bed takes the longest time because it is positioned further away from the compartment door, while the last is positioned directly behind it. The total evacuation time is clearly skewed to the right; as a result of long positioning and uncoupling times there are some peak values to the far right of the plot that are still in range to appear as a line in the Whisker plot. During the first evacuation drill the evacuation speed was slightly higher with dummies in comparison to the speeds with real people. Also if the teams did not discuss in advance about which bed to evacuate first, small mistakes could happen such as: both uncoupling different beds or both running towards different beds. These mistakes appear to be small, though they cost some time, which is often crucial in these particular situations. As mentioned before, the evacuation teams were instructed to not feel the door prior to entering the room. In a real fire emergency situation though, they are accustomed to perform this action. The door was furthermore self-‐closing, thus after each evacuation was performed it automatically closed and the BET did not have to perform this action. Though they also did not check if the door was fully closed and in some cases it was not, creating the possibility of some smoke to leak to the corridor. If this would happen during a real fire emergency situation, safe evacuation possibilities of the patients in the other rooms is decreasing with increasing time.

Evacuation of bedridden building occupants 25
3.1.4 Hospital #4 A man and a woman of respectively 33 and 52 years old conducted the experimental evacuation scenario in this hospital. The woman had experienced an evacuation drill with bedbound patients once while the man had no experience in evacuating bedbound patients. The man had furthermore participated in an evacuation drill twice, while the woman participated in an evacuation drill once but has also experienced an actual fire emergency in which she did not evacuate any people. In total they have evacuated four beds in five rounds. Furthermore, their profession at the hospital involves nursing hospital patients. Four beds were evacuated from a room connected to a straight hallway, which is shown in figure 3.8. The evacuation path is indicated with a dashed line, and the beds were staged behind the compartment doors on the left part of the figure. The compartment door was made self-‐closing by switching off the power to the door-‐spring. As can be seen in figure 3.8, the compartment door can only open in one direction, which might affect the evacuation results. The door towards the room itself was not self-‐closing, but was sometimes closed after a bed was removed. This door has a width of 111 centimetres. Four volunteers took place in the beds to simulate an actual emergency situation. All four beds were coupled to electricity and one of the volunteers was coupled to a drip. The beds had a width of approximately 102.5 centimetres.
Figure 3.8 – Ground plan of the room in hospital #4, the dashed line shows the evacuation route.
The man and woman generally moved relatively fast (ran) towards the room. They furthermore did not touch the door prior to entering the room. A wheelchair partly blocked the evacuation route during the first evacuation stage. They were hindered two times during the arrival-‐ and positioning stage. These results are incorporated into the graphs of figure 3.9.

Evacuation of bedridden building occupants 26
Figure 3.9 – Measured data from hospital #4, created from 20 evacuation drills.
Evac. speed Arrival speed Uncoupling Positioning Total time Mean values 0.843 m/s 2.131 m/s 4.690 sec. 9.035 sec. 40.355 sec.
Table 3.4 – Mean values of all five parameters from hospital #4.
Figure 3.9 gives the results of the evacuation drill held at the hospital and table 3.4 shows the mean values. The graphs were created from 5 evacuation rounds and 20 evacuation drills in total. In general, the evacuation speed results are faster than the first evacuation measurement but slower than the 2nd and 3rd measurements, with a 50 percent range between 0.79 and 0.9 metres per second. The reason for this relatively low evacuation speed might find its cause in the limited distance between the bed and the doorpost: the bed is 102.5 centimetres while the door width is 111 centimetres. Furthermore, once outside the room the bend that the evacuation team has to take with the bed is relatively small. The arrival speed is fairly comparative to the 2nd and 3rd evacuation measurement, which indicates that they were running at a relatively normal pace. Figure D4 in appendix D gives the additional uncoupling graphs. The graphs have been split to be able to analyse the difference in uncoupling with and without a drip. Though only five out of 20 measurements were conducted with a drip, which is the reason of the large skewness in the first picture of figure D4. It is shown that the higher values of an uncoupling with drip move the 50 percent range of the Boxplot from all measurements slightly to the right (figure 3.9). The positioning time is strongly dependent on where they put the beds once they were outside the fire compartment. Since the hallway was quite busy, they had to position the beds in line where, self-‐evidently, the first bed takes longer to position because it is furthest away. The peak value that is shown in figure 3.9 is a result of hindering during the positioning stage. The total evacuation time is clearly skewed to the right. There are a few peak values that contribute to this skewness: one is the first evacuation conducted, where a wheelchair was hindering the route, the other can be explained by a connections to a drip or other hindering. No relation was found in the fact that the door was closed sometimes after having left the room; instead the highest evacuation speed was achieved when they closed the door after leaving the room. The BET did not close the door after they have evacuated each bed. When they received the instruction to close the door they forgot to do so a few times until they had practised enough. The door was also left open during the time the BET was inside the room. Hindering furthermore has resulted in a peak value at the arrival speed and positioning time. The width between the door and the bed also seems to have an influence on the evacuation speed because of the small bend that is to be made in the corridor.
Evacuation of bedridden building occupants 27
3.1.5 Nursing home #1 The evacuation scenario conducted in this nursing home was slightly different than the standard scenario that was set-‐up for the experimental study. The evacuating personnel was instructed prior to the evacuation drill, but they were waiting in the canteen to be informed about the emergency via a beeper that was automatically triggered by the smoke detector. Once they were informed about the fire emergency situation, the personnel moved towards the assembly point to receive further instructions, put on an evacuation blouse and get a flashlight. The coordinator sent two people to the emergency room for inspection. As soon as they arrived at the scene they started applying their BET techniques, such as feeling the door and keeping in contact with the coordinator at the assembly point. Furthermore, at some a certain time there were three people evacuating the bed instead of two people as is described in the measurement protocol of the experimental study. The drill as described above was conducted two times with the same two people. In both situations a third person arrived, after they started evacuating the bed, for extra help. Also this third person was the same in both two rounds. The two persons that were sent to the scene first were two women of 55 and 60 years old. One of them had experienced an actual fire emergency situation twice and during one of this situations also conducted an evacuation. Even though one of them has witnessed a fire emergency situation twice, she had only attended two evacuation drills and the other woman only attended one evacuation drill.
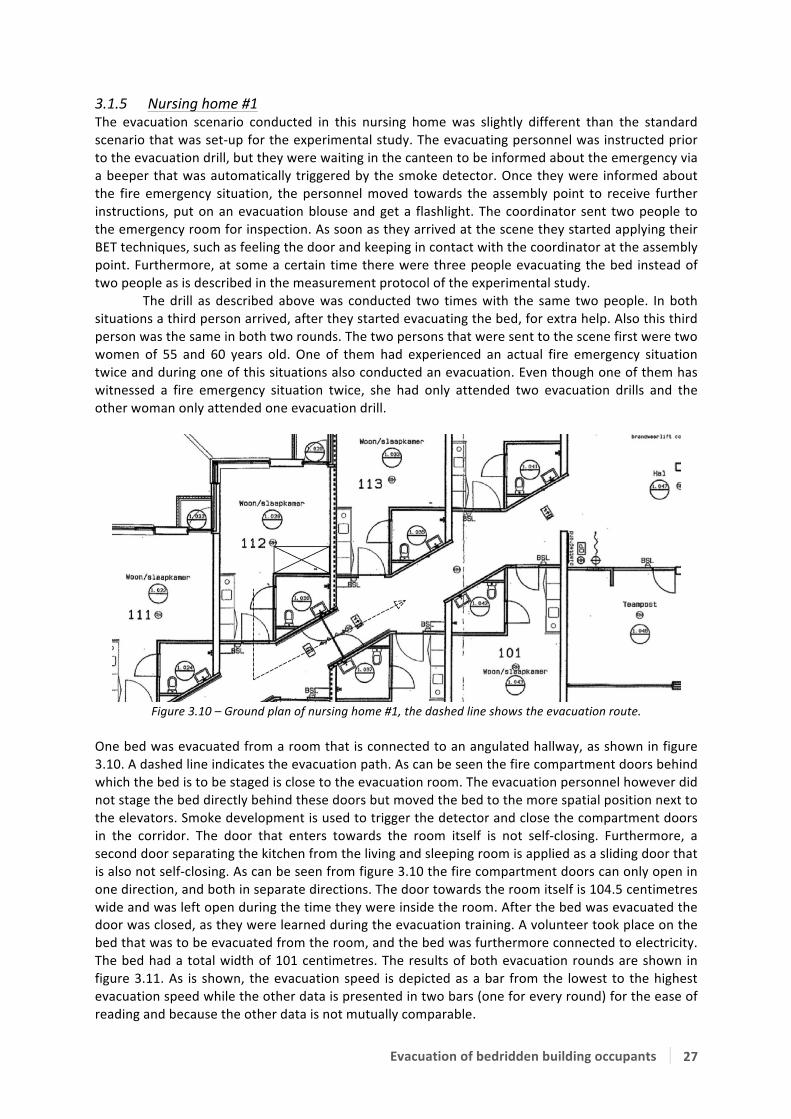
Figure 3.10 – Ground plan of nursing home #1, the dashed line shows the evacuation route.
One bed was evacuated from a room that is connected to an angulated hallway, as shown in figure 3.10. A dashed line indicates the evacuation path. As can be seen the fire compartment doors behind which the bed is to be staged is close to the evacuation room. The evacuation personnel however did not stage the bed directly behind these doors but moved the bed to the more spatial position next to the elevators. Smoke development is used to trigger the detector and close the compartment doors in the corridor. The door that enters towards the room itself is not self-‐closing. Furthermore, a second door separating the kitchen from the living and sleeping room is applied as a sliding door that is also not self-‐closing. As can be seen from figure 3.10 the fire compartment doors can only open in one direction, and both in separate directions. The door towards the room itself is 104.5 centimetres wide and was left open during the time they were inside the room. After the bed was evacuated the door was closed, as they were learned during the evacuation training. A volunteer took place on the bed that was to be evacuated from the room, and the bed was furthermore connected to electricity. The bed had a total width of 101 centimetres. The results of both evacuation rounds are shown in figure 3.11. As is shown, the evacuation speed is depicted as a bar from the lowest to the highest evacuation speed while the other data is presented in two bars (one for every round) for the ease of reading and because the other data is not mutually comparable.

Evacuation of bedridden building occupants 28
Figure 3.11 – Measured data from nursing home #1, created from 2 evacuation drills.
Figure 3.11 shows the two evacuation speeds as two points connected by a red bar. The other two measurements are shown as two separate bars that describe the whole scenario, because the results are not comparable to other measurements. As is shown from the figure the arrival time in round 1 is very long in comparison to the 2nd evacuation round. The reason of this is that during the second round they already had knowledge of where the evacuation would take place while during the first round they had to find out themselves. The red part of the graph, the “opening door” part, is when they have already arrived at the door but are conducting the door procedure as they have learned to and when they are still discussing over the portable phones about what to do. This part ends as the door is fully opened, the room inside is analysed, and when they start entering the room. The part of the evacuation procedure that follows is entering the room and ends when the team arrives near the bed. The arrival part during the first round was 49 seconds because there was still a door separating them from the bed and they were analysing the situation and reporting it before entering the room. The arrival part ends when they start uncoupling the bed; one of them was crawling to stay low and away from the fictive smoke layer. The uncoupling involved taking off the brakes and unplugging the electricity from the bed. After that the evacuation part started, where during the first round a speed of 0.255 metres per second was achieved and during the second round the speed was 0.268 metres per second. Finally positioning the beds near the elevators down the hallway finished the procedure. In general, all evacuation procedures took longer the first round than they did in the second round. This is not completely surprising, as they knew what to expect and how to handle the situation. Both people from the evacuation team walked and acted very slowly. They did for example not know how to properly use the portable phones and took very long to report the situation to the coordinator downstairs. Their evacuation speeds were very slow due to their slow movement but also due to the small door passage. The uncoupling, evacuation, and positioning of the bed took almost the same time during both rounds.
At the first round the evacuation team had to report downstairs where they would have to move and figure out where the emergency was taking place. The arrival time the BET needed is way too long and will cause critical situations if a real fire is to occur in one of the rooms. In an actual emergency situation however people will probably not wait as long as was analysed in the first round with entering the room. The team furthermore did execute the actions such as feeling the door for heat and peaking inside the room prior to entering it. Also, they closed the door behind their backs when the bed was evacuated from the room. The width between the door and the bed also seems to have an influence on the evacuation speed. The communication seems to be a problem as the BET was not able to get good contact with the people at the desk downstairs.

Evacuation of bedridden building occupants 29
3.1.6 Nursing home #2 The second evacuation scenario was conducted according to the standard experimental set-‐up and is therefore comparable with other measurement results. Again the evacuation teams, which consisted of four people in total, were instructed prior to the evacuation scenario. Four women of 41, 34, 18 and 18 years old conducted the evacuation. None of them had ever participated in an evacuation drill and none of them was familiar with the evacuation procedures. Also, none of them has ever experienced an actual emergency situation. All four women were nurses, of which the youngest two were doing teaching practise. In total 1 bed was evacuated in four rounds, in which the women of 41 and 18 years old conducted the first 2 rounds and the other two women conducted the last 2 rounds. One bed was evacuated from a room connected to a straight hallway as is shown in figure 3.12. The evacuation path is indicated with a dashed line. The bed that is evacuated is staged behind the compartment door on the far right of the picture; as is shown both door panels open in a different direction. The compartment doors were made self-‐closing by switching off the power to the door-‐spring. The door to the room itself had a width of 112.5 centimetres and was not self-‐closing and also not closed by the evacuation team after they have evacuated the room. The bed was coupled to electricity and the patient was not coupled to any devices that would lengthen the uncoupling time. The hospital bed that is used had a total width of 103 centimetres.
Figure 3.12 – Ground plan of nursing home #2, the dashed line shows the evacuation route.
As is shown from figure 3.12, the room that is furthest away from the compartment doors is used to conduct the evacuation drill from. The bed was, once outside the compartment doors, directly staged behind it at a distance of approximately 2 metres. Both evacuation teams were running very fast towards the room that was to be evacuated. They conducted the evacuation as it is described in the standard scenario. A volunteer took place on the bed that was evacuated during the four rounds. The measurement results of the evacuation rounds are shown in figure 3.13. Prior to the evacuation scenario, an unannounced evacuation drill was performed of which the evacuation teams were not aware. A fire was simulated in one of the rooms opposite to the room from which the evacuation scenario was performed. Furthermore, a victim was placed inside this room that was to be evacuated. When the smoke that was made to simulate a realistic scenario triggered the fire alarm, the evacuation team arrived fairly quickly in the hallway because their office was next to the room. They then however did not know what to do; eventually they did drag the victim from the room (after having received some instructions) in which the fire was simulated into the hallway, but left the victim there and left the door to the room open as well. They then did not know what to do and were standing still and asking other people about which actions to make. The smoke then developed quickly into the hallway and the drill was stopped; the teams failed to evacuate the other victims from their rooms and failed to perform an evacuation as is described in their building emergency plan.
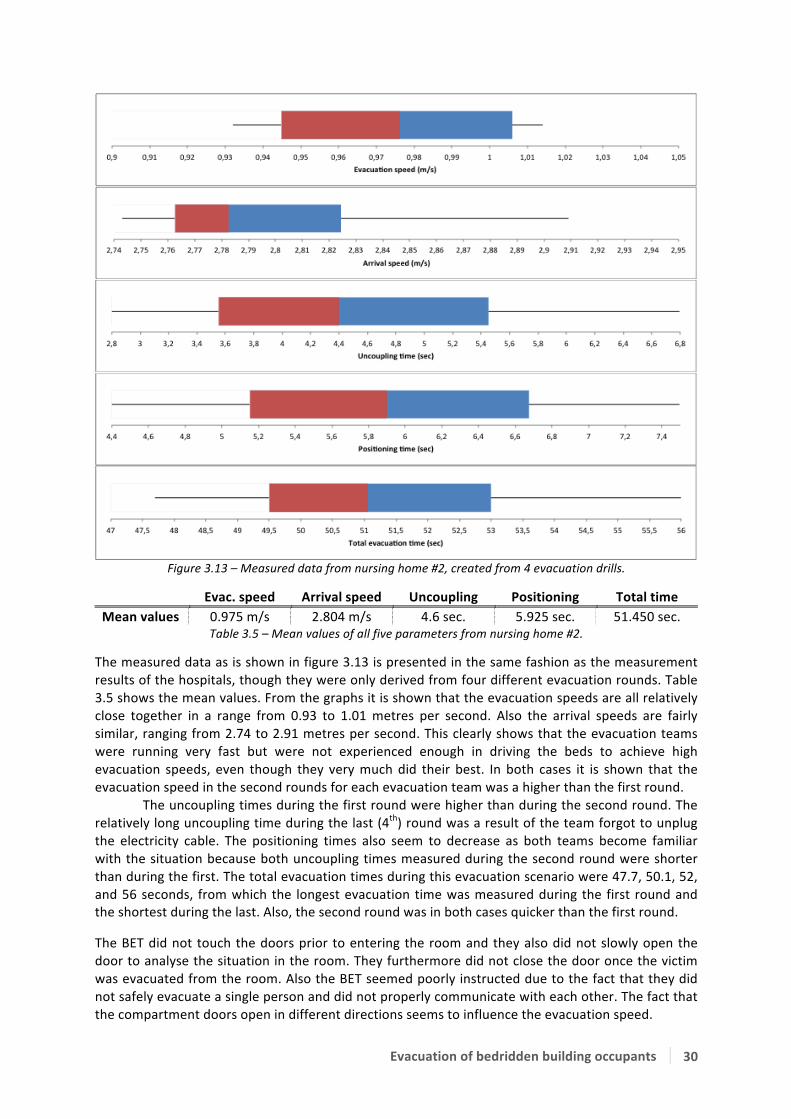
Evacuation of bedridden building occupants 30
Figure 3.13 – Measured data from nursing home #2, created from 4 evacuation drills.
Evac. speed Arrival speed Uncoupling Positioning Total time Mean values 0.975 m/s 2.804 m/s 4.6 sec. 5.925 sec. 51.450 sec.
Table 3.5 – Mean values of all five parameters from nursing home #2.
The measured data as is shown in figure 3.13 is presented in the same fashion as the measurement results of the hospitals, though they were only derived from four different evacuation rounds. Table 3.5 shows the mean values. From the graphs it is shown that the evacuation speeds are all relatively close together in a range from 0.93 to 1.01 metres per second. Also the arrival speeds are fairly similar, ranging from 2.74 to 2.91 metres per second. This clearly shows that the evacuation teams were running very fast but were not experienced enough in driving the beds to achieve high evacuation speeds, even though they very much did their best. In both cases it is shown that the evacuation speed in the second rounds for each evacuation team was a higher than the first round. The uncoupling times during the first round were higher than during the second round. The relatively long uncoupling time during the last (4th) round was a result of the team forgot to unplug the electricity cable. The positioning times also seem to decrease as both teams become familiar with the situation because both uncoupling times measured during the second round were shorter than during the first. The total evacuation times during this evacuation scenario were 47.7, 50.1, 52, and 56 seconds, from which the longest evacuation time was measured during the first round and the shortest during the last. Also, the second round was in both cases quicker than the first round.
The BET did not touch the doors prior to entering the room and they also did not slowly open the door to analyse the situation in the room. They furthermore did not close the door once the victim was evacuated from the room. Also the BET seemed poorly instructed due to the fact that they did not safely evacuate a single person and did not properly communicate with each other. The fact that the compartment doors open in different directions seems to influence the evacuation speed.
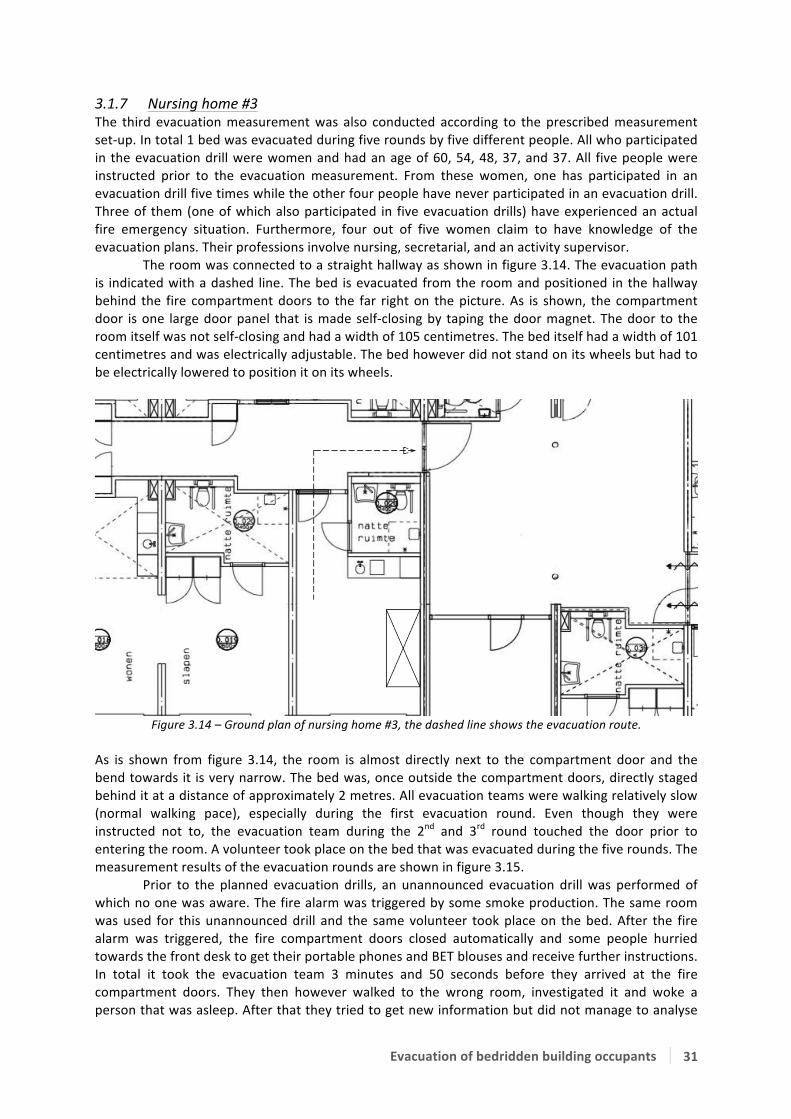
Evacuation of bedridden building occupants 31
3.1.7 Nursing home #3 The third evacuation measurement was also conducted according to the prescribed measurement set-‐up. In total 1 bed was evacuated during five rounds by five different people. All who participated in the evacuation drill were women and had an age of 60, 54, 48, 37, and 37. All five people were instructed prior to the evacuation measurement. From these women, one has participated in an evacuation drill five times while the other four people have never participated in an evacuation drill. Three of them (one of which also participated in five evacuation drills) have experienced an actual fire emergency situation. Furthermore, four out of five women claim to have knowledge of the evacuation plans. Their professions involve nursing, secretarial, and an activity supervisor. The room was connected to a straight hallway as shown in figure 3.14. The evacuation path is indicated with a dashed line. The bed is evacuated from the room and positioned in the hallway behind the fire compartment doors to the far right on the picture. As is shown, the compartment door is one large door panel that is made self-‐closing by taping the door magnet. The door to the room itself was not self-‐closing and had a width of 105 centimetres. The bed itself had a width of 101 centimetres and was electrically adjustable. The bed however did not stand on its wheels but had to be electrically lowered to position it on its wheels.
Figure 3.14 – Ground plan of nursing home #3, the dashed line shows the evacuation route.
As is shown from figure 3.14, the room is almost directly next to the compartment door and the bend towards it is very narrow. The bed was, once outside the compartment doors, directly staged behind it at a distance of approximately 2 metres. All evacuation teams were walking relatively slow (normal walking pace), especially during the first evacuation round. Even though they were instructed not to, the evacuation team during the 2nd and 3rd round touched the door prior to entering the room. A volunteer took place on the bed that was evacuated during the five rounds. The measurement results of the evacuation rounds are shown in figure 3.15. Prior to the planned evacuation drills, an unannounced evacuation drill was performed of which no one was aware. The fire alarm was triggered by some smoke production. The same room was used for this unannounced drill and the same volunteer took place on the bed. After the fire alarm was triggered, the fire compartment doors closed automatically and some people hurried towards the front desk to get their portable phones and BET blouses and receive further instructions. In total it took the evacuation team 3 minutes and 50 seconds before they arrived at the fire compartment doors. They then however walked to the wrong room, investigated it and woke a person that was asleep. After that they tried to get new information but did not manage to analyse

Evacuation of bedridden building occupants 32
what went wrong until the observatory told them. Finally, after 5 minutes and 35 seconds they were at the correct door performing their BET tasks. 10 seconds later one of them opened the door to analyse what was going on inside the room and realised there was smoke development. They reported the situation to the coordinator but did not close the door again. After 6 minutes and 55 seconds they were told by the observatory to enter the room and evacuate the victim and after 9 minutes the bed was completely removed from the room, the door however was never closed. The communication appeared to be a crucial problem during this unannounced drill and if the observatory did not tell the team what to do they would probably not have continued the drill.
Figure 3.15 – Measured data from nursing home #3, created from 5 evacuation drills. Evac. speed Arrival speed Uncoupling Positioning Total time Mean values 0.343 m/s 1.185 m/s 12.66 sec. 2.54 sec. 49.24 sec.
Table 3.6 – Mean values of all five parameters from nursing home #3. The measured data shown in figure 3.15 is derived from five different evacuation rounds and table 3.6 gives the mean values. From the graphs it is shown that the evacuation speeds are in a range from 0.25 to 0.49 metres per second. The peak evacuation speed value was a result of experience in manoeuvring the bed. The arrival speeds differentiate from 0.75 to 1.48 metres per second. These results indicate that the evacuation teams were evacuating the bed slowly in comparison to other data. Also the arrival speeds were low in comparison to the other results. Positioning times of the first round were longest in comparison to the other rounds, partly due to the fact that the evacuation team was moving slowly in the first round. Later they received instructions to move more realistically and fastened their pace. Again it is shown that in the first round of the 2nd and 3rd team (round 2 & 4 resp.) a longer positioning time was realized than in their
Evacuation of bedridden building occupants 33
second rounds (round 3 & 5 resp.). The uncoupling time during the second round was far longest of all five measurements, due to the fact that the bed was positioned at its highest stance. The reason for the long uncoupling time at the last round was due to one person pulling the plug while the bed was not fully lowered on its wheels. The evacuation team did touch the door prior to entering the room and took a glance inside to check the fire development in the room. It has to be noted though that one person was aware of the actions that were to be made in an emergency situation while the other was not aware of what to do. Once they opened the door however they did not close it again, not even after the bed was removed from the room. In a real fire emergency situation this would lead to a quick smoke spread inside the corridor, leaving the other rooms inside the fire compartment unable to access. Also the time that is needed for the BET to arrive at the room in which a fire is simulated is way too long, which again will probably cause critical situations when a fire occurs. The instructions they received were not clear enough as they interpreted them totally wrong and went to the wrong room at first. Communication therefore seems to be one of the crucial aspects.

Evacuation of bedridden building occupants 34
3.1.8 Nursing home #4 The fourth measurement was conducted according to the prescribed measurement set-‐up. One bed was evacuated from a room at a very spatial hallway (figure 3.16). Two women in total conducted five evacuation rounds with one bed. The women were 50 and 49 of age and both have participated twice in an evacuation drill. They both have not experienced a real fire emergency situation, but do claim to be familiar with the evacuation protocol. They were instructed prior to the evacuation on what to do and how to handle. Their professions at the nursing home involve section managers. Figure 3.16 shows the ground plan of the room and the hallway where the evacuation path is indicated with a dashed line. The fire compartment door was made self-‐closing by taping the door magnets and consisted of two door blades which both opened in different directions. The door to the room itself was not self-‐closing and had a width of 110 centimetres. The bed was an electrical hospital bed with a width of 103 centimetres. A volunteer took place on the bed.
Figure 3.16 – Ground plan of nursing home #4, the dashed line shows the evacuation route.
The women ran relatively fast (very fast pace) towards the room which was to evacuate. They tried to evacuate the bed as fast as possible and tried to improve this with every round. Once the bed was through the fire compartment doors, it was directly staged behind it at approximately 1.5 metres. The evacuation team conducted the evacuation scenario according to the prescribed protocol. As is shown from figure 3.16, no sharp turns were to be made with the bed and the hallway had a width of around 4 metres. The measurement results from this evacuation drill can be seen in figure 3.17, the mean values are shown in table 3.7. Prior to the planned evacuation drills, an unannounced evacuation drill was performed of which no one was aware. A volunteer took place on the bed in the same room as in which the other evacuation drills were performed. The smoke alarm was triggered by a little smoke production in the room, after which an evacuation team (the same two women who conducted the later evacuation drills) reported at the front desk where they took their BET blouses and portable phones. They then received instructions to move towards the room where the detector was triggered and arrived there 3 minutes and 57 seconds after first detection. They analysed the situation in the room and closed the door again as they have learned to. They furthermore checked if there was someone in the room besides the room where the detector was triggered. They did not make a move to rescue the person inside the room where the alarm was ringing because based on their judgements; the smoke layer was too dense (which was a good observation). The observatory however told them to go inside and rescue the victim, who was screaming for help. After 9 minutes and 4 seconds the group of 4 (2 more persons were sent for support) went inside the room, leaned down, and removed the bed from the room. The bed was removed after 9 minutes and 38 seconds and was moved outside the compartment in 10 minutes and 5 seconds. In contradiction to the unannounced drill in the previous nursing home, communication between the evacuation team and the coordinator went flawless and the judgements that were made were good ones. They could have entered the room much earlier (at 4 minutes and 22 seconds) if they would like to, though the decision on whether or not to enter the room based on the smoke layer thickness is a personal one which cannot be judged easily.

Evacuation of bedridden building occupants 35
Figure 3.17 – Measured data from nursing home #4, created form 5 evacuation drills. Evac. speed Arrival speed Uncoupling Positioning Total time Mean values 1.14 m/s 3.043 m/s 4.1 sec. 3.32 sec. 44.66 sec.
Table 3.7 – Mean values of all five parameters from nursing home #4.
It is shown from the evacuation and arrival time, that the evacuation team tried to achieve shorter evacuation times every round. Though at round 4 they seem to have reached a maximum speed of 1.3 metres per second. During round 5 the highest arrival speed was achieved of 3.39 metres per second. In comparison to the other measurements these were the fastest drills in nursing homes. The uncoupling of the bed involved taking the electrical plug from the socket and removing the brakes. Though during the first round this took the evacuation team over 7 seconds. Every round the uncoupling time decreased until round 4, where the lowest uncoupling time was performed. It should be noted that the bed had to be moved about 1 meter before the electrical plug could be uncoupled. Positioning the bed behind the fire compartment doors took less long with every round as was done quite quickly because it was staged right behind the compartment doors. Positioning during the first round took a little over 4.5 seconds while at the last round, around 2.2 seconds was required to position the bed. Even though the evacuation team performed the drill almost perfectly (they did e.g. touch the door and took a glance inside) it took them almost 4 minutes to arrive at the room. They did however not close the door once they had evacuated the bed out of the room. The door also stayed open while the BET was inside the room to evacuate the victim. Furthermore it is shown that the width between the door and bed seems to have an effect on the evacuation speed. The communication of the evacuation team with the other people at the front desk downstairs did not result in any problems.

Evacuation of bedridden building occupants 36
3.1.9 Nursing home #5 The last evacuation measurement that was conducted in a nursing home was not performed according to the measurement protocol because the door was not wide enough for the bed to be moved through it. The door had a width of 86 centimetres and the bed had a width of 100 centimetres. To still be able to evacuate a bedbound patient, an evacuation sheet was hung in the central staircase (rectangle with cross in figure 3.18) on which the patient could be placed and evacuated from the room. This sheet is used to conduct two evacuation rounds where one mattress was evacuated from the room. A volunteer took place on the bed that was to be evacuated. Two women of 49 and 42 years old conducted the first evacuation round and one man and one woman of respectively 39 and 60 years old conducted the second evacuation round. One of the two women who conducted the first round had never participated in an evacuation drill and was not familiar with the evacuation protocol, while the other woman was. The man and woman both have participated multiple times in evacuation drills and are familiar with the evacuation plan. None of the participants has ever been involved in a real fire emergency situation. Figure 3.18 shows the ground plan of the room and the corridor, where the evacuation path is indicated with a dashed line. The fire compartment doors, which could open in one direction only, were made self-‐closing by taping the door magnets.
Figure 3.18 – Ground plan of nursing home #5, the dashed line shows the evacuation route.
The two women ran (fast pace) towards the room while the man and woman walked (normal pace) towards the room. During the first round, the women went in the room to analyse the situation after which one of them went to get the evacuation sheet. During the second round however, the evacuation sheet was already positioned under the mattress on the bed and the team could immediately start the evacuation. Both teams felt the door prior to entering it and first looked inside to analyse the situation. The measurement results from this evacuation drill are shown in figure 3.19. Prior to the planned evacuation drills, an unannounced evacuation drill was performed of which no one was aware. A volunteer took place on the bed in the same room as in which the other evacuation drills were performed. A smoke alarm was triggered by some smoke production in the room. After being beeped by the alarm, two people went to the front desk and got their BET blouses, portable phones, and were given instructions to move to the subjected room. After 3 minutes and 30 seconds the team arrived at the room and took a peek inside the room 10 seconds later. Meanwhile one of the two women (the same two women who conducted the first evacuation round) was in touch and reporting the conditions to the coordinator at the front desk. After 4 minutes and 7 seconds the two women went inside the room and tried to get the bed out via the door. They quickly

Evacuation of bedridden building occupants 37
analysed that this was not possible and one of them told the other to get the evacuation sheet. She did however not know where the sheet was positioned and came back to ask the other woman. She then went outside the room again, found the sheet and brought it into the room. After 5 minutes and 55 seconds the victim was on the sheet and the evacuation started. In the meanwhile the door was left open constantly. 35 seconds later, at 6 minutes and 30 seconds, the victim was evacuated outside the fire compartment. In comparison to the unannounced drill in the previous nursing home, the evacuation team was less aware of the danger that smoke could cause and entered the room anyway. They also did not close the door when they had evacuated the victim and did not know the exact location of the evacuation sheet.
Figure 3.19 – Measured data from nursing home #5, created from 2 evacuation drills. Figure 3.19 shows the two evacuation speeds as two points connected by a red bar. The other two measurements are shown as two separate bars that describe the whole scenario, because the results are not comparable to other measurements. The figure shows the two evacuation scenarios that were executed, the first round being the one where a mattress was to be carried from the central staircase and the second round being the one with the evacuation sheet already underneath the mattress. From the figure one can clearly see that two processes were skipped in the second round in comparison to the first, namely the “getting mattress” period where the evacuation team had to carry the mattress from the staircase to the room, and the “victim on mattress” period where the evacuation team had to carry the victim on the evacuation mattress. These periods were skipped in the second round because the victim was already on the mattress and was evacuated with the mattress on which she was already positioned. The other time periods are measured according to the same principle as described at the results of nursing home #1. The evacuation scenario was furthermore conducted as the BET was learned to: e.g. feeling the door and looking inside it before entering the room. During the first and second round an evacuation speed of respectively 0.37 and 0.47 metres per second was achieved. Moving the mattress through the doorposts was relatively hard though, because the mattress was slightly wider than the door. Therefore the mattress had to be moved almost perpendicular (with regard to the doorposts) through the door hole. The preparing of the mattress during the first round went not as it was supposed to be going. The mattress was positioned wrong and as a result the victim was laying with her head at the point where her feet should have been. Therefore the mattress could not be closed correctly and the

Evacuation of bedridden building occupants 38
victim almost fell off the mattress while moving it through the doorposts. Furthermore, if she were to be evacuated down the stairs in this fashion, she would definitely be hurt as a result. The second round was executed much better, but also the evacuation sheet was already placed underneath the mattress. Though one can see that preparing the mattress for evacuation still requires 32.2 seconds. The door was felt prior to every evacuation drill and every team quickly took a glance inside the room. Though they all forgot to close the door once they had evacuated the victim outside the room and fire compartment. Furthermore the knowledge of the BET on the use and position of the evacuation sheets seems to be insufficient, which could possibly lead to dangerous situations if a real evacuation is to be performed.

Evacuation of bedridden building occupants 39
3.1.10 Total of all measurement results If possible, the measurements that have been conducted are combined to get an idea of the spreading on the measurement outcome. For the uncoupling time, positioning time, and total evacuation time a comparison between hospitals or nursing homes is not possible because of the different distances, manoeuvres and set-‐ups that occurred. But because the evacuation and arrival stage are expressed as speeds in metres per second, and because the measurement set-‐up was made comparable, they can be compared. Therefore, the evacuation and arrival speeds are expressed in two Whisker plots. For the hospital measurements, the results can be seen in figure 3.20 and for the nursing home measurements the results can be seen in figure 3.22.
Figure 3.20 – A combination of all measured data from hospitals #1,2,3 & 4 (91 measurements in total). As the figure shows, the evacuation speed ranges from 0.54 to 1.33 metres per second. Though this might seem as a fairly large spreading, there is only one value of 0.54 and the next-‐slowest value is 0.62 metres per second. There are only three values in the range of 0.6 to 0.7 metres per second and twelve values ranging from 0.7 to 0.8 metres per second (of which more than half is closer to 0.8). The lowest value 0.54 metres per second was furthermore the result of a cable that was jammed in the wheel during the evacuation. The second slowest evacuation speed of 0.62 metres per second was the cause of a wheelchair blocking the hallway when the evacuation procedure started. The value thereafter was reached due to the fact that it was the first bed to be evacuated from two inexperienced persons. The fourth value of 0.67 metres per second is of an evacuation drill where nothing went wrong and can be marked as the lowest value without any hindering or failure. The highest value of 1.33 metres per second was a result of the fact that the people conduction the evacuation had already practised this particular drill 18 times before. The same accounts for the second and third fastest values of 1.29 and 1.23 metres per second. There is however another evacuation speed of 1.23 that was achieved by two nurses who had much experience in manoeuvring hospital beds but did not have much experience conducting this particular evacuation drill. This point is thus marked as the fastest evacuation speed (measured in this thesis) achieved by an evacuation team without having practised the drill multiple times. There are furthermore 9 observations ranging from 1.23 to 1.10 metres per second; the rest of the evacuation measurements all lay below this value. Figure 3.21 now shows the evacuation speed range without the previously discussed measurements to give an overview of the general range in evacuation speeds. It is shown that over 50 percent of the measurement results lays within a range of 0.8 to 1 metres per second and that the plot is skewed to the right, indicating that an outcome near or below the median is most probable. One should note however that these results account for a certain evacuation path only; in this case a straight hallway connected to a room from which one turn was made. Whether or not and in what quantities the results will deviate much from other measurement set-‐ups has not been analysed during these evacuation drills.

Evacuation of bedridden building occupants 40
Figure 3.21 – A version of the evacuation speed measurement over 85 measurements (mean = 0.93 m/s) and an adjusted version of the arrival speeds over 65 measurements (mean = 2.09 m/s).
Figure 3.20 furthermore shows the arrival speeds of 91 measurements are ranging from 0.92 to 2.85 metres per second. The lowest 6 measurements (until 1.36 metres per second) were all derived from the first evacuation drill at the first hospital. These two men were walking slowly towards the room and did not run, as was generally the case in the other measurement drills. The first measurements that followed were also due to the fact that the evacuation team was walking or running in a slow pace. In fact, if one assumes that the people who have to evacuate in case of fire are running slowly, the data range would start at a measurement point of 1.6 metres per second. The highest twelve arrival speeds were obtained from evacuation drills at one hospital, where the evacuation teams ran very fast towards the room. In some cases they ran so fast they had to slow down very much before they could take the turn to enter the room. In a real fire emergency situation this would probably not be a realistic speed at which the evacuation teams will operate. The first highest arrival speed that was measured at another hospital is at 2.44 metres per second. An arrival-‐speed-‐range of 1.6 until 2.44 metres per second would therefore be a realistic range in which the arrival speeds are to be found. Figure 3.21 shows the adjusted graph for arrival speed over 65 measurements. The fifty percent range now st1rts at 1.97 metres per second and ends at 2.29 metres per second. The Whisker plot is skewed to the left, indicating that an arrival speed above 1.95 metres per second is the most probable outcome of all the 65 evacuation drill measurements.
Figure 3.22 – A combination of all measured data from nursing homes #2,3 & 4 (14 measurements in total). As is shown from figure 3.22, the evacuation speeds in nursing homes range from 0.25 to 1.3 metres per second. These measurement results are derived from three nursing homes and a total of 14 measurement results. As the results show, the spreading in the nursing home measurements is far larger than that of the hospital measurements for both the evacuation speed and the arrival speed. The reason for this large spreading is that in one nursing home measurement they walked and acted very slowly and did not exactly know what to do, while in the other nursing home the people had practised evacuating a bed before and knew exactly what to do. Also, nursing home 3 had a small

Evacuation of bedridden building occupants 41
corridor that affected the evacuation speed. The spreading in arrival speeds is relatively large in comparison to the data measured at the hospitals. It ranges from 0.75 to 3.4 metres per second. The lowest arrival speeds were achieved during the rounds that the door was felt prior to entering it and at the first rounds when they were not fully aware of the evacuation they had to perform. The quickest arrival speeds were achieved at nursing home 4, where the evacuation team ran as hard as they could towards the room that was to be evacuated from. What can be analysed from these results is that the hospital measurements have a far smaller spreading when it comes to the evacuation-‐ and arrival speeds. The reason for this smaller spreading is probably the difference in building dimensions; hospital corridors are usually broader than nursing home corridors, but also the experience of the evacuation team is of importance. It is important if they have ever executed an evacuation drill before and it is also important whether moving hospital beds is daily practice to them or not. It can be seen from the previous figures that the median of the nursing home measurements lies relatively close to the median of the hospital measurements. Also the skewness of the nursing home measurements reveals that outcomes are most probably near the right part of the median. The results show that in nursing home measurements more extreme values can be achieved in comparison to the hospital measurements. Though an evacuation speed higher than a speed of 1.33 metres per second is probably not possible. Results from nursing home 2 show that outcomes are comparable to the hospital measurements while nursing home 1 shows extremely low evacuation-‐ and arrival speeds and nursing home 3 shows extremely high evacuation-‐ and arrival speeds. Though the peak values have been removed from the last figures to present a smaller range of evacuation and arrival speeds where hindering was out of the question, the results should be taken seriously. In fact, the lowest peak value might as well be a more realistic value in case of an emergency because people tend to get stressed and perhaps panic in emergency situations and mistakes are more easily made. Also, a part of the values are a cause of hindering by other people inside the fire compartment, which represents a situation that could also occur during an evacuation.

Evacuation of bedridden building occupants 42
3.2 Experimental results at the ICU The fifth evacuation measurement at a hospital is one that cannot be compared to the other measurements because the drill was held at an intensive care unit (ICU). 2 men and one woman of respectively 45, 34, and 31 years old conducted the drills. The younger man and woman had experienced an evacuation drill with a bed once, while the older man had no experience in conducting an evacuation. None of them have experienced an actual fire emergency situation. Even though all three persons have much experience in moving hospital beds because their profession involves nursing IC patients. In total, two beds were evacuated in five rounds. Two dummies were used for this evacuation drill because it is easier to connect them to the different pumps and devices that are generally in use on an IC patient. Table 3.8 lists all the devices that were used and that also had to be uncoupled before an evacuation could start. The two beds were evacuated from the room, which is a winding path, down the hallway where a sharp turn is made (see figure 3.23). The dashed line indicates the evacuation path; as can be seen one bed has to be driven around the monitoring desk, while the other has a much less traveling distance. Finally, the beds were staged behind the compartment doors on the lower right part of the figure. The compartment doors were self-‐closing but closed at a very slow pace; the evacuation team had enough time to move the beds through while the doors were practically open. Also the door that enters to the room was an electrical door that had to be opened with an ID card, which would open automatically after having swiped the card in front of a detector. When leaving the room the doors are opened by pushing one of the two doors, after which they will both be opened by the electrical door spring. In three out of five evacuations, the door had to be opened with the ID card as the evacuation team returned because it was already automatically closed. Furthermore, both the compartment door and the door that enters towards the IC room are opening in the most favourable direction when conducting an evacuation. The door that enters towards the IC unit had a total width of 165 centimetres, consisting of two door panels. The beds that were used for the evacuation study had a total width of 98 centimetres.
Figure 3.23 – Ground plan of the IC unit in hospital #5, the dashed line shows the evacuation route.
The older man participated in all five evacuation rounds, while the woman conducted the first three evacuation rounds and the younger man participated in the last two rounds. In general the last two rounds were faster than the first three, probably as a result of team changing. Even though, both teams moved relatively fast (walked fast). Both teams were told to uncouple the patients as quickly as possible, but in a well-‐considered way: as if it were a real patient that could be harmed if anything
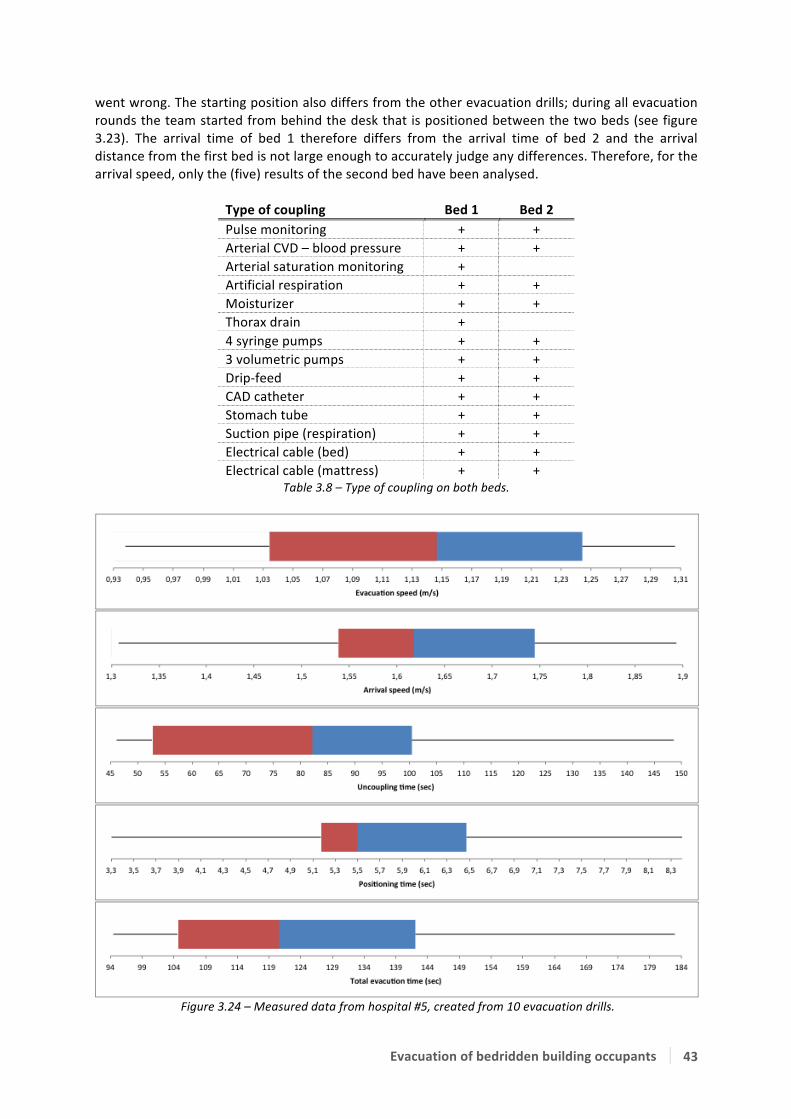
Evacuation of bedridden building occupants 43
went wrong. The starting position also differs from the other evacuation drills; during all evacuation rounds the team started from behind the desk that is positioned between the two beds (see figure 3.23). The arrival time of bed 1 therefore differs from the arrival time of bed 2 and the arrival distance from the first bed is not large enough to accurately judge any differences. Therefore, for the arrival speed, only the (five) results of the second bed have been analysed.
Type of coupling Bed 1 Bed 2 Pulse monitoring + + Arterial CVD – blood pressure + + Arterial saturation monitoring + Artificial respiration + + Moisturizer + + Thorax drain + 4 syringe pumps + + 3 volumetric pumps + + Drip-‐feed + + CAD catheter + + Stomach tube + + Suction pipe (respiration) + + Electrical cable (bed) + + Electrical cable (mattress) + +
Table 3.8 – Type of coupling on both beds.
Figure 3.24 – Measured data from hospital #5, created from 10 evacuation drills.
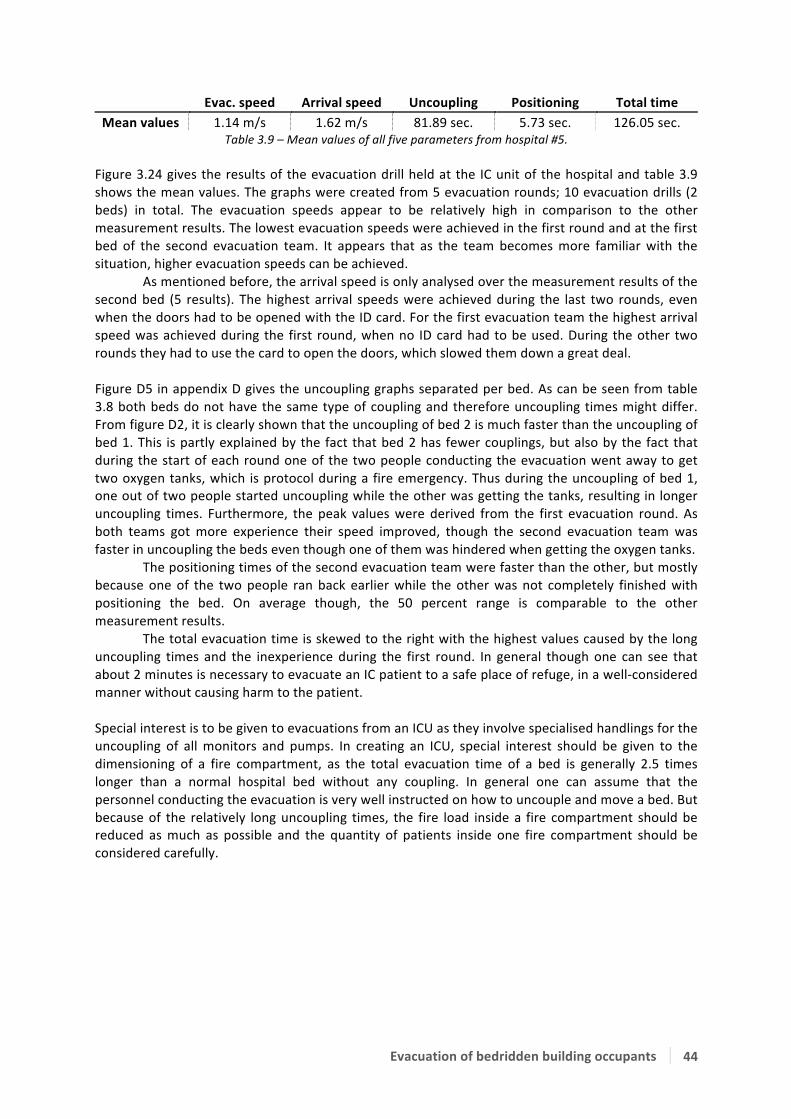
Evacuation of bedridden building occupants 44
Evac. speed Arrival speed Uncoupling Positioning Total time Mean values 1.14 m/s 1.62 m/s 81.89 sec. 5.73 sec. 126.05 sec.
Table 3.9 – Mean values of all five parameters from hospital #5. Figure 3.24 gives the results of the evacuation drill held at the IC unit of the hospital and table 3.9 shows the mean values. The graphs were created from 5 evacuation rounds; 10 evacuation drills (2 beds) in total. The evacuation speeds appear to be relatively high in comparison to the other measurement results. The lowest evacuation speeds were achieved in the first round and at the first bed of the second evacuation team. It appears that as the team becomes more familiar with the situation, higher evacuation speeds can be achieved. As mentioned before, the arrival speed is only analysed over the measurement results of the second bed (5 results). The highest arrival speeds were achieved during the last two rounds, even when the doors had to be opened with the ID card. For the first evacuation team the highest arrival speed was achieved during the first round, when no ID card had to be used. During the other two rounds they had to use the card to open the doors, which slowed them down a great deal. Figure D5 in appendix D gives the uncoupling graphs separated per bed. As can be seen from table 3.8 both beds do not have the same type of coupling and therefore uncoupling times might differ. From figure D2, it is clearly shown that the uncoupling of bed 2 is much faster than the uncoupling of bed 1. This is partly explained by the fact that bed 2 has fewer couplings, but also by the fact that during the start of each round one of the two people conducting the evacuation went away to get two oxygen tanks, which is protocol during a fire emergency. Thus during the uncoupling of bed 1, one out of two people started uncoupling while the other was getting the tanks, resulting in longer uncoupling times. Furthermore, the peak values were derived from the first evacuation round. As both teams got more experience their speed improved, though the second evacuation team was faster in uncoupling the beds even though one of them was hindered when getting the oxygen tanks. The positioning times of the second evacuation team were faster than the other, but mostly because one of the two people ran back earlier while the other was not completely finished with positioning the bed. On average though, the 50 percent range is comparable to the other measurement results. The total evacuation time is skewed to the right with the highest values caused by the long uncoupling times and the inexperience during the first round. In general though one can see that about 2 minutes is necessary to evacuate an IC patient to a safe place of refuge, in a well-‐considered manner without causing harm to the patient. Special interest is to be given to evacuations from an ICU as they involve specialised handlings for the uncoupling of all monitors and pumps. In creating an ICU, special interest should be given to the dimensioning of a fire compartment, as the total evacuation time of a bed is generally 2.5 times longer than a normal hospital bed without any coupling. In general one can assume that the personnel conducting the evacuation is very well instructed on how to uncouple and move a bed. But because of the relatively long uncoupling times, the fire load inside a fire compartment should be reduced as much as possible and the quantity of patients inside one fire compartment should be considered carefully.

Evacuation of bedridden building occupants 45
3.3 Simulation Results As discussed in chapter two, the simulation output is analysed for the visibility and temperature of all variants. A simulation model of a hospital room was created with and without corridor, and another simulation model of a nursing home was created. The time to reach the untenable conditions is written down in a table for both criteria in paragraph 3.3.1. In paragraph 3.3.2 the simulation output is compared to the measured data at the hospital (RSET versus ASET). 3.3.1 Simulation output The simulation variants were run according to the input as described in table 2.1 in paragraph 2.2.1. The reference numbers that are used in that table correspond to the reference numbers in the tables in this paragraph. Again a short overview of the model variants with their reference numbers is listed below for reading convenience.
Model with door closed constantly Model with door opened at pre-‐defined times Model #1 = RHR 100 / t! 300 Model #6 = RHR 100 / t! 300
Model #2 = RHR 250 / t! 300 Model #7 = RHR 250 / t! 300 Model #3 = RHR 375 / t! 300 Model #8 = RHR 375 / t! 300 Model #4 = RHR 250 / t! 600 Model #9 = RHR 250 / t! 600 Model #5 = RHR 250 / t! 100 Model #10 = RHR 250 / t! 100
The visibility and temperature output is defined for all the simulation variants. The output is judged by analysing so called ‘slice-‐files’ in FDS that represent a cross section at 1.5 metres height (a person’s head height). An example of the judgement on the first simulation model is shown in figures 3.25 for the 10 and the 6.23 metre soot visibility criteria. The visibility is judged through the visibility function in FDS, which directly couples the visibility factor of 3 (light reflecting objects) to the results.
Figure 3.25 – Soot visibility of model #1. The black line indicates the transition zone from a visibility of 10 metres or higher to a lower value in the left-‐ (at 155 sec) and a visibility of 6.23 metres in the right picture (at 171 sec). The transition zone in figure 3.25 (black line) is not spreading equally over the room due to the fact that the smoke development first travels across the ceiling and then flows downwards along the walls at the opposite of where the fire started. It will then slowly fill the air between the walls and the fire by slowly moving in the direction of the fire. Because the room is not equally filled with the same amount of smoke, the visibility and temperature criteria are judged at the moment when all three other beds are surrounded by the maximum value used for that criterion. The untenable conditions namely, are assigned to a certain visibility through smoke and thus also applicable at shorter distances with the same visibility as it contains an equal amount of particles per metre.

Evacuation of bedridden building occupants 46
Three tables were created to present the measurement results: one for the results of the model with the door constantly closed, one for the model which has the door opened at pre-‐defined time intervals, and one for the nursing home simulation. Hospital simulation The time intervals for the hospital simulation model are: 60 seconds until arrival – 35 seconds door open – 22 seconds door closed – 35 seconds door open – 22 seconds door closed – 17 seconds door open – 22 seconds door closed – 17 seconds door open – door closed during the rest of the simulation. These numbers were gathered from the experimental results at the hospital. It is assumed that no hindering is taking place and that no failures were made during the evacuation. Table 3.10 presents the results of the model with the door constantly closed and table 3.11 presents the results of the model with the door opened at pre-‐defined time intervals.
Model: #1 #2 #3 #4 #5 Visibility 10m 154.8 114 101.4 177 81 Visibility 6.23m 171 129 111 201 84 Temperature 150 oC > 600 441 291 > 600 234 Table 3.10 – Simulation results of the hospital model with the door constantly closed; results in seconds.
It is shown from table 3.10 that visibility is a far more important parameter than temperature when using the criteria as described in paragraph 2.2.2. This is due to the fact that smoke development in general goes much faster than the temperature development in a room (depending on the material on fire). When analysing the data one can see that the visibility criterion is reached in less than half the time that is required to reach the temperature criterion. Visibility, and thus toxicity of a smoke layer is therefore an important parameter and should not be underestimated. As is shown from the table the visibility criteria are met in 114 second for 10 metres and 129 seconds for 6.23 metres when applying the generally used fire conditions of 250 kW/m2 and a time constant of 300 seconds (model #2). When the sheets and the beds would be made fire retardant a lower time constant or lower heat release rate is more probable. The visibility criteria are met at 177 seconds for the 10-‐metre criteria and 201 seconds for the 6.23 metre criteria for the model with a lower time constant (model #4). For the model with the lower heat release rate (model #1) the criterion for 10 metre visibility is met at 155 seconds and the criterion for 6.23 metre is reached at 171 seconds. These differences seem relatively small on an absolute scale, but can be lifesaving in emergency situations where every minute counts. If the room would be filled with more obstacles and materials the heat release rate will become bigger and the fire-‐spread rate might increase. Model #3 is calculated with a higher heat release rate and shows that the time until the criteria are reached drops to 101.4 seconds for the 10 metre visibility and to 111 seconds for the 6.23 metre visibility criterion. When the fire spread rate would increase to a fast developing fire (model #5) the time to reach the criteria drops even lower to 81 seconds for the 10-‐metre criterion and to 84 seconds for the 6.23-‐metre criterion. These two conditions however are most often not applicable to hospital rooms, but can be applicable in case a room in a nursing home is simulated where the fire load is much different from a hospital room.
Model: #6 #7 #8 #9 #10 Visibility 10m 171 147 114 213 90 Visibility 6.23m 198 156 126 240 99 Temperature 150 oC > 600 420 294 > 600 241 Table 3.11 – Simulation results of the hospital with the door open at pre-‐defined intervals; results in seconds.
Table 3.11 shows the results for the model that was simulated with a door that opens at predefined time intervals and a connected corridor. Comparing the results with the results shown in table 3.10,

Evacuation of bedridden building occupants 47
one can see that all but one, results have an extended duration. The temperature criterion at model 7 is reached earlier than in model number 2, for the reason that the door closed at a certain time and accumulated heat faster and different than when the door would stay closed constantly. In the other simulated models where the door would open, a part and of the heat and smoke that is accumulating in the room is streaming to the corridor while the door is opened. This will increase the time until untenable conditions are reached inside the simulated room, but will also decrease the visibility length and increase the temperature in the corridor itself.
Figure 3.26 shows the visibility in the corridor for the models 6 and 7, with a HRR of respectively 100 and 250 kW/m2 at a time-‐constant of 300 seconds and after 230 seconds. After 230 seconds, the pre-‐defined door schedule as explained before has come to an end and the door is not opened again. During this period however the smoke has streamed into the corridor as can be seen from the figure. For model 6 with a HRR of 100 kW/m2, the smoke density in the hall is between 6 and 10 metres on the right part of the corridor while near the door of the room the visibility length is below the critical 6.23 metres. For model 7 (HRR = 250 kW/m2) the visibility length is under 6.23 metres in the whole corridor.
Figure 3.26 – Soot visibility (6.23 metres) of model #6 (left) & #7 (right) after 230 seconds.
The model shows that critical conditions might also occur inside the corridor, depending on the fire development and the rate and duration at which the doors are opened. Other evacuation strategies, like moving all the victims in their beds to the corridor and from there evacuate them outside the fire compartment might also cause critical situations because the door is then left open for a longer time period. Depending on the situation, one has to observe which evacuation procedure is best to apply. Furthermore the above-‐described results only account for a room without self-‐closing doors. Nursing home simulation A simulation model of a nursing home is conducted with a HRR of 250 kW/m2 at a time constant of 300 seconds. No variation in the HRR and time constants has been applied because in general the fire load in a nursing home is much larger and no fire retardant materials are applied. The model has been created according to the ground plan of nursing home 5, where the room and the corridor are simulated. A visualisation of the model is shown in figure 3.27. A similar time schedule is applied as was conducted in the unannounced evacuation drill: 250 seconds until the door is opened, and 30 seconds later the door was closed again, until after 290 seconds the door was opened again and never closed again. Another (fictive) time schedule is applied where the door would be closed after the victim was evacuated at 376 seconds. Both models are referred to as respectively N1 and N2.
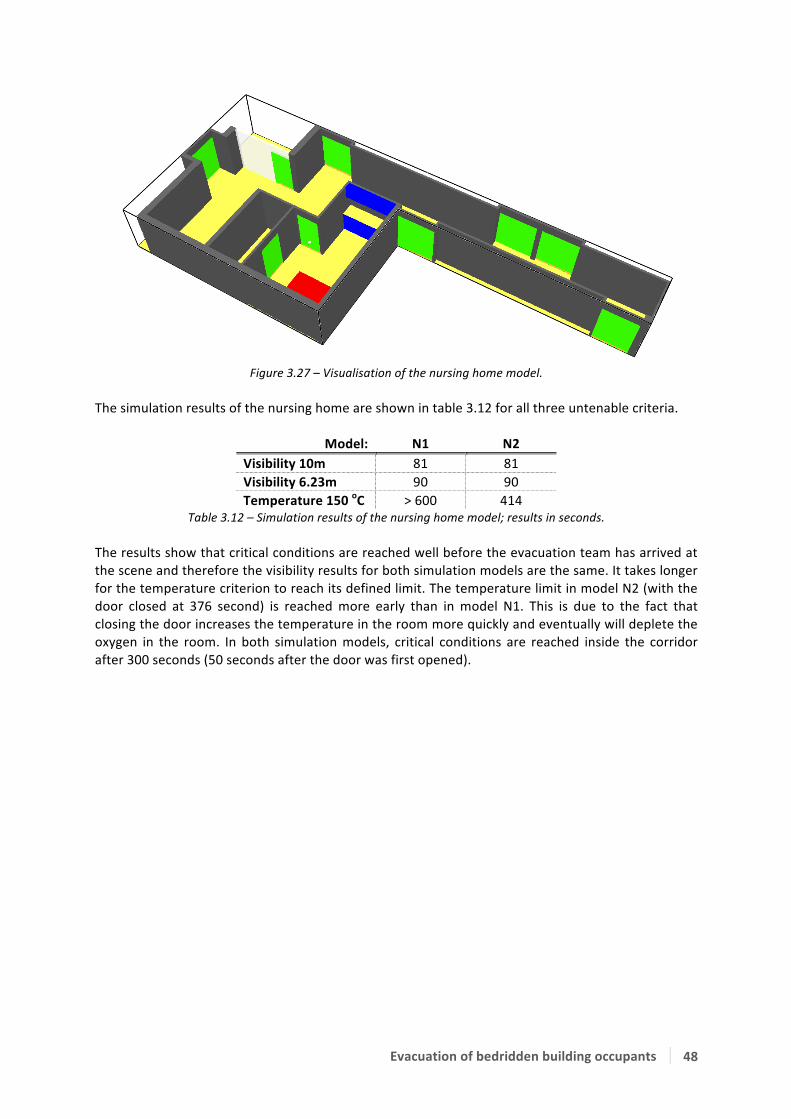
Evacuation of bedridden building occupants 48
Figure 3.27 – Visualisation of the nursing home model.
The simulation results of the nursing home are shown in table 3.12 for all three untenable criteria.
Model: N1 N2 Visibility 10m 81 81 Visibility 6.23m 90 90 Temperature 150 oC > 600 414
Table 3.12 – Simulation results of the nursing home model; results in seconds. The results show that critical conditions are reached well before the evacuation team has arrived at the scene and therefore the visibility results for both simulation models are the same. It takes longer for the temperature criterion to reach its defined limit. The temperature limit in model N2 (with the door closed at 376 second) is reached more early than in model N1. This is due to the fact that closing the door increases the temperature in the room more quickly and eventually will deplete the oxygen in the room. In both simulation models, critical conditions are reached inside the corridor after 300 seconds (50 seconds after the door was first opened).

Evacuation of bedridden building occupants 49
3.3.2 Comparison to the measured data The simulation models are set up from the ground plans and additional data from the hospital and nursing home measurements taken at hospital 2 and nursing home 5. The simulation initiates at t=0 seconds with a pre-‐defined heat release rate and time constant as described in paragraph 2.2. One should note that the smouldering phase therefore is skipped and the fire might already be detected. Because one cannot judge when the fire would be detected, t=0 is taken as the point where the fire probably would be detected by either the patients inside the room (this would involve a detection and response time of the person) or by the smoke detector. It is assumed that the people inside the room are bedbound and cannot evacuate themselves. Help is assumed to arrive at the scene within 60 seconds after t=0 for the hospital simulation. Because the experimental measurement at the nursing home was conducted as an unannounced drill, the measured time of approximately 240 seconds is used as the point where the BET would enter the room for assistance. Hospital simulation The simulation model of the hospital has already been set up with a pre-‐defined time period for opening and closing the doors. This time schedule is defined according to an average evacuation time gathered from the experiments executed at this particular hospital. Therefore the pre-‐defined time schedule is also used to assess the possibility of conducting a safe evacuation from the hospital. This schedule involves a 60 second arrival time and another 170 seconds of evacuation time until the door that provides access to the room is closed again. In total, an RSET of 230 seconds is required to evacuate four beds from the room. If three beds were to be evacuated instead of four because e.g. one of the beds is lit on fire, a total evacuation time of 191 seconds would be required. These numbers are compared to the available evacuation times simulated in models 6 to 10 (shown in table 3.11), and the results are shown in table 3.13 and table 3.14. If eventually the RSET is lower than the ASET a check mark is placed, and if the RSET is higher than the ASET a cross mark is placed in the corresponding rows and columns. Indicating that there is either enough or not enough time to conduct a safe evacuation from the room.
Model: #6 #7 #8 #9 #10 Visibility 10m ✗ ✗ ✗ ✗ ✗ Visibility 6.23m ✗ ✗ ✗ ✓ ✗ Temperature 150 oC ✓ ✓ ✓ ✓ ✓
Table 3.13 – Comparison of RSET versus ASET for an evacuation scenario with four beds at an evacuation time of 230 seconds. A check mark indicates that the RSET is lower than the ASET.
Model: #6 #7 #8 #9 #10
Visibility 10m ✗ ✗ ✗ ✓ ✗ Visibility 6.23m ✓ ✗ ✗ ✓ ✗ Temperature 150 oC ✓ ✓ ✓ ✓ ✓
Table 3.14 – Comparison of RSET versus ASET for an evacuation scenario with three beds at an evacuation time of 191 seconds. A check mark indicates that the RSET is lower than the ASET.
As is shown from table 3.14, only simulation model 9 meets all three criteria for untenable conditions after 191 seconds. Model 6 has visibilities below 10 metres but still above 6.23 metres and therefore is at its critical point, though evacuation could still be possible. From table 3.13 one can see that none of the 5 models satisfies to all three criteria. According to the simulation results, a safe evacuation of four patients would only be possible if the fire spread read is slow. Evacuating three patients is possible but conditions might become critical if the HRR or fire spread increases. Furthermore, if the door would be opened and closed according to the time-‐period as described before, the corridor will be filled with critical smoke conditions after 230 seconds for the models 7, 8, and 10 and possibly also for model 6. The visibility length measured in the corridor of model 9 after
Evacuation of bedridden building occupants 50
230 seconds lies somewhere between 6 and 10 metres. It should be noted that the results incorporate the arrival period where the evacuation team runs from outside the compartment to the room. In a real fire emergency scenario this arrival time might be slightly shorter or longer, or there might be only one person available to execute the evacuation during the first minute(s) of the fire. The simulation models that were run with the door closed show that within 1.5 minutes, critical conditions can occur if a HRR of 375 kW/m2 is applied in a hospital. This though is not very representable for a common hospital room. A HRR of 100 kW/m2 is more representable for a hospital, in which critical conditions would occur within approximately 3 minutes. Simulation results show that a quick response of the BET is essential in every situation and that no alarm should be underestimated. It is also shown that opening the door prolongs the evacuation time from the room but can also create critical smoke conditions inside the corridor if the door is open for too long. Furthermore, a safe evacuation of all four patients seems almost impossible with the current simulation conditions. Only if the fire spread rate is lowered to 100 seconds can a safe evacuation of four beds be realised within 230 seconds. A safe evacuation of three beds on the other hand is a bit more secure, though also only with a low fire spread rate or low heat release rate. Though one should keep in mind that a simulation is not a 100 percent realistic situation it does indicate that in this case, a safe evacuation of all four patients will become critical. Nursing home simulation The simulation model of a nursing home clearly shows that critical conditions are met quicker than in a hospital room because the room is much smaller and thus faster filled with smoke. After 1.5 minutes the smoke layer has become so dense that the critical visibility length of 6.23 metres is reached. After 2 minutes, the critical visibility length of 6.23 metres has also reached the height of the bed and thus the head height of a sleeping person. If help were to arrive after 3 minutes and 10 seconds, as was the case in the unannounced drill, it would probably be too late for the patient inside the room. Furthermore, there is a high chance for backdraft to occur if the evacuation team arrives minutes after the fire has initiated. According to the simulation model, the corridor is filled with a critical smoke layer within 20 to 30 seconds after the door is opened at 3 minutes and 10 seconds. This of course strongly depends on the material on fire and the HRR and fire spread rate. The simulation results of the nursing home show that a safe evacuation of a bedbound patient is becoming very critical and probably not possible if the arrival time takes several minutes. The personnel should furthermore be very careful with opening the doors and see to it that they do close the doors behind them as soon as possible to prevent the smoke from further spreading through the corridor. Overall remarks on the simulation results First of all it should be noticed that the simulation results function merely as an indication and that results in reality might deviate from the simulation results. It should also be noted that the simulation does not involve a smouldering phase of the fire. Instead the fire initiates at t=0 and starts developing at a constant rate. It is possible that a real fire emergency situation starts with a smouldering phase, which will most probably prolong the ASET of both the nursing homes and the hospitals. Even though the results of these simulations do not become less important because they are indeed possible scenarios. Especially in the nursing homes, situations can become critical, even if the smouldering phase is incorporated in the calculations.

Evacuation of bedridden building occupants 51
4 Discussion The results from the experimental measurements and the simulation are discussed in this chapter. For the experimental results it should be noted that the results only account for the specific set-‐up as described in chapter 1 and 2 and that results might differ in other experimental situations. The simulation was conducted merely to get an indication of the fire-‐ and smoke spread to analyse the RSET versus the ASET. Realistic fire scenarios might differ from the simulation and the results should not be used for any purpose other than this thesis. 4.1 Discussion on the experiments (RSET) The detection time that is employed in this research concerns a worst-‐case scenario in which the fire has already initiated when it is detected. In a real fire emergency situation the detection time however will be very dependent on the situation and the fire will most probably be detected before the fire is developing at a steady rate as is used in the simulation models. This detection time however is not the prescribing factor in this research and could be determined, if desired, by examining and determining the materials and the accompanying fire development scenarios. Comparing the measurement results with the simulation results has proven that the arrival time of the BET is of great influence to the possibility of conducting a safe evacuation. The unannounced drills in the nursing homes for example have proven that the arrival time is longer than the total evacuation time of a single bed. The arrival times that were measured during the three unannounced evacuation drills were 4.2 minutes, 3.85 minutes, 3.95 minutes, and 3.5 minutes on a total evacuation time of respectively 7.2 minutes, 9 minutes, 9.7 minutes, and 6 minutes. In hospitals the evacuation teams are often more close to the individual rooms, and therefore faster arriving times can be achieved. But because the rooms also house several beds, the total required evacuation time is generally longer. It can thus be concluded that the arrival time is of great importance in both situations, though it seems that the arrival time is of the largest importance in nursing home emergency situations. The arrival times can possibly be shortened if much of the procedural actions are skipped. It is still customary for a BET-‐member in a nursing home to first report at the front desk downstairs before moving towards the room in which the smoke detector is triggered, while they could already be located near the room when the alarm is first heard. This situation also occurred during one of the unannounced evacuation drills, where a few minutes could be gained and thus the arrival time could have been shortened, if the people did not have to move downstairs first. A different evacuation strategy might thus allow for the arrival time to be shortened to a more acceptable value. For example, if the BET would be warned by means of their walkie-‐talkie with the correct location of the fire, the people closest to the fire could run towards the room in question and report that they are moving directly towards the room instead of moving downstairs first. Evacuation measurements have proven that the duration of evacuating a single bed is dependent on many factors, of which the most important are experience of the BET, type of coupling(s), and building dimensions. Experience of the BET can be explained by e.g. how many times they have conducted an evacuation, how much experience they have with riding hospital beds, how may times they have performed the evacuation measurement etc. Furthermore age seems also of importance but is harder to accurately define. The width between the bed and the doorpost, and the width of the corridor in which a bend is to be made also influences the evacuation speed. Also the direction in which the fire compartment doors open is of influence on the evacuation speed. The evacuation speed is most reduced if both doors would open in different direction and least reduced if it would open in the evacuation direction.
Evacuation measurements can also be hindered by e.g. a cable jamming the wheel. Even though this might result in larger deviations in evacuation speeds, it is representable to an actual
Evacuation of bedridden building occupants 52
emergency situation. In fact, it might even be more representable, as when people are in a hurry things tend to go wrong more often. The total evacuation time is furthermore dependent on the uncoupling time, not only the type of coupling is of importance but also the quantity and the familiarity of the evacuation team with the couplings. It should also be mentioned that the evacuation scenario was discussed in advance with the evacuation team (unless an unannounced drill was performed), thus they knew what to expect. Realistic evacuations might therefore differ. The experience and familiarity of the BET with the evacuation scenarios appears to be of importance to the total evacuation time of a bedridden building occupant in an evacuation drill. Therefore one might conclude that giving the BET more proper and sufficient training on the subject, the evacuation scenarios might be conducted more quickly and smoother. But it should be kept in mind that training will never prepare a person for a real fire emergency situation, which will always be different. Other studies on the subject have shown that people might as well react completely different from what they have learned, and thus training the BET will most probably have a minor contribution to the total required evacuation time. The evacuation-‐ and arrival speeds that were derived from the nursing home measurements have a relatively large range in comparison to the hospital measurements. A possible reason for this large dispersion is the inexperience of some evacuation teams with this particular scenario. Because there is a fairly large dispersion between nursing homes and hospitals, the results should not be mutually compared and one measurement should not be used for the other.
Measurement results of the evacuation sheet show that a speed can be achieved that is relatively equal to the evacuation speed with a hospital bed in another nursing home, but only if small distance is to be covered. Over long distances, a hospital bed is faster. The evacuation sheet requires some time to prepare before it can be evacuated, especially if it is hung in the staircase and the evacuation team has to bring it to the room first. One should keep in mind though that the drill with an evacuation sheet has only been conducted once. The evacuation drill held at the intensive care indicates the importance of a fire safe environment because these patients are coupled to a relatively large amount of apparatus. Uncoupling times therefore are far longer than in a “normal” hospital situation, which should be taken into consideration when creating fire compartments for IC units. A possible different evacuation strategy, e.g. moving the beds outside the room and positioning the beds in the corridor before they are removed from the fire compartment, is not properly analysed. The described situation is practised once but did not result in different total evacuation times. Though the beds were removed earlier from the room in comparison to the standard evacuation scenario in this research, and in a real fire emergency situation the smoke conditions near the BET and the bedridden patients will thus be less severe. This situation was not further analysed but might result in a more advantageous evacuation than the scenario that is described in this research. The evacuation route that is analysed is not further specified for e.g. the time that is required for taking bends or traverse doors. This is not done because the dispersion that is believed to be found is minimal and the benefits that can be obtained by specifying these results are minimal. It is furthermore believed that other factors in the evacuation route, e.g. the uncoupling time and arrival time are of more importance and will have a larger effect on the total evacuation time. 4.2 Comparison to other literature Because of the lack of researches on the subject, there is only one comparison with another study that is focussed on bedridden building occupants and another comparison to the currently used theoretical timeline in the Dutch building code. Other studies focus only on the evacuation speeds of mobility impaired occupants such as wheelchair users, and furthermore describe their results as a
Evacuation of bedridden building occupants 53
speed on a straight piece of corridor or when traversing a bend. A third comparison is made with the evacuation speeds of other mobility impaired building occupants to define the order of magnitude of the current measurement results in regard to other researches. Results from a study conducted by DGMR (Peters, Milius, & van de Leur, 2012) show that four beds are evacuated within a time-‐range of 138 to 175 seconds, in a hospital with relatively similar dimensions as the measurement conducted at hospital 3 in this report. Though the corridor was almost 10 metres longer in the study of DGMR than the corridor in hospital 3. The type of coupling involved an electrical coupling for all four beds. Results from the measurements in hospital 3 show that a total evacuation time lies around a medium range of 170 seconds for beds without an electrical coupling. Further data about the measurements conducted by DGMR is not available and therefore any further specification cannot be given. Though it appears that the total evacuation time in the study conducted by DGMR resulted in faster evacuations, while an extra coupling in regard to the measurements in this report was applied and the corridor had a longer length. Other results from the same study show that in a test set-‐up in the new “Meander” hospital, six beds were evacuated within 120 seconds from six individual rooms. Again, further specifications about the measurements are not included. Even though, a comparison to the measured data in hospitals in this research shows that none of the total evacuation times lay below 30 seconds per bed and thus would require a total evacuation time of at least 180 seconds for six beds. In both studies conducted by DGMR, the evacuation time appears to be quicker than the measured data gathered in this research. A reason for both discrepancies remains unknown, but could be caused by the difference in experience of the evacuation team executing the drill or different door-‐ and corridor widths. The study is to be more specified before a more accurate comparison can be made. A study conducted by the Dutch ministry of internal affairs (TNO, 1994) in 1994 has developed a theoretical timeline in which it is assumed that a hospital room is to be evacuated within 5 minutes after the fire has been detected. Furthermore, the timeline shows that the whole room is theoretically evacuated within two minutes while the other three minutes are reserved for detection and arrival. The evacuation measurement results in this report show that on average, an evacuation of four beds requires 3 minutes. If a room with six beds would have to be evacuated, a total evacuation time of 4.5 minutes would be required. If the results are compared to the theoretical timeline of TNO, one can conclude that a safe evacuation will depend on the arrival time of the BET. A safe evacuation of six beds is probably not realistic but a four-‐bed room can be safely evacuated if the arrival time stays below 2 minutes, according to the research. Research conducted by Boyce et al. (Boyce, Shields, & Silcock, 1999) does not incorporate measurements on bedridden building occupants, but does involve measurements on people with crutches, a walking stick, a rollator, and wheelchair users. These measurements were conducted on a straight piece of horizontal hallway, and are mentioned to define the order of magnitude of the research results. The results from the study by Boyce show that evacuation speeds of people with crutches lie in a range of 0.63 to 1.35 m/s, for people with a walking stick the range is 0.26 to 1.60 m/s, for people using a rollator the speed lies in a range of 0.10 to 1.02 m/s. Evacuation results for assisted (manual) wheelchair users lies in a range of 0.84 to 1.98 m/s and for unassisted (manual) wheelchair user the range is 0.13 to 1.35 m/s. Comparing the results from the study by Boyce et al. with this research (range: 0.25 to 1.34 m/s for hospitals and nursing homes combined) one can see that the evacuation of assisted wheelchair users is generally faster than the evacuation of a bedridden building occupant. Also, the evacuation results of people with crutches, a rollator, and for unassisted wheelchair users lie within the range of the results that were found in this research or perhaps a bit lower (rollator-‐ and unassisted wheelchair users). Occupants with a walking stick are capable of faster evacuations than a bedridden building occupant. The results reveal that in general, evacuation speeds of bedridden building occupants are comparable to other mobility impaired, though if assisted, wheelchair users can conduct faster evacuation together with walking stick users.

Evacuation of bedridden building occupants 54
4.3 Discussion on the simulations (ASET) The simulation results reveal that smoke development in this case is far more important than the temperature. The smoke development (visibility) criterion is therefore reached much earlier than the temperature criterion in all simulated situations (see figure 4.1). Conditions can become critical very quickly and therefore a quick response of the BET is essential if a safe evacuation is to be conducted. Simulation results furthermore show that varying the HRR from 100 to 375 kW/m2 yields a dispersion of approximately one-‐third of the total time to reach untenable conditions with a HRR of 100 kW/m2. Increasing the time constant from 100 seconds to 600 seconds will increase the time until untenable conditions are reached with a factor 1.5.
Figure 4.1 – Time to reach untenable conditions for all three criteria in ten simulation models. The arrival time in the simulation models is calculated from the moment the fire initiates. In a real fire emergency situation a smouldering phase might occur, which could prolong the total available egress time. This moment is not incorporated in the simulation model because a smouldering phase is very dependent on the situation. Additional research will be required to investigate the probability of a smouldering phase in nursing homes and hospitals. This however does not fall within the scope of this research and is therefore left unattended. Smoke conditions will probably affect the evacuation time that is required for the BET in a negative way, prolonging the time a BET needs to remove the bed from the room. This factor is however not incorporate in this thesis, due to the fact that the data for this influence is unknown and investigation on this influence lies outside the scope of this research. It is assumed that the average HRR in a nursing home lays around 250 kW/m2 with a time constant of 300 seconds, but these assumptions might as well be different from the real HRR and time constant inside the room. For hospitals these values generally lay lower than those for the nursing homes, as there is less fire load and less flammable material inside the room. Because the large dispersion that can occur when addressing the fire loads, time constants and other fire properties, the results of the simulation should be used as an indication.
Evacuation of bedridden building occupants 55
4.4 General discussion For the worst-‐case situation that is considered, the results turn out to be very problematic. Though other, less severe conditions might occur in a real fire emergency situation. As mentioned before, a smouldering phase occurs prior to almost every fire and will thus prolong the total available evacuation time. Also, the simulation results are worst-‐case and the soot yield that the fire produces possesses a few safety factors that will decrease the ASET. A real fire emergency situation will therefore differ from the results that are found in this research. The results however should not be rejected that easily, because they have led to some important insights on the matter. It is for example shown that the arrival time of the BET is very important, and might be even more important than the total evacuation time in case of fire. As the arrival time increases, the smoke development inside the room becomes more severe and the chances on a safe evacuation become more critical. The simulation proves that smoke will flow through the corridor if room doors are opened at certain time periods. The smoke development might in its turn result in critical situations inside the corridor, which could lead to problems if the other rooms connected to the corridor are also to be evacuated. The current way of tackling fire safety problems is done by either installations, constructive, or organizational measures. The possible effect of any of these measures is described below. The current installations that are applied in common nursing homes and hospitals involve smoke detectors that are directly connected to a device that automatically forwards the alarm to the fire department and in some cases also shows the exact fire location on the beepers the personnel is carrying. These detectors are accurate enough and will most probably detect a smouldering fire in its early stage. Not all institutions however use beepers that inform the personnel on the exact location of the fire, which might decrease the total required arrival time, as discussed before. In many of the experimental researches that were conducted, no self-‐closing doors were applied while in some cases they should be applied according to the Dutch building code. The importance of applying self-‐closing doors seems to be underestimated and should be more carefully considered in both hospitals and nursing homes. Because results from the experimental measurements show that in many cases the BET forgets to close the door once the bed is evacuated from the room, the corridor could be filled with smoke. If self-‐closing doors are applied one does not have to rely on the BET to close the door in case of an emergency and the smoke development in the corridor will be reduced to a minimum. The smoke conditions in the room itself though will become critical more early, but a safe evacuation of all the other rooms connected to the corridor is substantially more secure. This is also in the advantage to the fire brigade, that usually arrives after approximately 15 to 20 minutes, and who can then directly start evacuating the other rooms connected to the corridor. The current way of organization in the examined hospitals and nursing homes is predominantly focussed on training people for emergency situations. This seems as the best possible strategy, though a more frequent training is advised because during the experimental researches it was analysed that few mistakes were made (e.g. leaving the door open). Though it should be noted that, even though the BET is properly and sufficiently trained, mistakes can still occur and people might even conduct very different evacuations in comparison to what they have learned. The arrival time, as discussed before, is probably one of the most important factors in which time can be gained if strategies are changed. All of the three discussed factors (installations, constructive, and organizational) should be sufficiently guaranteed if a fire safe environment is to be established in a hospital or nursing home room. If a safe environment cannot be guaranteed, an option is to use a sprinkler installation in a nursing home or hospital room to improve the fire safety. Though the consequences of applying a sprinkler installation are not analysed in this paper due to the limited scope of the research.

Evacuation of bedridden building occupants 56
Situations can also occur in which only one BET member is available for evacuation. This can happen in e.g. a night situation in a nursing home. Some institutions prescribe that a single person should not evacuate a room on its own, and that person should than have to wait for the fire brigade to arrive before an evacuation can start. The arrival time for the fire brigade, however, is approximately assumed to be 15 to 20 minutes. If one compares this to the simulations that were conducted in this research, critical conditions are probably reached before the fire department can start with an evacuation (including the smouldering phase). It will most likely be better if the person that is present in the building analyses the situation first and decides for him-‐ or herself if a safe evacuation is possible. Depending on the smouldering phase and the arrival time it will most likely be possible for one person to conduct a safe evacuation from the room. Furthermore, it might be better to allow smaller, or less beds (maximum of four beds) in one single hospital room. The individual rooms should then be fire resistant for at least 30 minutes, and the door should be made self-‐closing, to prevent the fire from further spreading through the corridor.

Evacuation of bedridden building occupants 57
5 Conclusions Conducting research on the evacuation of bedridden building occupants in hospitals and nursing homes has led to some general and some specific conclusions.
5.1 General conclusions § The range in evacuation speeds that was found in the experimental evacuations is for hospitals:
0.54 to 1.34 m/s, and for nursing homes: 0.25 to 1.30 m/s. Note that these values apply only to the setup that is used and described in this research, which includes traversing two doors and one corner;
§ The range in arrival speeds that was found in the experimental evacuation is for hospitals: 0.91 to 2.86 m/s, and for nursing homes: 0.75 to 3.39 m/s. Note that these values only apply to the setup that is used and described in this research, which includes traversing two doors and one corner;
§ An often returning problem is that people do not accurately perform an evacuation drill: they often forget to feel the door panel and take a glance inside, but rather open the door at once. If a real fire emergency situation is to occur, this could lead to potentially dangerous backdraft situations. Also, after the evacuation team has evacuated a patient from the room they forget to close the door that connects to the corridor, letting smoke travel from the room to the corridor. This problem could be tackled by applying self-‐closing doors that would prevent smoke from travelling through the door opening into the corridor;
§ The width between the door and the bed influences the evacuation speed, and also does the
width of the corridor, which influences the tightness of the corner that is to be made. The effect is analysed in both hospitals and nursing homes, but it is not quantified in this research. Though the effect is expected to be of minor influence to the total evacuation time;
§ On average, evacuation teams in both hospitals and nursing homes do not have sufficient experience with conducting evacuations, which might lead to critical situations if a real fire is to occur. The outcomes of the surveys endorse this fact. The evacuation teams require more frequent and proper training on the subject. Though it should be mentioned that in a real fire emergency situation, people might respond very differently than in an evacuation drill and could possibly ignore the evacuation strategy and do what they think is right.
For hospitals:
§ Uncoupling an intensive care patient generally takes 1 to 1.5 minutes or maybe longer if more couplings are applied. The total evacuation time of one single patient is generally 2 minutes. When designing fire compartments for IC-‐units, special interest is to be given to the evacuation speed and times that come with intensive care patients.
For nursing homes:
§ Measurements were conducted at daylight with sufficient personnel to execute the evacuation, in night situations the complement of personnel can be less and arrival-‐ and evacuation times can be longer, especially in nursing homes where often one person is available to execute an evacuation;
§ Communication seems to be a problem primarily in nursing homes, where the BET is having problems receiving instructions and reporting their findings to the coordinator, consuming valuable time (40 seconds in two investigated cases, and 1.5 minutes in another) that is better spent in the evacuation procedure.
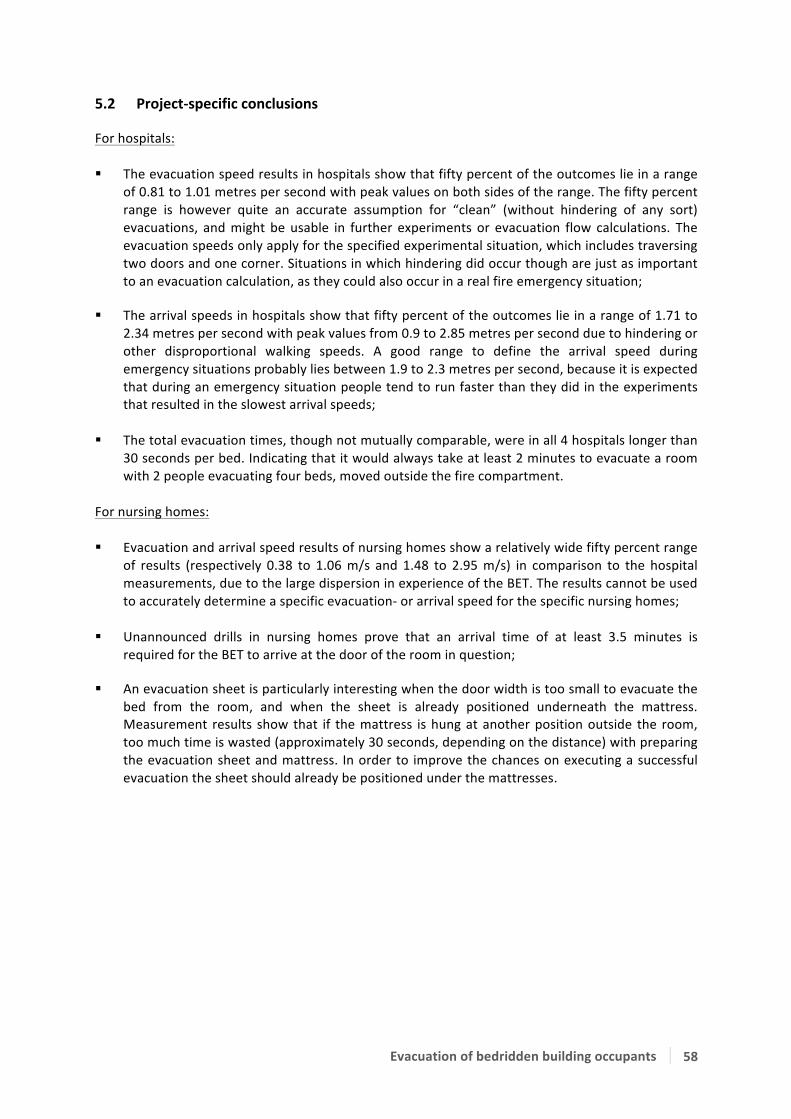
Evacuation of bedridden building occupants 58
5.2 Project-‐specific conclusions For hospitals: § The evacuation speed results in hospitals show that fifty percent of the outcomes lie in a range
of 0.81 to 1.01 metres per second with peak values on both sides of the range. The fifty percent range is however quite an accurate assumption for “clean” (without hindering of any sort) evacuations, and might be usable in further experiments or evacuation flow calculations. The evacuation speeds only apply for the specified experimental situation, which includes traversing two doors and one corner. Situations in which hindering did occur though are just as important to an evacuation calculation, as they could also occur in a real fire emergency situation;
§ The arrival speeds in hospitals show that fifty percent of the outcomes lie in a range of 1.71 to
2.34 metres per second with peak values from 0.9 to 2.85 metres per second due to hindering or other disproportional walking speeds. A good range to define the arrival speed during emergency situations probably lies between 1.9 to 2.3 metres per second, because it is expected that during an emergency situation people tend to run faster than they did in the experiments that resulted in the slowest arrival speeds;
§ The total evacuation times, though not mutually comparable, were in all 4 hospitals longer than
30 seconds per bed. Indicating that it would always take at least 2 minutes to evacuate a room with 2 people evacuating four beds, moved outside the fire compartment.
For nursing homes: § Evacuation and arrival speed results of nursing homes show a relatively wide fifty percent range
of results (respectively 0.38 to 1.06 m/s and 1.48 to 2.95 m/s) in comparison to the hospital measurements, due to the large dispersion in experience of the BET. The results cannot be used to accurately determine a specific evacuation-‐ or arrival speed for the specific nursing homes;
§ Unannounced drills in nursing homes prove that an arrival time of at least 3.5 minutes is
required for the BET to arrive at the door of the room in question; § An evacuation sheet is particularly interesting when the door width is too small to evacuate the
bed from the room, and when the sheet is already positioned underneath the mattress. Measurement results show that if the mattress is hung at another position outside the room, too much time is wasted (approximately 30 seconds, depending on the distance) with preparing the evacuation sheet and mattress. In order to improve the chances on executing a successful evacuation the sheet should already be positioned under the mattresses.
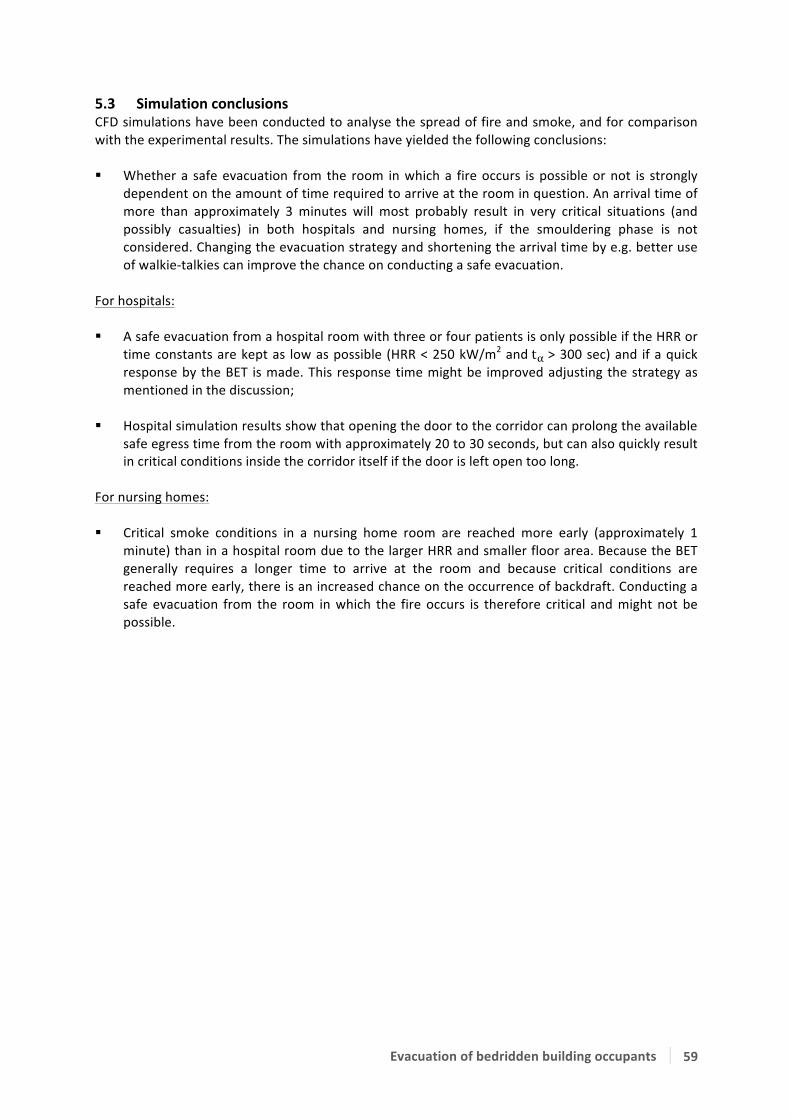
Evacuation of bedridden building occupants 59
5.3 Simulation conclusions CFD simulations have been conducted to analyse the spread of fire and smoke, and for comparison with the experimental results. The simulations have yielded the following conclusions: § Whether a safe evacuation from the room in which a fire occurs is possible or not is strongly
dependent on the amount of time required to arrive at the room in question. An arrival time of more than approximately 3 minutes will most probably result in very critical situations (and possibly casualties) in both hospitals and nursing homes, if the smouldering phase is not considered. Changing the evacuation strategy and shortening the arrival time by e.g. better use of walkie-‐talkies can improve the chance on conducting a safe evacuation.
For hospitals: § A safe evacuation from a hospital room with three or four patients is only possible if the HRR or
time constants are kept as low as possible (HRR < 250 kW/m2 and t! > 300 sec) and if a quick response by the BET is made. This response time might be improved adjusting the strategy as mentioned in the discussion;
§ Hospital simulation results show that opening the door to the corridor can prolong the available
safe egress time from the room with approximately 20 to 30 seconds, but can also quickly result in critical conditions inside the corridor itself if the door is left open too long.
For nursing homes: § Critical smoke conditions in a nursing home room are reached more early (approximately 1
minute) than in a hospital room due to the larger HRR and smaller floor area. Because the BET generally requires a longer time to arrive at the room and because critical conditions are reached more early, there is an increased chance on the occurrence of backdraft. Conducting a safe evacuation from the room in which the fire occurs is therefore critical and might not be possible.

Evacuation of bedridden building occupants 60
6 Recommendations for further research Due to the limited time in which this thesis is performed not all questions could be answered and in some cases, new questions arose from certain findings. Below is a summarization of interesting things that would require some additional research. § More evacuation drills should be conducted with other measurement set-‐ups with e.g. more
different type of couplings or other evacuation strategies to analyse the difference in evacuation speeds and time.
§ More measurements in nursing homes with an evacuation sheets should be conducted to get a better insight in the evacuation times with these mattresses. Additional evacuation measurements in nursing homes with hospital beds are also desired.
§ Studies on arrival times have to be conducted in both hospitals and nursing homes to generally
determine the required time for the BET to arrive at the room in question after an alarm is triggered.
§ A study on the possibility of a smouldering phase and duration in hospitals and nursing homes
should be conducted to get insight on this data. § More data is required to accurately determine the evacuation times in an intensive care unit.
Additional measurements are therefore desired. Furthermore a simulation model of an IC unit would be convenient to determine the time that is available before untenable conditions occur.
§ The video images that were made could use some extra investigation on how people respond
and act during an evacuation situation.
Evacuation of bedridden building occupants 61
7 References
Boyce, K., Shields, T., & Silcock, G. (1999). Toward the Characterization of Building Occupancies for Fire Safety Engineering: Capabilities of Disabled People Moving Horizontally and on an Incline. Fire Sert, University of Ulstel. Antrim: Fire Technology.
CBS. (2011, 10 28). Centraal Bureau voor de Statistiek. Retrieved 6 25, 2012 from Statline: http://statline.cbs.nl/
Evarts, B. (2011). Physical disability as a factor in home fire deaths. National Fire Protection Agency, Fire Analysis and Research Division, Quincy.
Drysdale, D. (1998). An introduction to fire dynamics (2nd edition). West Sussex, England: John Wiley & Sons Ltd.
Hadjisophocleous, G. V., & Benichou, N. (1999). Performance criteria used in fire safety design. National Research Council of Canada, National Fire Laboratory. Ottowa, Canada: Automation in Construction 8.
Herpen, R. v. (2013). Notitie rookverspreiding. Fire Safety. Zwolle: Nieman Raadgevende Ingenieurs.
Herpen, R. v., & Nes, R. v. (2011). CFD voor brandsimulaties in parkeergarages. Arnhem: Nederlands Vlaamse Bouwfysica Vereniging.
K. Höglander and B. Sundström. (1997). Design fires for preflashover fires – Characteristic heat release rates of building contents. SP Swedish National Testing and Research Institute. SP Report 1997:36: Fire Technology.
Lemaire, A. (2005). Souterrain Tramtunnel Den Haag; Beoordelingscriteria. TNO, Centrum voor brandveiligheid. Delft: TNO Bouw en Ondergrond.
NEN 6055. (2011). Thermische belasting op basis van het natuurlijk brandconcept -‐ Bepalingsmethode. Normcommissie 351 007, Brandveiligheid van Bouwwerken. Delft: Nederlands Normalisatie-‐instituut.
NEN 6069. (2011). Beproeving en klassering van de brandwerendheid van bouwdelen en bouwproducten. Normcommissie 353084, Brandveiligheidsaspecten bouwproducten en bouwdelen. Delft: Nederlands Normalisatie-‐instituut.
NEN-‐EN 1991-‐1-‐2-‐NB. (2010). Algemene belastingen – Belasting bij brand. Normcommissie 351 001. Delft: Nederlands Normalisatie-‐instituut.
NFPA. (2008). Fire Protection Handbook (Vol. I & II). (M. J. Hurley, & R. W. Bukowski, Eds.) Quincy, Massachusetts, USA, p. 3-‐127.
NIST. (2010). Fire Dynamics Simulator (Version 5) User’s Guide. National Institute of Standards and Technology, U.S. Department of Commerce. Washington: Special Publication 1019-‐5.
NRC-‐CNRC. (2005). Heat Release Methods. Institute for Research in Construction, Institute for Research in Construction, Ottowa, Canada.
Mulholland, G. W., & Croarkin, C. (2000). Specific extinction coefficient of flame generated smoke. National Institute of Standards and Technology (NIST). Gaithersburg: Fire and Materials, Vol. 24.
Peters, B., Milius, M., & van de Leur, P. (2012). Developing a new fire safety concept for wards in hospital buildings. DGMR Consulting Engineers. den Haag: DGMR.
Rijkswaterstaat. (2002). Safety proef -‐ Rapportage brandproeven. Dutch ministery of infrastructure and the environment. Utrecht: Bouwdienst Rijkswaterstaat.
TNO. (1994). Fire Safety Concept for Health Care Buildings (Dutch). Delft: Report B-‐88-‐133.
VROM. (2011). Brandveiligheid van zorginstellingen. Dienst Uitvoering, Programma bouwen aan kwaliteit. Den Haag: Ministerie van Volkshuisvesting Ruimtelijke Ordening en Milieubeheer.

Evacuation of bedridden building occupants 62
8 Figure & Table list
Figure Description Page 1.1 Deaths by fire in the Netherlands (CBS, 2011). 7 1.2 Total number of fires that caused damage in the year 2010 (CBS, 2011). 8 1.3 Schematic representation of the experiment. 9 1.4 The CBUF heat release curve from Höglander and Sundström compared to three ISO fire curves. 10 1.5 An impression of the FDS hospital model with and without corridor (the red areas are beds). 11 1.6 Comparison of three grid sizes. 12 2.1 The evacuation scenario. 13 3.1 Explanation of an example Whisker plot. 17 3.2 Ground plan of the room in hospital #1. 18 3.3 Measured data from hospital #1, created from 12 evacuation drills. 19 3.4 Ground plan of the room in hospital #2. 20 3.5 Measured data from hospital #2, created from 20 evacuation drills. 21 3.6 Ground plan of the room in hospital #3. 22 3.7 Data of all evacuation measurements from hospital #3, created from 39 evacuation drills. 23 3.8 Ground plan of the room in hospital #4. 25 3.9 Measured data from hospital #4, created from 20 evacuation drills. 26 3.10 Ground plan of nursing home #1. 27 3.11 Measured data from nursing home #1, created from 2 evacuation drills. 28 3.12 Ground plan of nursing home #2. 29 3.13 Measured data from nursing home #2, created from 4 evacuation drills. 30 3.14 Ground plan of nursing home #3. 31 3.15 Measured data from nursing home #3, created from 5 evacuation drills. 32 3.16 Ground plan of nursing home #4. 34 3.17 Measured data from nursing home #4, created form 5 evacuation drills. 35 3.18 Ground plan of nursing home #5. 36 3.19 Measured data from nursing home #5, created from 2 evacuation drills. 37 3.20 A combination of all measured data from hospitals #1,2,3 & 4. 39 3.21 A version of the evacuation speed measurement over 85 measurements and an adjusted version of
the arrival speeds over 65 measurements. 40
3.22 A combination of all measured data from nursing homes #2,3 & 4. 40 3.23 Ground plan of the IC unit in hospital #5. 42 3.24 Measured data from hospital #5. 43 3.25 Soot visibility of model #1. 45 3.26 Soot visibility of model #6 & #7 after 230 seconds 47 3.27 Visualisation of the nursing home model. 48 4.1 Time to reach untenable conditions for all three criteria in ten simulation models 54 D2 The uncoupling time with drip and without drip in two graphs. 63 D4 The uncoupling time with drip without drip in two graphs. 63 D5 The uncoupling time of bed#1 and bed #2 in two graphs. 63
Table Description Page 1.1 Input values for different growth rates. 11 2.1 Simulation variants. 15 2.2 Summary of upper and lower limits of deterministic criteria (Hadjisophocleous & Benichou, 1999). 16 2.3 Temperature versus response (Rijkswaterstaat, 2002). 16 3.1 Mean values of all five parameters from hospital #1. 19 3.2 Mean values of all five parameters from hospital #2. 21 3.3 Mean values of all five parameters from hospital #3. 23 3.4 Mean values of all five parameters from hospital #4. 26 3.5 Mean values of all five parameters from nursing home #2. 30 3.6 Mean values of all five parameters from nursing home #3. 32 3.7 Mean values of all five parameters from nursing home #4. 35 3.8 Type of coupling on both beds. 43 3.9 Mean values of all five parameters from hospital #5. 44 3.10 Simulation results of the hospital model with the door constantly closed. 46 3.11 Simulation results of the hospital with the door open at pre-‐defined intervals. 46 3.12 Simulation results of the nursing home model. 48 3.13 Comparison of RSET versus ASET for an evacuation scenario with four beds at an evacuation time of
230 seconds. 49
3.14 Comparison of RSET versus ASET for an evacuation scenario with three beds at an evacuation time of 191 seconds.
49

Evacuation of bedridden building occupants 63
Appendix A – Partners

Evacuation of bedridden building occupants 64
Appendix B – Survey
!" #$%&'(&)*&+$$,- ..............
/" #$%&'(&)*&01(2$34%- 5$+&! / 678)* !9" #$%&'(&)*&211:%';<- .........&=$$7
>" ?812$+0&*17@%&)&A';&A1+$<17'+0&B887&)*&4)'<'01&'+(%122'+0CD'1@1+4)'(- .........&=$$7
E" #$%&'(&)*&:)+3%'1- ............
F" G1+%&)&8+%7)',17&8:&G?6H17&'+&01B$2&B$+&11+&3$2$,'%1'%- I+%7)',17&! / G?6H17&!.J+<17(K&+2"L&.......
M" ?11:%&)&117<17&<11201+8,1+&$$+&11+&1B$3)$%'1N81:1+'+0-&O8&;$P&481&B$$@- =$&! / Q11&!.........&R117
S" ?81&411:%&)&<1&81:1+'+0T1+U&<1(%';<(&17B$71+- V117D$$,&! C&Q1)%7$$2&!.I+D'++'0&!&C&J+<17(K&+2"L&
............
W" ?11:%&)&4'17A';&88@&,1%&11+&A1<01A8+<1+&X$%'Y+%&8:&A1*8+17&0181:1+<- =$&! / Q11&!O8&;$P&*$(&<'%&,1%&A1<&8:&,1%&(211X,$%7$(- G1<&! / 5$%7$(&!
!Z" G1+%&)&A1@1+<&,1%&<1&1B$3)$%'1NX7831<)71(- =$&! / Q11&!
!!" ?11:%&)&117<17&11+&A7$+<&,1101,$$@%-&O8&;$P&481&B$$@- =$&! / Q11&!.........&R117
!/" ?11:%&)&117<17&11+&134%1&1B$3)$%'1&)'%01B817<-&O8&;$P&481&B$$@- =$&! / Q11&!.........&R117
!9" ?81B112&@117&411:%&)&B$+<$$0&,1101<$$+&$$+&<1&1[X17',1+%121&81:1+'+01+- .........&R117
!>" ?81&411:%&)&<1D1&81:1+'+0T1+U&17B$71+- V117D$$,&! C&Q1)%7$$2&!.I+D'++'0&!&C&J+<17(K&+2"L&
............
!E" \+<'1+&17&11+&A7$+<$2$7,&$:0$$%K&A1011:%&)&D'34&<$+&<'713%&+$$7&<1&X2$$%(&B$+ ]'713%&! / G$2'1&!<1&,12<'+0&8:&117(%&+$$7&<1&A7$+<,12<31+%7$21CA$2'1- J+<17(K&+2"L&.......
!F" I+%7)',%&)&A';&11+&A7$+<&11+&A7$+<38,X$7%',1+%K&11+&$:<12'+0&8: J:<12'+0&! / ^1A8)*&!41%&014121&01A8)*- _8,X$7%',1+%&!
!M" 51%&481B112&X17(8+1+&A1011:%&)&D'34&8B17<$0&+$$7&11+&X2$$%(&B$+&,12<'+0- .........&`17("
!S" a+&481B112&'(&<'%&'+&11+&+$34%&('%)$%'1- .........&`17("
!W" ?81B112&X17("&D';+&17&A';&11+&+$34%<'1+(%&T)*&$:<12'+0U&01,'<<12<&$$+*1D'0- ............
/Z" \+<'1+&H(&+$34%(&41%&$2$7,&$:0$$%&'+&!&B$+&<1&@$,17(&*$$7&11+&A1*8+17 V83$%'1&! / G7$+<*117&!.$$+*1D'0&'(&1+&)&A1+%&<1&1+'01&X17(88+&<'1&11+&+$34%<'1+(%&<7$$'%K&0$$%&)
<$+&+$$7&<'1&283$%'1&8:&*$34%&)&%8%&<1&A7$+<*117&$77'B117%"
!"#$%&'"%()*+),%-./)-.+)$./.0*1%*1%+
!"#$%&'()*+&$,''-.",'-/.'0(123'
!"#$"%"&$'&(")&%*+,"&**'+-.$/"'&0*)&%*'&)1"2*//$'3&$/&45$"&11+&166"5$,7"89:")&$'%.##"'&%*'&7"5"&"';.<)"&5*#&51='&>&6$'.)"'&%*'&.0&)$,7&$'&?"/#*3&'"6"'9
2-.$'.1*%3#%4%+*+,%+

Evacuation of bedridden building occupants 65
Appendix C – FDS input data &HEAD CHID='Model 1', TITLE='Simulatie ziekenhuis #2' / Title and model reference &MESH IJK=68,63,24,, XB= 0.0,6.8, 0.0,6.3, 0.0,2.4 / The applied mesh &TIME T_END=600.0, DT=0.5 / Total simulation time and time-‐step &VENT MB='YMIN', SURF_ID='OPEN'/ Boundary conditions of the model &VENT MB='YMAX', SURF_ID='OPEN'/ &REAC ID='Cellulose', Reaction input of the C3H6O3 fire FYI='C4H6O3', SOOT_YIELD=0.02644, C=4.0, H=6.0, O=3.0, HEAT_OF_COMBUSTION=17500., VISIBILITY_FACTOR=3.0, IDEAL=.TRUE. / &VENT XB= 6.6, 4.4, 4, 5, 0.7, 0.7, XYZ=6.0,4.5,0.7, Position, spread-‐rate and initiation SURF_ID='FIRE1', SPREAD_RATE=0.00266029 / of the fire &SURF ID = 'FIRE1', HRRPUA=250, RAMP_Q='FIRE RAMP1'/ &RAMP ID = 'FIRE RAMP1', T= 0, F=1.0 / &RAMP ID = 'FIRE RAMP1', T=600.0, F=1.0 / &VENT XB= 6.3, 6.5, 4.4, 4.6, 0.7, 0.7, SURF_ID='FIRE2' / A second fire that covers the fire &SURF ID = 'FIRE2', HRRPUA=250, RAMP_Q='FIRE RAMP2'/ development in the first 29 seconds &RAMP ID = 'FIRE RAMP2', T= 0, F=1.0 / which is not simulated in Fire1 due &RAMP ID = 'FIRE RAMP2', T= 28.0, F=1.0 / to the mesh size. &RAMP ID = 'FIRE RAMP2', T= 29.0, F=0.0 / &MATL ID = 'BRICK' Material input and positioning of CONDUCTIVITY = 0.8 the brick walls SPECIFIC_HEAT = 0.8 DENSITY = 1700. / &SURF ID = 'WAND' RGB = 100,100,100 MATL_ID = 'BRICK' THICKNESS = 0.1 / &OBST XB= 4.4, 3.9, 0, 0.1, 0, 2.4, SURF_ID='WAND' / &OBST XB= 4.4, 6.6, 0.4, 0.5, 0, 2.4, SURF_ID='WAND' / &OBST XB= 4.4, 4.5, 0, 0.4, 0, 2.4, SURF_ID='WAND' / &OBST XB= 2.4, 0.2, 0.4, 0.5, 0, 2.4, SURF_ID='WAND' / &OBST XB= 2.4, 2.3, 0, 0.4, 0, 2.4, SURF_ID='WAND' / &MATL ID = 'LIMESTONE' Material input and positioning of CONDUCTIVITY = 0.48 the limestone walls SPECIFIC_HEAT = 0.84 DENSITY = 1440. / &SURF ID = 'WAND1' RGB = 100,100,100 MATL_ID = 'LIMESTONE' THICKNESS = 0.2 /
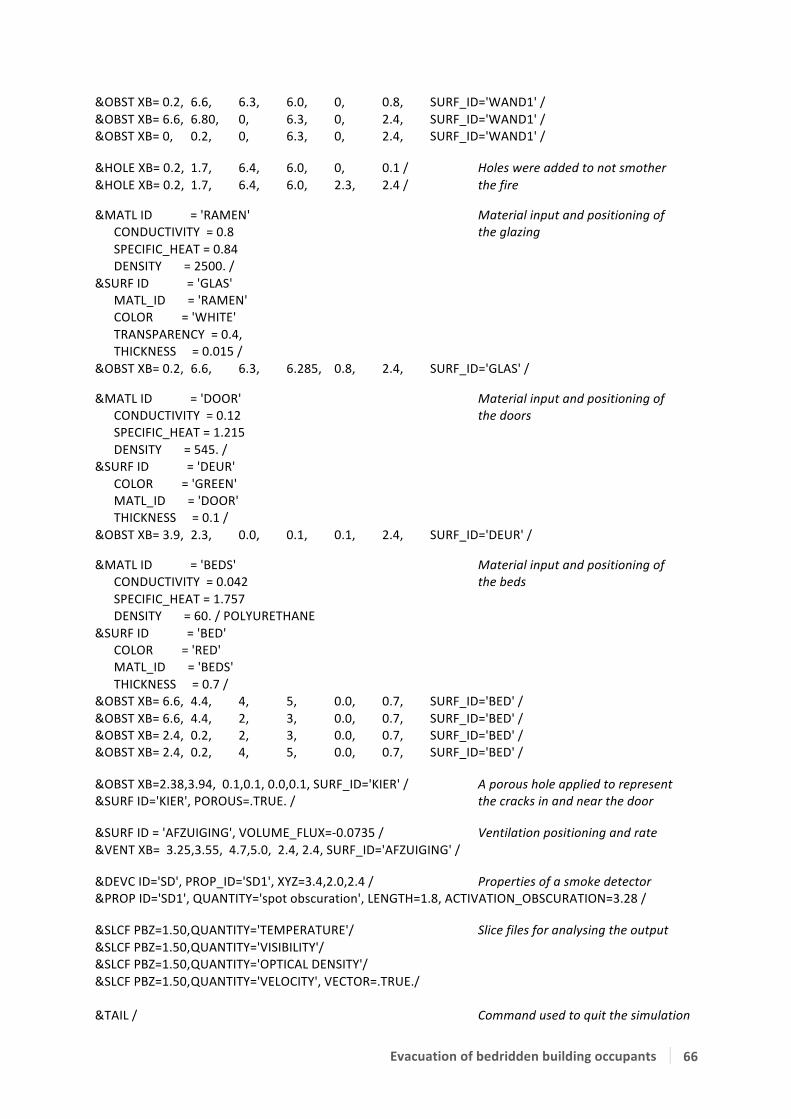
Evacuation of bedridden building occupants 66
&OBST XB= 0.2, 6.6, 6.3, 6.0, 0, 0.8, SURF_ID='WAND1' / &OBST XB= 6.6, 6.80, 0, 6.3, 0, 2.4, SURF_ID='WAND1' / &OBST XB= 0, 0.2, 0, 6.3, 0, 2.4, SURF_ID='WAND1' / &HOLE XB= 0.2, 1.7, 6.4, 6.0, 0, 0.1 / Holes were added to not smother &HOLE XB= 0.2, 1.7, 6.4, 6.0, 2.3, 2.4 / the fire &MATL ID = 'RAMEN' Material input and positioning of CONDUCTIVITY = 0.8 the glazing SPECIFIC_HEAT = 0.84 DENSITY = 2500. / &SURF ID = 'GLAS' MATL_ID = 'RAMEN' COLOR = 'WHITE' TRANSPARENCY = 0.4, THICKNESS = 0.015 / &OBST XB= 0.2, 6.6, 6.3, 6.285, 0.8, 2.4, SURF_ID='GLAS' / &MATL ID = 'DOOR' Material input and positioning of CONDUCTIVITY = 0.12 the doors SPECIFIC_HEAT = 1.215 DENSITY = 545. / &SURF ID = 'DEUR' COLOR = 'GREEN' MATL_ID = 'DOOR' THICKNESS = 0.1 / &OBST XB= 3.9, 2.3, 0.0, 0.1, 0.1, 2.4, SURF_ID='DEUR' / &MATL ID = 'BEDS' Material input and positioning of CONDUCTIVITY = 0.042 the beds SPECIFIC_HEAT = 1.757 DENSITY = 60. / POLYURETHANE &SURF ID = 'BED' COLOR = 'RED' MATL_ID = 'BEDS' THICKNESS = 0.7 / &OBST XB= 6.6, 4.4, 4, 5, 0.0, 0.7, SURF_ID='BED' / &OBST XB= 6.6, 4.4, 2, 3, 0.0, 0.7, SURF_ID='BED' / &OBST XB= 2.4, 0.2, 2, 3, 0.0, 0.7, SURF_ID='BED' / &OBST XB= 2.4, 0.2, 4, 5, 0.0, 0.7, SURF_ID='BED' / &OBST XB=2.38,3.94, 0.1,0.1, 0.0,0.1, SURF_ID='KIER' / A porous hole applied to represent &SURF ID='KIER', POROUS=.TRUE. / the cracks in and near the door &SURF ID = 'AFZUIGING', VOLUME_FLUX=-‐0.0735 / Ventilation positioning and rate &VENT XB= 3.25,3.55, 4.7,5.0, 2.4, 2.4, SURF_ID='AFZUIGING' / &DEVC ID='SD', PROP_ID='SD1', XYZ=3.4,2.0,2.4 / Properties of a smoke detector &PROP ID='SD1', QUANTITY='spot obscuration', LENGTH=1.8, ACTIVATION_OBSCURATION=3.28 / &SLCF PBZ=1.50, QUANTITY='TEMPERATURE'/ Slice files for analysing the output &SLCF PBZ=1.50, QUANTITY='VISIBILITY'/ &SLCF PBZ=1.50, QUANTITY='OPTICAL DENSITY'/ &SLCF PBZ=1.50, QUANTITY='VELOCITY', VECTOR=.TRUE./ &TAIL / Command used to quit the simulation
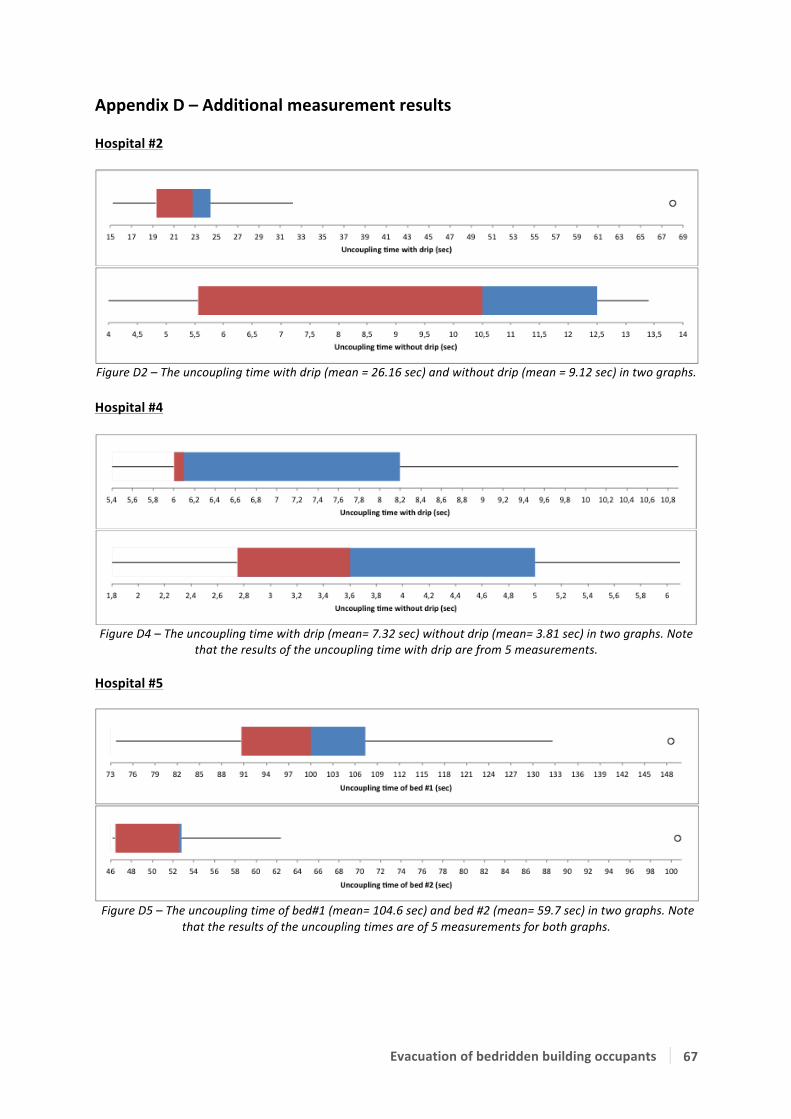
Evacuation of bedridden building occupants 67
Appendix D – Additional measurement results Hospital #2
Figure D2 – The uncoupling time with drip (mean = 26.16 sec) and without drip (mean = 9.12 sec) in two graphs.
Hospital #4
Figure D4 – The uncoupling time with drip (mean= 7.32 sec) without drip (mean= 3.81 sec) in two graphs. Note
that the results of the uncoupling time with drip are from 5 measurements. Hospital #5
Figure D5 – The uncoupling time of bed#1 (mean= 104.6 sec) and bed #2 (mean= 59.7 sec) in two graphs. Note that the results of the uncoupling times are of 5 measurements for both graphs.


