

Financial Literacy, Social Networks, andIndex-Based Weather Insurance
Xavier Giné, Dean Karlan and Muthoni Ngatia
Building Financial CapabilityJanuary 2013
Giné, Karlan & Ngatia Financial Literacy, Social Networks, & Index Insurance
Introduction
Introduction
I Agriculture in developing countries is characterised by high risk:• high dependence on weather• limited irrigation.
I Weather shocks are a major source of income fluctuation for ruralhouseholds involved in agricultural activities.
Giné, Karlan & Ngatia Financial Literacy, Social Networks, & Index Insurance

Introduction
Do Households Need Insurance?
I There is evidence that risk-sharing mechanisms are inadequateparticularly against covariate weather risk:
• Local rainfall variation around the time of birth significantly affectsschooling, health and socio-economic status measured inadulthood (Maccini and Yang, 2009).
• Duflo and Udry (2004) reject the null of perfect risk-sharing evenwith respect to rainfall shocks within households.
• Evidence that rainfall shocks generate plausibly exogenousvariation in income that can lead to poverty traps (Dercon andOates, 2009).
I Households engage in costly income smoothing in response torainfall risk.
Giné, Karlan & Ngatia Financial Literacy, Social Networks, & Index Insurance

Introduction
Insurance
I Traditional crop insurance has had limited success.
I Index-based weather insurance• Farmer insures crop, based on a proxy (rainfall) that causes yield
loss.• Insurance pays the farmer if expected rainfall does not occur,
irrespective of yield loss, as long as the the index is triggered.• Benefits:
F Eliminates Moral HazardF Low transaction CostsF Fast settlement of claims, payments are not subjective.
I However, voluntary uptake of Index Insurance has been limited(Giné et al. 2007, 2008, Cole et al. 2009).
Giné, Karlan & Ngatia Financial Literacy, Social Networks, & Index Insurance
Introduction
Insurance
I Role of financial literacy in influencing attitudes and understandingof insurance.
I Role of social networks.
Giné, Karlan & Ngatia Financial Literacy, Social Networks, & Index Insurance

Introduction
Results
I Social networks reinforce messages from financial literacymaterials.
• Receiving financial literacy materials when 60% or more of afarmers’ neighbours also receive financial literacy materialsincreases the likelihood that a farmer will purchase insurance by4.3% (s.e. 2.5%)
• Receiving a financial literacy materials when 40% or fewer of afarmers’ neighbours also receive financial literacy materialsdecreases the likelihood that a farmer will purchase insurance by2.6% (s.e. 2.5%).
I Strong individual effects for discount vouchers on farmers’decision to purchase insurance but no social network effects.
Giné, Karlan & Ngatia Financial Literacy, Social Networks, & Index Insurance

Introduction
Outline
I Study Design
I Results
I Conclusion
Giné, Karlan & Ngatia Financial Literacy, Social Networks, & Index Insurance

Experiment
Study Design I
I Study was carried out with coffee farmers in Eastern Kenya.
I At the baseline we first enumerated all the coffee growinghouseholds within the study area.
I Following the census, households were grouped together intoclusters based on geographic proximity.
I Clusters were randomized to either high or low intensity of comicand voucher provision.
Giné, Karlan & Ngatia Financial Literacy, Social Networks, & Index Insurance

Experiment
Study Design II
904 Households189 Clusters
No Comic276 Households
61 Clusters
High VoucherIntensity
138 Households31 Clusters
Low VoucherIntensity
138 Households30 Clusters
Low Comic307 Households
65 Clusters
High VoucherIntensity
163 Households33 Clusters
Low VoucherIntensity
144 Households32 Clusters
High Comic321 Households
63 Clusters
High VoucherIntensity
164 Households31 Clusters
Low VoucherIntensity
157 Households32 Clusters
Figure : Study Design
Giné, Karlan & Ngatia Financial Literacy, Social Networks, & Index Insurance

Experiment
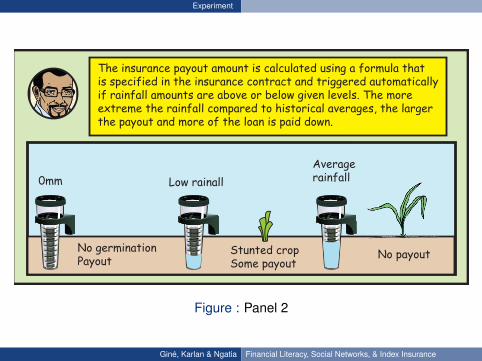
This is how it will work in the field:Rainfall will be measured throughout the season. Each of the growing phases of the crop has its specific water requirement.
10
Planting and Germination Flowering Harvest
If the rainfall is too low at any part of the crop season, the farmerwill receive an insurance payout that will be offset against the outstanding loan amount. For instance, if rainfall is too low at germination, the maize won’t grow at all. Farmers will receive a payout.
The insurance payout amount is calculated using a formula that is specified in the insurance contract and triggered automatically if rainfall amounts are above or below given levels. The more extreme the rainfall compared to historical averages, the larger the payout and more of the loan is paid down.
Less rainfall
Stunted crop
Average rainfall
Average crop
0mm
No germinationPayout
Low rainall
Stunted cropSome payout
Averagerainfall
No payout
Figure : Panel 1
Giné, Karlan & Ngatia Financial Literacy, Social Networks, & Index Insurance
Experiment
This is how it will work in the field:Rainfall will be measured throughout the season. Each of the growing phases of the crop has its specific water requirement.
10
Planting and Germination Flowering Harvest
If the rainfall is too low at any part of the crop season, the farmerwill receive an insurance payout that will be offset against the outstanding loan amount. For instance, if rainfall is too low at germination, the maize won’t grow at all. Farmers will receive a payout.
The insurance payout amount is calculated using a formula that is specified in the insurance contract and triggered automatically if rainfall amounts are above or below given levels. The more extreme the rainfall compared to historical averages, the larger the payout and more of the loan is paid down.
Less rainfall
Stunted crop
Average rainfall
Average crop
0mm
No germinationPayout
Low rainall
Stunted cropSome payout
Averagerainfall
No payout
Figure : Panel 2
Giné, Karlan & Ngatia Financial Literacy, Social Networks, & Index Insurance

Experiment
But how can we trust what the weather station says? They have given us inaccurate information in
the past. Sometimes when they say it won’t rain we get a bumper
harvest and when they say that it will rain, the rains fail.
It’s true that sometimes and especially nowadays, it’s very difficult to predict the weather with
certainty. However the insurance payouts won’t be based on the predicted rainfall but the actual rainfall that is recorded. The KMD
has also installed new state of the art weather stations to better record the
weather in this area.
But what will happen if the rains are normal and we receive a good harvest? Will we get our premium back?
No, premiums are non refundable. Once the premium is paid,
it cannot be returned.
13Figure : Panel 3
Giné, Karlan & Ngatia Financial Literacy, Social Networks, & Index Insurance

Experiment
50%50% This voucher entitles
to get a 50% discount on the purchase of
Weather Index Insurance offered by
APA Insurance Company.
Authorized by:
INSURANCE DISCOUNT COUPON
Please present this voucher with
your ID card to receive the discount
amount mentioned above.
Expires: 5th March, 2011
Name:
ID Number:
Figure : 50% Voucher
Giné, Karlan & Ngatia Financial Literacy, Social Networks, & Index Insurance

Experiment
Summary
Table : Summary Statistics by Intervention
Mean
Comicin HighIntensityComicCluster
Comicin LowIntensityComicCluster
NoComicin HighIntensityComicCluster
NoComicin LowIntensityComicCluster
Voucherin HighIntensityVoucherCluster
Voucherin LowIntensityVoucherCluster
p −value
Male 0.701 0.027 −0.070 −0.036 0.062 0.104 0.087 0.169(0.039) (0.057) (0.059) (0.039) (0.075) (0.086)Age 48.679 1.886 −2.892 −3.459 0.41 4.47 6.585∗ 0.174(1.714) (2.647) (3.035) (1.792) (3.530) (3.953)Household size 5.346 0.072 −0.531∗ −0.332 −0.032 −0.820∗∗ 0.17 0.033(0.213) (0.292) (0.303) (0.214) (0.405) (0.493)Years of education 6.682 -0.499 −1.310∗∗ −0.751 −0.698∗ 0.516 1.486 0.156(0.396) (0.574) (0.620) (0.394) (0.748) (0.951)Able to read a newspaper 0.689 −0.043 −0.097∗ −0.095 −0.019 0.048 0.143 0.296(0.041) (0.059) (0.062) (0.041) (0.080) (0.092)Asked for credit year before 0.233 −0.050 −0.082 −0.039 −0.056 0.084 0.106 0.484(0.039) (0.051) (0.056) (0.039) (0.071) (0.087)Agrees Drought is the most 0.678 −0.089∗∗ −0.041 −0.106∗ −0.053 0.133∗ 0.209∗∗ 0.062impt risk my household faces. (0.041) (0.057) (0.062) (0.042) (0.080) (0.093)Patient 0.380 0.004 0.07 0.103 0.024 -0.018 0.089 0.574(0.043) (0.061) (0.064) (0.044) (0.083) (0.100)Understand insurance 0.470 0.006 −0.033 0.142∗∗ −0.054 0.035 0.132 0.104(0.045) (0.065) (0.065) (0.047) (0.087) (0.103)
Notes: * significant with 90% confidence, ** 95%, *** 99%.† “Patient” is a dummy equal to 1 if the respondent prefers to receive KSh 1250 in a month to KSh 1000 today.Exchange rate was about 80 KSh to 1 USD during the study period.Giné, Karlan & Ngatia Financial Literacy, Social Networks, & Index Insurance

Experiment
Results IDependent Variable: Bought Index Insurance(1) (2) (3) (4)
Comic 0.022(0.019)
Voucher 0.131∗∗∗
(0.039)Low Comic Intensity −0.014
(0.020)High Comic Intensity 0.037∗
(0.023)High Voucher Intensity 0.029∗
(0.017)Comic in High Comic Intensity 0.043∗ 0.047∗
(0.025) (0.025)Comic in Low Comic Intensity −0.026 −0.022
(0.025) (0.026)No Comic in High Comic Intensity 0.026 0.032
(0.037) (0.037)No Comic in Low Comic Intensity −0.002 −0.002
(0.023) (0.023)Voucher in High Voucher Intensity 0.149∗∗∗ 0.148∗∗∗
(0.046) (0.047)Voucher in Low Voucher Intensity 0.093∗ 0.092∗
(0.049) (0.050)
Observations 904 904 904 904Mean among Controls 0.020 0.036 0 0Controls NO NO NO YES
Notes: Robust standard errors, in parentheses.* significant with 90% confidence, ** 95%, *** 99%.Regression (4) includes controls for farmer’s raven score, years of education, gender, ability to read anewspaper, ability to write a letter, score for coffee best practices followed, whether or not the farmeragrees that drought is the most important risk that he/she faces, a score for whether the farmer ispatient, number of coffee trees, whether the farmer understands index insurance, whether the farmercan identify 60mm in a drawing.
Giné, Karlan & Ngatia Financial Literacy, Social Networks, & Index Insurance

Experiment
Results IIDependent Variable: Bought Index Insurance
(1) (2) (3) (4) (5) (6)0-150m away 0-200m away 0-300m away
Comic −0.036 −0.031 −0.027 −0.020 −0.032 −0.029(0.025) (0.025) (0.028) (0.028) (0.032) (0.032)
# Comics 0-Xm away −0.020∗ −0.022∗∗ −0.010 −0.010 −0.008 −0.009(0.010) (0.011) (0.009) (0.009) (0.006) (0.006)
Comic * # Comics Xm away 0.047∗∗∗ 0.045∗∗∗ 0.025∗∗ 0.023∗ 0.014∗ 0.013∗
(0.017) (0.017) (0.012) (0.012) (0.007) (0.007)Voucher 0.178∗∗∗ 0.169∗∗∗ 0.120∗∗ 0.110∗ 0.103 0.096
(0.052) (0.054) (0.058) (0.059) (0.071) (0.072)# 50% vouchers 0-Xm away 0.007 0.007 0.000 0.000 −0.004 −0.005
(0.012) (0.012) (0.009) (0.009) (0.007) (0.007)Voucher * # 50% vouchers Xm away −0.028 −0.025 0.003 0.006 0.005 0.006
(0.020) (0.021) (0.016) (0.017) (0.010) (0.011)# Contacts Xm away 0.008 0.008 0.004 0.005 0.005 0.005
(0.008) (0.008) (0.006) (0.006) (0.004) (0.004)
Observations 904 904 904 904 904 904Mean among Controls 0.02
Village Fixed Effects YES YES YES YES YES YESControls NO YES NO YES NO YES
Notes: * significant with 90% confidence, ** 95%, *** 99%.Robust standard errors clustered at the village level, in parentheses.Regressions (2), (4) and (6) includes controls for farmer’s raven score, years of education, gender, ability to read a newspaper,ability to write a letter, score for coffee best practices followed, whether or not the farmer agrees that drought is the most importantrisk that he/she faces, a score for whether the farmer is patient, number of coffee trees, whether the farmer understands indexinsurance, whether the farmer can identify 60mm in a drawing.Giné, Karlan & Ngatia Financial Literacy, Social Networks, & Index Insurance

Experiment
Follow up
I A phone follow-up survey was carried about 7 months after thestart of the contract.
I There had been a drought, and insurance paid out.
Giné, Karlan & Ngatia Financial Literacy, Social Networks, & Index Insurance

Experiment
Follow-upDependent Variable: Interviewed in Follow-up Survey
(1) (2) (3)
Comic 0.031(0.035)
Voucher 0.168∗∗
(0.078)High Comic Cluster −0.020
(0.042)Low Comic Cluster 0.054
(0.042)High Voucher Cluster 0.008
(0.034)Comic in High Comic Intensity 0.050
(0.045)Comic in Low Comic Intensity −0.018
(0.062)No Comic in High Comic Intensity 0.059
(0.066)No Comic in Low Comic Intensity −0.019
(0.046)Voucher in High Voucher Intensity 0.160∗
(0.085)Voucher in Low Voucher Intensity 0.181∗
(0.102)
Observations 904 904 904Mean among Controls 0.506 0.493 0.417F test 1.314 1.088 1.18P-value of F model 0.186 0.361 0.267
Village Fixed Effects YES YES YES
* significant with 90% confidence, ** 95%, ***99%.
Giné, Karlan & Ngatia Financial Literacy, Social Networks, & Index Insurance

Experiment
KnowledgeKnowledge Score on Index Insurance at Follow-up
(1) (2)
Comic in High Comic Intensity −0.021 −0.009(0.044) (0.045)
Comic in Low Comic Intensity −0.137∗∗ −0.127∗
(0.068) (0.069)No Comic in High Comic Intensity 0.041 0.067
(0.063) (0.063)No Comic in Low Comic Intensity −0.010 0.002
(0.046) (0.046)Voucher in High Voucher Intensity 0.041 0.038
(0.086) (0.086)Voucher in Low Voucher Intensity 0.099 0.113
(0.101) (0.100)Baseline knowledge score of index insurance 0.002 (0.032)
(0.051) (0.058)
Observations 479 479R-squared 0.078 0.124
Mean of Dependent Variable Among Controls 0.686
Village Fixed Effects YES YESControls NO YES
* significant with 90% confidence, ** 95%, *** 99%. Robust standard errors in parentheses.All regressions include Village Fixed Effects. Regressions (2) includes controls for farmer’s raven score, years ofeducation, gender, ability to read a newspaper, ability to write a letter, score for coffee best practices followed, whetheror not the farmer agrees that drought is the most important risk that he/she faces, a score for whether the farmer ispatient, number of coffee trees, whether the farmer can identify 60mm in a drawing.The knowledge score is the sum of the number of correct answers to the following three questions: Imagine you havebought insurance against drought. If it rains less than 70mm by the end of November, you will receive a payout of 20KShfor every mm of deficient rainfall (that is, each mm of rainfall below 70mm). Will you paid out if (a) it rains 100mm? (b)It rains 60mm (If b = Yes) How much would you receive as a payout?
Giné, Karlan & Ngatia Financial Literacy, Social Networks, & Index Insurance

Experiment
Insurance Attitudes(1) (2) (3)
Dependent variables
“Insuranceprotects you intimes ofemergency”
“Insurancecompanies try tocheat people evenwhen they have agood claim”
“I don’t need insurancebecause my family,friends or relativesprovide cover whennecessary”
Comic in High Comic Intensity 0.057∗ −0.223∗∗∗ −0.092(0.029) (0.063) (0.061)
Comic in Low Comic Intensity −0.009 −0.135 0.012(0.052) (0.088) (0.088)
No Comic in High Comic Intensity 0.075∗∗ −0.319∗∗∗ 0.008(0.034) (0.086) (0.089)
No Comic in Low Comic Intensity 0.029 −0.216∗∗∗ −0.098(0.033) (0.063) (0.062)
Voucher in High Voucher Intensity −0.022 0.076 −0.309∗∗∗
(0.059) (0.113) (0.115)Voucher in Low Voucher Intensity 0.038 0.028 −0.126
(0.055) (0.142) (0.140)Baseline Attitude −0.023 0.014 0.026
(0.023) (0.056) (0.080)
Observations 456 453 458R-squared 0.06 0.072 0.06Mean Among Controls 0.939 0.441 0.471 Village Fixed EffectsYES YES YES
Notes: Robust standard errors, in parentheses.∗ significant with 90% confidence, ∗∗ 95%, ∗∗∗ 99%.
Giné, Karlan & Ngatia Financial Literacy, Social Networks, & Index Insurance

Experiment
Conclusion I
I Using a randomized experiment we compare the effect of financialliteracy materials and discount vouchers in influencing farmers’decision to purchase index insurance.
I Our results provide suggestive evidence that financial literacymaterials are efficacious in encouraging take-up when farmers’social contacts are similarly receive access to financial literacymaterials.
Giné, Karlan & Ngatia Financial Literacy, Social Networks, & Index Insurance

Experiment
Conclusion II
Thank you!
Giné, Karlan & Ngatia Financial Literacy, Social Networks, & Index Insurance


