

Seven & i Holdings Co., Ltd.Financial Results Presentationfor the Third Quarter of FY2015
January 9, 2015
Seven & i Holdings Co., Ltd.

Consolidated Financial Results for the Third Quarter of FY2015

Copyright (C) Seven & i Holdings Co., Ltd. All Rights Reserved.
Overview of Consolidated Financial Results
(Billions of yen)
Exchange rate (income statements): U.S.$1=102.93 yen, down 6.10 yen YOY
Nine Months Ended November 30, 2014
Amount YOY Change from previous year
Group’s total sales* 7,648.7 106.5% +467.0
Revenues from operations 4,501.7 107.5% +315.1
Operating income[before amortization of goodwill]
249.4[263.5]
100.1%[100.2%]
+0.3[+0.5]
Net income 127.3 99.4% (0.7)
* Group’s total sales include the sales of Seven-Eleven Japan and 7-Eleven, Inc. franchisees.
●Achieved record-high revenues from operations and operating income
1

Copyright (C) Seven & i Holdings Co., Ltd. All Rights Reserved.
(Billions of yen)
Operating Income by Business Segment
Nine Months Ended November 30, 2014Amount YOY Change from previous year
Consolidated operating income[before amortization of goodwill]
249.4[263.5]
100.1%[100.2%]
+0.3[+0.5]
Convenience store operations 209.6 106.1% +12.0Superstore operations 9.4 55.4% (7.6)Department store operations[before amortization of goodwill]
(1.7)[2.2]
-[97.9%]
(0.04)[(0.04)]
Food services (0.3) - (0.6)Financial services 36.9 107.3% +2.5Mail order services (5.2) - (5.2)Others 2.8 138.3% +0.7
● Operating income increased mainly due to increased income in convenience storeoperations and financial services
2

Copyright (C) Seven & i Holdings Co., Ltd. All Rights Reserved.
Operating Income for Major Operating Companies
(Billions of yen)
Nine Months Ended November 30, 2014Major factors on YOY changes
Amount YOY Change from previous year
Existing store sales increase
Seven-ElevenJapan 170.0 103.8% +6.2 +2.4%
Growth in existing store sales and improvements in merchandise gross profit margin
7-Eleven, Inc. 43.9 114.0% +5.4 +2.3% Growth in existing store sales
Ito-Yokado (2.5) - (6.2) (4.4)%Decrease in existing store sales and deterioration of the gross profit margin in apparel
York-Benimaru(including Life Foods*1) 11.9 101.3% +0.1 +0.4%*2 Growth in existing store sales and
strong performance of Life Foods
Sogo & Seibu 1.1 86.9% (0.1) +0.2% Decrease in high margin apparel sales
●Seven-Eleven Japan and 7-Eleven, Inc. achieved record-high operating income
*1Life Foods is a wholly owned subsidiary which produces and sells delicatessen in York-Benimaru stores.*2Existing store sales increase figures for York-Benimaru non-consolidated base.
3
Copyright (C) Seven & i Holdings Co., Ltd. All Rights Reserved.
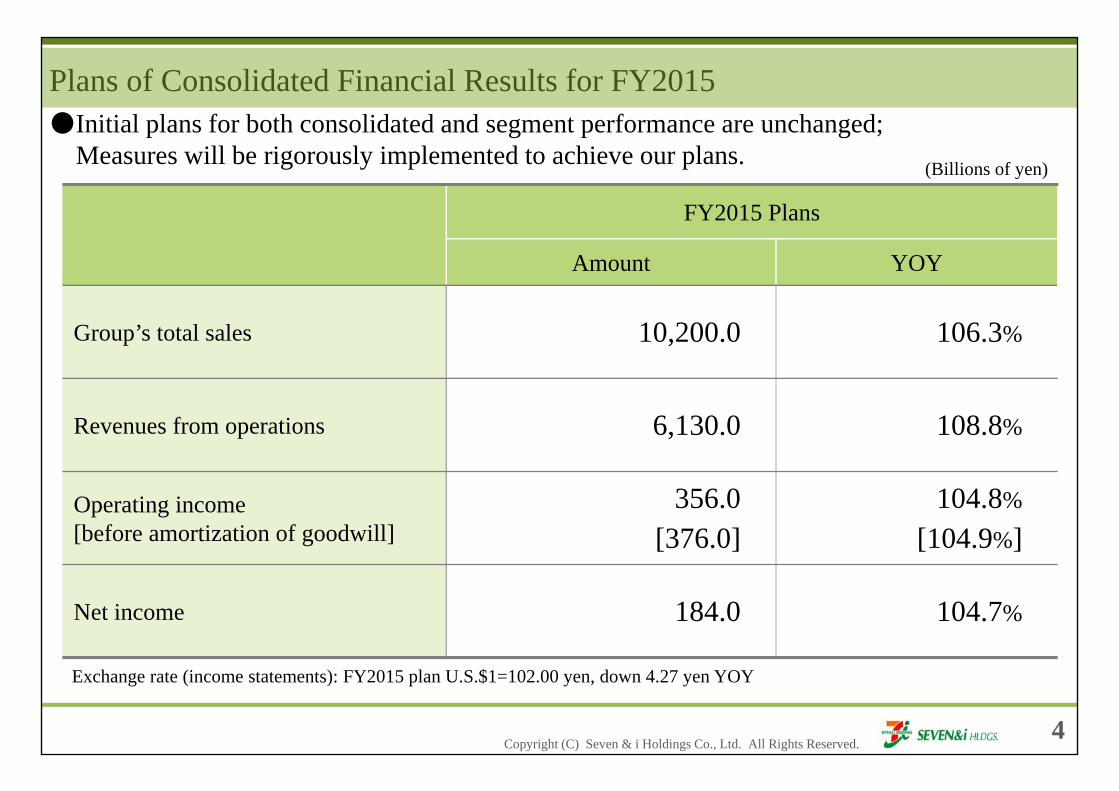
Plans of Consolidated Financial Results for FY2015
(Billions of yen)
FY2015 Plans
Amount YOY
Group’s total sales 10,200.0 106.3%
Revenues from operations 6,130.0 108.8%
Operating income[before amortization of goodwill]
356.0[376.0]
104.8%
[104.9%]
Net income 184.0 104.7%
Exchange rate (income statements): FY2015 plan U.S.$1=102.00 yen, down 4.27 yen YOY
●Initial plans for both consolidated and segment performance are unchanged; Measures will be rigorously implemented to achieve our plans.
4

1) Group Management Challenges and Major Group Companies’ Strategies
2) Group Strategies
Details of Today’s Presentation

Copyright (C) Seven & i Holdings Co., Ltd. All Rights Reserved.
Management Challenges and Response Measures Responses for Consumer Saturation = Mature Consumer Society
5
Harsh management environment to continue with rising prices and stagnant realincome
Response for consumer behavior due to “changing consumer mindsets”
Response for the “age of competition between companies” across business formats
Rely on personal stockpile
Bolster own merchandising and regional merchandising based on “Item by ItemManagement”
Strengthening value communication through customer service
Drive the Omni-Channel Strategy forward to reach our “Second Phase of Creation”

Copyright (C) Seven & i Holdings Co., Ltd. All Rights Reserved.
94
96
98
100
102
104
106
108
Mar. Apr. May Jun. Jul. Aug. Sep. Oct. Nov. Dec. Jan. Feb. Mar. Apr. May Jun. Jul. Aug. Sep. Oct. Nov. Dec. Jan. Feb. Mar. Apr. May Jun. Jul. Aug. Sep. Oct. Nov. Dec.
Year-on-year changes in existing store sales at SEJ
Year-on-year changes in existing store sales for overall conveniencestore industry
Trend in Year-on-Year Changes in Existing Store Sales at Seven-Eleven Japan (SEJ) Versus Overall Convenience Store Industry
Source: Japan Franchise Association monthly convenience store surveyNote: Year-on-year change in existing store sales at SEJ is presented based on new standards since the fiscal year ended February 28, 2014.
FY2013
(%)
FY2014 FY2015
●SEJ: 29 consecutive months of positive growth as of December 2014
Summer 2012: Year-on-year decrease:Pull back from the impact of severe heat in 2011 and an extended rainy season
Summer 2014: Year-on-year increase:Despite pull back from the impact of severe heat in 2013 and an extended rainy season=Product development and enhanced product lineup=
6

Copyright (C) Seven & i Holdings Co., Ltd. All Rights Reserved.
●Trend in SEJ’s share of sales and changes in convenience store sales by quarter (Japan Franchise Association)
37.2
41.3
37.0
38.0
39.0
40.0
41.0
42.0
0
50
100
150
200
250
1Q 2Q 3Q 4Q 1Q 2Q 3Q 4Q 1Q 2Q 3Q 4Q 1Q 2Q 3Q
Changes in SEJ sales (left scale)Changes in other convenience store sales (left scale)SEJ’s share (right scale)
(Billions of yen)
FY2012
(%)
FY2013
Source: Japan Franchise Association monthly convenience store survey
FY2014
Sales increase at other convenience stores
SEJ: Trend in SEJ’s Share of Sales and Changes in Sales by Quarter
FY2015
⇒The difference grows larger when there are major changes.
Great East Japan Earthquake
Consumption tax hike
Sales increase at SEJ
7
Copyright (C) Seven & i Holdings Co., Ltd. All Rights Reserved.
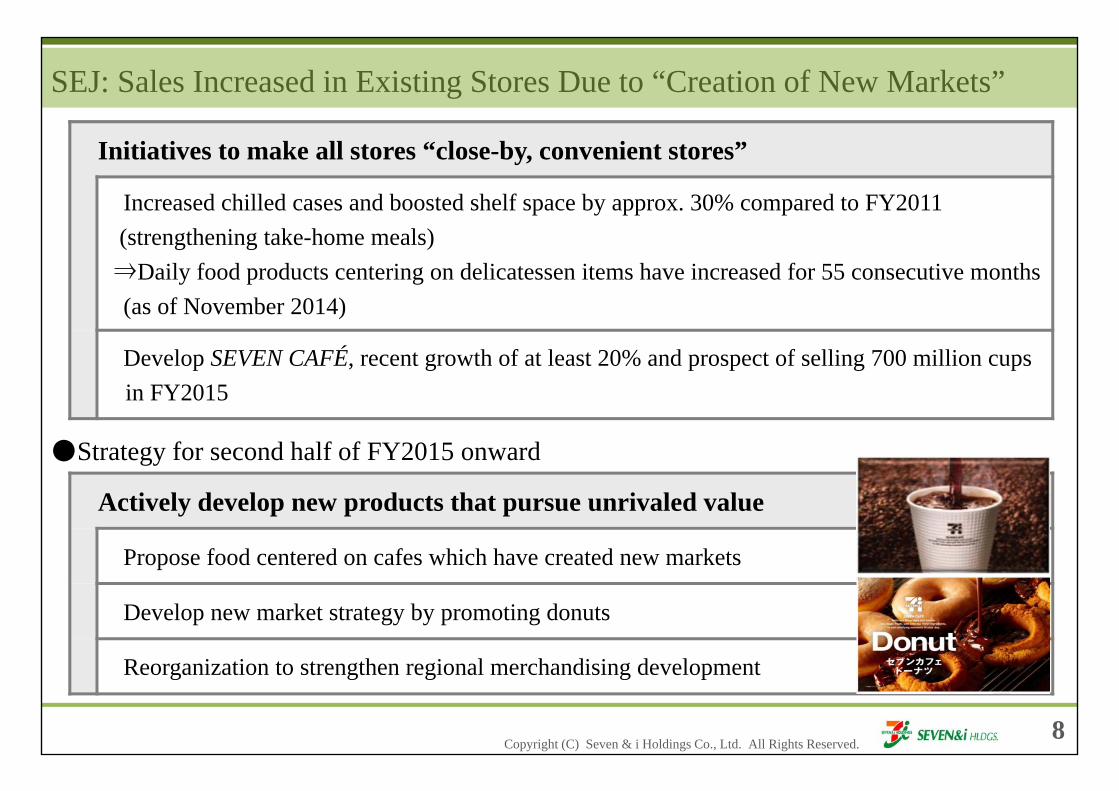
Initiatives to make all stores “close-by, convenient stores”
Increased chilled cases and boosted shelf space by approx. 30% compared to FY2011 (strengthening take-home meals)⇒Daily food products centering on delicatessen items have increased for 55 consecutive months(as of November 2014)
Develop SEVEN CAFÉ, recent growth of at least 20% and prospect of selling 700 million cups in FY2015
Actively develop new products that pursue unrivaled value
Propose food centered on cafes which have created new markets
Develop new market strategy by promoting donuts
Reorganization to strengthen regional merchandising development
SEJ: Sales Increased in Existing Stores Due to “Creation of New Markets”
●Strategy for second half of FY2015 onward
8

Copyright (C) Seven & i Holdings Co., Ltd. All Rights Reserved.
SEJ: The Donut Market is the Next Challenge (Developing SEVEN CAFÉ Donuts)
●Commercialized by powerful team merchandising across 10 fields and 24 companies
Delivered at stable temperature from 24 dedicated plants located across Japanand sold from dedicated fixtures
Seven-Eleven
Donut dough
Fixtures
Oils and fats
Enzyme technology
Logo design (Mr. Kashiwa Sato)
Flour milling
Daily manufacturer
Fryer
Oil
9
Scheduled to apply nationwide in first
half of FY2016

Copyright (C) Seven & i Holdings Co., Ltd. All Rights Reserved.
SEJ: Up-Front Donut Sales (Sales started on a week from Oct. 27 at 23 stores in the Kansai area)
●Donut sales added to sales of existing pastry
Effect of introducing donuts
High ratio of women, afternoon shoppers, bulk buyersSEVEN CAFÉ sales also increased
49.3 25.9 19.9 18.5 21.2 20.8 19.8 17.0 15.1
93.6 98.5
251.0
179.8159.7 148.4 143.0 145.0 144.3 137.4 140.7
0
100
200
300
0
50
100
150
Week fromOct. 13
Week fromOct. 20
Week fromOct. 27
Week fromNov. 3
Week fromNov. 10
Week fromNov. 17
Week fromNov. 24
Week fromDec. 1
Week fromDec. 8
Week fromDec. 15
Week fromDec. 22
Donut sales per store per dayPastry sales per store per dayPastry and Donuts YOY
(Thousand of yen)
(%)
Sales targetsFY2016 FY2017
400 mn donuts 40 bn yen 600 mn donuts 60 bn yen
10

Copyright (C) Seven & i Holdings Co., Ltd. All Rights Reserved.
7-Eleven, Inc. (SEI): Promotion of “Merchandising Innovation”
FY2014 1Q 2Q 3Q 4Q US existing stores sales increase (%) +1.0 +2.1 +3.5 +5.6(until Nov.)
Hot foodgrowth rate (%) +23.3 +49.5 +36.9 -
Stores with hot foods Approx. 5,500 Approx. 5,800 Approx. 5,900 Approx. 6,000
(Plan)
●SEI priority action: Install hot food equipment* to strengthen fast food sales
Hot food development
Doritos LOADEDPizza
11* Started installing from FY2010
Copyright (C) Seven & i Holdings Co., Ltd. All Rights Reserved.
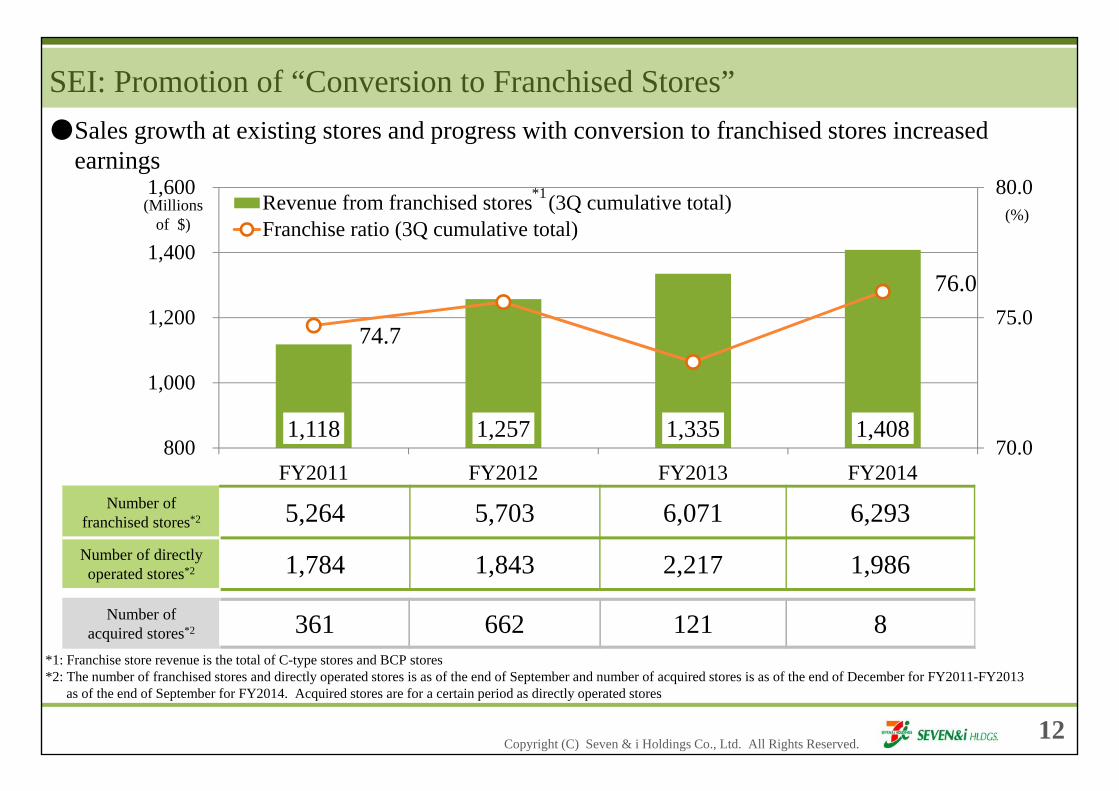
1,118 1,257 1,335 1,408
74.7
76.0
70.0
75.0
80.0
800
1,000
1,200
1,400
1,600
FY2011 FY2012 FY2013 FY2014
Revenue from franchised stores (3Q cumulative total)Franchise ratio (3Q cumulative total)
*1(Millions
of $)
Number of franchised stores*2 5,264 5,703 6,071 6,293Number of directly operated stores*2 1,784 1,843 2,217 1,986
(%)
SEI: Promotion of “Conversion to Franchised Stores”
*1: Franchise store revenue is the total of C-type stores and BCP stores*2: The number of franchised stores and directly operated stores is as of the end of September and number of acquired stores is as of the end of December for FY2011-FY2013
as of the end of September for FY2014. Acquired stores are for a certain period as directly operated stores
●Sales growth at existing stores and progress with conversion to franchised stores increasedearnings
12
Number of acquired stores*2 361 662 121 8

Copyright (C) Seven & i Holdings Co., Ltd. All Rights Reserved.13
Ito-Yokado (IY): Greatest Reform since the Establishment of HD and Current Challenge
Summary of challenges and response measures
New stores: Focus on mall-type shopping centers (Ario) and Shokuhinkan food specialty stores
GMS: Rightsize directly-managed sales areas and expand tenants with a main focus on apparel
Merchandising: Strengthen private brands Sales: Strengthen customer service
Cost reduction: Close unprofitable stores, review sales promotion costs, etc.
680.5 663.7 656.4 648.5 623.5 608.3
231.9 222.4 233.0 252.7 271.2 287.8
0.0
300.0
600.0
900.0
1,200.0
1,500.0
FY2009 FY2010 FY2011 FY2012 FY2013 FY2014
Food Apparel Household Tenant(Billions of yen)
●Ito-Yokado sales by fiscal yearTenant mix adjustment achieved a certain level of successStill room for improvement with apparel and household items End reliance on merchandisers and move to own merchandisingA slump in food, which is our backbone, is an urgent challenge
Copyright (C) Seven & i Holdings Co., Ltd. All Rights Reserved.
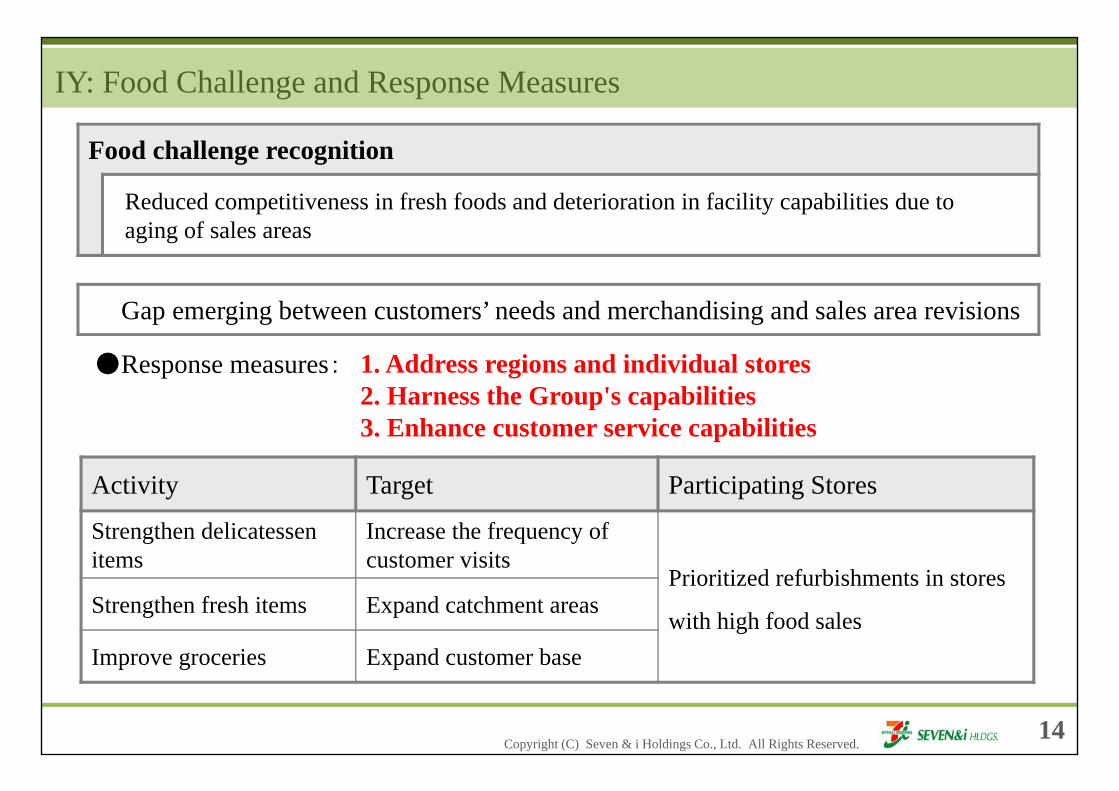
IY: Food Challenge and Response Measures
Food challenge recognition
Reduced competitiveness in fresh foods and deterioration in facility capabilities due to aging of sales areas
Gap emerging between customers’ needs and merchandising and sales area revisions
Activity Target Participating Stores
Strengthen delicatessen items
Increase the frequency of customer visits
Prioritized refurbishments in stores
with high food salesStrengthen fresh items Expand catchment areas
Improve groceries Expand customer base
●Response measures:
14
1. Address regions and individual stores2. Harness the Group's capabilities3. Enhance customer service capabilities

Copyright (C) Seven & i Holdings Co., Ltd. All Rights Reserved.
IY: Change Store Operation Structure -Responding to Diversifying Consumer Needs-
15
Do away with past approaches to chain stores
Limit of “Head Office-centered philosophy = Merchandising department taking responsibility
for sales, supply and income”
1. Incorporating regional characteristics・West Japan Business Department, Tohoku Reform Project・A part of the merchandising department function placed in each regional zone⇒Optimize supply and product lineups for individual stores
2. Permeation of individual store autonomy
Reorganize to promote store-led merchandising, sales area creation and operations

1) Group Management Challenges and Major Group Companies’ Strategies
2) Group Strategies

Copyright (C) Seven & i Holdings Co., Ltd. All Rights Reserved.
Seven Premium: FY2015 Sales to Reach 800.0 Billion Yen
1 trillion yen
0
700
1,400
2,100
2,800
3,500
0
200
400
600
800
1,000
FY2008 FY2009 FY2010 FY2011 FY2012 FY2013 FY2014 FY2015 FY2016
Sales Items (Items)SevenPremium
FY20143Q
FY20153Q
FY2015(Plan)
Sales(Billions of yen) 497.0 607.0 800.0
Items 2,400 2,810 2,860
Demonstrated that products representing value can be sold across business formatsThese results will be extended to clothing and miscellaneous goods, and will boostthe operating results of large-scale stores
PlanLaunch year
●Vigorously promoted renewals to achieve 607.0 billion yen (22.1% increase YOY)in sales during the third quarter of FY2015
(Billions of yen)
3Q3Q
3Q
16

Copyright (C) Seven & i Holdings Co., Ltd. All Rights Reserved.
Progress with the Omni-Channel Strategy
17
Foreseeable milestones (autumn 2015) Trial and verification ahead of full-fledged implementation
Portal site renewal Machi no Honya (Neighborhood Bookstore)Handling shoes and cosmetics, etc.
Complete requirement definition Establish scheme for accepting returns Management of small quantities of many items
●Utilize TOHAN’s logistics Establish 365-day distribution and return retrieval scheme
●Utilize Kuki distributioncenter Establish distribution for each Group company
●Strengthen HoldingCompany functions
Strengthen corporation with Group merchandizing projectEstablishment of Omni-Channel Systems Development Office
All Group products sold on the Internet to be available for pick up at SEJ stores from autumn 2015

【Appendix】Overview of Financial Results
for Major Operating Companies
Copyright (C) Seven & i Holdings Co., Ltd. All Rights Reserved.
0.0%
2.0%
4.0%
6.0%
0.0%
0.5%
1.0%
1.5%
1Q 2Q 3Q 4Q 1Q 2Q 3Q
Change in merchandise gross profit margin(left)
Existing stores sales increase(right)
Existing stores sales increase (right)(excluding cigarette sales)
Results YOY
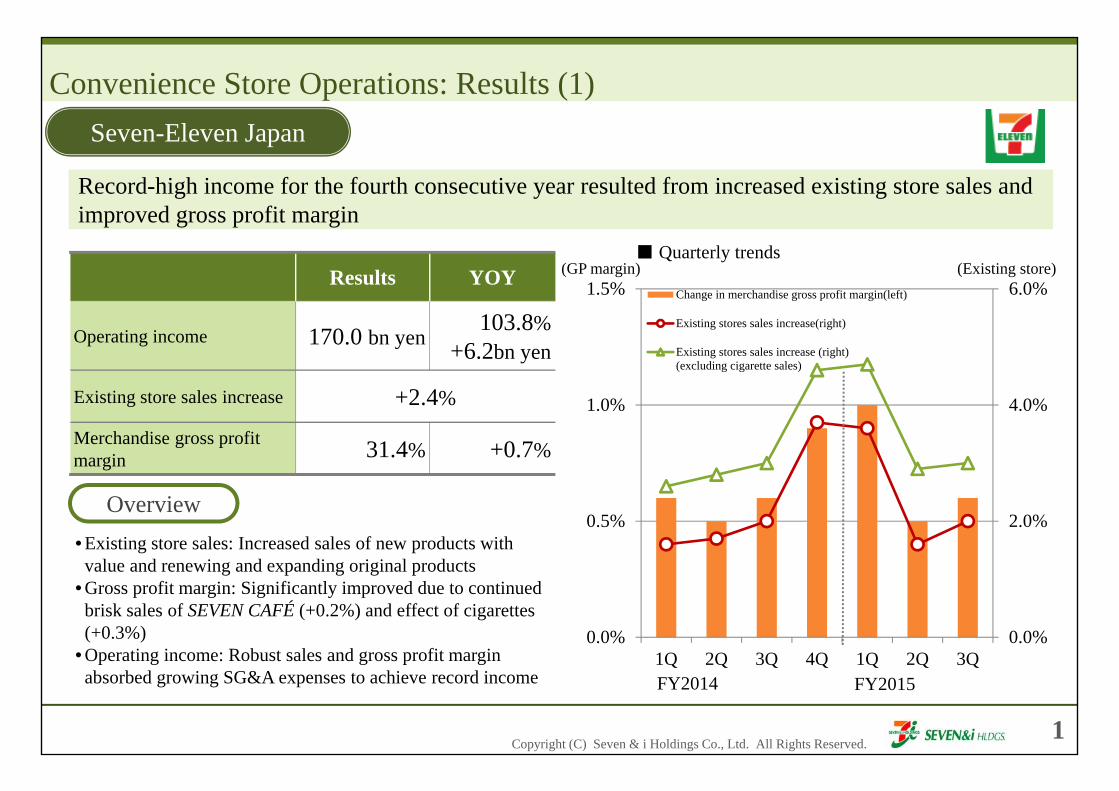
Operating income 170.0 bn yen103.8%
+6.2bn yen
Existing store sales increase +2.4%
Merchandise gross profit margin 31.4% +0.7%
FY2015FY2014
Convenience Store Operations: Results (1)Seven-Eleven Japan
Overview
■ Quarterly trends(GP margin) (Existing store)
• Existing store sales: Increased sales of new products with value and renewing and expanding original products
• Gross profit margin: Significantly improved due to continued brisk sales of SEVEN CAFÉ (+0.2%) and effect of cigarettes (+0.3%)
• Operating income: Robust sales and gross profit margin absorbed growing SG&A expenses to achieve record income
Record-high income for the fourth consecutive year resulted from increased existing store sales and improved gross profit margin
1

Copyright (C) Seven & i Holdings Co., Ltd. All Rights Reserved.
(2.0)%
0.0%
2.0%
4.0%
(1.0)%
0.0%
1.0%
2.0%
1Q 2Q 3Q 4Q 1Q 2Q 3Q
Change in merchandise gross profit margin(left)
Existing store sales increase(right)
Results YOY
Operating income 43.9 bn yen 114.0%+5.4 bn yen
Existing store sales increase (U.S. Merchandise sales in dollar basis)
+2.3%
Merchandise gross profit margin 34.6% (0.3)%
FY2014FY2013
7-Eleven, Inc.
Convenience Store Operations: Results (2)
Overview
■ Quarterly trends(Existing store)(GP margin)
Growth in merchandise sales at existing stores driven by strong hot foods sales resulted in double-digit operating income growth
• Existing store sales: Increased due to growth in fast foods sales centered on hot foods
• Gross profit margin: Decreased mainly due to competitive price setting for cigarettes
• Operating income: A double-digit income increase resulted from growth in existing store product sales and appropriate management of expenses, which covered a decline in the gross profit margin
2

Copyright (C) Seven & i Holdings Co., Ltd. All Rights Reserved.
(1.0)%
(0.5)%
0.0%
0.5%
1.0%
1Q 2Q 3Q 4Q 1Q 2Q 3Q(10.0)%
(5.0)%
0.0%
5.0%
10.0%Change in merchandise gross profit margin(left)
Existing store sales increase(right)
Results Change
Operating income (2.5) bn yen (6.2) bn yen
Existing store sales increase (4.4)%
Merchandise gross profit margin 30.0% (0.2)%
FY2015FY2014
Superstore Operations: Results (1)Ito-Yokado
■ Quarterly trends(Existing store)(GP margin)
Overview• Existing store sales: Decreased due to fall-back following
demand surge, unseasonable weather, and optimizing directly-managed sales areas (increasing tenants)
• Gross profit margin: Increased markdown loss, mainly in apparel, led to a 0.2% decrease
• SG&A: Down 0.6% despite increase in electricity charges offset by decreased land and building rent expenses and salaries and wages
3
Lower income reflected a decrease in existing store sales and deterioration of the gross profit margin in apparel

Copyright (C) Seven & i Holdings Co., Ltd. All Rights Reserved.
Results YOY
Operating income 8.7 bn yen96.1%
(0.3) bn yenExisting store sales increase +0.4%
Merchandise gross profit margin 25.4% (0.1)%
(8.0)%
(4.0)%
0.0%
4.0%
8.0%
(3.0)%
(1.5)%
0.0%
1.5%
3.0%
1Q 2Q 3Q 4Q 1Q 2Q 3Q
Change in merchandise gross profit margin(left)Existing stores sales increase(right)Operating profit margin (including LF)(right)
FY2015FY2014
Operating income(including Life Foods)* 11.9 bn yen
101.3%+0.1 bn yen
Superstore Operations: Results (2)York-Benimaru
Overview
■ Quarterly trends(Existing store)
(GP margin) (OP margin)
*Life Foods is wholly owned subsidiary which produces and sells delicatessen in York-Benimaru stores.
Increased income due to existing stores sales growth from operating income, including from Life Foods
• Existing store sales: : Increased on brisk sales of foods despite the struggling apparel sales due to weather impact
• Gross profit margin: Maintained food at the same level as the previous fiscal year, although apparel and household goods declined
• SG&A: Up 5.7% on increases in electricity rates and new stores (6 more than in the 3Q ended November 2013)
4

Copyright (C) Seven & i Holdings Co., Ltd. All Rights Reserved.
(4.0)%
(2.0)%
0.0%
2.0%
4.0%
(2.0)%
(1.0)%
0.0%
1.0%
2.0%
1Q 2Q 3Q 4Q 1Q 2Q 3Q
Change in merchandise grossprofit margin(left)
Existing stores salesincrease(right)
Results YOY
Operating income 1.1 bn yen86.9%
(0.1) bn yen
Existing store sales increase +0.2%Merchandise gross profit margin 24.8% (0.2)%
FY2015FY2014
Sogo & Seibu
Department Store Operations: Results
(Existing store)■ Quarterly trends
(GP margin)
Overview
Lower earnings reflected a decrease in gross profit margin despite an increase in existing store sales
・Existing store sales: Growth centered on the major stores thanksto higher sales of premium products due to a surge in demand ahead of the consumption tax increase and brisk sales of food products
・Gross profit margin: Decreased due to growth in sales of premium and food products with low gross profit margins
・SG&A: Decreased 0.3% despite an increase in advertising and decoration expenses associated with the launch of ashopping point system for food
5

This document contains certain statements based on the Company’s current plans, estimates,strategies, and beliefs; all statements that are not historical fact are forward-lookingstatements. These statements represent the judgments and hypotheses of the Company’smanagement based on currently available information. It is possible that the Company’sfuture performance will differ from the contents of these forward-looking statements.Accordingly, there is no assurance that the forward-looking statements in this document willprove to be accurate.


