
vOffice Depot® is a trademark of The Office Club, Inc. OfficeMax® is a trademark of OMX, Inc. ©2021 Office Depot, LLC. All rights reserved.
Q120Q120First Quarter 2021 Financial Results
Safe Harbor StatementThe Private Securities Litigation Reform Act of 1995, as amended, (the “Act”) provides protection from liability in private lawsuits for “forward-looking”
statements made by public companies under certain circumstances, provided that the public company discloses with specificity the risk factors that
may impact its future results. The Company wants to take advantage of the “safe harbor” provisions of the Act. Certain statements made during this
presentation are forward-looking statements under the Act. Except for historical financial and business performance information, statements made
during this presentation should be considered forward-looking as referred to in the Act. Much of the information that looks towards future performance
of the Company is based on various factors and important assumptions about future events that may or may not actually come true, including the
impacts on our business due to the unknown severity and duration of the COVID-19 outbreak. As a result, operations and financial results in the
future could differ materially and substantially from those discussed in the forward-looking statements made during this presentation. Certain risks
and uncertainties are detailed from time to time in the Company’s filings with the United States Securities and Exchange Commission (“SEC”).
You are strongly urged to review all such filings for a more detailed discussion of such risks and uncertainties. The Company’s SEC filings are
available at no charge at www.sec.gov and at the Company’s website at investor.theodpcorp.com.
During portions of today’s presentation, the Company may refer to results which are non-GAAP financial measures. A reconciliation of GAAP to non-
GAAP financial measures is available on the Company’s website at investor.theodpcorp.com. These measures exclude charges or credits not indicative
of core operations and the tax effects of these items, which may include but not be limited to merger integration, restructuring, acquisition costs, asset
impairments, loss on extinguishment of modification of debt and executive transition costs. The exact amount of these charges or credits are not
currently determinable but may be significant. Accordingly, the Company is unable to provide GAAP measures or equivalent reconciliations from GAAP to
non-GAAP for these financial measures.

Gerry SmithChief Executive Officer
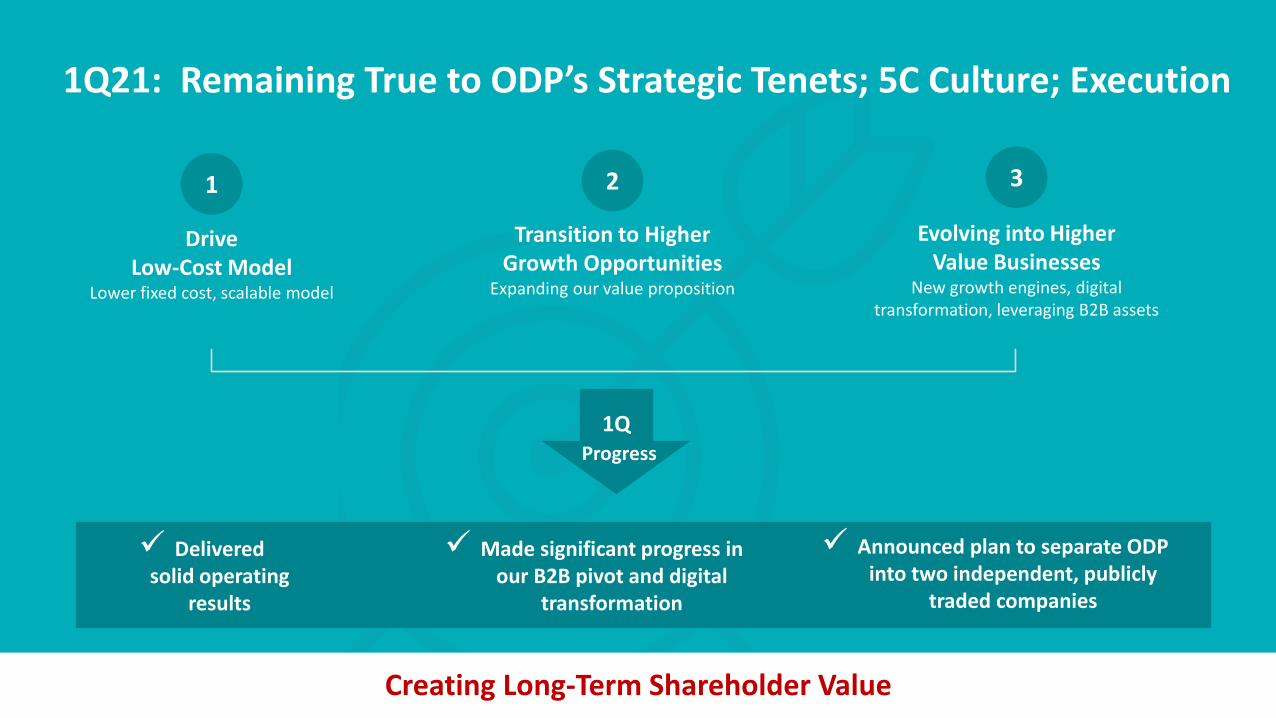
1Q21: Remaining True to ODP’s Strategic Tenets; 5C Culture; Execution
2 3
Drive Low-Cost Model
Lower fixed cost, scalable model
Transition to Higher Growth Opportunities
Expanding our value proposition
Evolving into Higher Value Businesses
New growth engines, digital transformation, leveraging B2B assets
1
Creating Long-Term Shareholder Value
✓ Deliveredsolid operating
results
✓ Made significant progress in our B2B pivot and digital
transformation
✓ Announced plan to separate ODP into two independent, publicly
traded companies
1QProgress
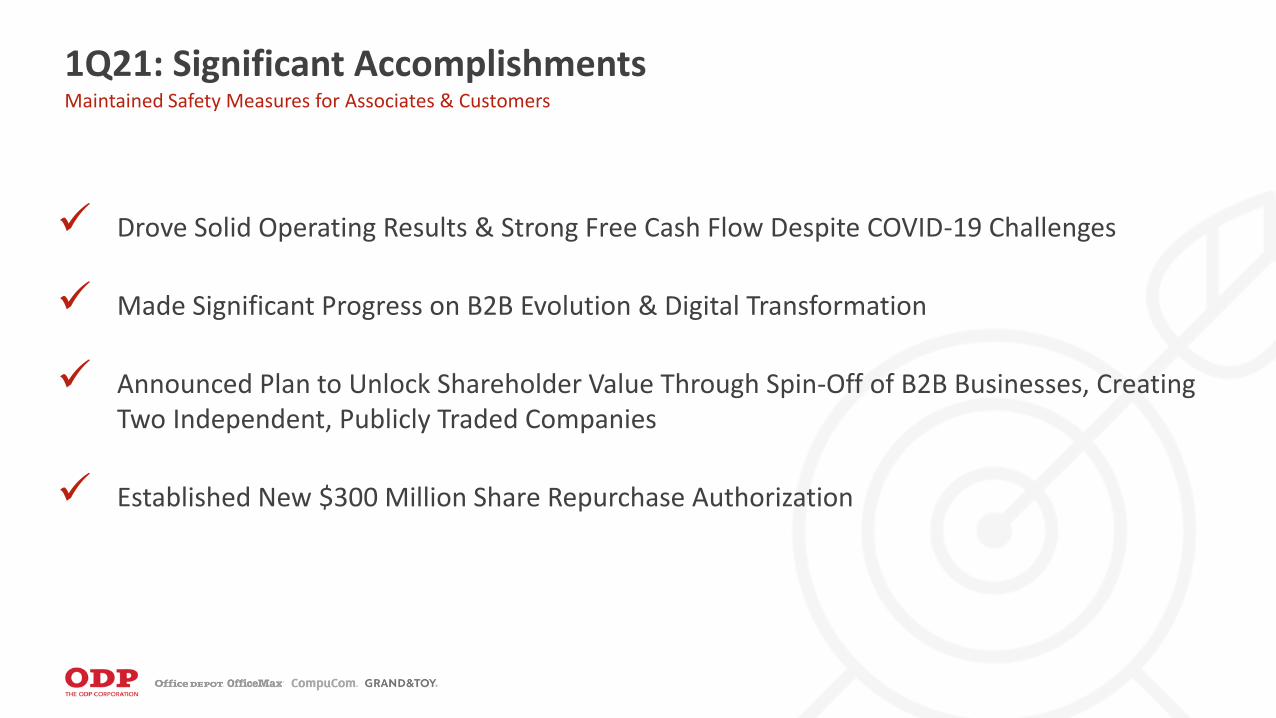
1Q21: Significant AccomplishmentsMaintained Safety Measures for Associates & Customers
✓ Drove Solid Operating Results & Strong Free Cash Flow Despite COVID-19 Challenges
✓ Made Significant Progress on B2B Evolution & Digital Transformation
✓ Announced Plan to Unlock Shareholder Value Through Spin-Off of B2B Businesses, Creating Two Independent, Publicly Traded Companies
✓ Established New $300 Million Share Repurchase Authorization
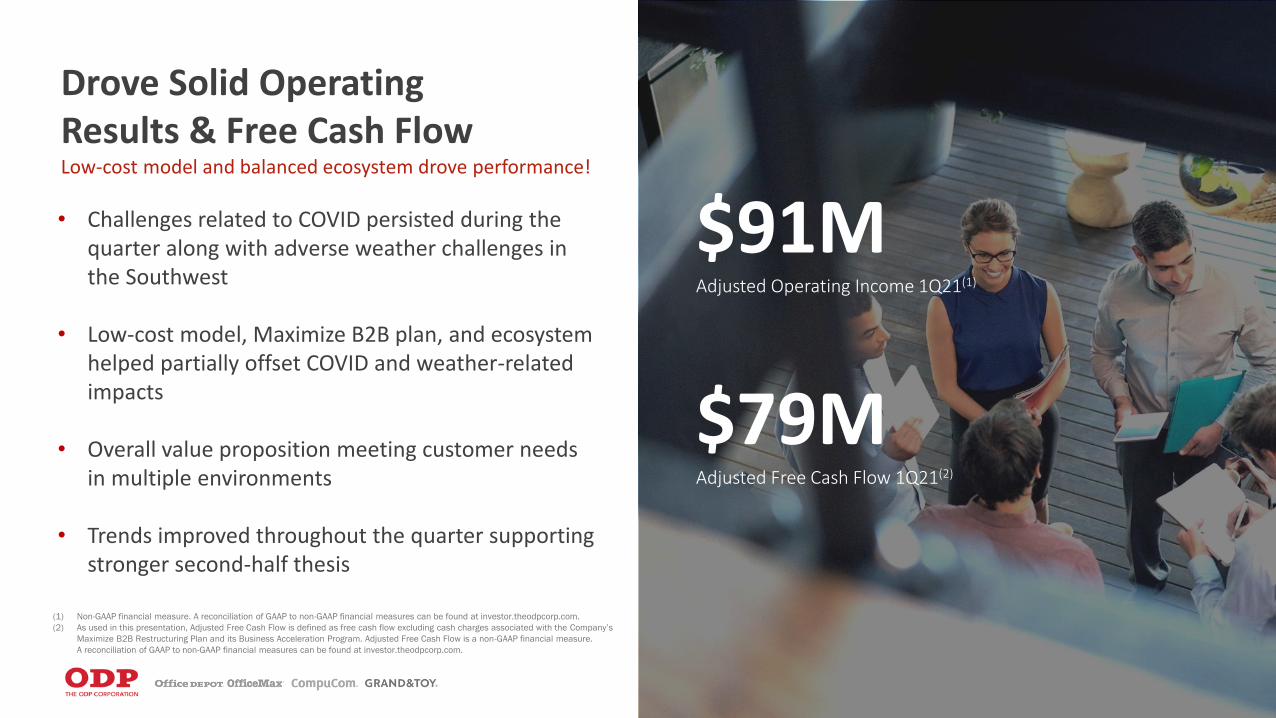
Drove Solid Operating Results & Free Cash FlowLow-cost model and balanced ecosystem drove performance!
• Challenges related to COVID persisted during the quarter along with adverse weather challenges in the Southwest
• Low-cost model, Maximize B2B plan, and ecosystem helped partially offset COVID and weather-related impacts
• Overall value proposition meeting customer needs in multiple environments
• Trends improved throughout the quarter supporting stronger second-half thesis
$91M Adjusted Operating Income 1Q21(1)
$79M Adjusted Free Cash Flow 1Q21(2)
(1) Non-GAAP financial measure. A reconciliation of GAAP to non-GAAP financial measures can be found at investor.theodpcorp.com.
(2) As used in this presentation, Adjusted Free Cash Flow is defined as free cash flow excluding cash charges associated with the Company’s
Maximize B2B Restructuring Plan and its Business Acceleration Program. Adjusted Free Cash Flow is a non-GAAP financial measure.
A reconciliation of GAAP to non-GAAP financial measures can be found at investor.theodpcorp.com.
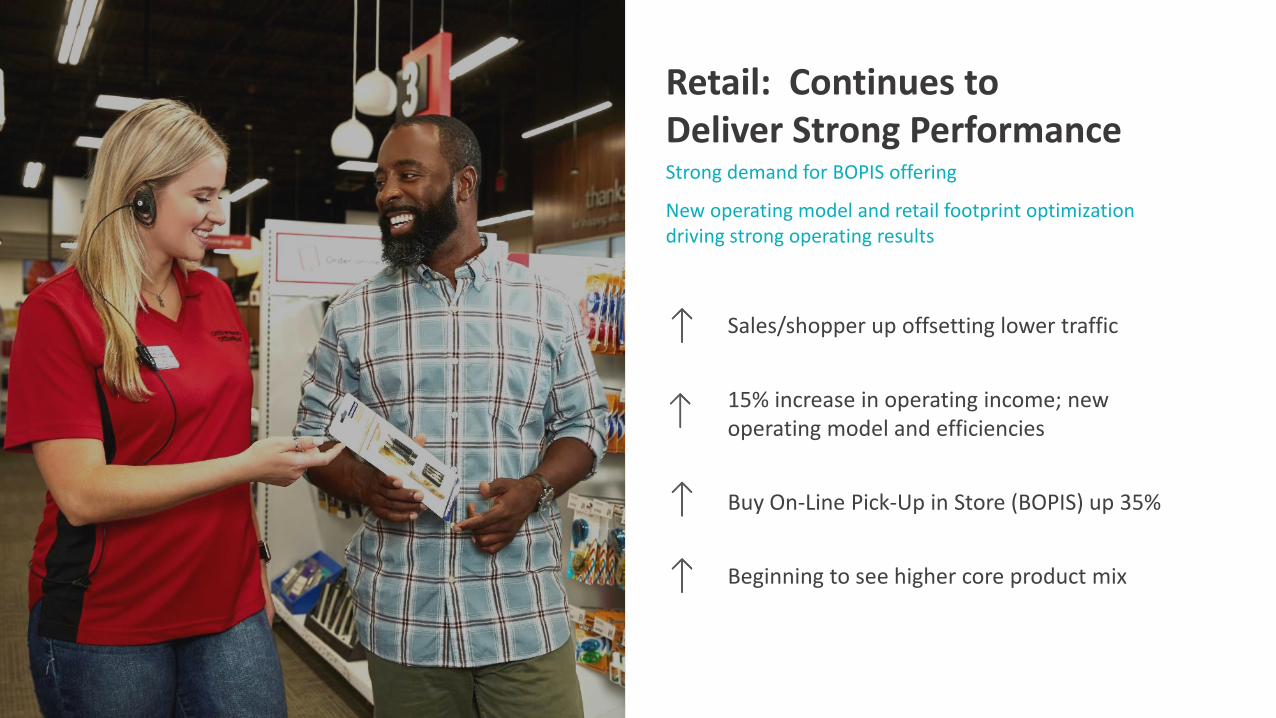
Retail: Continues to Deliver Strong PerformanceStrong demand for BOPIS offering
New operating model and retail footprint optimization driving strong operating results
Sales/shopper up offsetting lower traffic
15% increase in operating income; new operating model and efficiencies
Buy On-Line Pick-Up in Store (BOPIS) up 35%
Beginning to see higher core product mix
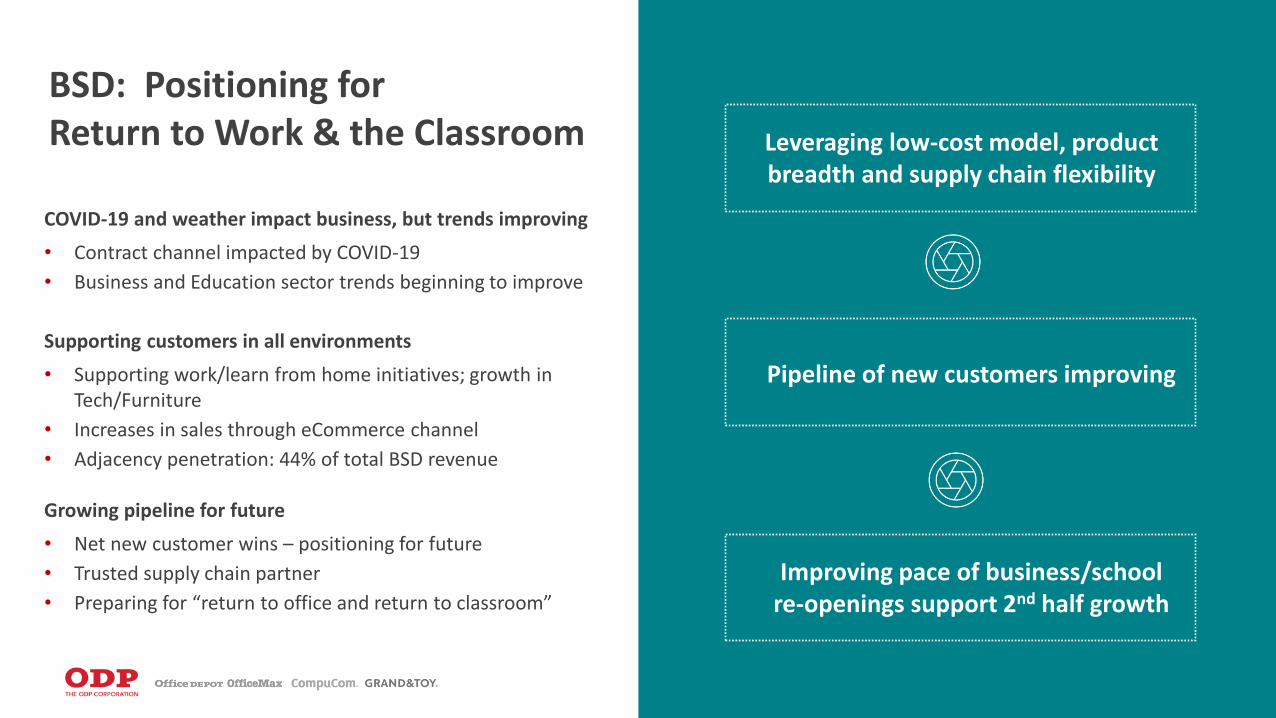
BSD: Positioning for Return to Work & the Classroom
COVID-19 and weather impact business, but trends improving
• Contract channel impacted by COVID-19
• Business and Education sector trends beginning to improve
Supporting customers in all environments
• Supporting work/learn from home initiatives; growth in Tech/Furniture
• Increases in sales through eCommerce channel
• Adjacency penetration: 44% of total BSD revenue
Growing pipeline for future
• Net new customer wins – positioning for future
• Trusted supply chain partner
• Preparing for “return to office and return to classroom”
Leveraging low-cost model, product breadth and supply chain flexibility
Pipeline of new customers improving
Improving pace of business/school re-openings support 2nd half growth
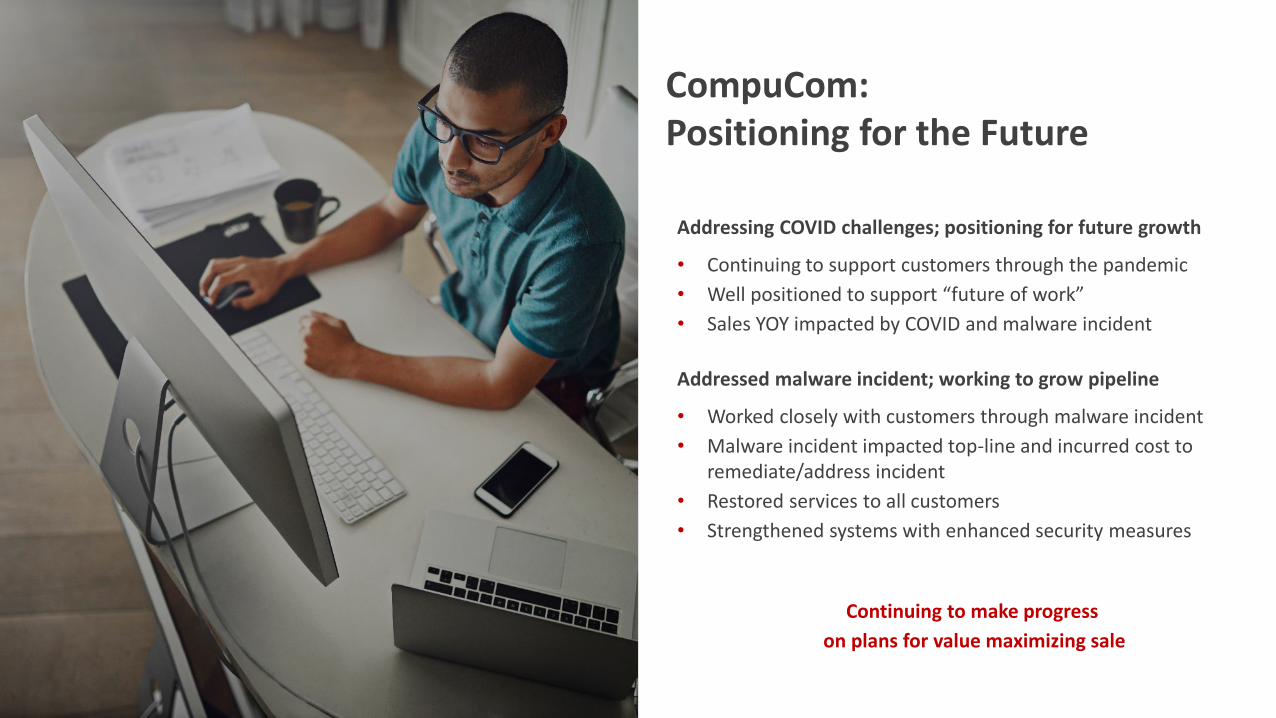
CompuCom:Positioning for the Future
Addressing COVID challenges; positioning for future growth
• Continuing to support customers through the pandemic
• Well positioned to support “future of work”
• Sales YOY impacted by COVID and malware incident
Addressed malware incident; working to grow pipeline
• Worked closely with customers through malware incident
• Malware incident impacted top-line and incurred cost to remediate/address incident
• Restored services to all customers
• Strengthened systems with enhanced security measures
Continuing to make progress
on plans for value maximizing sale
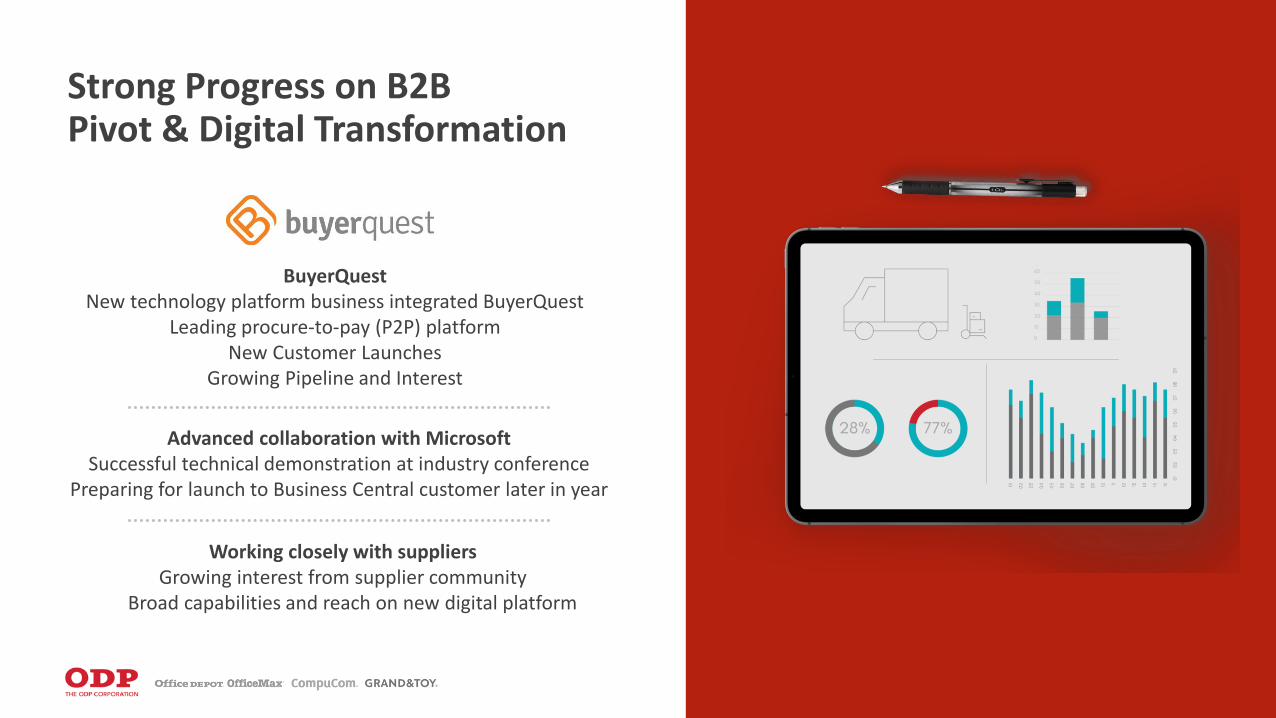
Advanced collaboration with MicrosoftSuccessful technical demonstration at industry conference
Preparing for launch to Business Central customer later in year
Working closely with suppliersGrowing interest from supplier community
Broad capabilities and reach on new digital platform
BuyerQuestNew technology platform business integrated BuyerQuest
Leading procure-to-pay (P2P) platformNew Customer Launches
Growing Pipeline and Interest
Strong Progress on B2B Pivot & Digital Transformation

Update on Staples Proposed OfferDavid Bleisch, EVP and Chief Legal & Administrative Officer
Maximizing Shareholder Value Through Separation of ODP
Gerry Smith, Chief Executive Officer
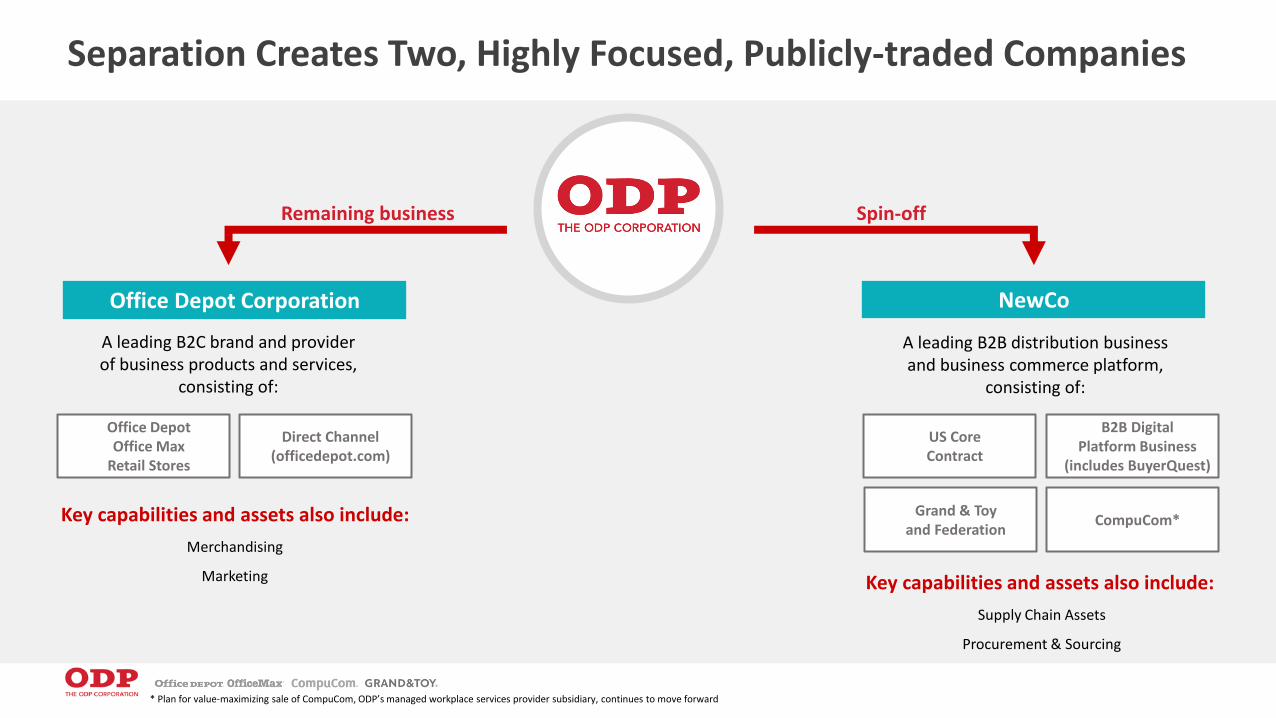
Merchandising
Supply Chain Assets
A leading B2B distribution business and business commerce platform,
consisting of:
A leading B2C brand and provider of business products and services,
consisting of:
Grand & Toy and Federation
US Core Contract
B2B Digital Platform Business
(includes BuyerQuest)
CompuCom*
Office Depot Office Max
Retail Stores
Direct Channel (officedepot.com)
Key capabilities and assets also include:
Key capabilities and assets also include:
Procurement & Sourcing
Marketing
Remaining business Spin-off
Separation Creates Two, Highly Focused, Publicly-traded Companies
Office Depot Corporation NewCo
* Plan for value-maximizing sale of CompuCom, ODP’s managed workplace services provider subsidiary, continues to move forward
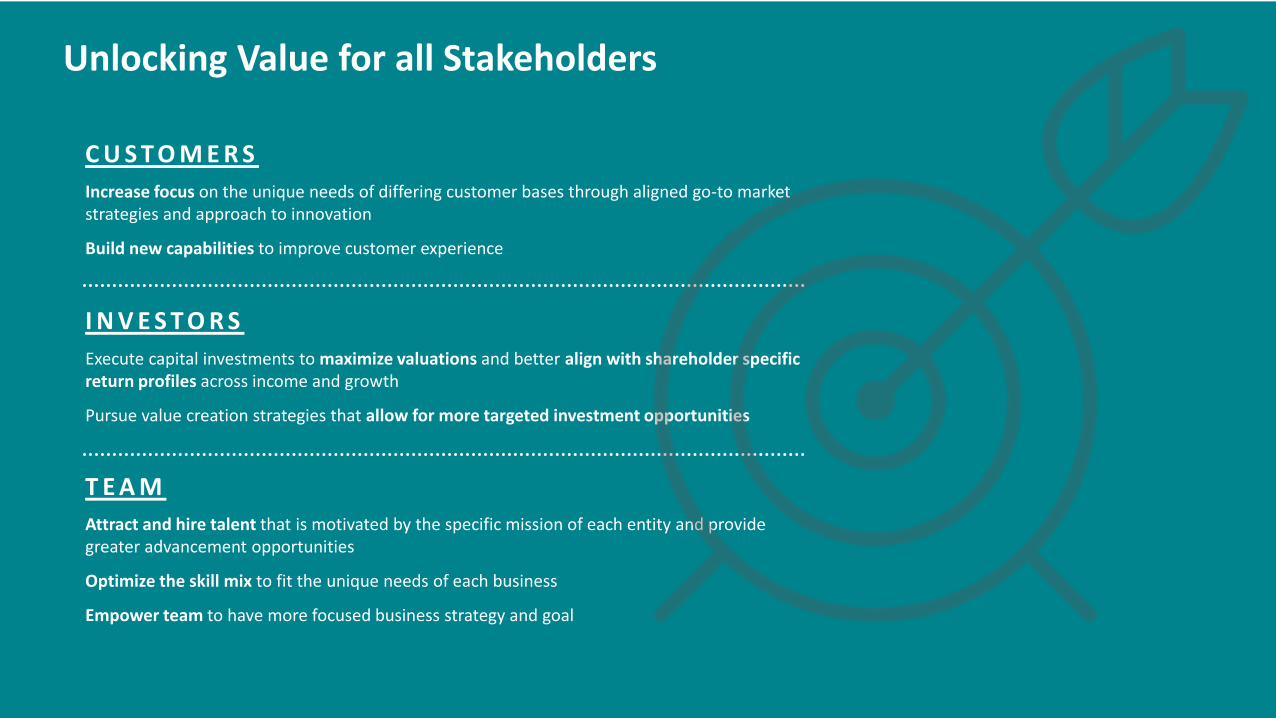
Unlocking Value for all Stakeholders
I N V E S T O R S
Execute capital investments to maximize valuations and better align with shareholder specific return profiles across income and growth
Pursue value creation strategies that allow for more targeted investment opportunities
T E A M
Attract and hire talent that is motivated by the specific mission of each entity and provide greater advancement opportunities
Optimize the skill mix to fit the unique needs of each business
Empower team to have more focused business strategy and goal
C U S T O M E R S
Increase focus on the unique needs of differing customer bases through aligned go-to market strategies and approach to innovation
Build new capabilities to improve customer experience
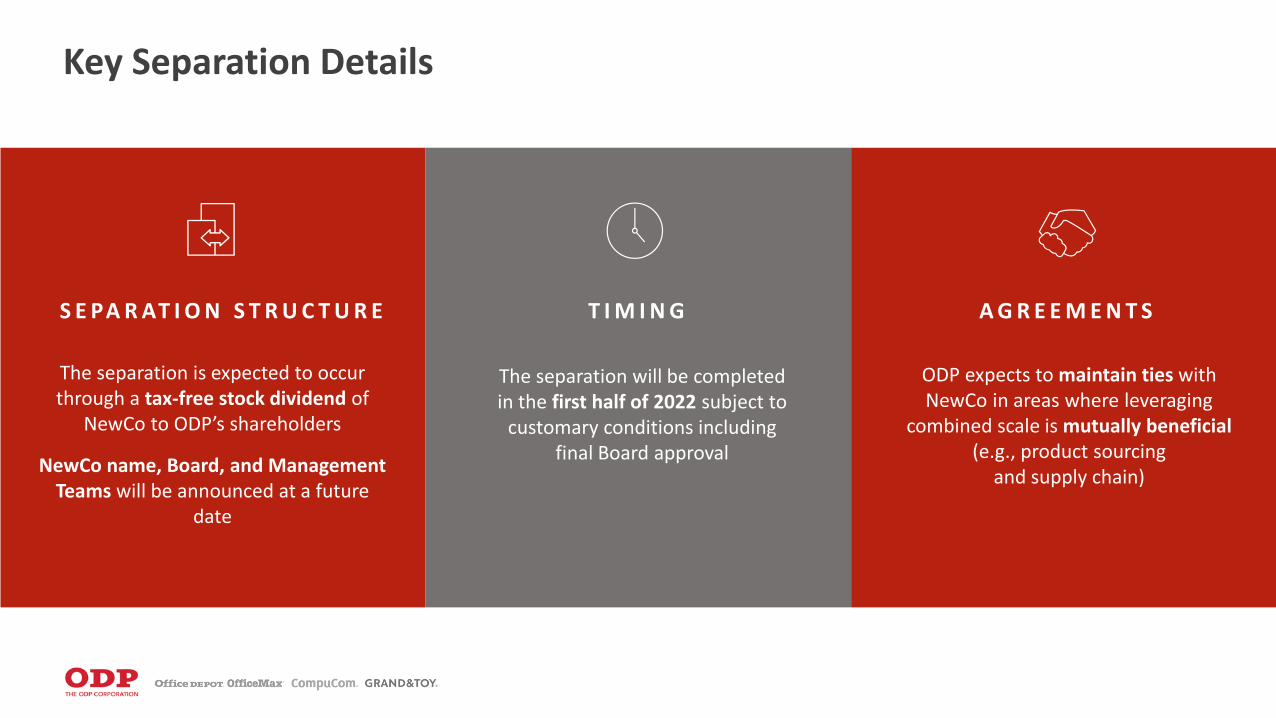
T I M I N GS E PA R AT I O N S T R U C T U R E A G R E E M E N T S
The separation will be completed in the first half of 2022 subject to
customary conditions including final Board approval
ODP expects to maintain ties with NewCo in areas where leveraging
combined scale is mutually beneficial (e.g., product sourcing
and supply chain)
The separation is expected to occur through a tax-free stock dividend of
NewCo to ODP’s shareholders
NewCo name, Board, and Management Teams will be announced at a future
date
Key Separation Details

1Q21 Financial OverviewAnthony Scaglione, EVP & Chief Financial Officer
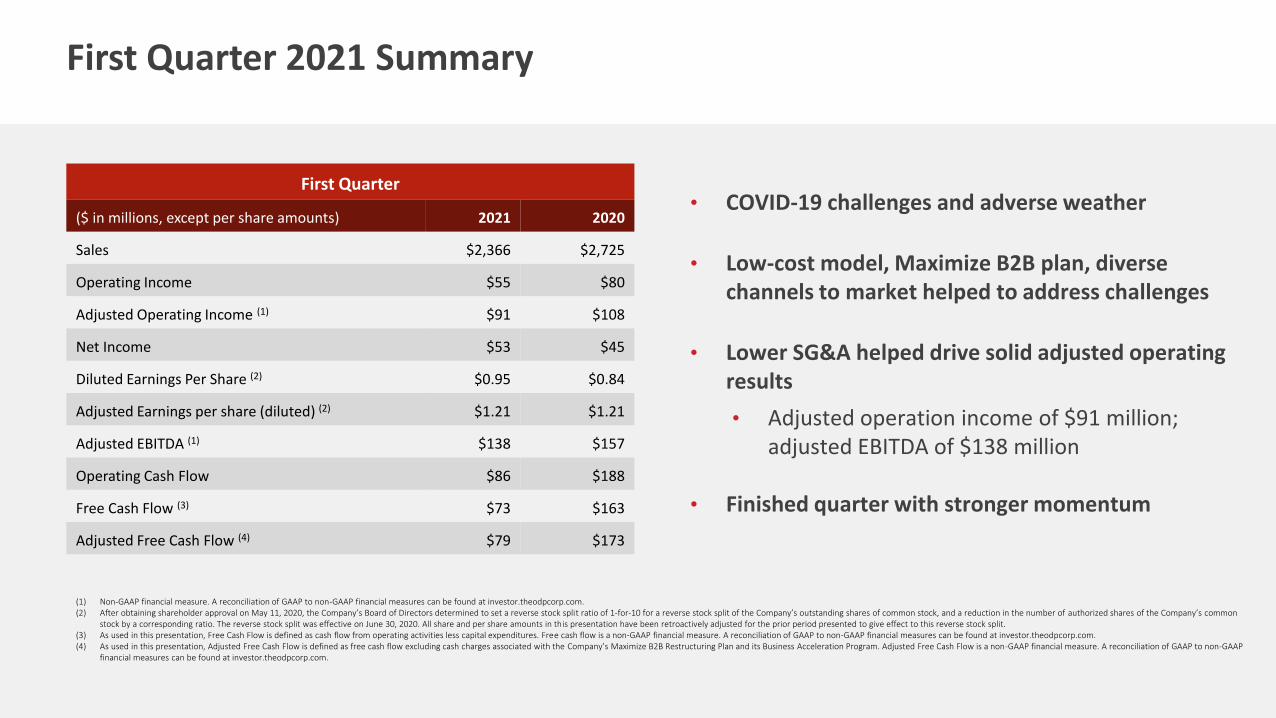
First Quarter 2021 Summary
First Quarter
($ in millions, except per share amounts) 2021 2020
Sales $2,366 $2,725
Operating Income $55 $80
Adjusted Operating Income (1) $91 $108
Net Income $53 $45
Diluted Earnings Per Share (2) $0.95 $0.84
Adjusted Earnings per share (diluted) (2) $1.21 $1.21
Adjusted EBITDA (1) $138 $157
Operating Cash Flow $86 $188
Free Cash Flow (3) $73 $163
Adjusted Free Cash Flow (4) $79 $173
• COVID-19 challenges and adverse weather
• Low-cost model, Maximize B2B plan, diverse channels to market helped to address challenges
• Lower SG&A helped drive solid adjusted operating results
• Adjusted operation income of $91 million; adjusted EBITDA of $138 million
• Finished quarter with stronger momentum
(1) Non-GAAP financial measure. A reconciliation of GAAP to non-GAAP financial measures can be found at investor.theodpcorp.com.(2) After obtaining shareholder approval on May 11, 2020, the Company’s Board of Directors determined to set a reverse stock split ratio of 1-for-10 for a reverse stock split of the Company’s outstanding shares of common stock, and a reduction in the number of authorized shares of the Company’s common
stock by a corresponding ratio. The reverse stock split was effective on June 30, 2020. All share and per share amounts in this presentation have been retroactively adjusted for the prior period presented to give effect to this reverse stock split.(3) As used in this presentation, Free Cash Flow is defined as cash flow from operating activities less capital expenditures. Free cash flow is a non-GAAP financial measure. A reconciliation of GAAP to non-GAAP financial measures can be found at investor.theodpcorp.com.(4) As used in this presentation, Adjusted Free Cash Flow is defined as free cash flow excluding cash charges associated with the Company’s Maximize B2B Restructuring Plan and its Business Acceleration Program. Adjusted Free Cash Flow is a non-GAAP financial measure. A reconciliation of GAAP to non-GAAP
financial measures can be found at investor.theodpcorp.com.
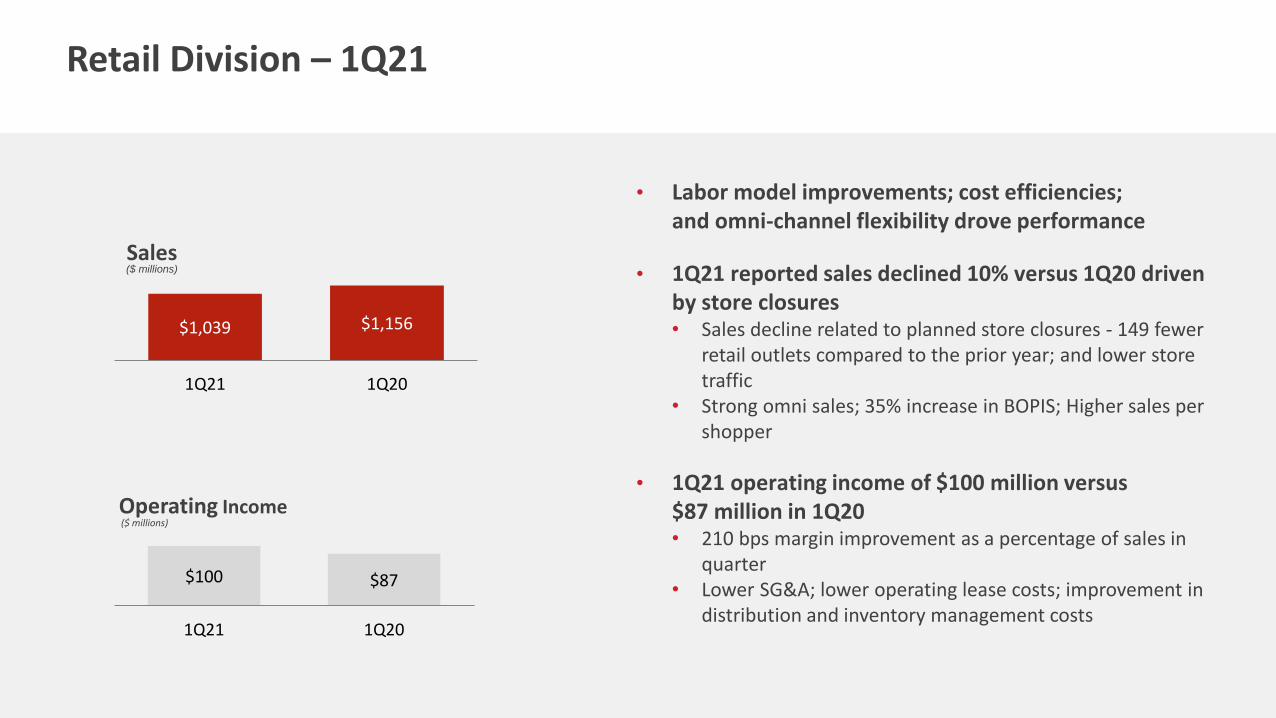
$100 $87
1Q21 1Q20
$1,039 $1,156
1Q21 1Q20
($ millions)Operating Income
($ millions)Sales
• Labor model improvements; cost efficiencies; and omni-channel flexibility drove performance
• 1Q21 reported sales declined 10% versus 1Q20 driven by store closures• Sales decline related to planned store closures - 149 fewer
retail outlets compared to the prior year; and lower store traffic
• Strong omni sales; 35% increase in BOPIS; Higher sales per shopper
• 1Q21 operating income of $100 million versus $87 million in 1Q20• 210 bps margin improvement as a percentage of sales in
quarter• Lower SG&A; lower operating lease costs; improvement in
distribution and inventory management costs
Retail Division – 1Q21
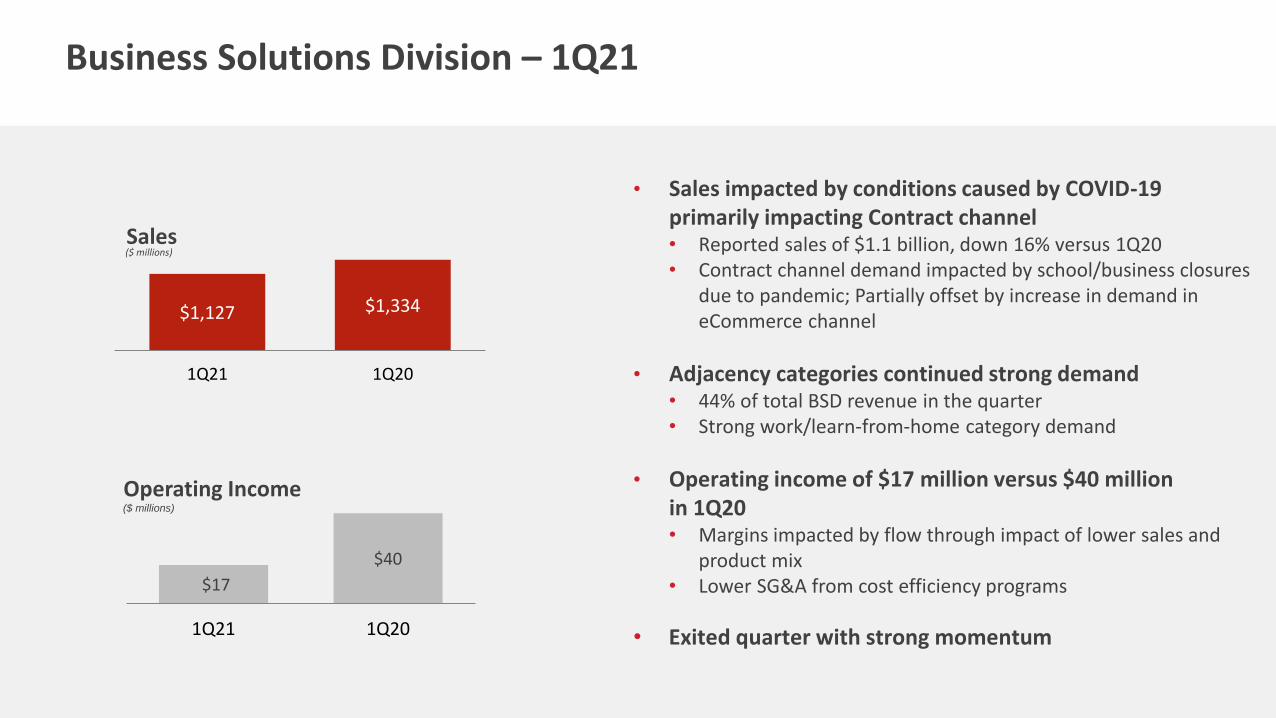
$17
$40
1Q21 1Q20
($ millions)
Operating Income
$1,127 $1,334
1Q21 1Q20
($ millions)Sales
• Sales impacted by conditions caused by COVID-19 primarily impacting Contract channel • Reported sales of $1.1 billion, down 16% versus 1Q20• Contract channel demand impacted by school/business closures
due to pandemic; Partially offset by increase in demand in eCommerce channel
• Adjacency categories continued strong demand • 44% of total BSD revenue in the quarter• Strong work/learn-from-home category demand
• Operating income of $17 million versus $40 million in 1Q20• Margins impacted by flow through impact of lower sales and
product mix• Lower SG&A from cost efficiency programs
• Exited quarter with strong momentum
Business Solutions Division – 1Q21
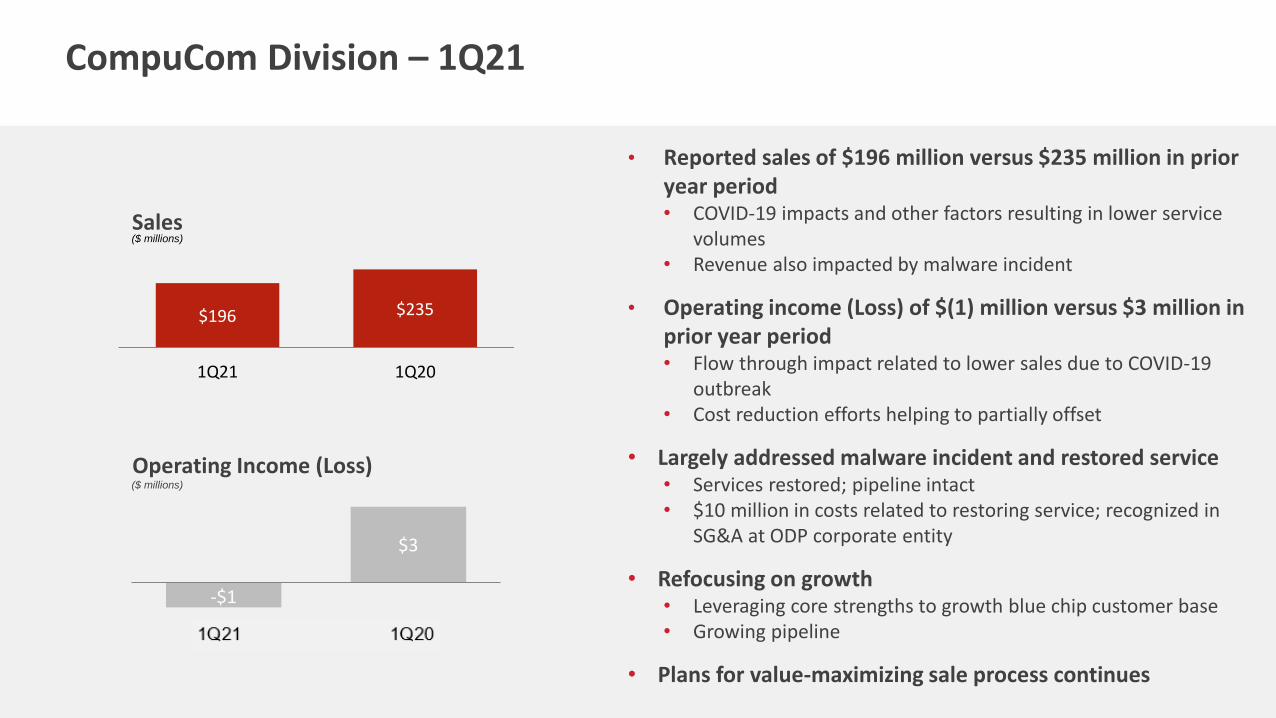
$196 $235
1Q21 1Q20
-$1
$3
($ millions)
Operating Income (Loss)
($ millions)
Sales
• Reported sales of $196 million versus $235 million in prior year period• COVID-19 impacts and other factors resulting in lower service
volumes • Revenue also impacted by malware incident
• Operating income (Loss) of $(1) million versus $3 million in prior year period• Flow through impact related to lower sales due to COVID-19
outbreak• Cost reduction efforts helping to partially offset
• Largely addressed malware incident and restored service• Services restored; pipeline intact• $10 million in costs related to restoring service; recognized in
SG&A at ODP corporate entity
• Refocusing on growth• Leveraging core strengths to growth blue chip customer base• Growing pipeline
• Plans for value-maximizing sale process continues
CompuCom Division – 1Q21
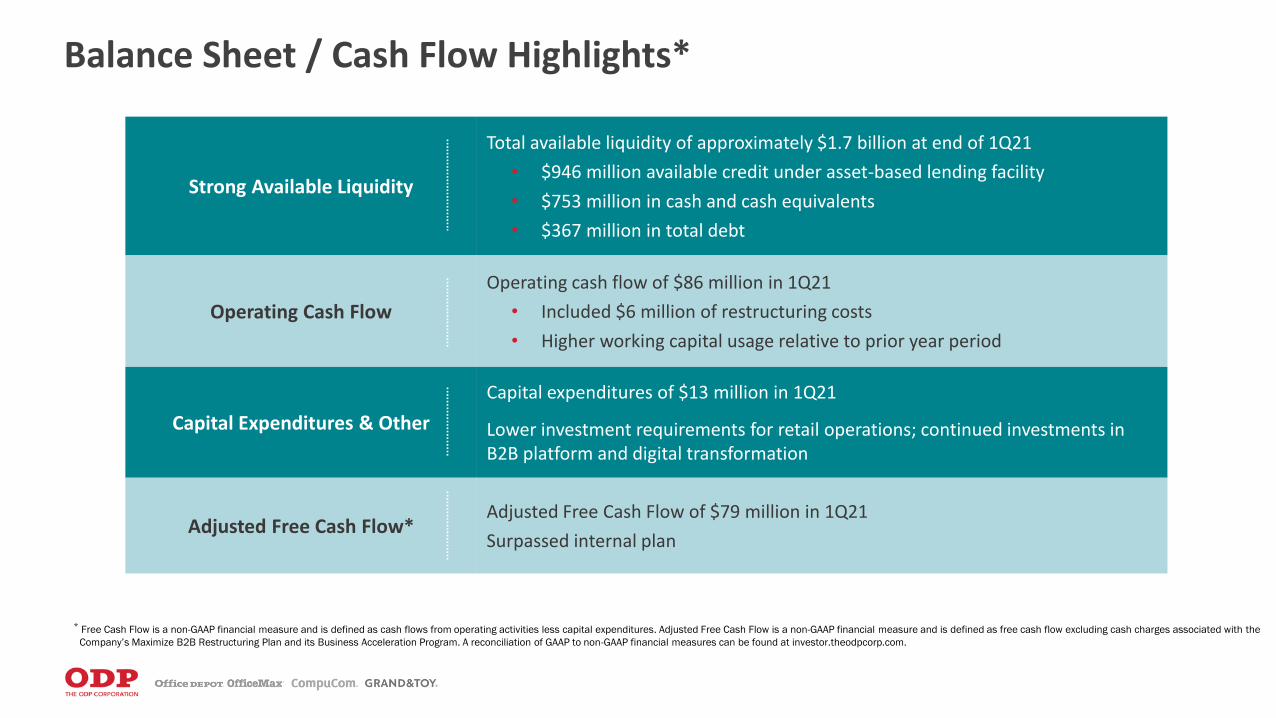
Balance Sheet / Cash Flow Highlights*
Strong Available Liquidity
Total available liquidity of approximately $1.7 billion at end of 1Q21
• $946 million available credit under asset-based lending facility
• $753 million in cash and cash equivalents
• $367 million in total debt
Operating Cash Flow
Operating cash flow of $86 million in 1Q21
• Included $6 million of restructuring costs
• Higher working capital usage relative to prior year period
Capital Expenditures & Other
Capital expenditures of $13 million in 1Q21
Lower investment requirements for retail operations; continued investments in B2B platform and digital transformation
Adjusted Free Cash Flow*Adjusted Free Cash Flow of $79 million in 1Q21
Surpassed internal plan
* Free Cash Flow is a non-GAAP financial measure and is defined as cash flows from operating activities less capital expenditures. Adjusted Free Cash Flow is a non-GAAP financial measure and is defined as free cash flow excluding cash charges associated with the
Company’s Maximize B2B Restructuring Plan and its Business Acceleration Program. A reconciliation of GAAP to non-GAAP financial measures can be found at investor.theodpcorp.com.

Q&A


