
First quarter20217. May 2021
Jan-Frode JansonCEO
Kjell FordalCFO
Vegard HellandExecutive director – Corporate Banking
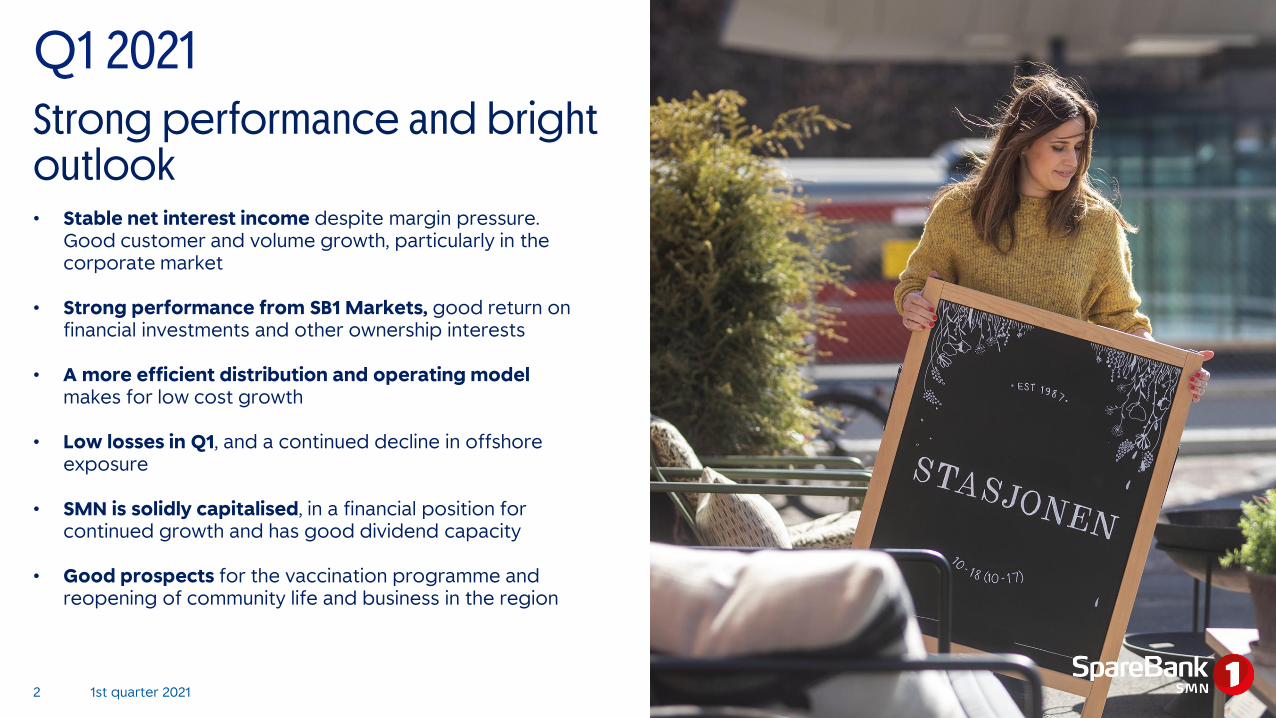
Strong performance and bright outlook• Stable net interest income despite margin pressure.
Good customer and volume growth, particularly in the corporate market
• Strong performance from SB1 Markets, good return on financial investments and other ownership interests
• A more efficient distribution and operating model makes for low cost growth
• Low losses in Q1, and a continued decline in offshore exposure
• SMN is solidly capitalised, in a financial position for continued growth and has good dividend capacity
• Good prospects for the vaccination programme and reopening of community life and business in the region
Q1 2021
1st quarter 20212

Q1 2021
Net profitNOK 768m (290m)
Return on equity14.8% (5.7%)
CET1 ratio18.0% (16.3%)
Pre-loss result of core business NOK 670m (564m)Losses NOK 59m (308m)
Lending growth 8.5% (6.0%)Deposit growth 16.2% (8.7%)
Book value per EC NOK 96.70 (86.85) Earnings per EC NOK 3.40 (1.26)
1st quarter 20213

Personal Banking: high liquidity spurs the housing market, acceleratesmortgage repayments and brings record saving rates
Personal Banking
Profit before tax (NOKm)
260218
295 320280
30
2021
Q220
0
301
260
Q120 Q320 Q121
3
Q420
248
315323
EM1 RM
Record-high saving in first quarter
Volume of saving contracts sold (NOKm)
Saving, single payment(NOKm)
4
13
Q120 Q121
+237%386
647
Q120 Q121
+68%
1st quarter 20214

Corporate Banking: good profitability, reduced losses in Q1. SB1 Markets taking market shares in a strong market
Corporate Banking
Profit before tax (NOKm)
SB1 Markets participated in most stockexchange listings in the Norwegian market in 2020
116
2563
167
47
46
5922
55
27
40
90
2771
35
-31
125
3-15
21
Q120
139
Q220 Q320
273
Q420 Q121
62
143
375
SpareBank 1 Regnskapshuset SMNSpareBank 1 SB1 Markets
SpareBank 1 SMN Finans Midt-NorgeThe bank’s corporate banking arm
Source: Dealogic per 7 April 2021
1st quarter 20215
Record number of new corporate customers in Q1

Product companies and associatedcompanies
Broad product range, commision income and return on ownership interests
225
8767
23
4036
-29
Q420Q120
0
-2
-9
1 14
17
-1
Q121
217
117 128
Other associated companies
Mortgage companies
BN Bank
SpareBank 1 Betaling
SpareBank 1 Gruppen
SpareBank 1 GruppenAlliance collaboration on productsunder a joint brand
SpareBank 1 BetalingParent company for Vipps paymentsolutions
BN BankNationwide actor in the retail and corporate market
Mortgage companiesSpareBank 1 BoligkredittSpareBank 1 Næringskreditt
Strong brands
*
• Q120 incl. gain of NOK 340m on the Fremtind merger
1st quarter 20216
Result from ownership interests (NOKm)

One SMN
Strengthened market position and increased cross sales• New distribution model with strong finance houses in growth
areas and leading digital solutions
• Strengthened interaction between banking and estate agencyarms and between banking and accounting arms makes for more customers and an increased financing share
• Increased use of analytical insight in sales, pricing and customercare
Efficient distribution and operating model• Reduced costs through fewer branches, efficient support
functions and tight cost control
• Staffing to be reduced by 100 FTEs in the course of 2021
Efficient capital utilisation• Allocation of capital to projects with the best return prospects
• Efficient capital utilisation and healthy solidityHead up the
development ofNorway’s savings
bank sector
Increasedigitalisation and
use of insight
Integratesustainability into the
business
Exploit the power in the ownership
model
1st quarter 20217

New distribution model is being implemented. Physical presence and digital leader position
A strong local presence with 17 finance centres, a broad product range and spearhead competence
Hvor finner jeg gode produktbilder?
Leader position in self-service channels
1st quarter 20218
17 finanssentre med lokal tilstedeværelse, bredt produktspekter og spisskompetanse

SpareBank 1 mobile app ranked highest on Google Play og App Store
Banking + Accounting launched on digital interfaces
9

SustainabilityGoals and key targets
InnovationCreate green growth and business developmentthrough cooperation and partnerships
Customer offeringOffer products and services which encouragecustomers’ green transition and digitalisation
Climate footprintReduce the climate footprint across the entire valuechain
CompetenceStrengthen climate risk competence and reporting
DiversityContribute to diversity and a fair transition
↑10%
↓ 50%
10% annual increasequalifying for green
bond financing
Halve the group’s climatefootprint by 2030.
Reduction of 8% per year
Engage customers and partners in the development of
innovative local communities
Offer competenceprogramme for customers
and employees
Strengthen equalopportunities in working life, everyday life and business
First step towards sustainabledevelopment
1st quarter 202110

Q1
Goals and keytargets adoptedon sustainability
Green bond issuedin the euromarket
‘My climate track’ launched in the
mobile bank
Source: Adresseavisen
Sustainability
1st quarter 202111

SpareBank 1 SMN strengthens itsposition as a local mainstayowned by everyone living in Central Norway
Through the ‘You are one of us’ campaign weare spreading knowledge of our ownershipmodel and are gathering suggestions from across all Central Norway on putting thecommunity dividend to the best possibleuse.
12

12%
16.9%
< 2%
↓ 50%
ProfitableReturn on equity 12%
SolidCET1 ratio 16.9%Payout ratio approx. 50%
EfficientAnnual growth in group costs limited to 2% withinexisting business
ResponsibleAims to halve the group’s climate footprint by 2030 Reduction of 8% per year
GoalsSpareBank 1 SMN aims to be the leading finance house in Central Norway and amongthe best performers in theNordic region
1st quarter 202113

High return over time and solidly capitalised. Efficient banking operations and unrealised income and cost synergies in thegroup. Shareholder-friendly dividend policy
Strong position and good growth in an attractive region and in all business lines. Diversified customer portfolio and incomebase
Substantial underlying assets through ownership positions in and outside SpareBank 1-alliansen
Well positioned as regards to consolidation amongNorwegian savings banks
A good brand with development potential based onownership model, presence and sustainability
1
2
3
4
5
1st quarter 202114
SpareBank 1 SMN (MING)- an attractive investment

Financial informationKjell FordalCFO
1st quarter 2021
1st quarter 202116
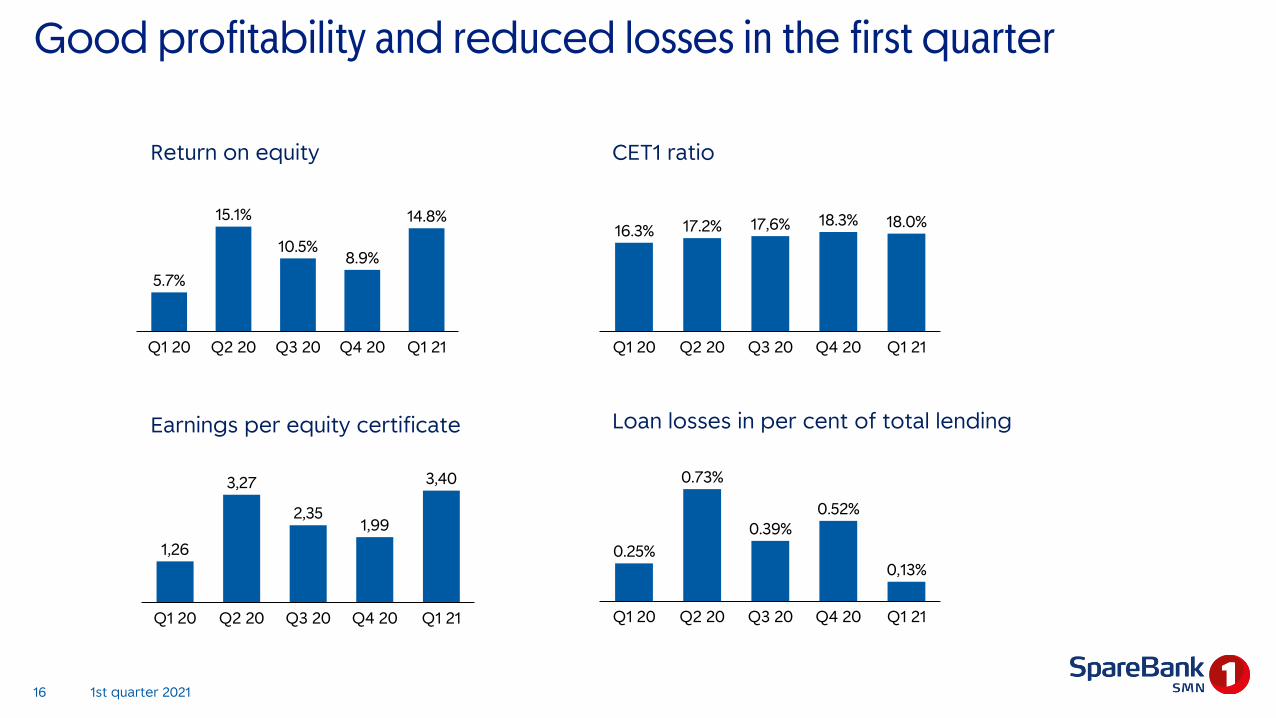
Good profitability and reduced losses in the first quarter
CET1 ratio
Loan losses in per cent of total lendingEarnings per equity certificate
16.3%
Q1 20 Q2 20 Q1 21Q4 20Q3 20
17.2% 17,6% 18.3% 18.0%
1,26
3,27
2,351,99
3,40
Q1 20 Q2 20 Q3 20 Q4 20 Q1 21 Q3 20
0.39%
0.73%
Q1 20 Q2 20 Q1 21Q4 20
0.25%
0.52%
0,13%
Q3 20Q1 20 Q4 20Q2 20
5.7%
Q1 21
15.1%
10.5%8.9%
14.8%
Return on equity

1st quarter 202117
Norwegian banks adapt readily to changing framework conditions
Total return in % - selected banks 2005 - 2021
Price increase since 31.12.2004 adjusted for dividend
Financial crisis 2008
Debt crisisEurope 2011/12
Oil crisis2015/16
Covid-19
MING
Regional savings banks
DNB
OSEBX
US banksSwedish banks
European banks
04/05 2006 2008 2010 2012 2014 2016 2018 2020/21Source: SpareBank 1 Markets, weekly report Norwegian banks, Nils Christian Øyen

Strong quarterly results and 14.8 per cent return on equity
Pre-loss result of core business is strengthened and losses arereduced
Good results
NOK mill Q1 21 Q4 20 Q3 20 Q2 20 Q1 20
Net interest 668 688 695 666 710
Commission income and other income 808 757 638 607 570
Operating income 1.477 1.445 1.333 1.273 1.280
Total operating expenses 806 845 685 706 716
Pre-loss result of core business 670 600 648 567 564
Losses on loans and guarantees 59 242 231 170 308
Post-loss result of core business 612 357 417 397 256
Related companies 128 117 170 177 -123
Gain Fremtind 340
Securities, foreign currency and derivates 161 80 34 271 -116
Result before tax 901 554 621 845 357
Tax 133 104 102 126 67
Net profit 768 449 518 718 289
Return on equity 14,8 % 10,5 % 15,1 % 5,7 % 7,1 %
1st quarter 202118

Companies’ comprehensiveincome
Subsidiaries
mNOK, SMN's share in parentheses Q1 21 Q4 20 Q3 20 Q2 20 Q1 20
EiendomsMegler 1 Midt-Norge (87 %) 21 2 19 30 0
SpareBank 1 Regnskapshuset SMN (89 %) 27 22 21 40 27
SpareBank 1 Finans Midt-Norge (61 %) 55 52 52 41 39
SpareBank 1 Markets (67 %) 125 90 35 71 -15
SpareBank 1 SMN Invest (100%) 109 21 -3 7 -19
Other companies 1 2 1 2 3
Subsidiaries 338 189 125 191 36
Profit before tax
1st quarter 202119

Lending growth
Total loans NOK 185bn, 12 month growth of 8.5 per cent
Market growth in mortgages5.0 per cent (C2) last 12 months
Good 12 month growth in residential mortgages, butsomewhat lower growth in Q1
High business banking lending, growth spread bothgeographically and across a wide range of customers
Share of total lending, CM and RM
Lending growth RM 8.3% (CAGR)
Lending growth CM 5.3% (CAGR)
91,3 100,4 108,7 117,0 125,5
31.3.2031.3.17 31.3.18 31.3.19 31.3.21
10,0% 8,2% 7,6% 7,3%
48,7 50,6 52,4 53,8 59,8
31.3.17 31.3.18 31.3.19 31.3.20 31.3.21
4,0% 3,4% 2,7% +11,3%
CM
RM
68%
32%
1st quarter 202120

Lending margins
Norges Bank’s base rate downto zero in June 2020, and a fall in NIBOR strengthened margins
Two mortgage rate cuts carriedout in 2020
Increased NIBOR in Q4 2020 and in 1Q 2021 putting mortgageloan margins under pressure
Norges Bank retains an unchanged base rate, but has signalled a possible increase in autumn 2021
1,81 1,91 1,99 1,961,79 1,65 1,64 1,63 1,60 1,50 1,49 1,40
1,631,99 1,87 1,73 1,59
2,71 2,81 2,80 2,75 2,71 2,73 2,75 2,73 2,692,56 2,53 2,522,69
3,102,85
2,64 2,68
Q1 17 Q3 17 Q1 18 Q3 18 Q1 19 Q319 Q120 Q320 Q121
Loans RM Loans CM
Lending margins versus 3M NIBOR
1st quarter 202121
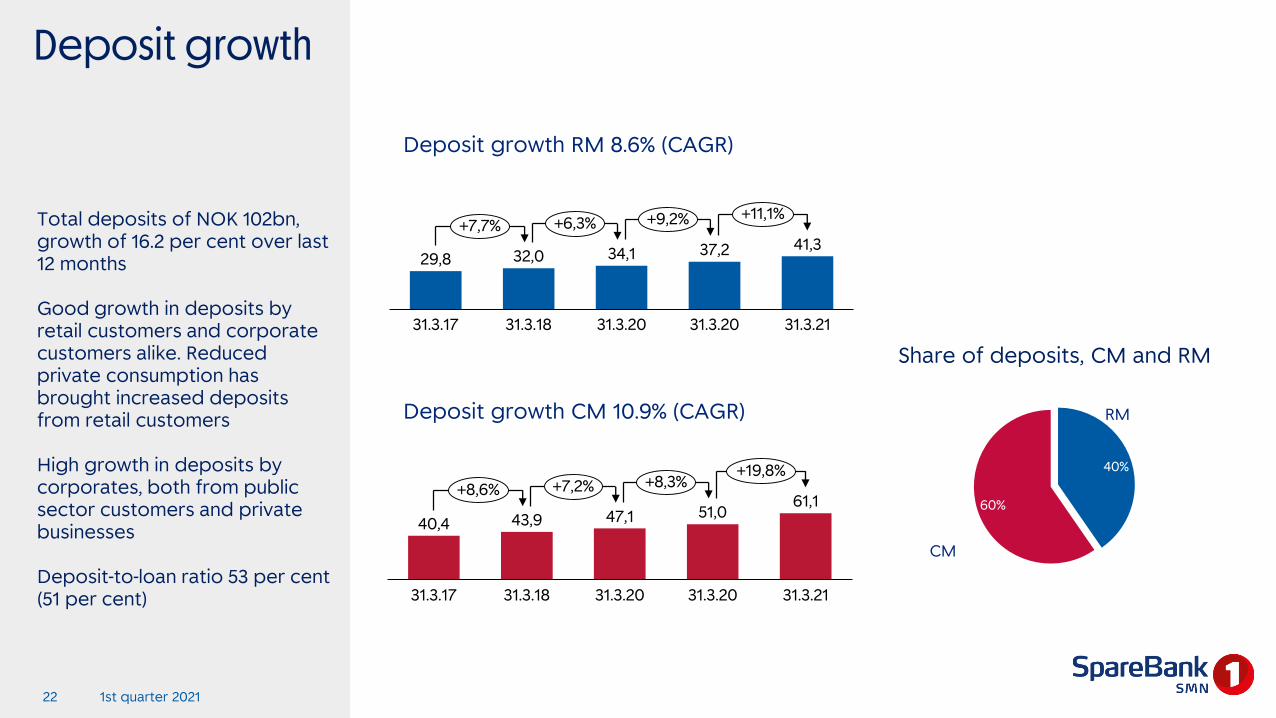
Deposit growth
Total deposits of NOK 102bn, growth of 16.2 per cent over last 12 months
Good growth in deposits by retail customers and corporatecustomers alike. Reducedprivate consumption has brought increased depositsfrom retail customers
High growth in deposits by corporates, both from publicsector customers and private businesses
Deposit-to-loan ratio 53 per cent (51 per cent)
Deposit growth RM 8.6% (CAGR)
CM
RM
29,8 32,0 34,1 37,2 41,3
31.3.2131.3.17 31.3.18 31.3.20 31.3.20
+7,7% +6,3% +9,2% +11,1%
40,4 43,9 47,1 51,061,1
31.3.1831.3.17 31.3.20 31.3.20 31.3.21
+8,6% +7,2% +8,3%+19,8%
Deposit growth CM 10.9% (CAGR)
40%
60%NL
Share of deposits, CM and RM
1st quarter 202122

Deposit margins
RM margins track NIBOR development due to unchangedproduct interest rates.
CM loans are mostly linked to NIBOR and margins aretherefore relatively stable
Deposit margins measured against 3M NIBOR
0,240,13 0,03 0,03
0,140,28 0,27
0,39 0,460,59 0,66 0,75
0,50
-0,47
-0,19 -0,01 0,08
-0,06 -0,11 -0,14 -0,13 -0,05 -0,04 -0,05 -0,02 0,02 0,02 0,08 0,13 0,04-0,26
-0,24-0,21 -0,29
Q1 17 Q3 17 Q1 18 Q3 18 Q1 19 Q319 Q120 Q320 Q121
Deposits RMDeposits CM
1st quarter 202123

Change in netinterest income
Increased volume of loansand deposits strengthens netinterest income
Deposit margins reduced due to zero base rate from summer 2020
Lower interest income on thebank’s equity capital due to markedly lower marketinterest rate
Net interest Q1 2021 668
Net interest Q1 2020 710
Change -42
Obtained as follows:
Fees on lending 3
Lending volume 39
Deposit volume 9
Lending margin 13
Deposit margin -80
Equity capital -53
Funding and liquidity buffer 10
Subsidiaries 18
Change -42
Change from Q120 to Q121
1st quarter 202124
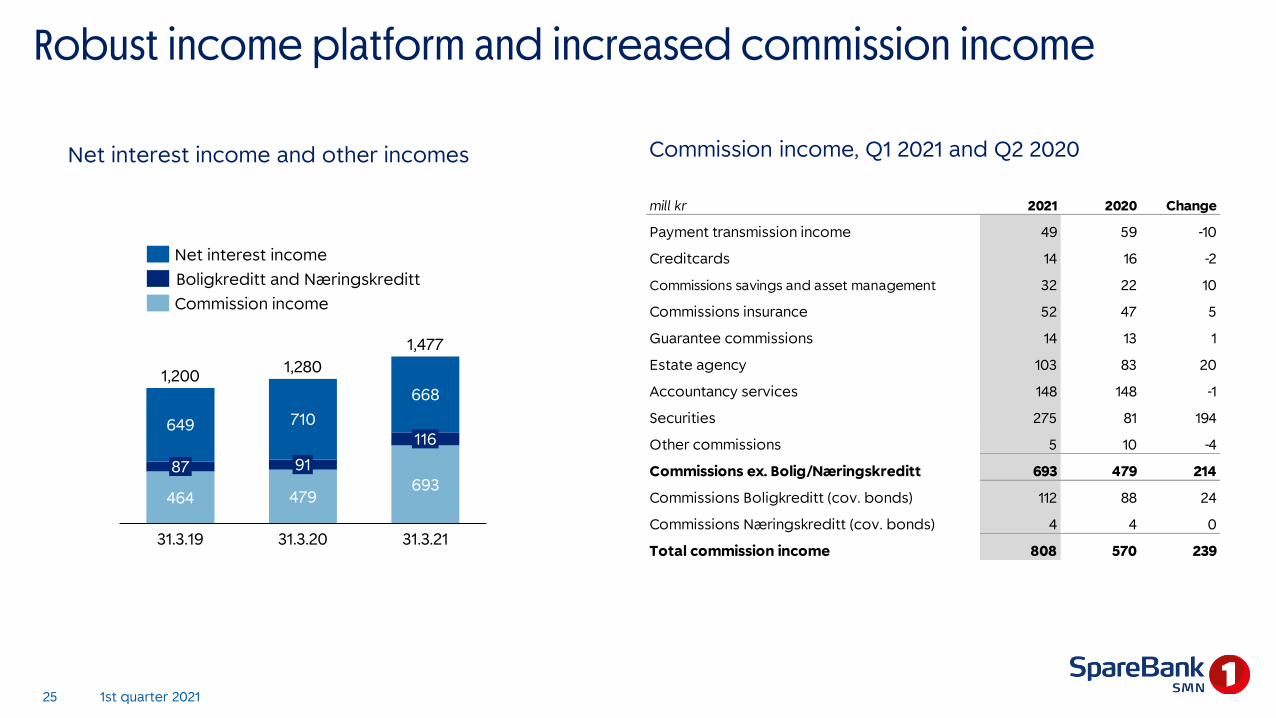
Robust income platform and increased commission income
Net interest income and other incomes
464 479693
649 710
668
31.3.20
9187
31.3.19
1,280
116
1,200
31.3.21
1,477
Net interest income
Boligkreditt and Næringskreditt
Commission income
Commission income, Q1 2021 and Q2 2020
mill kr 2021 2020 Change
Payment transmission income 49 59 -10
Creditcards 14 16 -2
Commissions savings and asset management 32 22 10
Commissions insurance 52 47 5
Guarantee commissions 14 13 1
Estate agency 103 83 20
Accountancy services 148 148 -1
Securities 275 81 194
Other commissions 5 10 -4
Commissions ex. Bolig/Næringskreditt 693 479 214
Commissions Boligkreditt (cov. bonds) 112 88 24
Commissions Næringskreditt (cov. bonds) 4 4 0
Total commission income 808 570 239
1st quarter 202125

Underlying cost reduction of 4.0 per cent last 12 months
367 344
350 344
119
Subsidiaries
Q1 20 Q1 21
Parent bank
716
806
Group costs reduced whenvariable remuneration (NOK 119m) at SpareBank 1 Markets is excluded
Reduction at both the bank and subsidiaries
Downstaffing proceedingapprox. as planned
Costdevelopment
One SMN with measuresproviding effects in thethe short and long term
• Efficient distribution• Streamlined support functions• Tight cost control• Reduction of 100 FTEs in 2021
1st quarter 202126
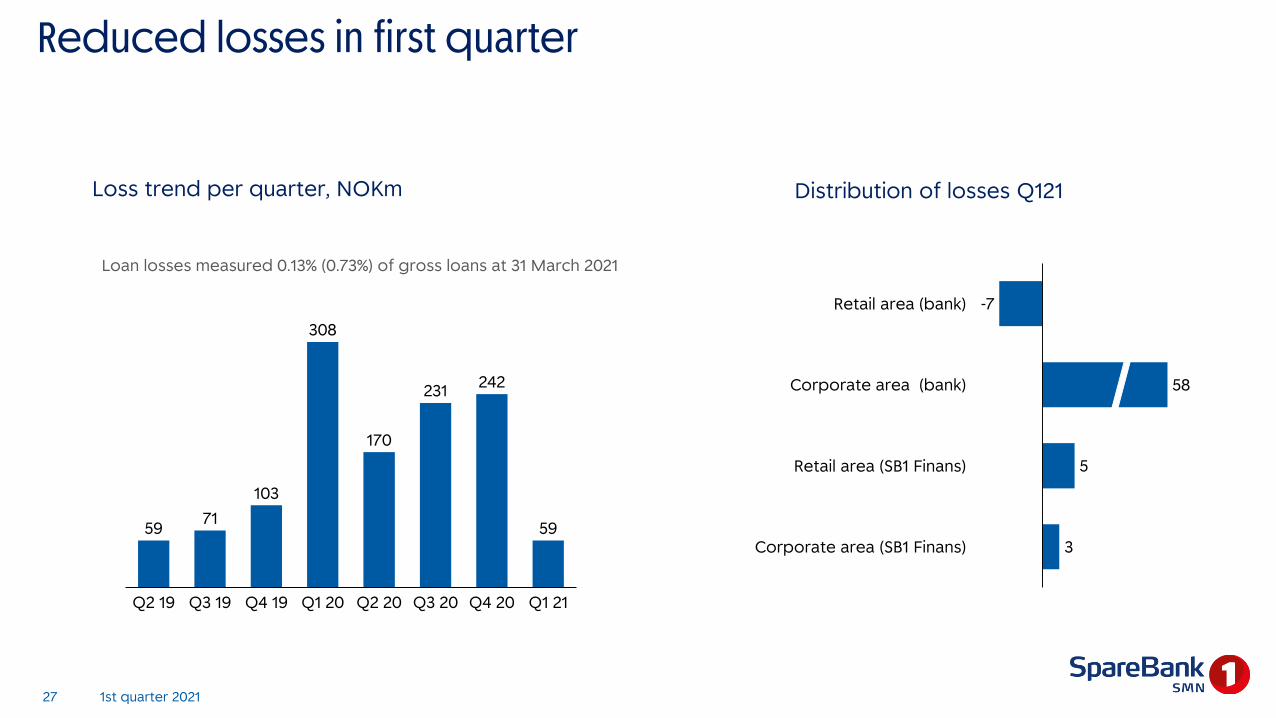
Reduced losses in first quarter
Loss trend per quarter, NOKm
-7
5
3
58
Corporate area (SB1 Finans)
Retail area (bank)
Corporate area (bank)
Retail area (SB1 Finans)
Loan losses measured 0.13% (0.73%) of gross loans at 31 March 2021
5971
103
308
170
231 242
59
Q4 20Q2 19 Q3 19 Q4 19 Q3 20Q1 20 Q2 20 Q1 21
Distribution of losses Q121
1st quarter 202127
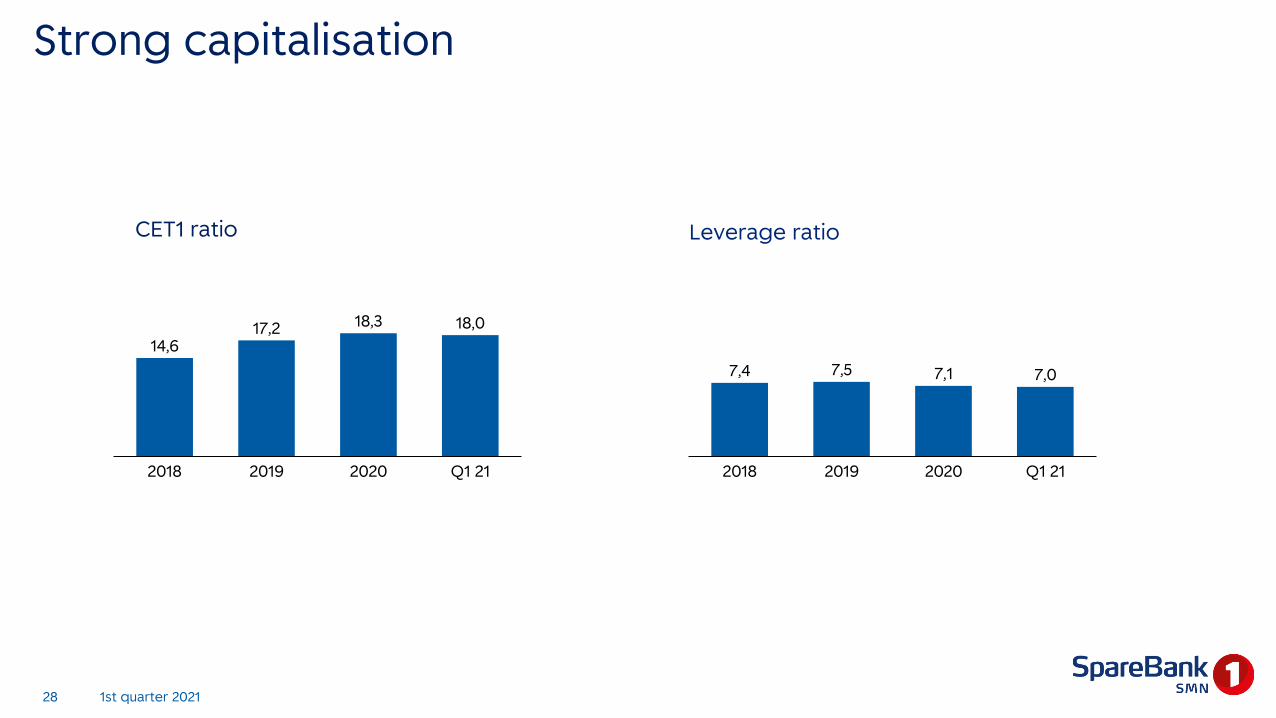
Strong capitalisation
CET1 ratio
14,617,2 18,3 18,0
20192018 2020 Q1 21
7,4 7,5 7,1 7,0
2018 2019 2020 Q1 21
Leverage ratio
1st quarter 202128

Market and creditVegard HellandExecutive director, Corporate Banking
1st quarter 2021

Increased demand and good market balance in most segments. Outlook revised up for agriculture and construction
Retail trade Maritime industryConstruction Fisheries
Offshore Commercial propertyAgriculture Aquaculture
Status Outlook Status Outlook Status Outlook Status Outlook
Status Outlook Status Outlook Status Outlook Status Outlook
1st quarter 202130
Source: SpareBank 1 SMN

Unemployment has risen as a result ofCovid-19, but is substantially down from the peak in April 2020
Norway
2.9%1.9%
4.2%
10.2%
2.2%2.3%
9.1% 9.1%
2.8%
April 20March 19 March 21
Trøndelag Møre and Romsdal
Unemployment
Wholly unemployed as a share of the labour force (NAV), monthly figures
1st quarter 202131
Source: NAV

House prices have risen by 9.2 % in Trondheim over the past year
House price trend
Hvor finner jeg gode produktbilder?
The property market in Central Norway is marked by high demandand turnover velocity. This applies to existing homes, new builds and commercial property alike
In the professional segment the focuson sustainability and environmentalcertification of buildings is intensifying
2005-2021
Hu
nd
red
s
20152005 2007 2009 20182011 20212013
Norway
Trondheim
200 %
150 %
100 %
50 %
1st quarter 202132

Support schemesCM – Payment deferments
Government guaranteed loans – Guaranteed volume, number of loans and degree ofutilisation of the guarantee scheme
RM – Payment deferments
March 20 March 20
A high number of paymentdeferments in March and April, back to normal levels thereafter
Many government guaranteedloans were granted from April to June 2020, stable developmentsince then Guaranteed volume (mill NOK)
Number of loans
Utilisation of the guarantee scheme (per cent, rhs)
33

Robust loan portfolio: 68% to wage-earners
Low exposure to the hardest hit sectors
Loan distribution
17%
11%
4%68%
Wage-earners
Moderate effect
Weak effect
Strong effect
79.2
46.3
16.6
9.6
8.1
5.4
4.8
4.0
3.4
2.8
2.8
2.3
Transport and other services
Mortgages sold to Boligkreditt
Fishery
Wage-earners
Commercial property
Forestry and agriculture
Maritime / offshore
Construction
Business services
Manufacturing
Retail trade, hotels
Aquaculture
Loan portfolio per 31.03.21 (bNOK)
4,1
4,4
1,9
0,6
-0,1
0,5
-0,4
0,2
1,3
0,6
0,2
1,2
Changes last 12 months (bNOK)
34
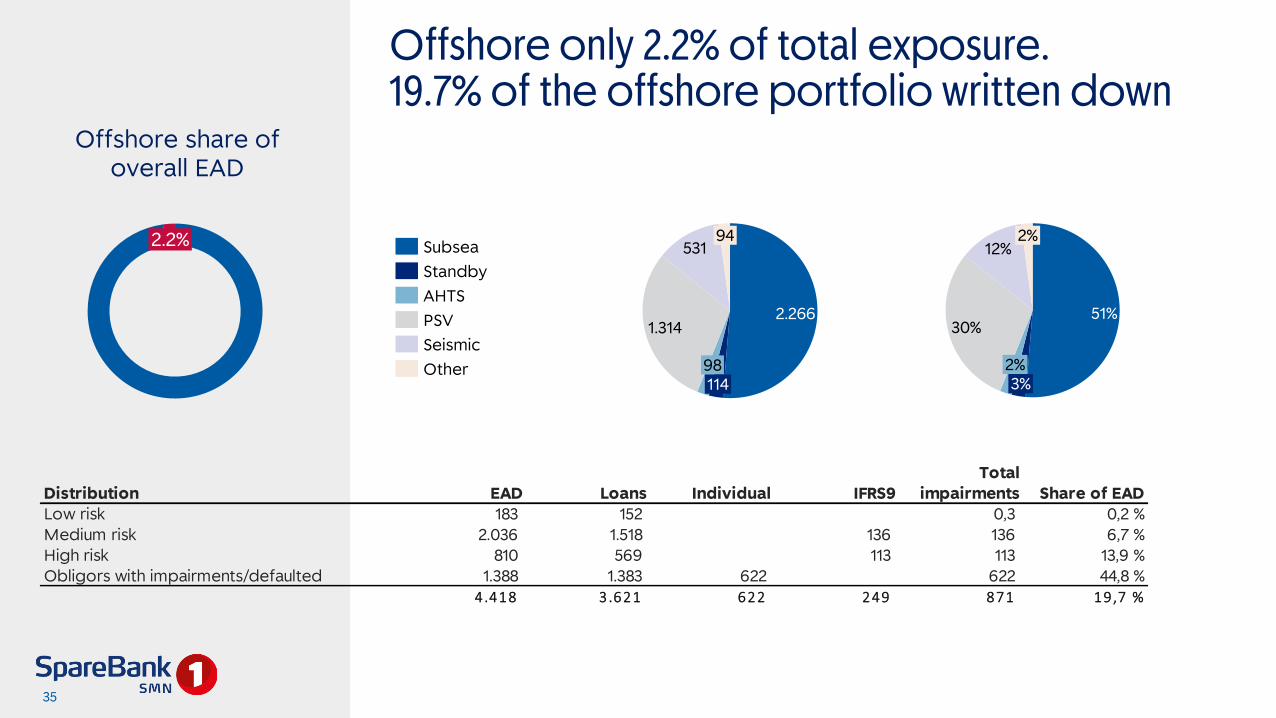
Offshore only 2.2% of total exposure. 19.7% of the offshore portfolio written down
Offshore share ofoverall EAD
2.2% 94
2.266
98114
1.314
531
51%30%
12%
3%2%
2%
Distribution EAD Loans Individual IFRS9Total
impairments Share of EADLow risk 183 152 0,3 0,2 %Medium risk 2.036 1.518 136 136 6,7 %High risk 810 569 113 113 13,9 %Obligors with impairments/defaulted 1.388 1.383 622 622 44,8 %
4.418 3 .621 622 249 871 19 ,7 %
Standby
AHTS
Subsea
Seismic
Other
PSV
35

Reduced losses in first quarter
Distribution of losses
Hvor finner jeg gode produktbilder?
Losses in Q1 back to pre-Covid level
Group losses of NOK 59m, of whichNOK 56m from offshore portfolio
Losses so far this year (NOKm)
18
53
59
38
14
16
6
4
7
Offshore general (stage 1 and 2)
Offshore individual (stage 3)
Other general (stage 1 and 2)
Other individual (stage 3)
Losses on corporate portfolio*
Retail general (stage 1 and 2)
Retail individual (stage 3)
SMN Finans
Losses, group
* Incl. agriculture portfolio
1st quarter 202136

Potential problem loans
• New regulatory definiton of defaultincreases stage 3 loans from 2021
• The new definition has not changedthe groups assessment of its creditrisk exposure, hence it has nomaterial effect on losses in Q1 2021
Stage 3 loans to customers in NOKm and in per cent of gross lending
1.880 1.998 2.123 2.1102.747
2.370 2.332 2.255
3.073
1.17 1.22 1.28 1.26
1.61
1,35 1.30
1.66
Q1 19 Q3 19Q2 19 Q4 19 Q1 20 Q2 20 Q3 20 Q4 21 Q1 21
1.23
1st quarter 202137
SpareBank 1 SMN7467 Trondheim
CEO Jan-Frode JansonTel +47 909 75 183E-mail [email protected]
CFO Kjell FordalTel +47 905 41 672E-mail [email protected]
SpareBank 1 SMNTel +47 915 07 300
Internet adressesSMN homepage and internet bankwww.smn.no
Financial calendar 2021Q1 7. May 2021Q2 11. August 2021Q3 29. October 2021

Appendix
1st quarter 2021
1st quarter 202140
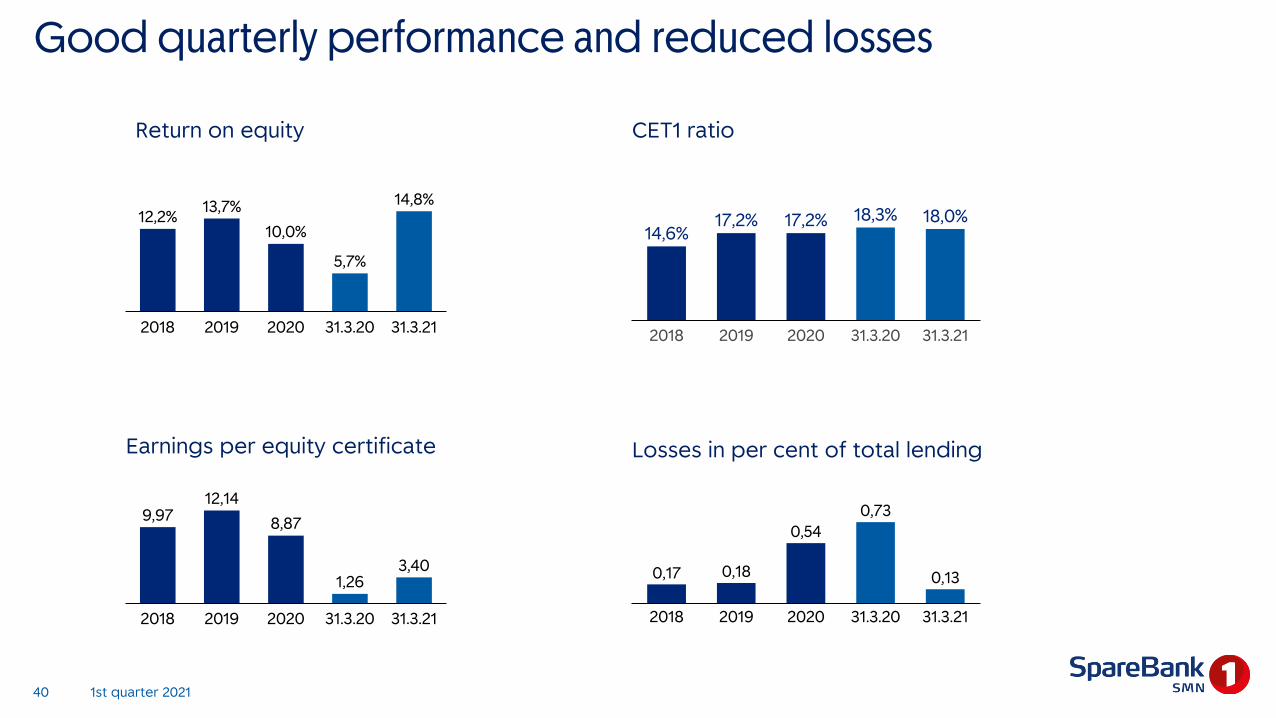
Good quarterly performance and reduced losses
CET1 ratio
Earnings per equity certificate
31.3.212018
10,0%
2019 2020
13,7%
31.3.20
12,2%
5,7%
14,8%17,2%
31.3.212019 20202018 31.3.20
14,6%17,2% 18,3% 18,0%
9,9712,14
8,87
1,263,40
31.3.2020192018 2020 31.3.21
0,17 0,18
0,540,73
0,13
31.3.212018 2019 2020 31.3.20
Return on equity
Losses in per cent of total lending

Commission income
mill kr Q1 21 Q4 20 Q3 20 Q2 20 Q1 20
Payment transmission income 49 56 54 51 59
Creditcards 14 14 15 15 16
Commissions savings and asset management 32 32 27 28 22
Commissions insurance 52 51 49 48 47
Guarantee commissions 14 6 14 15 13
Estate agency 103 93 111 105 83
Accountancy services 148 111 105 141 148
Securities 275 245 122 129 81
Other commissions 5 9 9 17 10
Commissions ex. Bolig/Næringskreditt 693 617 506 548 479
Commissions Boligkreditt (cov. bonds) 112 136 128 57 88
Commissions Næringskreditt (cov. bonds) 4 4 4 2 4
Total commission income 808 757 638 607 570
1st quarter 202141
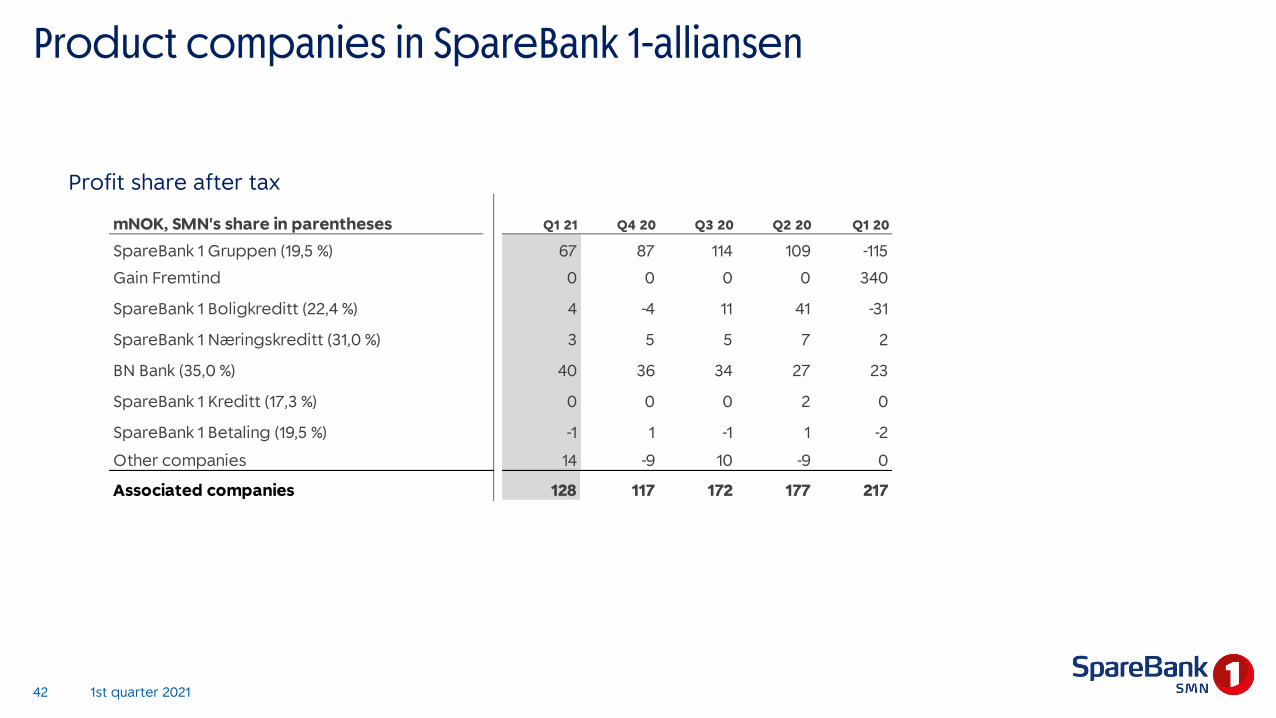
Product companies in SpareBank 1-alliansen
Profit share after tax
mNOK, SMN's share in parentheses Q1 21 Q4 20 Q3 20 Q2 20 Q1 20
SpareBank 1 Gruppen (19,5 %) 67 87 114 109 -115
Gain Fremtind 0 0 0 0 340
SpareBank 1 Boligkreditt (22,4 %) 4 -4 11 41 -31
SpareBank 1 Næringskreditt (31,0 %) 3 5 5 7 2
BN Bank (35,0 %) 40 36 34 27 23
SpareBank 1 Kreditt (17,3 %) 0 0 0 2 0
SpareBank 1 Betaling (19,5 %) -1 1 -1 1 -2
Other companies 14 -9 10 -9 0
Associated companies 128 117 172 177 217
1st quarter 202142

Return on financial investments
NOKm Q1 21 Q4 20 Q3 20 Q2 20 Q1 20
Stocks 102 -3 4 36 -42
Sertificates and bonds -84 -62 -8 124 50
Derivatives 105 110 19 51 -148
Financial instruments related to hedging -11 1 4 2 -6
Other financial instruments at fair value 10 2 -2 45 -57
Foreign exchange 15 3 11 4 65
Stocks and share derivatives at SpareBank 1 Markets 20 2 5 7 14
Net return on financial instruments 158 53 32 269 -124
1st quarter 202143

Balance sheet
31.3.21 31.3.20 31.3.19
Funds available 40,4 35,5 29,8
Net loans 135,9 126,1 119,3
Securities 2,1 1,4 2,0
Investment in related companies 7,4 6,7 6,4
Goodwill 0,9 0,9 0,8
Other assets 7,2 14,6 6,2
Total Assets 193,8 185,2 164,6
Capital market funding 59,4 62,5 54,8
Deposits 102,4 88,2 81,1
Other liabilities 8,5 12,9 7,8
Subordinated debt 1,8 2,1 2,3
Equity ex hybrid bonds 20,5 18,3 17,7
Hybrid bonds 1,3 1,3 1,0
Total liabilities and equity 193,8 185,2 164,6
in addition loans sold to Boligkreditt and Næringskreditt 47,9 43,5 41,0
1st quarter 202144

Equity certificate, key figures
31.3.21 31.3.20 2020 2019 2018 2017
ECC ratio 64,0 % 64,0 % 64,0 % 64,0 % 64,0 % 64,0 %
Total issued ECCs (mill) 129,22 129,22 129,39 129,30 129,62 129,38
ECC price 107,40 67,60 97,60 100,20 84,20 82,25
Market value (NOKm) 13.878 8.735 12.629 12.956 10.914 10.679
Booked equity capital per ECC 96,70 86,85 94,71 90,75 83,87 78,81
Post-tax earnings per ECC, in NOK 3,40 1,26 8,87 12,14 9,97 8,71
Dividend per ECC 4,40 5,00 5,10 4,40
P/E 7,91 13,46 11,01 8,26 8,44 9,44
Price / Booked equity capital 1,11 0,78 1,03 1,10 1,00 1,04
1st quarter 202145

Good access to capital market financing
Maturity structure as at 31 March 2021 (NOK bn)
Comments
5,5 6,69,1
4,6
24,4
20242021 2022 2023 2025 ->
3,8
0,6 1,1
5,1
1,00,4
1,8
Q222Q221 Q321 Q123Q421 Q122 Q322 Q422
0,0
• Boligkreditt is a significant source of funding; mortgages totalling NOK 46bn sold as at 31 March 2021
• Total maturing over next 2 years NOK 14.1bn:• NOK 5.5bn in 2021• NOK 6.5bn in 2022• NOK 1.8bn in Q1 23
• LCR 190% as at 31 March 2021
• SpareBank 1 SMN issued senior non-preferred debt (MREL) worth NOK 1bn in September 2020 and NOK 1.5bn in January 2021
• SpareBank 1 SMN issued in February 2021 a green senior bond of EUR 500m with a 7-year maturity
1st quarter 202146
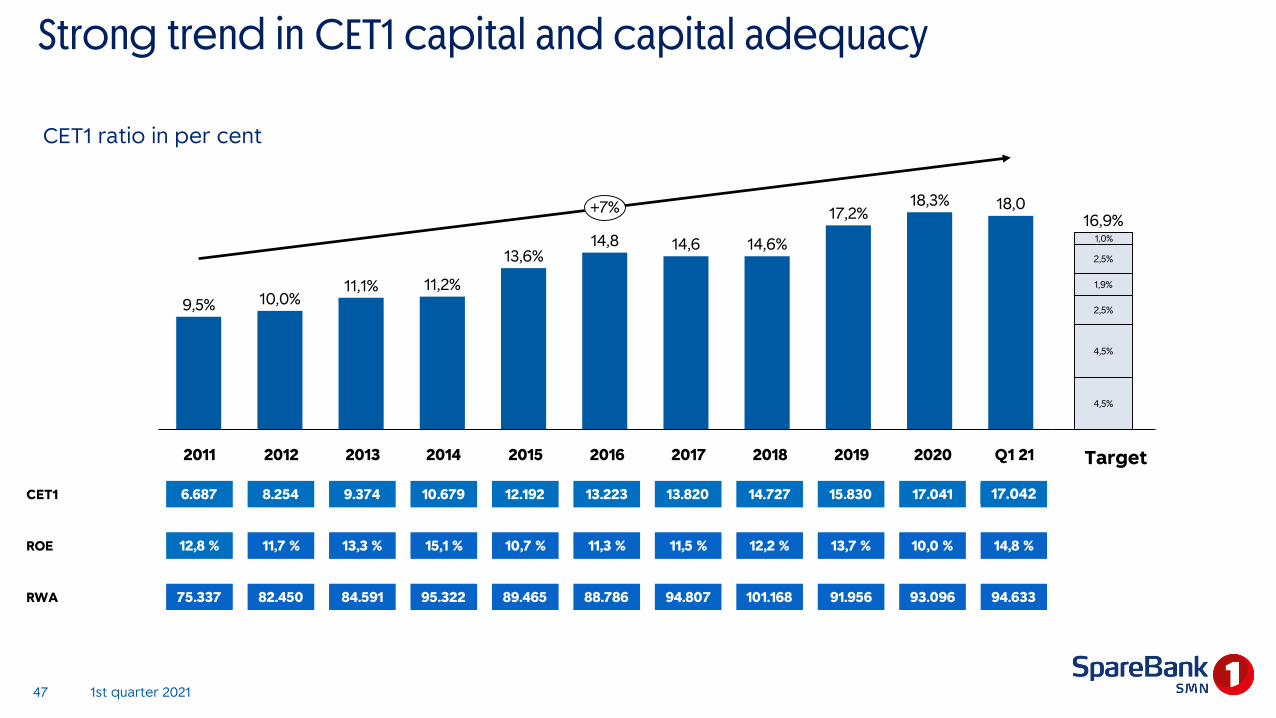
Strong trend in CET1 capital and capital adequacy
14,6
18,0
10,0%11,2%
13,6%
9,5%11,1%
14,8 14,6%
17,2%18,3%+7%
4,5%
4,5%
2,5%
1,9%
2,5%
1,0%
16,9%
Systemrisikobuffer
Ledelsesbuffer
Pilar 2
Motsyklisk
Bevaringsbuffer
Ren kjernekapital
CET1 ratio in per cent
Target2011 2012 2013 2014 2015 2016 2017 2018 2019 2020 Q1 21
CET1 6.687 8.254 9.374 10.679 12.192 13.223 13.820 14.727 15.830 17.041 17.040
ROE 12,8 % 11,7 % 13,3 % 15,1 % 10,7 % 11,3 % 11,5 % 12,2 % 13,7 % 10,0 % 14,8 %
RWA 75.337 82.450 84.591 95.322 89.465 88.786 94.807 101.168 91.956 93.096 94.633
1st quarter 202147
17.042

New group management team shows business orientation and thegroup’s breadth
Group CEO____________________________________________________________________
Jan-Frode Janson
Risk Management____________________________________________________________________
Ola Neråsen
Communication and Society____________________________________________________________________
Rolf Jarle Brøske
Technology and Development____________________________________________________________________
Astrid Undheim
SpareBank1
Regnskapshuset SMN____________________________________________________________________
Arne Nypan
• Additional parts of the business nowrepresented on the group management team – increased focus on the customerand the business, and closercollaboration between the business lines
• New group-wide units created –increased power to strategic focal areas, and efficiency gains across the groupcompanies
• Transition from management anchored in the bank to management anchored in thegroup
• A better and more cost-efficientorganisation – further elaboration of theorganisation in keeping with «One SMN» over past half-yearGroup Finance and
Governance_________________________________________________________________
___
Kjell Fordal
EiendomsMegler 1
Midt-Norge_________________________________________________________________
___
Kjetil Reinsberg
Corporate Banking_________________________________________________________________
___
Vegard Helland
Retail Banking_________________________________________________________________
___
Nelly Maske
1st quarter 202148

Sr. unsec. ratings Moody’s
SpareBank 1 SMN A1 / P-1
SpareBank 1 SR A1 / P-1
SpareBank 1 SNN Aa3 / P-1
SpareBank 1 Østlandet Aa3 / P-1
SpareBank 1-alliansenStrong position nationally, regional focus
• SpareBank 1-alliansen consists of 14 banks• Operates exclusively in Norway. The bank grouping in
Norway with the most bank branches (about 350)• The SpareBank 1 banks are far to the fore in digitalisation
and technological development• The SpareBank 1 banks are independent banks in their
respective regions• They are market leaders in their most important regional
market areas• The largest of them (~ 80% of total assets) have the
following rating:
1st quarter 202149

SpareBank 1 SMN
SpareBank 1 SR-Bank
SpareBank 1 Nord-Norge SamSpar SpareBank 1
Østlandet LO
BN Bank SB 1 Boligkreditt
SB 1 Næringskreditt
SpareBank 1 Gruppen
SpareBank 1Fremtind (65 %)
ODIN
SpareBank 1Forsikring
SpareBank 1 Factoring
Spar
eBa
nk 1
Alli
anse
n co
mp
anie
sM
em
be
rs
Sales, loan portfolios, capitalProducts, commissions, dividend
The banks collaborate on: Brand building, technology, procurement, innovation
SpareBank 1 Kreditt
SB 1 Betaling, (Vipps)
Spare Bank 1-alliansen
1st quarter 202150


