Fiscal Year 2017 (ending March 31, 2018)
Third Quarter Results (ended December 31, 2017)
Brother Industries, Ltd. February 7, 2018
Information on this report, other than historical facts, refers to future prospects and performance, and has been prepared by our Management on the basis of information available at the time of the announcement. This covers various risks, including, but not limited to, economic conditions, customer demand, foreign currency exchange rates, tax rules, regulation and other factors. As a result, actual future performance may differ from any forecasts contained on this report.
© 2018 Brother Industries, Ltd. All Rights Reserved.
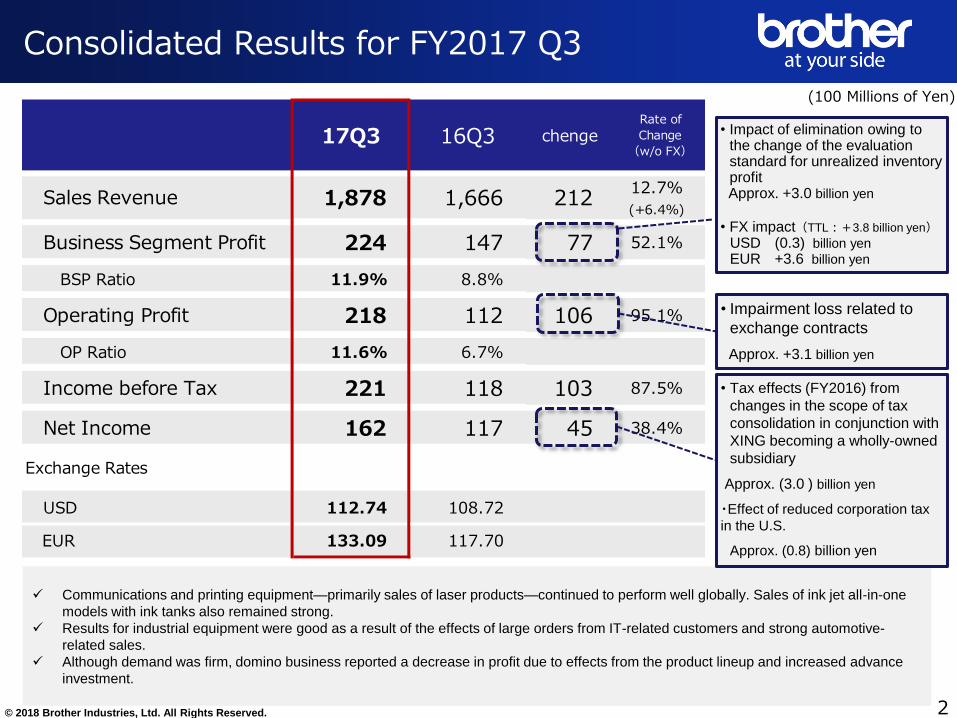
17Q3 16Q3 chengeRate of
Change
(w/o FX)
12.7%
(+6.4%)
Business Segment Profit 224 147 77 52.1%
BSP Ratio 11.9% 8.8%
Operating Profit 218 112 106 95.1%
OP Ratio 11.6% 6.7%
Income before Tax 221 118 103 87.5%
Net Income 162 117 45 38.4%
Exchange Rates
USD 112.74 108.72
USDEUR 133.09 117.70
212Sales Revenue 1,878 1,666
2
Communications and printing equipment—primarily sales of laser products—continued to perform well globally. Sales of ink jet all-in-one
models with ink tanks also remained strong.
Results for industrial equipment were good as a result of the effects of large orders from IT-related customers and strong automotive-
related sales.
Although demand was firm, domino business reported a decrease in profit due to effects from the product lineup and increased advance
investment.
• Impairment loss related to
exchange contracts
Approx. +3.1 billion yen
• Impact of elimination owing to the change of the evaluation standard for unrealized inventory profit
Approx. +3.0 billion yen
• FX impact(TTL:+3.8 billion yen)
USD (0.3) billion yen
EUR +3.6 billion yen
Consolidated Results for FY2017 Q3
(100 Millions of Yen)
• Tax effects (FY2016) from
changes in the scope of tax
consolidation in conjunction with
XING becoming a wholly-owned
subsidiary
Approx. (3.0 ) billion yen
・Effect of reduced corporation tax
in the U.S.
Approx. (0.8) billion yen

© 2018 Brother Industries, Ltd. All Rights Reserved. 3
Main Factors for Changes in Business Segment Profit 17Q3
© 2018 Brother Industries, Ltd. All Rights Reserved.
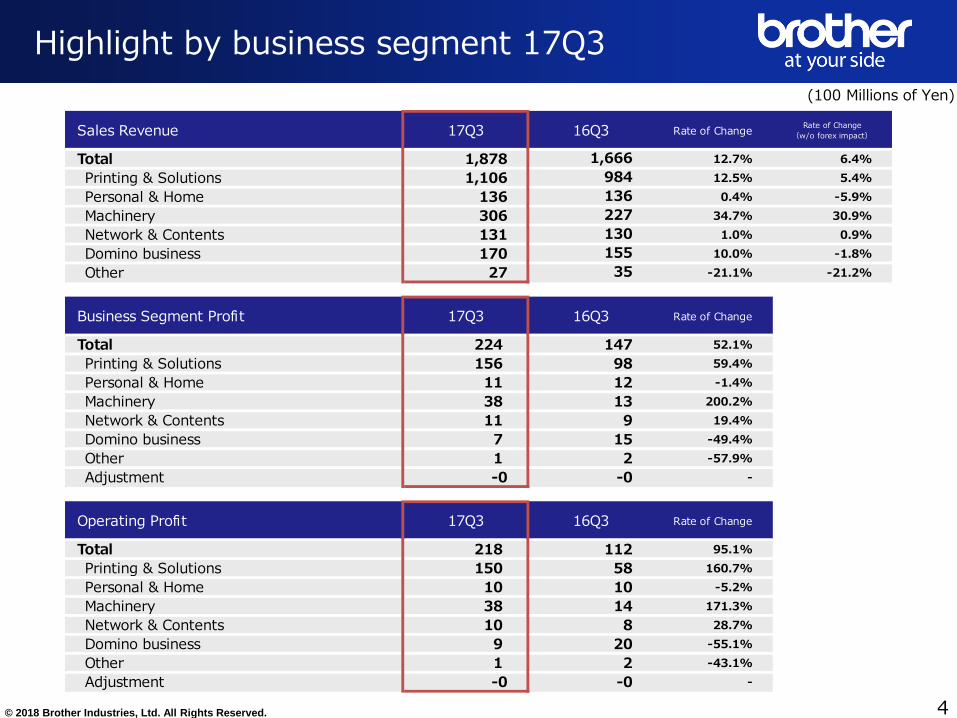
Sales Revenue 17Q3 16Q3 Rate of ChangeRate of Change
(w/o forex impact)
Total 1,878 1,666 12.7% 6.4%
Printing & Solutions 1,106 984 12.5% 5.4%
Personal & Home 136 136 0.4% -5.9%
Machinery 306 227 34.7% 30.9%
Network & Contents 131 130 1.0% 0.9%
Domino business 170 155 10.0% -1.8%
Other 27 35 -21.1% -21.2%
Business Segment Profit 17Q3 16Q3 Rate of Change
Total 224 147 52.1%
Printing & Solutions 156 98 59.4%
Personal & Home 11 12 -1.4%
Machinery 38 13 200.2%
Network & Contents 11 9 19.4%
Domino business 7 15 -49.4%
Other 1 2 -57.9%
Adjustment -0 -0 -
Operating Profit 17Q3 16Q3 Rate of Change
Total 218 112 95.1%
Printing & Solutions 150 58 160.7%
Personal & Home 10 10 -5.2%
Machinery 38 14 171.3%
Network & Contents 10 8 28.7%
Domino business 9 20 -55.1%
Other 1 2 -43.1%
Adjustment -0 -0 -
4
Highlight by business segment 17Q3
(100 Millions of Yen)
© 2018 Brother Industries, Ltd. All Rights Reserved.
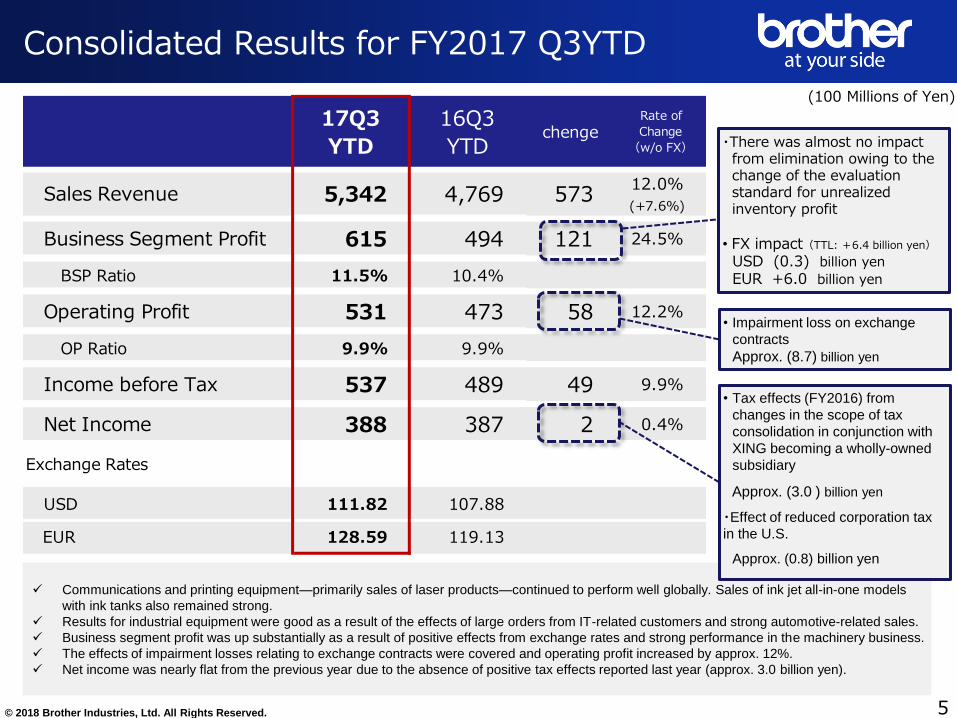
17Q3
YTD
16Q3
YTDchenge
Rate of
Change
(w/o FX)
12.0%
(+7.6%)
Business Segment Profit 615 494 121 24.5%
BSP Ratio 11.5% 10.4%
Operating Profit 531 473 58 12.2%
OP Ratio 9.9% 9.9%
Income before Tax 537 489 49 9.9%
Net Income 388 387 2 0.4%
Exchange Rates
USD 111.82 107.88
USDEUR 128.59 119.13
Sales Revenue 5,342 4,769 573
5
・There was almost no impact from elimination owing to the change of the evaluation standard for unrealized inventory profit • FX impact(TTL: +6.4 billion yen)
USD (0.3) billion yen
EUR +6.0 billion yen
• Impairment loss on exchange
contracts
Approx. (8.7) billion yen
Communications and printing equipment—primarily sales of laser products—continued to perform well globally. Sales of ink jet all-in-one models
with ink tanks also remained strong.
Results for industrial equipment were good as a result of the effects of large orders from IT-related customers and strong automotive-related sales.
Business segment profit was up substantially as a result of positive effects from exchange rates and strong performance in the machinery business.
The effects of impairment losses relating to exchange contracts were covered and operating profit increased by approx. 12%.
Net income was nearly flat from the previous year due to the absence of positive tax effects reported last year (approx. 3.0 billion yen).
Consolidated Results for FY2017 Q3YTD
(100 Millions of Yen)
• Tax effects (FY2016) from
changes in the scope of tax
consolidation in conjunction with
XING becoming a wholly-owned
subsidiary
Approx. (3.0 ) billion yen
・Effect of reduced corporation tax
in the U.S.
Approx. (0.8) billion yen

© 2018 Brother Industries, Ltd. All Rights Reserved. 6
Main Factors for Changes in Business Segment Profit 17Q3YTD
494
615
+137+64
-18 -1-33
-28
2016Q3YTD
Business Segment
Profit
Diff.
in sales
Price
change
Cost
change
Forex
impact
SG&A R&D
expense
2017Q3YTD
Business Segment
Profit
100 Millions of Yen
+121(+24.5%)
© 2018 Brother Industries, Ltd. All Rights Reserved.
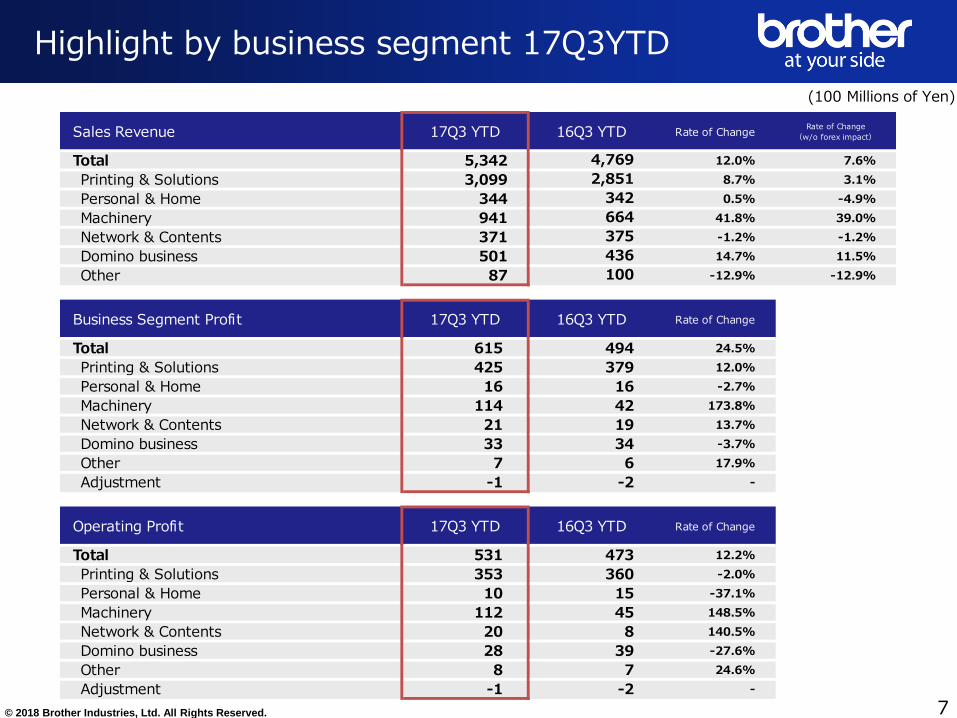
Sales Revenue 17Q3 YTD 16Q3 YTD Rate of ChangeRate of Change
(w/o forex impact)
Total 5,342 4,769 12.0% 7.6%
Printing & Solutions 3,099 2,851 8.7% 3.1%
Personal & Home 344 342 0.5% -4.9%
Machinery 941 664 41.8% 39.0%
Network & Contents 371 375 -1.2% -1.2%
Domino business 501 436 14.7% 11.5%
Other 87 100 -12.9% -12.9%
Business Segment Profit 17Q3 YTD 16Q3 YTD Rate of Change
Total 615 494 24.5%
Printing & Solutions 425 379 12.0%
Personal & Home 16 16 -2.7%
Machinery 114 42 173.8%
Network & Contents 21 19 13.7%
Domino business 33 34 -3.7%
Other 7 6 17.9%
Adjustment -1 -2 -
Operating Profit 17Q3 YTD 16Q3 YTD Rate of Change
Total 531 473 12.2%
Printing & Solutions 353 360 -2.0%
Personal & Home 10 15 -37.1%
Machinery 112 45 148.5%
Network & Contents 20 8 140.5%
Domino business 28 39 -27.6%
Other 8 7 24.6%
Adjustment -1 -2 -
7
Highlight by business segment 17Q3YTD
(100 Millions of Yen)

© 2018 Brother Industries, Ltd. All Rights Reserved.
FY17
Forecast
Previous
forecastRate of Change FY16
Rate of Change
(w/o forex
impact)
9.2%
(+6.3%)
Business Segment Profit 725 725 0.0% 608 19.3%
Business Segment Profit Ratio 10.4% 10.4% 9.5%
Operating Profit 660 660 0.0% 592 11.6%
Operating Profit Ratio 9.4% 0.0% 9.2%
Income before Tax 655 655 0.0% 613 6.9%
Net Income 485 485 0.0% 472 2.7%
Adjusted Net Income 485 485 0.0% 430 12.8%
Exchange Rates
USD 110.97 110.97 109.03
EUR 127.63 127.63 119.37
Sales Revenue 7,000 7,000 0.0% 6,412
8
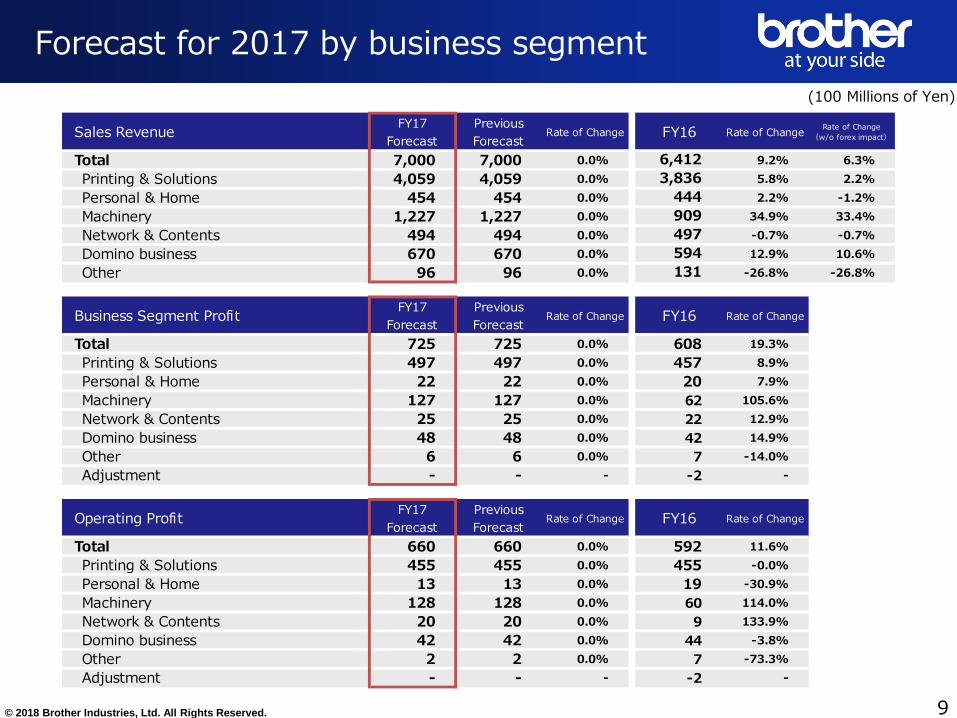
・Based on progress made through the third quarter, there are no changes to the previous forecast of results for the year.
・The exchange rate assumptions for the forecast period remain 110 yen per U.S. dollar and 128 yen per Euro.
・There are no changes to the forecasts by business segment or region.
Forecast for FY2017
(100 Millions of Yen)
© 2018 Brother Industries, Ltd. All Rights Reserved.
Sales RevenueFY17
Forecast
Previous
ForecastRate of Change FY16 Rate of Change
Rate of Change
(w/o forex impact)
Total 7,000 7,000 0.0% 6,412 9.2% 6.3%
Printing & Solutions 4,059 4,059 0.0% 3,836 5.8% 2.2%
Personal & Home 454 454 0.0% 444 2.2% -1.2%
Machinery 1,227 1,227 0.0% 909 34.9% 33.4%
Network & Contents 494 494 0.0% 497 -0.7% -0.7%
Domino business 670 670 0.0% 594 12.9% 10.6%
Other 96 96 0.0% 131 -26.8% -26.8%
Business Segment ProfitFY17
Forecast
Previous
ForecastRate of Change FY16 Rate of Change
Total 725 725 0.0% 608 19.3%
Printing & Solutions 497 497 0.0% 457 8.9%
Personal & Home 22 22 0.0% 20 7.9%
Machinery 127 127 0.0% 62 105.6%
Network & Contents 25 25 0.0% 22 12.9%
Domino business 48 48 0.0% 42 14.9%
Other 6 6 0.0% 7 -14.0%
Adjustment - - - -2 -
Operating ProfitFY17
Forecast
Previous
ForecastRate of Change FY16 Rate of Change
Total 660 660 0.0% 592 11.6%
Printing & Solutions 455 455 0.0% 455 -0.0%
Personal & Home 13 13 0.0% 19 -30.9%
Machinery 128 128 0.0% 60 114.0%
Network & Contents 20 20 0.0% 9 133.9%
Domino business 42 42 0.0% 44 -3.8%
Other 2 2 0.0% 7 -73.3%
Adjustment - - - -2 -
9
Forecast for 2017 by business segment
(100 Millions of Yen)

© 2018 Brother Industries, Ltd. All Rights Reserved.
Appendix

© 2018 Brother Industries, Ltd. All Rights Reserved.
98
156
379425 457
497 497
9.9%14.1%
13.3% 13.7%
11.9% 12.2% 12.2%
16Q3 17Q3 16Q3
YTD
17Q3
YTD
FY16 Previous
Forecast
FY17
Forecast
113 122
333 352
451 475 475
16Q3 17Q3 16Q3
YTD
17Q3
YTD
FY16 Previous
Forecast
FY17
Forecast
871 985
2,5192,746
3,3863,584 3,584
16Q3 17Q3 16Q3
YTD
17Q3
YTD
FY16 Previous
Forecast
FY17
Forecast
16Q3 17Q3 ChangeChange
x FX
16Q3
YTD
17Q3
YTDChange
Change
x FXFY16
Previous
Forecast
FY17
Forecast
Change
v LY
Change
x FX
Sales Revenue 984 1,106 12.5% 5.4% 2,851 3,099 8.7% 3.1% 3,836 4,059 4,059 5.8% 2.2%
Communications & Printing equipment 871 985 13.1% 5.9% 2,519 2,746 9.0% 3.5% 3,386 3,584 3,584 5.9% 2.2%
Americas 323 342 5.7% 1.2% 953 1,007 5.6% 0.7% 1,283 1,339 1,339 4.4% 2.0%
Europe 278 334 20.1% 6.4% 791 873 10.4% 1.8% 1,076 1,169 1,169 8.6% 1.7%
Asia & Others 138 161 17.1% 10.2% 413 476 15.4% 9.4% 546 606 606 10.9% 7.2%
Japan 132 148 12.0% 12.0% 362 390 7.8% 7.8% 480 470 470 -2.1% -2.1%
Electronic stationery 113 122 8.0% 1.2% 333 352 5.8% 0.3% 451 475 475 5.4% 1.9%
Americas 51 53 3.9% -0.3% 158 160 1.8% -2.9% 214 218 218 1.6% -0.6%
Europe 35 39 11.9% -0.6% 97 106 8.7% 0.5% 132 146 146 10.5% 3.5%
Asia & Others 18 21 17.1% 10.0% 50 59 16.7% 10.8% 66 75 75 13.7% 10.1%
Japan 10 9 -1.1% -1.1% 28 27 -1.1% -1.1% 39 37 37 -5.1% -4.5%
Business Segment Profit 98 156 59.4% - 379 425 12.0% - 457 497 497 8.9% -
Operating Profit 58 150 160.7% - 360 353 -2.0% - 455 455 455 0.0% -
11
Printing & Solutions Sales Revenue & Business Segment Profit
(100 Millions of Yen)
<Sales Revenue> Communications & Printing equipment
<Sales Revenue> Electronic stationery
<Business Segment Profit>
© 2018 Brother Industries, Ltd. All Rights Reserved.
12 11 16 16
20 22 22
8.5% 8.3%
4.7% 4.6%4.6% 4.8% 4.8%
16Q3 17Q3 16Q3
YTD
17Q3
YTD
FY16 Previous
Forecast
FY17
Forecast
136 136
342 344
444 454 454
16Q3 17Q3 16Q3
YTD
17Q3
YTD
FY16 Previous
Forecast
FY17
Forecast
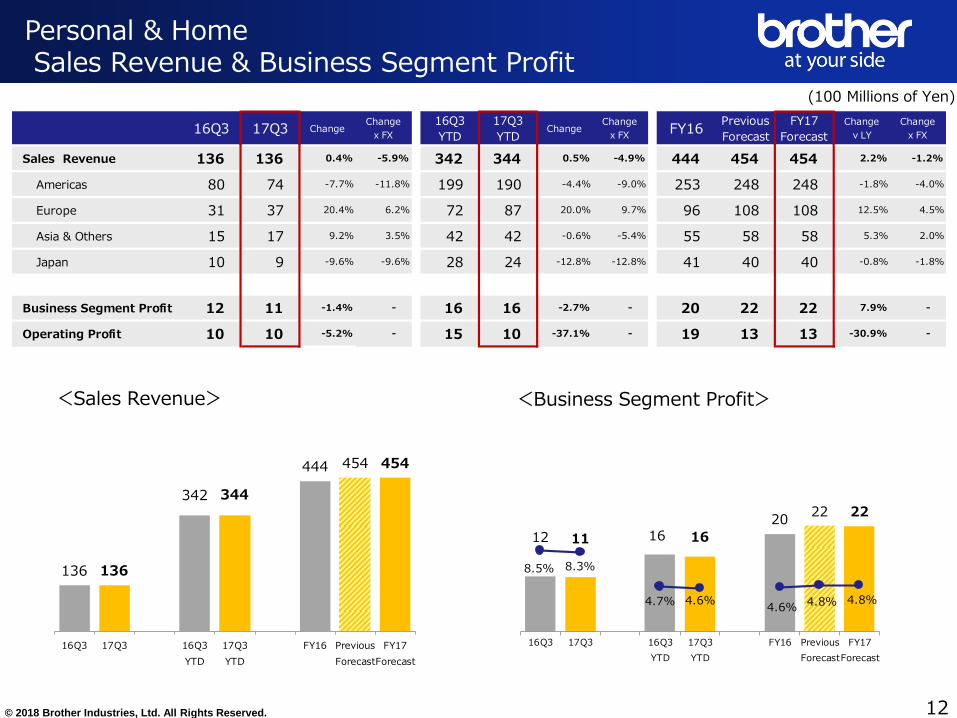
16Q3 17Q3 ChangeChange
x FX
16Q3
YTD
17Q3
YTDChange
Change
x FXFY16
Previous
Forecast
FY17
Forecast
Change
v LY
Change
x FX
Sales Revenue 136 136 0.4% -5.9% 342 344 0.5% -4.9% 444 454 454 2.2% -1.2%
Americas 80 74 -7.7% -11.8% 199 190 -4.4% -9.0% 253 248 248 -1.8% -4.0%
Europe 31 37 20.4% 6.2% 72 87 20.0% 9.7% 96 108 108 12.5% 4.5%
Asia & Others 15 17 9.2% 3.5% 42 42 -0.6% -5.4% 55 58 58 5.3% 2.0%
Japan 10 9 -9.6% -9.6% 28 24 -12.8% -12.8% 41 40 40 -0.8% -1.8%
Business Segment Profit 12 11 -1.4% - 16 16 -2.7% - 20 22 22 7.9% -
Operating Profit 10 10 -5.2% - 15 10 -37.1% - 19 13 13 -30.9% -
12
Personal & Home Sales Revenue & Business Segment Profit
(100 Millions of Yen)
<Sales Revenue> <Business Segment Profit>
© 2018 Brother Industries, Ltd. All Rights Reserved.
1338
42
114
62
127 127
5.6%
12.4%
6.3%
12.1%
6.8%
10.4%10.4%
16Q3 17Q3 16Q3
YTD
17Q3
YTD
FY16 Previous
Forecast
FY17
Forecast
68 88194 228 268 301 301113
168
333
563 454
723 723
4650
137
150188
203 203
16Q3 17Q3 16Q3
YTD
17Q3
YTD
FY16 Previous
Forecast
FY17
Forecast
16Q3 17Q3 ChangeChange
x FX
16Q3
YTD
17Q3
YTDChange
Change
x FX FY16Previous
Forecast
FY17
Forecast
Change
v LY
Change
x FX
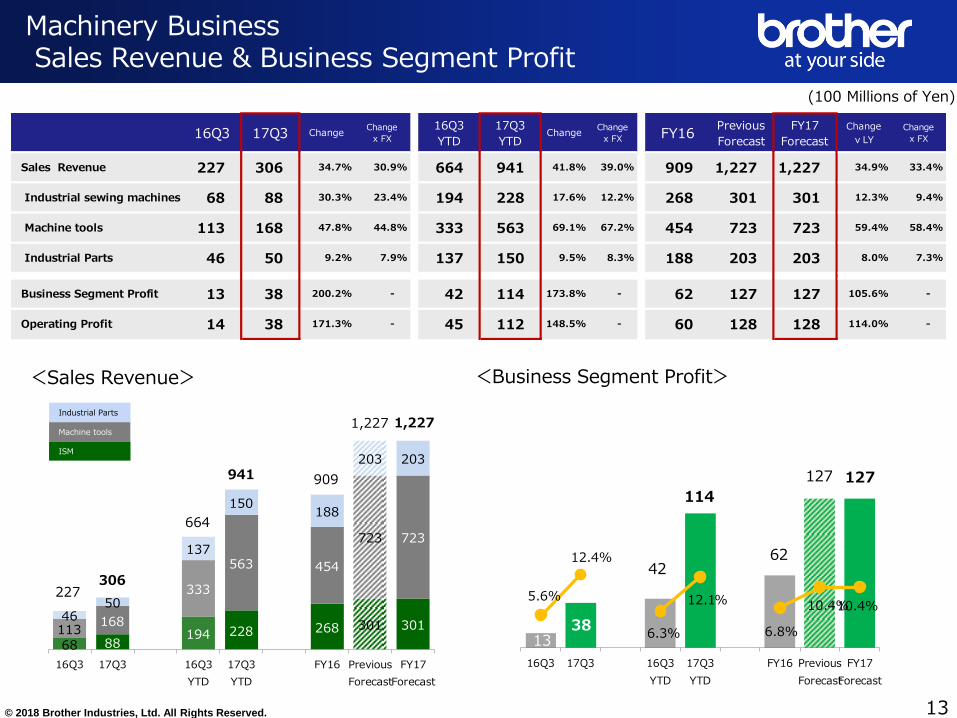
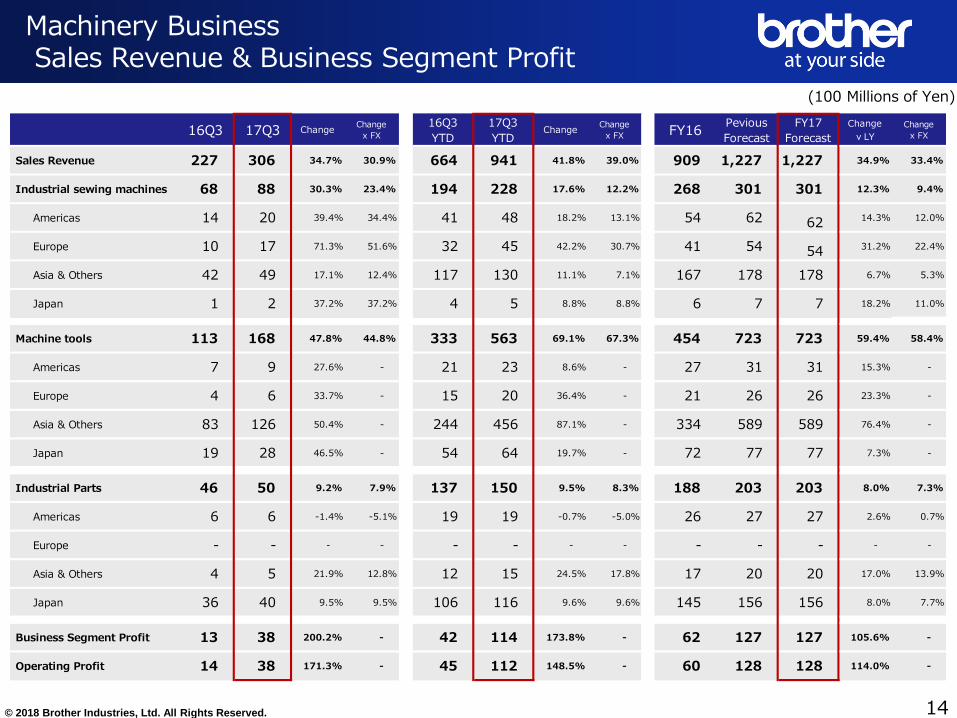
Sales Revenue 227 306 34.7% 30.9% 664 941 41.8% 39.0% 909 1,227 1,227 34.9% 33.4%
Industrial sewing machines 68 88 30.3% 23.4% 194 228 17.6% 12.2% 268 301 301 12.3% 9.4%
Machine tools 113 168 47.8% 44.8% 333 563 69.1% 67.2% 454 723 723 59.4% 58.4%
Industrial Parts 46 50 9.2% 7.9% 137 150 9.5% 8.3% 188 203 203 8.0% 7.3%
Business Segment Profit 13 38 200.2% - 42 114 173.8% - 62 127 127 105.6% -
Operating Profit 14 38 171.3% - 45 112 148.5% - 60 128 128 114.0% -
13
227 306
909
1,227
664
941
Machinery Business Sales Revenue & Business Segment Profit
(100 Millions of Yen)
1,227
<Sales Revenue> <Business Segment Profit>
ISM
Machine tools
Industrial Parts
© 2018 Brother Industries, Ltd. All Rights Reserved.
16Q3 17Q3 ChangeChange
x FX
16Q3
YTD
17Q3
YTDChange
Change
x FX FY16Pevious
Forecast
FY17
Forecast
Change
v LY
Change
x FX
Sales Revenue 227 306 34.7% 30.9% 664 941 41.8% 39.0% 909 1,227 1,227 34.9% 33.4%
Industrial sewing machines 68 88 30.3% 23.4% 194 228 17.6% 12.2% 268 301 301 12.3% 9.4%
Americas 14 20 39.4% 34.4% 41 48 18.2% 13.1% 54 62 62 14.3% 12.0%
Europe 10 17 71.3% 51.6% 32 45 42.2% 30.7% 41 54 54 31.2% 22.4%
Asia & Others 42 49 17.1% 12.4% 117 130 11.1% 7.1% 167 178 178 6.7% 5.3%
Japan 1 2 37.2% 37.2% 4 5 8.8% 8.8% 6 7 7 18.2% 11.0%
Machine tools 113 168 47.8% 44.8% 333 563 69.1% 67.3% 454 723 723 59.4% 58.4%
Americas 7 9 27.6% - 21 23 8.6% - 27 31 31 15.3% -
Europe 4 6 33.7% - 15 20 36.4% - 21 26 26 23.3% -
Asia & Others 83 126 50.4% - 244 456 87.1% - 334 589 589 76.4% -
Japan 19 28 46.5% - 54 64 19.7% - 72 77 77 7.3% -
Industrial Parts 46 50 9.2% 7.9% 137 150 9.5% 8.3% 188 203 203 8.0% 7.3%
Americas 6 6 -1.4% -5.1% 19 19 -0.7% -5.0% 26 27 27 2.6% 0.7%
Europe - - - - - - - - - - - - -
Asia & Others 4 5 21.9% 12.8% 12 15 24.5% 17.8% 17 20 20 17.0% 13.9%
Japan 36 40 9.5% 9.5% 106 116 9.6% 9.6% 145 156 156 8.0% 7.7%
Business Segment Profit 13 38 200.2% - 42 114 173.8% - 62 127 127 105.6% -
Operating Profit 14 38 171.3% - 45 112 148.5% - 60 128 128 114.0% -
14
Machinery Business Sales Revenue & Business Segment Profit
(100 Millions of Yen)
© 2018 Brother Industries, Ltd. All Rights Reserved.
9 11
19
21 22
25 25
6.9% 8.1%
5.0%5.7%
4.5%5.1% 5.1%
16Q3 17Q3 16Q3
YTD
17Q3
YTD
FY16 Previous
Forecast
FY17
Forecast
130 131
375 371
497 494 494
16Q3 17Q3 16Q3
YTD
17Q3
YTD
FY16 Previous
Forecast
FY17
Forecast
16Q3 17Q3 Change16Q3
YTD
17Q3
YTDChange FY16
Previous
Forecast
FY17
Forecast
Change
v LY
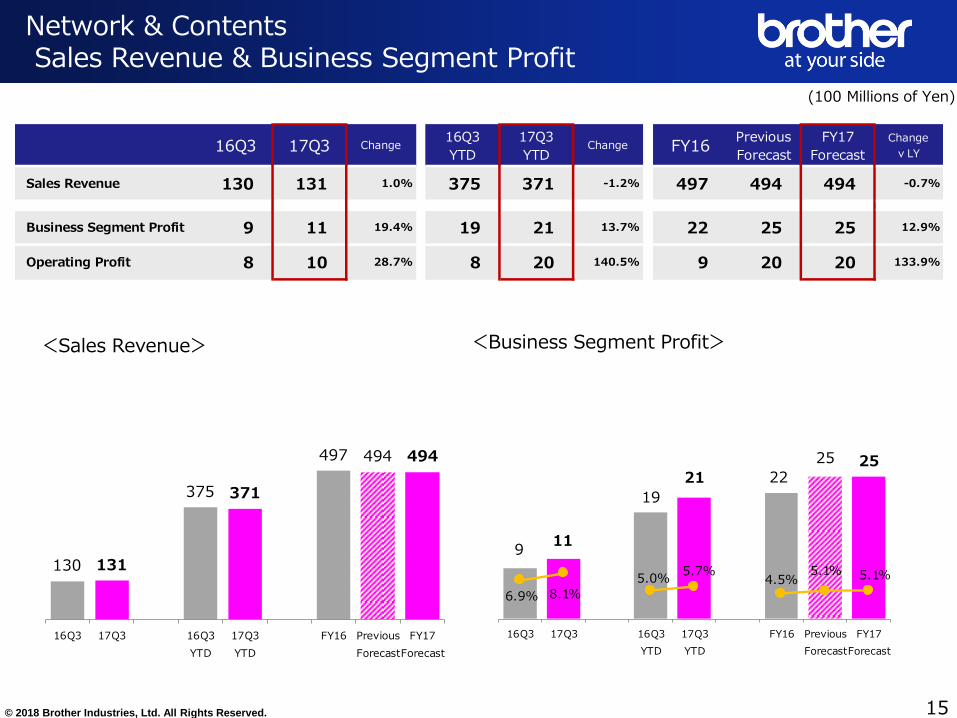
Sales Revenue 130 131 1.0% 375 371 -1.2% 497 494 494 -0.7%
Business Segment Profit 9 11 19.4% 19 21 13.7% 22 25 25 12.9%
Operating Profit 8 10 28.7% 8 20 140.5% 9 20 20 133.9%
15
Network & Contents Sales Revenue & Business Segment Profit
(100 Millions of Yen)
<Sales Revenue> <Business Segment Profit>

© 2018 Brother Industries, Ltd. All Rights Reserved.
15
7
3433
4248 48
9.4%
4.3% 7.7%
6.5%7.0% 7.2% 7.2%
16Q3 17Q3 16Q3
YTD
17Q3
YTD
FY16 Previous
Forecast
FY17
Forecast
155 170
436501
594
670 670
16Q3 17Q3 16Q3
YTD
17Q3
YTD
FY16 Previous
Forecast
FY17
Forecast
16Q3 17Q3 ChangeChange
x FX
16Q3
YTD
17Q3
YTDChange
Change
x FX FY16Previous
Forecast
FY17
Forecast
Change
v LY
Change
x FX
Sales Revenue 155 170 10.0% -1.8% 436 501 14.7% 11.5% 594 670 670 12.9% 10.6%
Americas 42 39 -8.0% -17.3% 110 121 10.4% 6.4% 150 164 164 9.1% 6.0%
Europe 75 85 13.9% 2.4% 208 240 15.1% 11.2% 283 319 319 12.8% 10.0%
Asia & Others 38 47 22.1% 9.8% 119 140 17.8% 13.8% 161 187 187 16.7% 13.7%
Business Segment Profit 15 7 -49.4% - 34 33 -3.7% - 42 48 48 14.9% -
Operating Profit 20 9 -55.1% - 39 28 -27.6% - 44 42 42 -3.8% -
16
Domino Business Sales Revenue & Business Segment Profit
(100 Millions of Yen)
<Sales Revenue> <Business Segment Profit>

© 2018 Brother Industries, Ltd. All Rights Reserved.
1,3751,269
1,133 1,129 1,175 1,124 1,1691,242 1,228
3.9 4.1 4.0 3.93.5 3.5 3.6 3.6 3.4
Dec-15 Mar-16 Jun-16 Sep-16 Dec-16 Mar-17 Jun-17 Sep-17 Dec-17
6692
286
350 350
83 86
338 346 346
104 110
425460 460
17
R&D expenses / Capital expenditure / Depreciation and amortization / Inventories
R&D expenses (100 Millions of Yen)
Capital expenditure / Depreciation & amortization (100 Millions of Yen)
Capital expenditure
Depreciation & amortization
Inventories (100 Millions of yen)
(Number of months) Inventories Inventories / Cost of sales
16Q3 Act
17TY Previous Forecast
16TY Act
17Q3 Act
17TY Fct
16Q3 Act
17TY Previous Forecast
16TY Act
17Q3 Act
17TY Fct