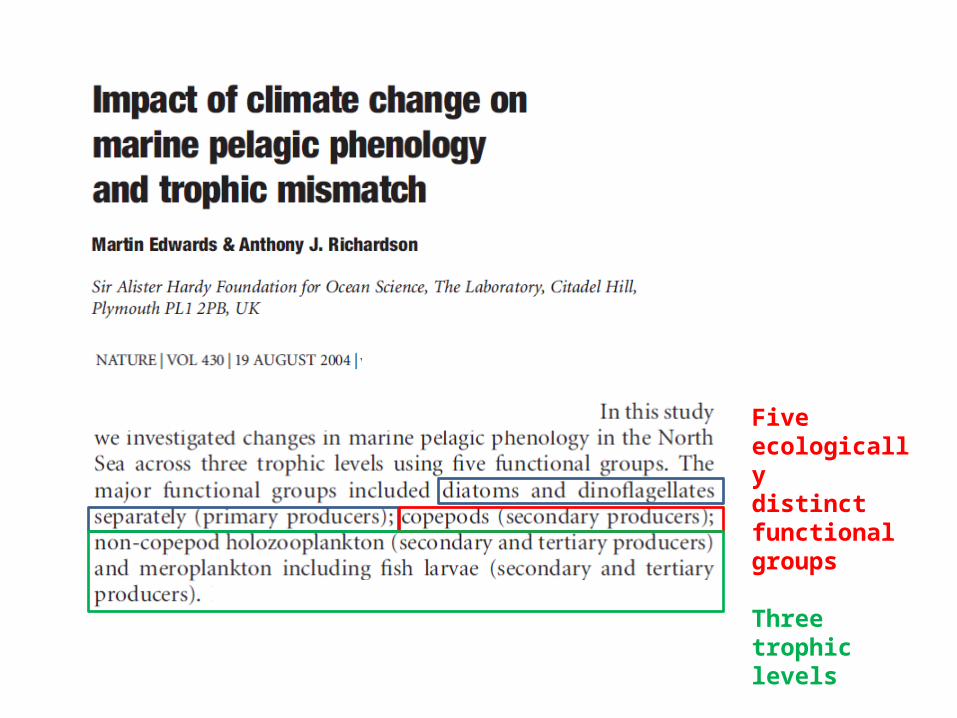
Five ecologicallydistinct functional groups
Three trophic levels
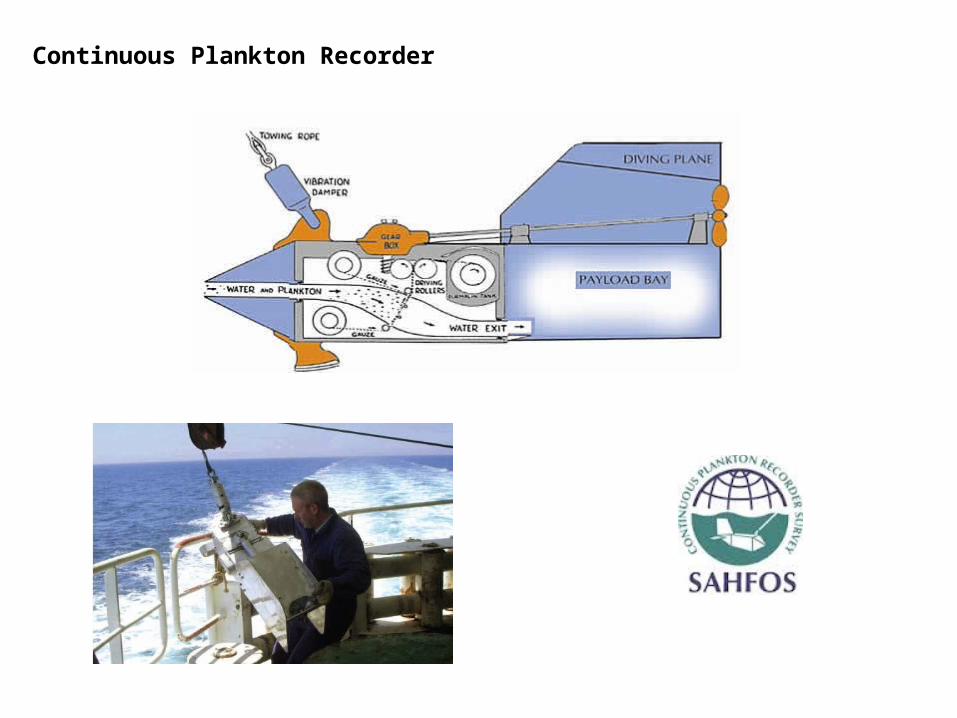
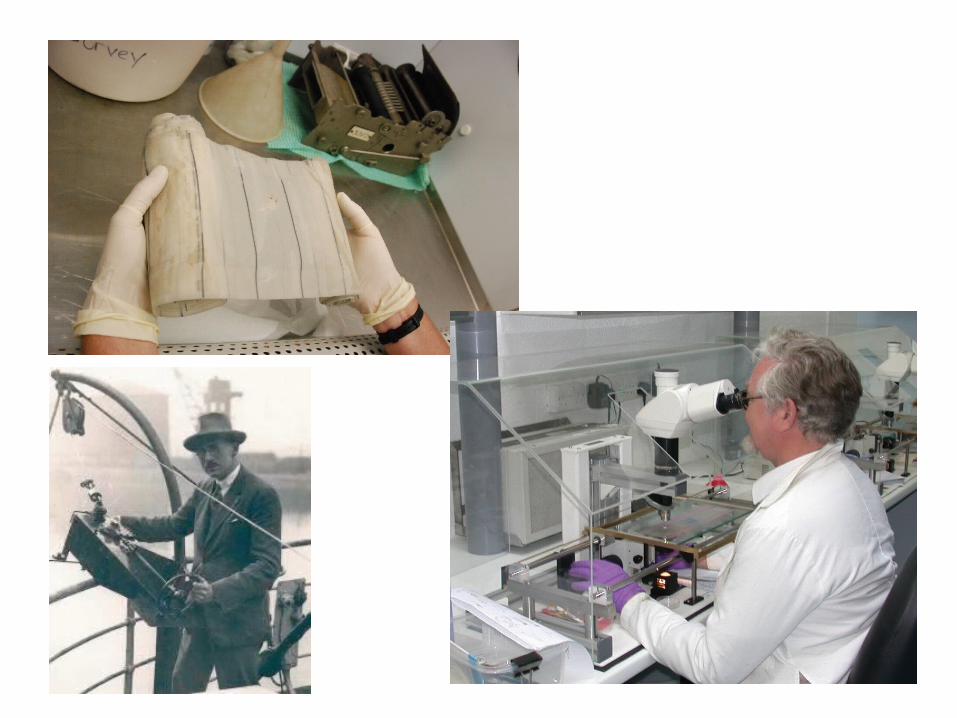
Continuous Plankton Recorder
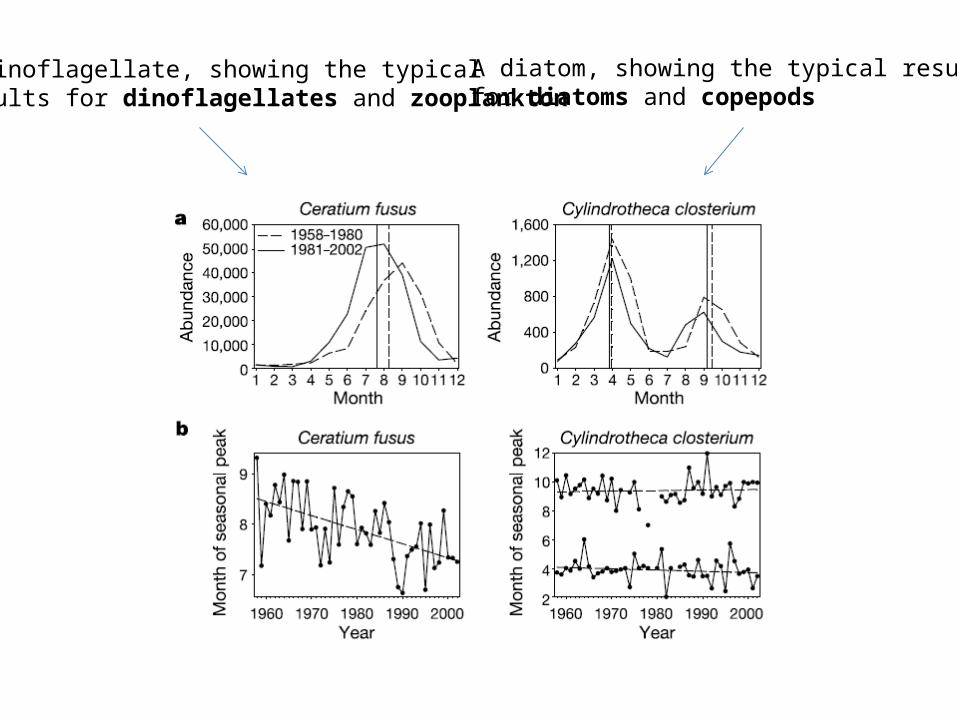
A diatom, showing the typical results for diatoms and copepods
A dinoflagellate, showing the typical results for dinoflagellates and zooplankton
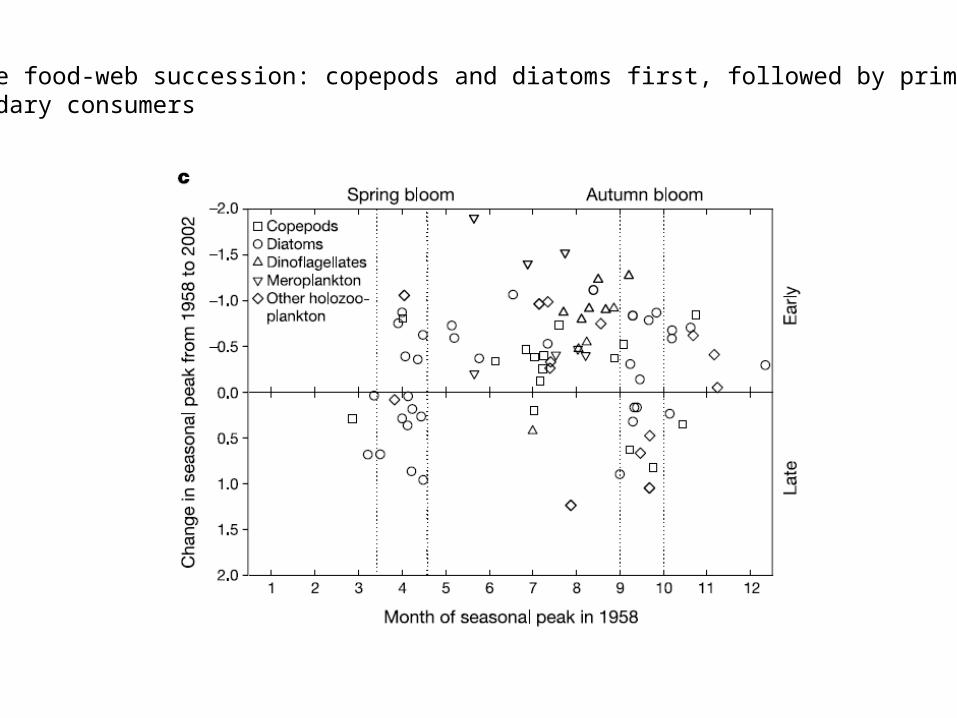
Marine food-web succession: copepods and diatoms first, followed by primary and secondary consumers

Little shift in mean seasonal peak – peak during turnover in water column responding to photoperiod cues
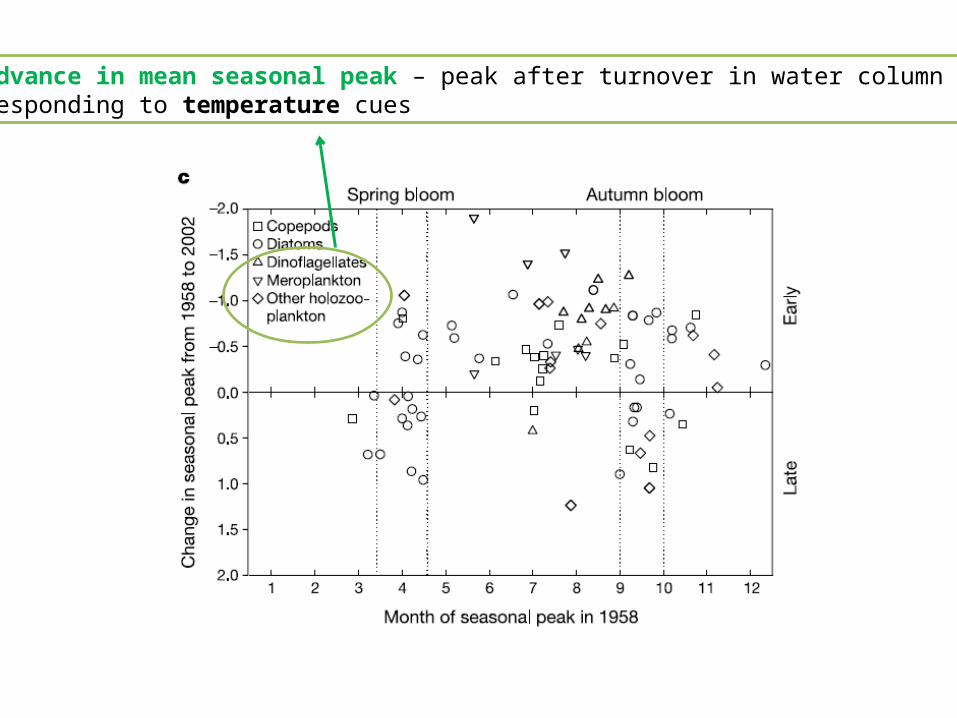
Advance in mean seasonal peak – peak after turnover in water column responding to temperature cues
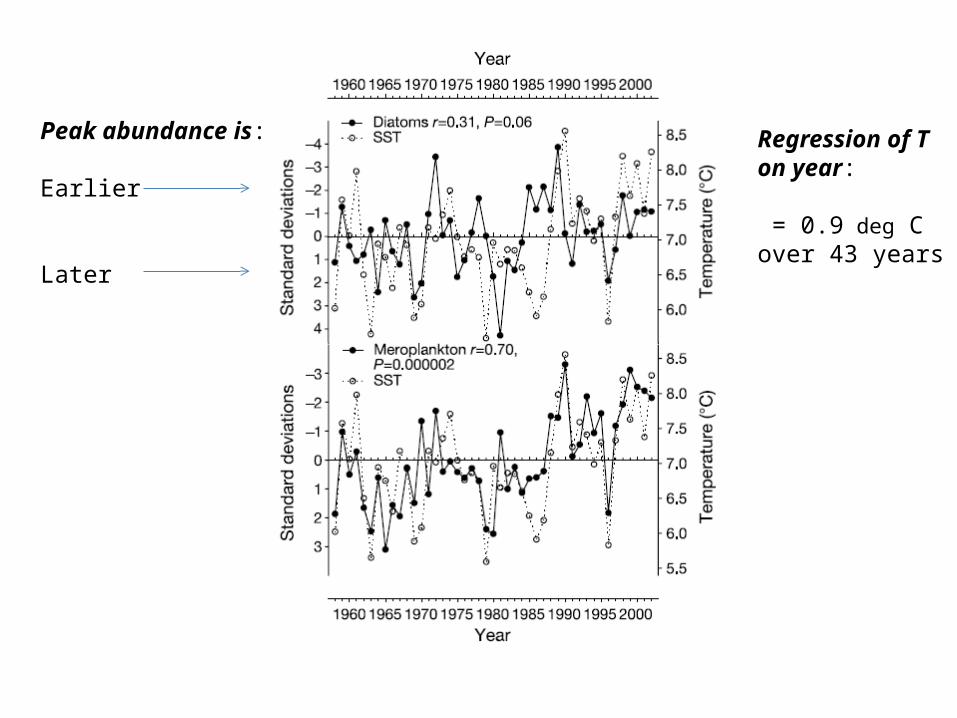
Peak abundance is:
Earlier
Later
Regression of Ton year:
= 0.9 deg Cover 43 years
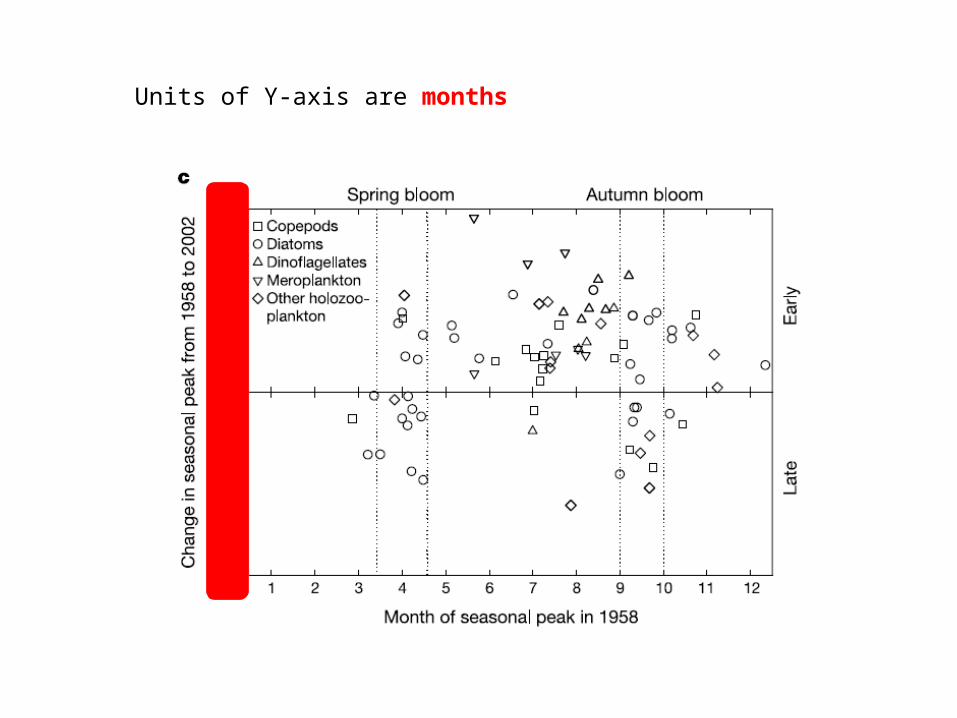
Units of Y-axis are months
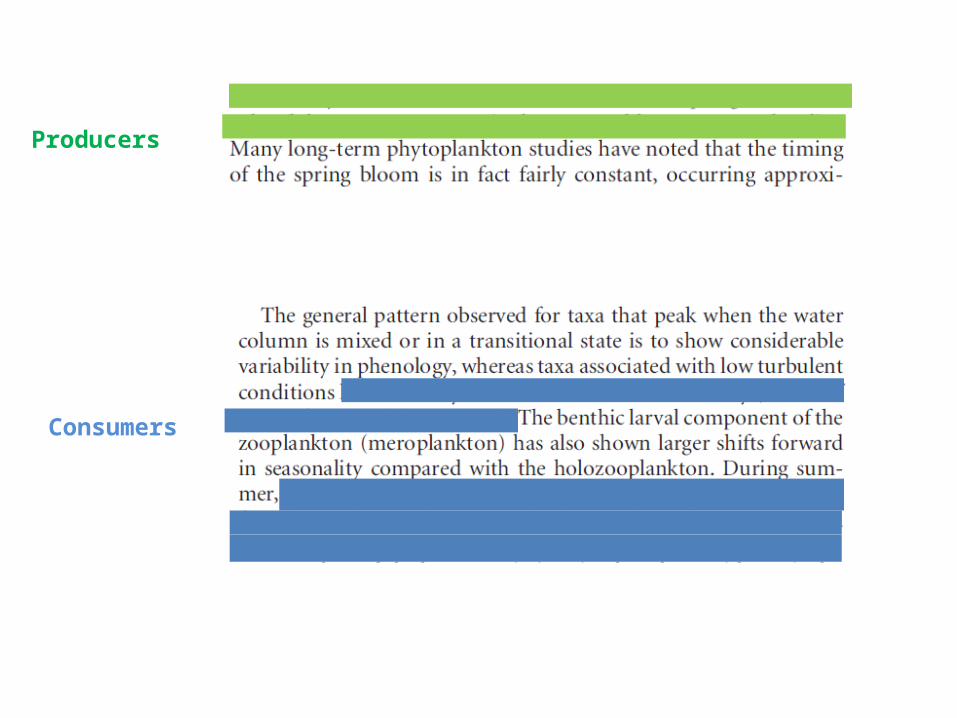
Producers
Consumers
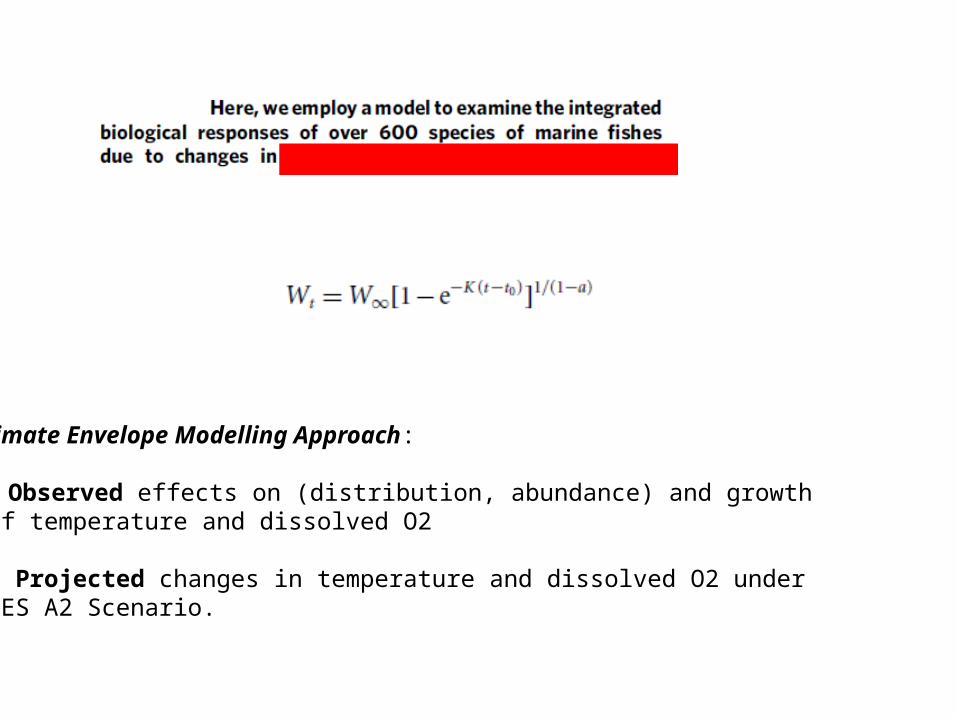
Climate Envelope Modelling Approach:
1. Observed effects on (distribution, abundance) and growth of temperature and dissolved O2
2. Projected changes in temperature and dissolved O2 under SRES A2 Scenario.

Cod
Haddock
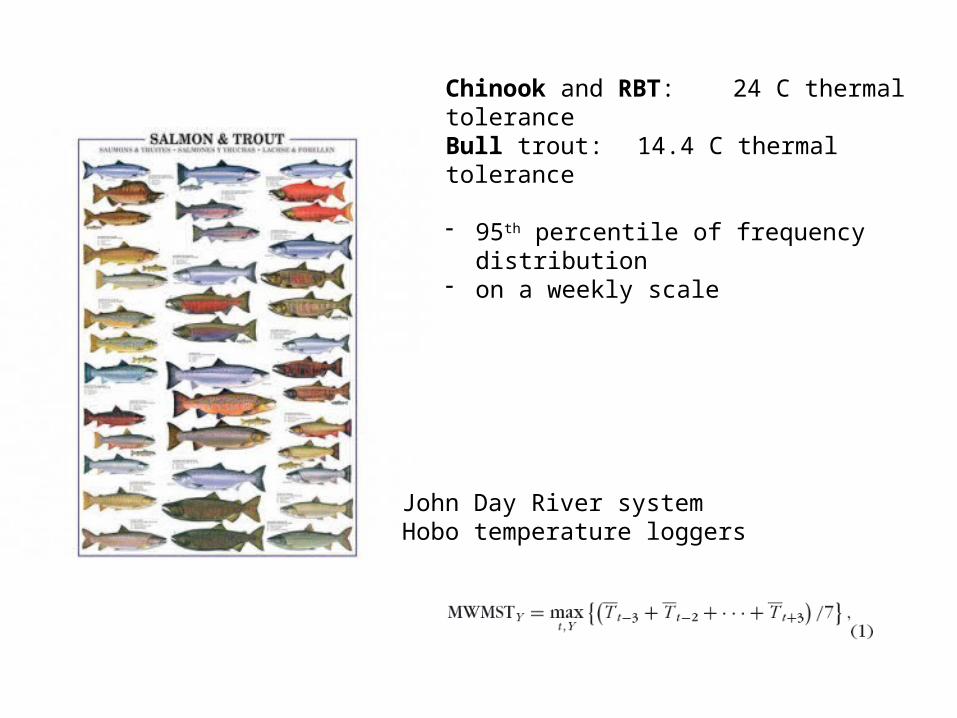
Chinook and RBT: 24 C thermal toleranceBull trout: 14.4 C thermal tolerance
- 95th percentile of frequency distribution- on a weekly scale
John Day River systemHobo temperature loggers
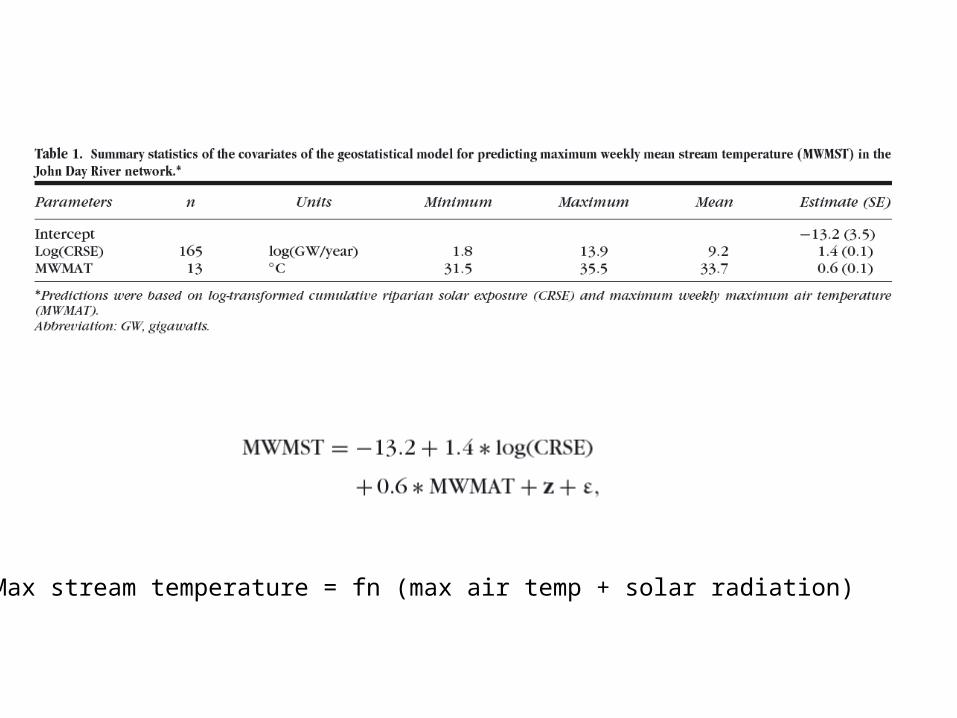
Max stream temperature = fn (max air temp + solar radiation)
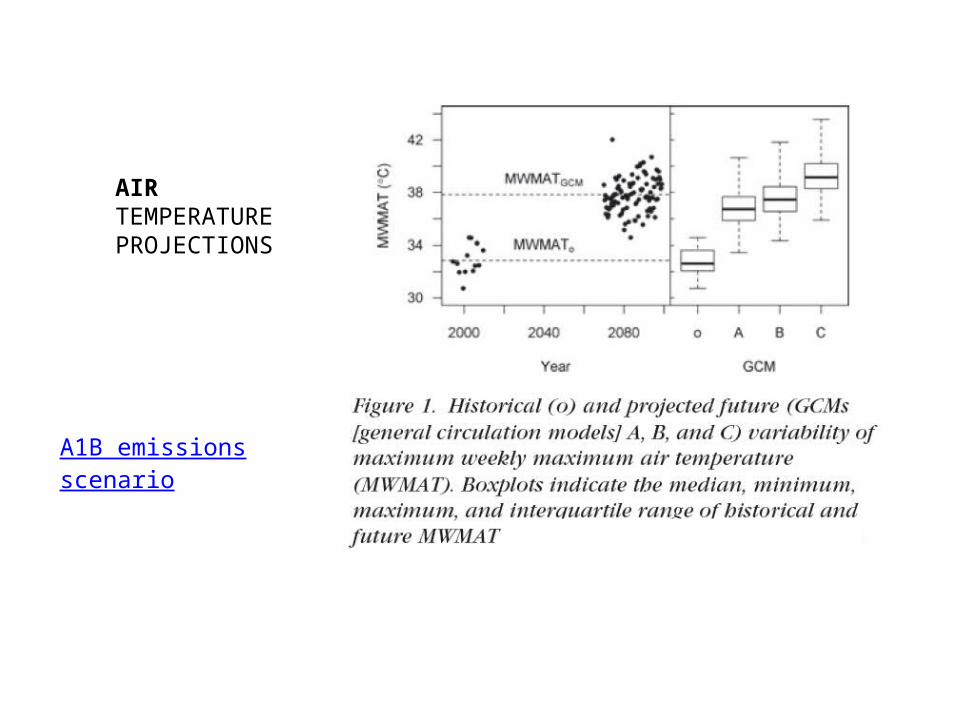
AIRTEMPERATUREPROJECTIONS
A1B emissionsscenario
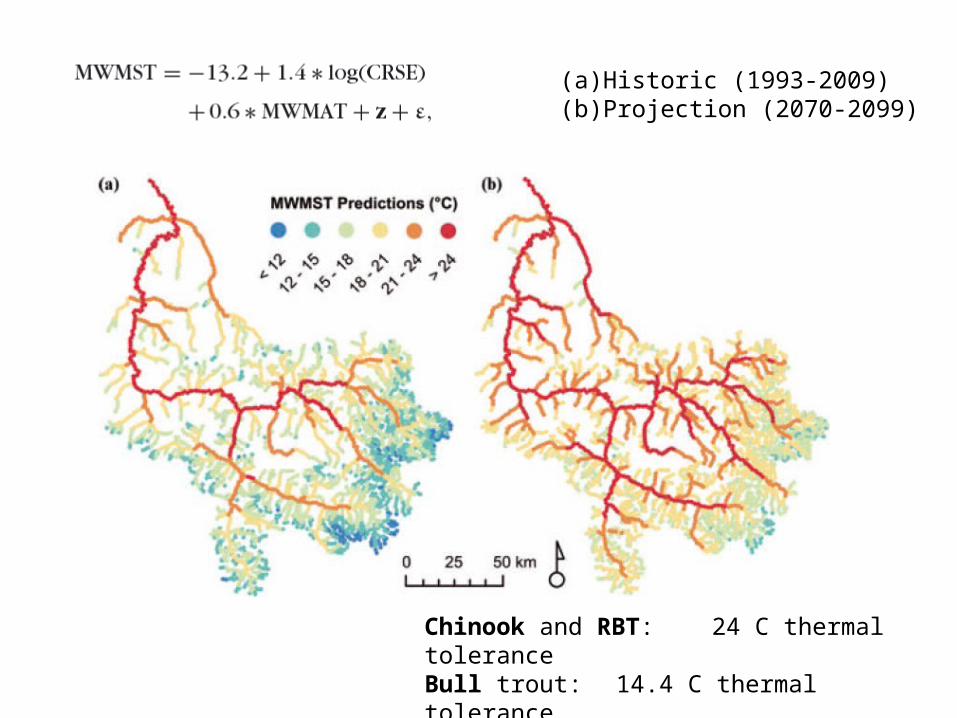
(a) Historic (1993-2009)(b) Projection (2070-2099)
Chinook and RBT: 24 C thermal toleranceBull trout: 14.4 C thermal tolerance
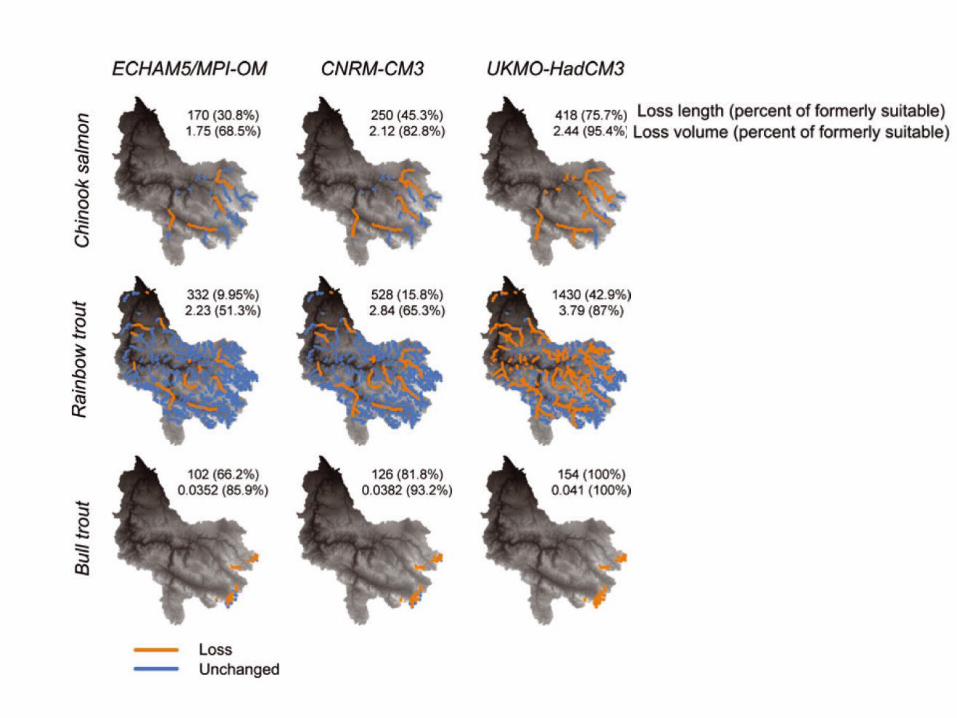
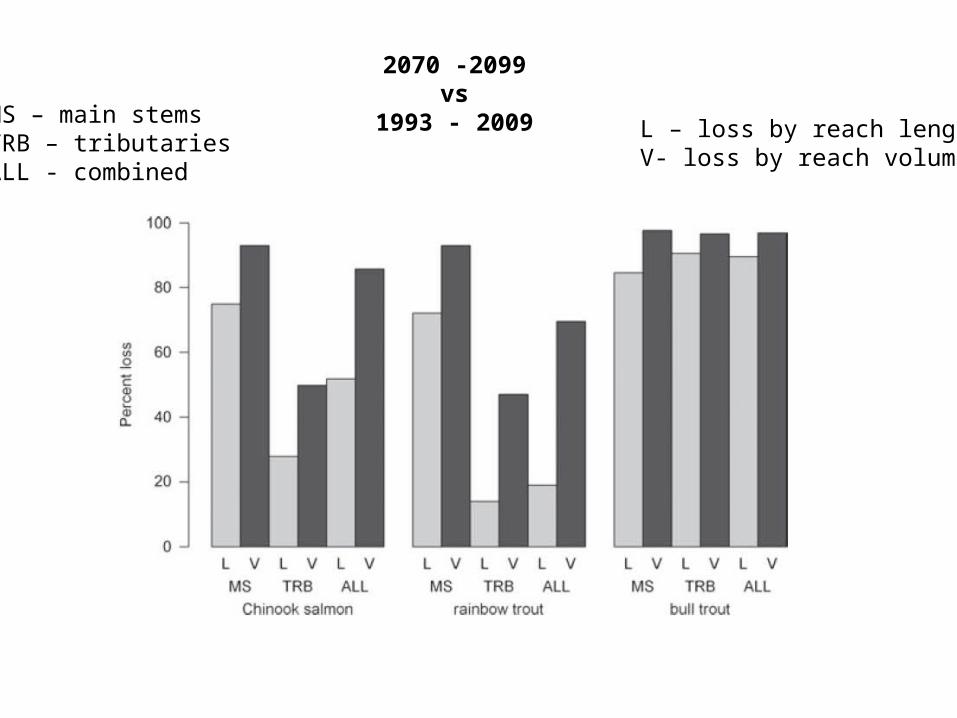
MS – main stemsTRB – tributariesALL - combined
L – loss by reach lengthV- loss by reach volume
2070 -2099 vs
1993 - 2009