
1
Flexural buckling of elliptical hollow section columns
T. M. Chan1 and L. Gardner2
1Assistant Professor in Structural Engineering, School of Engineering, the University of Warwick, Coventry, CV4 7AL,
United Kingdom. Email: [email protected]
2Senior Lecturer, Department of Civil and Environmental Engineering, South Kensington Campus, Imperial College
London, SW7 2AZ, United Kingdom. Email: [email protected]
Abstract
Complementary to recent studies on the cross-section behavior of elliptical hollow sections,
investigations into the member response have also been performed and described in this paper. The
first stage of these investigations involved a series of precise column buckling tests on hot-finished
steel elliptical hollow sections. In total, 24 flexural buckling tests about the minor and major axes
were carried out. Specimen sizes and lengths were carefully chosen in order to cover a wide range
of both cross-section and member slendernesses. The non-dimensional column slenderness of the
test specimens varied between 0.19 and 1.58. Measurements were taken of specimen geometry,
global initial geometric imperfections and tensile material properties. Key results from the tests
including the full load-deformation histories have been presented and discussed. The test results
have also been supplemented by 158 numerically generated results, allowing a wider range of
geometries to be investigated. Design rules for the member buckling resistance of elliptical hollow
section columns have been proposed and verified by means of reliability analysis. The presented
results are the first member buckling tests on elliptical hollow sections, and represent part of the
development of comprehensive structural design rules for these sections.
2
CE Database subject headings: Buckling; Columns; Compression; Design; Hollow sections;
Laboratory tests; Numerical analysis; Slenderness ratio; Steel structures.
Introduction
Tubular members are widely used for exposed structural elements owing to their efficiency and
aesthetic appearance. The familiar range of tubular members currently comprises square,
rectangular and circular hollow sections. However, elliptical hollow sections have been recently
introduced to the construction market, and structural columns are becoming a popular application.
Elliptical hollow sections can offer greater efficiency than circular hollow sections, particularly
when subjected to eccentric loading (generating a bending moment about the stronger axis) or when
differing end restraints or bracings exist about the two principal axes (altering the effective column
buckling lengths). Recent examples of the use of elliptical hollow sections as columns may be
found at the airports at Heathrow in London, UK (Corus 2006a) and Barajas in Madrid, Spain
(Viñuela-Rueda and Martinez-Salcedo 2006). Previous studies of elliptical hollow sections
conducted by the authors include design proposals for cross-section classification (Gardner and
Chan 2007), cross-section design strength in compression (Chan and Gardner 2008a) and bending
about both principal axes (Chan and Gardner 2008b) and combined shear and bending (Gardner et
al. 2008). Recent studies on the elastic buckling of elliptical hollow sections (Zhu and Wilkinson
2006; Ruiz-Teran and Gardner 2008), the response of filled elliptical tubes (Roufegarinejad and
Bradford 2007; Zhao et al. 2007; Yang et al. 2008) and the behaviour of connections to EHS
(Bortolotti et al. 2003; Choo et al. 2003; Pietrapertosa and Jaspart 2003; Willibald et al. 2006) have
also been performed. This paper describes an investigation of the buckling strength of elliptical
hollow section columns. Detailed experimental and numerical studies are described and structural
design rules are proposed.
3
Experimental studies
A comprehensive full-scale laboratory testing programme on EHS (grade S355), manufactured by
Corus Tubes (Corus 2006b), has been conducted at Imperial College London. To date, material
tensile coupon tests and cross-section capacity tests in compression (Chan and Gardner 2008a),
bending (Chan and Gardner 2008b) and shear (Gardner et al. 2008) have been performed. This
paper focuses on the member behavior of pin-ended, elliptical hollow section columns. The tested
EHS had an aspect ratio of two, overall cross-section dimensions of 150×75 mm and thicknesses of
4 mm, 5 mm and 6.3 mm. A total of six material tensile coupon tests and twenty four column
buckling tests were carried out.
Tensile coupon tests
Material tensile coupon tests were performed to determine the basic engineering stress-strain
response of the material for each of the tested section sizes. The obtained material data were used
to facilitate the analysis of the column test results and were incorporated into the numerical
simulations to replicate the response of the tested specimens. Full details of the tensile tests have
been reported by the authors (Chan and Gardner 2008a), whilst a summary of the test results is
given in Table 1.
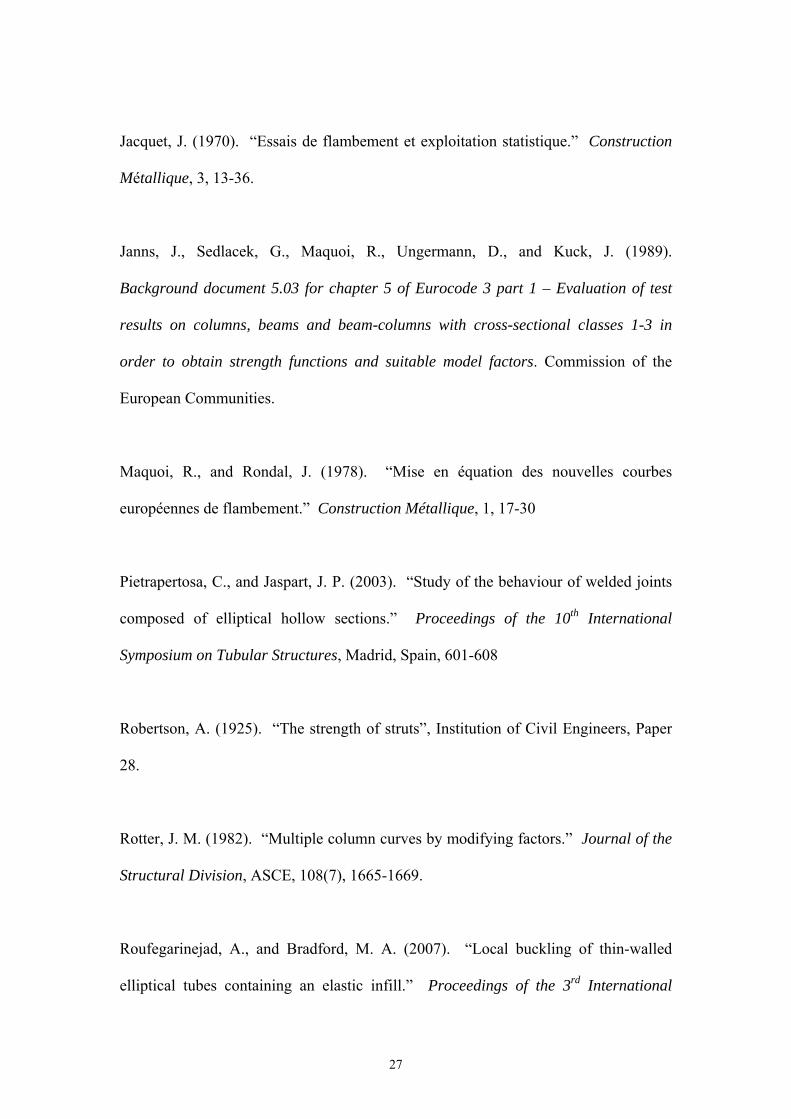
Flexural buckling tests
The primary aim of the column tests was to investigate the flexural buckling response of EHS pin-
ended compression members under axial loading. The pin-ended conditions were provided by
hardened steel knife-edges fixed to the ends of the specimens. The specimen lengths were carefully
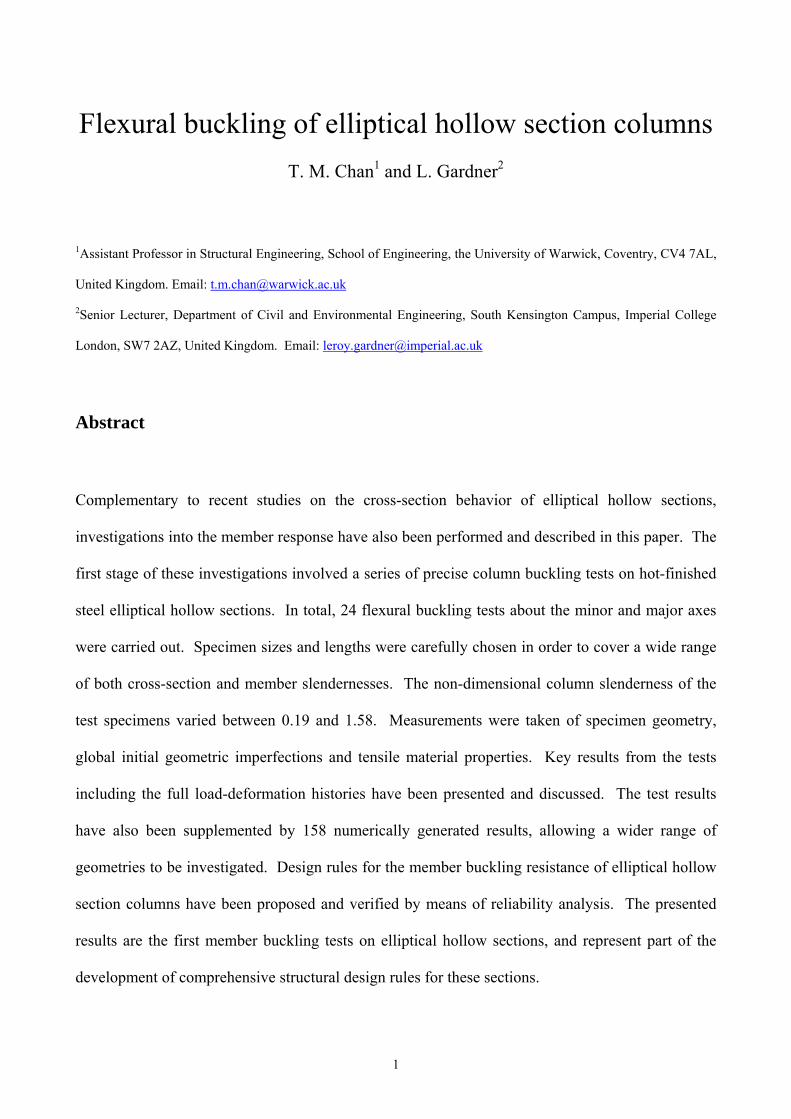
chosen to provide a spectrum of member slendernesses. The nominal pin-ended column lengths
were 0.7 m, 1.5 m, 2.3 m and 3.1 m (Fig. 1), with the corresponding Lcr/i ranging from 15 to 117

4
(and non-dimensional column slenderness ranging from 0.19 to 1.58), where Lcr is the buckling
(effective) length in the buckling plane considered and i is the radius of gyration about the relevant
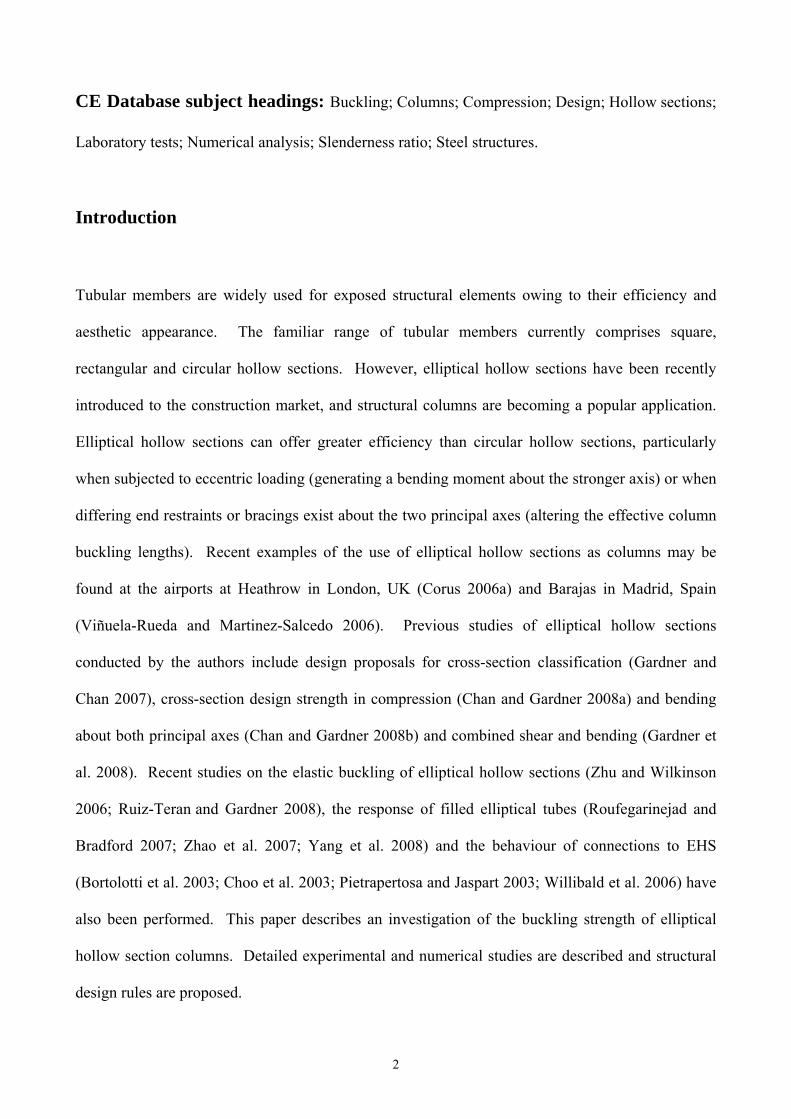
buckling axis (determined using the properties of the gross cross-section). The general testing
configuration is depicted in Fig. 2. For column specimens where the measured global imperfection
was less than L/1000, an eccentricity of loading was applied such that the combined imperfection
plus eccentricity was equal to L/1000. For three of the columns – 150756.3-C1, 150755-C3
and 150755-C5 – the measured initial imperfections were greater than L/1000; for these
specimens, the load was applied concentrically. The loading was recorded by a 1000 kN load cell
located at the top end of the columns. Vertical displacement was measured at the loaded end of the
columns by two LVDTs, whilst two additional LVDTs were positioned at each end of the columns
to measure end rotation. Two LVDTs were also located at the mid-height of the columns to
measure the lateral deflection in the major and minor axes directions. Four linear electrical
resistance strain gauges were affixed to the extreme fibers of the section at a distance of 20 mm
from the mid-height to avoid contact with the LVDTs. Load, strain, displacement and input voltage
were all recorded using the data acquisition equipment DATASCAN and logged using the DSLOG
computer package.
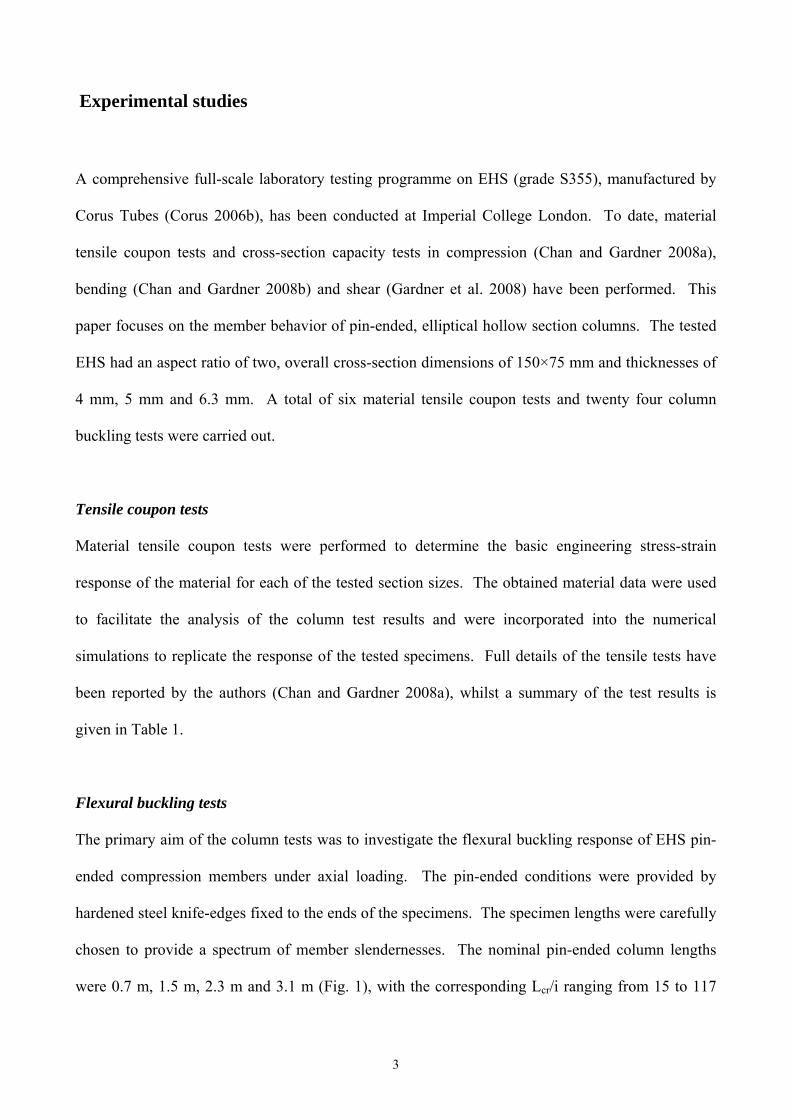
The geometry of an elliptical hollow section is depicted in Fig. 3 and the mean measured
dimensions and maximum global geometric imperfections g (determined by employing feeler
gauges to measure the clearance between the columns and a flat datum) of the test specimens (based
on specimen lengths ignoring the knife edges) are summarized in Table 2. Local geometric
imperfections were not measured in this study since the proportions of the cross-sections examined
were relatively stocky and insensitive to local buckling. For thin-walled hollow sections, such
measurements would typically be performed (Young and Chen 2008). Geometric properties for the
EHS specimens are defined using the exact formulae adopted by the authors in previous studies
5
(Chan and Gardner 2008a, b; Gardner and Chan 2007). The key results from the column tests have
been reported in Table 2. Full load-deformation relationships for the column tests are reported in
Chan (2007) and typical structural responses are described in the following sections.
Load versus vertical displacement response
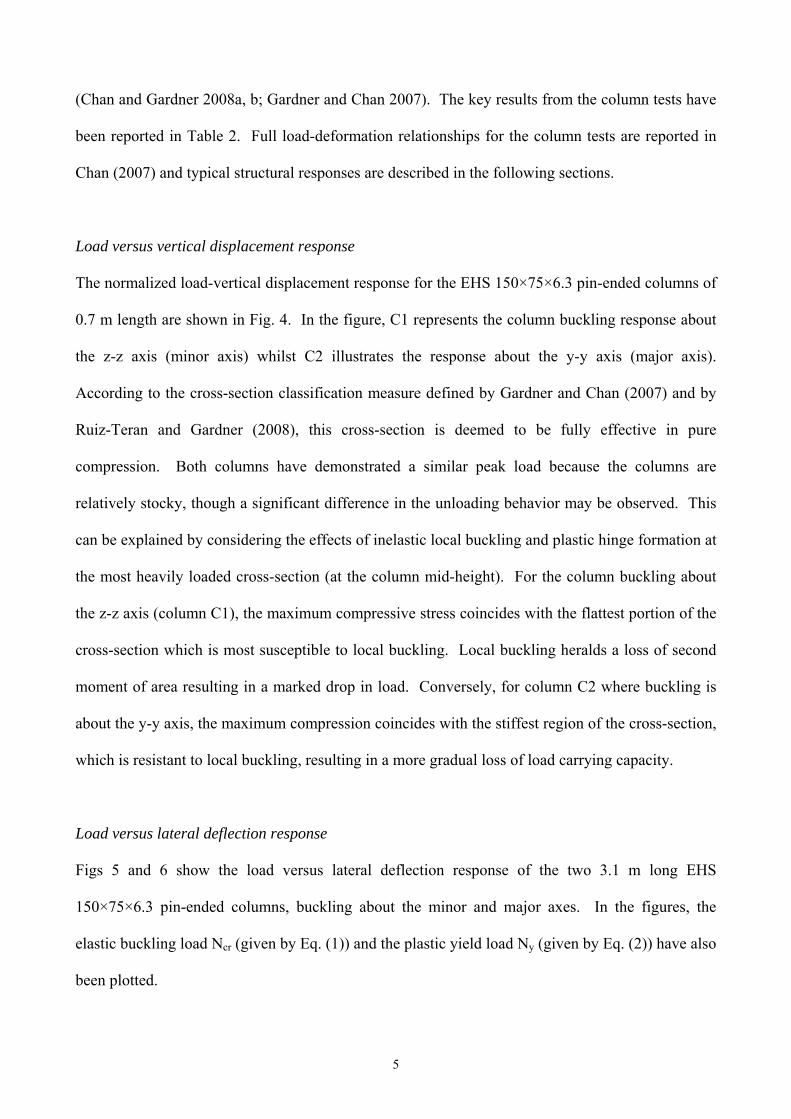
The normalized load-vertical displacement response for the EHS 150×75×6.3 pin-ended columns of
0.7 m length are shown in Fig. 4. In the figure, C1 represents the column buckling response about
the z-z axis (minor axis) whilst C2 illustrates the response about the y-y axis (major axis).
According to the cross-section classification measure defined by Gardner and Chan (2007) and by
Ruiz-Teran and Gardner (2008), this cross-section is deemed to be fully effective in pure
compression. Both columns have demonstrated a similar peak load because the columns are
relatively stocky, though a significant difference in the unloading behavior may be observed. This
can be explained by considering the effects of inelastic local buckling and plastic hinge formation at
the most heavily loaded cross-section (at the column mid-height). For the column buckling about
the z-z axis (column C1), the maximum compressive stress coincides with the flattest portion of the
cross-section which is most susceptible to local buckling. Local buckling heralds a loss of second
moment of area resulting in a marked drop in load. Conversely, for column C2 where buckling is
about the y-y axis, the maximum compression coincides with the stiffest region of the cross-section,
which is resistant to local buckling, resulting in a more gradual loss of load carrying capacity.
Load versus lateral deflection response
Figs 5 and 6 show the load versus lateral deflection response of the two 3.1 m long EHS
150×75×6.3 pin-ended columns, buckling about the minor and major axes. In the figures, the
elastic buckling load Ncr (given by Eq. (1)) and the plastic yield load Ny (given by Eq. (2)) have also
been plotted.
6
2cr
2
crL
EIN
(1)
yy AfN (2)
where E is the Young’s modulus, I is the second moment of area about the relevant buckling axis,
Lcr is the buckling (effective) length in the buckling plane considered, A is the gross cross-section
area and fy is the material yield stress. Eqs (1) and (2) represent the two theoretical upper bounds to
column resistance. For stockier members, the ultimate load is dominated by the plastic yield load
whilst for slender members, the ultimate load approaches the Euler buckling load. For the column
under consideration, when buckling about the minor axis (Fig. 5), the elastic buckling load Ncr is
below the yield load Ny, whilst when buckling about the major axis (Fig. 6), the elastic buckling
load is above the yield load. The relative influence of the two bounds may be seen in Figs 5 and 6.
In addition to the inclusion of Ncr and Ny in Figs 5 and 6, the results of a second order elastic
analysis and a rigid plastic analysis have also been shown. The second order elastic analysis was
performed on the assumption that the unloaded column has an initial sinusoidal bow of maximum
amplitude i. The maximum additional lateral deflection arising under increased loading N may
be determined from Eq. (3) provided the column remains elastic.
icr
i
)NN(1
(3)
The amplitude of the initial bow was selected to achieve the best representation of the response of
the tested columns – for column 150756.3-C7 (Fig. 5), the required initial bow was found to be
approximately L/500, whilst for column 150756.3-C8 (Fig. 6), a value of approximately L/1000
was found to be suitable. In the latter case, the required initial bow was similar to the total test
imperfection (initial bow plus applied load eccentricity), whilst for the 150756.3-C7, a larger
7
imperfection than was measured in the test was required – interestingly L/500 was also the
imperfection amplitude that resulted in best agreement between the FE model and the test (see
Table 3), suggesting that a slightly larger imperfection (geometric or residual stresses) may have
actually existed for this test specimen.
For the second order rigid plastic analysis, reference may be made to the concentrically loaded pin-
ended column shown in Fig. 7. By assuming that all deformation is concentrated in a plastic hinge
at the mid-height of the column, the axial load N that can be sustained under increased lateral
deflection may be determined by examining the stress distribution of Fig. 8. As illustrated in Fig. 8,
the central compressive region (zone 2) is responsible for resisting the axial load N, whilst the two
outer regions (zones 1 and 3) form a couple to resists the second order moment M2 = N arising
from the lateral deflection (Allen and Bulson 1980). Based on this stress model, the second order
rigid plastic boundary has been derived and plotted in Figs 5 and 6. The test results demonstrate
sound agreement with the theoretical models, with the general response being characterized by the
envelope of the two second order boundaries. The initial elastic response concurs with the second
order elastic analysis while the unloading behavior merges into the second order rigid plastic line.
These test results have been replicated numerically and used for the validation of column buckling
curves in the following sections.
Numerical simulations
A numerical modeling investigation, utilizing the finite element (FE) package ABAQUS (2006),
was implemented alongside the experimental programme. The objectives of the investigation were
to (1) replicate the experimental results, (2) validate the numerical models and (3) perform
parametric studies. The elements chosen for the FE models were 4-noded, reduced integration shell
8
elements with six degrees of freedom per node, designated as S4R in the ABAQUS (2006) element
library, and suitable for thin or thick shell applications. A uniform mesh density was carefully
chosen by carrying out a mesh convergence study based on elastic eigenvalue predictions with the
aim of achieving accurate results whilst minimizing computational effort. A suitable mesh size was
found to be 2a/10(a/b) × 2a/10(a/b) mm, where a and b are defined in Fig. 3. In total, 158
numerical simulations were carried out, including validation studies, sensitivity studies and
parametric studies.
The column tests were modeled using the measured dimensions of the test specimens and measured
material stress-strain data. Initial global geometric imperfections were incorporated in the
numerical model by means of a global half-sine wave given by gsin(x /L), where x is the distance
along the specimen, L is the specimen length and g is the global imperfection amplitude. A range
of global imperfection amplitudes g was studied – in addition to the measured imperfection values
(excluding applied load eccentricity), four fixed fractions of the specimen length L (L/250, L/500,
L/1000 (representing the total test imperfection including applied load eccentricity) and L/2000)
were considered. A similar spectrum of global imperfection amplitude was studied by Batterman
and Johnston (1967) and Gardner and Nethercot (2004). The amplitudes of L/250 and L/500 reflect
the current allowable out-of-straightness tolerance for elliptical hollow section tubes in Europe (EN
10210-2 2006), whilst L/500 is the tolerance limit in Europe (EN 10210-2 2006), North America
(ASTM A501 2005) and Australia (AS 1163 1991) for other tubular members.
The presence of longitudinal residual stresses in structural members can have a significant influence
on column buckling strengths, by causing premature yielding of the cross-section resulting in a
reduction in stiffness and loss of load carrying capacity. Residual stresses are induced primarily
during the production process. For cold-formed sections, residual stresses are principally induced
9
through plastic deformation, whilst for hot-finished and welded sections, uneven cooling is the main
source of residual stresses. The elliptical hollow sections considered in the present study are hot-
finished structural sections; the residual stresses are therefore primarily induced through uneven
cooling. In tubes, uneven cooling arises as a result of the differing thermal conditions present at the
outer and inner surfaces of the sections, with the outer surface cooling more rapidly. This generally
leaves the outer surface of the tube in longitudinal and radial compression, with equilibrating
tension on the inner surface. In the development of the European column buckling curve for hot-
finished tubular sections (Beer and Schulz 1970), a representative residual stress pattern based on
measurements from circular tubes was employed. The adopted distribution was symmetrical
through the thicknesses with compressive residual stresses on the outer surface and tensile residual
stresses on the inner surface, though the experimental findings of Stamenkovic and Gardner (1983)
exhibited a contradictory trend. The magnitude of both tensile and compressive residual stresses
was in the region of 15% of the material yield stress. It may be inferred that residual stresses in
elliptical tubes would be of similar magnitude and distribution to those in circular tubes, though
since no residual stresses measurements were performed in this study, further investigation would
be required to verify this. Two observations indicated that the level of residual stresses in the
studied hot-finished EHS was low: (1) negligible deformations occurred when the material tensile
coupons were machined from the cross-sections and (2) a distinct yield point was seen in both the
tensile coupon results and the stub column results (Chan and Gardner 2008a), which high residual
stresses would erode. For these reasons, residual stresses were not explicitly incorporated into the
numerical models.
The true material stress-strain relationships were generated from the engineering stress-strain curves
obtained from the tensile coupon tests. The material non-linearity was incorporated into the
numerical models by means of a piecewise linear stress-strain model to replicate, in particular, the
strain-hardening region. Boundary conditions were applied to model pin end conditions at the ends
10
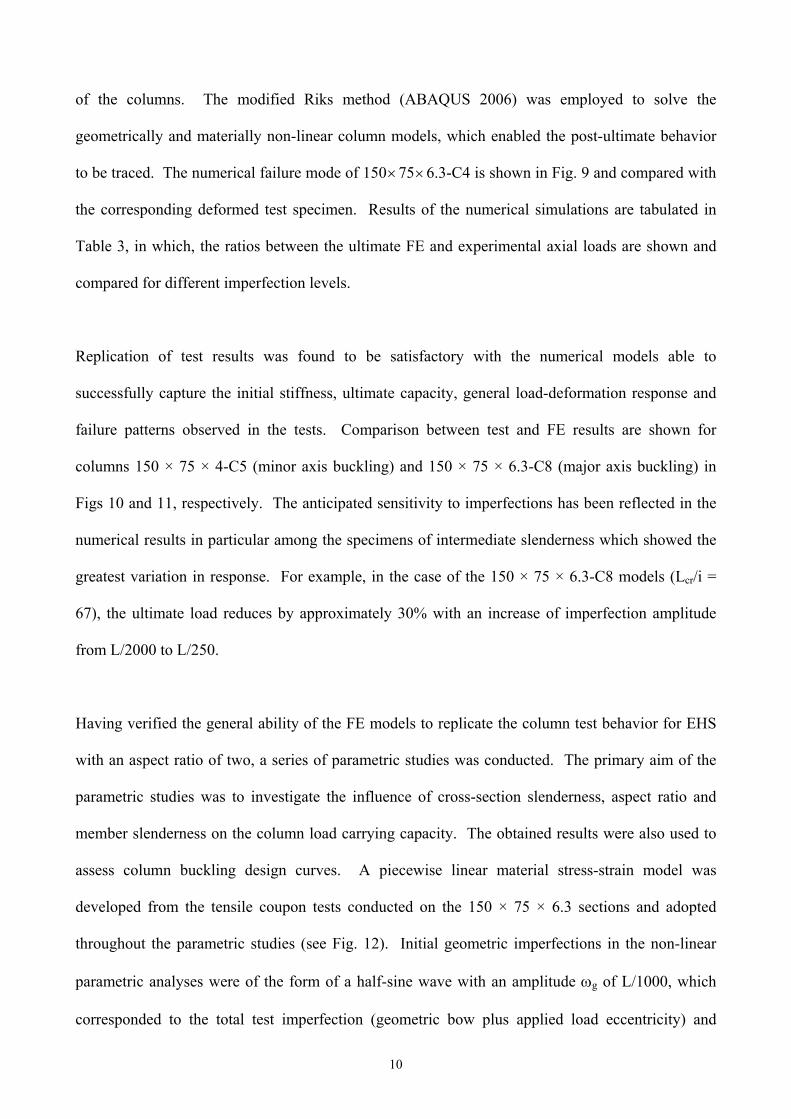
of the columns. The modified Riks method (ABAQUS 2006) was employed to solve the
geometrically and materially non-linear column models, which enabled the post-ultimate behavior
to be traced. The numerical failure mode of 150756.3-C4 is shown in Fig. 9 and compared with
the corresponding deformed test specimen. Results of the numerical simulations are tabulated in
Table 3, in which, the ratios between the ultimate FE and experimental axial loads are shown and
compared for different imperfection levels.
Replication of test results was found to be satisfactory with the numerical models able to
successfully capture the initial stiffness, ultimate capacity, general load-deformation response and
failure patterns observed in the tests. Comparison between test and FE results are shown for
columns 150 × 75 × 4-C5 (minor axis buckling) and 150 × 75 × 6.3-C8 (major axis buckling) in
Figs 10 and 11, respectively. The anticipated sensitivity to imperfections has been reflected in the
numerical results in particular among the specimens of intermediate slenderness which showed the
greatest variation in response. For example, in the case of the 150 × 75 × 6.3-C8 models (Lcr/i =
67), the ultimate load reduces by approximately 30% with an increase of imperfection amplitude
from L/2000 to L/250.
Having verified the general ability of the FE models to replicate the column test behavior for EHS
with an aspect ratio of two, a series of parametric studies was conducted. The primary aim of the
parametric studies was to investigate the influence of cross-section slenderness, aspect ratio and
member slenderness on the column load carrying capacity. The obtained results were also used to
assess column buckling design curves. A piecewise linear material stress-strain model was
developed from the tensile coupon tests conducted on the 150 × 75 × 6.3 sections and adopted
throughout the parametric studies (see Fig. 12). Initial geometric imperfections in the non-linear
parametric analyses were of the form of a half-sine wave with an amplitude g of L/1000, which
corresponded to the total test imperfection (geometric bow plus applied load eccentricity) and
11
provided the best agreement between FE and test results (Table 3). This magnitude is the same as
that employed in the formulation of the European column buckling curves (Beer and Schulz 1970;
Galambos 1998) and the Australian column curves (Rotter 1982; Beedle 1991). It is worth noting
that the current AISC Standard employed L/1500 (Beedle 1991; Galambos 1998) as the governing
out-of-straightness in developing the column design curves. The section sizes considered in the
parametric studies were 150×150, 150×75 and 150×50 with varying thicknesses and a range of
column lengths to extend the investigation to higher member slenderness. The results have been
utilized for the validation of proposed column buckling curves for elliptical hollow sections, as
discussed in the following section.
Buckling resistance of members
In this section, the results of the EHS column buckling tests are examined and compared with the
current column design specifications adopted in Europe, North America and Australia; on the basis
of the comparisons, design recommendations are presented.
Member slenderness for flexural buckling
European Standard (EC 3)
According to EN 1993-1-1 (2005), the non-dimensional member slenderness EC is given by
E
f
i
L
N
Af ycr
cr
yEC
for Class 1 to 3 (fully effective) sections (4)
E
fAA
i
L
N
fA yeffcr
cr
yeffEC
for Class 4 (slender) sections (5)
where Lcr is the buckling (effective) length in the buckling plane considered, i is the radius of

12
gyration about the relevant buckling axis (determined using the properties of the gross cross-section)
and Aeff is the effective cross-sectional area, a proposal for which has been made for EHS by Chan
and Gardner (2008a).
North American Standard (AISC 360)
In accordance with AISC 360 (2005) and Tide (1985, 2001), the corresponding non-dimensional
member slenderness AISC is given by
E
f
i
L ycrAISC
for fully effective sections (6)
E
Qf
i
L ycrAISC
for slender sections (7)
where Q is the slenderness reduction factor which defines the ratio of the stress at local buckling to
the yield stress (AISC 360 2005).
Australian Standard (AS 4100)
According to AS 4100 (1998), the equivalent non-dimensional member slenderness AS is given by
250
E
E
f
i
L
250
f
i
L ycrycrAS for fully effective sections (8)
250
E
E
fk
i
L
250
fk
i
L yfcryfcrAS for slender sections (9)
where kf is defined as the ratio of the effective area to the gross area of the cross-section.
Table 4 summarizes the key results of the column tests where the ultimate load Nu has been
normalized by the yield load Ny (=Afy) or the effective yield load Aefffy. According to the
slenderness parameters and limits proposed by Gardner and Chan (2007) and by Ruiz-Teran and
13
Gardner (2008), the tested EHS with wall thicknesses of 4 mm are Class 4 (slender), and the
ultimate loads have therefore been normalized by Aefffy. The 5 mm and 6.3 mm thick sections are
classified as Class 1-3 (fully effective) and thus, the ultimate loads have been normalized by Afy.
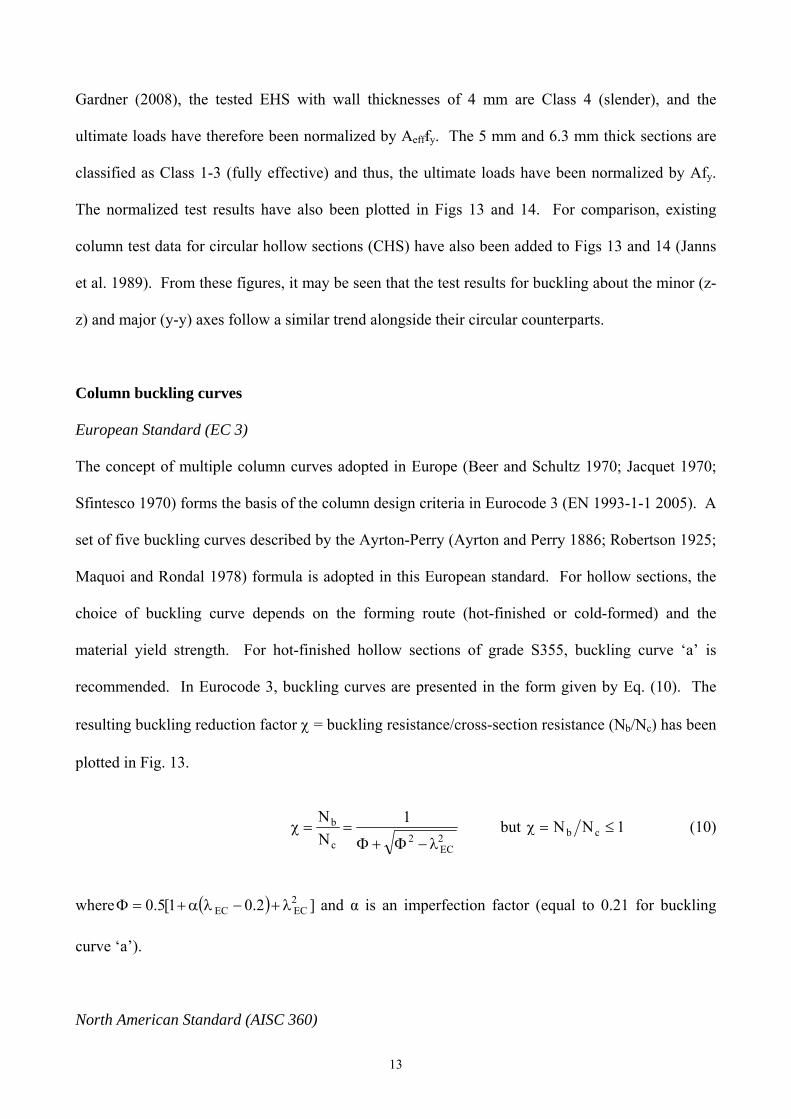
The normalized test results have also been plotted in Figs 13 and 14. For comparison, existing
column test data for circular hollow sections (CHS) have also been added to Figs 13 and 14 (Janns
et al. 1989). From these figures, it may be seen that the test results for buckling about the minor (z-
z) and major (y-y) axes follow a similar trend alongside their circular counterparts.
Column buckling curves
European Standard (EC 3)
The concept of multiple column curves adopted in Europe (Beer and Schultz 1970; Jacquet 1970;
Sfintesco 1970) forms the basis of the column design criteria in Eurocode 3 (EN 1993-1-1 2005). A
set of five buckling curves described by the Ayrton-Perry (Ayrton and Perry 1886; Robertson 1925;
Maquoi and Rondal 1978) formula is adopted in this European standard. For hollow sections, the
choice of buckling curve depends on the forming route (hot-finished or cold-formed) and the
material yield strength. For hot-finished hollow sections of grade S355, buckling curve ‘a’ is
recommended. In Eurocode 3, buckling curves are presented in the form given by Eq. (10). The
resulting buckling reduction factor = buckling resistance/cross-section resistance (Nb/Nc) has been
plotted in Fig. 13.
2EC
2c
b 1
N
N
but 1NN cb (10)
where ]2.01[5.0 2ECEC and α is an imperfection factor (equal to 0.21 for buckling
curve ‘a’).
North American Standard (AISC 360)
14
A single column curve is currently adopted in North America (AISC 360 2005). This column curve
is derived from the three column curves proposed by the Structural Stability Research Council
(Bjorhovde and Tall 1971; Bjorhovde 1972, 1978; Galambos 1998) and can be described by basic
column equations which have been derived empirically based on test data (Tide 1985, 2001; Beedle
1991). The AISC column curve is defined by Eqs (11) and (12) and has been plotted in Fig. 13.
2AISC658.0
N
N
c
b for AISC 1.5 (11)
2AISCc
b 877.0
N
N
for AISC1.5 (12)
Australian Standard (AS 4100)
Column design curves, based on the multiple column curve concept are also adopted in the
Australian Standard (Rotter 1982; Trahair and Bradford 1998; AS 4100 1998). For hollow sections,
the choice of buckling curve depends on the forming route (hot-formed, cold-formed (stress
relieved) or cold-formed (not stress relieved)) and the cross-section slenderness. For hot-finished
hollow sections of Class 1-3 (fully effective), the reduction factor cNb/Nc can be described by Eq.
(13) which has been plotted in Fig. 13. The slenderness AS has been divided by 250/E for
consistency and direct comparison with the other Standards considered.
2
baASc
bc )(
9011
N
N (13)
where b is equal to -1.0 for Class 1-3 (fully effective) sections and and a are defined in AS 4100
(1998).
Proposals, reliability analyses and discussion
15
As shown in Fig. 13, the buckling curves for hot-finished hollow sections from the three Standards
considered generally follow each other closely, with the AS 4100 curve being slightly higher over
the full range of member slenderness. The AISC curve is marginally lower than the EC 3 curve at
low and intermediate slenderness. At higher slenderness, all curves converge towards the Euler
elastic buckling curve.
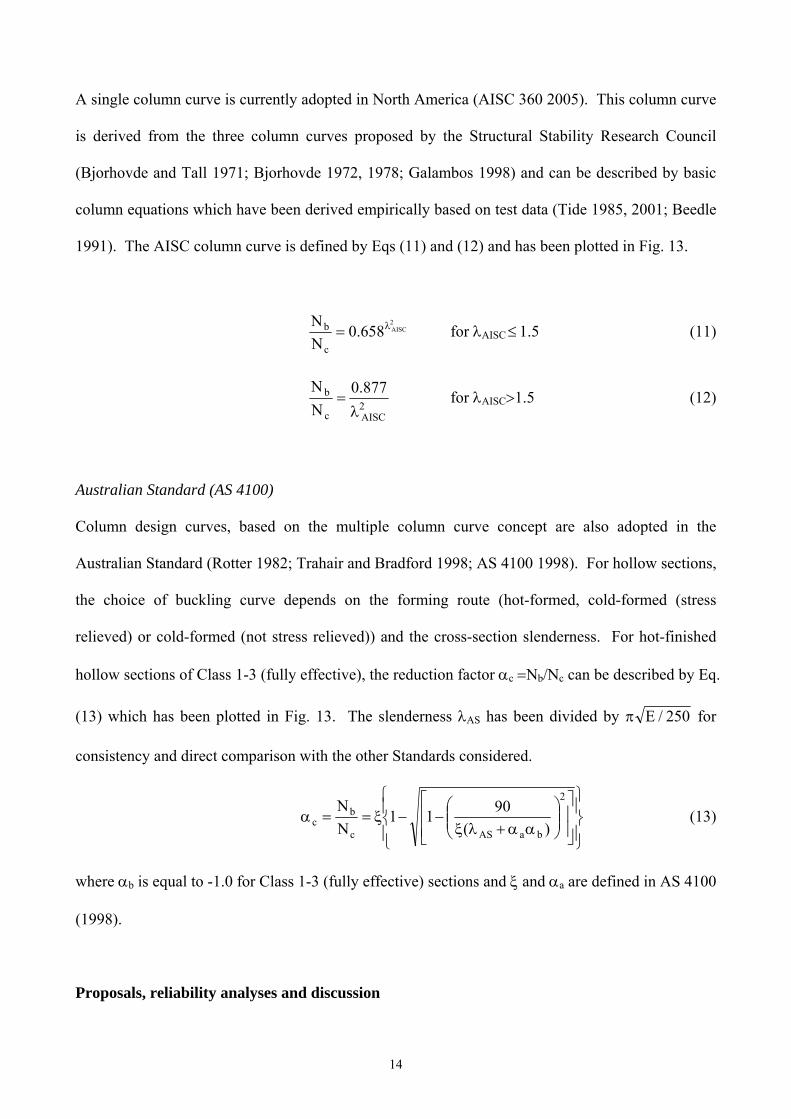
Partial (resistance) factors are applied to the nominal column equations given by Eqs (10) to (13) to
ensure that the required level of reliability is achieved. In EC 3, this partial factor M1 appears in the
denominator and is set equal to unity, whereas in AISC 360 and AS 4100, the resistance factors
(denoted c and , respectively) appear in the numerator and have a value of 0.9. The ‘design’
column curves are plotted in Fig. 14. The buckling curves recommended for hot-finished hollow
sections in the three Standards considered generally provide a lower bound to the EHS test data and
to the numerical results from the described parametric studies on elliptical hollow sections with
aspect ratios a/b of 1.0 (CHS), 2.0 and 3.0 (shown by lines in Fig. 14). It is therefore proposed that
these buckling curves may also be applied to elliptical hollow sections.
In order to verify the reliability of the buckling resistance functions, standard statistical analyses in
accordance with EN 1990 (2002) and AISC 360 (2005) were performed. In the Eurocode analysis,
the ratio of mean to nominal yield strengths (i.e. the material over-strength) was taken as 1.16 and
the coefficients of variation of yield strength and geometric properties were taken as 0.05 and 0.02,
respectively (Byfield and Nethercot 1997). These values originate from industrial data obtained
from European steel producers. For the AISC analysis, the ratio of mean to nominal yield strengths
was taken as 1.028 and the coefficients of variation of yield strength and geometric properties were
taken as 0.058 and 0.05, respectively (Bartlette et al. 2003).
16
The results of the analyses and a summary of the key statistical parameters are presented in Tables 5
(European analysis) and 6 (AISC analysis). The following symbols are used in the Eurocode
analysis: kd,n is the design (ultimate limit states) fractile factor for n tests, where n is the population
of test data under consideration; b is the average ratio of experimental to model resistance based on
a least squares fit to the test data; V is the coefficient of variation of the tests relative to the
resistance model; Vr is the combined coefficient of variation incorporating both model and basic
variable uncertainties. The following symbols are used in the AISC analysis: VQ is the coefficient
of variation of load effects; VR is the combined coefficient of variation incorporating both model
and basic variable uncertainties (equivalent to Vr in Eurocode terminology); is the reliability
index. For an acceptable level of reliability, a value of M1 less than unity (unity being the adopted
partial factor for member in EN 1993-1-1 (2005)) and a value of greater than 2.6 is sought. The
results (Tables 5 and 6) indicate that when the 24 tests are considered alone, whilst the AISC
requirements are satisfied, the Eurocode outcome is marginal. However, the required level of
reliability is achieved for both codes when the test and parametric FE results are considered
together. The AS 4100 (1998) buckling curve lies below the Eurocode curve and it may be
assumed that this also yield acceptable reliability. Overall, it is recommended that the buckling
curves from EN 1993-1-1 (2005), AISC 360 (2005) and AS 4100 (1998) that are currently applied
to SHS, RHS and CHS columns can also be adopted for hot-finished EHS columns, buckling about
either the major or minor axis.
It is worth noting that the initial out-of-straightness implied by modern column curves is generally
less than the corresponding specified maximum fabrication tolerances (Beedle 1991; Galambos
1998). This disparity raises concern over the structural adequacy of real columns in relation to the
design strengths provided by the Standards (Bild and Trahair 1989). However, in essence, the
formulation of modern column curves is based on fitting a design model to available laboratory test

17
results for real columns, and performing statistical analyses to determine suitable resistance factors
to achieve lower bound predictions or the required level of reliability. A similar process is also
undertaken in the development of other structural design rules. Inherently embedded within the test
results are a range of geometric imperfections, residual stresses, load eccentricities and material
characteristics.
The fabrication limit on out-of-straightness for circular hollow sections is L/500, where L is the
length of the member (EN 10210-2 2006; ASTM A501 2005; AS 1163 1991). However, the basic
initial out-of-straightness implied in the development of the current American column curve is
L/1500 (Beedle 1991; Galambos 1998), and in the derivation of the current European curve for
tubular sections is L/1000 (Beer and Schultz 1970). Clearly, the initial geometric imperfections
assumed in the development of both design codes is smaller than the fabrication tolerance, but still
significantly greater than the mean value of out-of-straightness observed in tubular columns of
approximately L/6300, as reported by Bjorhovde (1977). In the current study, the mean measured
initial out-of-straightness for the tested elliptical tubes was approximately L/2000, whilst the
fabrication tolerance is L/250 for EHS with major outer diameter (2a) less than 250 mm and L/500
for larger sections (EN 10210-2 2006). Since it is proposed to adopt the current CHS buckling
curves for EHS, the implied initial imperfections in the buckling curves are again lower than the
fabrication tolerances. The results obtained herein therefore support the wider research findings that
fabrication tolerances may be unduly lax as evidenced by both the observed structural performance
and measured imperfections of real columns. Thus, it is recommended that fabrication tolerances
for structural steelwork be re-assessed in preference to adjusting buckling curves to accord with
current tolerances. It should also be added that fabrication tolerances are based on mill products of
substantial length, and may not reflect the initial out-of-straightness of columns of typical structural
slenderness (Davison and Birkemoe 1982), and furthermore, for columns in real structures, the
presence of end restraint and end moments may significantly reduce the influence of the out-of-

18
straightness. In the context of this research, the tested elliptical hollow sections, buckling about
either the major or minor axis, have demonstrated similar structural behavior to their circular
counterparts, and it is therefore deemed appropriate to adopt the same column curves.
Conclusions
The compressive response of hot-finished elliptical hollow section (EHS) columns has been
examined in this study. A total of twenty four flexural buckling experiments was performed –
twelve about the minor axis and twelve about the major axis. All tested specimens had a cross-
sectional aspect ratio of two. Various column lengths were considered to give a range of non-
dimensional member slenderness from 0.19 to 1.58. Measurements of initial global geometric
imperfections in the EHS columns revealed average values of out-of-straightness of approximately
L/2000, and all were within specified tolerances. Residual stresses were not explicitly measured, but
minimal deformation of coupons upon machining from the complete sections and a sharply defined
yield point observed in stub column tests are both indicative of low residual stress magnitudes in
EHS, as is generally the case for other hot-finished tubular sections. The key material properties,
geometric measurements and test results from the column buckling tests have been reported.
Comparisons of sample load-deflection histories have been made against second order elastic and
rigid plastic analytical approaches, revealing good agreement between experimental results and
theoretical models.
To extend the pool of structural performance data on EHS columns, a detailed numerical modelling
programme was conducted. Verification of the models was carefully performed against all test
results using measured material properties and geometries – satisfactory replication of the full load-
deflection histories and failure modes was achieved. Parametric studies were subsequently

19
performed to assess the structural response of EHS over a wider range of aspect ratios (from 1.0 to
3.0) and member slendernesses. A total of 158 results were generated numerically.
With the aid of both the experimentally and numerically derived results, the column buckling
curves utilized in Europe, North America and Australia were examined. The elliptical hollow
section columns were found to exhibit similar structural performance to their circular counterparts
and it is therefore proposed that the buckling curves from EN 1993-1-1 (2005), AISC 360 (2005)
and AS 4100 (1998) that are currently applied to SHS, RHS and CHS columns can also be adopted
for hot-finished EHS columns, buckling about either the major or minor axis. The suitability of
these design proposals was verified by means of reliability analyses in accordance with the
European and AISC requirements.
Acknowledgements
The authors are grateful to the Dorothy Hodgkin Postgraduate Award Scheme for the project
funding, and would like to thank Corus Tubes for the supply of test specimens and funding
contributions, Andrew Orton (Corus Tubes) and Ada Law (Imperial College London) for their
technical input and Ron Millward (Imperial College London) for his assistance in the laboratory
works.
20
Notation
The following symbols are used in this paper:
A = gross cross-sectional area;
Aeff = effective cross-sectional area;
E = Young’s modulus;
I = second moment of area;
L = specimen length;
Lcr = buckling (effective) length;
M2 = second order moment (N);
N = applied axial load;
Nb = buckling resistance;
Nc = cross-section resistance;
Ncr = elastic buckling load;
Nu = ultimate axial load;
Ny = plastic yield load;
Q = slenderness reduction factor which defines the ratio of the stress at
local buckling to the yield stress (AISC 360 2005);
V = coefficient of variation of tests relative to resistance model (EN 1990 2002);
VQ = coefficient of variation of load effects (AISC 360 2005);
Vr = combined coefficient of variation incorporating both model and basic variable
uncertainties (EN 1993-1-1 2005);
VR = combined coefficient of variation incorporating both model and basic variable
uncertainties (AISC 360 2005);
a = half of the larger outer diameter;
21
‘a’ = buckling curve ‘a’ in EN 1993-1-1 2005;
b = correction factor (EN 1990 2002);
b = half of the smaller outer diameter;
btc = tensile coupon width;
fu = ultimate tensile stress;
fy = material yield stress;
kd,n = design fractile factor for n tests (EN 1990 2002);
kf = form factor, defined as the ratio of the effective area to the gross area
of the section (AS 4100 1998);
t = thickness;
i = radius of gyration;
x = displacement along the specimen;
y-y = cross-section major axis;
z-z = cross-section minor axis;
= 2ECEC 2.015.0 (EN 1993-1-1 2005);
= imperfection factor (EN 1993-1-1 2005);
= reliability index (AISC 360 2005);
a = 20503.15
)5.13(2100
AS2AS
AS
(AS 4100 1998);
b = section constant (AS 4100 1998);
c = member slenderness reduction factor (AS 4100 1998);
= buckling reduction factor (EN 1993-1-1 2005);
= vertical displacement;
22
= capacity factor (AS 4100 1998);
c = resistance factor (AISC 360 2005);
M1 = partial factor (EN 1993-1-1 2005);
= 0)5.13(00326.0 baAS (AS 4100 1998);
= non-dimensional member slenderness;
AISC = non-dimensional member slenderness for AISC 360 2005;
AS = non-dimensional member slenderness for AS 4100 1998;
EC = non-dimensional member slenderness for EN 1993-1-1 2005;
= lateral displacement at mid-height of column;
g = global imperfection amplitude;
i = initial global imperfection amplitude and
= 2
baAS
2baAS
902
190
(AS 4100 1998).
23
References
ABAQUS (2006). ABAQUS, Version 6.6, Hibbitt, Karlsson & Sorensen, Inc.
Pawtucket, USA.
Allen, H. G., and Bulson, P. S. (1980). Background to Buckling, McGraw-Hill,
London.
AISC 360 (2005). Specification for structural steel buildings, AISC, Chicago, Illinois.
AS 1163 (1991). Structural steel hollow sections, Standards Australia, Homebush,
New South Wales.
AS 4100 (1998). Steel structures, Standards Australia, Homebush, New South Wales.
ASTM A501 (2005). Standard specification for hot-formed welded and seamless
carbon steel structural tubing, ASTM International, West Conshohocken, PA.
Ayrton, W. E., and Perry, J. (1886). “On struts.” The Engineer, 62, 464-465.
Bartlette, R. M., Dexter, R. J., Graeser, M., Jelinek, J. J., Schmidt, B. J. and Galambos,
T. V. (2003). “Updating Standard Shape Material Properties Database for Design and
Reliability.” Engineering Journal, AISC, 40 (1), 2-14.
Batterman, R. H., and Johnston, B. G. (1967). “Behavior and maximum strength of
metal columns.” Journal of the Structural Division, ASCE, 93(2), 205-230.
24
Beedle, L. S. (editor-in-chief) (1991). Stability of metal structures: a world view, 2nd
Ed., Structural Stability Research Council, Lehigh University, Bethlehem, Pa.
Beer, H., and Schulz, G. (1970). “Bases théoriques des courbes européennes de
flambement.” Construction Métallique, 3, 37-57.
Bild, S., and Trahair, N. S. (1989). “In-plane strengths of steel columns and beam-
columns.” Journal of Constructional Steel Research, 13(1), 1-22.
Bjorhovde, R. (1972). Deterministic and probabilistic approaches to the strength of
steel columns, PhD thesis, Lehigh University, Bethlehem, Pa.
Bjorhovde, R. (1977). Strength and behaviour of cold-formed HSS columns,
Structural Engineering Report No. 65, Department of Civil Engineering, the
University of Alberta, Edmonton, Alta.
Bjorhovde, R. (1978). “The safety of steel columns.” Journal of the Structural
Division, ASCE, 104(3), 463-477.
Bjorhovde, R., and Tall, L (1971). Maximum column strength and the multiple
column curve concept, Fritz Engineering Laboratory Report No. 338.29, Lehigh
University, Bethlehem, Pa.
Bortolotti, E., Jaspart, J. P., Pietrapertosa, C., Nicaud, G., Petitjean, P. D., and
Grimault, J. P. (2003). “Testing and modelling of welded joints between elliptical

25
hollow sections.” Proceedings of the 10th International Symposium on Tubular
Structures, Madrid, Spain, 259-266.
Byfield, M. P. and Nethercot, D. A. (1997). “Material and geometric properties of
structural steel for use in design.” The Structural Engineer, 75(21), 363-367
Chan, T. M. (2007). Structural behaviour of elliptical hollow sections, PhD thesis,
Imperial College, London.
Chan, T. M., and Gardner, L. (2008a). “Compressive resistance of hot-rolled
elliptical hollow sections.” Engineering Structures, 30(2), 522-532.
Chan, T. M., and Gardner, L. (2008b). “Bending strength of hot-rolled elliptical
hollow sections.” Journal of Constructional Steel Research, 64(9), 971-986.
Choo, Y. S., Liang, J. X., and Lim, L. V. (2003). “Static strength of elliptical hollow
section X-joint under brace compression.” Proceedings of the 10th International
Symposium on Tubular Structures, Madrid, Spain, 253-258.
Corus (2006a). Celsius® 355 Ovals, Corus Tubes – Structural & Conveyance
Business.
Corus (2006b). Celsius® 355 Ovals – Sizes and resistances Eurocode version, Corus
Tubes – Structural & Conveyance Business.
26
Davison, T. A. and Birkemoe, P. C. (1983). “Column behaviour of cold-formed
hollow structural steel shapes.” Canadian Journal of Civil Engineering, 10(1), 125-
141.
EN 1990 (2002). Eurocode 3 – Basis of structural design, CEN, Brussels, Belgium.
EN 1993-1-1 (2005). Eurocode 3: Design of steel structures – Part 1-1: General
rules and rules for buildings, CEN, Brussels, Belgium.
EN 10210-2 (2006). Hot finished structural hollow sections of non-alloy and fine
grain steels – Part 2: Tolerances, dimensions and sectional properties, CEN, Brussels,
Belgium.
Galambos (editor) (1998). Guide to stability design criteria for metal structures, 5th
Ed., Wiley, New York.
Gardner, L., and Chan, T. M. (2007). “Cross-section classification of elliptical
hollow sections.” Steel and Composite Structures, 7(3), 185-200.
Gardner, L., Chan, T. M., and Wadee, M. A. (2008). “Shear response of elliptical
hollow sections.” Structures and Buildings, ICE. In press.
Gardner, L., and Nethercot, D. A. (2004). “Numerical modeling of stainless steel
structural components – a consistent approach.” Journal of Structural Engineering,
ASCE, 130(10), 1586-1601.
27
Jacquet, J. (1970). “Essais de flambement et exploitation statistique.” Construction
Métallique, 3, 13-36.
Janns, J., Sedlacek, G., Maquoi, R., Ungermann, D., and Kuck, J. (1989).
Background document 5.03 for chapter 5 of Eurocode 3 part 1 – Evaluation of test
results on columns, beams and beam-columns with cross-sectional classes 1-3 in
order to obtain strength functions and suitable model factors. Commission of the
European Communities.
Maquoi, R., and Rondal, J. (1978). “Mise en équation des nouvelles courbes
européennes de flambement.” Construction Métallique, 1, 17-30
Pietrapertosa, C., and Jaspart, J. P. (2003). “Study of the behaviour of welded joints
composed of elliptical hollow sections.” Proceedings of the 10th International
Symposium on Tubular Structures, Madrid, Spain, 601-608
Robertson, A. (1925). “The strength of struts”, Institution of Civil Engineers, Paper
28.
Rotter, J. M. (1982). “Multiple column curves by modifying factors.” Journal of the
Structural Division, ASCE, 108(7), 1665-1669.
Roufegarinejad, A., and Bradford, M. A. (2007). “Local buckling of thin-walled
elliptical tubes containing an elastic infill.” Proceedings of the 3rd International
28
Conference on Steel and Composite Structures, Manchester, United Kingdom, 943-
948.
Ruiz-Teran, A. M., and Gardner, L. (2008). “Elastic buckling of elliptical tubes.”
Thin-Walled Structures, 46(11), 1304-1318.
Sfintesco, D. (1970). “Fondement expérimental des courbes européennes de
flambement.” Construction Métallique, 3, 5-12.
Stamenkovic, A., and Gardner, M. J. (1983). “Effect of residual stresses on the
column behaviour of hot-finished steel structural hollow sections.” Proceedings of
the Institution of Civil Engineers, Part 2, 75, 599-616.
Tide, R. H. R. (1985). “Reasonable column design equations.” Proceedings of the
Annual Technical Session of Structural Stability Research Council, Cleveland, OH.,
16th – 17th April, 47-55.
Tide, R. H. R. (2001). “A technical note: Derivation of the LRFD column design
equations.” Engineering Journal, AISC, 38(3), 137-139.
Trahair, N. S., and Bradford, M. A. (1998). The behaviour and design of steel
structures to AS 4100, 3rd Ed., E & FN Spon, London.
Viñuela-Rueda, L., Martinez-Salcedo, J. (2006). “Steel structure and prestressed
façade of the new terminal building.” Hormigón Y Acero, 239(1), 71-84.
29
Willibald, S., Packer, J. A. and Martinez-Saucedo, G. (2006). “Behaviour of gusset
plate connections to ends of round and elliptical hollow structural section members.”
Canadian Journal of Civil Engineering, 33(4), 373-383.
Yang, H., Lam, D. and Gardner, L. (2008). “Testing and analysis of concrete-filled
elliptical hollow sections”. Engineering Structures. In press.
Young, B., and Chen, J. (2008). “Design of Cold-Formed Steel Built-Up Closed
Sections with Intermediate Stiffeners.” Journal of Structural Engineering, ASCE,
134(5), 727-737.
Zhao, X. L., Lu, H., and Galteri, S. (2007). “Tests of elliptical hollow sections filled
with SCC (self-compacting concrete).” Proceedings of the 5th International
Conference on Advances in Steel Structures, Singapore, 950-955.
Zhu, Y., and Wilkinson, T. (2006). “Finite element analysis of structural steel
elliptical hollow sections in pure compression.” Proceedings of the 11th International
Symposium on Tubular Structures, Québec City, Canada, 179-186.
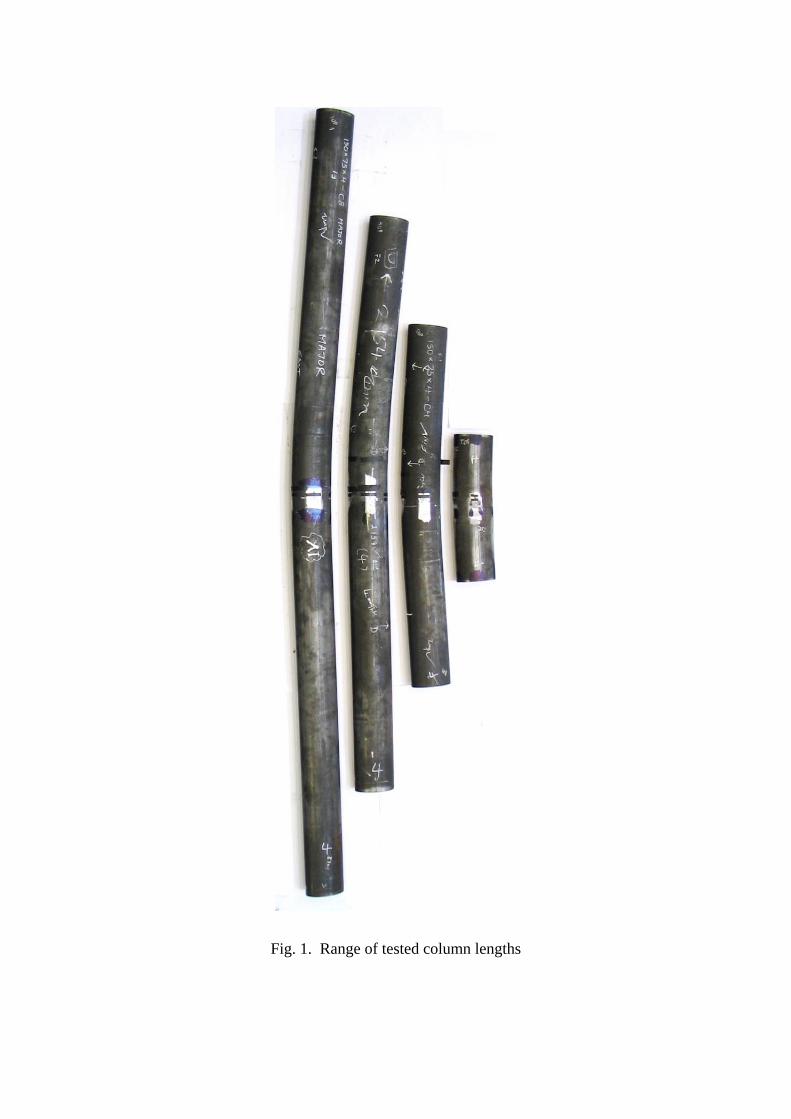
Fig. 1. Range of tested column lengths
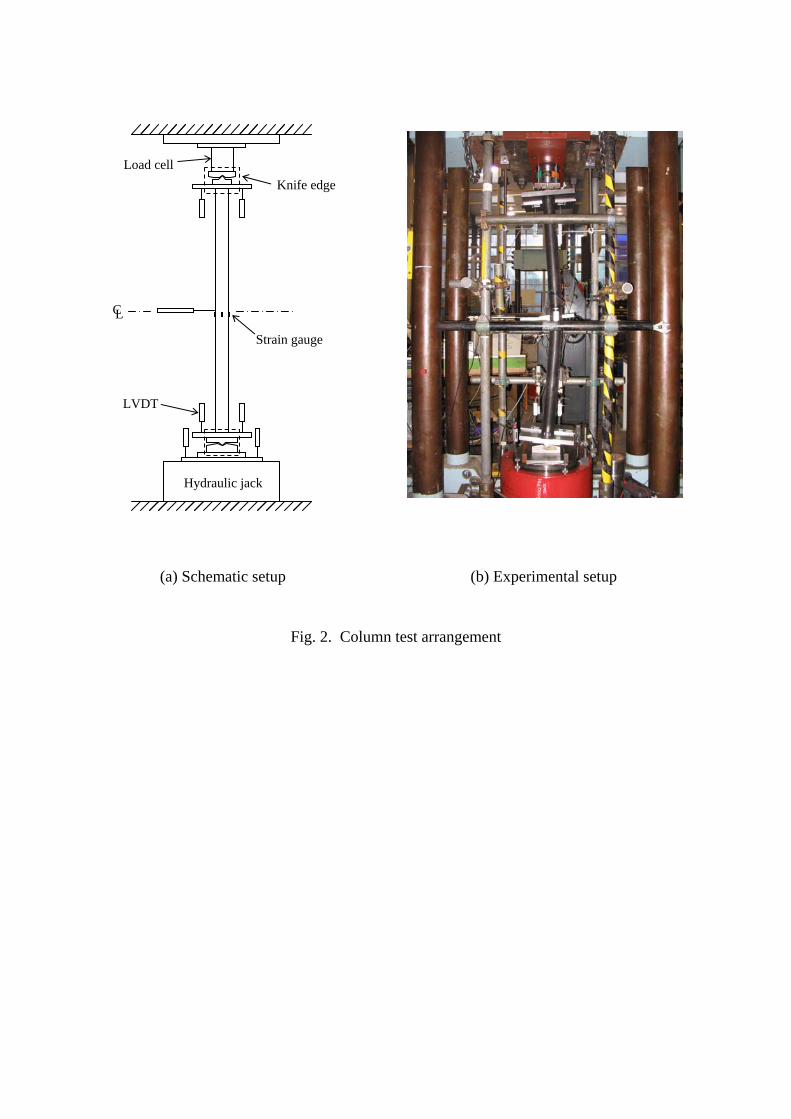
Fig. 2. Column test arrangement
(a) Schematic setup (b) Experimental setup
Knife edge
Load cell
LVDT
Strain gauge
C L
Hydraulic jack

Fig. 3. Geometry of an elliptical hollow section
b
a a
z
y
b
t
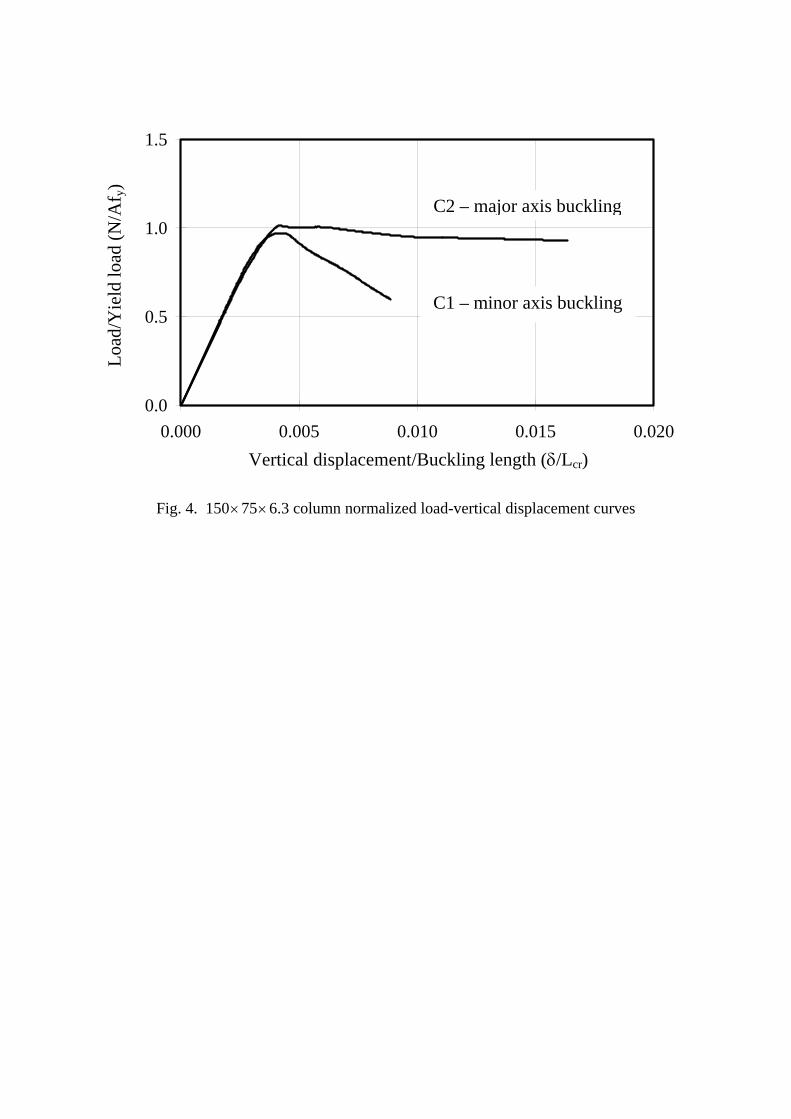
Fig. 4. 150756.3 column normalized load-vertical displacement curves
Vertical displacement/Buckling length (/Lcr)
Loa
d/Y
ield
load
(N
/Af y
)
0.0
0.5
1.0
1.5
0.000 0.005 0.010 0.015 0.020
C1 – minor axis buckling
C2 – major axis buckling
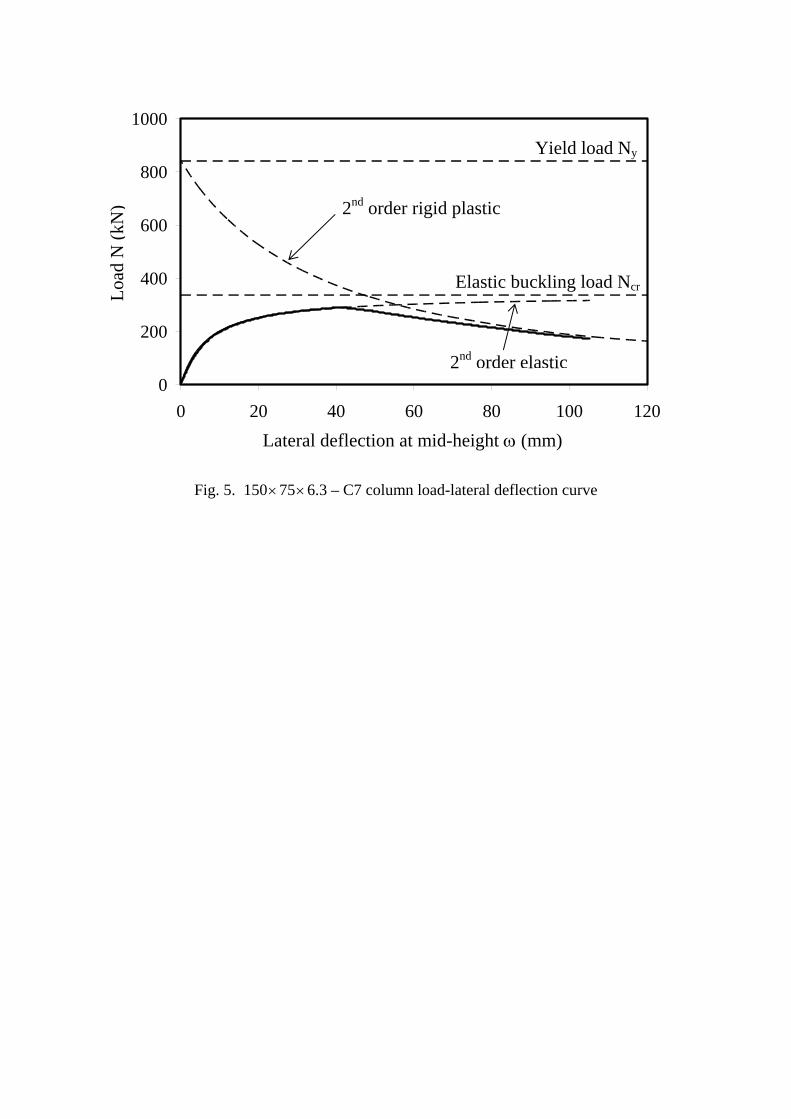
Fig. 5. 150756.3 – C7 column load-lateral deflection curve
0
200
400
600
800
1000
0 20 40 60 80 100 120
Lateral deflection at mid-height (mm)
Loa
d N
(kN
)
Elastic buckling load Ncr
Yield load Ny
2nd order rigid plastic
2nd order elastic
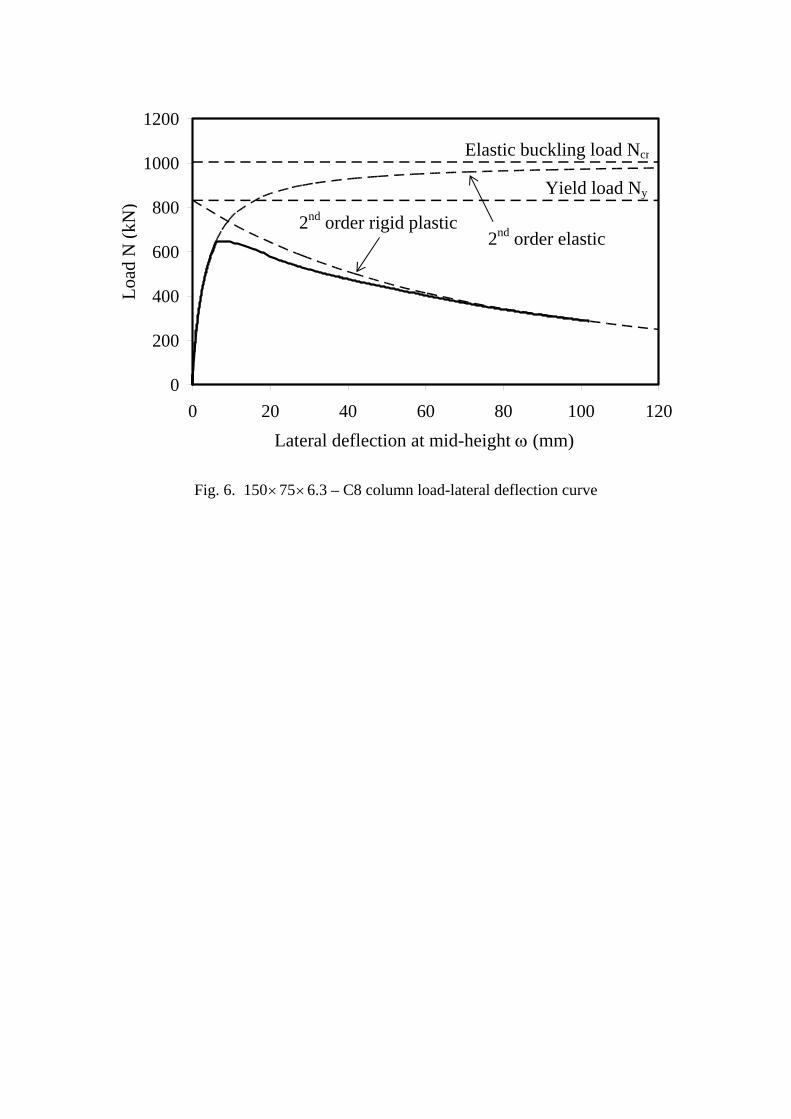
Fig. 6. 150756.3 – C8 column load-lateral deflection curve
0
200
400
600
800
1000
1200
0 20 40 60 80 100 120
Lateral deflection at mid-height (mm)
Loa
d N
(kN
) Elastic buckling load Ncr
Yield load Ny
2nd order rigid plastic 2nd order elastic
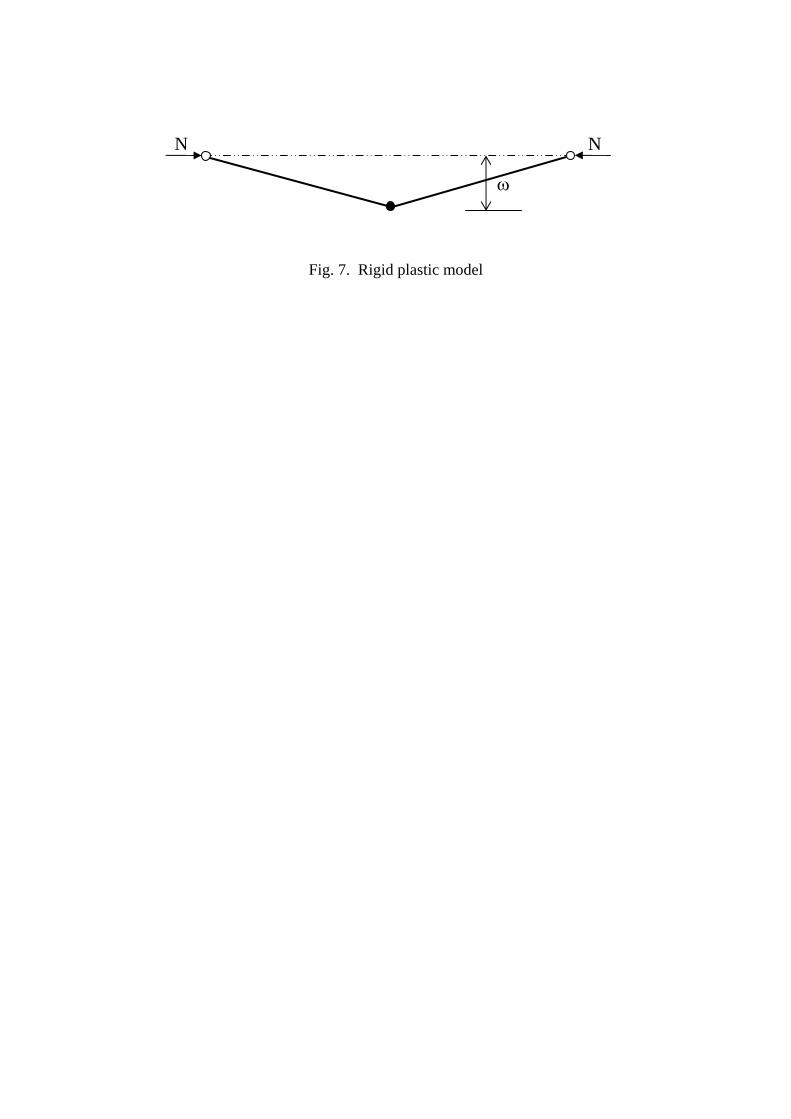
Fig. 7. Rigid plastic model
N N
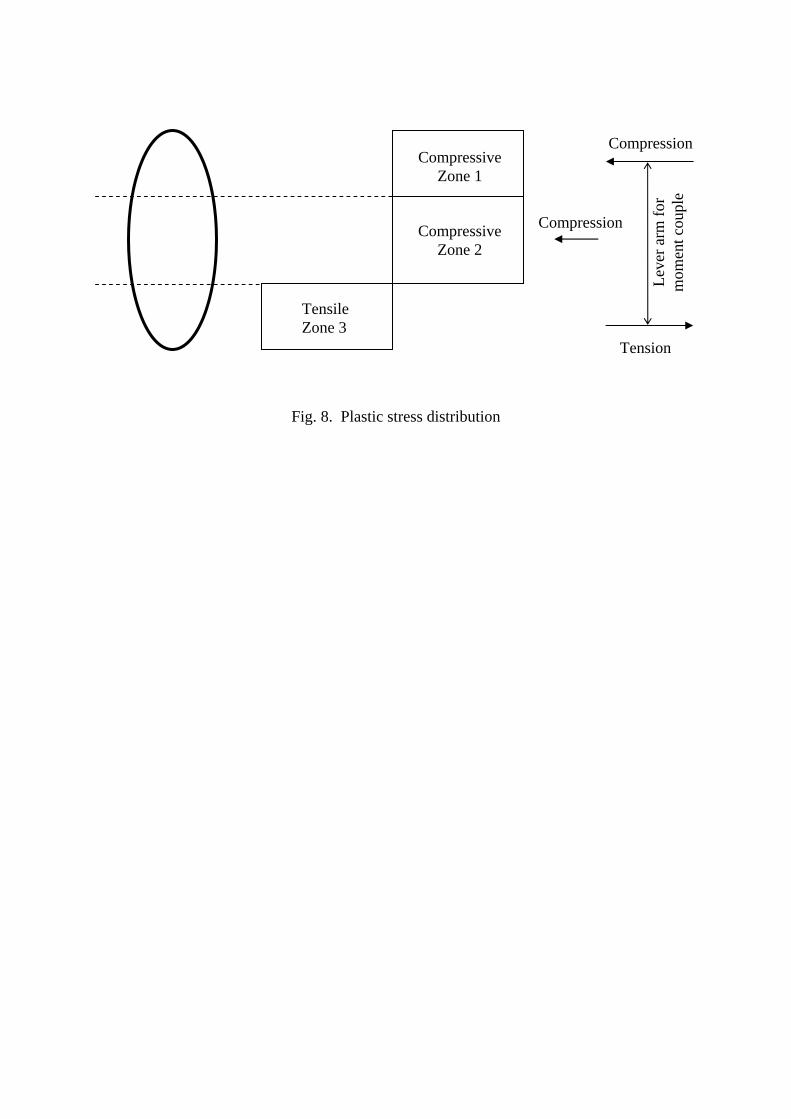
Fig. 8. Plastic stress distribution
Compressive Zone 1
Tensile Zone 3
Compressive Zone 2
Lev
er a
rm f
or
mom
ent c
oupl
e
Compression
Compression
Tension
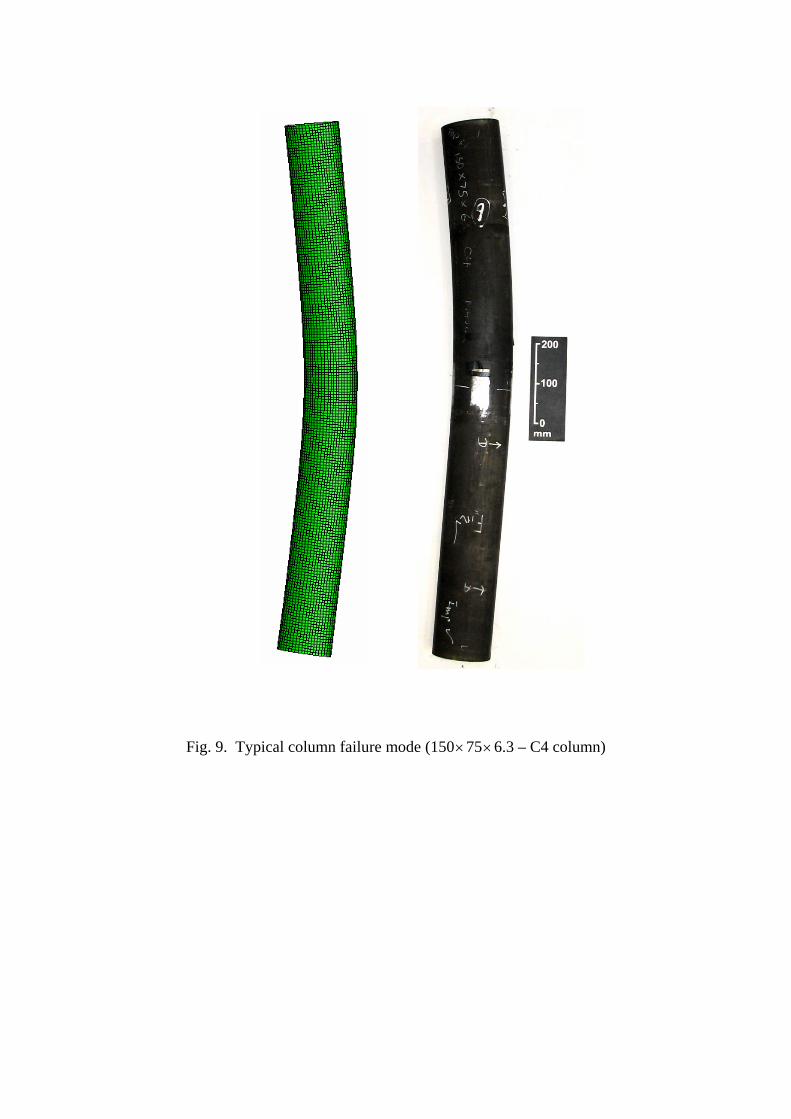
Fig. 9. Typical column failure mode (150756.3 – C4 column)
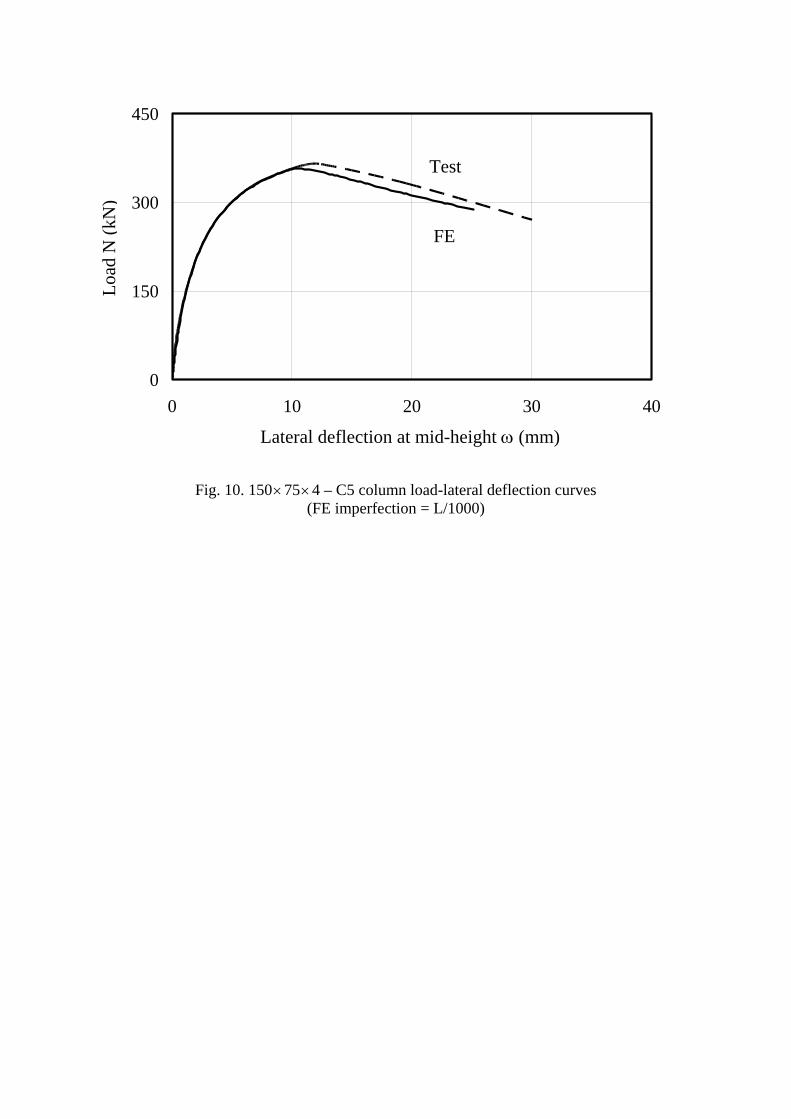
Fig. 10. 150754 – C5 column load-lateral deflection curves (FE imperfection = L/1000)
0
150
300
450
0 10 20 30 40
Lateral deflection at mid-height (mm)
Loa
d N
(kN
)
Test
FE
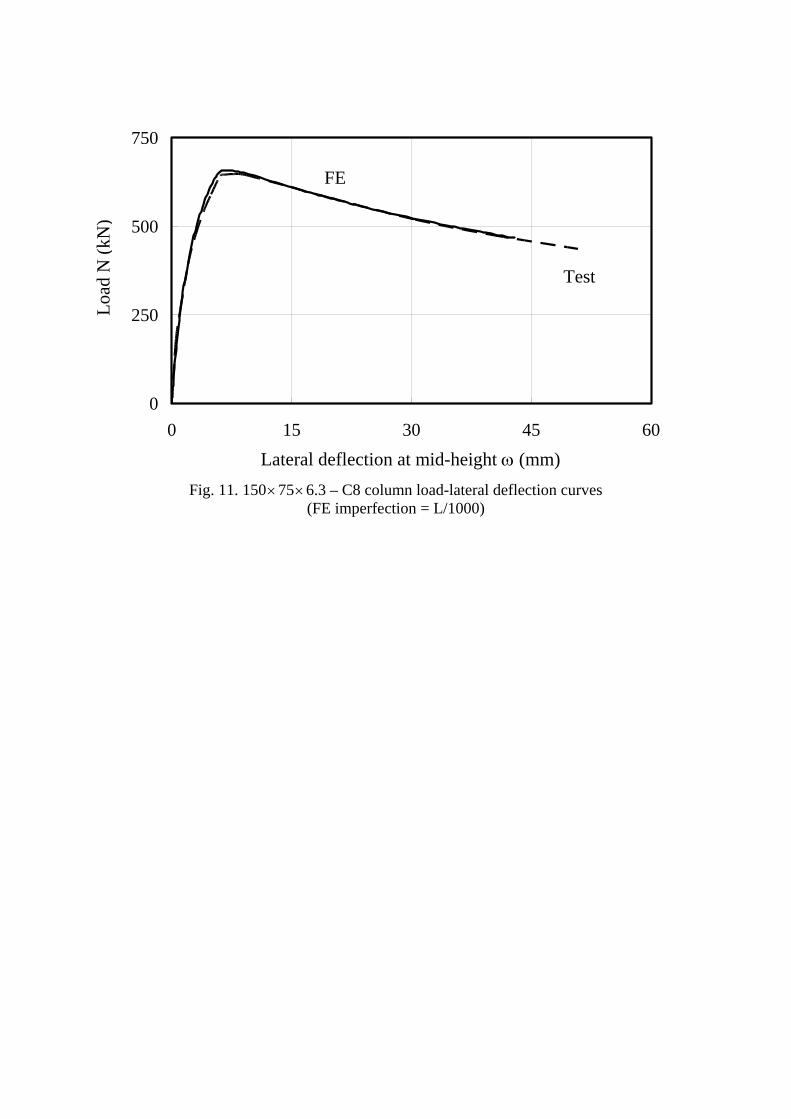
Fig. 11. 150756.3 – C8 column load-lateral deflection curves (FE imperfection = L/1000)
0
250
500
750
0 15 30 45 60
Lateral deflection at mid-height (mm)
Loa
d N
(kN
)
Test
FE

Fig. 12. Piecewise linear stress-strain model
Strain
Str
ess
(N/m
m2 )
0
100
200
300
400
500
600
0.00 0.02 0.04 0.06 0.08 0.10 0.12 0.14 0.16 0.18
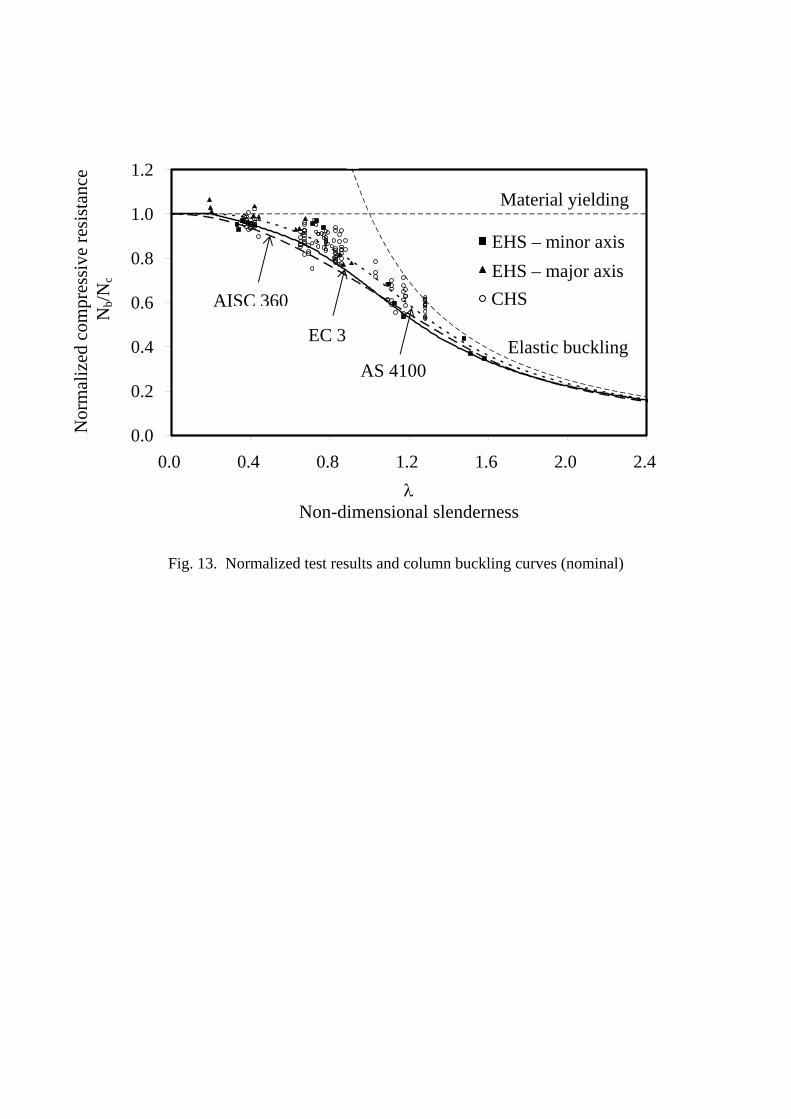
Fig. 13. Normalized test results and column buckling curves (nominal)
Nor
mal
ized
com
pres
sive
res
ista
nce
Nb/
Nc
0.0
0.2
0.4
0.6
0.8
1.0
1.2
0.0 0.4 0.8 1.2 1.6 2.0 2.4
Non-dimensional slenderness
AISC 360
AS 4100
EC 3
EHS – minor axis
CHS
EHS – major axis
Material yielding
Elastic buckling
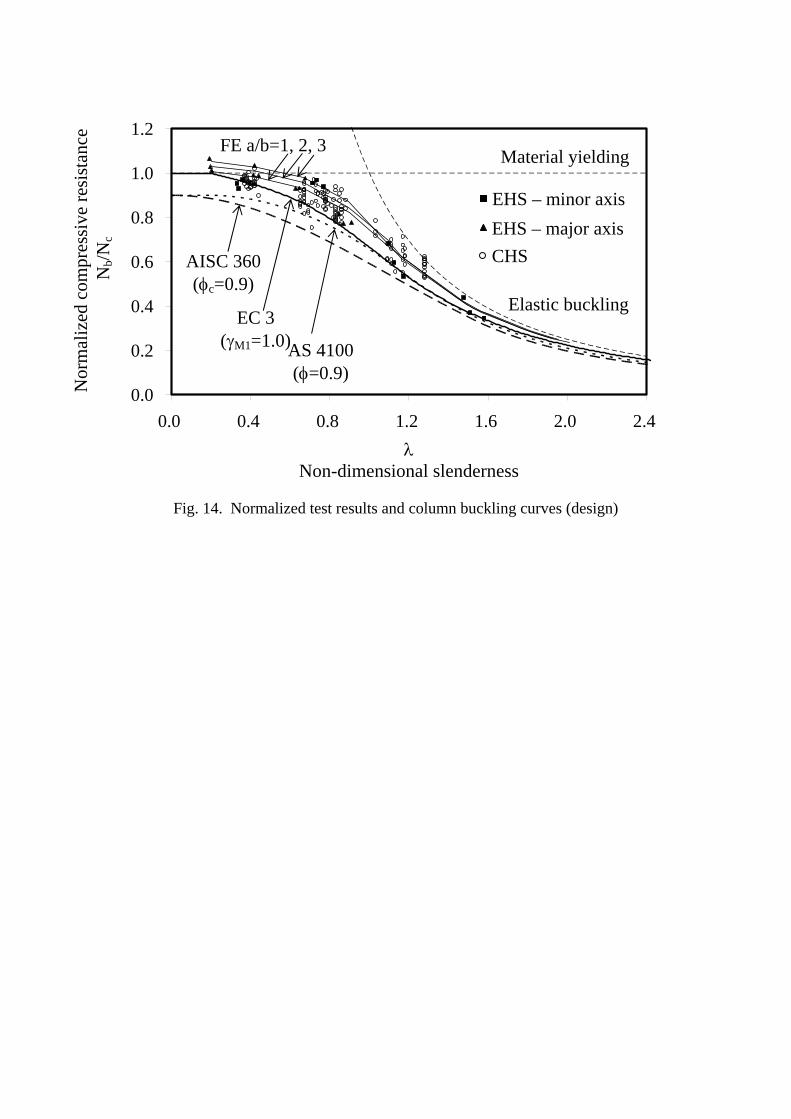
Fig. 14. Normalized test results and column buckling curves (design)
0.0
0.2
0.4
0.6
0.8
1.0
1.2
0.0 0.4 0.8 1.2 1.6 2.0 2.4
Nor
mal
ized
com
pres
sive
res
ista
nce
Nb/
Nc
Non-dimensional slenderness
AISC 360 (c=0.9)
AS 4100 (=0.9)
EC 3 (M1=1.0)
FE a/b=1, 2, 3
EHS – minor axis
CHS
EHS – major axis
Material yielding
Elastic buckling
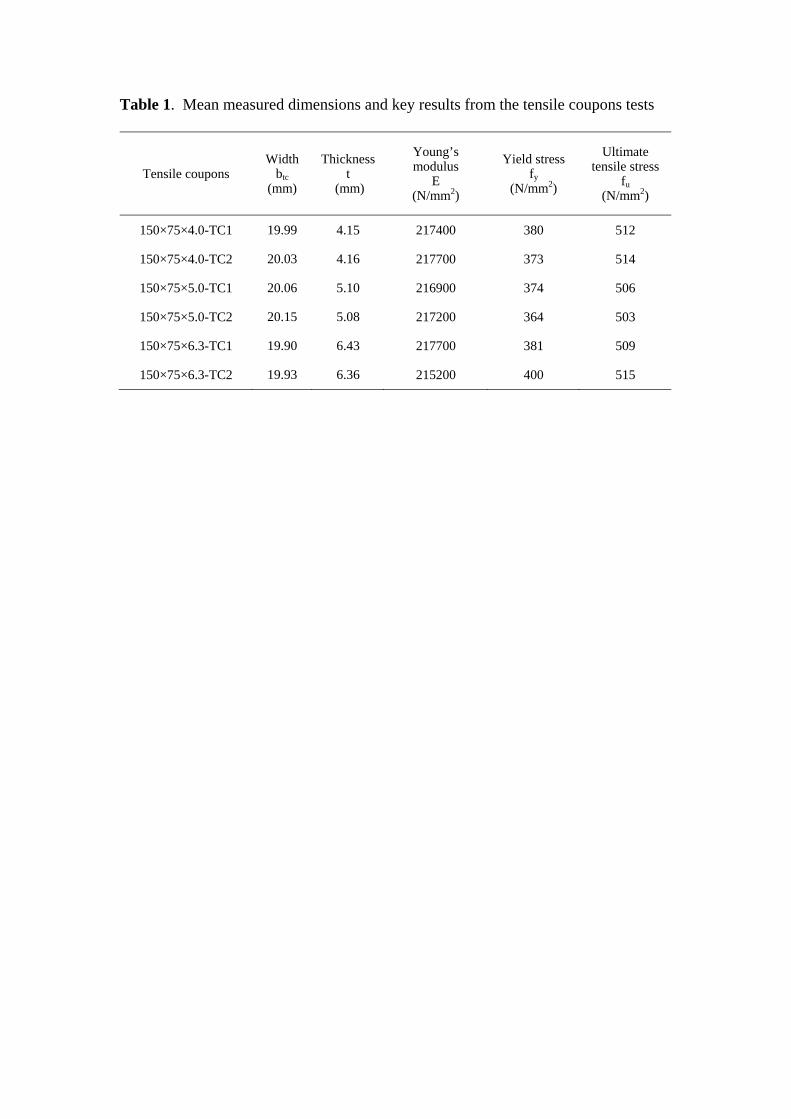
Table 1. Mean measured dimensions and key results from the tensile coupons tests
Tensile coupons Width
btc (mm)
Thickness t
(mm)
Young’s modulus
E (N/mm2)
Yield stress fy
(N/mm2)
Ultimate tensile stress
fu (N/mm2)
150×75×4.0-TC1 19.99 4.15 217400 380 512
150×75×4.0-TC2 20.03 4.16 217700 373 514
150×75×5.0-TC1 20.06 5.10 216900 374 506
150×75×5.0-TC2 20.15 5.08 217200 364 503
150×75×6.3-TC1 19.90 6.43 217700 381 509
150×75×6.3-TC2 19.93 6.36 215200 400 515
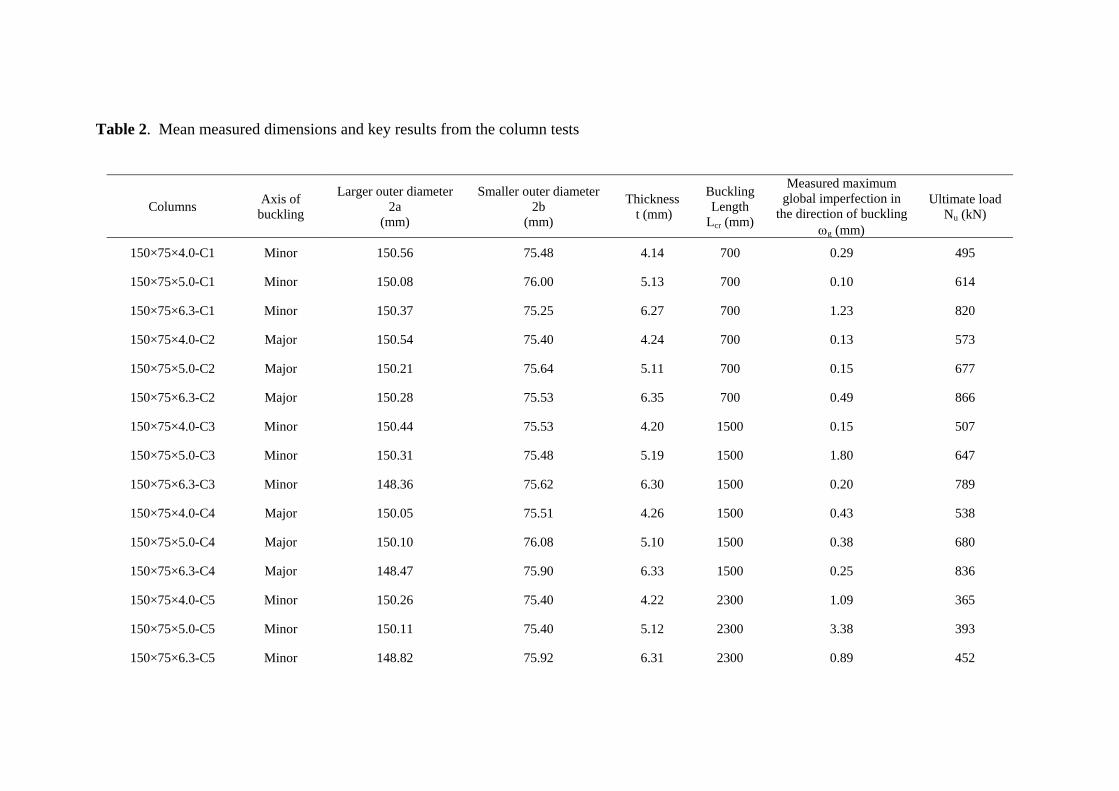
Table 2. Mean measured dimensions and key results from the column tests
Columns Axis of
buckling
Larger outer diameter 2a
(mm)
Smaller outer diameter 2b
(mm)
Thickness t (mm)
Buckling Length
Lcr (mm)
Measured maximum global imperfection in
the direction of buckling g (mm)
Ultimate load Nu (kN)
150×75×4.0-C1 Minor 150.56 75.48 4.14 700 0.29 495
150×75×5.0-C1 Minor 150.08 76.00 5.13 700 0.10 614
150×75×6.3-C1 Minor 150.37 75.25 6.27 700 1.23 820
150×75×4.0-C2 Major 150.54 75.40 4.24 700 0.13 573
150×75×5.0-C2 Major 150.21 75.64 5.11 700 0.15 677
150×75×6.3-C2 Major 150.28 75.53 6.35 700 0.49 866
150×75×4.0-C3 Minor 150.44 75.53 4.20 1500 0.15 507
150×75×5.0-C3 Minor 150.31 75.48 5.19 1500 1.80 647
150×75×6.3-C3 Minor 148.36 75.62 6.30 1500 0.20 789
150×75×4.0-C4 Major 150.05 75.51 4.26 1500 0.43 538
150×75×5.0-C4 Major 150.10 76.08 5.10 1500 0.38 680
150×75×6.3-C4 Major 148.47 75.90 6.33 1500 0.25 836
150×75×4.0-C5 Minor 150.26 75.40 4.22 2300 1.09 365
150×75×5.0-C5 Minor 150.11 75.40 5.12 2300 3.38 393
150×75×6.3-C5 Minor 148.82 75.92 6.31 2300 0.89 452

150×75×4.0-C6 Major 150.34 75.46 4.17 2300 0.46 489
150×75×5.0-C6 Major 150.05 75.54 5.09 2300 1.02 611
150×75×6.3-C6 Major 148.77 75.78 6.21 2300 0.25 814
150×75×4.0-C7 Minor 150.50 75.45 4.22 3100 1.93 234
150×75×5.0-C7 Minor 149.93 75.79 5.09 3100 1.55 242
150×75×6.3-C7 Minor 148.77 75.85 6.28 3100 0.74 292
150×75×4.0-C8 Major 150.46 75.43 4.18 3100 0.25 429
150×75×5.0-C8 Major 150.03 75.67 5.13 3100 1.32 509
150×75×6.3-C8 Major 148.60 75.91 6.21 3100 0.42 648
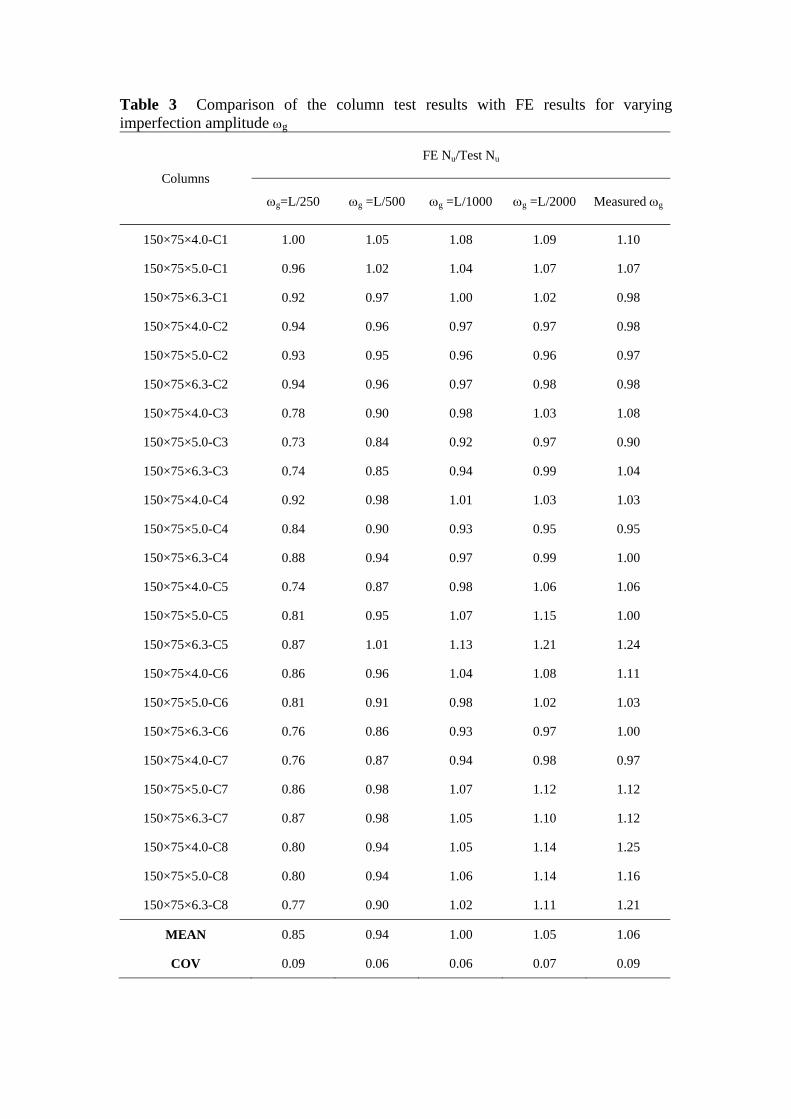
Table 3 Comparison of the column test results with FE results for varying imperfection amplitude g
Columns
FE Nu/Test Nu
g=L/250 g =L/500 g =L/1000 g =L/2000 Measured g
150×75×4.0-C1 1.00 1.05 1.08 1.09 1.10
150×75×5.0-C1 0.96 1.02 1.04 1.07 1.07
150×75×6.3-C1 0.92 0.97 1.00 1.02 0.98
150×75×4.0-C2 0.94 0.96 0.97 0.97 0.98
150×75×5.0-C2 0.93 0.95 0.96 0.96 0.97
150×75×6.3-C2 0.94 0.96 0.97 0.98 0.98
150×75×4.0-C3 0.78 0.90 0.98 1.03 1.08
150×75×5.0-C3 0.73 0.84 0.92 0.97 0.90
150×75×6.3-C3 0.74 0.85 0.94 0.99 1.04
150×75×4.0-C4 0.92 0.98 1.01 1.03 1.03
150×75×5.0-C4 0.84 0.90 0.93 0.95 0.95
150×75×6.3-C4 0.88 0.94 0.97 0.99 1.00
150×75×4.0-C5 0.74 0.87 0.98 1.06 1.06
150×75×5.0-C5 0.81 0.95 1.07 1.15 1.00
150×75×6.3-C5 0.87 1.01 1.13 1.21 1.24
150×75×4.0-C6 0.86 0.96 1.04 1.08 1.11
150×75×5.0-C6 0.81 0.91 0.98 1.02 1.03
150×75×6.3-C6 0.76 0.86 0.93 0.97 1.00
150×75×4.0-C7 0.76 0.87 0.94 0.98 0.97
150×75×5.0-C7 0.86 0.98 1.07 1.12 1.12
150×75×6.3-C7 0.87 0.98 1.05 1.10 1.12
150×75×4.0-C8 0.80 0.94 1.05 1.14 1.25
150×75×5.0-C8 0.80 0.94 1.06 1.14 1.16
150×75×6.3-C8 0.77 0.90 1.02 1.11 1.21
MEAN 0.85 0.94 1.00 1.05 1.06
COV 0.09 0.06 0.06 0.07 0.09
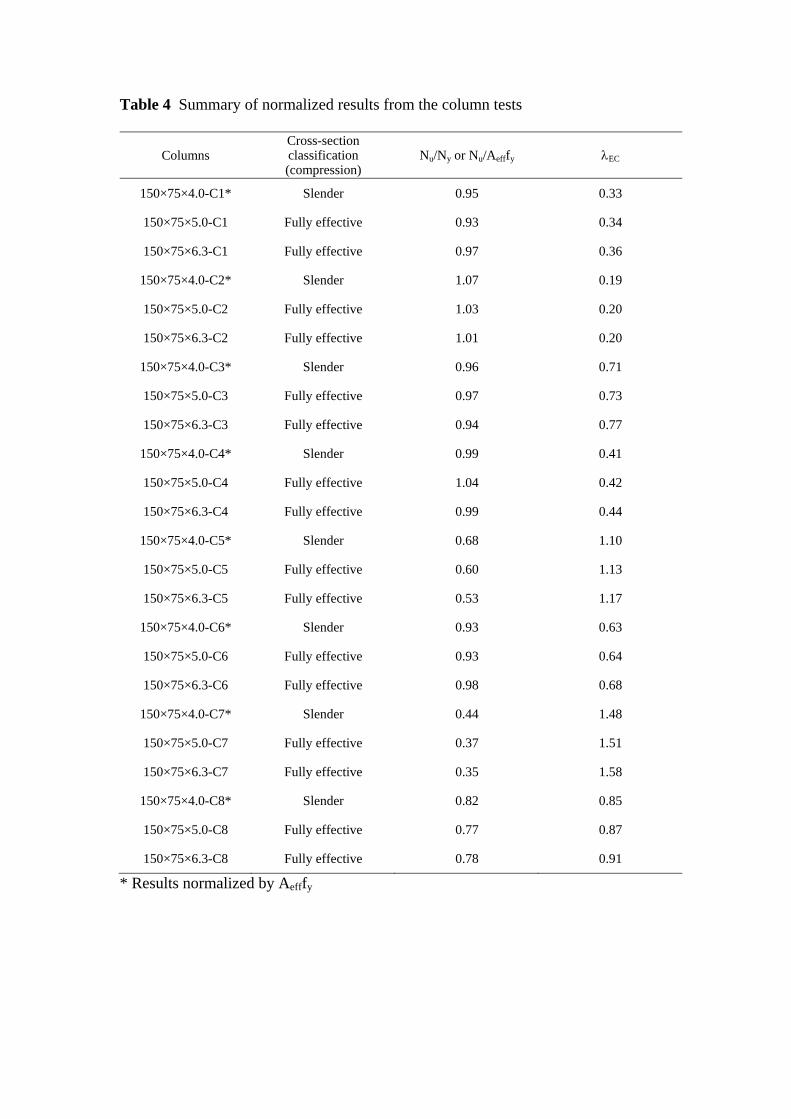
Table 4 Summary of normalized results from the column tests
Columns Cross-section classification (compression)
Nu/Ny or Nu/Aefffy EC
150×75×4.0-C1* Slender 0.95 0.33
150×75×5.0-C1 Fully effective 0.93 0.34
150×75×6.3-C1 Fully effective 0.97 0.36
150×75×4.0-C2* Slender 1.07 0.19
150×75×5.0-C2 Fully effective 1.03 0.20
150×75×6.3-C2 Fully effective 1.01 0.20
150×75×4.0-C3* Slender 0.96 0.71
150×75×5.0-C3 Fully effective 0.97 0.73
150×75×6.3-C3 Fully effective 0.94 0.77
150×75×4.0-C4* Slender 0.99 0.41
150×75×5.0-C4 Fully effective 1.04 0.42
150×75×6.3-C4 Fully effective 0.99 0.44
150×75×4.0-C5* Slender 0.68 1.10
150×75×5.0-C5 Fully effective 0.60 1.13
150×75×6.3-C5 Fully effective 0.53 1.17
150×75×4.0-C6* Slender 0.93 0.63
150×75×5.0-C6 Fully effective 0.93 0.64
150×75×6.3-C6 Fully effective 0.98 0.68
150×75×4.0-C7* Slender 0.44 1.48
150×75×5.0-C7 Fully effective 0.37 1.51
150×75×6.3-C7 Fully effective 0.35 1.58
150×75×4.0-C8* Slender 0.82 0.85
150×75×5.0-C8 Fully effective 0.77 0.87
150×75×6.3-C8 Fully effective 0.78 0.91
* Results normalized by Aefffy
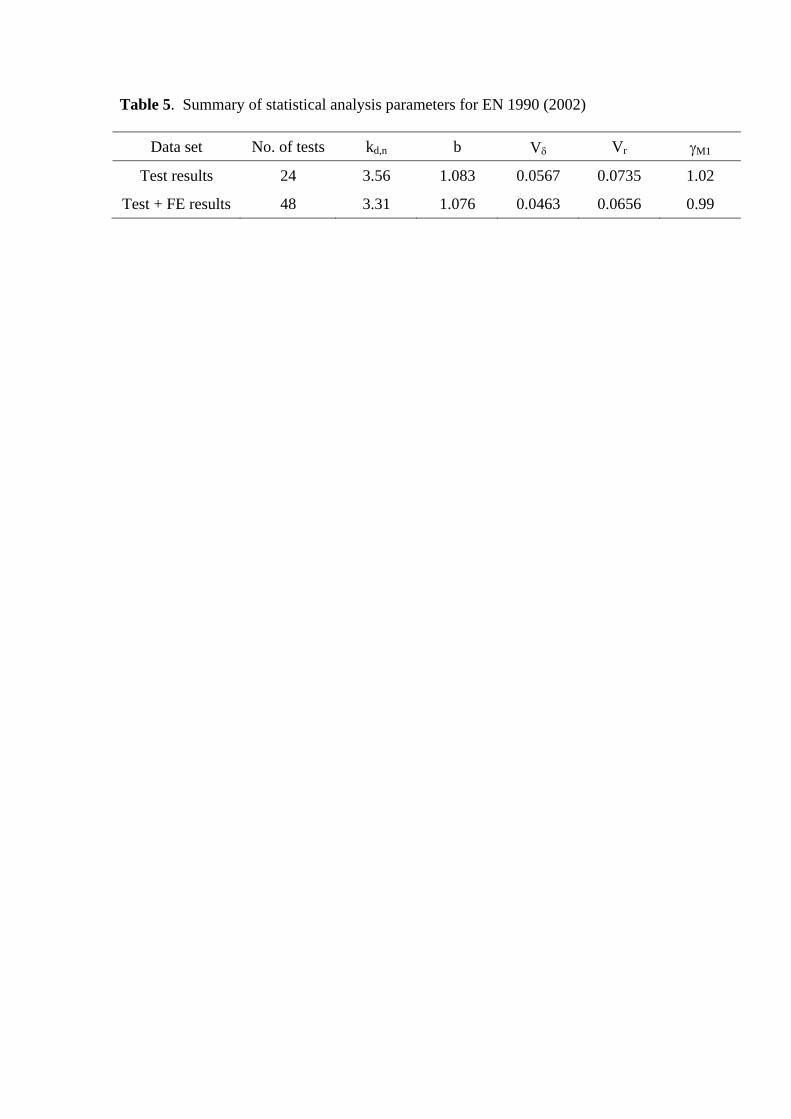
Table 5. Summary of statistical analysis parameters for EN 1990 (2002)
Data set No. of tests kd,n b V Vr M1
Test results 24 3.56 1.083 0.0567 0.0735 1.02
Test + FE results 48 3.31 1.076 0.0463 0.0656 0.99
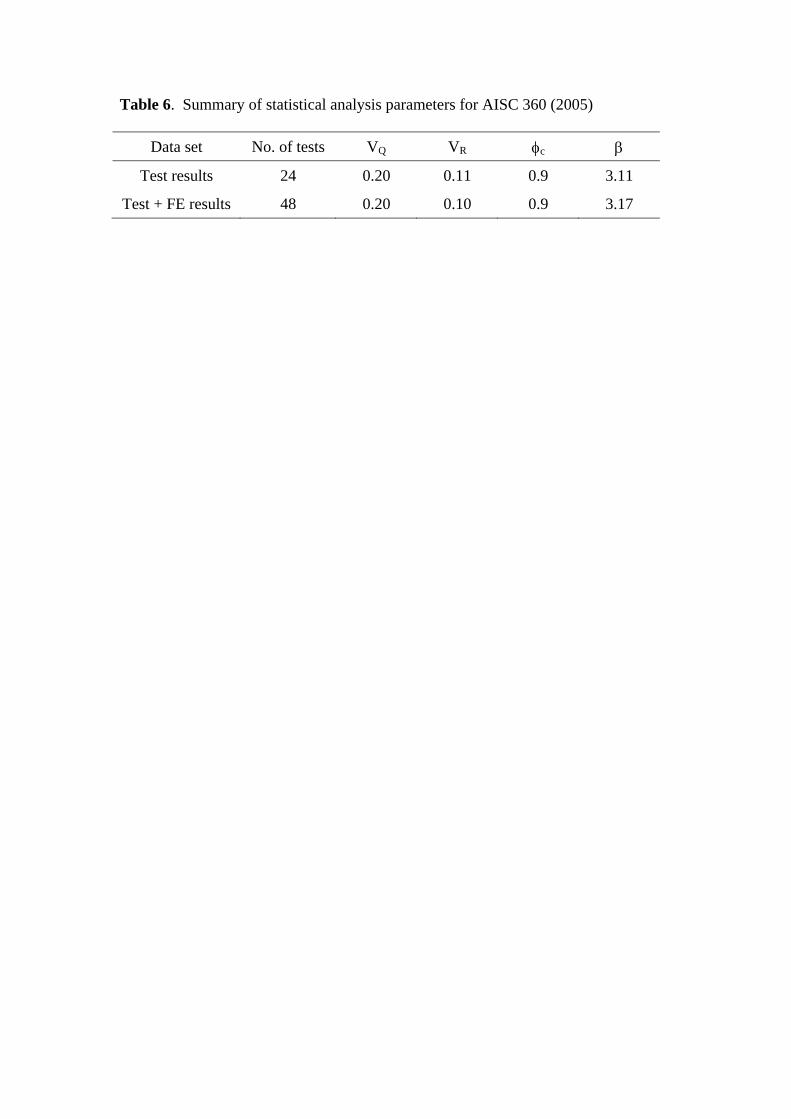
Table 6. Summary of statistical analysis parameters for AISC 360 (2005)
Data set No. of tests VQ VR c
Test results 24 0.20 0.11 0.9 3.11
Test + FE results 48 0.20 0.10 0.9 3.17


