
Food and Beverage Management
Appraising Performance
© 2011 Cousins et al: Food and Beverage Management, 3rd edition, Goodfellows Publishers
Performance appraisal
Revenue Costs Profits The product
© 2011 Cousins et al: Food and Beverage Management, 3rd edition, Goodfellows Publishers
Fundamentals of appraisal
Knowing goals and objectives
Placing a value on a measurement
Being prepared to make decisions
© 2011 Cousins et al: Food and Beverage Management, 3rd edition, Goodfellows Publishers
Basis of appraisal
Established aims and objectives
Existing budgets
Existing standards required
© 2011 Cousins et al: Food and Beverage Management, 3rd edition, Goodfellows Publishers
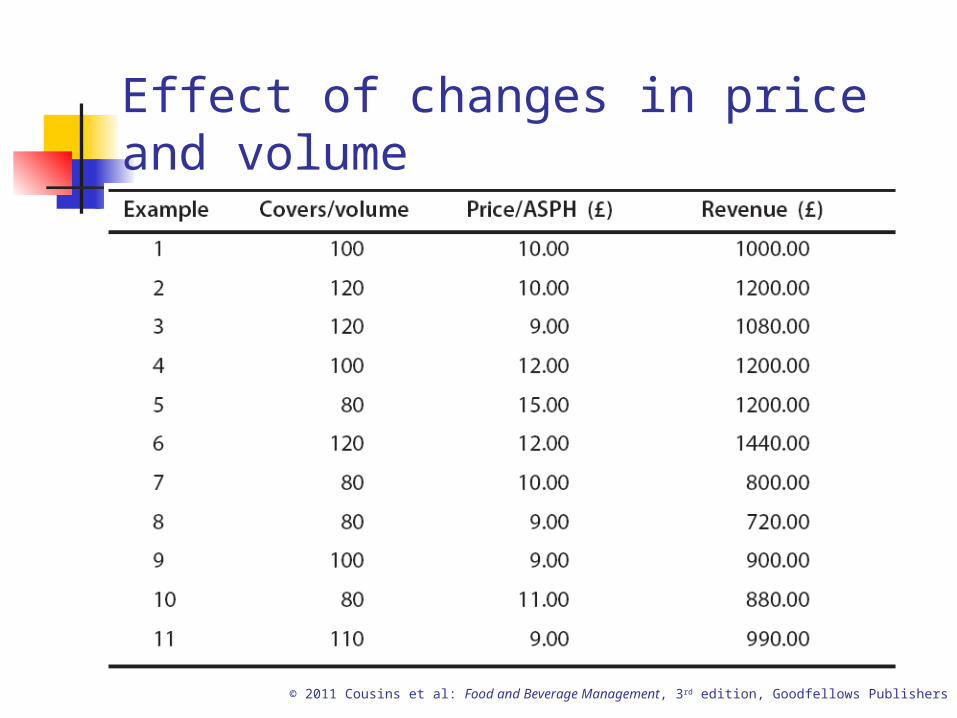
Effect of changes in price and volume
© 2011 Cousins et al: Food and Beverage Management, 3rd edition, Goodfellows Publishers
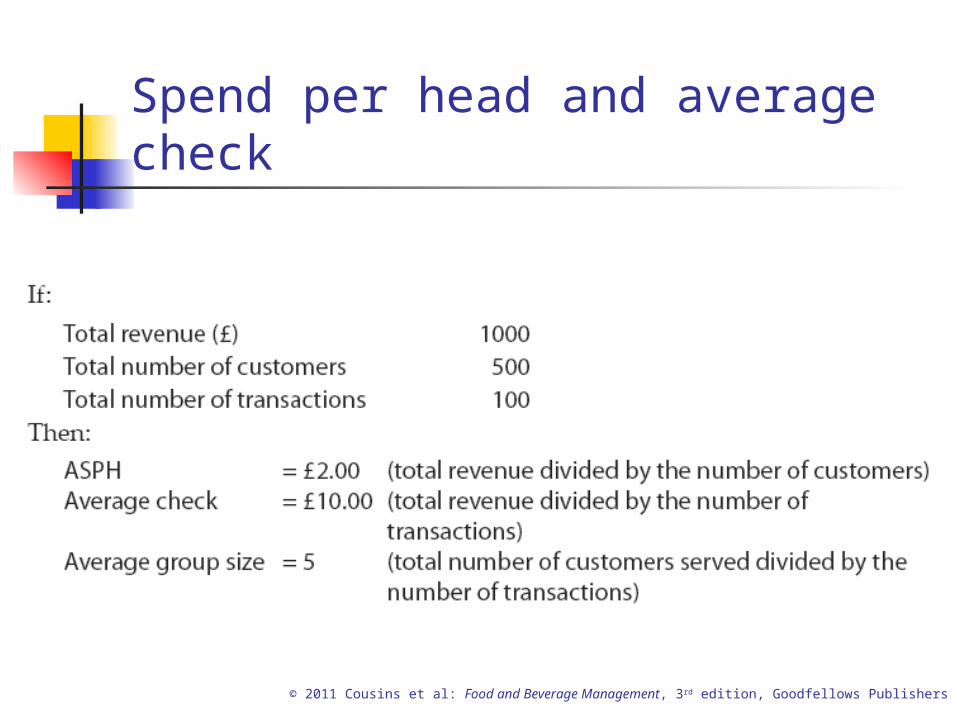
Spend per head and average check
© 2011 Cousins et al: Food and Beverage Management, 3rd edition, Goodfellows Publishers
Key points of revenue appraisal Revenue is product of price and volume Appraisal needs to take account of changes in
both price and volume Averages not always accurate and prone to
misinterpretation Allow for inflation and/or price rises Need to compare like with like Incorporate 12-month rolling totals to
determine true trends and performance Revenue cannot be fully appraised by itself
© 2011 Cousins et al: Food and Beverage Management, 3rd edition, Goodfellows Publishers
Appraising costs
Fixed costs
Variable costs
Semi-variable costs
© 2011 Cousins et al: Food and Beverage Management, 3rd edition, Goodfellows Publishers
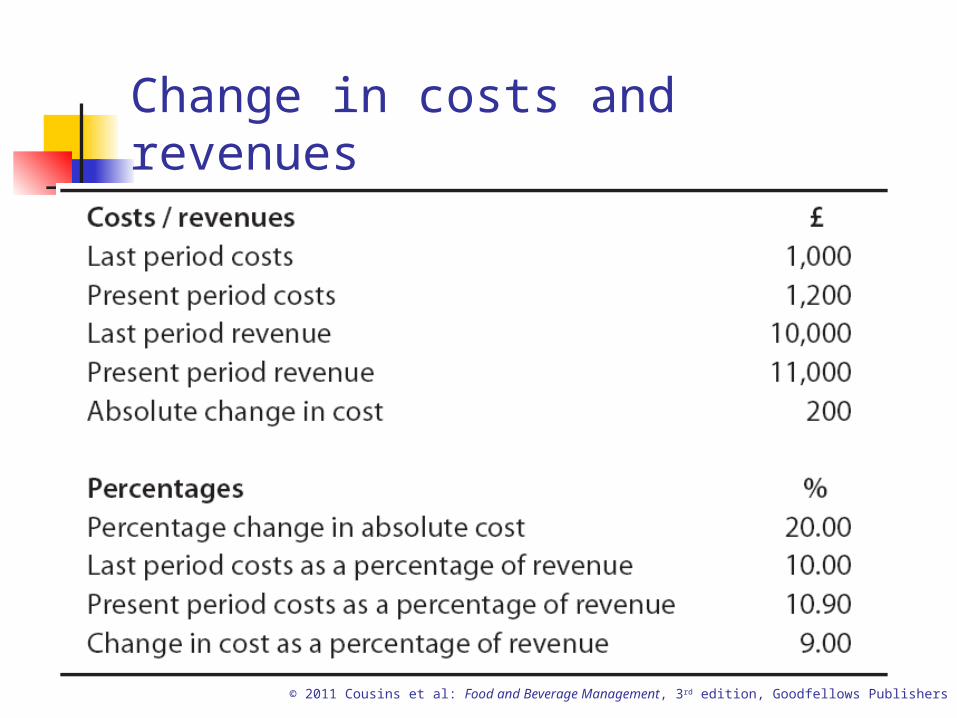
Change in costs and revenues
© 2011 Cousins et al: Food and Beverage Management, 3rd edition, Goodfellows Publishers
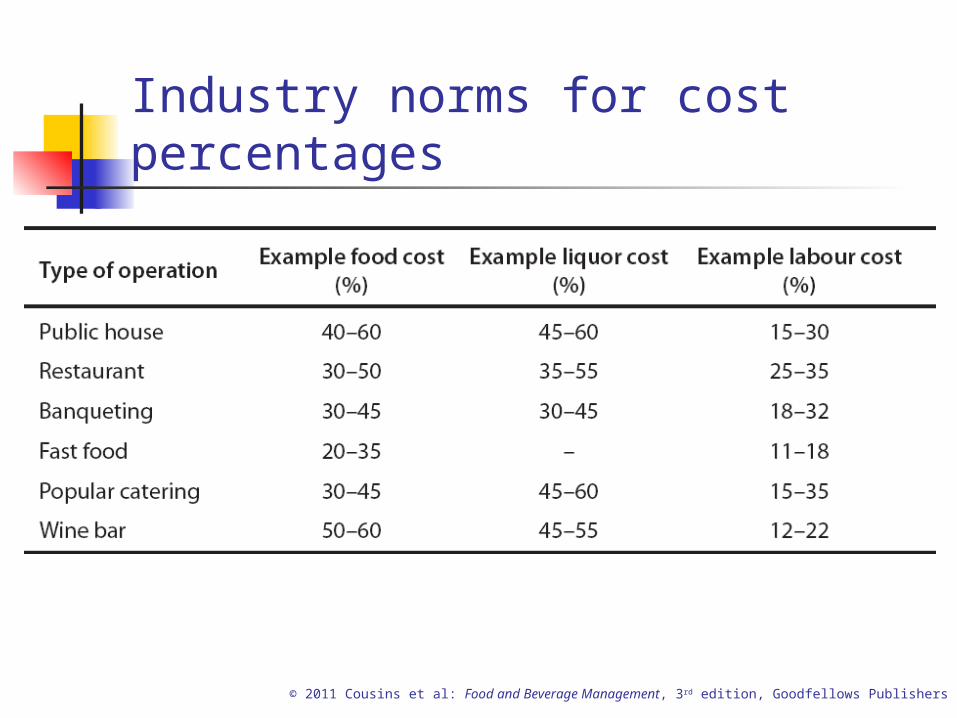
Industry norms for cost percentages
© 2011 Cousins et al: Food and Beverage Management, 3rd edition, Goodfellows Publishers
Key points of cost appraisal Structures vary, and change over time Can be measured in cash or percentages Proportional relationship between costs Relationship between costs and inflation Cross-sectional and time-series analyses useful 12-month rolling totals identify true performance Operators with the lowest costs perceived as
having a key advantage Allocating indirect costs more complex than
allocating direct costs
© 2011 Cousins et al: Food and Beverage Management, 3rd edition, Goodfellows Publishers
Profitability measures
Gross profit Operating profit Net profit Net operating profit Departmental and unit profit Yield
© 2011 Cousins et al: Food and Beverage Management, 3rd edition, Goodfellows Publishers
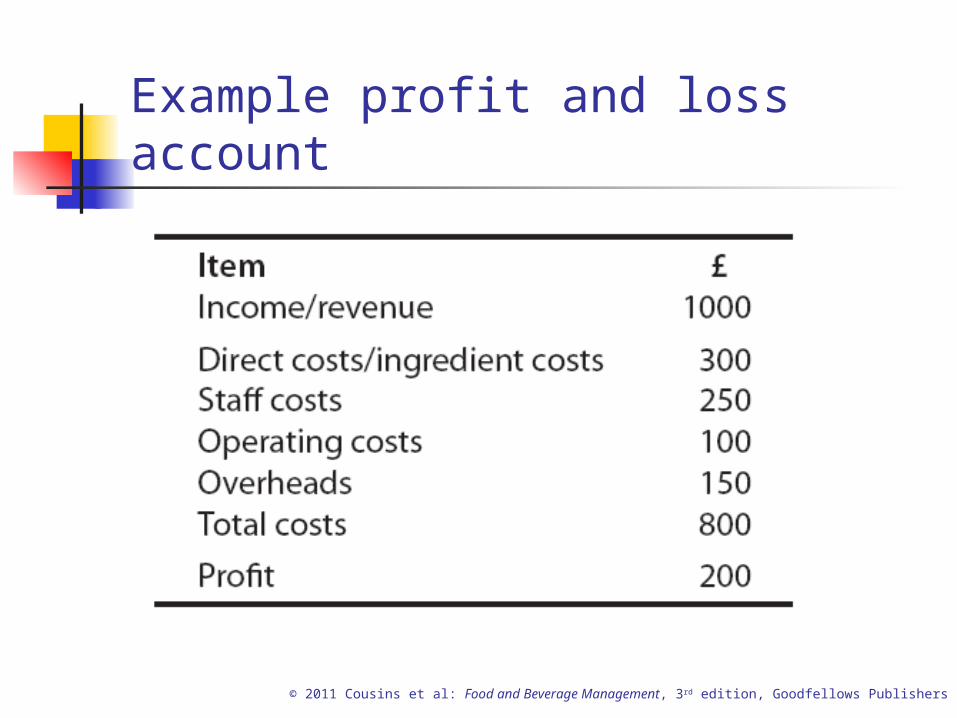
Example profit and loss account
© 2011 Cousins et al: Food and Beverage Management, 3rd edition, Goodfellows Publishers
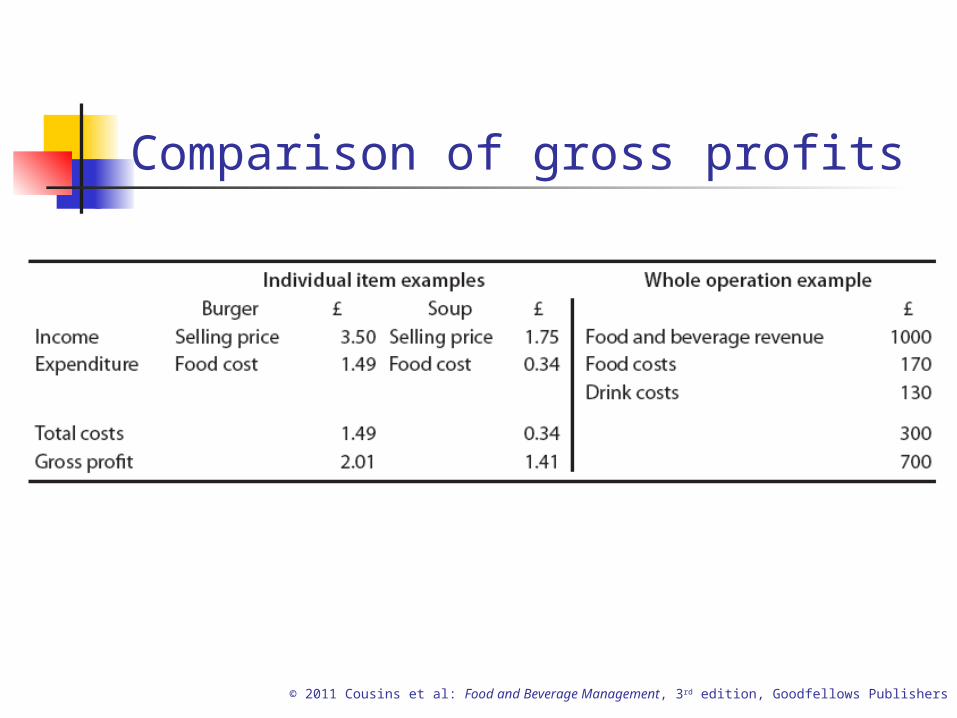
Comparison of gross profits
© 2011 Cousins et al: Food and Beverage Management, 3rd edition, Goodfellows Publishers
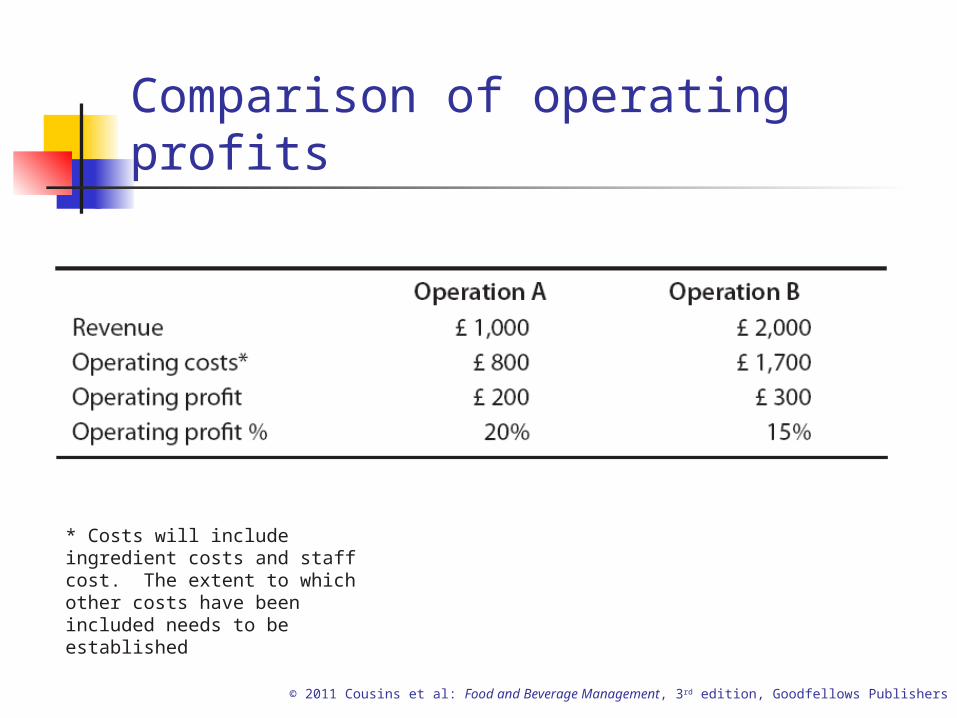
Comparison of operating profits
* Costs will include ingredient costs and staff cost. The extent to which other costs have been included needs to be established
© 2011 Cousins et al: Food and Beverage Management, 3rd edition, Goodfellows Publishers
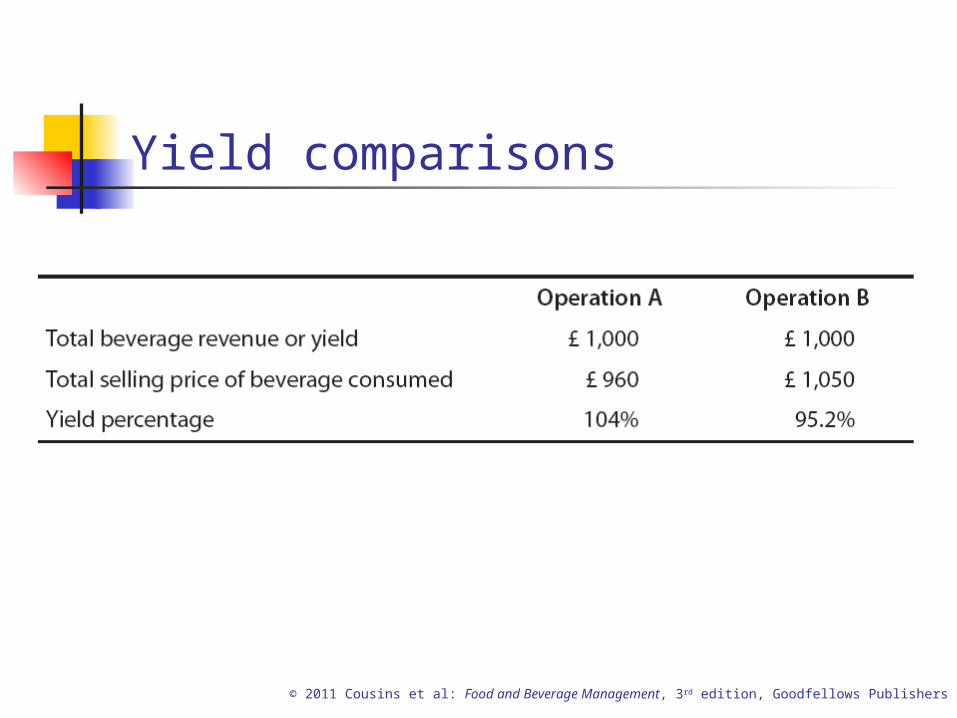
Yield comparisons
© 2011 Cousins et al: Food and Beverage Management, 3rd edition, Goodfellows Publishers
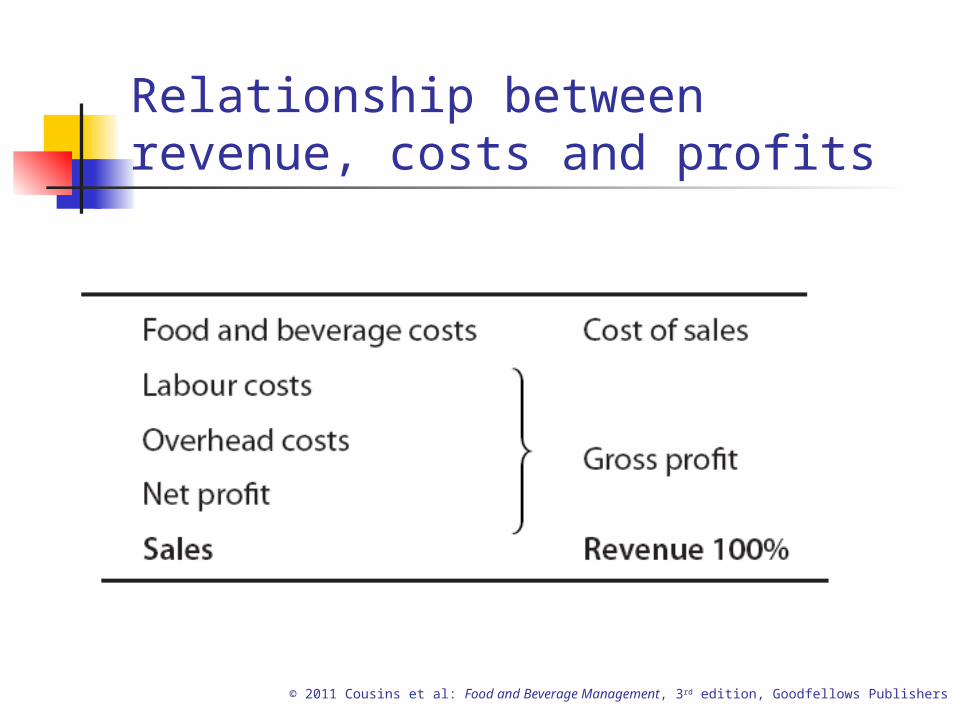
Relationship between revenue, costs and profits
© 2011 Cousins et al: Food and Beverage Management, 3rd edition, Goodfellows Publishers
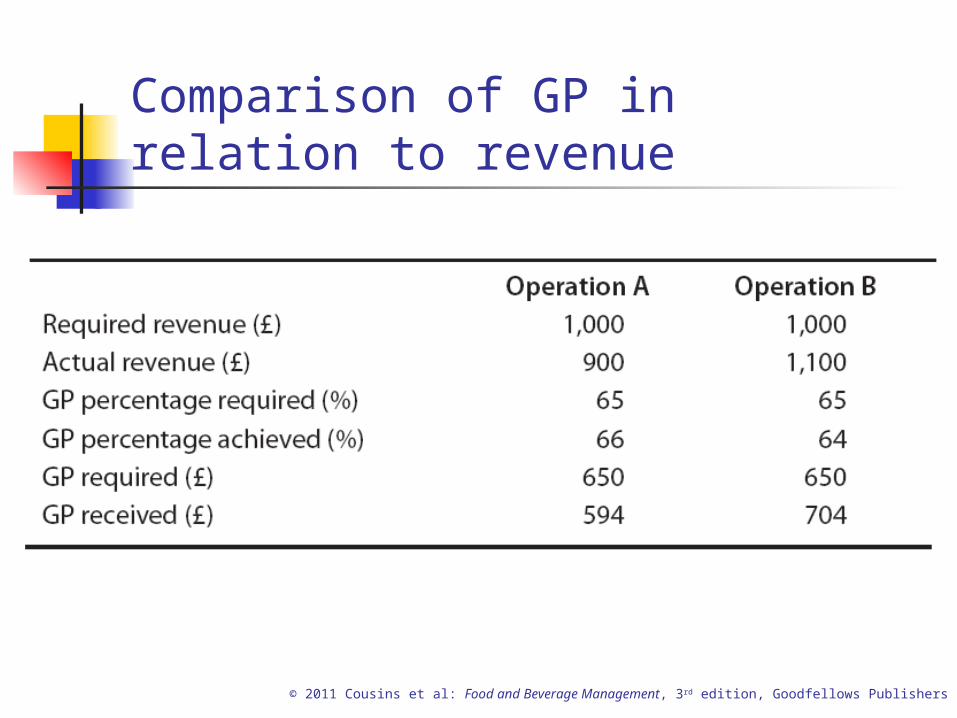
Comparison of GP in relation to revenue
© 2011 Cousins et al: Food and Beverage Management, 3rd edition, Goodfellows Publishers
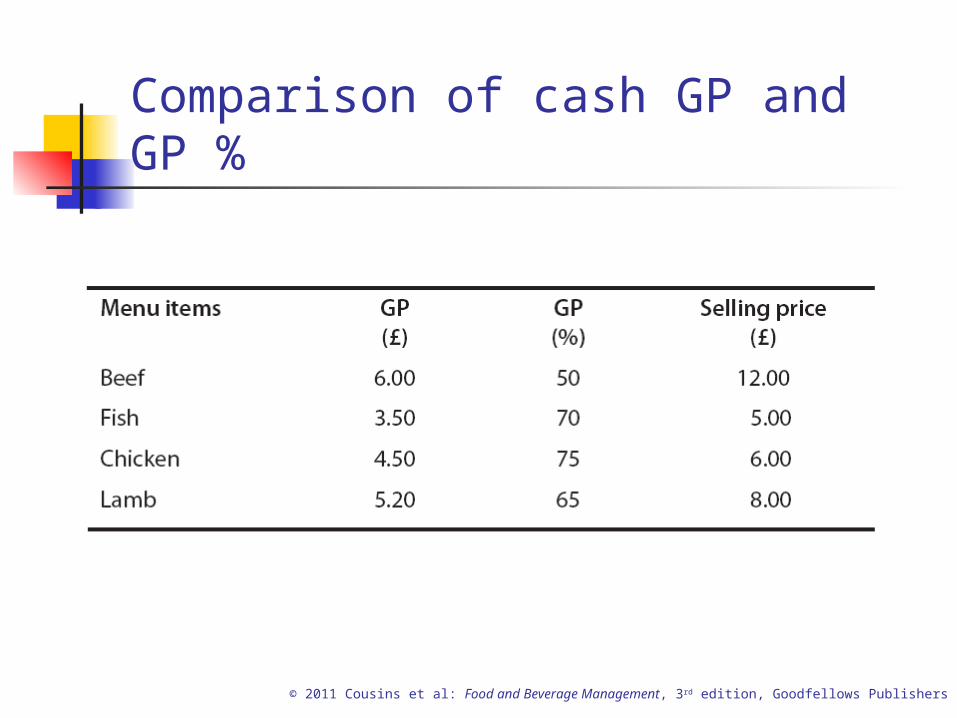
Comparison of cash GP and GP %
© 2011 Cousins et al: Food and Beverage Management, 3rd edition, Goodfellows Publishers
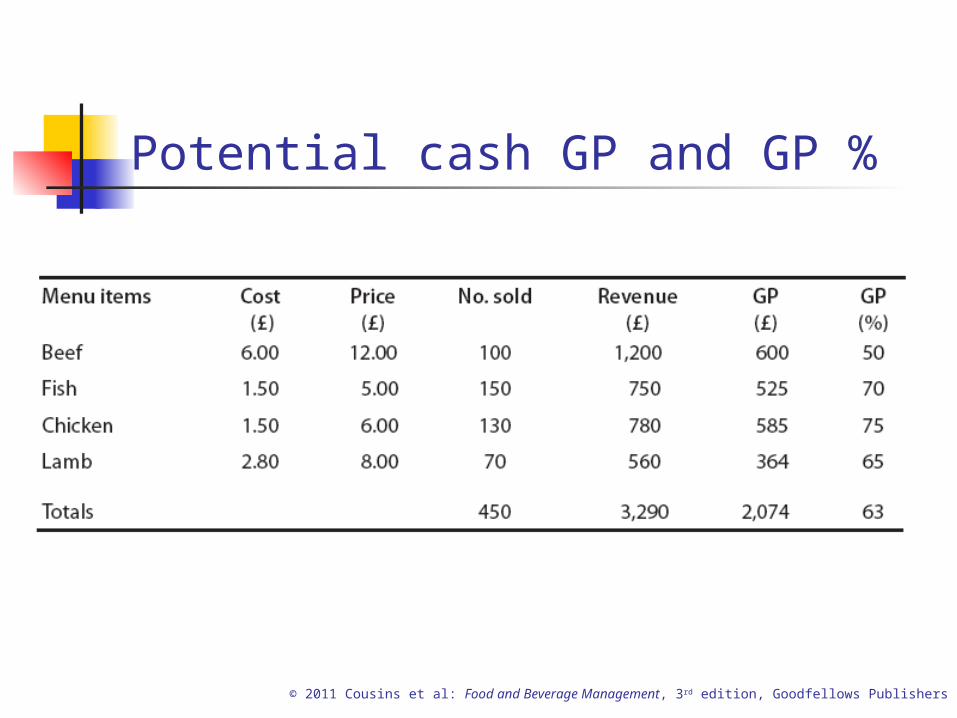
Potential cash GP and GP %
© 2011 Cousins et al: Food and Beverage Management, 3rd edition, Goodfellows Publishers
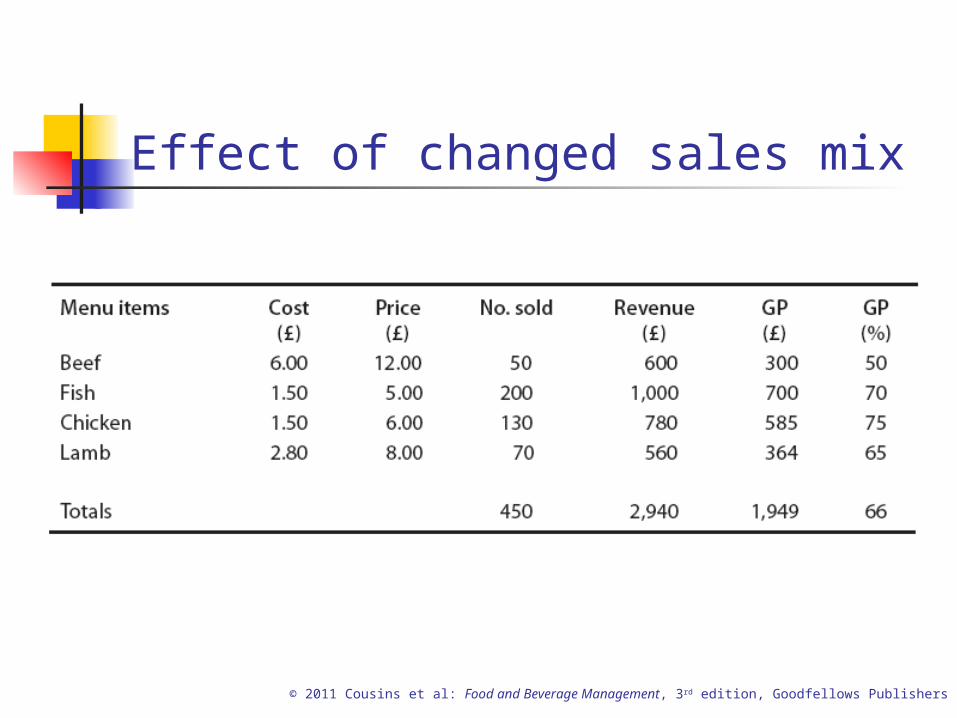
Effect of changed sales mix
© 2011 Cousins et al: Food and Beverage Management, 3rd edition, Goodfellows Publishers
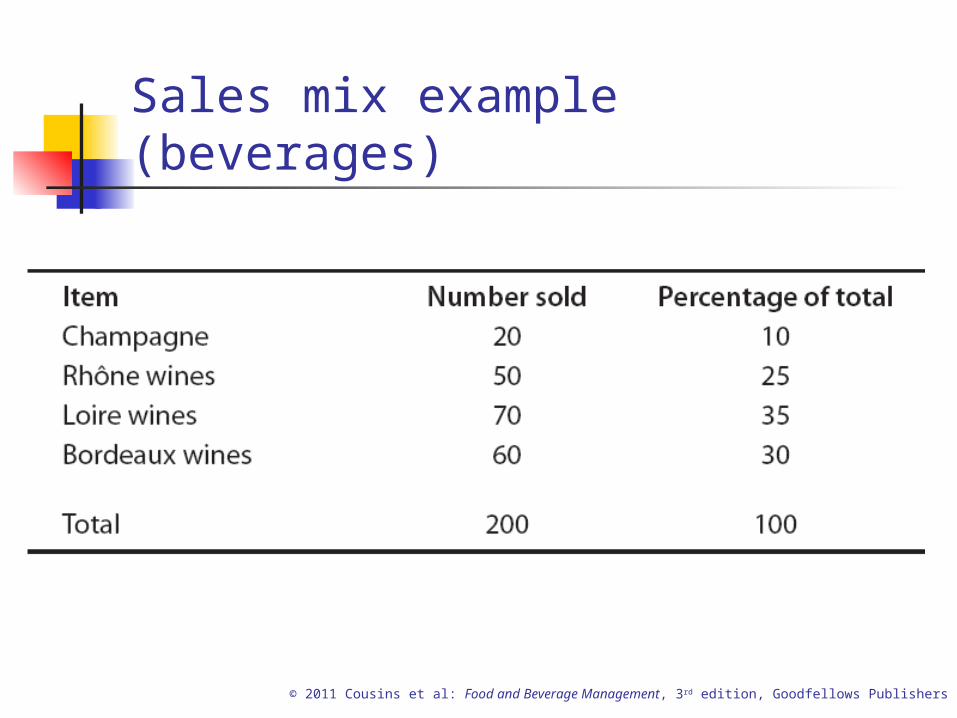
Sales mix example (beverages)
© 2011 Cousins et al: Food and Beverage Management, 3rd edition, Goodfellows Publishers
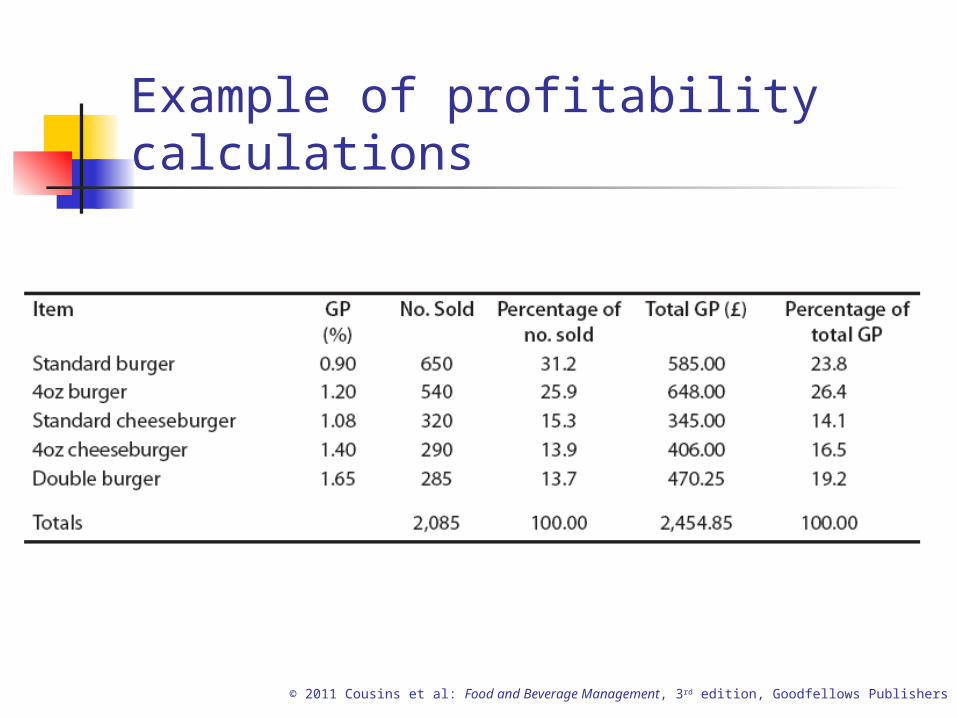
Example of profitability calculations
© 2011 Cousins et al: Food and Beverage Management, 3rd edition, Goodfellows Publishers
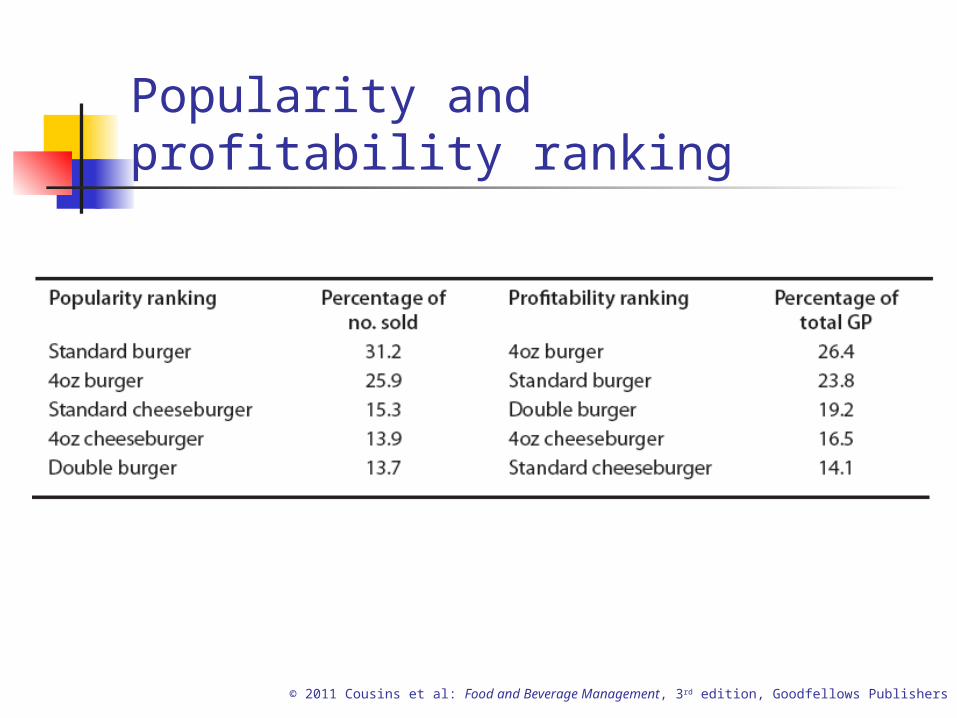
Popularity and profitability ranking
© 2011 Cousins et al: Food and Beverage Management, 3rd edition, Goodfellows Publishers
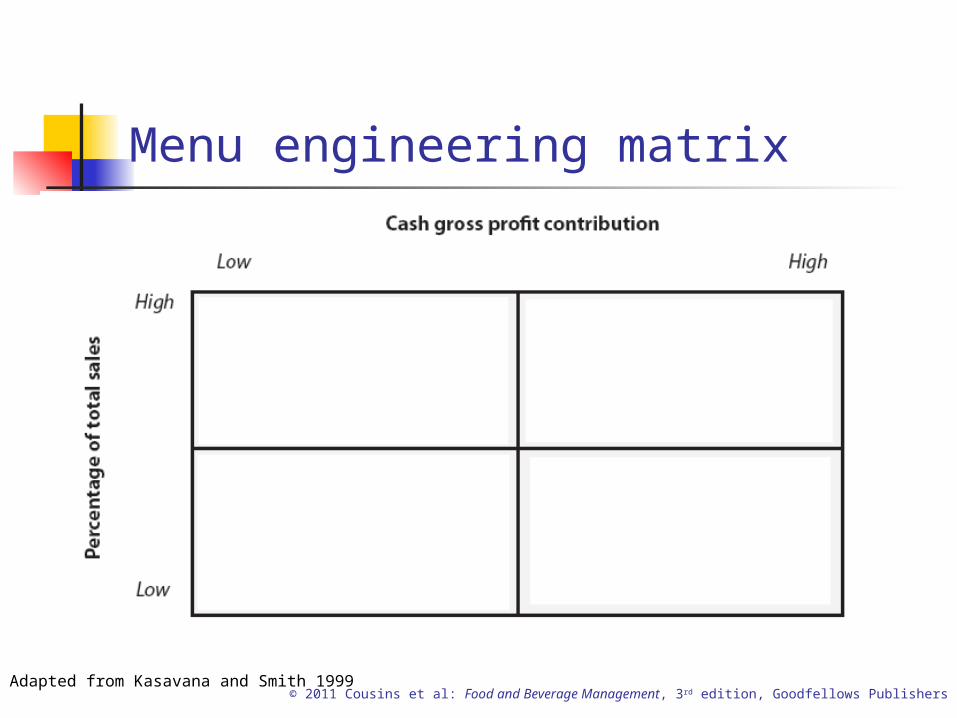
Menu engineering matrix
Adapted from Kasavana and Smith 1999
© 2011 Cousins et al: Food and Beverage Management, 3rd edition, Goodfellows Publishers
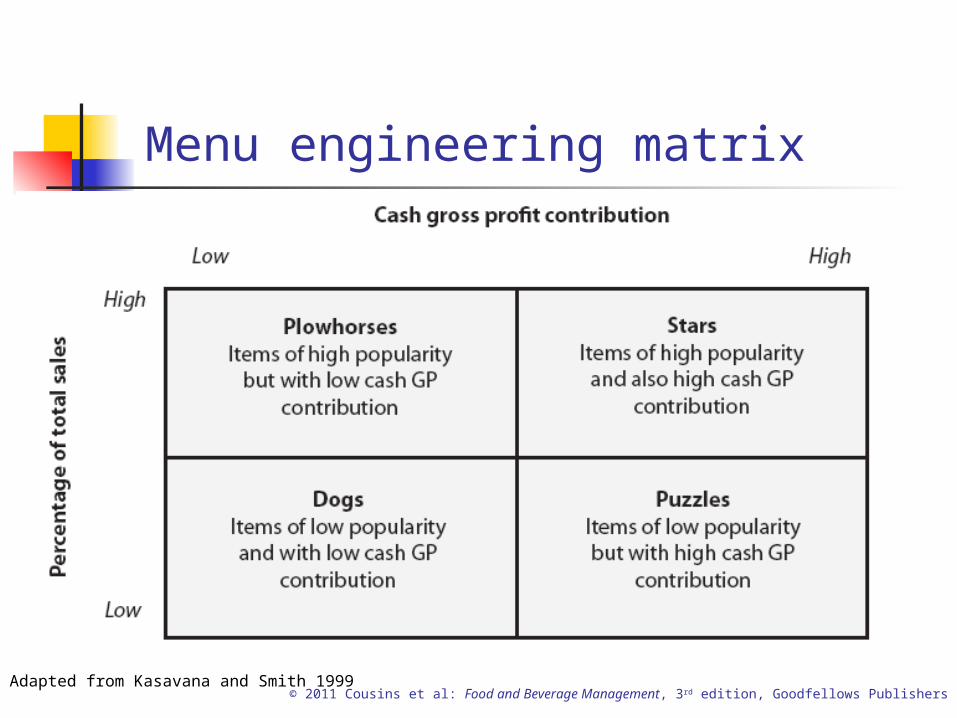
Menu engineering matrix
Adapted from Kasavana and Smith 1999
© 2011 Cousins et al: Food and Beverage Management, 3rd edition, Goodfellows Publishers
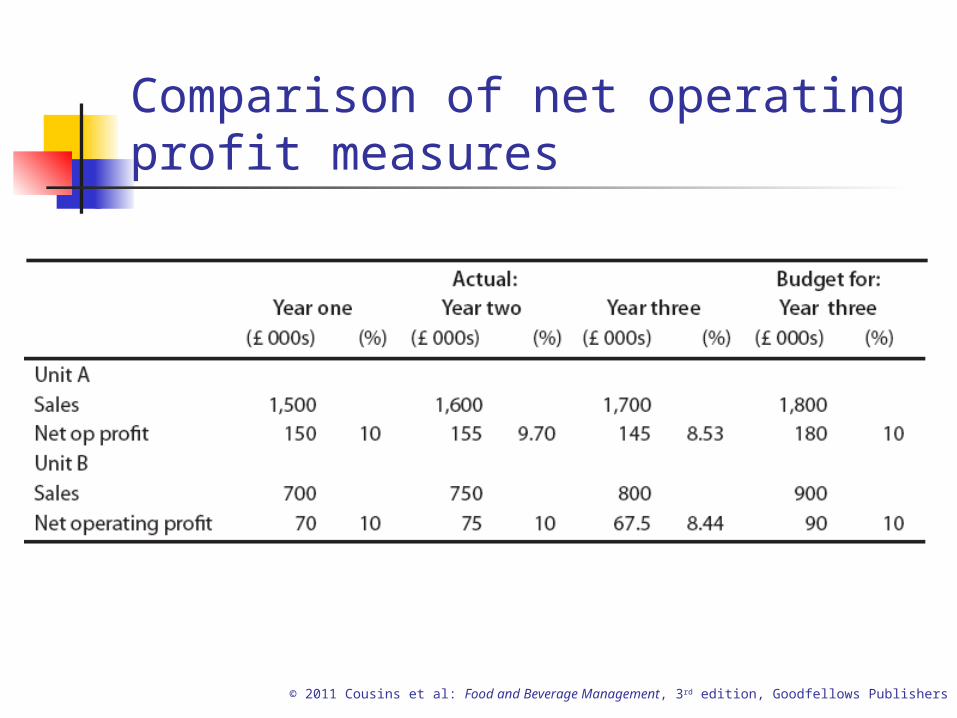
Comparison of net operating profit measures
© 2011 Cousins et al: Food and Beverage Management, 3rd edition, Goodfellows Publishers
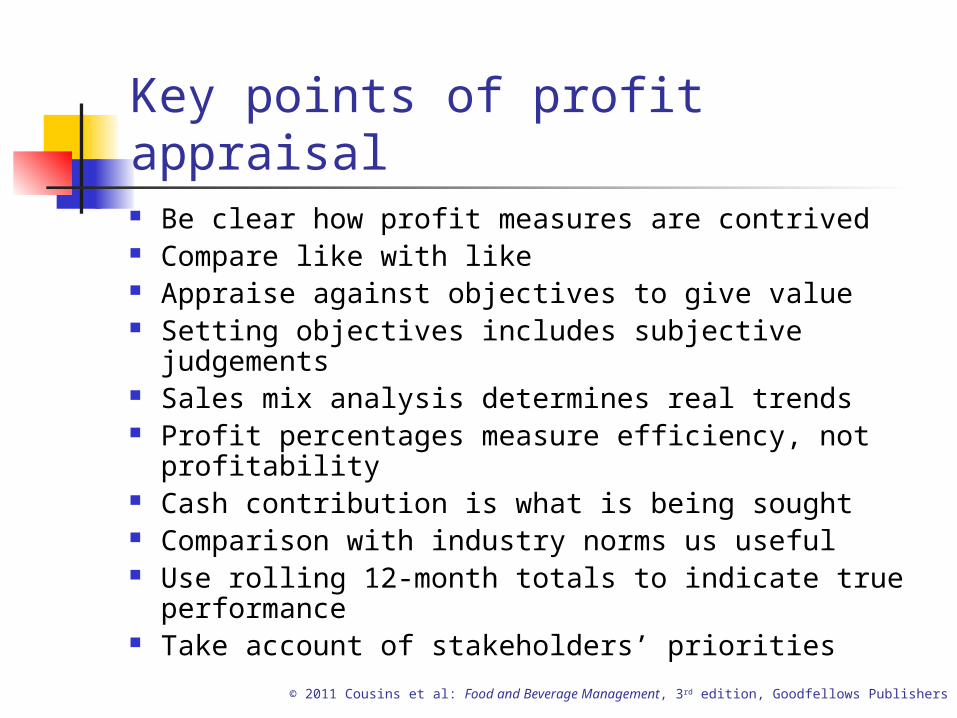
Key points of profit appraisal Be clear how profit measures are contrived Compare like with like Appraise against objectives to give value Setting objectives includes subjective judgements Sales mix analysis determines real trends Profit percentages measure efficiency, not
profitability Cash contribution is what is being sought Comparison with industry norms us useful Use rolling 12-month totals to indicate true
performance Take account of stakeholders’ priorities
© 2011 Cousins et al: Food and Beverage Management, 3rd edition, Goodfellows Publishers
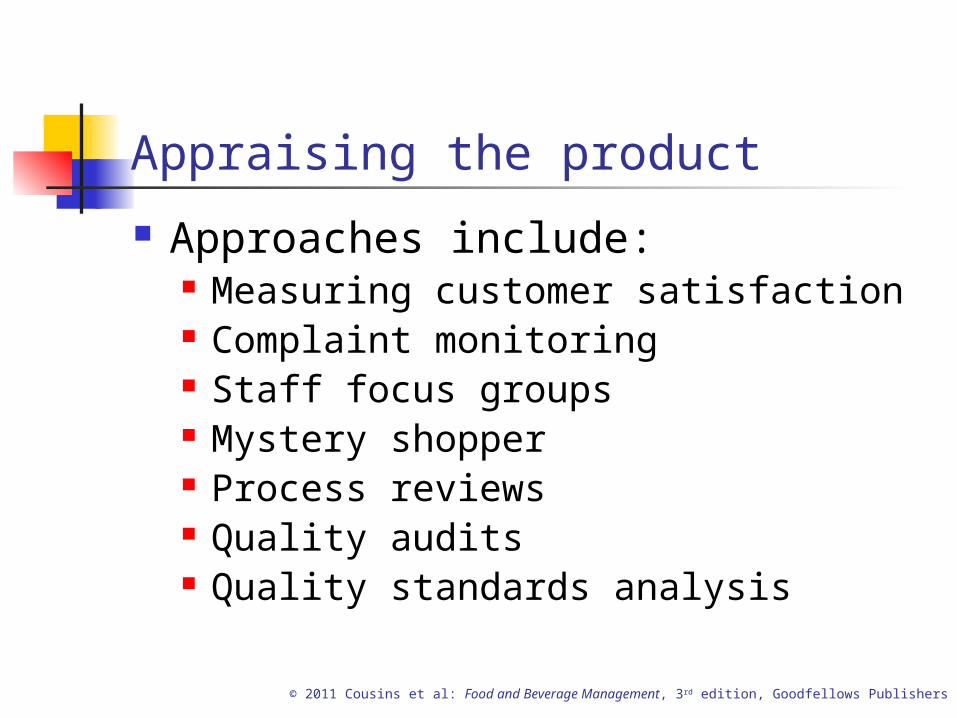
Appraising the product
Approaches include: Measuring customer satisfaction Complaint monitoring Staff focus groups Mystery shopper Process reviews Quality audits Quality standards analysis
© 2011 Cousins et al: Food and Beverage Management, 3rd edition, Goodfellows Publishers
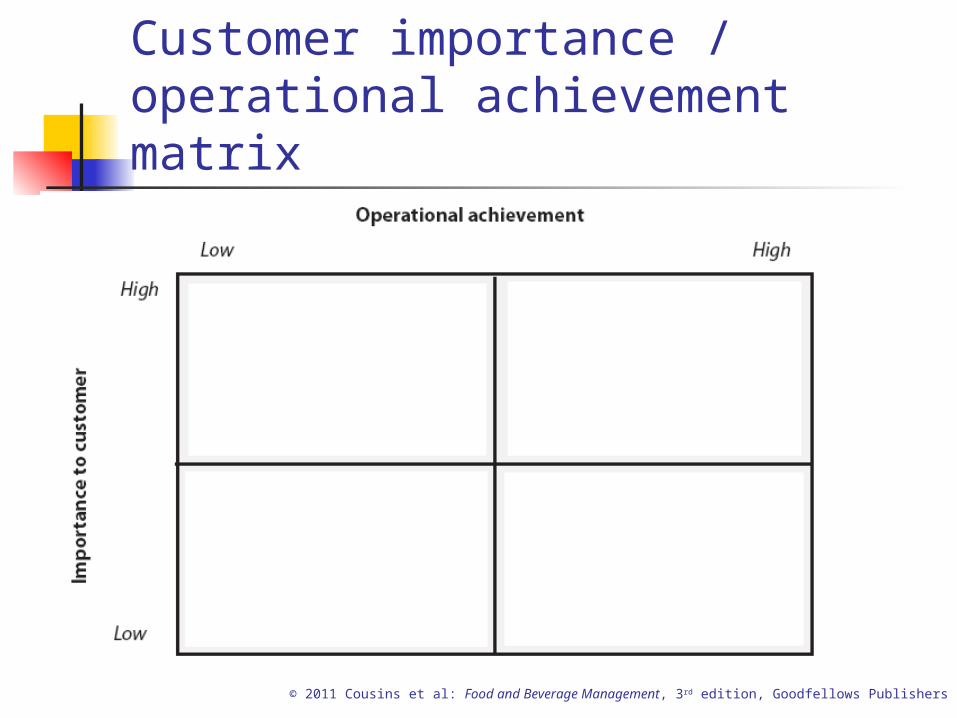
Customer importance / operational achievement matrix
© 2011 Cousins et al: Food and Beverage Management, 3rd edition, Goodfellows Publishers
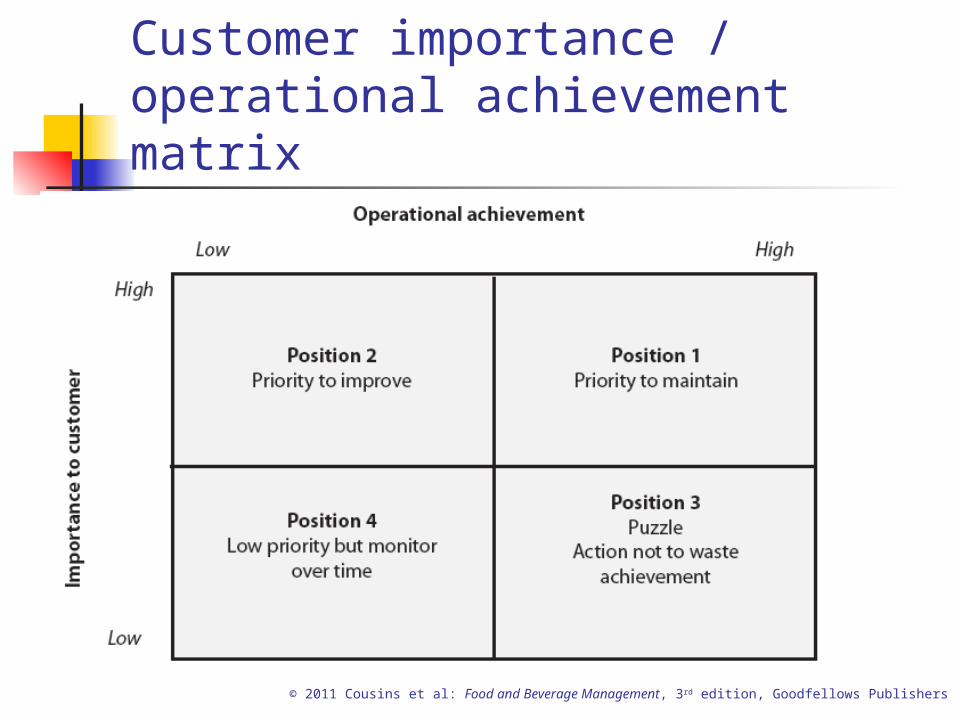
Customer importance / operational achievement matrix
© 2011 Cousins et al: Food and Beverage Management, 3rd edition, Goodfellows Publishers
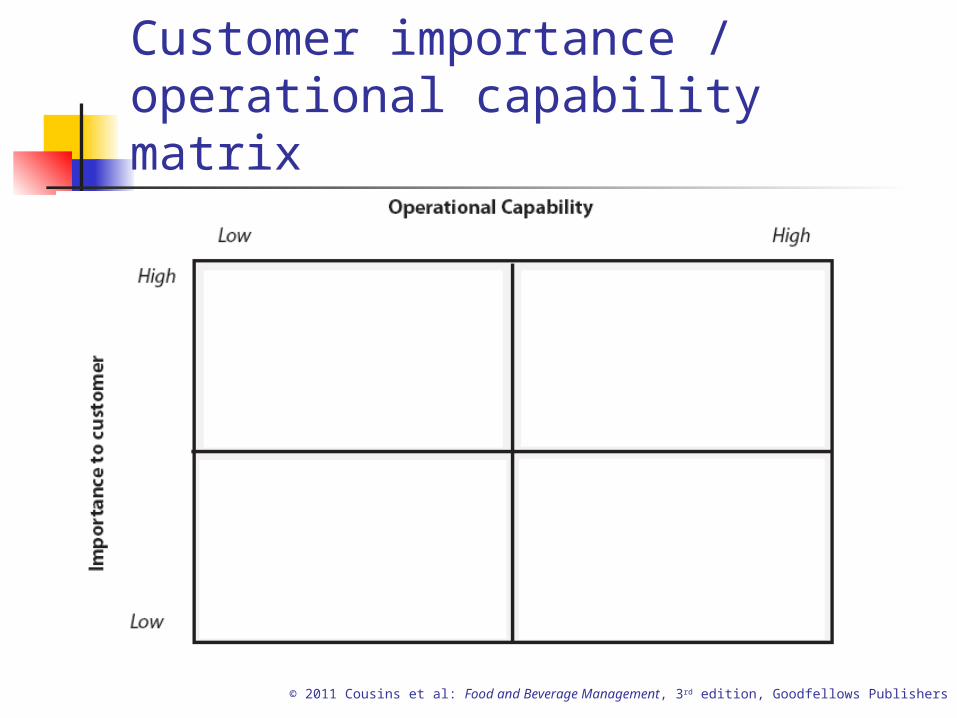
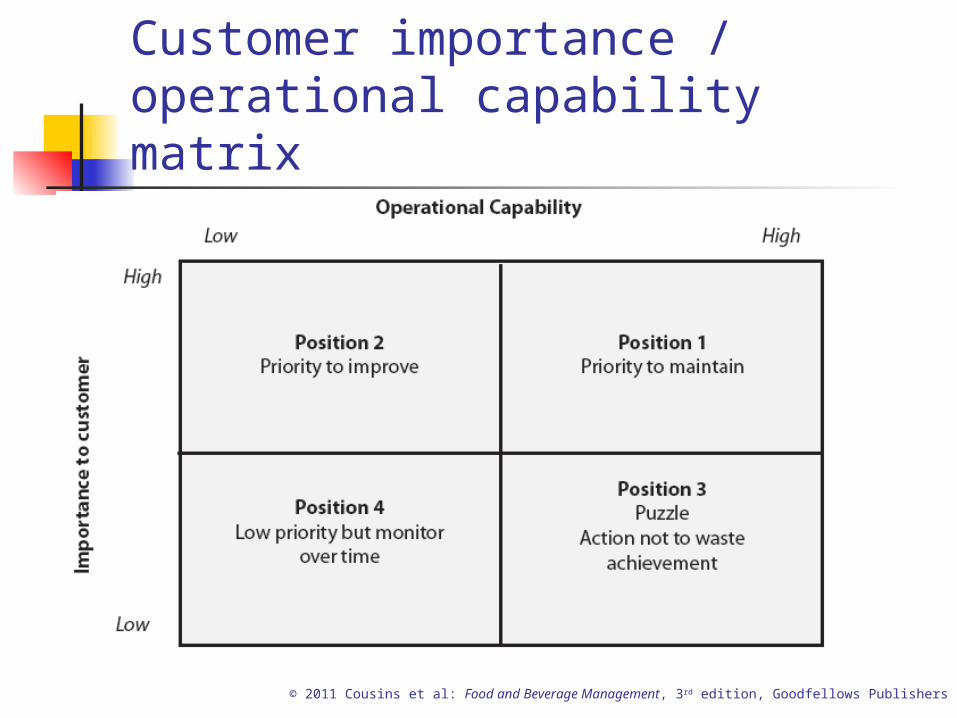
Customer importance / operational capability matrix
© 2011 Cousins et al: Food and Beverage Management, 3rd edition, Goodfellows Publishers
Customer importance / operational capability matrix
© 2011 Cousins et al: Food and Beverage Management, 3rd edition, Goodfellows Publishers
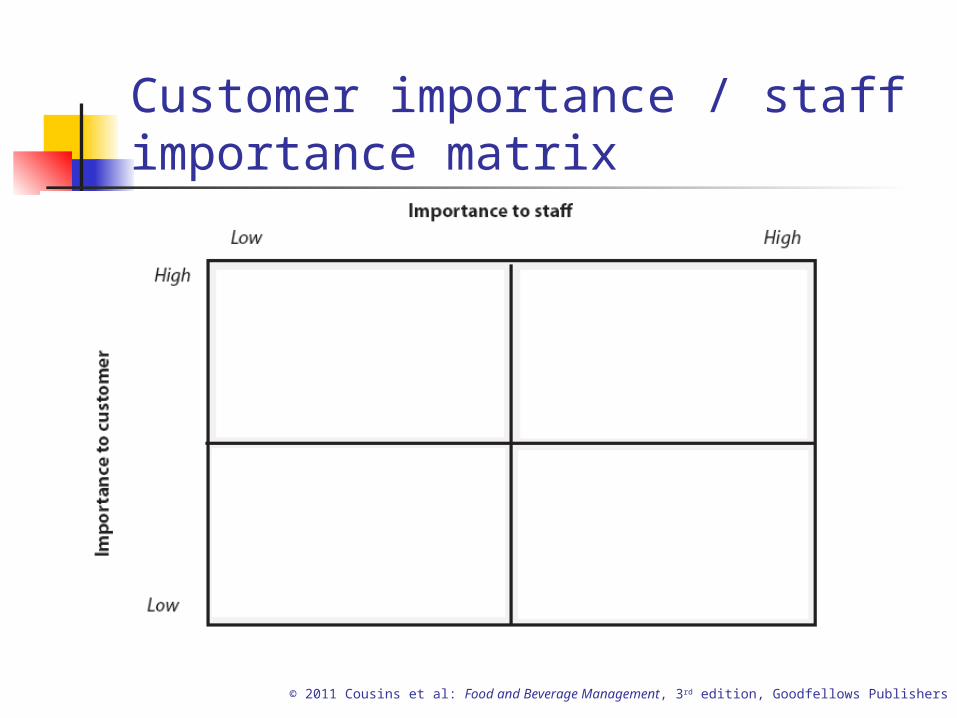
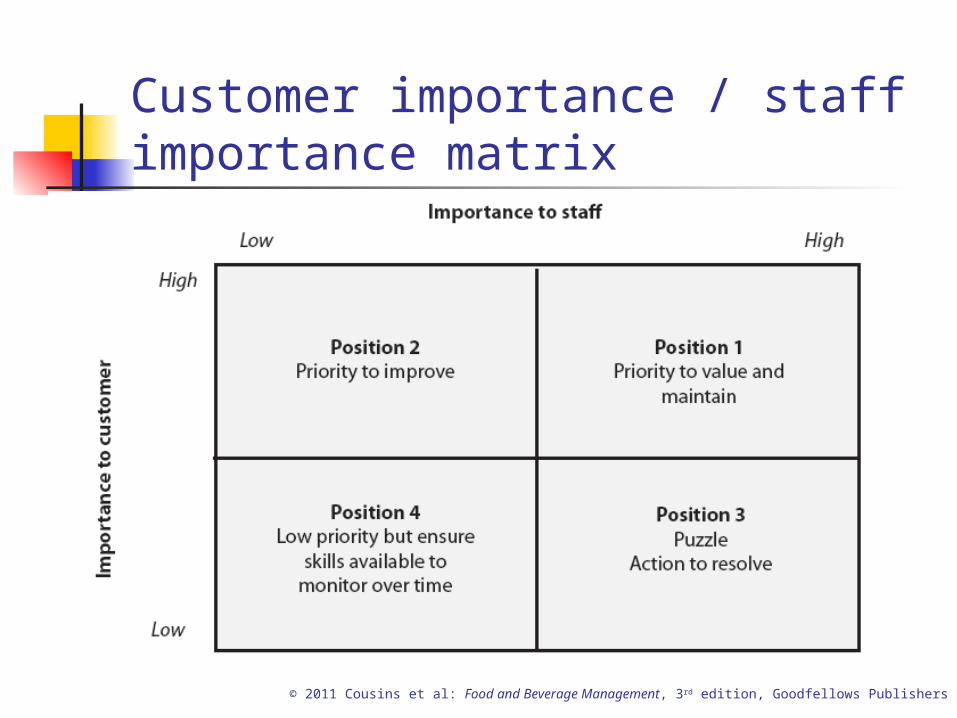
Customer importance / staff importance matrix
© 2011 Cousins et al: Food and Beverage Management, 3rd edition, Goodfellows Publishers
Customer importance / staff importance matrix


