
Food vs. Fuel: Examining the Tradeoffs in
the Allocation of Biomass Energy Sources to
Domestic and Productive Uses in Ethiopia
By: Dawit Mekonnen, Elizabeth Bryan, Tekie Alemu, and
Claudia Ringler
Presented by Elizabeth Bryan ([email protected])
Poverty and Applied Micro Seminar
The World Bank
Wednesday, October 7, 2015

Outline
• Background and Research Questions
• Objectives
• Data
• Descriptive Statistics
• Methods
• Results
• Conclusions
Background
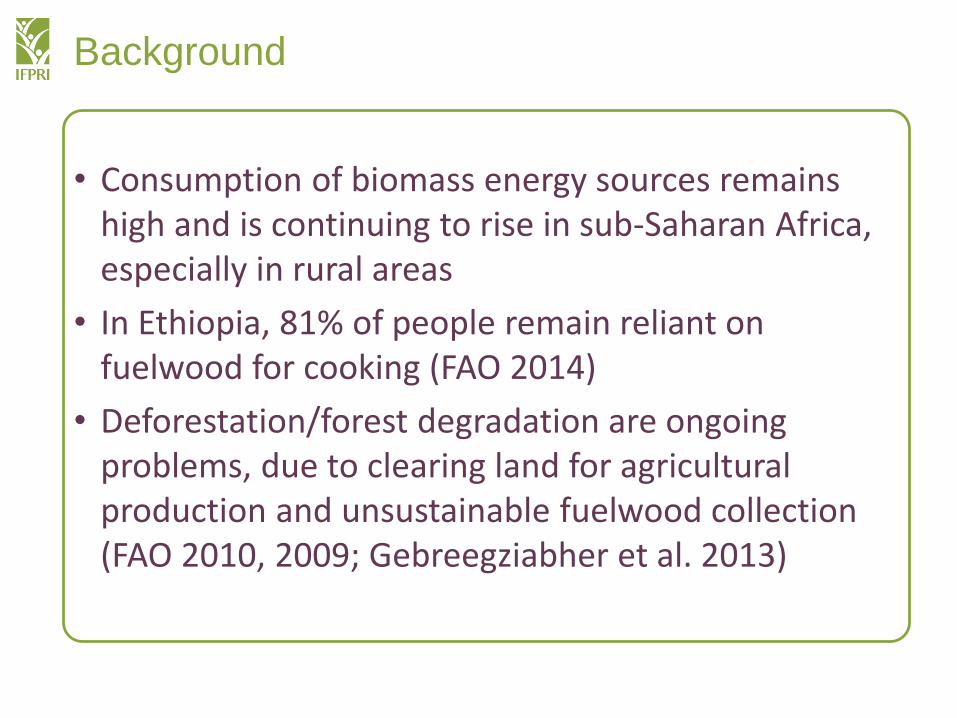
• Consumption of biomass energy sources remains high and is continuing to rise in sub-Saharan Africa, especially in rural areas
• In Ethiopia, 81% of people remain reliant on fuelwood for cooking (FAO 2014)
• Deforestation/forest degradation are ongoing problems, due to clearing land for agricultural production and unsustainable fuelwood collection (FAO 2010, 2009; Gebreegziabher et al. 2013)
Background
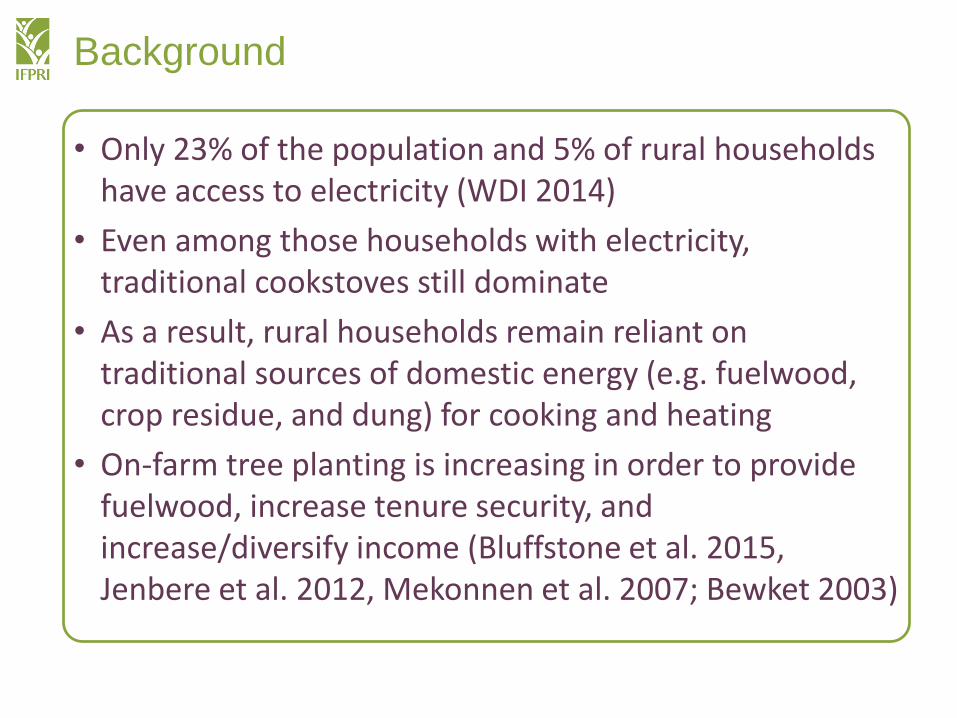
• Only 23% of the population and 5% of rural households have access to electricity (WDI 2014)
• Even among those households with electricity, traditional cookstoves still dominate
• As a result, rural households remain reliant on traditional sources of domestic energy (e.g. fuelwood, crop residue, and dung) for cooking and heating
• On-farm tree planting is increasing in order to provide fuelwood, increase tenure security, and increase/diversify income (Bluffstone et al. 2015, Jenbere et al. 2012, Mekonnen et al. 2007; Bewket 2003)
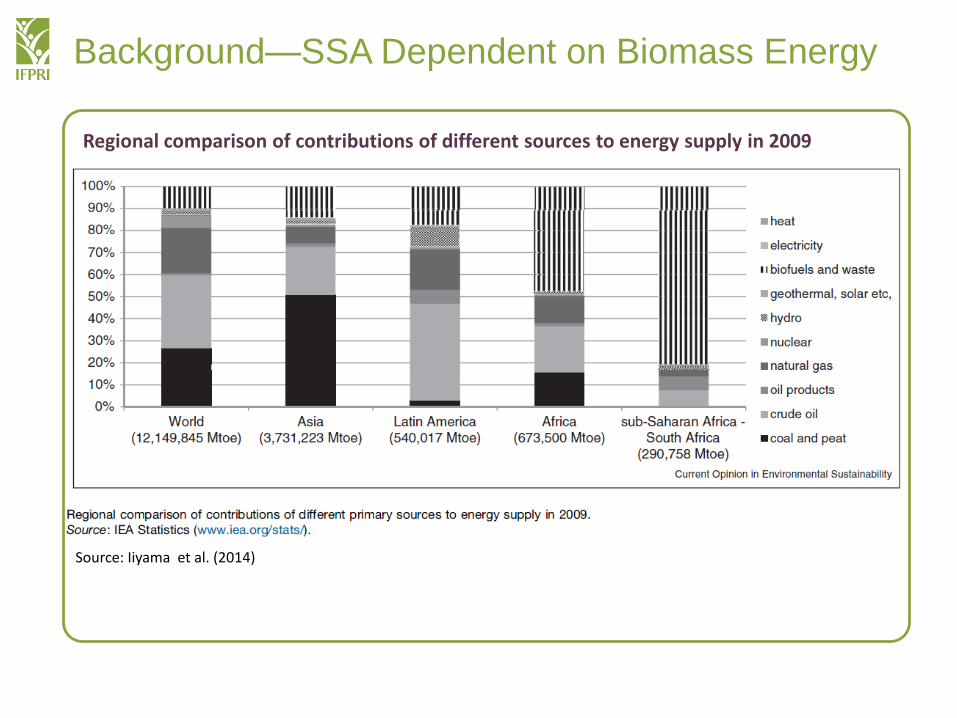
Background—SSA Dependent on Biomass Energy
Source: Iiyama et al. (2014)
Regional comparison of contributions of different sources to energy supply in 2009
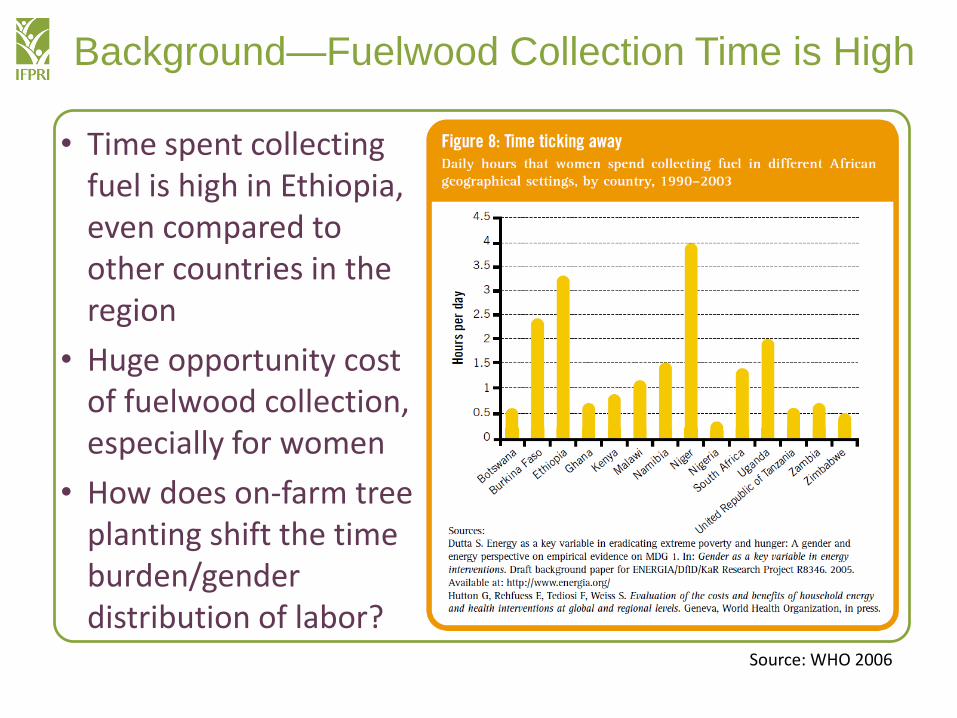
• Time spent collecting fuel is high in Ethiopia, even compared to other countries in the region
• Huge opportunity cost of fuelwood collection, especially for women
• How does on-farm tree planting shift the time burden/gender distribution of labor?
Background—Fuelwood Collection Time is High
Source: WHO 2006
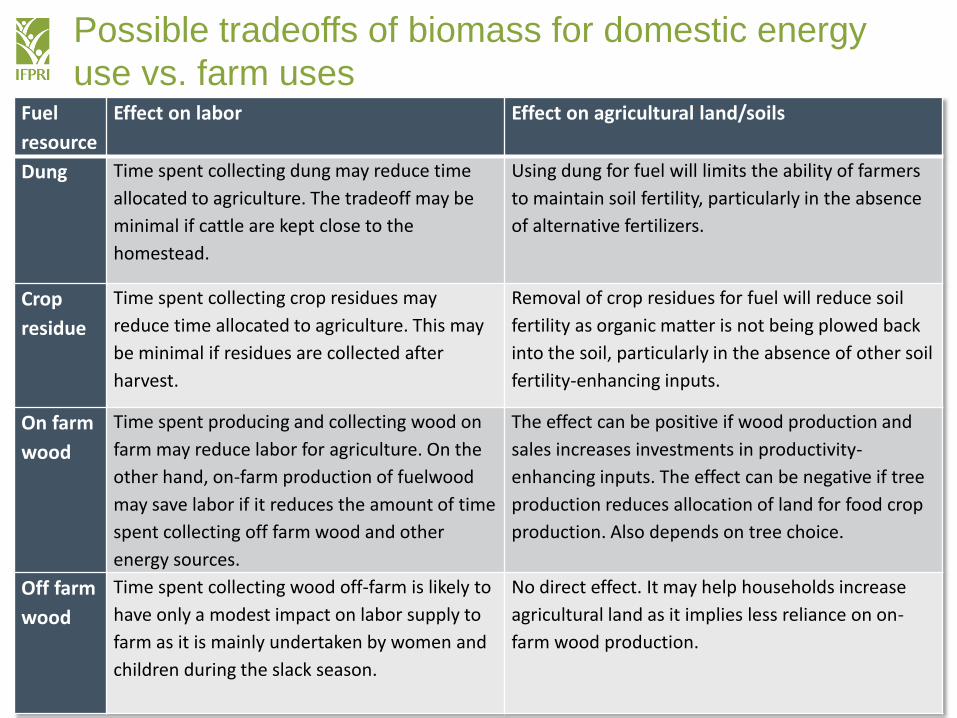
Possible tradeoffs of biomass for domestic energy
use vs. farm usesFuel
resource
Effect on labor Effect on agricultural land/soils
Dung Time spent collecting dung may reduce time
allocated to agriculture. The tradeoff may be
minimal if cattle are kept close to the
homestead.
Using dung for fuel will limits the ability of farmers
to maintain soil fertility, particularly in the absence
of alternative fertilizers.
Crop
residue
Time spent collecting crop residues may
reduce time allocated to agriculture. This may
be minimal if residues are collected after
harvest.
Removal of crop residues for fuel will reduce soil
fertility as organic matter is not being plowed back
into the soil, particularly in the absence of other soil
fertility-enhancing inputs.
On farm
wood
Time spent producing and collecting wood on
farm may reduce labor for agriculture. On the
other hand, on-farm production of fuelwood
may save labor if it reduces the amount of time
spent collecting off farm wood and other
energy sources.
The effect can be positive if wood production and
sales increases investments in productivity-
enhancing inputs. The effect can be negative if tree
production reduces allocation of land for food crop
production. Also depends on tree choice.
Off farm
wood
Time spent collecting wood off-farm is likely to
have only a modest impact on labor supply to
farm as it is mainly undertaken by women and
children during the slack season.
No direct effect. It may help households increase
agricultural land as it implies less reliance on on-
farm wood production.
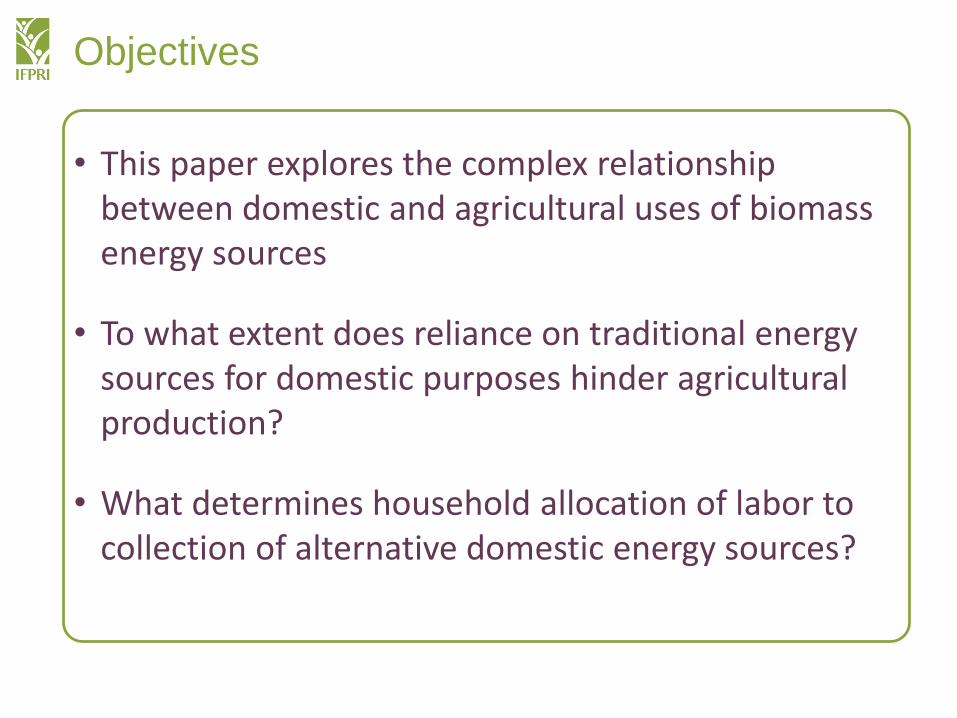
Objectives
• This paper explores the complex relationship between domestic and agricultural uses of biomass energy sources
• To what extent does reliance on traditional energy sources for domestic purposes hinder agricultural production?
• What determines household allocation of labor to collection of alternative domestic energy sources?
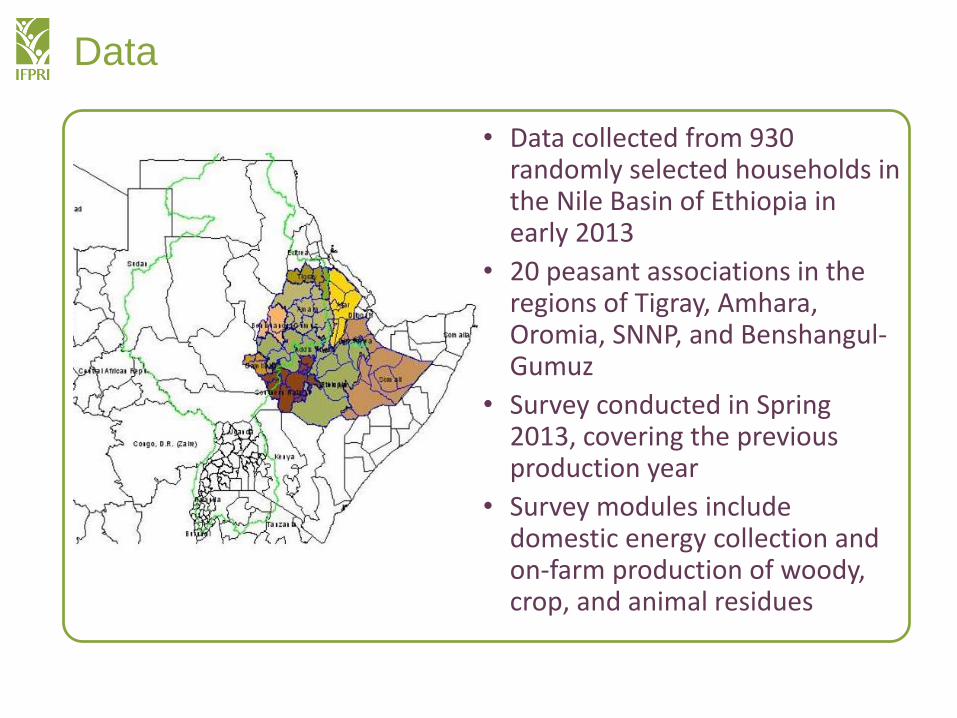
Data
• Data collected from 930 randomly selected households in the Nile Basin of Ethiopia in early 2013
• 20 peasant associations in the regions of Tigray, Amhara, Oromia, SNNP, and Benshangul-Gumuz
• Survey conducted in Spring 2013, covering the previous production year
• Survey modules include domestic energy collection and on-farm production of woody, crop, and animal residues
Data limitations
• The analysis could only consider the production implications of the removal of biomass energy sources from the field during the same season given cross-section data
• We, therefore, assume that behavior in the previous seasons is reflective of the behavior observed during the survey period
• The collection time variable is not fully gender-disaggregated as the data only indicates the gender of the primary collector
• Only time spent collecting biomass resources not quantity (time spent used as a proxy for quantity)
– Are collection times an indication of availability/scarcity of fuelwood and alternative sources?
– Or do collection times reflect volume of fuelwood being consumed?
Descriptive Statistics
• 74% get at least a portion of their fuelwood from their own farm
• 31% of households collect fuel wood from neighbors‘ woodlots or from community forests
• 51% depend on animal dung as an important source of domestic energy
• 21% use crop residues as a main source of domestic energy
Descriptive Statistics
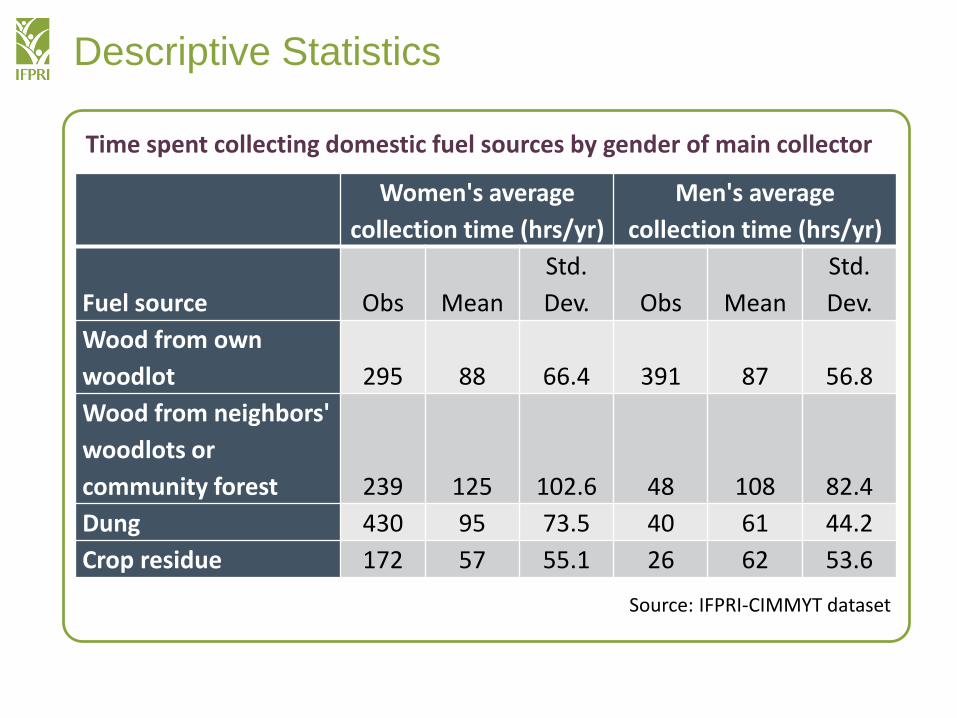
Women's average
collection time (hrs/yr)
Men's average
collection time (hrs/yr)
Fuel source Obs Mean
Std.
Dev. Obs Mean
Std.
Dev.
Wood from own
woodlot 295 88 66.4 391 87 56.8
Wood from neighbors'
woodlots or
community forest 239 125 102.6 48 108 82.4
Dung 430 95 73.5 40 61 44.2
Crop residue 172 57 55.1 26 62 53.6
Time spent collecting domestic fuel sources by gender of main collector
Source: IFPRI-CIMMYT dataset
Descriptive Statistics
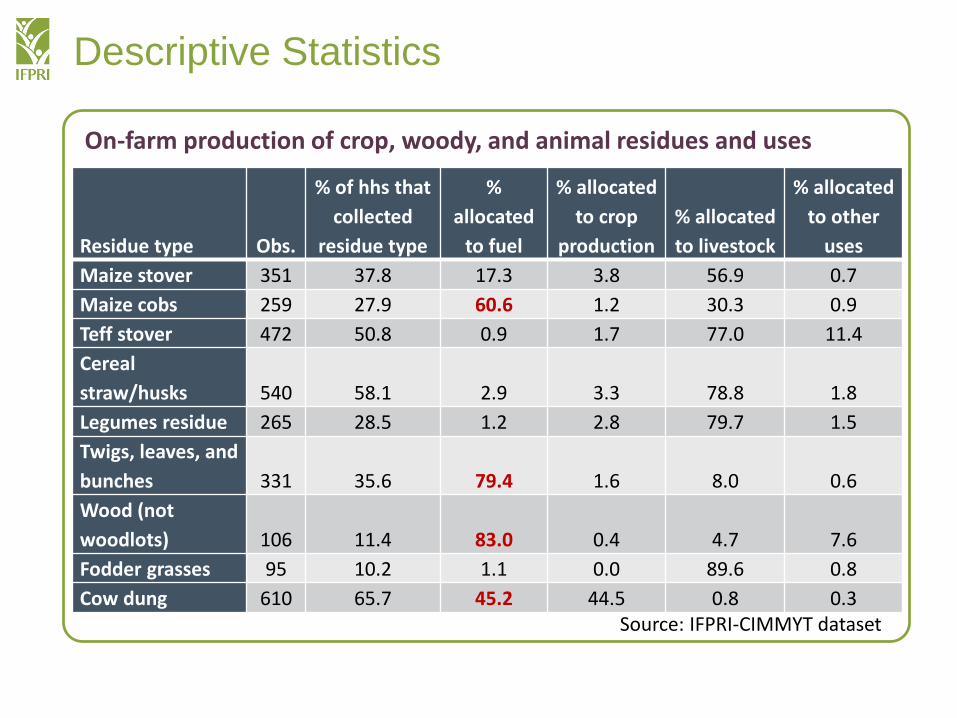
Residue type Obs.
% of hhs that
collected
residue type
%
allocated
to fuel
% allocated
to crop
production
% allocated
to livestock
% allocated
to other
uses
Maize stover 351 37.8 17.3 3.8 56.9 0.7
Maize cobs 259 27.9 60.6 1.2 30.3 0.9
Teff stover 472 50.8 0.9 1.7 77.0 11.4
Cereal
straw/husks 540 58.1 2.9 3.3 78.8 1.8
Legumes residue 265 28.5 1.2 2.8 79.7 1.5
Twigs, leaves, and
bunches 331 35.6 79.4 1.6 8.0 0.6
Wood (not
woodlots) 106 11.4 83.0 0.4 4.7 7.6
Fodder grasses 95 10.2 1.1 0.0 89.6 0.8
Cow dung 610 65.7 45.2 44.5 0.8 0.3
On-farm production of crop, woody, and animal residues and uses
Source: IFPRI-CIMMYT dataset
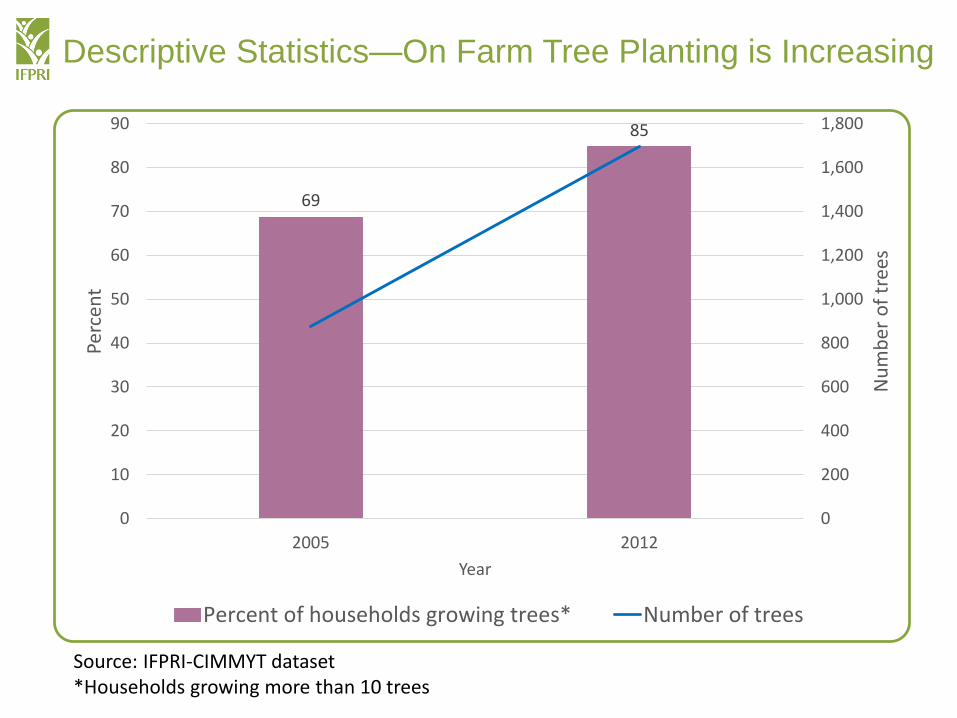
Descriptive Statistics—On Farm Tree Planting is Increasing
69
85
0
200
400
600
800
1,000
1,200
1,400
1,600
1,800
0
10
20
30
40
50
60
70
80
90
2005 2012
Nu
mb
er o
f tr
ees
Perc
ent
Year
Percent of households growing trees* Number of trees
Source: IFPRI-CIMMYT dataset*Households growing more than 10 trees
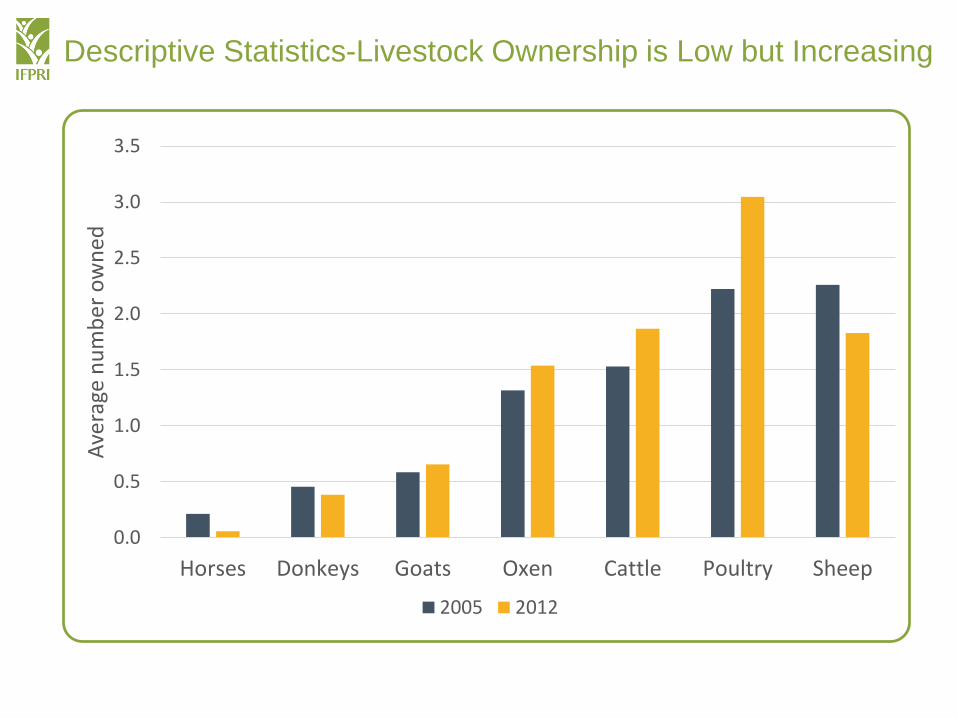
Descriptive Statistics-Livestock Ownership is Low but Increasing
0.0
0.5
1.0
1.5
2.0
2.5
3.0
3.5
Horses Donkeys Goats Oxen Cattle Poultry Sheep
Ave
rage
nu
mb
er
ow
ned
2005 2012
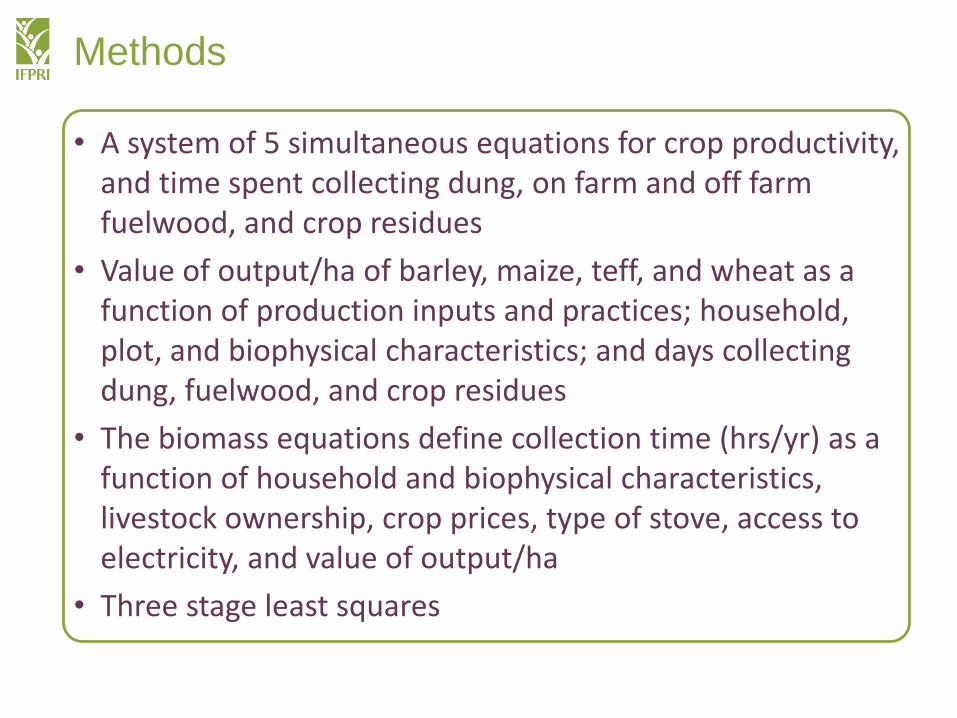
Methods
• A system of 5 simultaneous equations for crop productivity, and time spent collecting dung, on farm and off farm fuelwood, and crop residues
• Value of output/ha of barley, maize, teff, and wheat as a function of production inputs and practices; household, plot, and biophysical characteristics; and days collecting dung, fuelwood, and crop residues
• The biomass equations define collection time (hrs/yr) as a function of household and biophysical characteristics, livestock ownership, crop prices, type of stove, access to electricity, and value of output/ha
• Three stage least squares
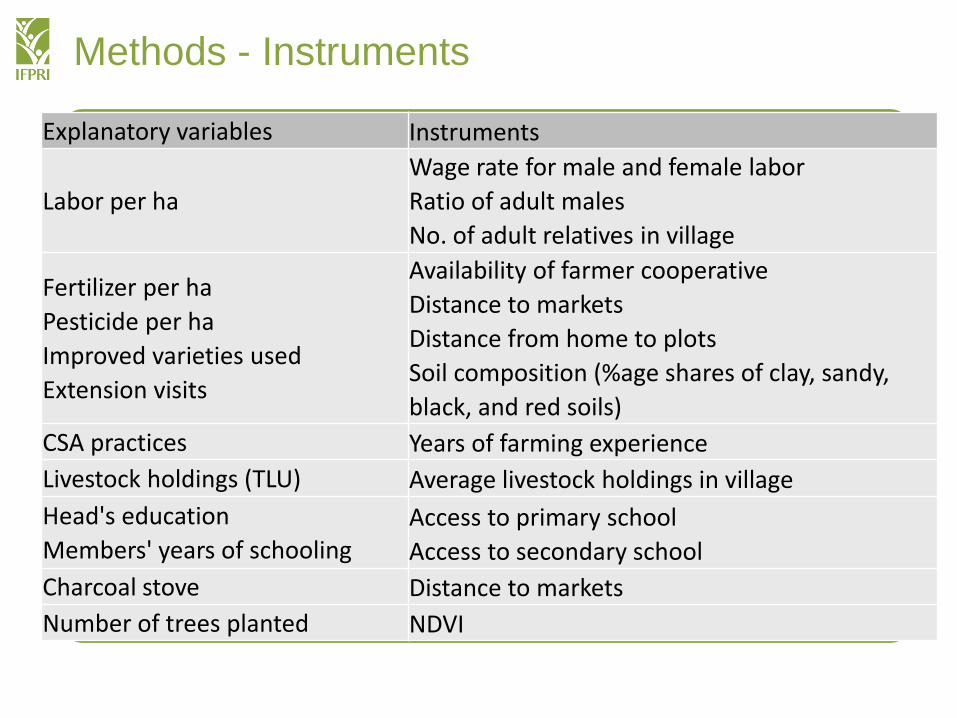
Methods - Instruments
Explanatory variables Instruments
Labor per ha
Wage rate for male and female labor
Ratio of adult males
No. of adult relatives in village
Fertilizer per ha
Pesticide per ha
Improved varieties used
Extension visits
Availability of farmer cooperative
Distance to markets
Distance from home to plots
Soil composition (%age shares of clay, sandy,
black, and red soils)
CSA practices Years of farming experience
Livestock holdings (TLU) Average livestock holdings in village
Head's education
Members' years of schoolingAccess to primary school
Access to secondary school
Charcoal stove Distance to markets
Number of trees planted NDVI
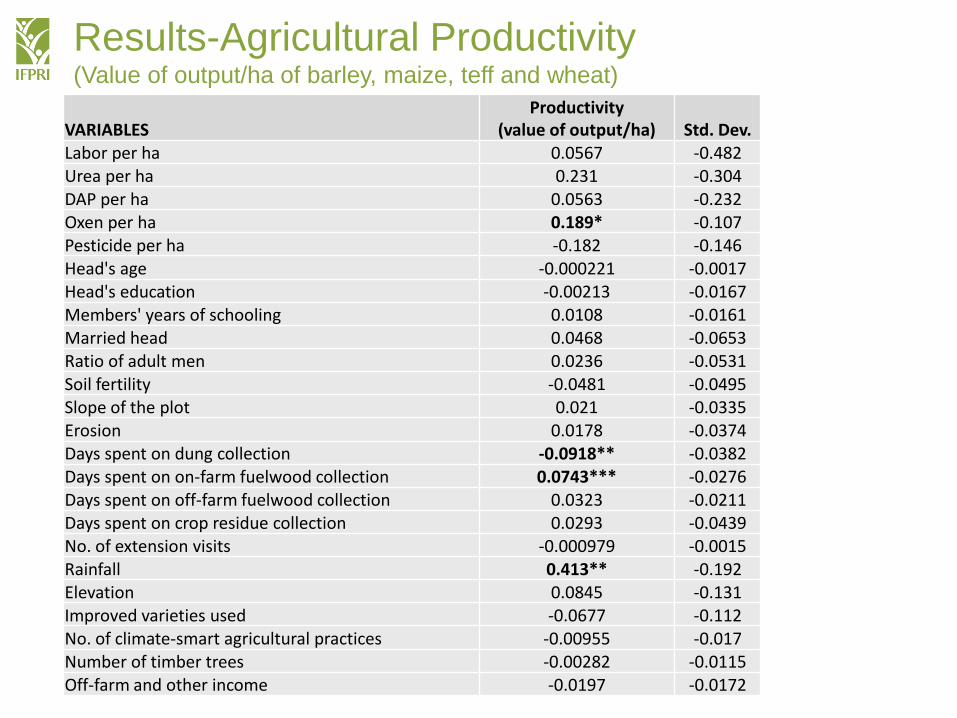
Results-Agricultural Productivity (Value of output/ha of barley, maize, teff and wheat)
VARIABLESProductivity
(value of output/ha) Std. Dev.Labor per ha 0.0567 -0.482Urea per ha 0.231 -0.304DAP per ha 0.0563 -0.232Oxen per ha 0.189* -0.107Pesticide per ha -0.182 -0.146Head's age -0.000221 -0.0017Head's education -0.00213 -0.0167Members' years of schooling 0.0108 -0.0161Married head 0.0468 -0.0653Ratio of adult men 0.0236 -0.0531Soil fertility -0.0481 -0.0495Slope of the plot 0.021 -0.0335Erosion 0.0178 -0.0374Days spent on dung collection -0.0918** -0.0382Days spent on on-farm fuelwood collection 0.0743*** -0.0276Days spent on off-farm fuelwood collection 0.0323 -0.0211Days spent on crop residue collection 0.0293 -0.0439No. of extension visits -0.000979 -0.0015Rainfall 0.413** -0.192Elevation 0.0845 -0.131Improved varieties used -0.0677 -0.112No. of climate-smart agricultural practices -0.00955 -0.017Number of timber trees -0.00282 -0.0115Off-farm and other income -0.0197 -0.0172
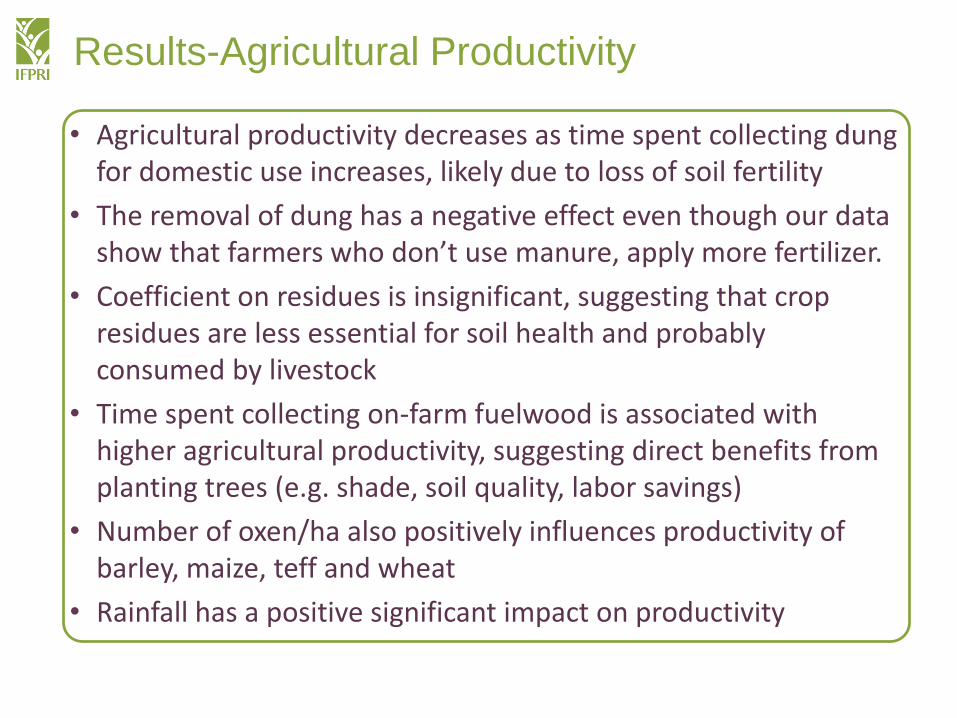
Results-Agricultural Productivity
• Agricultural productivity decreases as time spent collecting dung for domestic use increases, likely due to loss of soil fertility
• The removal of dung has a negative effect even though our data show that farmers who don’t use manure, apply more fertilizer.
• Coefficient on residues is insignificant, suggesting that crop residues are less essential for soil health and probably consumed by livestock
• Time spent collecting on-farm fuelwood is associated with higher agricultural productivity, suggesting direct benefits from planting trees (e.g. shade, soil quality, labor savings)
• Number of oxen/ha also positively influences productivity of barley, maize, teff and wheat
• Rainfall has a positive significant impact on productivity
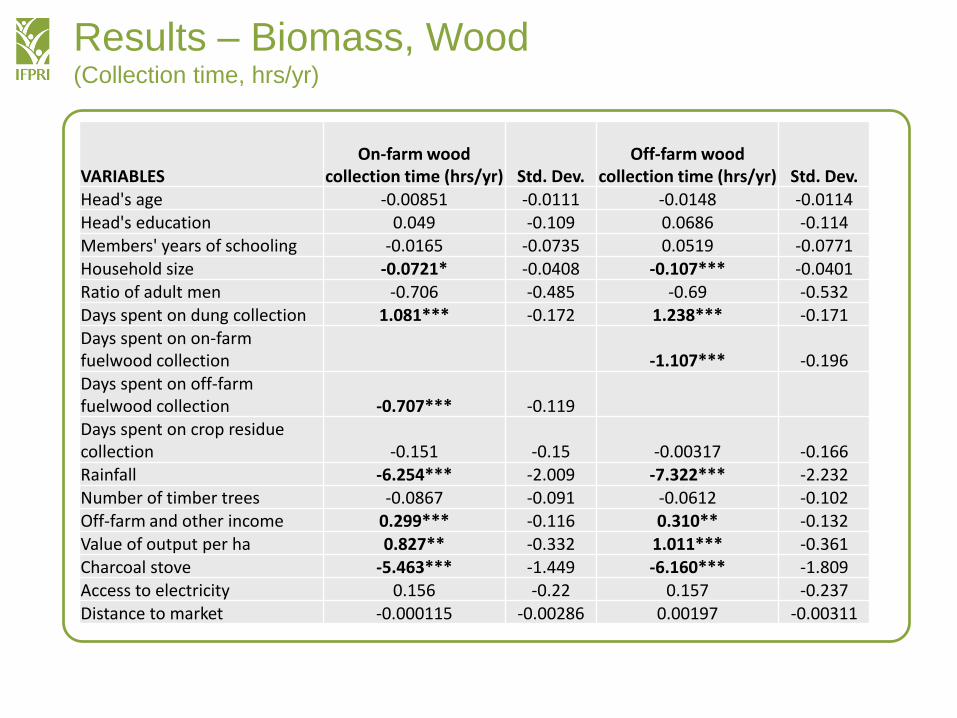
Results – Biomass, Wood(Collection time, hrs/yr)
VARIABLESOn-farm wood
collection time (hrs/yr) Std. Dev.Off-farm wood
collection time (hrs/yr) Std. Dev.Head's age -0.00851 -0.0111 -0.0148 -0.0114Head's education 0.049 -0.109 0.0686 -0.114Members' years of schooling -0.0165 -0.0735 0.0519 -0.0771Household size -0.0721* -0.0408 -0.107*** -0.0401Ratio of adult men -0.706 -0.485 -0.69 -0.532Days spent on dung collection 1.081*** -0.172 1.238*** -0.171Days spent on on-farm fuelwood collection -1.107*** -0.196Days spent on off-farm fuelwood collection -0.707*** -0.119Days spent on crop residue collection -0.151 -0.15 -0.00317 -0.166Rainfall -6.254*** -2.009 -7.322*** -2.232Number of timber trees -0.0867 -0.091 -0.0612 -0.102Off-farm and other income 0.299*** -0.116 0.310** -0.132Value of output per ha 0.827** -0.332 1.011*** -0.361Charcoal stove -5.463*** -1.449 -6.160*** -1.809Access to electricity 0.156 -0.22 0.157 -0.237Distance to market -0.000115 -0.00286 0.00197 -0.00311
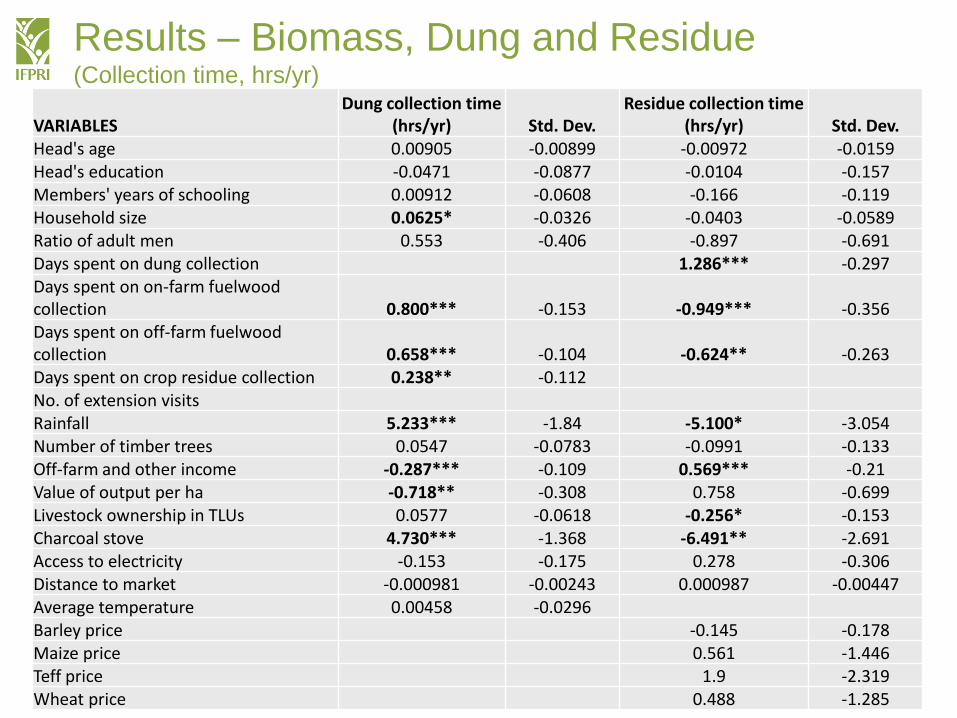
Results – Biomass, Dung and Residue(Collection time, hrs/yr)
VARIABLESDung collection time
(hrs/yr) Std. Dev.Residue collection time
(hrs/yr) Std. Dev.Head's age 0.00905 -0.00899 -0.00972 -0.0159Head's education -0.0471 -0.0877 -0.0104 -0.157Members' years of schooling 0.00912 -0.0608 -0.166 -0.119Household size 0.0625* -0.0326 -0.0403 -0.0589Ratio of adult men 0.553 -0.406 -0.897 -0.691Days spent on dung collection 1.286*** -0.297Days spent on on-farm fuelwood collection 0.800*** -0.153 -0.949*** -0.356Days spent on off-farm fuelwood collection 0.658*** -0.104 -0.624** -0.263Days spent on crop residue collection 0.238** -0.112No. of extension visitsRainfall 5.233*** -1.84 -5.100* -3.054Number of timber trees 0.0547 -0.0783 -0.0991 -0.133Off-farm and other income -0.287*** -0.109 0.569*** -0.21Value of output per ha -0.718** -0.308 0.758 -0.699Livestock ownership in TLUs 0.0577 -0.0618 -0.256* -0.153Charcoal stove 4.730*** -1.368 -6.491** -2.691Access to electricity -0.153 -0.175 0.278 -0.306Distance to market -0.000981 -0.00243 0.000987 -0.00447Average temperature 0.00458 -0.0296Barley price -0.145 -0.178Maize price 0.561 -1.446Teff price 1.9 -2.319Wheat price 0.488 -1.285
Results-Biomass Collection Times
• As crop productivity increases, time spent collecting dung decreases while time spent collecting on-and off-farm fuelwood increases
• More productive households may keep livestock close to the home
• Results provide evidence of fuel stacking rather than switching but also some preferences emerge:
– Time spent collecting dung increases with time spent collecting on- and off-farm fuelwood and vice versa.
–However, on-farm and off-farm fuelwood are substitutes
– Some indication of preference for fuelwood over residues
• Electricity has no impact on households’ consumption of biomass energy sources
• Owning a charcoal stove increases the time spent collecting dung and decreases time spent collecting on- and off-farm fuelwood
• HHs with more off-farm income collect more fuelwood and residues and less dung
• HHs that own more livestock collect more dung and less crop residues
• More rainfall reduces time allocated to the collection of on- and off-farm fuelwood and crop residues
Results-Biomass Collection Times
Results-Alternate Model
• Results similar to the main results but with some differences:
–Removal of crop residues for fuel is associated with lower crop productivity
–Time spent collecting off-farm fuelwood is associated with increased productivity
–Number of timber trees is associated with higher crop productivity
–Number of timber trees on-farm also reduces fuelwood collection time
Conclusions
• Productivity of staple crops is negatively affected by time spent collecting dung (and possibly residues)
• This suggests that integrated soil fertility management does more to enhance soil health than the application of inorganic fertilizer alone
• Results highlight the importance of livestock as both an essential source of energy (dung) but also a consumer of energy (residues)—this factors in HH biomass allocation decisions
• On-farm fuelwood collection is associated with higher productivity suggesting direct benefits of agroforestry
Conclusions
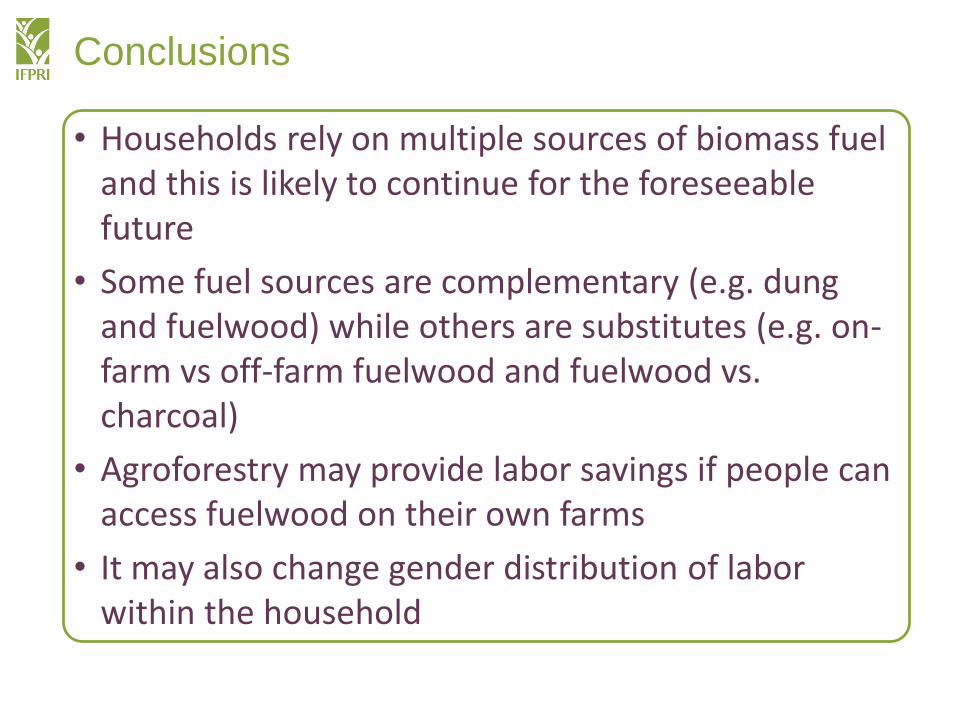
• Households rely on multiple sources of biomass fuel and this is likely to continue for the foreseeable future
• Some fuel sources are complementary (e.g. dung and fuelwood) while others are substitutes (e.g. on-farm vs off-farm fuelwood and fuelwood vs. charcoal)
• Agroforestry may provide labor savings if people can access fuelwood on their own farms
• It may also change gender distribution of labor within the household
Conclusions
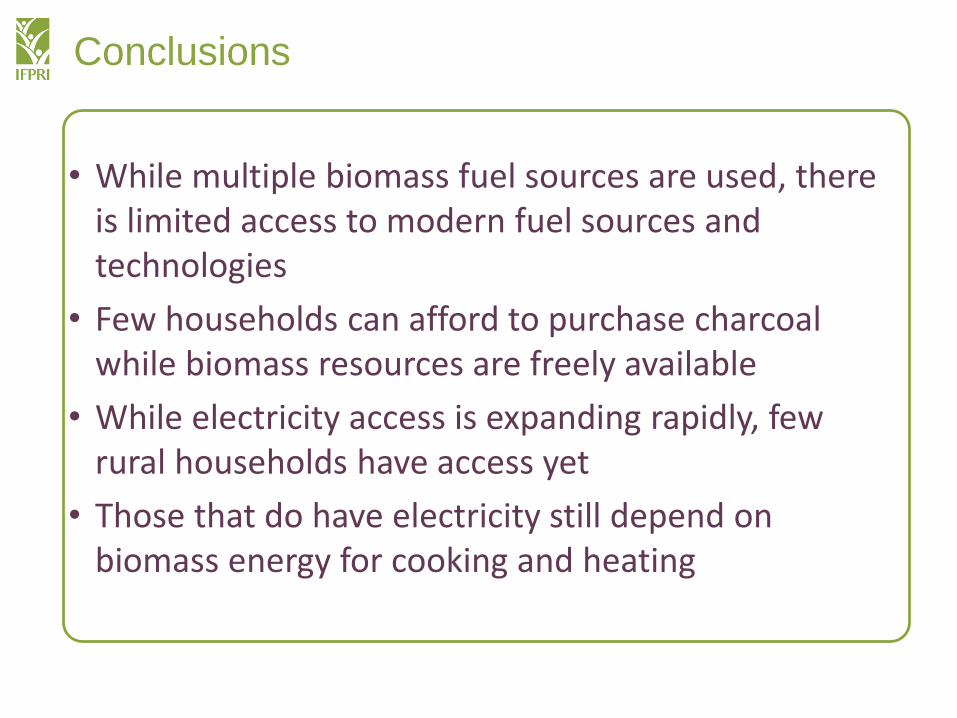
• While multiple biomass fuel sources are used, there is limited access to modern fuel sources and technologies
• Few households can afford to purchase charcoal while biomass resources are freely available
• While electricity access is expanding rapidly, few rural households have access yet
• Those that do have electricity still depend on biomass energy for cooking and heating
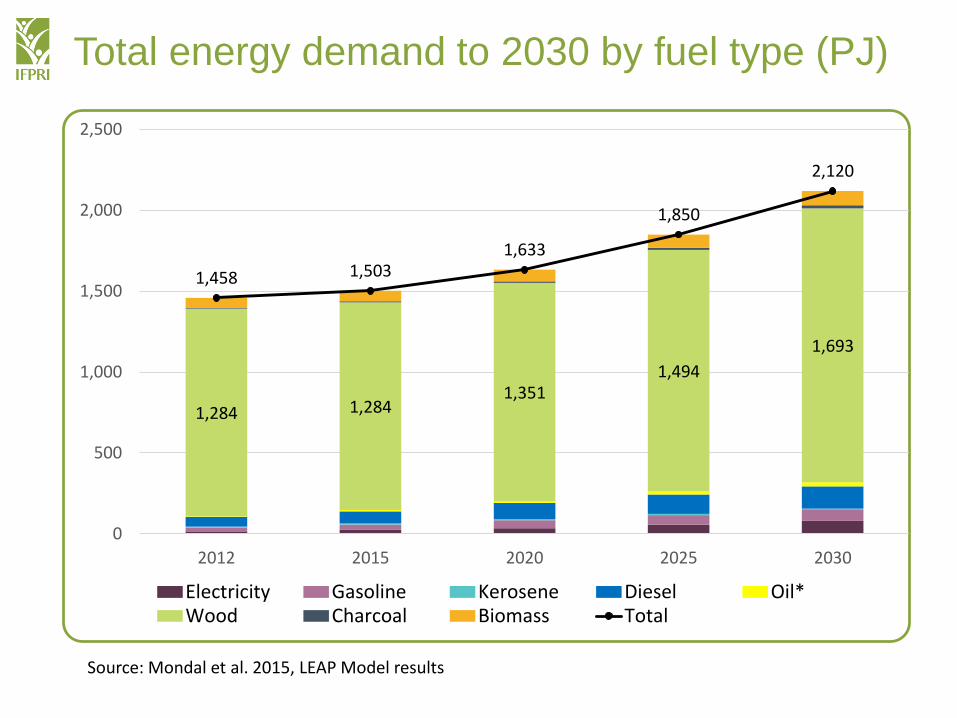
Total energy demand to 2030 by fuel type (PJ)
Source: Mondal et al. 2015, LEAP Model results
1,284 1,2841,351
1,494
1,693
1,458 1,5031,633
1,850
2,120
0
500
1,000
1,500
2,000
2,500
2012 2015 2020 2025 2030
Electricity Gasoline Kerosene Diesel Oil*Wood Charcoal Biomass Total
Conclusions
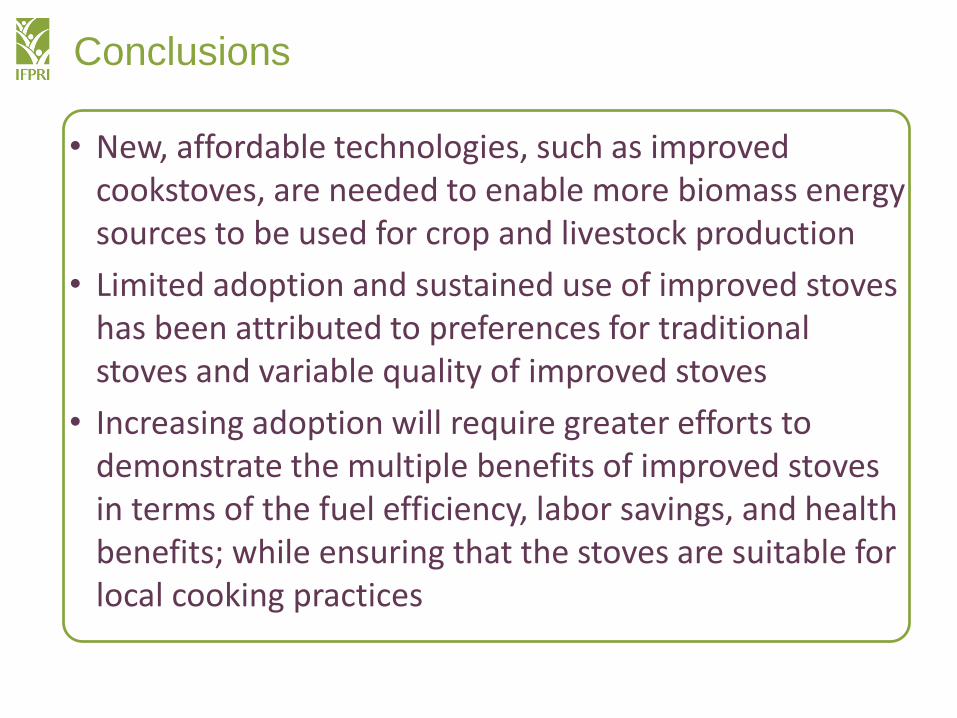
• New, affordable technologies, such as improved cookstoves, are needed to enable more biomass energy sources to be used for crop and livestock production
• Limited adoption and sustained use of improved stoves has been attributed to preferences for traditional stoves and variable quality of improved stoves
• Increasing adoption will require greater efforts to demonstrate the multiple benefits of improved stoves in terms of the fuel efficiency, labor savings, and health benefits; while ensuring that the stoves are suitable for local cooking practices
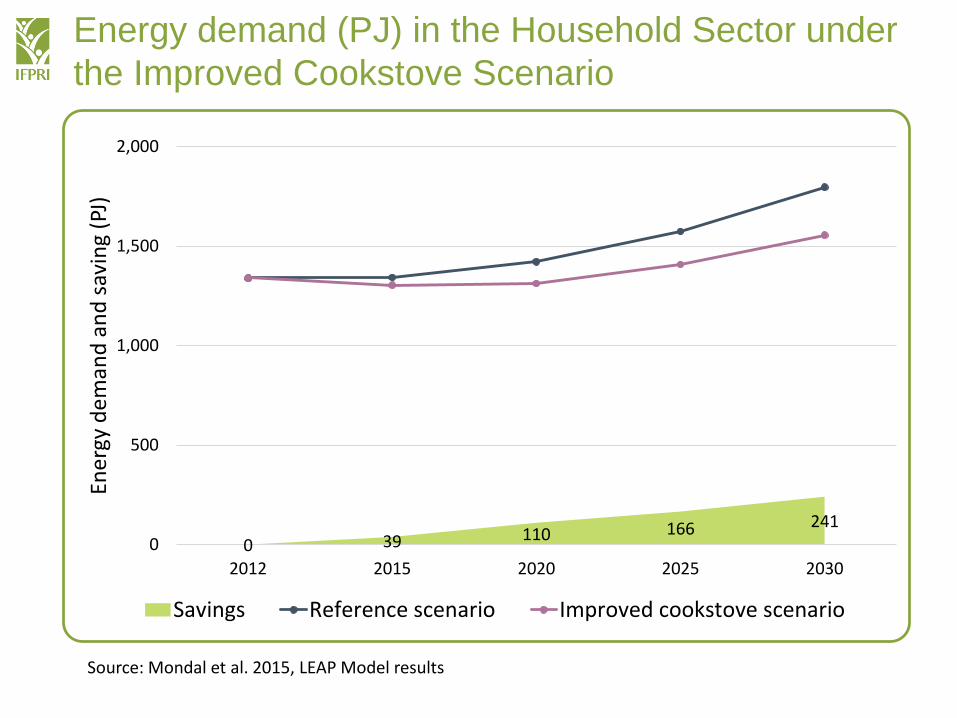
Energy demand (PJ) in the Household Sector under
the Improved Cookstove Scenario
0 39 110 166 2410
500
1,000
1,500
2,000
2012 2015 2020 2025 2030
Ener
gy d
em
and
an
d s
avin
g (P
J)
Savings Reference scenario Improved cookstove scenario
Source: Mondal et al. 2015, LEAP Model results
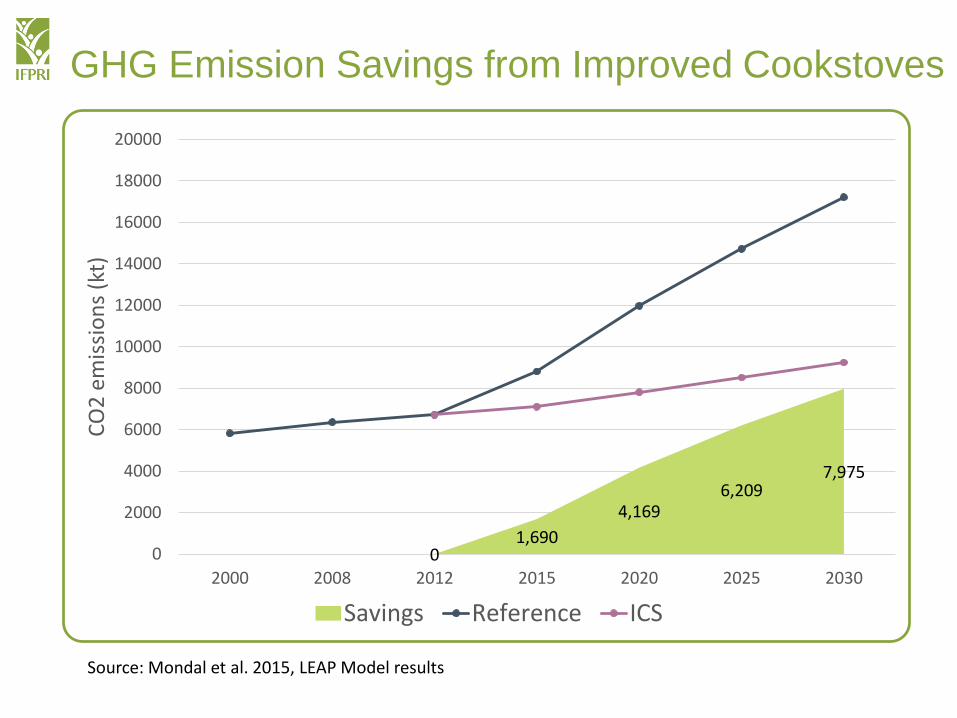
GHG Emission Savings from Improved Cookstoves
01,690
4,1696,209
7,975
0
2000
4000
6000
8000
10000
12000
14000
16000
18000
20000
2000 2008 2012 2015 2020 2025 2030
CO
2 e
mis
sio
ns
(kt)
Savings Reference ICS
Source: Mondal et al. 2015, LEAP Model results

Thank you for your attention!
Your comments are much
appreciated!
Elizabeth BryanSenior Research Analyst
Environment and Production Technology Division
International Food Policy Research Institute


