

Supplementary Information
Two Cyclotriveratrylene Metal-Organic Frameworks as Effective Catalysts
for Knoevenagel Condensation and CO2 Cycloaddition with Epoxides
Da-Wei Kang,a, b Xue Han,a Xin-Jun Ma,b Ying-Ying Liu,*a and Jian-Fang Ma*a
a Key Lab of Polyoxometalate Science, Department of Chemistry,
Northeast Normal University, Changchun 130024, Chinab Inner Mongolia Key Lab of Chemistry of Natural Products and Synthesis of Functional
Molecules, College of Chemistry and Chemical Engineering, Inner Mongolia University for
the Nationalities, Tongliao, 028000, China.
* Correspondence authors
E-mail: [email protected] (Y.-Y. Liu)
E-mail: [email protected] (J.-F. Ma)
Fax: +86-431-85098620 (J.-F. Ma)
Reagents and Instruments. All chemical reagents and solvents were commercially
available. The C, H and N elemental analyses were carried out with a Perkin-Elmer 240C
elemental analyzer. (TG) measurements were performed on a Perkin-Elmer TG-7 analyzer,
heating from 30 to 1000 ˚C at a rate of 5 °C min-1 under nitrogen gas. The solid-state
emission/excitation spectra were collected with a FLSP920 Edinburgh fluorescence
spectrometer. PXRD patterns were recorded on a Rigaku Dmax 2000 X-ray diffractometer
with graphite monochromatized Cu Kα radiation (λ = 0.154 nm). 1H NMR spectra were
recorded on a Varian 500 MHz. The catalytic products were measured by gas chromatograph
equipment with capillary (30 m long × 0.25 mm i.d., WondaCAP 17), and FID detector (GC-
2014C, Shimadzu, Japan).
X-ray crystallography. Crystallographic data of 1, 2 and 1a were determined on an
Oxford diffraction Gemini R CCD diffractometer with graphite-monochromated MoKα
radiation (λ = 0.71073 Å) at room temperature. Absorption correction was performed by a
Electronic Supplementary Material (ESI) for Dalton Transactions.This journal is © The Royal Society of Chemistry 2018

multi-scan technique. The structure was solved by direct methods with SHELXS-97 and
refined on F2 by full-matrix least-squares using the SHELXTL-2014 program within WINGX.
Non-hydrogen atoms were refined anisotropically. Hydrogen atoms on carbon were generated
geometrically. Crystallographic data, structure refinements, bond distances and angles are
given in Tables S1 and S2.
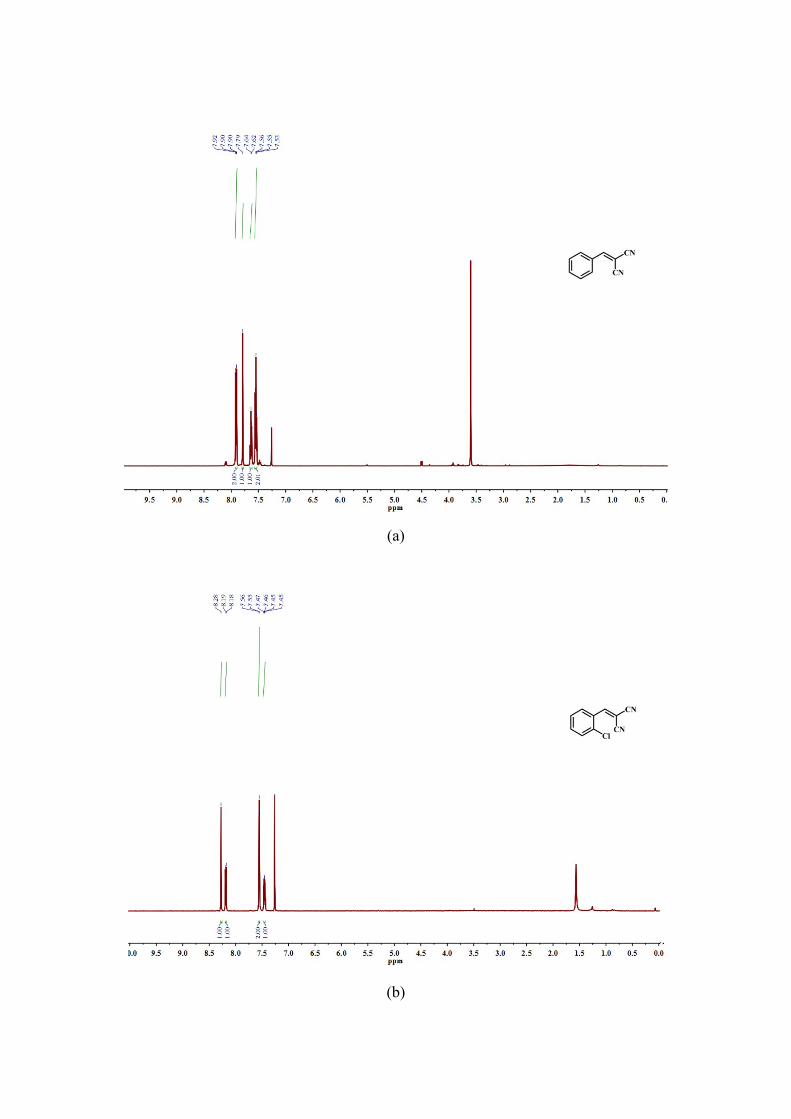
(a)
(b)Fig. S1 1H NMR spectra of intermediate ligand C (a) and final ligand HECTV (b) as shown in
Scheme 1.

During the refinements of 1 and 2, the SQUEEZE routine in PLATON was employed
because of the highly disordered solvents. The lattice molecules were demonstrated by the
difference Fourier maps of original X-ray data, TGA data (Fig. S2) and elemental analyses.
(a) (b)
Fig. S2 Thermogravimetric curves of 1 (a) and 2 (b).
For 1, the weight loss from 35 ˚C to 263 ˚C corresponds to the water molecules and DMF
molecules (found: 9.42%, calcd: 9.31%). For 2, the weight loss from 35 ˚C to 270 ˚C
corresponds to the water molecules and DMF molecules (found: 14.58%, calcd: 14.45%).
Knoevenagel Condensation Reactions. In a typical procedure, aldehyde (1 mmol),
malononitrile (1.2 mmol), and 1 (0.005 mmol, 10 mg) were placed in a 10 mL round-bottom
flask. Then the mixture was heated to 60 ˚C and stirred for 1 h. The yields were determined
by GC and 1H NMR spectra with tridecane as internal standard.
Cycloaddtion of CO2 to epoxides. In a typical procedure, epoxide (10 mmol), n-Bu4NBr
(32 mg, 0.1 mmol) and 2 (10 mg, 0.005 mmol) were placed in a 10 mL reactor. The reactor
was purged several times with CO2 and bubbled with 1 atm CO2. Then, the reactor was heated
to 80 ˚C and stirred for 4 h. The product structure was confirmed by 1H NMR and the yields
were calculated by and GC and 1H NMR .

Fig. S3 View of the coordination environment of the Zn(II) cation in 2. Symmetric codes: #1 -
x+y+1, -x+1, z ; #2 -y+1, x-y, z; #3 x, y, -z+1/2 ; #4 y+1, x-1, -z.
To confirm the porosity in the MOFs, we took the typical 1 as an example. The crystals of
1 were immersed in methanol, ethanol and acetone for three days, respectively. Then, thermal
analysis was carried out on these samples. They showed obvious profiles characterized by
solvent losses (Fig. S4).
(a) (b)
(c)
Fig. S4 Thermogravimetric curves of 1 with loading guest molecules of methanol (a), ethanol
(b) and acetone (c).

TGA curves exhibit weight losses of ca. 8.1%, 7.5% and 7.4% (in the temperature ranges of
20−120 °C, 20−130 °C and 20−100 °C), which are ascribed to the release of methanol,
ethanol and acetone, respectively.
(a)
(b)
(c)
(d)
(e)
(f)
(g)
(h)
(i)

(j)
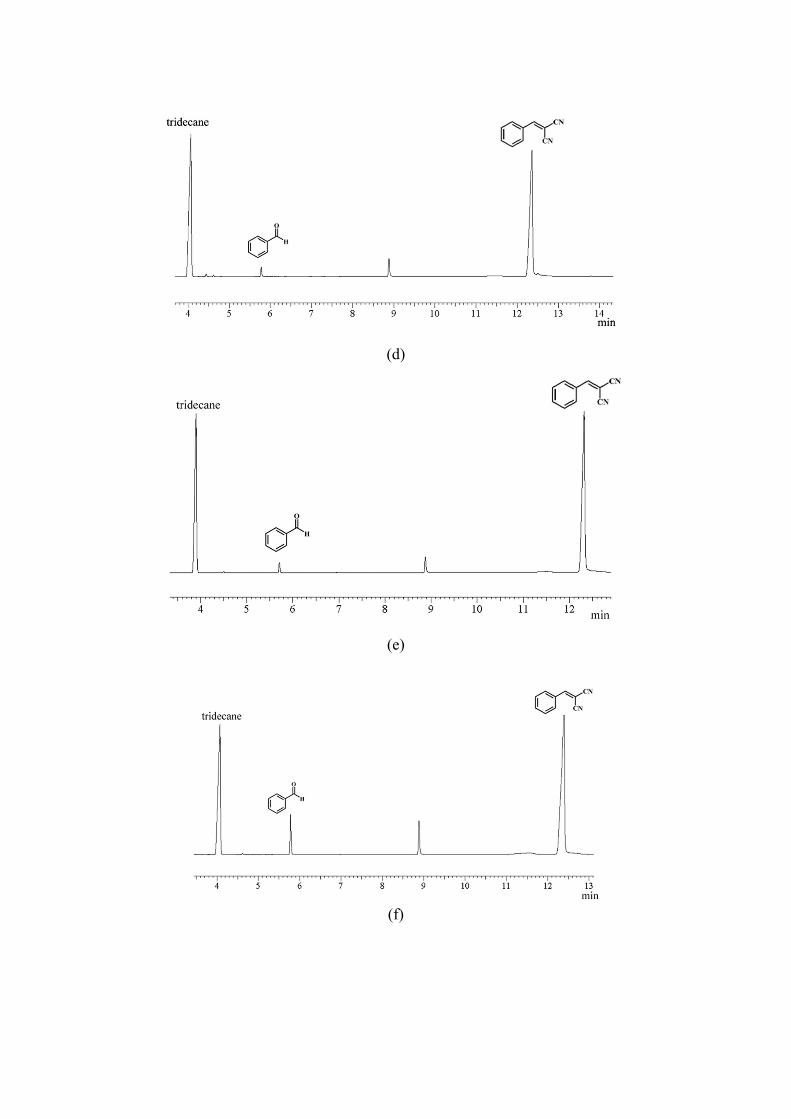
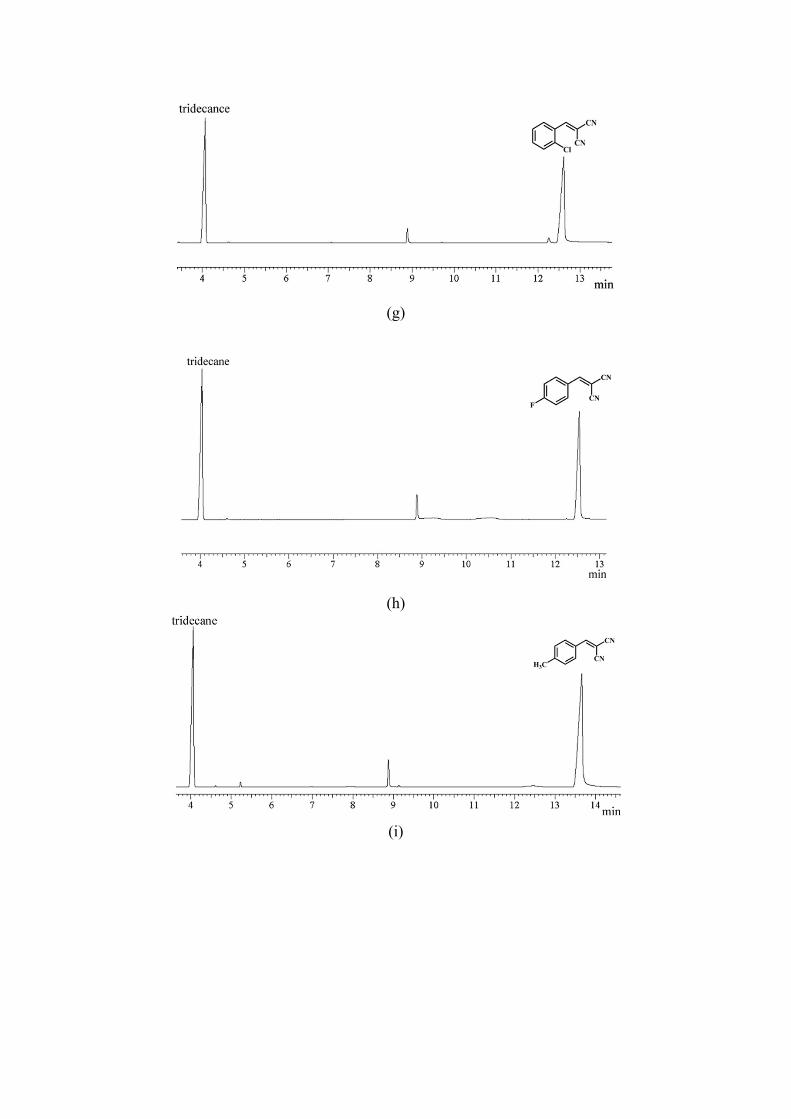
(k)Fig. S5 GC of Knoevenagel condensation reaction of malononitrile.
(a) With benzaldehyde without catalyst after 60 mins.
(b) With benzaldehyde using catalyst 1 after 30 mins.
(c) With benzaldehyde using catalyst 1 after 60 mins.
(d) With benzaldehyde using catalyst 2 after 60 mins.
(e) With benzaldehyde using catalyst 1a after 60 mins.
(f) With benzaldehyde using catalyst Cd(NO3)2·4H2O after 60 mins.
(g) With 2-chlorobenzaldehyde using catalyst 1 after 60 mins.
(h) With 4-fluorobenzaldehyde using catalyst 1 after 60 mins.
(i) With 4-methylbenzaldehyde using catalyst 1 after 60 mins.
(j) With 4-ethylbenzaldehyde using catalyst 1 after 60 mins.
(k) With 4-methoxybenzaldehyde using catalyst 1 after 60 mins.
(a)
(b)

(c)
(d)

(e)
(f)

Fig. S6 1H NMR spectrum of the crude products from the Knoevenagel condensation reaction
of malononitrile with (a) Benzaldehyde. (b) 2-Chlorobenzaldehyde. (c) 4-Fluorobenzaldehyde.
(d) 4-Methylbenzaldehyde. (e) 4-Ethylbenzaldehyde. (f) 4-Methoxybenzaldehyde.
The signals in the range of 0.5-2.0 ppm maybe caused by the catalytic internal standard
tridecane. The signal at 5.3 ppm is caused by the impurity CH2Cl2 in CDCl3 during the 1H
NMR testing.
Fig. S7 PXRD patterns of 1 simulated (black), the experimental (red) and after 4 cycles
Knoevenagel condensation reaction (green).
(a)

(b)
(c)
(d)

(e)
Fig. S8 GC of cycloaddtion of CO2 to epichlorohydrin using (a) Catalyst 1 for 2 hours at 1
atm. (b) n-Bu4NBr as catalyst for 2 hours at 1 atm. (c) Catalyst 1 and n-Bu4NBr as co-catalyst
for 2 hours at 1 atm. (d) Catalyst 2 for 2 hours at 1 atm. (e) Catalyst 2 and n-Bu4NBr as co-
catalyst for 2 hours at 1 atm.
(a)

(b)
(c)
(d)
Fig. S9 GC of cycloaddtion of CO2 to (a) 1,2-Epoxyhexane using catalyst 2 and n-Bu4NBr as
co-catalyst for 2 hours. (b) 1,2-Epoxyethylbenzene (c) Gylcidyl phenyl ether (d)
Benzylglycidylether using catalyst 2 and n-Bu4NBr as co-catalyst for 4 hours.
(a)

(b)
(c)
Fig. S10 GC of cycloaddtion of CO2 to (a) 1,2-Epoxyethylbenzene (b) Gylcidylphenylether (c)
Benzylglycidylether using catalyst 2 and n-Bu4NBr as co-catalyst for 12 hours.
(a)

(b)
(c)
(d)Fig. S11 GC of cycloaddtion of CO2 to epichlorohydrin using catalyst 2 and n-Bu4NBr as co-
catalyst for (a) 0.5 hour, (b) 1 hour, (c) 1.5 hours and (d) after removing catalysts at 1 atm.

(a)
(b)

.
(c)
(d)

(e)
Fig. S12 (a)1H NMR spectrum of the product 4-chloromethyl-1,3-dioxolan-2-one achieved
from the cycloaddition of CO2 to epichlorohydrin.
(b) 1H NMR spectrum of the product 4-butyl-1,3-dioxolan-2-one achieved from the
cycloaddition of CO2 to 1,2-epoxyhexane.
(c) 1H NMR spectrum of 1,2-epoxyethylbenzene and its corresponding reaction mixture. 1H
NMR (500 MHz, CDCl3) for 4-phenyl-1,3-dioxolan-2-one.
(d) 1H NMR spectrum of gylcidylphenylether and its corresponding reaction mixture. 1H
NMR (500 MHz, CDCl3) for 4-(phenoxymethyl)-1,3-dioxolan-2-one.
(e) 1H NMR spectrum of the product 4-(phenylmethoxymethyl)-1,3-dioxolan-2-one achieved
from the cycloaddition of CO2 to glycidylbenzylether.
The signals at 0.5-2.0 ppm and 5.3 ppm are caused by the impurities in CDCl3 during the
1H NMR testing.

Fig. S12 PXRD patterns of the simulated (black), the experimental (red) and after 4 cycles
cycloaddition reaction catalyzed by 2 (green).
Fig. S13 PXRD patterns of the simulated (black) and the experimental (red) of 1a .
Table S1 Crystal Data and Structure Refinements.
1 2 1aFormula C78H85O25N13Cd3 C84H95O28N15Zn3 C81H78O18N12Cd3
Mr 1941.78 1958.85 1844.75Crystal system hexagonal hexagonal hexagonalspace group P-62c P-62c P-62ca/Å 18.3047(6) 19.4560(11) 18.1130(5)

b/Å 18.3047(6) 19.4560(11) 18.1130(5)c/Å 37.9711(15) 37.381(3) 39.2720(15)α/° 90 90 90β/° 90 90 90γ/° 120 120 120V/ Å3 11018.2(8) 12254.3(16) 11158.2(6)Z 4 4 4Dc (g/cm3) 1.171 1.062 1.098F(000) 3952 4072 3744GOF on F2 0.848 0.959 1.100R1a [I > 2σ(I)] 0.0494 0.0583 0.0688wR2
b (all data) 0.1375 0.1725 0.2043R(int) 0.0678 0.0757 0.0543aR1 = ∑||Fo| - |Fc||/∑|Fo|. bwR2 = {∑[w(Fo2 - Fc2)2]/∑w(Fo2)2]}1/2.
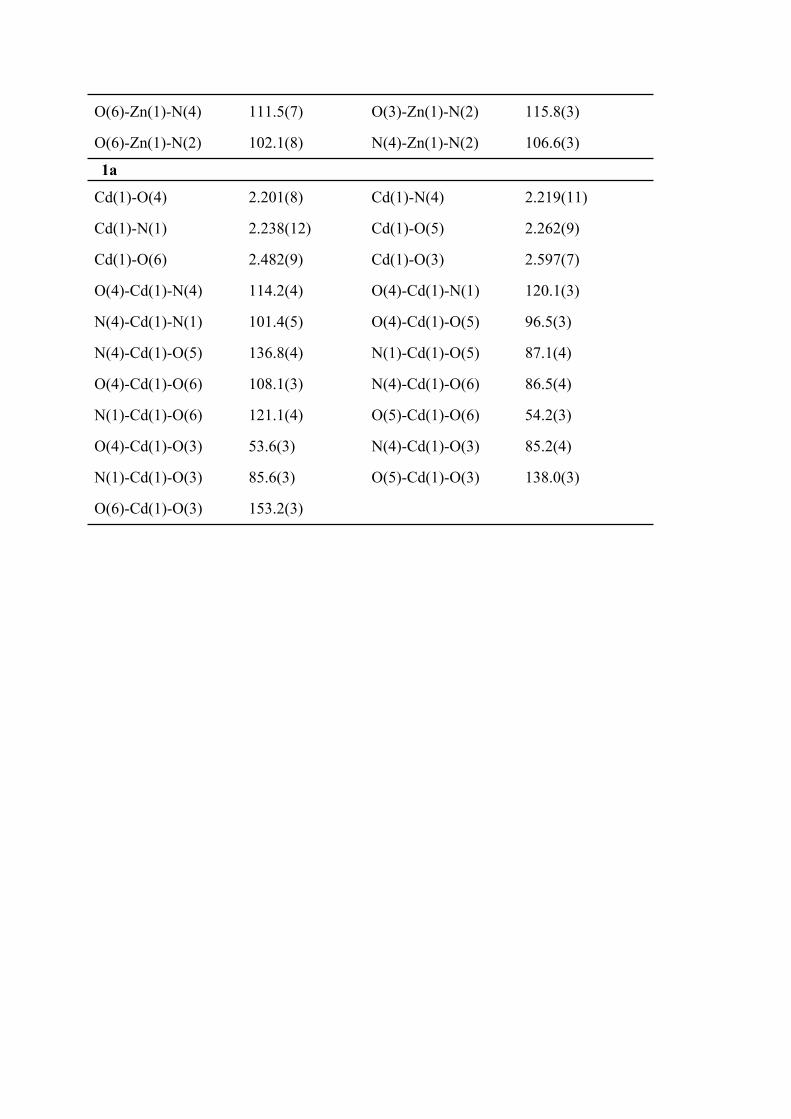
Table S2 Selected Bond Distances (Å) and Angles (°) for 1, 2 and 1a.
1
Cd(1)-N(1) 2.233(7) Cd(1)-N(3) 2.248(7)
Cd(1)-O(3) 2.262(5) Cd(1)-O(1) 2.308(5)
Cd(1)-O(2) 2.414(5) Cd(1)-O(4) 2.460(5)
N(1)-Cd(1)-N(3) 97.9(3) N(1)-Cd(1)-O(3) 125.5(2)
N(3)-Cd(1)-O(3) 116.8(2) N(1)-Cd(1)-O(1) 88.3(2)
N(3)-Cd(1)-O(1) 135.0(2) O(3)-Cd(1)-O(1) 93.9(2)
N(1)-Cd(1)-O(2) 123.8(2) N(3)-Cd(1)-O(2) 87.2(2)
O(3)-Cd(1)-O(2) 99.7(2) O(1)-Cd(1)-O(2) 53.98(17)
N(1)-Cd(1)-O(4) 87.3(2) N(3)-Cd(1)-O(4) 90.2(2)
O(3)-Cd(1)-O(4) 54.35(18) O(1)-Cd(1)-O(4) 134.8(2)
O(2)-Cd(1)-O(4) 148.77(18)
2
Zn(1)-O(3) 1.941(5) Zn(1)-O(6) 1.997(19)
Zn(1)-N(4) 1.978(9) Zn(1)-N(2) 2.022(9)
O(3)-Zn(1)-O(6) 106.5(5) O(3)-Zn(1)-N(4) 113.8(3)
O(6)-Zn(1)-N(4) 111.5(7) O(3)-Zn(1)-N(2) 115.8(3)
O(6)-Zn(1)-N(2) 102.1(8) N(4)-Zn(1)-N(2) 106.6(3)
1a
Cd(1)-O(4) 2.201(8) Cd(1)-N(4) 2.219(11)
Cd(1)-N(1) 2.238(12) Cd(1)-O(5) 2.262(9)
Cd(1)-O(6) 2.482(9) Cd(1)-O(3) 2.597(7)
O(4)-Cd(1)-N(4) 114.2(4) O(4)-Cd(1)-N(1) 120.1(3)
N(4)-Cd(1)-N(1) 101.4(5) O(4)-Cd(1)-O(5) 96.5(3)
N(4)-Cd(1)-O(5) 136.8(4) N(1)-Cd(1)-O(5) 87.1(4)
O(4)-Cd(1)-O(6) 108.1(3) N(4)-Cd(1)-O(6) 86.5(4)
N(1)-Cd(1)-O(6) 121.1(4) O(5)-Cd(1)-O(6) 54.2(3)
O(4)-Cd(1)-O(3) 53.6(3) N(4)-Cd(1)-O(3) 85.2(4)
N(1)-Cd(1)-O(3) 85.6(3) O(5)-Cd(1)-O(3) 138.0(3)
O(6)-Cd(1)-O(3) 153.2(3)


