

FULL YEAR 2011
RESULTS PRESENTATION
PRESENTERS:
DANNY WALLIS CHIEF EXECUTIVE OFFICER
LACHLAN ARMSTRONG CHIEF FINANCIAL OFFICER
DOUGALL MCBURNIE DIRECTOR – STRATEGIC OPERATIONS
For
per
sona
l use
onl
y

FY11 revenue up 3% to $98.39M
FY11 EBITDA down 8% to $24.81M (in-line with guidance)
FY11 earnings down 6% to $17.39M
Final fully franked dividend of 6.0 cents per share, bringing total payout ratio to 84% (91% incl. special dividends paid)
Balance sheet remains strong with zero debt
Operating cash flow was solid. Q4 cash flow was affected by a slow down in receipts - this has improved in Q1 FY12 with net cash increasing to $15M in July ‘11
Billable consultant numbers up 7% to 540 (FY10: 504) bringing total staff numbers to 594 (FY10: 550)
Financials
Operations during FY11 were affected by Federal and Victorian Elections, natural disasters in QLD and a client close down over the Christmas period
A significant four year strategic transformation program is being delivered - “Improve, Extend, Grow”
Two new specialist business lines added during FY11 (Business Analytics and Information Management, and DWS i-Solutions). Both these practices are contributing to earnings
New regional office opened in Geelong (Victoria) to service growing regional client demand
Added further strategic management and advisory capability to assist in the formulation and execution of the transformation program and various strategic business initiatives
Operations
2
For
per
sona
l use
onl
y

H1 2011 ($’000)
H2 2011 ($’000)
FY11 ($’000)
FY10 ($’000)
Revenue from continuing operations
48,454 49,932 98,386 95,653
EBITDA 12,769 12,041 24,810 26,845
Margin 26% 24% 25% 28%
NPAT 8,969 8,420 17,389 18,516
EPS 6.78 cents 6.36 cents 13 cents 14 cents
Revenue growth driven by a rate increase in the Victorian business & growth in consulting staff numbers
Weighted average revenue per billable consultant in FY11 $196K (FY10: $198K)
Total billable hours in FY11 783,151 (FY10: 800,579)
Average utilisation per billable consultant in FY11 75% (FY10: 78%)
FY11 utilisation was affected by Federal and Vic Government elections, large client Xmas close down and natural disasters in Queensland
Lower utilisation rates dragged on margins, as did initial investment into new business line in H1. Margins have now stabilised and we expect to see the benefit of our new business lines in future periods
Labour market remains competitive and this continues to put pressure on average salary costs
3
For
per
sona
l use
onl
y

JUNE 2011 ($’000)
JUNE 2010 ($’000)
Cash 10,977 13,656
Debtors 23,945 17,742
WIP 1,974 5,156
Total Assets 67,250 66,664
Borrowings NIL NIL
Total Liabilities 9,864 10,453
Net Assets 57,386 56,211
June cash reserves impacted by a slow down in debtor receipts in Q4
Net cash post balance date stronger than PCP at $15M (July ’11)
WIP reduced against PCP with several large projects concluding during Q1 FY11
Continued strengthening of our working capital position
Zero debt position maintained
JUNE 2011 JUNE 2010
Final Dividend 6.0 cents 6.25 cents
Total Dividends 12.0 cents 11.25 cents
Payout Ratio 84% (91% Inc SD) 80%
Franking credits $24.82M $21.54M
Record Date 16 Sept 2011 17 Sept 2010
Dividend payout ratio has been increased due to excess reserves of free cash
Special 1.0 cent fully franked dividend declared during the year to return cash and franking credits
4
For
per
sona
l use
onl
y
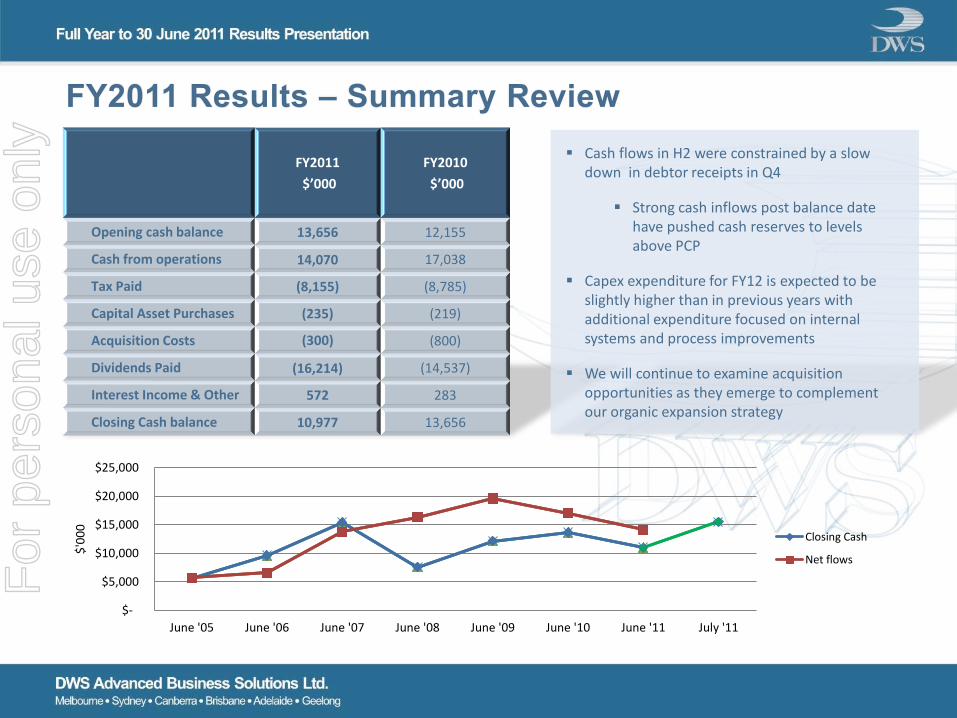
FY2011
$’000
FY2010
$’000
Opening cash balance 13,656 12,155
Cash from operations 14,070 17,038
Tax Paid (8,155) (8,785)
Capital Asset Purchases (235) (219)
Acquisition Costs (300) (800)
Dividends Paid (16,214) (14,537)
Interest Income & Other 572 283
Closing Cash balance 10,977 13,656
Cash flows in H2 were constrained by a slow down in debtor receipts in Q4
Strong cash inflows post balance date have pushed cash reserves to levels above PCP
Capex expenditure for FY12 is expected to be slightly higher than in previous years with additional expenditure focused on internal systems and process improvements
We will continue to examine acquisition opportunities as they emerge to complement our organic expansion strategy
$-
$5,000
$10,000
$15,000
$20,000
$25,000
June '05 June '06 June '07 June '08 June '09 June '10 June '11 July '11
$'0
00
Closing Cash
Net flows
For
per
sona
l use
onl
y

June 2011
Information &
Communications
Technology
24% Utilities
17%
Government
24%
Banking &
Finance
18%
Other
17%
June 2010
Information &
Communications
Technology
33% Utilities
20%
Government
17%
Banking &
Finance
13%
Other
17%
Significant reduction in ICT revenues following the successful delivery of large programs of work in Q1
Although the Federal and Victorian Government elections were disruptive in H1, we have continued to win market share in the Government sector which we view as favourable in the current economic environment
Banking & Finance client portfolio continues to expand and we are confident of further growth in this sector in FY12
We have expanded our national business development capability and we are focussing on winning market share within our existing clients while also increasing our client portfolio
Revenue by Sector Analysis
6
For
per
sona
l use
onl
y
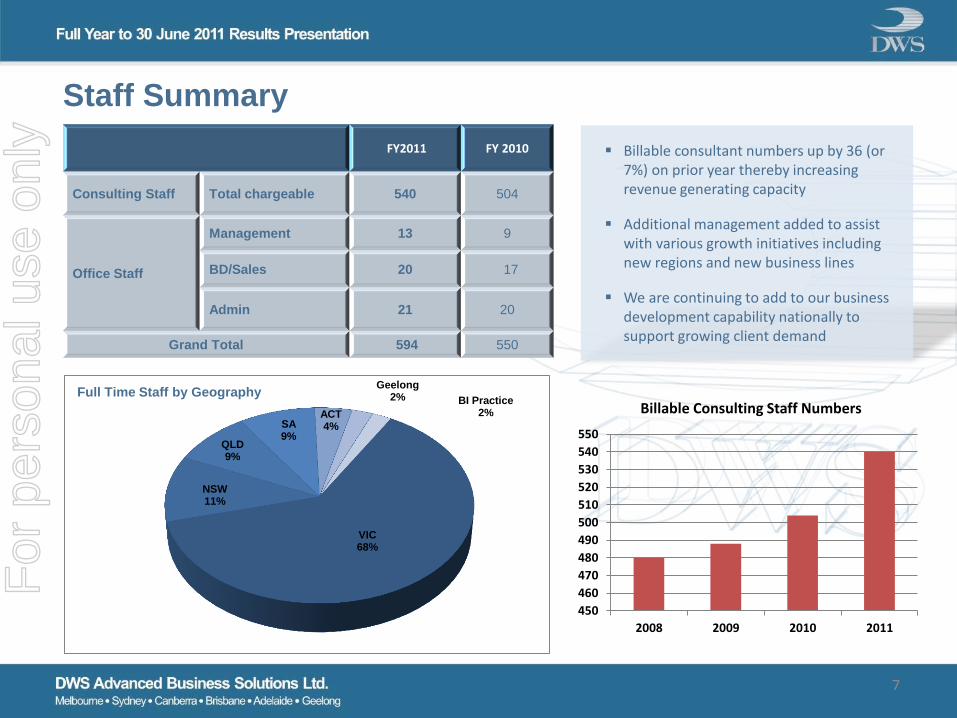
FY2011 FY 2010
Consulting Staff Total chargeable 540 504
Office Staff
Management 13 9
BD/Sales 20 17
Admin 21 20
Grand Total 594 550
VIC 68%
NSW 11%
QLD 9%
SA 9%
ACT 4%
Geelong 2% BI Practice
2%
Full Time Staff by Geography
Billable consultant numbers up by 36 (or 7%) on prior year thereby increasing revenue generating capacity
Additional management added to assist with various growth initiatives including new regions and new business lines
We are continuing to add to our business development capability nationally to support growing client demand
Staff Summary
450
460
470
480
490
500
510
520
530
540
550
2008 2009 2010 2011
Billable Consulting Staff Numbers
7
For
per
sona
l use
onl
y

EVP research undertaken by internationally recognised consultancy
Robust training and development framework implemented for all consulting staff
Leading branding and marketing consultant engaged to assist with the development of the brand strategy
Implementation of new performance management platform
Launch of new and enhanced DWS brand (including logo, website and marketing materials)
Enhance and expand our recruitment strategy (which includes our 457 visa program)
FY12 INITIATIVES
Enhance our overall Employee Value Proposition (EVP)
Brand refresh and launch to raise DWS’ industry awareness
Internal platforms and process improvements
“Improve, Extend, Grow” Strategy Update
AREAS OF FOCUS DELIVERED IN FY11
Lower consultant attrition rates through enhanced consultant career development
Attraction of industry recognised technical and solution specialists to underpin our delivery capability
Improvement to core operations by driving operational efficiency with the use of technology platforms
Raise the profile of DWS at Executive and Board levels of existing and potential clients
IMPROVE
KEY OUTCOMES
8
For
per
sona
l use
onl
y
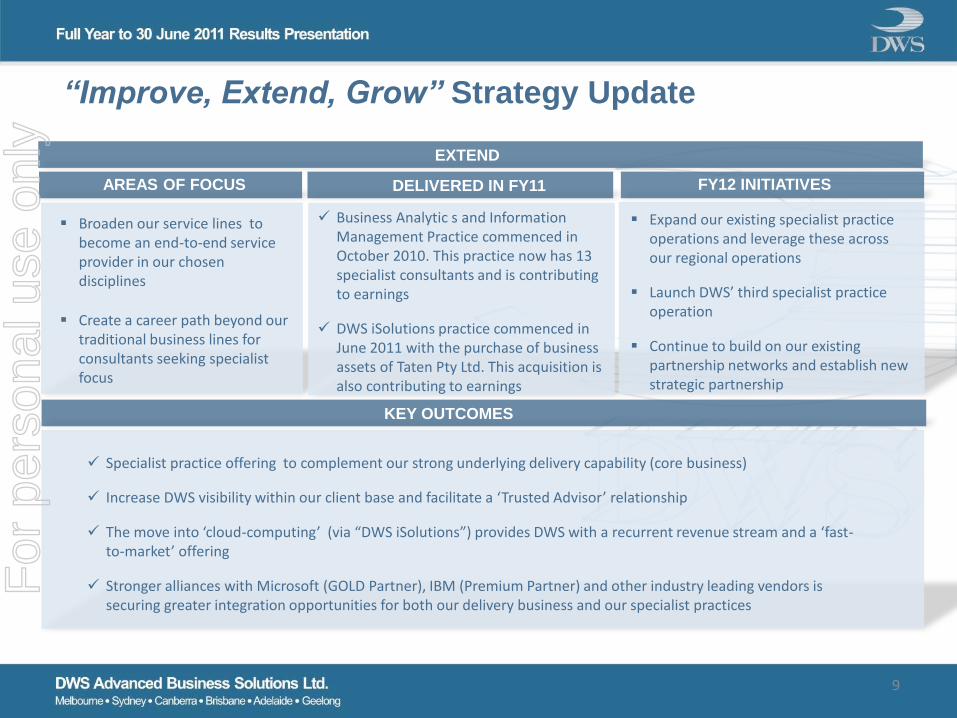
Business Analytic s and Information Management Practice commenced in October 2010. This practice now has 13 specialist consultants and is contributing to earnings
DWS iSolutions practice commenced in June 2011 with the purchase of business assets of Taten Pty Ltd. This acquisition is also contributing to earnings
Expand our existing specialist practice operations and leverage these across our regional operations
Launch DWS’ third specialist practice operation
Continue to build on our existing partnership networks and establish new strategic partnership
FY12 INITIATIVES
Broaden our service lines to become an end-to-end service provider in our chosen disciplines
Create a career path beyond our traditional business lines for consultants seeking specialist focus
“Improve, Extend, Grow” Strategy Update
AREAS OF FOCUS DELIVERED IN FY11
Specialist practice offering to complement our strong underlying delivery capability (core business)
Increase DWS visibility within our client base and facilitate a ‘Trusted Advisor’ relationship
The move into ‘cloud-computing’ (via “DWS iSolutions”) provides DWS with a recurrent revenue stream and a ‘fast-to-market’ offering
Stronger alliances with Microsoft (GOLD Partner), IBM (Premium Partner) and other industry leading vendors is securing greater integration opportunities for both our delivery business and our specialist practices
EXTEND
KEY OUTCOMES
9
For
per
sona
l use
onl
y
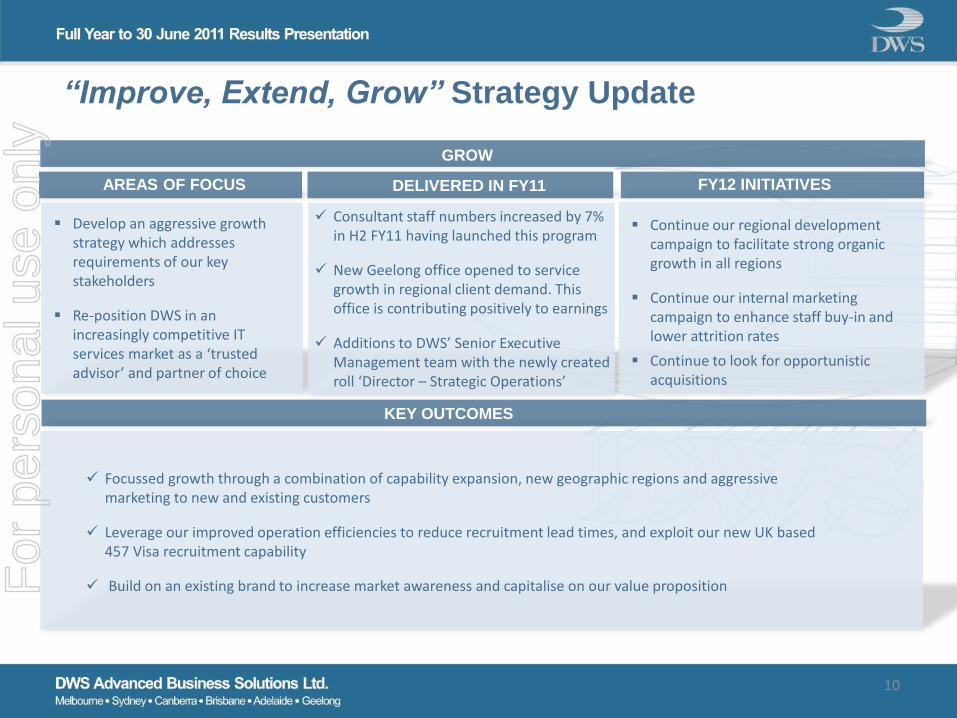
Consultant staff numbers increased by 7% in H2 FY11 having launched this program
New Geelong office opened to service growth in regional client demand. This office is contributing positively to earnings
Additions to DWS’ Senior Executive Management team with the newly created roll ‘Director – Strategic Operations’
Continue our regional development campaign to facilitate strong organic growth in all regions
Continue our internal marketing campaign to enhance staff buy-in and lower attrition rates
Continue to look for opportunistic acquisitions
FY12 INITIATIVES
Develop an aggressive growth strategy which addresses requirements of our key stakeholders
Re-position DWS in an increasingly competitive IT services market as a ‘trusted advisor’ and partner of choice
“Improve, Extend, Grow” Strategy Update
AREAS OF FOCUS DELIVERED IN FY11
Focussed growth through a combination of capability expansion, new geographic regions and aggressive marketing to new and existing customers
Leverage our improved operation efficiencies to reduce recruitment lead times, and exploit our new UK based 457 Visa recruitment capability
Build on an existing brand to increase market awareness and capitalise on our value proposition
GROW
KEY OUTCOMES
10
For
per
sona
l use
onl
y
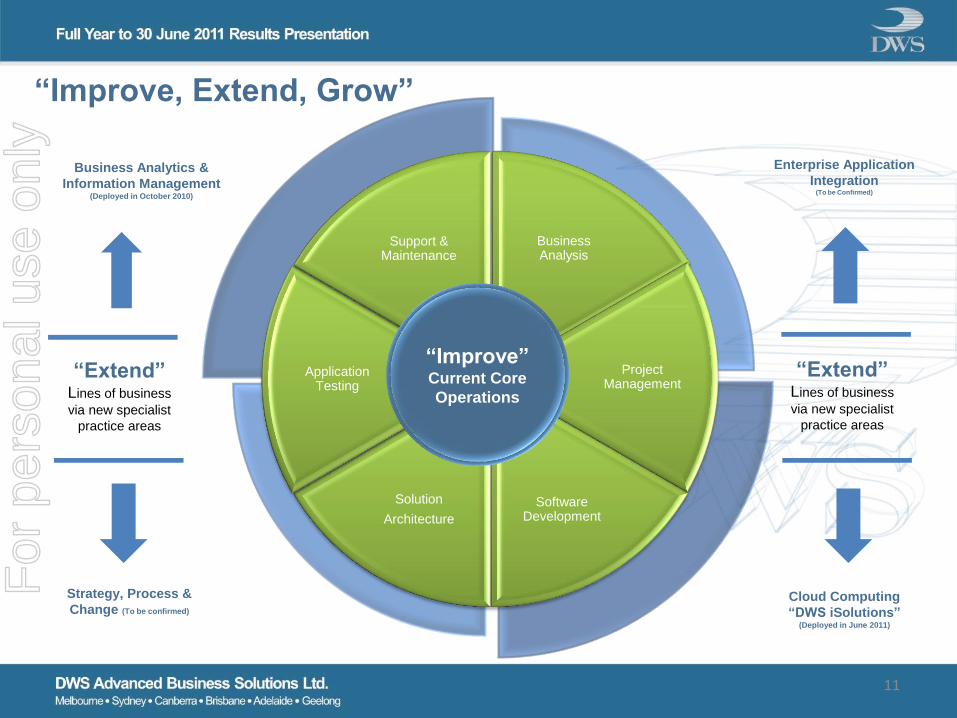
Business Analysis
Project Management
Software Development
Solution
Architecture
Application Testing
Support & Maintenance
Business Analytics &
Information Management (Deployed in October 2010)
Strategy, Process &
Change (To be confirmed)
Cloud Computing
“DWS iSolutions” (Deployed in June 2011)
Enterprise Application
Integration (To be Confirmed)
“Improve, Extend, Grow”
“Improve” Current Core
Operations
“Extend” Lines of business
via new specialist
practice areas
“Extend” Lines of business
via new specialist
practice areas
11
For
per
sona
l use
onl
y

New Practice - “DWS iSolutions”
Established through the acquisition of the Taten business assets
Industry leading Internet technologies delivered through a Cloud Computing model
Revenue based on ‘per click’ basis
Strong existing client base in Financial Services industry
Introduces this client base to DWS
Represents significant opportunity to deploy this technology across existing DWS clients
Gain important exposure to Cloud Computing paradigm
Opportunity to ‘Extend’ DWS iSolutions service offering with additional Cloud Solutions
12
For
per
sona
l use
onl
y
Summary and Outlook
We have a clear strategy which we are successfully executing and we remain confident that this will underpin the continued development of our business
Outlook for FY12 is positive and we are continuing to see solid demand for services across the Government, Banking and Finance, and Utilities sectors
We are seeing potential for further headcount growth in our QLD, ACT, Vic , SA operations and BI practice operations in H1
We are optimistic about the continued development of our specialist practice offerings and we are confident that these will continue to see us win market share in these chosen domains
Although the economic climate remains difficult, we are confident that our focussed strategy will continue to see DWS capitalise on opportunities as they emerge
13
For
per
sona
l use
onl
y


