

ACN Final (tick) Financial Year ended (‘current
period’)
006 067 607 Preliminary Final 30-Jun-16
30-Jun-16 30-Jun-15
$ $
1. Revenues from ordinary activities 19,340,540 16,207,218 3,133,322 19.33%
2. Net profit/(loss) after tax 5,218,430 4,016,258 1,202,172 29.93%
3. Other comprehensive income for the period (foreign currency translation)
(3,068) (10,845) 7,777 71.71%
4. Net comprehensive income after tax attributable to members
5,215,362 4,005,413 1,209,949 30.21%
5. Record date for determining entitlements to the final dividend
Appendix 4E
Senetas Corporation Limited
Final dividend: not proposed
For announcement to the marketResults
Increase / (Decrease) $
%
For
per
sona
l use
onl
y

6. Brief Explanation of figures 1 to 3
FY2016 highlights:
• Operating revenue up 19% to $19.34 million (FY2015: $16.21 million);
• Net profit before tax up 17% to $7.02 million (FY2015: $6.02 million);
Appendix 4E (continued)
Senetas delivers strong full year profit growth and cash flow.
Highlights
• Net profit after tax up 30% to $5.22 million (FY2015: $4.02 million);
• Margins were very strong with gross profit margin at 83%, pre-tax profit margin at 36% and after tax net profit margin at 27%;
• Cash flow was excellent, with net operating cash flow of $5.19 million;
• Sound, unleveraged balance sheet
- No debt;- Cash on hand at 30 June 2016 of $20.85 million (FY2015: 15.90 million); - Net assets up 41% to $18.53 million; and- Return on Equity at 33%
• All new product development projects are on track and the new 100Gbps encryptor is currently undergoing certification in order to progress customer testing.
Revenue growth was balanced across both product sales and maintenance revenue and it is particularly pleasing to note the increasing share of revenue represented by commercial customers who now represent over 50% of operating revenue.
Commentary
The 2016 full year profit is a record for the Company and was achieved despite a $1.43 million increase in R&D expenditure during the period and lower than expected sales in the first half of the year as a result of the integration of SafeNet into Gemalto.
Subject to completion of the certification and customer testing processes, sales of the 100Gbps encryptor are expected to impact operating revenue in the first half of calendar 2017.
These results continue to reflect the market’s rapidly growing awareness of the critical need for high assurance encryption solutions in order to protect data in transit.
The result also reflects benefits from the more enhanced supportive role Senetas is now playing in the sales, marketing and business development partnership with Gemalto and our other distribution partners, as well as the aforementioned progress that has been made in the integration of Senetas’ global distributor SafeNet with Gemalto during the second half of the fiscal year.
Progress on Senetas’ key new product development initiatives was accelerated during the year with a significant increase in R&D expenditure. Additional permanent and contract resources were employed in order to fast track R&D projects with particular focus on the new 100Gbps encryptor that is now undergoing certification.
Senetas’ financial position remains extremely sound, with net assets up 41% during the period, no debt, and cash on hand of almost $21 million.
This result is a strong endorsement of both the quality of the Company’s personnel and product solutions, as well as its ability to identify and meet the critical security needs of our end customers and business partners.
For
per
sona
l use
onl
y

Research and Development
A highly innovative and responsive R&D capability remains the Company’s core focus and will be the major driver of growth prospects and increased profitability going forward.
Senetas substantially increased its investment in R&D during FY2016 in order to fast-track initiatives that will build new capability and drive revenue growth in FY2017 and beyond. R&D expenditure during the year was $1.43 million higher than the prior period and reflected a total R&D investment aggregating approximately 29% of operating revenue.
The key focus during the year was development of the 100Gbps encryptor that is on track to be available for sale by the end of this calendar year or early in 2017. The certification process commenced mid-year and customer testing is due to be completed within the next two or three months.
Senetas’ custom encryption algorithm product (“CEAP”) is also currently undergoing customer testing and certification. Subject to the timing of certification and export approval, it is expected that the CEAP will become available for sale late in FY2017. Development of Senetas’ virtual encryption technologies (“VET”) is ahead of schedule and is now available for customer testing.
Senetas is continuing to work actively with its customers, master distribution partner (Gemalto) and technology partners in order to identify new product/service opportunities that will create significant ongoing revenue growth for Senetas in the future.
Balance Sheet and Cash Flow
As a rapidly growing R&D technology company, the Board continues to implement a conservative capital management policy in order to conserve capital for continued investment in attractive R&D product development, as well as to ensure that Senetas is well positioned to take advantage of other compelling investment opportunities.
Senetas’ balance sheet continues to strengthen and provides significant capacity to support both organic growth and investment. Net assets increased 41% to $18.53 million and the cash balance at 30 June 2016 was $20.85 million.
Net operating cash flow remained strong at $5.19 million in FY2016 but was lower than FY2015. The key contributing factors to the lower cash flow versus the prior period were:
1. Tax paid of $1.25 million during FY2016 compared to nil in the prior period; and2. Higher receivables at 30 June 2016 due to the shift in weighting of product sales to later in the fiscal year and the higher R&D rebate due in FY2017.
Senetas expects R&D expenditure in FY2017 will be at a similar level to FY2016.
Appendix 4E (continued)
The Board periodically reviews its capital management policy and in so doing takes into account a variety of factors including R&D and other investment opportunities, financial returns, risk and liquidity considerations which might impact Senetas’ business.
Product sales to commercial customers grew robustly and more than offset slower sales to government customers. Sales continue to be weighted towards late in each half year and commercial sector sales, in particular, were significantly stronger than projected in the 6 month period ended 30 June 2016.
Delayed commercial customer sales at 31 December 2015 were completed as expected during the second half of the fiscal year; however, some of the delayed US Federal Government sales will now not proceed as some agencies move from a SONET to Ethernet network over the next 3-4 years. Growth in Senetas’ maintenance revenue from FY2017 may moderate as the higher cost SONET maintenance contracts roll off throughout that period. However, the Company expects that its lower cost Ethernet encryptors will replace the existing SONET encryptors in those updated networks.
The company is working closely with Gemalto to significantly improve its Government business.
Revenue Growth
Revenue growth was driven by 19% growth in both product sales and maintenance revenue during the period.
For
per
sona
l use
onl
y
An additional tax credit of $0.21 million (FY2015: nil) was also booked to recognise the remaining carried forward tax losses available to be utilised against taxable income in the 2017 year and beyond. Utilisation of the remaining tax losses is restricted such that only a portion can be utilised in any year; however, it is expected that the losses will be fully utilised within the next 3-4 years.
Outlook
Continued growth in data flows across Layer 2 networks combined with increasing recognition of the need for high assurance encryption solutions creates significant opportunities for the sale of Senetas’ existing products and those under development.
Whilst the growth outlook for the sector remains extremely positive, Senetas’ future sales growth rates remain difficult to predict accurately. Sales lead times are long and customers are generally reluctant to disclose detail about the timing and scale of planned purchases.
R&D Rebate
The R&D rebate is available to Senetas whilst its operating revenue remains below $20 million per annum. Should Senetas’ annual operating revenue exceed $20 million in future years the R&D rebate will no longer be available. Instead, the R&D rebate converts into a tax offset equal to 40% of eligible R&D expenditure. The R&D expenditure would remain non-deductible for the purposes of calculating Senetas’ corporate income tax liability.
Appendix 4E (continued)
Senetas very strongly believes that the threshold for R&D tax rebate should be significantly increased in order to maximise the incentive for successful smaller enterprises to invest in critical R&D expenditure. The Company is working with government at all levels to bring broader awareness and urgency in order to accomplish this important incentive for the future benefit of the Australian economy.
Tax Expense
Tax expense in 2016 was reduced by a credit of $0.94 million (FY2015: $0.45 million) recognised in relation to the use of carried forward tax losses.
If the current R&D rebate is unavailable going forward, Senetas’ Other Income and Profit Before Tax would be lower by the amount of the R&D tax rebate previously available ($2.1 million in FY2016); however, tax expense would be reduced by an offset equal to 40% of its eligible R&D expenditure. Senetas currently estimates that in those circumstances its effective tax rate would be in the low to mid 20s as a percentage of Profit Before Tax.
Senetas currently receives a tax rebate of 45% from the Australian Government for eligible R&D expenditure. The rebate is currently recorded as Other Income and is received in cash in the following financial year net of any corporate income tax payable. Eligible R&D expenditure is not deductible for the purposes of calculating Senetas’ corporate income tax liability.
The addition of the new 100Gbps encryptor to the Senetas product portfolio later in FY2017 is an exciting opportunity for the Company. While at this stage it is too early to predict the scale of initial sales for the 100Gbps encryptor, the initial interest from Senetas’ largest customers remains very strong.
In addition we expect to commence sales in the March quarter of FY2017 for our custom algorithm and virtual encryption appliances. We expect these sales will add to our overall growth in FY2017.
Senetas has a substantial R&D product roadmap that leverages its engineering skills. These products, when brought to market in the mid term, have the potential to add significantly to the company's revenues and profits. The board considers that the company needs to maintain a strong cash balance to allow for the possibility to extend its engineering capability and, where necessary, to add resources to bring products to market earlier than planned if required.
For
per
sona
l use
onl
y

7. Details of dividend / distribution payments
Interim Dividend:
Final Dividend: Not Proposed
8. Details of Divided Reinvestment Plan
9. Movements in Retained Earnings
30-Jun-16 30-Jun-15
(Cents Per Share) (Cents Per Share)
Net tangible asset backing per ordinary security 1.65 1.20
11. Details of entities over which control has been gained or lost during the period
12. Details of Associates / Joint Venture Holdings
13. Other information on financial statements
14. Foreign Entities – accounting standards used to prepare report
15.Other Information
Compliance Statement
2. This report, and the accounts upon which the report is based (if separate), use the same accounting policies.
3. This report does give a true and fair view of the matters disclosed.
5. The entity has a formally constituted audit committee.
Francis W. Galbally
Chairman
Date: 29 August 2016
Appendix 4E (continued)
Not Proposed
None
None
4. This report is based on accounts which are in the process of being audited.
1. This report has been prepared in accordance with AASB Standards, other AASB authoritative pronouncements and
10. NTA backing
Please refer to Statement of Changes in Equity
N/A
Senetas Europe Ltd - IFRS
N/A
N/A
N/A
None
For
per
sona
l use
onl
y
Contents
CORPORATE INFORMATION 2STATEMENT OF COMPREHENSIVE INCOME 3STATEMENT OF FINANCIAL POSITION 4STATEMENT OF CASHFLOWS 5STATEMENT OF CHANGES IN EQUITY 6NOTES TO THE APPENDIX 4E
1 REVENUE AND EXPENSES 72 CONTRIBUTED EQUITY 73 CASH AND CASH EQUIVALENTS 84 REVENUE BY GEOGRAPHY 95 TRADE AND OTHER RECEIVABLES 9
Appendix 4E FOR THE YEAR ENDED 30 JUNE 2016
For
per
sona
l use
onl
y

Corporate Information
Non-Executive Directors
Executive Director
Andrew R. Wilson
Company Secretary
Brendan Case
Registered Office
Senetas Corporation Limited
312 Kings Way
South Melbourne VIC 3205
Phone: +61 3 9868 4555
Facsimile: +61 3 9821 4899
Web: www.senetas.com
Email: [email protected]
Share Register
Yarra Falls, 452 Johnston Street,
Abbotsford VIC 3061
Phone: + 61 3 9415 5000 Toll Free 1300 13 83 25Facsimile: + 61 3 9473 2500
Investor Relations
For all investor enquiries
Phone: 1300 787 795
Email: [email protected]
Auditors
Ernst & Young
8 Exhibition Street
Melbourne VIC 3000
Francis W. Galbally
Annual General Meeting Date and Place
Annual General Meeting of shareholders of Senetas Corporation Limited (Company) will be held at Royce Hotel 379 St Kilda Road Melbourne VIC 3004, Thursday 17 November 2016.
Lachlan P. Given
Kenneth J. Gillespie
Computershare Registry Services Pty Ltd
Lawrence D. Hansen
2
For
per
sona
l use
onl
y

Notes
2016 2015$ $
Revenue from operating activities 1(a) 19,340,540 16,207,218 Cost of sales (3,228,899) (2,758,600) Gross profit 16,111,641 13,448,618
Other income 1(b) 2,096,625 1,652,698 Depreciation and amortisation expense 1(c) (346,048) (301,091)
Employee benefits expense 1(d) (6,124,898) (5,332,951)
Administration expenses 1(e) (1,932,702) (2,845,327)
Other expenses 1(f) (2,783,019) (600,947)
Profit before income tax 7,021,599 6,021,000
Income tax expense (1,803,169) (2,004,742)
Net profit after income tax for the period 5,218,430 4,016,258
Items that may be classified subsequently to profit or loss
Foreign currency translation (3,068) (10,845)
Other comprehensive income for the period (3,068) (10,845)
Total comprehensive income for the period 5,215,362 4,005,413
Profit for the period is attributable to:Owners of the parent 5,215,362 4,005,413
5,215,362 4,005,413 Total comprehensive income for the period is attributable to:Owners of the parent 5,215,362 4,005,413
5,215,362 4,005,413 Earnings per share
Basic, profit for the year attributable to ordinary equity holders of the parent.
0.0048 0.0028
Diluted, profit for the year attributable to ordinary equity holders of the parent.
0.0048 0.0028
CONSOLIDATED
Statement of Comprehensive Income FOR THE YEAR ENDED 30 JUNE 2016
The above statement of comprehensive income should be read in conjunction with the accompanying notes.
3
For
per
sona
l use
onl
y
Notes
2016 2015$ $
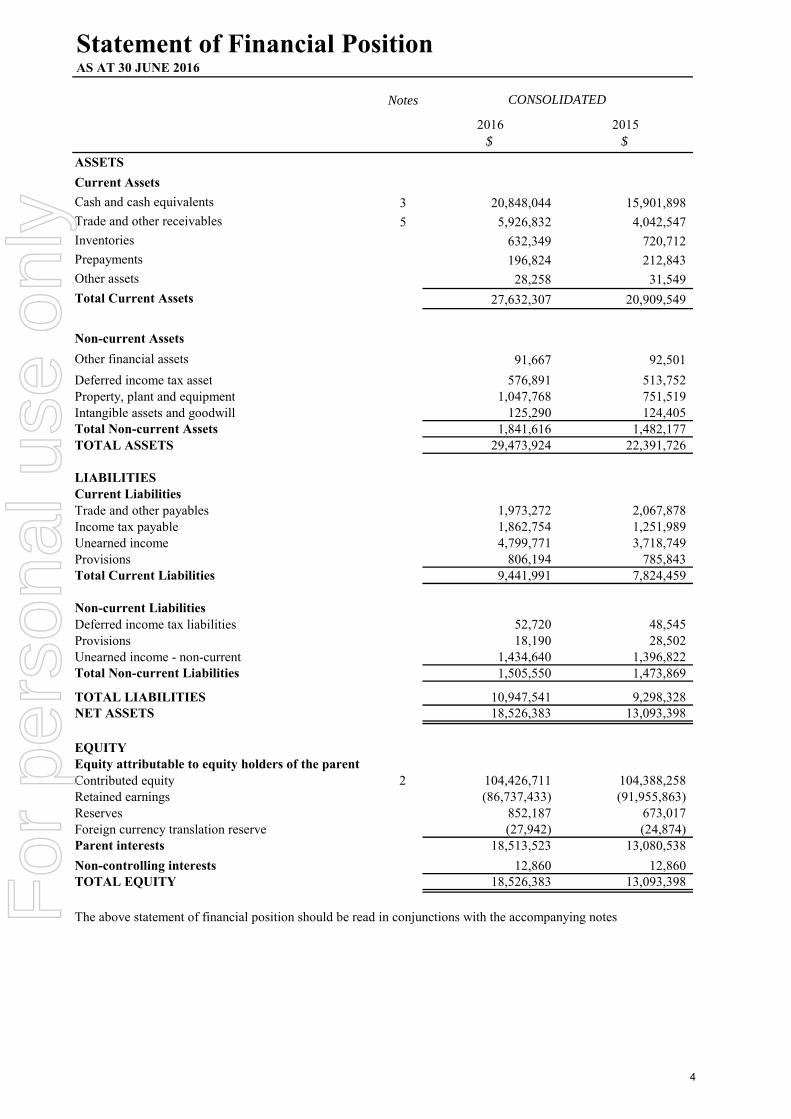
ASSETS
Current Assets
Cash and cash equivalents 3 20,848,044 15,901,898 Trade and other receivables 5 5,926,832 4,042,547 Inventories 632,349 720,712 Prepayments 196,824 212,843 Other assets 28,258 31,549
Total Current Assets 27,632,307 20,909,549
Non-current Assets
Other financial assets 91,667 92,501
Deferred income tax asset 576,891 513,752 Property, plant and equipment 1,047,768 751,519 Intangible assets and goodwill 125,290 124,405 Total Non-current Assets 1,841,616 1,482,177 TOTAL ASSETS 29,473,924 22,391,726
LIABILITIESCurrent LiabilitiesTrade and other payables 1,973,272 2,067,878 Income tax payable 1,862,754 1,251,989 Unearned income 4,799,771 3,718,749 Provisions 806,194 785,843 Total Current Liabilities 9,441,991 7,824,459
Non-current LiabilitiesDeferred income tax liabilities 52,720 48,545 Provisions 18,190 28,502 Unearned income - non-current 1,434,640 1,396,822 Total Non-current Liabilities 1,505,550 1,473,869
TOTAL LIABILITIES 10,947,541 9,298,328 NET ASSETS 18,526,383 13,093,398
EQUITYEquity attributable to equity holders of the parentContributed equity 2 104,426,711 104,388,258 Retained earnings (86,737,433) (91,955,863)Reserves 852,187 673,017 Foreign currency translation reserve (27,942) (24,874)Parent interests 18,513,523 13,080,538
Non-controlling interests 12,860 12,860 TOTAL EQUITY 18,526,383 13,093,398
Statement of Financial Position AS AT 30 JUNE 2016
CONSOLIDATED
The above statement of financial position should be read in conjunctions with the accompanying notes
4
For
per
sona
l use
onl
y
Notes
2016 2015
$ $
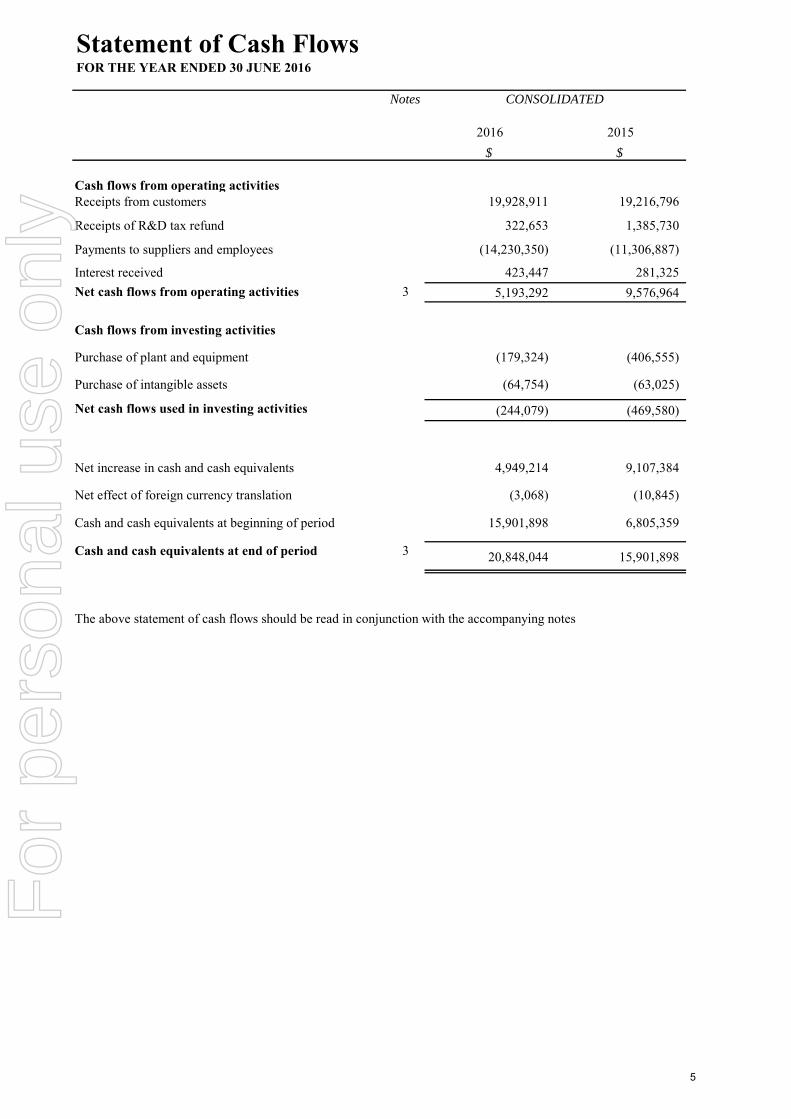
Cash flows from operating activitiesReceipts from customers 19,928,911 19,216,796
Receipts of R&D tax refund 322,653 1,385,730
Payments to suppliers and employees (14,230,350) (11,306,887)
Interest received 423,447 281,325
Net cash flows from operating activities 3 5,193,292 9,576,964
Cash flows from investing activities
Purchase of plant and equipment (179,324) (406,555)
Purchase of intangible assets (64,754) (63,025)
Net cash flows used in investing activities (244,079) (469,580)
Net increase in cash and cash equivalents 4,949,214 9,107,384
Net effect of foreign currency translation (3,068) (10,845)
Cash and cash equivalents at beginning of period 15,901,898 6,805,359
Cash and cash equivalents at end of period 3 20,848,044 15,901,898
Statement of Cash Flows FOR THE YEAR ENDED 30 JUNE 2016
CONSOLIDATED
The above statement of cash flows should be read in conjunction with the accompanying notes
5
For
per
sona
l use
onl
y
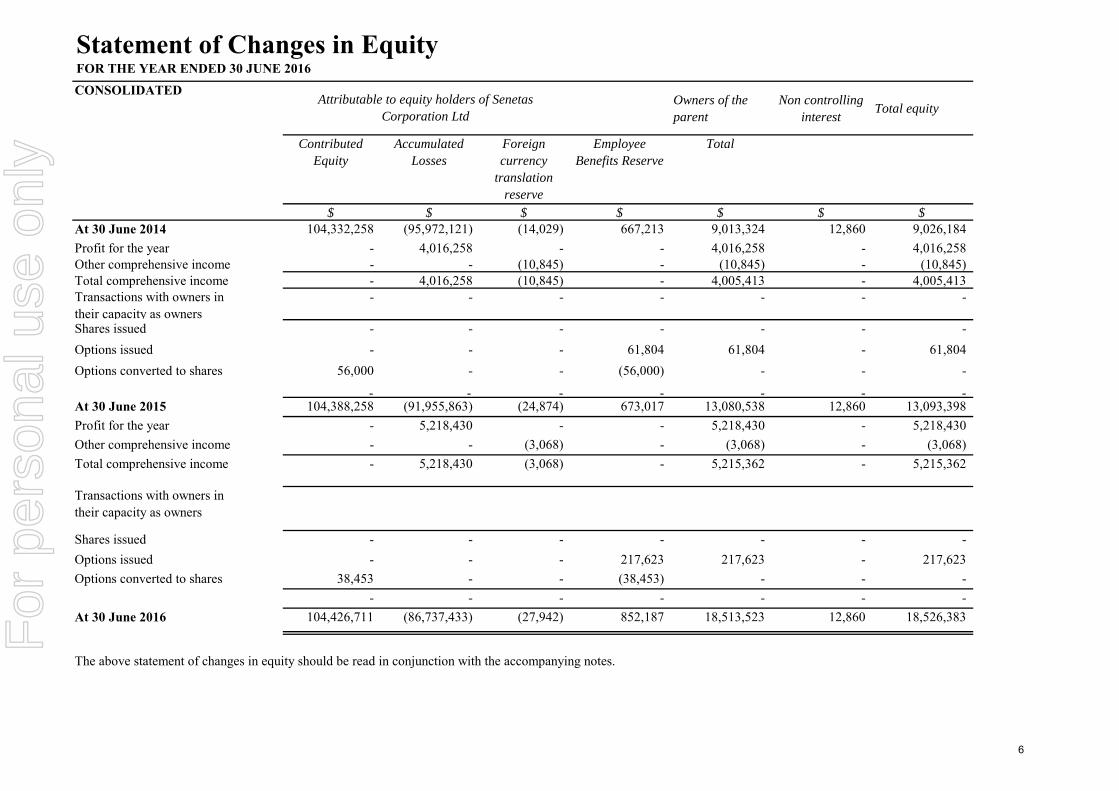
CONSOLIDATEDOwners of the parent
Non controlling interest
Total equity
Contributed Equity
Accumulated Losses
Foreign currency
translation reserve
Employee Benefits Reserve
Total
$ $ $ $ $ $ $At 30 June 2014 104,332,258 (95,972,121) (14,029) 667,213 9,013,324 12,860 9,026,184
Profit for the year - 4,016,258 - - 4,016,258 - 4,016,258 Other comprehensive income - - (10,845) - (10,845) - (10,845)Total comprehensive income - 4,016,258 (10,845) - 4,005,413 - 4,005,413 Transactions with owners in their capacity as owners
- - - - - - -
Shares issued - - - - - - -
Options issued - - - 61,804 61,804 - 61,804
Options converted to shares 56,000 - - (56,000) - - -
- - - - - - -At 30 June 2015 104,388,258 (91,955,863) (24,874) 673,017 13,080,538 12,860 13,093,398
Profit for the year - 5,218,430 - - 5,218,430 - 5,218,430
Other comprehensive income - - (3,068) - (3,068) - (3,068)
Total comprehensive income - 5,218,430 (3,068) - 5,215,362 - 5,215,362
Transactions with owners in their capacity as owners
Shares issued - - - - - - -
Options issued - - - 217,623 217,623 - 217,623
Options converted to shares 38,453 - - (38,453) - - -
- - - - - - -
At 30 June 2016 104,426,711 (86,737,433) (27,942) 852,187 18,513,523 12,860 18,526,383
Statement of Changes in EquityFOR THE YEAR ENDED 30 JUNE 2016
Attributable to equity holders of Senetas Corporation Ltd
The above statement of changes in equity should be read in conjunction with the accompanying notes.
6
For
per
sona
l use
onl
y

1 REVENUES AND EXPENSES
2016 2015
$ $
(a) RevenueSale of goods 11,829,883 9,966,089
Sale of software 39,980 40,608
Product maintenance revenue 7,050,521 5,900,097
Interest revenue:
Non-related parties 420,156 300,424
19,340,540 16,207,218
(b) Other income R & D tax incentive 2,096,625 1,652,698
2,096,625 1,652,698
(c) Depreciation and amortisation expense
Depreciation:
Plant and equipment 219,684 201,887
Leasehold improvements 62,495 42,453
Amortisation:
Software 63,869 56,751
346,048 301,091
(d) Employee benefits expenses
Salaries & Wages 5,555,963 4,974,965
Superannuation 316,266 296,182
Termination Payouts 35,046 -
Share Based Payment Expense 217,623 61,804
6,124,898 5,332,951
(e) Administration expenses
Operating lease 394,245 367,339
Travel expenditure 612,857 524,732
Telephone & internet expenditure 68,497 72,398
Insurance expenditure 113,192 124,935
Marketing expenditure 351,507 291,105
External contractors (sales & corporate) 392,404 1,464,818
1,932,702 2,845,327
(f) Other expenses
Net loss / (gain) on foreign exchange 62,165 (348,464)
Inventory written off / provision 70,026 140,823
Certification, testing and contract engineering 2,004,448 220,108
Write off of plant & equipment - 228
Other overhead expenses 646,380 588,252
2,783,019 600,947
2 CONTRIBUTED EQUITY No. of shares $
Ordinary shares - issued and fully paid 1,078,641,948 104,426,711
No. of shares $Movement in ordinary shares on issue
At 30 June 2015 1,077,891,948 104,388,258
Employee performance rights converted to shares 750,000 38,453
At 30 June 2016 1,078,641,948 104,426,711
Notes to the Appendix 4EFOR THE YEAR ENDED 30 JUNE 2016
CONSOLIDATED
Fully paid ordinary shares carry one vote per share and carry the right to dividends.
7
For
per
sona
l use
onl
y
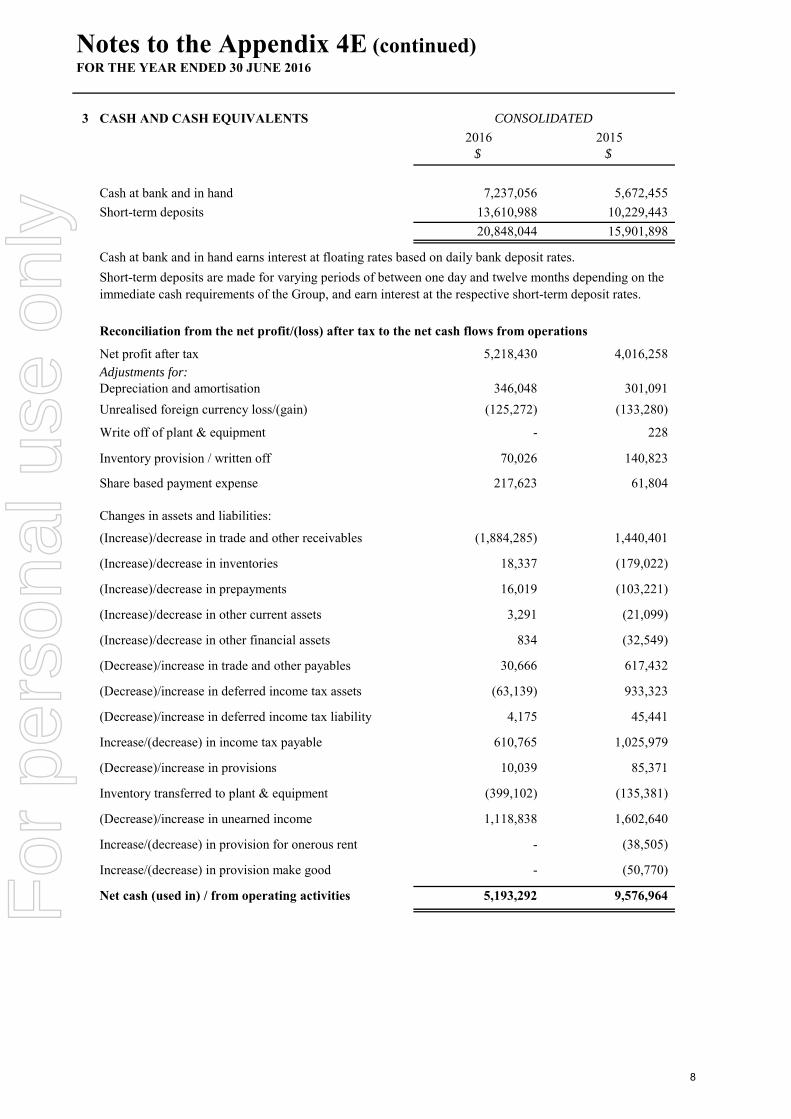
3 CASH AND CASH EQUIVALENTS
2016 2015$ $
Cash at bank and in hand 7,237,056 5,672,455
Short-term deposits 13,610,988 10,229,443
20,848,044 15,901,898
Net profit after tax 5,218,430 4,016,258 Adjustments for:Depreciation and amortisation 346,048 301,091
Unrealised foreign currency loss/(gain) (125,272) (133,280)
Write off of plant & equipment - 228
Inventory provision / written off 70,026 140,823
Share based payment expense 217,623 61,804
Changes in assets and liabilities:
(Increase)/decrease in trade and other receivables (1,884,285) 1,440,401
(Increase)/decrease in inventories 18,337 (179,022)
(Increase)/decrease in prepayments 16,019 (103,221)
(Increase)/decrease in other current assets 3,291 (21,099)
(Increase)/decrease in other financial assets 834 (32,549)
(Decrease)/increase in trade and other payables 30,666 617,432
(Decrease)/increase in deferred income tax assets (63,139) 933,323
(Decrease)/increase in deferred income tax liability 4,175 45,441
Increase/(decrease) in income tax payable 610,765 1,025,979
(Decrease)/increase in provisions 10,039 85,371
Inventory transferred to plant & equipment (399,102) (135,381)
(Decrease)/increase in unearned income 1,118,838 1,602,640
Increase/(decrease) in provision for onerous rent - (38,505)
Increase/(decrease) in provision make good - (50,770)
Net cash (used in) / from operating activities 5,193,292 9,576,964
Reconciliation from the net profit/(loss) after tax to the net cash flows from operations
Notes to the Appendix 4E (continued)FOR THE YEAR ENDED 30 JUNE 2016
CONSOLIDATED
Cash at bank and in hand earns interest at floating rates based on daily bank deposit rates.
Short-term deposits are made for varying periods of between one day and twelve months depending on the immediate cash requirements of the Group, and earn interest at the respective short-term deposit rates.
8
For
per
sona
l use
onl
y

4
2016 2015
2,745,967 2,052,738
15,968,204 11,174,893
626,369 2,979,587
19,340,540 16,207,218
5
2016 2015
$ $
3,779,968 2,206,793
Net GST receivable 50,239 183,056
2,096,625 1,652,698
5,926,832 4,042,547
Neither past due nor impaired
Past due but not impaired (i)
Past due & impaired
$ $ $
3,779,968 - -
2,206,793 - -
(i) Trade receivables outstanding beyond 91 days are past due
CONSOLIDATED
(i) R&D tax incentive - a 45% refundable tax offset.
At 30 June 2016, the ageing analysis of trade receivables is as follows:
The fair value of trade and other receivables are deemed to approximate their carrying value.
TRADE AND OTHER RECEIVABLES
Trade receivables
R&D tax incentive (i)
2016 Consolidated
2015 Consolidated
REVENUE BY GEOGRAPHY
The Group has only one segment - the product division. Therefore, the Group no longer prepares operating segment reporting other than the geographical segments shown below.
Revenue is attributed to geographic locations based on the location of the customers. The Company does not have external revenues from any external customers that are attributable to any foreign country other than as shown.
Notes to the Financial Statements (continued)FOR THE YEAR ENDED 30 JUNE 2016
Australia & New Zealand
Europe
United States
9
For
per
sona
l use
onl
y


![Senetas Corporation Ltd, distributed by Gemalto NV (SafeNet) · [Y] 1. denotes Senetas Corp. Ltd. & SafeNet co-branded version SafeNet logo co-branding added to fascia Figure 1 –](https://static.documents.pub/doc/80x56/5d4e3d8a88c99330028bc647/senetas-corporation-ltd-distributed-by-gemalto-nv-safenet-y-1-denotes.jpg)


