

LUPIN LIMITED l ANNUAL REPORT 2014
for tomorrow
Contents
03Chairman’s Letter
05Board of Directors
09Chief Executive Officer’s Letter
12Financial Highlights
18India
26Global Active Pharmaceutical Ingredients
34Global Manufacturing and Supply Chain
39Financial Review
45Reports and Accounts
04Corporate Information
07Vice Chairman’s Letter
11Managing Director’s Letter
14United States and Europe
22Rest of the World
28Research and Development
36Human Resources
42Corporate Social Obligation

“We are one of the privileged few that have the fundamentals in place to shape a better future for society, to make the world healthier and happier. To build a better tomorrow. We embrace this not as a responsibility but as an obligation.”
Dr. Desh Bandhu Gupta,
Founder & Chairman, Lupin Limited

Chairman’s Letter
With our feet firmly planted in today, we envision a bigger, brighter tomorrow. That is what we are here for... For Tomorrow.
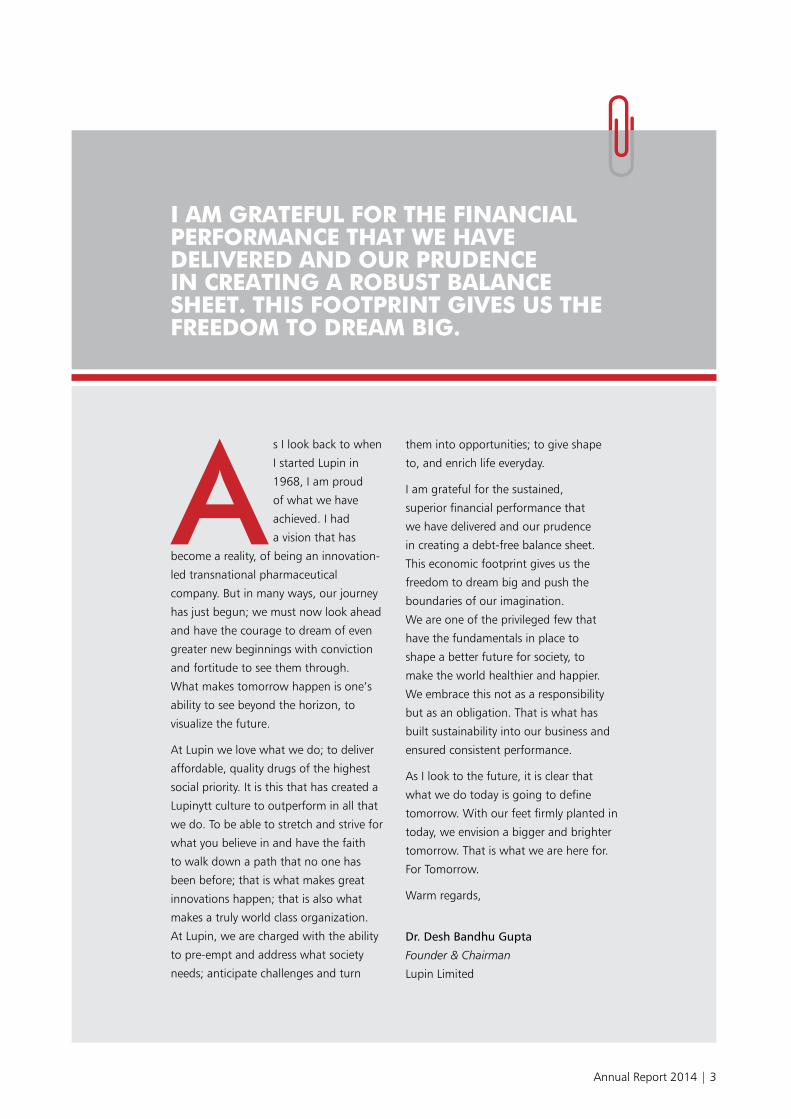
I am grateful for the fInancIal performance that we have delIvered and our prudence In creatIng a robust balance sheet. thIs footprInt gIves us the freedom to dream bIg.
s i look back to when
i started Lupin in
1968, i am proud
of what we have
achieved. i had
a vision that has
become a reality, of being an innovation-
led transnational pharmaceutical
company. But in many ways, our journey
has just begun; we must now look ahead
and have the courage to dream of even
greater new beginnings with conviction
and fortitude to see them through.
What makes tomorrow happen is one’s
ability to see beyond the horizon, to
visualize the future.
at Lupin we love what we do; to deliver
affordable, quality drugs of the highest
social priority. it is this that has created a
Lupinytt culture to outperform in all that
we do. to be able to stretch and strive for
what you believe in and have the faith
to walk down a path that no one has
been before; that is what makes great
innovations happen; that is also what
makes a truly world class organization.
at Lupin, we are charged with the ability
to pre-empt and address what society
needs; anticipate challenges and turn
them into opportunities; to give shape
to, and enrich life everyday.
i am grateful for the sustained,
superior financial performance that
we have delivered and our prudence
in creating a debt-free balance sheet.
this economic footprint gives us the
freedom to dream big and push the
boundaries of our imagination.
We are one of the privileged few that
have the fundamentals in place to
shape a better future for society, to
make the world healthier and happier.
We embrace this not as a responsibility
but as an obligation. that is what has
built sustainability into our business and
ensured consistent performance.
as i look to the future, it is clear that
what we do today is going to define
tomorrow. With our feet firmly planted in
today, we envision a bigger and brighter
tomorrow. that is what we are here for.
For tomorrow.
Warm regards,
Dr. Desh Bandhu Gupta
Founder & Chairman
Lupin Limited
A
annual report 2014 | 3

DirectorsDr. Desh Bandhu Gupta, Chairman
Dr. Kamal K. Sharma, Vice Chairman
Ms. Vinita Gupta, Chief executive Officer
Mr. Nilesh Gupta, managing Director
Mrs. M. D. Gupta, executive Director
Dr. Vijay Kelkar
Mr. Richard Zahn
Mr. R. A. Shah
Dr. K. U. Mada
Mr. Dileep C. Choksi
Company Secretary & Compliance OfficerMr. R. V. Satam
AuditorsDeloitte Haskins & Sells LLPChartered Accountants
Internal AuditorsErnst & Young LLP
Audit CommitteeDr. K. U. Mada, ChairmanDr. Kamal K. Sharma Mr. Dileep C. Choksi
Investors’ Grievances CommitteeDr. Vijay Kelkar, ChairmanDr. K. U. Mada
Remuneration CommitteeDr. K. U. Mada, ChairmanMr. R. A. Shah
BankersCentral Bank of India
Bank of Baroda
State Bank of India
Citibank N.A.
The Hongkong and Shanghai Banking Corporation Limited
Standard Chartered Bank
ICICI Bank Limited
Kotak Mahindra Bank Limited
JP Morgan Chase Bank, N.A.
Senior Management TeamDr. Desh Bandhu Gupta,Chairman
Dr. Kamal K. Sharma,Vice Chairman
Ms. Vinita Gupta,Chief executive Officer
Mr. Nilesh Gupta,managing Director
Mr. Shakti Chakraborty,Group President -india region Formulations
Mr. Vinod Dhawan,Group President -aamLa & Business Development
Dr. Rajender Kamboj,President - novel Drug Discovery & Development
Mr. Ramesh Swaminathan,Chief Financial Officer
Mr. Naresh Gupta,President - aPi & Global tB
Mr. Divakar Kaza,President - human resources
Mr. Alok Ghosh,President - technical Operations
Dr. Cyrus Karkaria,President - Biotechnology
Mr. Paul McGarty,President - Lupin Pharmaceuticals inc., Usa
Dr. Sofia Mumtaz,head - Pipeline management and Legal
Mr. Sunil Makharia,President - Finance
Mr. Debabrata Chakravorty,President - Global sourcing
Dr. Maurice Chagnaud,President - europe and head of inhalation strategy
Ms. Theresa Stevens,Chief Corporate Development Officer
Registered Office159, C.s.t. road, Kalina, santacruz (east),mumbai - 400 098.tel:+ 91 22 6640 2323Fax:+ 91 22 2652 8806
Corporate OfficeLaxmi towers, ‘B’ Wing,Bandra Kurla Complex,Bandra (east), mumbai - 400 051.tel: + 91 22 6640 2222Fax: + 91 22 6640 2130www.lupinworld.com
Corporate Identity NumberL24100MH1983PLC029442
Key ContactsMr. Alpesh Dalal,head - investor [email protected]
Mr. Pradeep Bhagwat,General manager - investors’ services [email protected]
Mr. Shamsher Gorawara,head - Corporate [email protected]
Corporate Information
4 | Lupin Limited

Board of Directors
Awards 2013-14
Dr. Desh Bandhu Gupta, Chairman
Dr. Kamal K. Sharma, Vice Chairman
Ms. Vinita Gupta, Chief Executive Officer
Mr. Nilesh Gupta, Managing Director
Mrs. M. D. Gupta, Executive Director
Dr. Vijay Kelkar Mr. Richard Zahn Mr. R. A. Shah Dr. K. U. Mada Mr. Dileep C. Choksi
The Economic Times 500 rankings 2013
india’s 10 most resilient
Companies
Dun & Bradstreet Corporate Awards 2014
top indian company
in the Pharmaceuticals
sector
Great Place to Work
Best Companies to Work
for, 2014, india
American Society for Training and Development (ASTD) BEST Award
Winner for employee
Learning & Development
Business Today - India’s Best CEO Awards
Best CeO in the
pharmaceutical sector
– Dr. Kamal K. sharma
Forbes Asia Power 50 Businesswomen
ms. Vinita Gupta
annual report 2014 | 5

Lupin today is at an inflection point. With our vision and mission etched out, we are creating exciting opportunities and remain committed to build for tomorrow.
ViCe Chairman’s Letter

lupIn’s strong performance over the last 10 years can be attrIbuted to dIstInctIve dIfferentIators that It has buIlt Into Its busIness mIx. thIs backed by flawless executIon has enabled the company to consIstently outperform and clock growth on a sustaIned basIs.
upin’s strong fundamentals
and its resilient business
model have enabled us to
record another remarkable
year of growth. exemplary
performance achieved
against the backdrop of a downbeat
economy, a rapidly consolidating but
highly volatile global pharmaceutical
landscape; rabid competition not to
mention challenges within india’s
pharmaceutical regulatory system.
Lupin’s strong performance this year and
over the last 10 years can be attributed
to distinctive differentiators that it has
engineered and built into its business
mix like its choice and mix of high
growth markets; mining and growing
existing markets and its rapidly evolving
technology, therapy focus and products.
all of this backed by flawless execution
has enabled the company to consistently
outperform all its key markets and
clock growth on a sustained basis.
We are proud to be an employer
of choice and are grateful for the
unwavering commitment to excellence
from our global teams that have
embraced a philosophy to think
globally but focus on solutions relevant
for local markets.
the global pharmaceutical environment
is going through a volatile and
challenging phase but we believe that
Lupin’s endeavor of building a robust
organization through its commercial
initiatives, investments in research,
operational excellence and people
development will help it steer the course
and continue to create value for all
stakeholders. acquisitions, joint ventures,
strategic alliances and partnerships
would supplement the growth imperative
and sustainability in the long term but
our focus would continue on operational
excellence and building and enhancing
our research capabilities.
Lupin today is at an inflection point. With
our vision and mission etched out, we
are creating exciting opportunities and
remain committed to build for tomorrow.
sincerely,
Dr. Kamal K. Sharma
Vice Chairman
Lupin Limited
L
annual report 2014 | 7

ChieF exeCUtiVe OFFiCer’s Letter
Our strong business model, lucrative pipeline and investment in strategic growth drivers give us the confidence to sustain our growth going forward. We are more prepared than ever for tomorrow.

wIth the plans we have In place; Investments In technology, operatIons, Infrastructure and more Importantly, In human capItal, we are set to evolve lupIn Into a global specIalty pharmaceutIcal player.
iscal Year 2014
has been a very
exciting year for our
organization. it’s a
year where we not only
grew our sales & profits
to record levels; we also executed
on our strategic plan and invested
in growth drivers to prepare Lupin
for a better tomorrow. a year
where we have enhanced our
technology capabilities, ventured
into new markets, forged strategic
alliances globally and increased
our management and leadership
bandwidth. We are better prepared
today to achieve our strategic
objective through FY 2018
and beyond.
Our quest for sustainable growth
has enabled us to deliver a CaGr
of 23.8% in Gross sales, 33.2% in
eBitDa and 29.6% in net Profits for
the last 5 years. We are today the
7th largest generic pharmaceutical
company in the world by market
capitalization and the 10th largest
generic pharmaceutical company by
revenues (Bloomberg, June - 2014).
We have continued to build on
our leadership credentials in all of
our key markets. Lupin is the 5th
largest generics player in the Us,
3rd largest indian pharmaceutical
company by revenue, the
8th largest Japanese generic
pharmaceutical company and the
4th largest generic pharmaceutical
player in south africa. Our strong
business model, lucrative pipeline
and investment in strategic growth
drivers give us the confidence to
sustain our growth going forward.
in FY 2014 we recorded strong
growth enabled by effective
execution and commercialization of
our internal pipeline. We also added
new dimensions to our technology
capabilities with the teams that
we have brought on board for
inhalation, Complex Generics &
specialty. We acquired nanomi
B.V. in netherlands to enhance our
technology strengths, we made
our first foray into Latin america
with an agreement to acquire
Laboratorios Grin, the 4th largest
Ophthalmological player in
mexico and we advanced our
Biosimilars strategy with the
joint venture agreement with
Yoshindo inc. for Japan. We also
strengthened our Us brand business
through alliances and partnerships
with romark Laboratories and
Onset Dermatologics.
With the plans we have in place;
investments in technology,
operations, infrastructure and
more importantly, in human
capital, we are set to deliver
sustainable growth and evolve
Lupin into a global specialty
pharmaceutical player bringing
affordable quality medicines to
major parts of the world.
regards,
Vinita Gupta
Chief Executive Officer
Lupin Limited
F
annual report 2014 | 9

manaGinG DireCtOr’s Letter
We have been able to create one of the most exciting growth stories in the pharmaceutical industry. Going forward,I see a brave, rapidly evolving and innovative Lupin ready for tomorrow.

we have buIlt lupIn focusIng not only on dIfferentIated products and the rIght markets, but also the rIght busIness practIces.
e have had
another
remarkable
year
fuelled
by strong
growth in key markets like the
Us, europe, south africa and in
our global aPi business. We also
further strengthened our position
in markets like india and Japan.
Our performance this year is not
only a natural progression of the
momentum that we have generated
over the last 10 years but also
vindication of our long-range
strategy to continuously focus on
improving the quality of business
globally. it is also a reflection of
the Quality ethic that is part of the
Lupin Dna: ingrained deep in our
businesses, our research programs,
the products we develop and deliver
and in how we go about serving
our customers and communities.
We have been able to create one of
the most exciting growth stories in
the pharmaceutical industry.
FY 2014 was a fantastic year. it was
a year of operational excellence, built
on the back of flawless execution,
new product launches, enhanced
investments in research, rapid
consolidation of our manufacturing
operations and the creation of a
global supply chain. all this led to
record revenues and profits during
FY 2014 where Lupin’s net sales
grew by 17.2% to H110,866 million
(UsD 1.83 billion) up from H94,616
million the previous year. net Profits
grew by 39.7% to H18,364 million
(UsD 304 million) as compared to
H13,142 million in FY 2013. more
importantly, earnings before interest,
tax, Depreciation and amortization
(eBitDa) increased to H31,193 million
from H22,977 million in FY 2013, an
increase of 35.8%.
research is the backbone of our
performance. in addition to a
robust internal generics research
program, FY 2014 marked significant
enhancement of our research
capabilities through the acquisition
of nanomi with capabilities
to address the niche Complex
injectables segment. We are also in
the process of setting up two new
r&D centers in the Us focusing
on research in inhalation and on
Complex Formulations. i am pleased
to note that we are attracting some
of the best talent from the industry.
We continue to hit milestones in
our novel Drug Discovery &
Development program and our
joint venture with Yoshindo inc.
gives us a clear line of sight now to
commercialize biosimilars for Japan.
all of these investments would
emerge as significant growth drivers
for the future.
We have built Lupin focusing not
only on differentiated products
and the right markets, but also the
right business practices. as i look
ahead i see a brave, rapidly evolving
and innovative Lupin. We are here
for today; here for tomorrow; but
importantly, we are here for the
long term.
Best regards,
Nilesh Gupta
Managing Director
Lupin Limited
W
annual report 2014 | 11

Financial Highlights 2014Business analysis – revenue and profitability
Revenue composition
aPi
Domestic Formulations
emerging markets Formulations
advanced markets Formulations
10%
22%
21%
47%
Geographic break down(% contribution)
Domestic
exports – advanced markets
export – emerging marketsFY
10
FY11
FY12
FY13
FY14
33
39
28
31
41
28
30
41
29
27
44
29
25
48
27
Profit before tax (H million)
FY10
FY11
FY12
FY13
FY14
8,35
7
11,9
60
19,2
46
28,3
17
9,96
3
Net sales(H million)
FY10
FY11
FY12
FY13
FY14
47,7
36
69,5
97
94,6
16
110,
866
57,0
68
CAGR23.4%
EBIDTA(H million)
FY10
FY11
FY12
FY13
FY14
9,98
1
14,5
91
22,9
77
31,1
93
12,0
00
CAGR33.0%
Net profit (H million)
FY10
FY11
FY12
FY13
FY14
6,81
6
8,67
6
13,1
42
18,3
64
8,62
6
CAGR28.1%
12 | Lupin Limited

Business critical investments
Shareholder value growth
Financial leverage
Debt equity ratio
FY10
FY11
FY12
FY13
FY14
0.39
0.30
0.14
0.00
0.22
Dividend(%)
FY14
FY13
FY12
FY11
FY10
135 15
0 160
200
300
Cumulative R&D(H million)
Current Year
Past Years
FY14
9,58
327
,775
FY10
4,11
94,
707
FY11
5,30
18,
826
FY12
5,94
014
,127
FY13
7,70
820
,067
Market capitalization(H million)
FY14
FY13
FY12
FY11
FY10
185,
909 23
6,49
7 281,
295
418,
425
144,
743
CAGR30.4%
CAGR26.8%
Earning per share(H)
FY14
FY13
FY12
FY11
FY10
15.8
4 19.3
6
19.4
3
29.3
9
40.9
9
Cumulative capex(H million)
FY14
4,37
625
,480
FY13
20,6
094,
871
FY12
15,0
955,
514
FY11
10,2
874,
808
FY10
5,85
44,
433
Current Year
Past Years
annual report 2014 | 13

Driving this growth have been the
markets of Us & europe which remain
the principal growth engines for the
Company and are the major contributors
to Lupin’s global revenues and overall
profitability. Us & europe formulation
sales contributed 47% to the Company’s
overall consolidated revenues for FY 2014.
Formulations sales for the market by grew
by 29% to clock in revenues of H51,805
million during FY 2014, as against
H40,051 million in FY 2013. Lupin remains
the fifth largest and the fastest growing
top 5 generics player in the Us.
FY 2014 saw Lupin expand its business
with key new product launches. it also
saw us add scale, breadth and depth
by acquiring new technology, increased
investments in research in our continued
efforts to build a differentiated quality
pipeline. in keeping with our global
strategy of building a highly differentiated
specialty business, the Company made
significant inroads in establishing two
dedicated Centers of excellence for
research in inhalation and Complex
injectables in Florida and maryland in the
Us. this will enable us to gain entry into
the multi-billion dollar global opportunity
in the inhalation and Complex injectables
space. Our commitment to this project
has attracted the best in available
research talent for these therapies
globally. We know what we do today, will
drive growth for tomorrow.
the Last DeCaDe has Been a VerY reWarDinG One FOr LUPin Where We haVe emerGeD as One OF the mOst
exCitinG GrOWth stOries in the PharmaCeUtiCaL WOrLD. nOt OnLY haVe We OUtPerFOrmeD mOst OF OUr Peers
BUt We haVe COntinUeD tO BUiLD On OUr LeaDershiP CreDentiaLs COnsistentLY.
United States and Europe
US Formulation Revenue(UsD million)
FY10
FY11
FY12
FY13
FY14
348
441
507
693
803
14 | Lupin Limited

Largest generics player in
the Us (by prescriptions)
5th
Contribution to overall Company revenues
47%sales growth in Us & europe29%
United States
headquartered in Baltimore, maryland, the Company’s Us
subsidiary, Lupin Pharmaceuticals, inc. (LPi), is dedicated
to delivering high-quality, branded and generic medicines
trusted by healthcare professionals and patients across the
Us. LPi has built strong relationships in the Us wholesale
and retail channels with an excellent reputation as a reliable
supplier of quality generics. in addition, LPi has developed a
meaningful presence among Pediatric specialists and primary
care physicians with a dedicated field sales force selling
our branded product line. strong commercial capabilities
in the Us market for both branded and generic product
offerings position LPi to capitalize on the Company’s growth
strategy for the advanced markets built around quality niche
products, world-class research, manufacturing and supply
chain capabilities, protected by strong intellectual Property.
Us revenues grew by 16% to UsD 803 million during
FY 2014, up from UsD 693 million in FY 2013. the Brands
business contributed 10% of total Us sales whereas the
Generics business contributed 90% during FY 2014.
US GenericsLPi remains the 5th largest and the fastest growing top
5 generics player in the Us with a 5.4% market share by
prescriptions. LPi grew by 9.2% during the calendar year
2013 as compared to a 4.9% overall growth rate for the
Us generic industry (ims health). LPi’s strength in the
generics market is best characterized by its ability to achieve
leading market shares in even the most competitive market
scenarios. as of march 2014, 31 of the 63 generic products
marketed by LPi in the Us ranked no. 1 by market share and
53 of the 63 are in the top 3 by market share (ims health).
We have played to our strengths, focusing on increasing our
market shares not only for new launches but by executing
well to ensure that we are able to grow market shares for
our existing products as well. We are constantly engaging
with our trade partners and customers, and have worked
hard to strengthen our supply chain to ensure industry
record response times which explains why Lupin has one of
the best fill ratios in the Us.
addressable opportunity of the
93 anDas pending approval
USD80billion
Us Generics revenuesUSD723million
Generic products that are ranked
number 1 by market share
31
Lupin Goa facility, India
annual report 2014 | 15

the Company filed 19 anDas in the Us market and received
approval for 22 anDas during FY 2014. the Company has
93 anDas pending for approval and launch, addressing a
total market size of over UsD 80 billion. Of these, 30 anDas
are first-to-file addressing a market size of over UsD 20
billion. the Company has 15 exclusive first-to-file addressing
a market size of UsD 2 billion.
the Us Generics business continued its impressive growth
story in FY 2014, recording revenues of UsD 723 million, an
increase of 32% over last year. in FY 2014, we launched 19
new products, including the successful commercialization of
generic versions of Zymaxid®, trizivir® and Cymbalta® to name
a few high profile exclusive and semi-exclusive launches.
US BrandedOne of Lupin’s biggest differentiators has been the
Company’s Us branded business. LPi continued to expand
its suprax® branded franchise with the launch of a capsule
dosage form during FY 2014, building on the FY 2013
addition of suprax® chewable tablets. the total suprax® family
of products continues to grow and remains the foundation of
the company’s Us branded business.
During the year, the Company continued to work hard to
maintain market share on antara® (Fenofibrate Capsules
43mg and 130mg) in the wake of mylan’s launch of a generic
version in February 2013. During FY 2014, LPi introduced
the antara® 90mg capsules. LPi has maintained 70% market
US Generics Revenue(UsD million)
FY10
FY11
FY12
FY13
FY14
220
308
361
548
723
Unbranded Generics, MAT December 2013
Lupin is rated 5th in the US Industry standings of Unbranded Generics
Leading corporations
MAT September 2013
MAT December 2013
Rank % Market Share
TRXS mn
% Market Share
% Growth
US Industry 100.0 3,384 100.0 4.9
1 teva 1 15.5 493 14.6 0.3
2 mylan Labs inc 2 10.9 366 10.8 -5.5
3 actavis Us 3 8.2 258 7.6 -9.4
4 sandoz (novartis) 4 5.8 208 6.2 4.5
5 Lupin Pharma 5 5.4 175 5.2 9.2
Total Industry, MAT December 2013
Lupin is rated 6th in the US Industry standings of Leading corporations
Leading corporations
MAT September 2013
MAT December 2013
Rank % Market Share
TRXS mn
% Market Share
% Growth
US Industry 100.0 4,211 100.0 1.4
1 teva 1 13.8 559 13.3 -0.6
2 mylan Labs inc 2 8.8 370 8.8 -5.4
3 actavis Us 3 7.3 302 72.0 -9.0
4 novartis (inc sandoz) 4 6.0 258 6.1 -1.0
5 endo Pharma inc 5 4.6 192 4.6 17.5
6 Lupin Pharma 6 4.3 176 4.2 9.1
Dispensed TRX US Industry
Lupin’s US headquarters, Baltimore
16 | Lupin Limited

share of the Fenofibrate 130mg market with our brand and
authorized generic products.
in FY 2014, the Company added two new products to its
portfolio in order to enhance and extend its Us brands
business for the future. in august FY 2013, we acquired
exclusive rights to promote, distribute and market alinia®
(nitazoxanide) for oral suspension in the Us. alinia® for oral
suspension is indicated for the treatment of diarrhea caused
by Giardia lamblia or Cryptosporidium parvum in patients
1 year of age and older. these are the two most common
protozoal causes of diarrhea in the developed and developing
world. in september 2013, LPi also signed a strategic co-
promotion agreement for exclusive rights to promote
Locoid® Lotion (hydrocortisone butyrate 0.1%) to the Pediatric
community in the Us. Locoid® is the most highly prescribed
mid-potency steroid brand in the Us for the topical treatment
of mild to moderate atopic Dermatitis (aD) in patients 3
months of age and older. aD, more commonly called eczema,
is one of the most common skin disorders in young children
and has a prevalence of 10% to 20% in the first decade of life.
LPi’s strategy is to prudently invest in its specialty sales force
targeting both Pediatricians and select high prescribing
primary care physicians. the Company aims to continue to
strengthen its branded portfolio with the launch of additional
products developed and filed with the Us FDa from its own
pipeline as well as strategic brand acquisitions for the future.
ANDA Pipeline
* The Company withdrew 16 ANDAs during FY13 after re-evaluating their business potential
FY10
FY11
FY12
FY13
FY14
127
148
173
176*
192
Lupin has developed a solid foundation to grow its
formulations business in the european (eU) markets having
built a robust product pipeline over the years. in FY 2014, we
not only strengthened our presence across select eU markets
through a blend of direct-to-market initiatives and strategic
partnerships but also bolstered our presence by bringing on
board a seasoned industry stalwart Dr. maurice Chagnaud,
who now heads Lupin’s europe business and is responsible
for our growth there. the Company today is well placed to
address the unique demands of the fragmented and diverse
eU market. the eU finished dosage business recorded
net sales of H2,934 million during FY 2014 as against
H2,356 million in the previous year, a growth of 24%.
Lupin successfully launched new products like Gliclazide
mr and Desogestrel + ethinylestradiol in the eU market
while existing products clocked in healthy growth during
the year. Lupin continued to focus on building its pipeline
in the UK and German markets through its own direct-to-
market initiative.
the Company filed 4 marketing authorization applications
during the year and received approvals for 10 applications
during the year. the Company launched a total of 4 new
products in europe during FY 2014. Cumulative filings
with eU authorities now stands at 57 with 48 approvals
to date.
Europe
annual report 2014 | 17

inDia has aLWaYs Been at the heart OF LUPin’s GrOWth PLans. it is the COmPanY’s seCOnD LarGest marKet anD
COntriBUteD 22% OF LUPin’s COnsOLiDateD reVenUes DUrinG FY 2014.
India
Our consistent outperformance over the last 5 years in the
indian market is a reflection of our ability to provide an
ever-widening choice of quality, affordable medicines across
existing and new therapeutic segments.
We are the 10th largest in terms of formulation sales in india
and our passion and commitment to grow in our home turf
has never been stronger than now. Propelled and driven by a
passionate 5,365 strong field force, Lupin has been extremely
agile in not only garnering and growing its market share but
also swift in responding to a regulated, hyper-competitive
fragmented market environment. FY 2014 was a challenging
year for the indian Pharmaceutical market (iPm) given the
changes in the Drug Price Control Order (DPCO) and related
events. Under the national Pharmaceutical Pricing Policy, the
government had regulated the prices of 348 essential drugs
and their combinations, covering 60% of drugs sold in the
country. it also resulted in supply disruptions which gave rise
to challenging conditions between the trade and industry.
Our prudent handling of the situation ensured that Lupin
remained on the growth path in the domestic market, ending
the year on a positive note.
the Company’s india formulations business grew by 5%,
clocking in gross revenues of H25,141 million during FY 2014,
as compared to H23,840 million in FY 2013. the business has
grown at a CaGr of 17% over the last five years.
today, Lupin is one of the fastest growing players in high
growth therapy segments like Cardiology, Central nervous
system (Cns), Diabetology, anti-asthma, Gynaecology,
anti-infective, Gastro-intestinal and Oncology.
the Company is the 2nd largest player in india’s respiratory
(anti-asthma) segment, the 3rd largest player in the
Cardiovascular segment and the 7th largest player in
Diabetes segment.
18 | Lupin Limited

Overall market share of iPm
(ims tsa mat, march, 2014)
2.8%
Brands with sales in excess of
H300 million
21
Contribution to overall Company
revenues
22%
Over the last decade, the Company has transitioned from
a primary dependence on acute therapies to a position
now where close to 64% of our revenues (on a significantly
enlarged revenue base) come from higher value and more
frequently used chronic therapies.
in the last few years, the Company launched 23 in-licensed
products, of which 9 were first to be introduced into the iPm.
During FY 2014, the Company launched 4 in-licensed products.
Therapeutic contribution
Products in-licensed in the last
4 years
23
specialty field force
5,365
Domestic formulations (sales) (H million)
FY10
FY11
FY12
FY13
FY14
13,5
02 15,7
34
19,3
74
23,8
40
25,1
41
Proportion of revenues derived from key segments
Acute therapies
Chronic therapies
2013-14 36% 64%
2012-13 37% 63%
2007-08 56% 44%
2005-06 69% 31%
Lupin Jammu facility, India
annual report 2014 | 19

Pinnacle Cardiology Lupin india formulation business’s flagship division
continued to outperform the market with the division
emerging as the 3rd largest player within the indian
cardiology market.
the Company continues to expand on its association
with the american College of Cardiology (aCC) where
we conducted a special program called rhythm 2013,
an advanced eCG Program in seven locations across india
with over 1,500 doctors with international certification
participating in the proceedings.
Pinnacle also conducted an emergency Cardiovascular
Care workshop in association with and certification from
the american heart association (aha) for doctors across
different cities in india. the division also conducted and
facilitated innovative Doctor engagement webcasts in the
area of hypertension and Dyslipidemia.
Lupin Blue Eyesthis specialized ophthalmic division of the Company is
ranked amongst the top 10 in its represented market
within the iPm. the division grew by 48% in FY 2014 as
against a market which grew by just 7% (aiOCD aWaCs
mat Feb 2014).
Lupin Blue eyes in association with eye Bank association of
india (eBai) launched the ‘Punarjyoti’ campaign to promote
eye donation in the country after death.
Lupin Diabetes Careindia is unfortunately often referred to as the future diabetic
capital of the world. it is estimated that by 2030, every
fifth diabetic will be an indian. since inception, the Lupin
Diabetes Care division has been scripting new chapters in its
fight against diabetes. Lupin Diabetes Care has consistently
outperformed the market and ranked as the 3rd largest
player in its participated market with a growth of 28%
during FY 2014 (aiOCD aWaCs mat Feb 2014).
the division has created very strong patient care programs
like arogya and the Wellness program. the arogya diabetes
program is a first-of-its kind initiative to screen 37,000
patients with over 2,000 doctors participating across india.
it has not only enabled diabetes and hypertension screening
and diagnosis but also covers lipid and renal profile and
thyroid screening for patients. the tereos Wellness
Program (tWP) is an exclusive unique patient support
venture where qualified nurses and periodic laboratory
testing at the patients door step is ensuring better
monitoring of the patient.
Lupin Metabolicsthe Lupin metabolics division covers the Company’s
presence in metabolics diseases like hypertension and
obesity. the division is also responsible for promoting and
distributing Lilly’s conventional insulin range of product in
india and nepal. in FY 2014, Lupin metabolics launched
a special patient support and awareness service called
‘humrahi’ with 31 diabetes educators to facilitate the
goal of supporting, educating and counseling patients on
Diabetes and its effective management.
Lupin CVN set up in FY 2010, Lupin CVn is focused on the Cardiology
and nephrology segments. the Lupin CVn division has
grown at a CaGr of 28% over the last 5 years. the division
continues to build on its leadership credentials in its
participated markets where it is ranked 1st by prescription.
the division continues to innovate by creating specialized
webinars and was the first to introduce Qr Code
interactive Communications to communicate with doctors
and patients.
The Lupin Division – Anti-Tuberculosis, Anti-Biotics, Gynaecology, Orthopaedic & Dermatology this has been yet another year that the Lupin division has
continued to outperform the represented market with 8.8%
growth as compared to 4.9% of irm growth. it is a matter
of pride that we built on our market leader credentials in the
tB space by increasing our market share to 54.9%, up from
44.7% last year.
the Lupin division has a wide basket of women’s healthcare
products which include iVF, nutritional supplements,
contraceptives and other products meant for gynaecological
disorders. Lupin’s alliances with the ian Donald school
offers academic updates and the latest information to
indian gynecologists and obstetricians in the field
of ultrasonography.
Therapy segments and Key divisions
20 | Lupin Limited
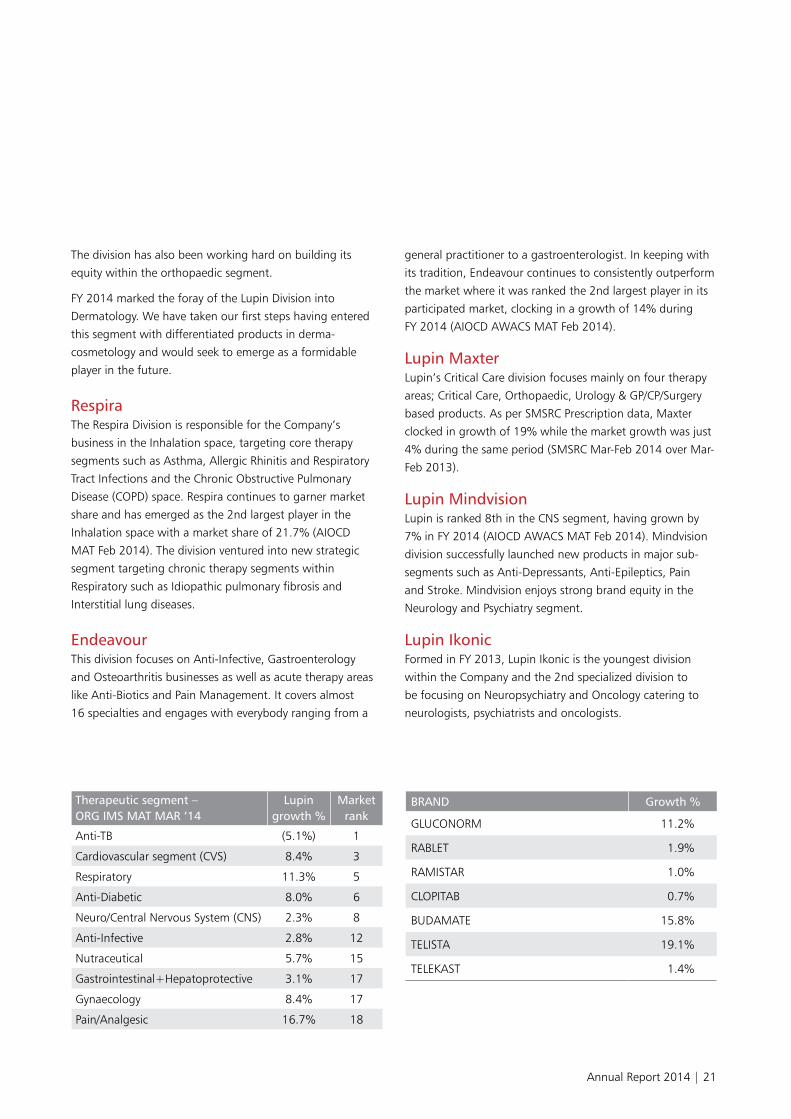
Therapeutic segment – ORG IMS MAT MAR ’14
Lupin growth %
Market rank
anti-tB (5.1%) 1
Cardiovascular segment (CVs) 8.4% 3
respiratory 11.3% 5
anti-Diabetic 8.0% 6
neuro/Central nervous system (Cns) 2.3% 8
anti-infective 2.8% 12
nutraceutical 5.7% 15
Gastrointestinal+hepatoprotective 3.1% 17
Gynaecology 8.4% 17
Pain/analgesic 16.7% 18
BRAND Growth %
GLUCOnOrm 11.2%
raBLet 1.9%
ramistar 1.0%
CLOPitaB 0.7%
BUDamate 15.8%
teLista 19.1%
teLeKast 1.4%
the division has also been working hard on building its
equity within the orthopaedic segment.
FY 2014 marked the foray of the Lupin Division into
Dermatology. We have taken our first steps having entered
this segment with differentiated products in derma-
cosmetology and would seek to emerge as a formidable
player in the future.
Respirathe respira Division is responsible for the Company’s
business in the inhalation space, targeting core therapy
segments such as asthma, allergic rhinitis and respiratory
tract infections and the Chronic Obstructive Pulmonary
Disease (COPD) space. respira continues to garner market
share and has emerged as the 2nd largest player in the
inhalation space with a market share of 21.7% (aiOCD
mat Feb 2014). the division ventured into new strategic
segment targeting chronic therapy segments within
respiratory such as idiopathic pulmonary fibrosis and
interstitial lung diseases.
Endeavourthis division focuses on anti-infective, Gastroenterology
and Osteoarthritis businesses as well as acute therapy areas
like anti-Biotics and Pain management. it covers almost
16 specialties and engages with everybody ranging from a
general practitioner to a gastroenterologist. in keeping with
its tradition, endeavour continues to consistently outperform
the market where it was ranked the 2nd largest player in its
participated market, clocking in a growth of 14% during
FY 2014 (aiOCD aWaCs mat Feb 2014).
Lupin MaxterLupin’s Critical Care division focuses mainly on four therapy
areas; Critical Care, Orthopaedic, Urology & GP/CP/surgery
based products. as per smsrC Prescription data, maxter
clocked in growth of 19% while the market growth was just
4% during the same period (smsrC mar-Feb 2014 over mar-
Feb 2013).
Lupin MindvisionLupin is ranked 8th in the Cns segment, having grown by
7% in FY 2014 (aiOCD aWaCs mat Feb 2014). mindvision
division successfully launched new products in major sub-
segments such as anti-Depressants, anti-epileptics, Pain
and stroke. mindvision enjoys strong brand equity in the
neurology and Psychiatry segment.
Lupin IkonicFormed in FY 2013, Lupin ikonic is the youngest division
within the Company and the 2nd specialized division to
be focusing on neuropsychiatry and Oncology catering to
neurologists, psychiatrists and oncologists.
annual report 2014 | 21

LUPin’s rest OF WOrLD (rOW) BUsiness is the Fastest GrOWinG BUsiness Within the COmPanY
COVerinG marKets aCrOss asia PaCiFiC, aFriCa, miDDLe-east anD Latin ameriCa. OVer the Last
DeCaDe, LUPin has maDe raPiD inrOaDs intO these Fast GrOWinG marKets anD aLsO Been aBLe
tO estaBLish anD strenGthen its LeaDershiP CreDentiaLs anD GrOWinG BUsiness PresenCe in
KeY marKets sUCh as JaPan anD sOUth aFriCa. these marKets rePresent the Fastest GrOWinG
marKet OPPOrtUnitY Within the GLOBaL PharmaCeUtiCaL marKet anD are exPeCteD tO GrOW
tO OVer UsD 300 BiLLiOn BY 2015 (ims heaLth).
Rest of the World
ROW sales (H million)
FY10
FY11
FY12
FY13
FY14
7,74
1 9,24
0
14,7
70
21,4
24 23,1
26
Key markets - ROW Finished dosages filings (rest of world)
FY10
FY11
FY12
FY13
FY14
557
616
674 690
700
22 | Lupin Limited

the Company’s rOW business clocked in revenues of H23,126 million, registering a growth of
8% during FY 2014. the business contributed 21% to Lupin’s global total consolidated revenues.
the Company continued to grow and build its pipeline for these markets. With 10 new product
filings, the cumulative filings for rOW markets now stand at 700 product applications.
Largest generics player in Japan
8th
Largest generics player in south africa
4th
number of products filed in rOW markets
700
Growth in revenues (including Japan & south africa) over FY 2013
8%
Contribution to overall company revenues
21%
Japan is the largest market within Lupin’s
rOW business. During FY 2014, Lupin’s
Japanese business clocked in revenues of
JPY 21,399 million as against revenues of
JPY 19,785 million; registering a growth
of 8% over the previous year. Lupin is the
8th largest generics player in the Japanese
market and has a strong presence in the
neurology, Cardiovascular, Gastroenterology
and injectable segments.
the Japanese pharmaceutical market
(JPm) is the second largest pharmaceutical
market in the world and is valued at over
UsD 110 billion. the Japanese generics
pharmaceutical industry has witnessed a
lot of changes over the last 7 years which
include incentives announced by the
Japanese Government to promote generics,
increased competition with the entry of
more international players and the entry
of innovator pharma companies into the
Japanese generics space.
Current generics market penetration stands
at 44% in Japan. the Japanese Government
has set new target of about 60% generic
penetration by year 2017 which translates
into an additional 30-35% of the overall
pharmaceutical volumes getting genericized
over the next 3-4 years. add to this, the
patent expiries of key molecules worth UsD
16-17 billion by 2017; all of this adds up to
one of the largest market opportunity for
Lupin outside of the Us.
Japan
Japan sales (¥ million)
FY10
FY11
FY12
FY13
FY14
10,4
21 11,6
46
14,1
94
19,7
85 21,3
99
Lupin Sanda facility, Japan
annual report 2014 | 23

the total australian pharmaceutical market is valued at
UsD 13.5 billion. the generics market is estimated to
be UsD 2.2 billion, growing at approximately 8%.
Lupin operates in the australian market through its
subsidiary Generic health Pty Ltd. (Gh). Gh received
approvals for 7 products and filed for 7 new products in
the year. Gh recorded revenues of aUD 30 million during
FY 2014, clocking in a growth of 23% over the previous
year. Gh has presence in both the ethical medicine and OtC
markets in australia.
Australia
the Philippines pharma market is valued at UsD 3.3 billion
and grew by 6.6% for FY 2014 (ims mat march 14).
Lupin’s Philippines subsidiary multicare Pharmaceuticals
(multicare) continues to outpace the market, having grown
38%, clocking in revenues of PhP 909 million during
FY 2014 as compared to PhP 659 million in the last fiscal.
the Company launched a new Oncology division during
the year and expects its products to make inroads into the
market place over the next few years.
Philippines
Lupin received three product approvals for its Goa plant
from the Japanese health ministry; the commercialization
of these products has already commenced. the Company
also commercialized two aPis in Japan during the year and
expects to file close to ten DmFs in the next two years.
During the year, the Company remained focused on
revamping i’rom Pharmaceutical Co., Ltd (i’rom), a niche
injectable company that it had acquired during FY 2012.
i’rom has a significant presence in the DPC hospital segment
within the Japanese pharmaceutical market.
Kyowa Kyowa reported sales of JPY 15,918 million, growing by
14% during the year
the Company launched two new specialty segment
products (Oncology) and one Cns product. Kyowa has a
portfolio of over 350 products
the Company ramped up its field force to strengthen its
Cns business & also to target CVs patent expiries worth
UsD 8 Billion over the next 3-4 years
Kyowa inaugurated its 3rd plant at its sanda facility to
meet growing demand
Lupin commenced commercial supply of formulations
from its Goa facility
the Company filed for 8 formulations and 6 DmF’s in
the year
I’rom Pharmaceuticals i’rom posted sales of JPY 5,512 million for the year ended
march 3i, 20i4, indicating a de-growth of 6% on account of
decline in contract manufacturing sales
the Company implemented restructuring initiatives to
rationalize cost and overheads
the south african pharmaceutical market is valued at about
UsD 3.5 billion. the generics market grew by 6% in value
terms and 2% by volume during FY 20i4. Lupin’s south
african subsidiary Pharma Dynamics (PD) recorded revenues
of Zar 638 million, registering a growth of 28% over the
previous year.
PD’s consistent out performance has made it the 4th largest
generics company and the 12th largest pharmaceutical
company in the south african market. it remains the largest
Company in the Cardiovascular segment. the Company is a
market leader in 8 products (by prescriptions) and ranked 2nd
(by prescriptions) for another 8 in the south african market.
PD launched 6 new products and remains focused on
building and growing into the Cns & OtC segments within
the south african market. it also filed for and registered 10
products during FY 2014.
South Africa
24 | Lupin Limited

FY 2014 saw Lupin realize its long stated ambition of
foraying into the Latin american pharmaceutical market
with the acquisition of 100% equity stake in Laboratorios
Grin, s.a. De C.V. (Grin), mexico, subject to certain closing
conditions. the acquisition marks Lupin’s foray into the high
growth mexican pharmaceuticals market. today, mexico is
one of the fastest growing pharmaceutical markets globally
and valued at over UsD 13.5 billion, growing at 9-10%
annually (ims health).
incorporated in 1955, Grin is a specialty pharmaceutical
company engaged in the development, manufacturing and
commercialization of branded ophthalmic products. Grin
is the 4th largest ophthalmic player and a trusted brand in
mexico. the Company recorded revenues of approximately
UsD 28 million during calendar year, 2013. it has over
275 employees with its own dedicated manufacturing and
product development facilities that are compliant with
international standards and certified for production and
supplies to other Latin american markets.
the acquisition is a reflection of Lupin’s commitment
to expand not only into the Latin american market but
also build its global specialty business as we leverage
our own ophthalmic pipeline to build the Grin business
and also ramp-up our presence in other promising segments
in mexico.
Mexico & Latin America – Expanding Horizons
annual report 2014 | 25

the GLOBaL aPi marKet is WitnessinG strOnG GrOWth anD is CUrrentLY VaLUeD at OVer
UsD 125 BiLLiOn. Patent exPiries in the Us anD eUrOPe, GrOWth in emerGinG marKets,
DemanD FOr hiGh QUaLitY aPis FrOm Other PharmaCeUtiCaL PLaYers anD inCreasinG
DemanD FOr essentiaL DrUGs are BOOstinG the GrOWth OF the GLOBaL aPi inDUstrY.
Global Active Pharmaceutical Ingredients
india remains the most favoured aPi producing
nation globally; largely because of its high
quality manufacturing credentials as well as its
cost competitiveness.
Lupin is one of the most vertically integrated
pharmaceutical companies that has consciously
focused on building scale and efficiencies that have
made it an undisputed leader in its chosen product
segments. Lupin has remained a global leader in
therapeutic segments such as Cephalosporins,
Cardivasculars and the anti-tB space for over 15 years.
Lupin’s strengths and cost leadership in aPis has not only
enabled forging of better synergies between a complex,
rapidly growing and fast evolving formulation business
but also created new opportunities for future growth. API – Therapeutic contribution
26 | Lupin Limited

Global Active Pharmaceutical Ingredients
in anti-tB and
Cephalosporins segment
globally
No.1
Growth in aPi revenues17%
Contribution to overall
Company revenues
10%
Captive consumption
of aPis
90%
the Company’s aPi output has grown significantly in both
volume and value. FY 2014 was a milestone year for the
Company’s aPi business, recording revenues of H11,140
million in FY 2014 as compared to H9,498 million in
FY 2013, reporting a growth of 17%.
the Company has already embarked on some key initiatives
that are going to drive the future growth of the business;
adopting greener chemistry technologies with the dual
purpose of improving efficiencies and protecting the
environment. the Company has re-focused its aPi group into
making further inroads into markets such as Us, europe,
Japan and exploring new opportunities in emerging markets
like China, Brazil, mexico, Korea and russia.
the aPi plus division of the Company has also taken rapid
strides in its value-added finished formulation business, the
Principal-to-Principal (P2P) business. Lupin’s P2P business
leverages our rich expertise in aPi research and formulations
development. the Company’s P2P business has been
successful in taking its products to other markets with
launches in the Philippines and Ukraine during FY 2014.
the internationalization of the P2P product portfolio is
expected to be an important growth driver for
the business.
the Company also consolidated its institutional formulations
business position. it retained its leading position as one
of the few coveted suppliers of anti-tB products to the
World health Organization’s (WhO’s) Global Drug Facility.
Lupin has the unique distinction of being the only company
to have both its aPis and formulations for tB products
prequalified by the WhO globally.
Lupin Goa facility, India
annual report 2014 | 27

the Quality of Business is decided by how a company goes
about creating, developing and nurturing the basics that
build up the business.
the seeds of Lupin’s business start at our research and
Development (r&D) facilities, this is reflected in the
choices that we make in terms of products, therapies and
programs that we invest in. it is what makes us relevant and
meaningful to our customers, markets and communities.
these basics have fuelled the Company’s emergence as a
global generics powerhouse and an emerging specialty
pharmaceutical player.
Over 1,400 research scientists at the Lupin research park,
Pune and other research facilities in india, Japan and the Us
create and deliver quality products and platforms that fuel
our business aspirations.
Lupin continues to invest heavily in its r&D programs and
FY 2014 was no different. the Company invested 8.6%
of its net sales in r&D and related spends, amounting to
H9,583 million.
Lupin has designed a very successful research program
which continues to ensure the delivery of a sustainable
pipeline of high-value opportunities that are maximizing
growth for the Company across markets. We are also
working hard to identify future areas of growth and we are
investing to move up the technology curve. FY 2014 saw
the Company acquire nanomi B.V. in the netherlands for
its patented technology platforms that it plans to leverage
to develop complex injectable products. the Company is
also in the process of setting up two dedicated Centers
of excellence for research in inhalation and Complex
Formulations in Florida and maryland in the Us.
Research and Development
The Heart of Lupin
28 | Lupin Limited

R&D scientific pool
Diploma
Doctorate
Graduation
mBBs
Post Graduation
R&D trends (H million)
FY10
FY11
FY12
FY13
FY14
4,11
9
5,30
1 5,94
0
7,70
8
9,58
3
r&D expenditure as a percentage
of net sales
8.6%
anDas filed in FY 2014
19
Cumulative r&D spend in the
last 7 years
J37,358million
First-to-file products30
Pipeline of nDDD / nCe programs in
various phases of drug discovery &
development
10
Patents filed as on march 31, 2014
1,762
Our commitment to this project has seen us attract the
best research talent for these therapies globally. in 2014,
Lupin also entered into a strategic joint venture agreement
with Japanese pharmaceuticals company, Yoshindo inc.
(Yoshindo) to create a new entity – YL Biologics (YLB). YLB
will be responsible for conducting clinical development of
certain Biosimilars including regulatory filings and obtaining
marketing authorizations in Japan.
a year of heightened activity, FY 2014 saw the Company
continue to step on the gas across all its research programs,
be it filings across markets, our drug discovery & delivery
programs or biotechnology research.
Highlights, FY 2014
Filed 19 anDas and 11 DmFs in the Us; received
approvals for 22 anDas as well as one supplemental nDa
(new Drug application) from the Us FDa during FY 2014
Filed 2 exclusive first-to-files for the generic versions of
Prolensa® and Quartette®
Lupin Research Park, Pune, India
annual report 2014 | 29

received project milestones payments of UsD 8.8 million
for 2 products that are currently under joint development
with medicis Pharmaceutical Corporation, Us
Completed Phase-i studies in europe for a program in
the Cns area, which is being advanced to Phase ii clinical
trial now
Candidates from two programs in the area of endocrine
disorders and cancer, entered clinical phase during FY 2014
the Company acquired nanomi B.V. in netherlands for
its patented technology platforms that would help develop
products in the Complex injectables space
set up a joint venture with Japanese pharmaceuticals
company Yoshindo to address the biotech opportunity
in Japan
Lupin’s research and development programs cover the
following disciplines:
Generics research
• Process Research
• Formulations Research
advanced Drug Delivery systems (aDDs)
novel Drug Discovery and Development (nDDD)
Biotechnology research
Cumulative DMF filings
FY10
FY11
FY12
FY13
FY14
104 11
1
123
138
149
Cumulative ANDA filings
* The Company withdrew 16 ANDAs during FY13 after re-evaluating their business potential
FY10
FY11
FY12
FY13
FY14
127
148
173
176*
192
Generics Research Lupin’s Generic research programs continue to fuel the
Company’s growth into higher orbits of leadership. it is
focused on developing aPis and formulations for the Us,
european, Japanese and other advanced and emerging
markets and has helped the Company emerge as a global
generics powerhouse.
API process researchOur aPi r&D capabilities are the backbone of the Company’s
generics research program and support it by developing
non-infringing and cost competitive aPis. the Process
research Group has also been responsible for fuelling the
growth of Lupin’s global aPi business, making it one of the
most competitive quality players in the aPi space globally.
Highlights, FY 2014
During FY 2014, the Company filed 11 Us DmFs, taking
cumulative total to 149 DmF filings. the Company also
filed 1 eDmF, 1 CeP, 3 australia DmFs, 1 Japan DmF and 3
Canada DmFs during the year
this year’s filings include complex aPis Prostaglandins that
involve very complex multistep chemistry
Pharmaceutical ResearchFY 2014 was a very productive year for the Pharmaceutical
research Group. not only did it step up filings for key
markets globally but also saw its efforts of preceding years
bearing fruit in the form of 45 approvals received in key
advanced markets; 22 in Us; 10 in europe; 6 in australia;
5 in Canada and 2 in Japan. the group continued to focus
on developing a highly differentiated quality pipeline
of niche products in diverse therapy areas such as Oral
Contraceptives, Ophthalmology, inhalation (mDis, DPis and
nasal sprays) and Dermatology.
Highlights, FY 2014
Filed 19 anDas with Us FDa; 4 maas with european
regulatory authorities; 4 maas in australia; 2 anDs
in Canada
the cumulative number of anDa filings with the Us FDa
now stand at 192
Confirmed first-to-file opportunities now stand at 30 with
15 being exclusive first-to-files
Cumulative filings with european authorities now stand at
57 with the Company having received 48 approvals to date
Advanced Drug Delivery Systems (ADDS)Lupin’s advanced Drug Delivery program is focused on
creating and leveraging technologies that not only provide
30 | Lupin Limited

clinical advantage but also transform and facilitate better
patient convenience and experience. We are leveraging
these technologies to build a highly differentiated pipeline
of branded products globally and have also been working
on joint development programs with like-minded peers to
create new products.
Highlights, FY 2014 the team achieved further milestone payments of UsD 8.8
million for 2 products that are being jointly developed with
medicis Pharmaceutical Corporation
the Company also completed technology transfer to a
Us CmO site for 2 of its two drug fixed-dose combination
extended-release nDa products
Analytical Researchthe analytical research Group is responsible for ensuring
that all processes and products transferred to Lupin’s
manufacturing plants meet regulatory requirements and
expectations through the development and validation of the
right testing methods and systems. the group also ensures
that all development and documentation are in line with
regulatory expectations. the Company’s analytical research
facility is fully automated and equipped with state-of-the-art
technology and instrumentation needed to support a top-
notch global research program, for example, equipment like
Powder x-ray Diffraction, solid state nmr and Differential
scanning Calorimetry to study physical properties such
as polymorphism and the latest LC/ms-ms systems and
automated preparative hPLCs for the isolation/synthesis and
characterization of impurities in aPis and drug products.
Lupin Bioresearch Centerthe Lupin Bioresearch Center (LBC) located in Pune is
responsible for conducting bioequivalence studies for
Lupin’s generic products and branded formulations which
form a part of the Company’s regulatory filings. they also
support pharmaco-kinetic studies of Lupin’s biosimilars
and respiratory products pipeline. LBC has both clinical and
bioanalytical capabilities and houses 2 clinics; a bioanalytical
annual report 2014 | 31

lab with 12 state-of-the-art LC-ms/ms systems, 2 ion
Chromatography systems and a clinical chemistry lab that
has been accredited by national accreditation Board of
Laboratories (naBL). LBC completed setting up an eLisa Lab
for the support of PK studies of Biotech products in FY 2014.
LBC also manages outsourced Ba/Be studies, clinical
end-point studies as well as studies for the Company’s
aDDs initiatives. During the year, LBC completed 35 full
studies, taking the cumulative tally to 156 to date. LBC had
undergone successful French regulatory (ansm) audit and
Us FDa audits for its Bioanalytical and Clinical areas.
Intellectual Property ManagementOver the years, Lupin’s intellectual Property management
Group (iPmG) has become a benchmark in the industry for
not only protecting the Company’s research and product
pipeline but by also building an enviable litigation track
record and carrying out patent challenges successfully.
the Group is also responsible for identifying new therapy
areas and products for the Company’s research programs
to develop.
Highlights, FY 2014 the confirmed first-to-file products now stand at 30
Post successful litigation wins, Lupin launched the generic
versions of Zymaxid® and trizivir® with 180 days of exclusivity
the Company also launched the generic version of
niaspan®
Post settlement, Lupin successfully launched the generic
versions of seasonique®, trilipix® and Cymbalta®
During the year, the Company settled 9 pending litigations
with various global pharmaceutical companies
During FY 2014, the Company filed 381 new patents,
taking the cumulative total to 1762 patents filed till date in
india and other countries. this included 108 Formulation
patents, 39 aPi/Process patents, 2 Biotech and 232 nCe
patents in india and other countries. the Company received
6 Formulation patents, 6 aPi Patents and more importantly 2
nCe patents.
Novel Drug Discovery & DevelopmentLupin’s novel Drug Discovery & Development (nDDD)
program focuses on the discovery, development and
commercialization of new drugs that address disease
areas with significantly unmet medical needs. We have
identified targets from which 10 research programs are
currently underway. scientists at nDDD have been working
to ensure that our portfolio of novel compounds are
progressing and are at various stages ranging from discovery
to development. this steady movement will ensure that
32 | Lupin Limited

at least one compound enters the clinical phase in terms
of first-in-human studies each year. Lupin’s nDDD efforts
address disease areas such as metabolic disorders, pain and
inflammation, autoimmune diseases, Cns disorders, cancer
and infectious diseases.
Highlights, FY 2014 Completed Phase i studies in europe for a program in the
Cns area, which is being advanced to Phase ii clinical trials
in europe
Candidates from two programs in the area of endocrine
disorders and cancer have entered clinical phase
in FY 2014
Lupin BiotechnologyOver the last six years, Lupin Biotechnology Group (LBG)
has been steering its efforts towards the development of
affordable, high quality Biosimilars. LBG has a talent pool
of 150 scientists who are developing and working on a
product basket of 10 Biosimilars. the product basket
under development has an interesting mix of blockbuster
microbial and mammalian products, addressing diverse
and niche therapeutic indications such as Oncology,
inflammation, antivirals, Osteoporosis, rheumatoid
arthritis and Ophthalmics.
Highlights, FY 2014 Lupin’s first biosimilars foray into advanced markets
was marked by the entry into a JV with Yoshindo inc. for
developing and commercializing biosimilars for Japan
5 of Lupin’s biosimilar products are slated to enter the
Clinical trial phase this year, having successfully completed
pre-clinical studies
3 pipeline products preparing to enter pre-clinical phase
this financial year
the product development conforms to iCh and biosimilar
guidelines issued by the indian regulatory bodies and is
also in tune with the global regulatory landscape. the
product development has been supported by innovative and
proprietary expression systems, innovative process designs
and novel formulations as evidenced through encompassing
15 indian patent applications, 13 PCt applications, 10
patent applications in regulated markets and 23 publications
till date. the JV with Yoshindo would also act as a stepping
stone for exploring other regulated markets now.
We are now well positioned to write a new chapter in
Lupin’s evolution as a global pharmaceutical Company,
where we have not only put all the building blocks
together but have built a solid foundation to ink a
remarkable tomorrow.
annual report 2014 | 33

in the pharmaceutical world, there are no shortcuts to
quality because manufacturing drugs is a responsibility;
and carrying it out to the best of our capabilities, an
obligation we have.
the Productivity, Quality and regulatory Compliance
standards that we have set for ourselves have become key
differentiators to help Lupin emerge as a global generics and
specialty pharmaceutical major.
Lupin has a global manufacturing footprint, with operations
in india and Japan. the Company operates 12 world-class
facilities (10 in india and 2 in Japan) manufacturing and
supplying aPis and formulations approved by leading
pharmaceutical regulatory authorities like the Us FDa, World
health Organisation, mhra (UK), tGa (australia), mhLW
(Japan), anVisa (Brazil) and mCC (south africa) to name
a few. a 700+ strong Global Corporate Quality assurance
function spread across all manufacturing locations is not
only engaged in developing and implementing policies and
quality guidelines for our manufacturing operations but also
responsible for ensuring that we stay current with rapidly
changing good manufacturing practices as laid down by
regulatory agencies globally.
the Company continues to maintain focus not only on
building new systems, adopting new technologies and
smart automation but is also investing in continuous
learning and development programs that keep personnel
current with cGmP guidelines, instilling and ingraining
quality and compliance deep into our very Dna.
During FY 2014, the Company received certification for
international sustainability rating standard, 8th edition
(isrs) from Det norske Veritas (DnV). the certification
was received after audits were conducted at three of the
Company’s manufacturing facilities in india located at
ankleshwar, mandideep and tarapur. Lupin is the first
Global Manufacturing and Supply Chain
The Business of Quality
34 | Lupin Limited

manufacturing facilities spread
across india and Japan
12
Pharmaceutical company globally
to receive the isrs 8th edition
certification
1st
within Us generics players with
99.6% fill rates
No.1
Lupinytts engaged in
manufacturing and quality
Over 6,000
Cumulative capital expenditure
over the last 7 years
J29,856million
pharmaceutical company globally to have received the isrs
8th edition certification. Using isrs ensures operations are
safe and sustainable which helps improve and demonstrate
safety, environmental, and sustained business operations
and performance. this certification bears testimony to
Lupin’s commitment towards adopting best practices
in environment, health and safety for Lupin’s global
manufacturing operations in our mission to remain best-
in-class in the industry. We are building new efficiencies by
adopting six sigma and lean manufacturing across most of
our manufacturing facilities.
Lupin has over the last decade not only ramped up but also
set up new manufacturing facilities to meet future demand.
Capital expenditure for the Company stood at H4,831 million
for FY 2014.
the Company also completely restructured its supply chain
by setting up a centralized Global supply Chain Organization
these measures were taken to ensure that we build a future-
ready, nimble and strong supply chain. the new division has
already implemented and put in place new systems that are
enabling a segmented supply chain strategy; long range
supply chain strategy for capacity planning and adopting
scientific statistical tools for advanced forecasting.
Highlights, FY 2014
received the prestigious QCi-DL shah national award
under the Drugs & Pharmaceuticals category for excellent
display of application of six sigma principles
Optimized manufacturing costs with the rollout of the
Disha program to all locations (based on Lean and six
sigma principles) to increase productivity and reduce costs
Our new formulations manufacturing facility in nagpur is
now operational
as we aspire to stay ahead we must fine tune execution to
exceed customer expectations to deliver greater value for a
better tomorrow.
annual report 2014 | 35

We have faced challenges but never lost focus, have been
guided by a common vision and shared values and followed
the high standards of integrity and governance. this creates
an incredibly powerful performing engine that has translated
into business success for the Company and professional
growth for all our people.
We are proud of our meritocratic culture, the strength
and eminence of our leadership team and the values
that all Lupinytts practice as a way of life. Our people are
our strength and the fountainhead of our competitive
advantage. Our hr vision has been built around the
fundamental principles of innovation, empowerment
and people-development. these principles ultimately
translate into an array of policies, practices and processes
institutionalized by the hr function and practiced
unequivocally by the entire organization.
innovation is the core of our business and the very heart of
everything that we do, be it in research, operations, supply
chain or how we have gone about executing flawlessly
in markets around the world. innovation is the not just
an element but is in the Dna of Lupin. Our people are
always looking at how we can do things better, to not only
reinvent processes but deliver world class products. several
hr programs within the Company have been specifically
designed to engage and encourage people to ideate, create
and innovate. Be it simple suggestion schemes that have
actively engaged our employees in the process of workplace
improvement and continuous innovation or our Learn &
earn program, which is a classic example of filling the
talent gap through innovative and inclusive talent
development strategies.
For a Company that is expanding at a rapid pace and
is diversified both geographically and business-wise,
micromanaging the taskforce is never an option.
empowerment thus becomes critical. the success of
Lupin lies in the abilities and business-focused approach
of our managers, coupled with a highly engaged and
enthused Gen Y workforce. Being in a highly regulated
business environment, balancing creativity and freedom of
thought with the norms that govern the business, we always
Human Resourcesthe Last DeCaDe has seen LUPin On an aCCeLerateD GrOWth Path anD the COmPanY transFOrm intO
a GLOBaL GeneriCs POWerhOUse amiDst a hiGhLY COmPetitiVe GLOBaL enVirOnment. We haVe GrOWn
in siZe, sCaLe, statUre anD set stanDarDs FOr Others tO FOLLOW.
36 | Lupin Limited

run the risk of suppressing the entrepreneurial streak in
young minds. to that end, we are empowering and enabling
our junior and middle management employees through
several specially designed leadership development programs
such as the ‘Leader Plus’, ‘managers’ excellence Program’,
‘Business Leaders Program’ that prevents this balance from
tipping over and ensuring that we provide our employees
with the right tools at the right time and empower them
to develop the ability to exercise sound judgment and take
decisions through rational and risk-evaluative thinking.
People development is at the very heart of the Company’s
agenda. at Lupin, we are proud of the slew of learning
interventions we offer that caters not only to each stage of
the employee lifecycle but is also specific to the nature of
each function, role and its characteristics. a combination
of structured academic inputs coupled with experiential
learning opportunities and high impact accelerator
experiences has helped our employees design their own
careers at Lupin. We continue to partner with the best
academic institutions, such as the indian institute of
management (ahmedabad), sP Jain institute (mumbai),
narsee monjee institute (mumbai) and Bits (Pilani).
From job enhancement, enrichment and enlargement
opportunities to developing technical and behavioural
competence and finally fulfilling the aspirations for higher
education, we have developed several broad based as well
as niche initiatives for every stream within our system. such
focused learning interventions have not only helped groom
managers but also ensured their evolution as leaders and
from leaders to being visionaries, a value chain that is integral
to building a resilient tomorrow. some examples of these
programs are the area managers’ excellence program,
asCent initiative and the top 100 managers leadership
development program. Lupin won the american society
for training and Development (astD) Best award 2014 for
employee Learning and Development.
Our Values of integrity, Customer Focus, teamwork, Passion
for excellence, entrepreneurial spirit, respect and Care are
aptly christened as ‘the spirit of Lupin’ and guide us in all
our endeavours.
Lupin is a global team; 15,000 highly-passionate
Lupinytts spread across 21 geographies; makes us truly
a transnational company. We are passionate and focussed
on leaving no stone unturned to ensure the development
of each Lupinytt to ensure that each one of us is giving our
best and contributing towards an enriching tomorrow.
Lupinytts globally
15,000+
invested in training and developmentJ150million
Years – average age of a Lupinytt30
employee retention of team within Lupin for more than 3 years
72%
rank in the ‘Great Place to Work’ survey amongst indian pharma companies
2nd
Lupinytts covered under the Lupin stock option plan
2,400
annual report 2014 | 37

FinanCiaL reVieW
We are committed to ensuring an insured tomorrow…

we have a clear vIsIon for the future and have already buIlt a road-map whIch gIves us clear lIne-of-sIght as far as revenues and markets go.
upin had a very strong
year in FY 2014. Despite
volatility, the Company
has delivered a record set
of numbers, be it growth
in revenues or margins
or increased shareholder
value. it not only reflects value
created and delivered, but is also an
expression of the shareholder’s trust
in the Company and its management
over the years.
The Business Performance Matrix FY 2014 was a landmark year:
the Company recorded
consolidated net revenues of
H110,866 million in FY 2014, a
growth of 17% over the previous
year. the Company has recorded a
CaGr of 24% over the last 5 years
earnings before interest, tax,
Depreciation and amortization
(eBitDa) grew by 36% to H31,193
million in FY 2014, a CaGr of 33%
over the last 5 years
Profit before tax (PBt) grew by 47%
to H28,317 million during FY 2014,
up from H19,246 million, FY 2013
net profit grew to H18,364 million
in FY 2014; a growth of 40%; a
CaGr of 30% over the last 5 years
Our reserves & surplus increased to
H68,419 million during FY 2014
these numbers are an outcome
of the Company’s overall global
growth strategy, be it in how we
have gone about growing our
existing businesses, calibrating our
m&a strategy in terms of prioritizing
markets and perfecting our entry
into these high growth geographies.
it is also an outcome of our
continued investments in new
therapies, technology and building
a niche product pipeline, not to
mention a rigorous attention to input
costs in a never-ending quest to
improve margins.
We have a clear vision for the future
and have already built a road-map
which gives us a clear line-of-sight in
so far as revenues and markets go.
We have built systems and are
continually strengthening our
processes to help us mitigate volatility
and risks. FY 2014 saw the Company
not only increase its investment in
r&D but also saw us expand our
research base by acquiring nanomi
B.V. in the netherlands and also set up
two new research and development
centres in the Us, which would
help us address niche segments like
inhalation and Complex injectables
globally. Lupin also took its first
steps to address the global biological
opportunity by entering into a joint
venture agreement with Yoshindo
inc., Japan, which would help the
Company address the Japanese
biologics market and also make
inroads into global markets. FY
2014 was also the year where the
Company announced its entry into the
Latin american market by acquiring
Laboratorios Grin, a specialty
pharmaceutical company in mexico.
it is the 4th largest ophthalmological
player in the mexican market.
The Market Matrix advanced market (Us & europe)
sales increased to H51,805 million
in FY 2014 as compared to H40,051
million in FY 2013, a growth of 29%
Lupin’s india region Formulations
business net revenues increased to
H24,795 million during FY 2014, a
growth of 5%
L
annual report 2014 | 39

Lupin’s Japanese business recorded revenues of H12,955
million during FY 2014 and contributed 12% to the
Company’s overall revenues, a de-growth of 1%
Lupin’s south african subsidiary Pharma Dynamics
reported sales of H3,800 million in FY 2014 as compared to
H3,210 million in FY 2013, growth by 18%
the Company’s global aPi business clocked in revenues of
H11,140 million a growth of 17%
Strong Balance SheetWe have delivered a strong balance sheet yet another year;
more importantly a debt-free balance sheet bolstered by
strong and positive cash flows, all of which we would
be leveraging to strengthen and capitalize on larger
opportunities to grow the business faster. the ability of the
Company to raise credit is stronger than ever. Lupin’s short-
term debt program continued to receive the highest rating
from iCra.
net Operating working capital increased to H28,158 million
as on 31st march, 2014 as against H24,312 million in the
previous year.
the Company has improved its financial performance
significantly over the years. the asset turnover ratio has
improved from 3 to 4.1 during the same period despite
substantial increase in capacities.
Earnings per share, Dividends & Taxationthe Company recorded a growth of 39% in earnings per
share (ePs) to H40.99 during the financial year FY 2014.
the Board of Directors recommended a dividend of 300%,
a YoY increase of 100%. Lupin delivered an outstanding
shareholder return of 48% during FY 2014, outperforming the
Bse sensex (19%) & Bse healthcare index (25%). this translates
into a market cap increase from H281 billion at the beginning
of april 2013 to H418 billion by the end of march 2014.
the Company’s tax expense for FY 2014 was H9,622 million
as compared to H5,842 million for FY 2013. the aggregate
tax obligations of the Company were significantly higher
during FY 2014 due to changes in tax regimes; some of our
tax Free Production Zones losing their benefits; the one time
impact of tax on dividend received from our Us subsidiary
and tax that was levied on inventories shipped to overseas
subsidiaries for new launches part of which remained unsold
towards the year end. the effective rate of tax increased to
34% during FY 2014 as a result of the above.
Capital Allocation – Investing in TomorrowCapital expenditurethe Company continues to invest ahead of the curve and
deployed H4,831 million towards capital expenditure during
FY 2014. Capital expenditure was deployed towards setting
up new facilities and enhancement of existing capacities.
the underlined importance of technology and safe-guarding
intellectual property saw the Company allocate a sizeable
chunk on ramping up and investing in new it infrastructure
& intangible assets.
Research & Developmentrevenue expenditure on r&D increased to H9,294 million,
8.4% of Lupin’s net sales globally, which indicates how
aggressively the Company is investing in our future to creating
meaningful and differentiated technology platforms and a
30%
25%
20%
15%
10%
5%
0%
4.5
4
3.5
3
2.5
2
1.5
1
0.5
0FY10
Net profit% to net salesEBITDA% to net sales
Fixed asset turnoverDebt equity
FY11 FY12 FY13 FY14
40 | Lupin Limited

niche, highly differentiated proprietary product pipeline, a
great pointer to the quality of our future earnings.
Internal Control Systems & Information Technology (IT)at Lupin, we have put in place automated internal business
controls and a centralized global process framework
that works and governs the day-to-day operations of
key functions like research, technical operations, global
procurement, manufacturing and supply chain, integrating
them with key support functions like marketing, sales,
finance, regulatory affairs and hr. an alert and empowered
internal audit group monitors systems and processes
ensuring that automated control procedures ensure prudent
financial control, accountability and integrity in every part of
our organization. ernst and Young are our internal auditors
and submit reports and updates to the audit Committee of
the Board, which reviews and provides direction on how we
can further enhance controls within the Company.
the Company continues to invest heavily to ensure that we
remain a truly scalable, technologically advanced, process-
integrated it enabled organization globally.
implemented state-of-art it system to support the
Company’s Global supply Chain
implemented technologies to optimize Lupin’s global
network and critical applications infrastructure, as well as to
make it resilient in the event of a disaster
re-modelled the tax structure in the saP system for the
india business, to position it for upcoming statutory changes
such as Gst and DtC
implemented Quality assurance management systems
at manufacturing locations to automate and improve
compliance in key quality assurance processes
implemented best-in-class it technologies in networks and
firewalls to enhance Lupin’s enterprise security
Risks, Concerns & ThreatsLupin has over the last decade built a strong financial
organisation. Governed by a strong compliance ethic, it relies
heavily on risk management and forecasting frameworks to
manage competitive, economic, financial, geo-political and
social risks. Coupled with our investments in it and Business
intelligence, Lupin has put in place information security,
disaster management and recovery solutions to ensure that
our intellectual property is secure and business operations
continue to function without any disruptions globally.
We have put in place response mechanisms that mitigate
environmental, operational and business risks and minimize
impact on business. the Company’s currency hedging
strategy for the short, mid and the long-term through
forward exchange contracts, have helped minimise volatility
and have helped buffer the impact of currency exchange
rate fluctuations. We benefited by the steep depreciation of
the rupee against major global currencies like the UsD and
the eUrO during FY 2014. Close to 75% of the Company’s
revenues come from exports and sales in other markets.
FY 2014 was a challenging year for our india region
formulations business given the Drug Price Control Order
(DPCO) and related events that affected the entire indian
Pharmaceutical industry. Our handling of the situation and
the Company’s current and envisaged therapy and product
mix in the domestic market ensured that Lupin remained on
the growth path in the domestic market, ending the year on
a positive note.
Lupin continues to de-risk its global business by creating
efficiencies within its systems. We are adopting best
practices, learning and working with global domain
leaders be it in research, quality or procurement; we are
collaborating with leading institutions, think tanks, vendor
partners, peers and our customers. We are working at
every step to create value for all our stakeholders. more
importantly, we are creating value for tomorrow.
regards,
Ramesh Swaminathan
Chief Financial Officer
Lupin Limited
annual report 2014 | 41

LhWrF is focussed on building a sustainable model which
would aim to improve human Development indices (hDi)
in its chosen geographic area of operations.
LhWrF operates in districts with a low hDi score such as
alwar, Dhaulpur, Karauli and Bharatpur in rajasthan; Dhule,
nandurbar, Pune and sindhudurg in maharashtra; raisen in
madhya Pradesh and Dehradun in Uttarakhand. in addition,
of the ten locations where Lupin’s manufacturing plants are
located, LhWrF has initiated development work at all the
locations except Jammu and nagpur, which will be taken up
in FY 2015.
We have worked hard over the last 26 years in creating,
developing, nurturing and executing programs in
partnership with the rural communities we choose to work
with. We have collaborated with numerous institutions,
governments, individuals, visionaries and domain experts
on multiple projects to ensure growth and progress for the
communities we serve. LhWrF reaches out to 2.8 million
people, living in 3100 villages spread across 4 states in india.
We are passionate about what we have set out to do, about
transforming the rural landscape of the country; about
changing the lives of the communities we exist in and
We BeLieVe, We COLLeCtiVeLY as COrPOrate inDia haVe the FUnDamentaLs in PLaCe tO shaPe a Better FUtUre FOr
sOCietY anD We mUst emBraCe this nOt as a resPOnsiBiLitY BUt an OBLiGatiOn. this is What LeD LUPin tO set
UP the LUPin hUman WeLFare & researCh FOUnDatiOn (LhWrF) in 1988; LhWrF Was set UP With the OBJeCtiVe OF
CreatinG a rePLiCaBLe anD eVer-eVOLVinG mODeL FOr sUstainaBLe rUraL DeVeLOPment With the simPLe GOaL OF
UPLiFtinG FamiLies.
Corporate Social Obligation
42 | Lupin Limited

work with; we are working to create a happier more
meaningful tomorrow.
LhWrF focuses on rural development programs that
help promote and enable economic Development,
social Development, natural resource management and
infrastructure Development.
Economic DevelopmentAgriculture the Foundation works to improve the income levels
and living conditions of farmers by propagating the
introduction and use of modern agricultural equipment,
crop diversification and technology infusion to enhance farm
productivity. Our intervention in agricultural sector focuses
on crop diversification and productivity enhancement.
Animal Husbandry LhWrF focusses on improving productivity by inducting
livestock of superior breeds and on breed improvement.
this is complemented by routine activities such as providing
animal health services, organising vaccination camps,
ensuring fodder security and introducing advanced cattle
management and livestock productivity practices.
Rural Industries PromotionLhWrF continues to focus on skill development for rural
population, particularly youth and women enabling them to
become entrepreneurs by facilitating timely micro-finance
support. in FY 2014, LhWrF provided skill training to 4,478
persons and facilitated establishment of about 4,014 new
self-enterprises.
Floriculture at Deeg, Bharatpur
human lives touched2.08 million
Lupin locations where we
carry out Csr
8
Villages to which LhWrF
reaches out
3,100
mobilized by LhWrF J500 million
annual report 2014 | 43

Financial InclusionLhWrF collaborated with state Bank of Bikaner and Jaipur
(sBBJ) to implement an innovative programme that enables
banks to go to rural households. initiated in FY 2013, the
programme has led to 1,20,000 new accounts opened
across 560 villages in 6 districts in eastern rajasthan.
Social DevelopmentWomen empowermenteconomic independence is critical to women, their
development and empowerment in rural india. the
Foundation has focused on strengthening self-help Groups
(shGs) to encourage employability and development. Linking
these shGs with financial institutions and banks ensures
timely and much-needed credit. shG movement in adopted
areas has resulted in development of leadership qualities and
economic empowerment amongst rural women.
HealthQuality and in-time health care is the most basic need
in rural areas. the Foundation has made health services
available even in the most inaccessible parts. in FY 2014,
about 2.5 lakh patients were treated through medical camps
and our mobile medical Diagnostic Unit (mmDU).
EducationLhWrF has introduced e-learning systems to make
education exciting and easy for students as well as teachers.
this unique initiative has not only improved the quality of
education but has also improved retention. these school
based interventions have also helped reduce dropout rates.
Natural Resource Management (NRM) natural resource conservation is critical to the local eco-system
and thereby to the rural economy. Various nrm measures such
as construction of check dams, ponds, anicuts, farm bunds and
excavation of streams are undertaken by the foundation for soil
and water conservation in its adopted areas.
Infrastructurethe foundation focusses on school infrastructure, rural
sanitation and housing for improving the quality of life in
its adopted areas.
Post Disaster Response in Uttarakhandin June 2013, LhWrF adopted three districts in the state of
Uttarakhand; Uttarkashi, Chamoli and rudraprayag which
were hit badly due to the devastating floods and landslides
that caused unprecedented damage.
A rural youth engaged in gems polishing work
Provided tents for flood victim families Rural women after eye surgical operation
Poultry works for income generation
44 | Lupin Limited

R e p o R t s a n d F i n a n c i a l s
Seven Year Financial Summary ........................................................................................... 46
Directors’ Report ............................................................................................................... 48
Corporate Governance Report ........................................................................................... 58
Auditors’ Certificate on Corporate Governance .................................................................. 78
Business Responsibility Report ........................................................................................... 79
Independent Auditors’ Report on Consolidated Financial Statements ................................. 89
Consolidated Financial Statements..................................................................................... 90
Independent Auditors’ Report ........................................................................................... 137
Financial Statements ......................................................................................................... 140
Section 212 ...................................................................................................................... 180
Annual Report 2014 | 45

seven yeaRs Financial summaRyCONSOLIDATED BALANCE SHEET I in million
As at March 31, 2008 2009 2010 2011 2012 2013 2014
SOURCES OF FUNDS
Shareholders' funds
Equity Share Capital 820.8 828.2 889.4 892.4 893.3 895.1 896.8
Reserves and Surplus 11,976.0 13,420.0 24,788.9 31,918.4 39,235.6 51,146.7 68,418.9
12,796.8 14,248.2 25,678.3 32,810.8 40,128.9 52,041.8 69,315.7
Minority Interest 94.5 142.5 254.9 515.1 722.9 594.5 669.4
Loan Funds
Secured Loans 7,080.6 7,569.2 8,722.4 7,885.9 8,161.2 6,369.2 1,195.6
Unsecured Loans 4,948.2 4,663.5 2,676.1 3,738.0 8,229.8 5,275.7 5,341.8
12,028.8 12,232.7 11,398.5 11,623.9 16,391.0 11,644.9 6,537.4
Deferred Tax Liabilities (net)
1,248.0 1,387.2 1,630.4 1,791.8 1,910.1 2,336.8 2,486.6
TOTAL 26,168.1 28,010.6 38,962.1 46,741.6 59,152.9 66,618.0 79,009.1
APPLICATION OF FUNDS
Fixed Assets
Gross Block 14,858.8 18,200.3 22,937.1 26,388.5 36,878.4 41,768.9 46,260.3
Less : Depreciation and Amortisation
4,697.5 6,188.3 7,072.2 9,075.1 14,421.8 16,840.4 19,283.0
Net Block 10,161.3 12,012.0 15,864.9 17,313.4 22,456.6 24,928.5 26,977.3
Capital Work-in-Progress (incl. Capital Advances)
963.8 2,239.7 3,578.7 5,319.3 4,973.7 3,909.0 4,110.2
11,125.1 14,251.7 19,443.6 22,632.7 27,430.3 28,837.5 31,087.5
Goodwill on Consolidation
1,872.3 3,173.7 3,196.8 3,254.9 5,040.0 5,073.2 6,578.7
Investments 58.2 215.6 264.3 31.5 28.0 20.6 20.6
Deferred Tax Assets (net) 141.2 222.8 195.4 380.5 467.8 704.4 708.1
Other Assets
Inventories 7,893.4 9,571.6 9,714.9 11,999.6 17,326.7 19,489.3 21,294.5
Receivables 7,439.0 9,179.7 11,265.7 12,556.4 17,800.1 21,869.9 24,641.0
Cash and Bank Balances (incl. Current Investments)
2,741.8 777.7 2,015.3 4,201.4 4,024.7 4,348.8 9,739.1
Others 2,367.0 2,779.7 4,758.6 6,186.6 7,704.6 8,794.9 7,990.8
20,441.2 22,308.7 27,754.5 34,944.0 46,856.1 54,502.9 63,665.4
Other Liabilities
Liabilities 6,018.8 10,334.8 9,663.4 11,779.3 16,730.5 17,836.4 18,272.3
Provisions 1,451.1 1,827.1 2,229.1 2,722.7 3,938.8 4,684.2 4,778.9
7,469.9 12,161.9 11,892.5 14,502.0 20,669.3 22,520.6 23,051.2
Net Other Assets 12,971.3 10,146.8 15,862.0 20,442.0 26,186.8 31,982.3 40,614.2
TOTAL 26,168.1 28,010.6 38,962.1 46,741.6 59,152.9 66,618.0 79,009.1
46 | Lupin Limited

CONSOLIDATED STATEMENT OF PROFIT AND LOSS I in million
Year ended March 31, 2008 2009 2010 2011 2012 2013 2014
INCOME
Sales (Gross) 29,007.4 38,428.9 48,009.5 57,421.7 70,017.2 95,235.3 111,671.2
Less : Excise Duty 666.4 479.0 273.2 353.5 420.2 619.0 804.8
Sales (net) 28,341.0 37,949.9 47,736.3 57,068.2 69,597.0 94,616.3 110,866.4
Other Operating Income 575.9 637.1 762.5 1,121.5 1,232.1 1,796.7 1,999.3
Other Income 211.3 125.5 351.1 221.9 143.5 278.5 1,164.8
Total Income 29,128.2 38,712.5 48,849.9 58,411.6 70,972.6 96,691.5 114,030.5
EXPENDITURE
Cost of Materials 11,638.0 16,043.1 19,694.2 22,379.3 26,039.0 35,485.0 38,173.8
Employee Benefits Expense 3,076.0 4,871.3 5,871.5 7,675.6 9,695.3 12,666.2 14,646.5
Manufacturing and Other Expenses
7,991.2 10,359.2 13,303.3 16,356.4 20,647.7 25,562.9 30,017.5
Total Expenses 22,705.2 31,273.6 38,869.0 46,411.3 56,382.0 73,714.1 82,837.8
Profit before Interest, Depreciation and Tax
6,423.0 7,438.9 9,980.9 12,000.3 14,590.6 22,977.4 31,192.7
Finance Cost 373.5 498.6 384.9 344.8 354.7 409.5 266.5
Depreciation and Amortisation
647.4 879.9 1,239.1 1,711.8 2,275.2 3,321.9 2,609.7
Profit before Tax 5,402.1 6,060.4 8,356.9 9,943.7 11,960.7 19,246.0 28,316.5
Current Tax 1,022.6 727.0 1,109.8 1,176.3 2,756.2 5,829.0 9,536.0
Deferred Tax 180.6 106.2 250.4 (26.5) 329.4 12.6 85.5
Fringe Benefit Tax 114.8 149.8 - - - - -
Net Profit before Minority Interest and Share of Loss in Associates
4,084.1 5,077.4 6,996.7 8,793.9 8,875.1 13,404.4 18,695.0
Minority Interest 1.3 28.6 111.6 148.4 198.6 262.8 331.3
Share of Loss in Associates 0.3 33.4 68.8 20.0 - - -
Net Profit 4,082.5 5,015.4 6,816.3 8,625.5 8,676.5 13,141.6 18,363.7
Note : Figures are suitably regrouped to make them comparable.
Annual Report 2014 | 47

diRectoRs’RepoRt
Your Directors have pleasure in presenting their report on the business and operations of your Company for the year ended March 31, 2014.
Financial Results
(I in million)
Standalone Consolidated
2013-14 2012-13 2013-14 2012-13
Sales (Gross) 88576.6 70723.9 111671.2 95235.3
Profit before interest, depreciation and tax 33277.1 19072.3 31192.7 22977.4
Less: Interest and finance charges 209.9 332.8 266.5 409.5
Less: Depreciation and amortisation 1676.3 1501.4 2609.7 3321.9
Profit before tax 31390.9 17238.1 28316.5 19246.0
Less: Provision for taxation (including deferred tax) 8148.7 4633.8 9621.5 5841.6
Net Profit before Minority Interest 23242.2 12604.3 18695.0 13404.4
Less: Minority Interest - - 331.3 262.8
Net Profit 23242.2 12604.3 18363.7 13141.6
Add: Surplus brought forward from previous year 28539.2 19530.2 31172.1 21345.2
Amount available for Appropriation 51781.4 32134.5 49535.8 34486.8
Appropriations:
Transfer to General Reserve 2500.0 1500.0 2500.0 1500.0
Add: Transfer from Minority Interest - - - 280.6
Interim Dividend on Equity Shares 1345.0 - 1345.0 -
Proposed final dividend on Equity Shares 1345.1 1790.1 1345.1 1790.1
Dividend on Equity Shares for previous year 1.1 0.9 1.1 0.9
Reversal of Corporate Tax on Final Dividend for previous years(In terms of Section 115-O/115BBD of the Income Tax Act, 1961)
(304.2) - (304.2) -
Corporate Tax on dividend 247.8 304.3 247.8 304.3
Balance carried to Balance Sheet 46646.6 28539.2 44401 31172.1
51781.4 32134.5 49535.8 34486.8
Performance Review
During the year, your Company’s turnover crossed H 111 billion, with Consolidated Gross Sales clocking H 111671.2 million as against H 95235.3
million of the previous year, higher by 17%. International markets accounted for 74% of sales. Profit before interest, depreciation and tax
increased by 36% at H 31192.7 million as against H 22977.4 million in the previous year. Profit before tax was H 28316.5 million, higher by 47%
over the previous year. After providing for taxes and minority interest, net profit was H 18363.7 million, higher by 40% over the previous year.
Earnings per share was H 40.99.
Dividend
Your Directors are pleased to recommend final dividend at H 3/- per equity share of H 2/- each, for the year ended March 31, 2014, subject to
the approval of the members at the ensuing Annual General Meeting. At its meeting held on February 3, 2014, the Board of Directors declared
interim dividend of H 3/- per equity share of H 2/- each, which was paid on February 21, 2014. Thus, the total dividend for the year shall be 300%
i.e. H 6/- per equity share (as against 200% last year) amounting to H 2690.1 million.
48 | Lupin Limited

Share Capital
During the year, the paid-up equity share capital of your Company
rose by H 1.7 million consequent to the allotment of 846311 equity
shares of H 2/- each to eligible employees under the ‘Lupin Employees
Stock Option Plan 2003’, ‘Lupin Employees Stock Option Plan 2005’,
‘Lupin Subsidiary Companies Employees Stock Option Plan 2005’,
‘Lupin Employees Stock Option Plan 2011’ and ‘Lupin Subsidiary
Companies Employees Stock Option Plan 2011’.
Credit Rating
ICRA Limited reaffirmed its “[ICRA] A1+” (pronounced “ICRA A one
plus”) rating for your Company’s working capital lines of H 15000
million from banks indicating a very strong degree of safety for timely
payment of financial obligations. Of this limit, H 1900 million was
assigned a long-term rating of “[ICRA] AA+” (pronounced “ICRA
double A plus”) indicating a high degree of safety and the outlook
was revised from ‘Stable’ to ‘Positive’.
The Company also enjoys “[ICRA] AA+” rating for non-convertible
debentures (NCDs) of H 1000 million, indicating a high degree of
safety for timely servicing of financial obligations for long-term
debt instruments and the outlook was been revised from ‘Stable’ to
‘Positive’. The Company did not issue any long-term NCDs during the
year.
Acquisitions
In its strategy to pursue inorganic growth for further accelerating
its progress and expanding its presence in select geographies, your
Company made the following acquisitions through Lupin Atlantis
Holdings SA, Switzerland, wholly-owned subsidiary: -
a) the entire shareholding of Laboratorios Grin, S.A. DE C.V.,
Mexico, (‘Lab Grin’). Lab Grin, a 60 year old company
specializing in Opthalmics. It is ranked 4th in the Opthalmics
segment in the Mexican market, commanding 11% market share
with a CAGR of 10%. Lab Grin has superior brand recognition
and an outstanding reputation with the medical community.
It has state-of-the-art manufacturing facility, a highly regarded
management team and attractive profitability margins.
The Company believes that the acquisition would add value in the
opthalmic pharmaceutical and opthalmic vision care segments.
The deal is subject to compliance to certain conditions which
were yet to be fulfilled as on date.
(b) the entire shareholding of Nanomi B.V., the Netherlands,
(‘Nanomi’) to make significant in-roads into the niche area of
complex injectables. Nanomi has patented technology platforms
to develop complex injectable products and a rich talent pool of
scientists who would be backed by the Company’s global R&D
and manufacturing teams.
Lupin Holdings B.V., Netherlands, wholly-owned subsidiary of
the Company, acquired the entire shareholding of Farma World
Importacao e Exportacao de Medicamentos LTDA - EPP, Brazil (‘Farma
World’). The objective of Farma World is to import and export finished
dosages, API, R&D consulting and participate in investments in Brazil
and abroad.
Subsidiary Companies
As on March 31, 2014, the Company had 23 subsidiaries. Lupin Inc.,
U.S.A. and Lupin GmbH, Switzerland, wholly-owned subsidiaries, were
incorporated on June 27, 2013 and August 15, 2013 respectively.
Financials of subsidiaries are disclosed in the Consolidated Financial
Statements which form part of this Annual Report. Statement
pursuant to the provisions of Section 212(1)(e) of the Companies Act,
1956 also forms part of this Annual Report.
Management Discussion and Analysis
A detailed Management Discussion and Analysis forms part of this
Annual Report.
Corporate Governance
Report on Corporate Governance forms part of this Annual Report.
The Auditors’ certificate certifying compliance with the conditions of
Corporate Governance under Clause 49 of the Listing Agreement is
also annexed to this Report.
Business Responsibility Report
In compliance with Clause 55 of the Listing Agreement, the Business
Responsibility Report forms part of this Annual Report.
Directors’ Responsibility Statement
Pursuant to the provisions of Section 217(2AA) of the Companies Act,
1956 (Act), your Directors confirm that:
i) in the preparation of the annual accounts, the applicable
accounting standards had been followed along with proper
explanation relating to material departures;
ii) the Directors had selected such accounting policies and applied
them consistently and made judgments and estimates that are
reasonable and prudent so as to give a true and fair view of the
state of affairs of your Company at the end of the financial year
ended March 31, 2014 and of the profit of your Company for
that year;
iii) the Directors had taken proper and sufficient care for the
maintenance of adequate accounting records in accordance
with the provisions of the Act for safeguarding the assets of
your Company and for preventing and detecting fraud and other
irregularities; and
iv) the Directors had prepared the annual accounts on a ‘going
concern’ basis.
Annual Report 2014 | 49

Directors
Pursuant to the provisions of Section 152 of the Companies Act,
2013, (‘Act’), Dr. Kamal K. Sharma, Vice Chairman, retires by rotation
at the forthcoming Annual General Meeting and is eligible for
re-appointment. Pursuant to the provisions of Section 149 of the Act,
Dr. Vijay Kelkar, Mr. Richard Zahn, Mr. R. A. Shah, Dr. K. U. Mada and
Mr. Dileep C. Choksi are being appointed as independent directors for
a period of one year at the forthcoming Annual General Meeting till
the conclusion of the next Annual General Meeting.
Conservation of Energy, Technology Absorption and Foreign
Exchange Earnings and Outgo
The particulars as prescribed by Section 217(1)(e) of the Companies
Act, 1956 read with Companies (Disclosure of Particulars in the Report
of Board of Directors) Rules, 1988 relating to conservation of energy,
technology absorption and foreign exchange earnings and outgo are
given in Annexure ‘A’.
Fixed Deposits
Your Company has not accepted any fixed deposit during the
year. During the year, seven deposits aggregating H 63,000/- lying
unclaimed with the Company were transferred to the Investor
Education and Protection Fund, pursuant to the relevant guidelines.
No deposit was outstanding or lying unclaimed with the Company, as
on March 31, 2014.
Auditors
Statutory Auditors of the Company, Deloitte Haskins & Sells LLP,
Chartered Accountants, retire at the conclusion of the forthcoming
Annual General Meeting. They will be completing 10 consecutive
years as Statutory Auditors of the Company. Pursuant to the
provisions of Section 139 of the Companies Act, 2013, read with
Rule 6 of the Companies (Audit and Auditors) Rules 2014, they will
be re-appointed for a period of two years from the conclusion of
the Thirty-Second Annual General Meeting till the conclusion of the
Thirty-Fourth Annual General Meeting. The Audit Committee and
the Board of Directors recommend their re-appointment as Statutory
Auditors of your Company.
Ernst & Young LLP, Mumbai, are the Internal Auditors of the Company.
Cost Auditors
Pursuant to the provisions of Section 233B of the Companies Act,
1956, in terms of General Circular No.15/2011 dated April 11, 2011
and with the approval of the Central Government, Mr. S. D. Shenoy
(Fellow Membership No.8318), practising Cost Accountant, was
appointed as Cost Auditor to conduct audit of cost records for the
year ended March 31, 2014. Cost Audit Report would be submitted
to the Central Government within the prescribed time.
Pursuant to Rule 5 of the Companies (Cost Audit Report) Rules, 2011,
the Cost Audit Report for Bulk Drugs and Formulations, for the year
ended March 31, 2013 was filed with the Central Government on
September 27, 2013, in the Extensible Business Reporting Language
(XBRL) mode.
Employees Stock Options
Pursuant to the provisions of the Securities and Exchange Board of
India (Employee Stock Option Scheme and Employee Stock Purchase
Scheme) Guidelines, 1999, the details of stock options granted by the
Company during the year are set out in Annexure ‘B’ forming part of
this Report.
Human Resources
Your Company was ranked 2nd amongst ‘India’s Best Companies to
Work for - 2013’ in the Biotech and Pharma Sector, by the ‘Great
Places to Work Institute®’ and ‘The Economic Times’, in their
annual cross-industry study called Best Companies to Work for.
The Company continues to be in the Top 2 for the third year in a
row. This recognition is a true testimony of superior people practices,
pride of the employees as also overall employee orientation.
The Company firmly believes that people are its most valued resource
and their efficiency plays a key role in achieving set goals and building
a competitive work environment. The Company regularly conducts
several programs across various levels which include development
programs and employee-friendly policies, in order to attract, retain
and develop best available talents.
Particulars of Employees
Particulars of employees required to be furnished pursuant to the
provisions of Section 217(2A) of the Companies Act, 1956 (Act),
read with Companies (Particulars of Employees) Amendment Rules,
2011, are given as an annexure to this Report. However, pursuant
to the provisions of Section 219(1)(b)(iv) of the Act, the Report and
Accounts are being sent to all the members excluding the aforesaid
Annexure. Members, who are interested in the information, may write
to the Company Secretary at the registered office of the Company.
Acknowledgements
Your Directors commend all employees of your Company for their
hard work, continued dedication, commitment and significant
contributions. Your Directors wish to express their gratitude to the
Central and State governments, members, analysts, banks, financial
institutions, business associates, customers, medical professionals,
distributors and suppliers, for their continued whole-hearted support.
For and on behalf of the Board of Directors
Dr. Desh Bandhu Gupta
Chairman
Mumbai, May 7, 2014
50 | Lupin Limited

anneXuRe ‘a’ totHe diRectoRs’ RepoRt
Pursuant to the Companies (Disclosure of Particulars in the Report of Board of Directors) Rules, 1988.
A. CONSERVATION OF ENERGY a) Energy conservation measures taken: i) Manufactured products by enzymatic route in
place of chemical route.
ii) Shifted load of reciprocating refrigeration compressor on screw compressor.
iii) Replaced certain operations like centrifuging with agitated nutsche filtration.
iv) Installed automatic solar light sensors for external street lighting.
v) Shifted load from chilled brine to chilled water.
vi) Replaced FTL lamps with energy saving T5 lamps.
vii) Utilised RO reject water in cooling tower thereby reducing water load on ETP.
viii) Replaced reciprocating compressor having high specific power consumption with screw compressor having low specific power consumption.
ix) Redesigned distillation column internals packing.
x) Installed condensing and IBR economizers for Boiler.
xi) Pre-heating the feed by using heat of in distillation columns.
xii) Converted chilling plant from design temperature
to operating temperature.
xiii) Installed lighting energy saving panel at OC Block.
b) Additional investments and proposals: i) AHU conversion from DX to chilled water system.
ii) Re-sizing of utility headers.
iii) Install energy efficient induction motors.
iv) Reduction of reflux ratio in distillation column by increasing stages.
v) Hot water generation by flash using steam.
vi) Install pressure reducing station at vaccum ejector.
c) Impact of measures in (a) & (b): i) Boiler efficiency improved.
ii) Reduced consumption of water, power and fuel resulting in lowering overall costs.
iii) Reduction in pumping energy cost.
iv) Optimal utilisation of resources resulted in overall efficiency improvement.
d) Total energy consumption and energy consumption per unit of production:
Details are given in Form A.
Annual Report 2014 | 51

FORM ‘A’(See Rule 2)
FORM FOR DISCLOSURE OF PARTICULARS WITH RESPECT TO CONSERVATION OF ENERGY
Year endedMarch 31, 2014
Year endedMarch 31, 2013
A. POWER & FUEL CONSUMPTION
1. Electricity
a) Purchased Units Thousand KWH 279386 256966
Total amount I in Mn. 1669 1652
Rate/unit (KWH) I 6.0 6.4
b) Own Generation
i) Through Diesel Generator (HSD)
Units Thousand KWH 6261 4996
Units per litre of diesel oil KWH 3.0 3.0
Cost/unit (KWH) I 16.2 15.1
ii) Through Generator (furnace oil)
Units Thousand KWH Nil 63
Units per litre of furnace oil KWH Nil 3.3
Cost/unit (KWH) I Nil 12.2
iii) Through Generator (gas)
Units Thousand KWH 165 8402
Units per M3 of Natural gas KWH 3.5 3.7
Cost/unit (KWH) I 13.5 9.0
2. Coal Nil Nil
3. Furnace oil (Boiler)
Quantity KL 11216 11947
Total amount I in Mn. 474.7 494.0
Rate/unit (KL) I 42328 41352
4. i) Natural gas
Quantity Cu. mts. 15227806 14871096
Total amount I in Mn. 527.6 432.4
Rate/unit (Cu. mt.) I 34.7 29.1
ii) Briquette (Boiler)
Quantity MT 7833.9 4557
Total amount I in Mn. 29.5 16.7
Rate/unit (MT) I 3.8 3.7
B. CONSUMPTION PER UNIT OF PRODUCTION: The Company manufactures APls and several drug formulations of different pack sizes. It is therefore, impractical to apportion
the consumption and cost of utilities to each product.
NOTE:There are no specific standards, as the consumption per unit depends upon the product mix. Variations in consumption are due to different product mix.
52 | Lupin Limited
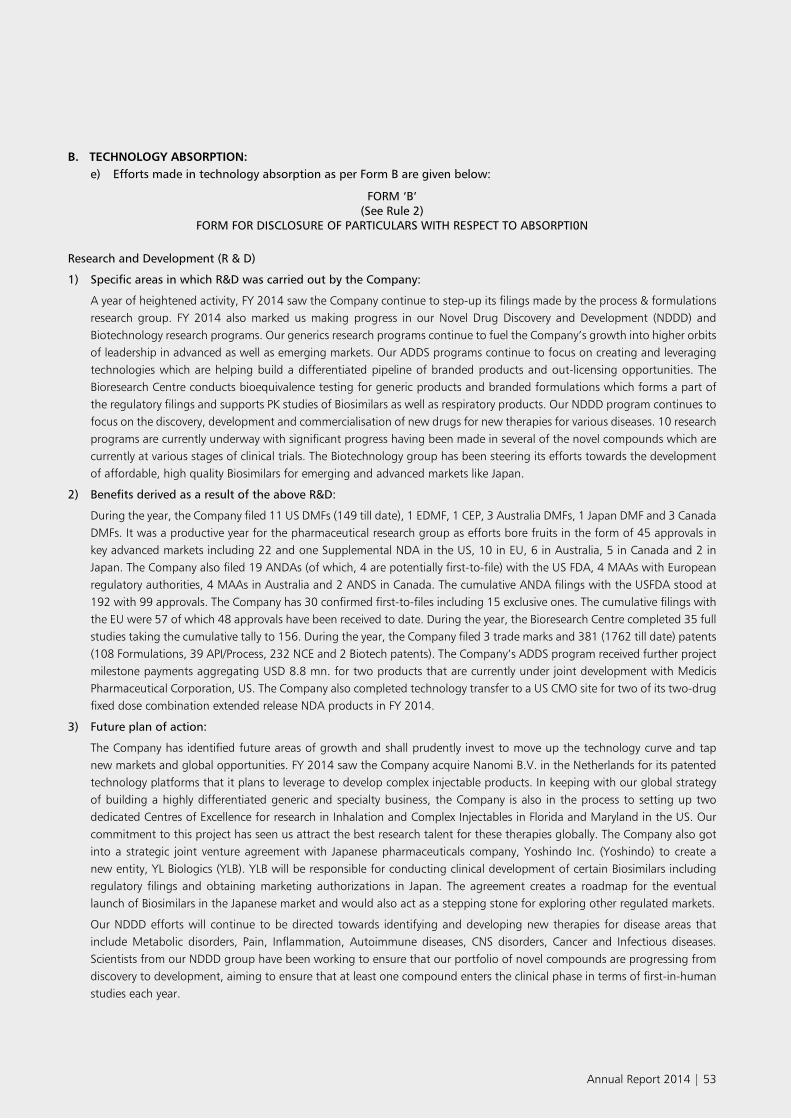
B. TECHNOLOGY ABSORPTION: e) Efforts made in technology absorption as per Form B are given below:
FORM ‘B’(See Rule 2)
FORM FOR DISCLOSURE OF PARTICULARS WITH RESPECT TO ABSORPTI0N
Research and Development (R & D)
1) Specific areas in which R&D was carried out by the Company:
A year of heightened activity, FY 2014 saw the Company continue to step-up its filings made by the process & formulations research group. FY 2014 also marked us making progress in our Novel Drug Discovery and Development (NDDD) and Biotechnology research programs. Our generics research programs continue to fuel the Company’s growth into higher orbits of leadership in advanced as well as emerging markets. Our ADDS programs continue to focus on creating and leveraging technologies which are helping build a differentiated pipeline of branded products and out-licensing opportunities. The Bioresearch Centre conducts bioequivalence testing for generic products and branded formulations which forms a part of the regulatory filings and supports PK studies of Biosimilars as well as respiratory products. Our NDDD program continues to focus on the discovery, development and commercialisation of new drugs for new therapies for various diseases. 10 research programs are currently underway with significant progress having been made in several of the novel compounds which are currently at various stages of clinical trials. The Biotechnology group has been steering its efforts towards the development of affordable, high quality Biosimilars for emerging and advanced markets like Japan.
2) Benefits derived as a result of the above R&D:
During the year, the Company filed 11 US DMFs (149 till date), 1 EDMF, 1 CEP, 3 Australia DMFs, 1 Japan DMF and 3 Canada DMFs. It was a productive year for the pharmaceutical research group as efforts bore fruits in the form of 45 approvals in key advanced markets including 22 and one Supplemental NDA in the US, 10 in EU, 6 in Australia, 5 in Canada and 2 in Japan. The Company also filed 19 ANDAs (of which, 4 are potentially first-to-file) with the US FDA, 4 MAAs with European regulatory authorities, 4 MAAs in Australia and 2 ANDS in Canada. The cumulative ANDA filings with the USFDA stood at 192 with 99 approvals. The Company has 30 confirmed first-to-files including 15 exclusive ones. The cumulative filings with the EU were 57 of which 48 approvals have been received to date. During the year, the Bioresearch Centre completed 35 full studies taking the cumulative tally to 156. During the year, the Company filed 3 trade marks and 381 (1762 till date) patents (108 Formulations, 39 API/Process, 232 NCE and 2 Biotech patents). The Company’s ADDS program received further project milestone payments aggregating USD 8.8 mn. for two products that are currently under joint development with Medicis Pharmaceutical Corporation, US. The Company also completed technology transfer to a US CMO site for two of its two-drug fixed dose combination extended release NDA products in FY 2014.
3) Future plan of action:
The Company has identified future areas of growth and shall prudently invest to move up the technology curve and tap new markets and global opportunities. FY 2014 saw the Company acquire Nanomi B.V. in the Netherlands for its patented technology platforms that it plans to leverage to develop complex injectable products. In keeping with our global strategy of building a highly differentiated generic and specialty business, the Company is also in the process to setting up two dedicated Centres of Excellence for research in Inhalation and Complex Injectables in Florida and Maryland in the US. Our commitment to this project has seen us attract the best research talent for these therapies globally. The Company also got into a strategic joint venture agreement with Japanese pharmaceuticals company, Yoshindo Inc. (Yoshindo) to create a new entity, YL Biologics (YLB). YLB will be responsible for conducting clinical development of certain Biosimilars including regulatory filings and obtaining marketing authorizations in Japan. The agreement creates a roadmap for the eventual launch of Biosimilars in the Japanese market and would also act as a stepping stone for exploring other regulated markets.
Our NDDD efforts will continue to be directed towards identifying and developing new therapies for disease areas that include Metabolic disorders, Pain, Inflammation, Autoimmune diseases, CNS disorders, Cancer and Infectious diseases. Scientists from our NDDD group have been working to ensure that our portfolio of novel compounds are progressing from discovery to development, aiming to ensure that at least one compound enters the clinical phase in terms of first-in-human studies each year.
Annual Report 2014 | 53

4) Expenditure on R&D (Consolidated):
a. Capital H 635.1 Mn.
b. Recurring (excluding depreciation of H 346.4 Mn.) H 8947.7 Mn.
c. Total H 9582.8 Mn.
d. Total R&D expenditure as a percentage of net sales 8.6%
Technology absorption, adaptation and innovation:
i) Efforts in brief, made towards technology absorption, adaptation and innovation:
One of the key reasons why the Company continues to witness sustained growth across markets has been the collaborative framework that it operates within globally; where the core business and strategy groups work in tandem with the regulatory, research, technical operations and intellectual property groups for creating the business strategy behind building a quality product pipeline.
ii) Benefits derived as a result of the above efforts:
The Company continues to witness high and sustained growth across all its businesses; growth that has been achieved on the back of a robust research foundation that continues to deliver innovative quality products that has made us the 3rd largest Indian pharmaceutical company by revenues and the 10th largest generic pharmaceutical company globally by revenues (Bloomberg, June - 2014). The Company continues to be the 5th largest and fastest growing generics player in the US (5.2% market share by prescriptions, IMS Health) and also continues to be amongst the fastest growing top 10 generic pharmaceutical player in markets like Japan and South Africa (IMS).
The Company continues to build on it leadership and market presence in the Cardiovascular, Diabetology, Asthma, Pediatric, CNS, GI, Anti-Infective and NSAID space in addition to being the global leaders in the Anti-TB and Cephalosporin segments.
iii) Imported technology:
During the year, the Company did not import any specific technology. The Company developed technology through efforts of its in-house Research and Development.
C. FOREIGN EXCHANGE EARNINGS AND OUTGO:
f) Information regarding exports activities and related matters is covered elsewhere in this Annual Report.
g) Earnings in foreign exchange was equivalent to H 60055.9 Mn. and expenditure H 16051 Mn.
For and on behalf of the Board of Directors
Dr. Desh Bandhu Gupta
Chairman
Mumbai, May 7, 2014
54 | Lupin Limited

anneXuRe ‘B’ totHe diRectoRs’ RepoRtDETAILS OF STOCK OPTIONS AS ON MARCH 31, 2014
In terms of Clause 12.1 of the Securities and Exchange Board of India (Employee Stock Option Scheme and Employee Stock Purchase Scheme) Guidelines, 1999, the particulars of options as on March 31, 2014 are as under:
No. Description Detailsa) Options granted during the year Plan No. of options
ESOP 2003ESOP 2011 SESOP 2011
50000946250185090
Total: 1181340b) The pricing formula • Exercisepricefor1131340optionsisthemarketpriceoftheshare,asdefined
under the SEBI Guidelines. • Exercisepricefor50000optionsis50%ofthemarketpriceoftheshare,as
defined under the SEBI Guidelines.c) Options vested during the year Plan No. of options
ESOP 2003ESOP 2005SESOP 2005ESOP 2011 SESOP 2011
238000209875129039541151
70542Total: 1188607
d) Options exercised during the year Plan No. of optionsESOP 2003ESOP 2005SESOP 2005ESOP 2011 SESOP 2011
274226252516
65986248696
4887Total: 846311
e) Total number of shares arising as result of exercise of options
Plan No. of optionsESOP 2003ESOP 2005SESOP 2005ESOP 2011 SESOP 2011
274226252516
65986248696
4887Total: 846311
f) Options lapsed during the year Lapsed on account of resignation of employees:Plan No. of optionsESOP 2005ESOP 2011 SESOP 2011
4875219062
57950Total: 281887
g) Variation of terms of options There has been no variation in terms of the options granted during the year, from those approved by the shareholders.
Annual Report 2014 | 55

h) Money realised by exercise of options Plan Amount (I)ESOP 2003ESOP 2005SESOP 2005ESOP 2011 SESOP 2011
62785553.9343142854.4514373730.38
116894468.702273708.15
Total: 239470315.61i) Total no. of options in force Plan No. of options
ESOP 2003ESOP 2005SESOP 2005ESOP 2011 SESOP 2011
539389494529364133
2737539429033
Total: 4564623j) Employee-wise details of options
granted to: -i. Senior Managerial Personnel No. of options Plan
Dr. Kamal K. Sharma 50000 ESOP 2003ii. Employees to whom options
granted amounting to 5% or more, of the total options granted during the year
Nil
iii. Employees to whom options equal to or exceeding 1% of the issued capital have been granted during the year
Nil
k) Diluted earnings per share (EPS) pursuant to issue of shares on exercise of options during the year and ESOPs outstanding as on 31.03.2014, calculated in accordance with Accounting Standard (AS) 20 ‘Earnings per share’
Diluted earnings per share as on 31.03.2014 - H 51.62ESOPs outstanding as on 31.03.2014 - 4564623 shares
l) Where the company has calculated the employee compensation cost using the intrinsic value of the stock options, the difference between the employee compensation cost so computed and the employee compensation cost that shall have been recognized if it had used the fair value of the options, shall be disclosed. The impact of this difference on profits and on EPS of the company shall also be disclosed
Net Income would be lower by - H 291.5 millionAdjusted EPS:Standalone- Basic : H 51.23- Diluted : H 50.97Consolidated- Basic : H 40.34- Diluted : H 40.14
56 | Lupin Limited

m) Weighted average exercise prices and weighted average fair values of options disclosed separately for options whose exercise price either equals or exceeds or is less than the market price of the stock
(i) Weighted average exercise price of options granted during the year whose: - a. Exercise price equals market price : H 867.03 b. Exercise price is greater than market price : N.A. c. Exercise price is less than the market price : H 439.43 (ii) Weighted average fair value of options granted during the year whose: - a. Exercise price equals market price : H 399.10 b. Exercise price is greater than market price : N.A. c. Exercise price is less than the market price : H 597.22
n) Description of the method and significant assumptions used during the year to estimate the fair values of the options, including the following weighted average information:• FairvaluecalculatedbyusingBlack-Scholesoptionpricingmodel.
• Stockprice:TheclosingpriceonNSEasonthedateofgranthasbeenconsideredforvaluingtheoptionsgranted.
• ExpectedVolatility:Thehistoricalvolatilityofthestocktillthedateofgranthasbeenconsideredtocalculatethefairvalue of the options.
• Riskfreeinterestrate:Theriskfreeinterestrateonthedateofgrantconsideredforthecalculationistheinterestrateapplicable for a maturity equal to the expected life of the options based on the zero coupon yield curve for Government Securities.
• TimetoMaturity/ExpectedLife:TimetoMaturity/ExpectedLifeofoptionistheperiodforwhichtheCompanyexpectsthe options to be live. The minimum life of a stock option is the minimum period before which the options cannot be exercised and the maximum life is the period after which the options cannot be exercised.
• Expecteddividendyield:Expecteddividendyieldhasbeencalculatedasanaverageofdividendyields for the fourfinancial years preceding the date of the grant.
Variables Weighted Average InformationPlan ESOP 2003 ESOP 2011 ESOP 2011 SESOP 2011 SESOP 2011 SESOP 2011 SESOP 2011 SESOP 2011Grant date 07.10.13 26.07.13 13.11.13 02.08.13 13.08.13 13.11.13 27.12.13 14.02.14Risk free rate (%) 8.62 8.44 8.88 8.52 8.41 8.88 9.02 9.02Expected life (years) 5.50 6.25 6.25 6.25 6.25 6.25 6.25 6.25Volatility (%) 32.39 32.62 32.48 32.60 32.71 32.48 32.19 31.92Dividend yield (%) 0.72 0.72 0.72 0.72 0.72 0.72 0.72 0.72Stock price (NSE closing rate) H
895.25 854.85 874.70 890.95 838.80 874.70 906.10 901.35
Option Fair Value I 597.22 394.53 415.00 421.96 396.75 415.00 430.26 429.57
ESOP 2003 - Lupin Employees Stock Option Plan 2003ESOP 2005 - Lupin Employees Stock Option Plan 2005SESOP 2005 - Lupin Subsidiary Companies Employees Stock Option Plan 2005ESOP 2011 - Lupin Employees Stock Option Plan 2011SESOP 2011 - Lupin Subsidiary Companies Employees Stock Option Plan 2011
For and on behalf of the Board of Directors
Dr. Desh Bandhu Gupta
Chairman
Mumbai, May 7, 2014
Annual Report 2014 | 57

coRpoRate GoveRnance RepoRt
[1] Company’s Philosophy on Corporate Governance: Your Company is firmly committed to good corporate
governance which underpins its success and integrity. The Company adheres to the highest standards of ethical, moral and legal conduct of its business operations. Your Company strongly believes that adopting the best global governance practices is the key to build sustainable and efficient business environment. Strong leadership together with good corporate governance practices has been the Company’s hallmark. The corporate governance philosophy is aimed at achieving complete transparency and accountability towards its stakeholders and assisting the top management in taking sound business decisions. The Company’s legacies of professionalism, fairness and trusteeship have been the guiding pillars which have enhanced shareholder value.
The Company believes that good governance is a continuous process and is committed to pursue the highest standards of corporate governance across all geographies. The Company is of the firm view that active, independent and well informed Board is integral to attain the highest standards of governance. The Board has an optimum mix of executive and independent non-executive directors who are well experienced, competent and highly respected persons in their chosen fields.
The Board is committed to evolve and adopt the best practices of Corporate Governance on an on-going basis.
All mandatory requirements and a few non-mandatory requirements prescribed by Clause 49 of the Listing Agreement, such as formation of ‘Remuneration Committee’ and ‘Whistle Blower Policy’ have been implemented by the Company. The Codes of Conduct adopted by the directors and senior management personnel are posted on the website of the Company (www.lupinworld.com). All Board members and senior management personnel have affirmed compliance with the respective Codes of Conduct for the year ended March 31, 2014. In terms of Clause 49(I)(D) of the Listing Agreement, the Managing Director has given the requisite declaration to this effect. The Company continues to be in the regime of unqualified financial statements and there was no audit qualification in its financial statements for the year ended March 31, 2014.
The Company promotes a culture of free speech and intolerance of corrupt and immoral practices. Employees are encouraged to come forward and express their concerns about suspected misconduct without fear of punishment or unfair treatment. The Company has instituted PLEDGE (Preparing Lupin Employees to Demonstrate Corporate Governance and Ethical Conduct), an initiative encompassing three important policies namely, Code of Conduct, Whistle Blower Policy and Prevention of Workplace Harassment. Employees are free to raise their concerns and report any potential violations of Company policies or Code of Conduct to the office of the Ombudsperson, easily and free of any fear of retaliation or retribution. During the year, the Office of the Ombudsperson received about 25 complaints, all of which were investigated and satisfactorily resolved.
Sound systems of internal checks and balances are in place which are regularly evaluated and updated. ‘Kavach’, an information security initiative, was successfully implemented to address various security concerns and create awareness. It broadly encompasses evaluating security risks, protecting assets and ensuring compliances on a continuing basis. An initiative in ‘Business Continuity’ was embarked upon with an aim to setup
a preventive mechanism to address the gaps that may delay the recovery of processes in case of any incidents. This initiative would help the Company sustain the competitive edge in current and future business environment. Comprehensive risk management policy is in place across the Company, wherein key risk elements are discussed at top management meetings for taking remedial actions; rated and accessed in terms of their probability and its consequence on the Company’s business. The system monitors risks, ensures compliance with all the applicable laws and efficiency and effectiveness in operations. With a view to identify risks, the Company organises workshops and interactive sessions as also interviews at various levels across different locations.
A detailed Management Discussion and Analysis report forms part of this Annual Report.
58 | Lupin Limited

[2] Board of Directors: The strength of the Board as on March 31, 2014 was ten, of which, four are executive promoter-directors, one an executive
director and five are independent directors which is in conformity with Clause 49(I)(A)(ii) of the Listing Agreement. The requisite particulars are given below: -
Sl. No.
Name of the director Whether Promoter/ Executive/
Independent
No. of BoardMeetings during
the year
Attendanceat the last
AGM
Number ofdirectorships
of othercompanies
Member/Chairman of committees
other than the Company
Held Attended
1. Dr. Desh Bandhu Gupta, Chairman P. & E.D. 5 5 Yes 10 -
2. Dr. Kamal K. Sharma, Vice Chairman E.D. 5 4 Yes 7 -
3. Ms. Vinita Gupta, Chief Executive Officer P. & E.D. 5 5 Yes 4 -
4. Mr. Nilesh Gupta, Managing Director P. & E.D. 5 5 Yes 7 -
5. Mrs. M. D. Gupta, Executive Director P. & E.D. 5 4 Yes 11 -
6. Dr. Vijay Kelkar I. N-E.D. 5 5 Yes 9 3/-
7. Mr. Richard Zahn I. N-E.D. 5 4 Yes 1 -
8. Mr. R. A. Shah I. N-E.D. 5 5 Yes 18 9/4
9. Dr. K. U. Mada I. N-E.D. 5 5 Yes 3 5/2
10. Mr. Dileep C. Choksi I. N-E.D. 5 4 Yes 10 7/2
Notes:
(a) P. & E.D.: Promoter & Executive Director; E.D.: Executive Director; I. N-E.D.: Independent Non-Executive Director. (b) In the case of Mr. R. A. Shah, directorships include a foreign company and four Alternate directorships of public limited
companies. (c) Mrs. M. D. Gupta is the wife of Dr. Desh Bandhu Gupta, Ms. Vinita Gupta their daughter and Mr. Nilesh Gupta their son. (d) Membership/Chairmanship of Committees includes only those of the Audit Committee and the Investors’ Grievances
Committee. (e) The appointment of Mr. Dileep C. Choksi as a Director was approved by the members at the Annual General Meeting
held on August 7, 2013.
Board Meetings The Board of Directors is entrusted with the ultimate
responsibility of management, provide direction and guidance to the management and evaluate the effectiveness of management policies in achieving the set goals. The Board plays a vital role in overseeing how the management serves the long term objective of enhancing stakeholders’ value. While the Board is regularly apprised of important business-related information and developments, detailed presentations are made by key management personnel and business heads on important matters. Board Members express opinions and bring up matters for discussions at the meetings. Board meeting dates are finalised in consultation with all directors and agenda papers backed up by comprehensive notes are circulated in advance which enables the Board to take informed decisions and discharge its functions efficiently.
Board Meeting Minutes are circulated to all the Directors in advance and confirmed at the subsequent meeting. Copies of signed minutes of various Committees of the Board, minutes of Board meetings of subsidiaries as also Compliance Report in respect of various laws applicable to the Company are tabled at Board meetings.
Details of Board Meetings In compliance with the provisions of Clause 49 of the
Listing Agreement, Board meetings are held at least four times a year and the time-gap between two meetings is not more than four months. During the year, five Board meetings were held on May 8, 2013, August 7, 2013, October 30, 2013, January 3, 2014 and February 3, 2014. The Board also passed by circulation three resolutions dated June 20, 2013, September 18, 2013 and September 26, 2013.
Annual Report 2014 | 59

Remuneration to Executive Directors
Remuneration during 2013-14 (I million)Particulars Dr. Desh Bandhu Gupta,
Chairman Dr. Kamal K. Sharma,
Vice Chairman Mr. Nilesh Gupta, Managing Director
Mrs. M. D. Gupta, Executive Director
Fixed Component:Salary 31.80 60.22 34.85 3.60Benefits / Allowances 11.37 3.38 1.23 0.61Provident Fund / Superannuation 4.86 12.01 7.09 0.97Variable Component:Performance-Linked Incentive - 29.65 17.50 -Commission [Note (b)] 323.50 - - -Stock Options - 29.44 - -Total: 371.53 134.70 60.67 5.18
Notes: (a) Dr. Desh Bandhu Gupta, Chairman, Dr. Kamal K. Sharma,
Vice Chairman, Mr. Nilesh Gupta, Managing Director and Mrs. M. D. Gupta, Executive Director are in whole-time employment of the Company and their employment is contractual in nature. Ms. Vinita Gupta, who was appointed as Chief Executive Officer of the Company w.e.f. September 1, 2013, is an Executive Director but not in whole-time employment of the Company. She is an employee of Lupin GmbH, Switzerland, a wholly-owned subsidiary of Lupin Atlantis Holdings SA, Switzerland.
Ms. Vinita renders management services to the Company in terms of the Services Agreement between the Company and Lupin GmbH, effective January 1, 2014. No amount is charged to the Company for the year in respect of her services pending approval of the same from the Reserve Bank of India, which has been received subsequent to the year end. The appointments of Dr. Kamal K. Sharma, Ms. Vinita Gupta and Mr. Nilesh Gupta were
approved by the members by postal ballot, the results of which were announced on September 27, 2013. While
Dr. Desh Bandhu Gupta and Mrs. M. D. Gupta hold office up to December 31, 2015, Dr. Sharma holds office up to September 28, 2015 and Mr. Nilesh Gupta up to August 31, 2018.
(b) Dr. Desh Bandhu Gupta is entitled to a commission @ 1% of the net profit, calculated in accordance with the
provisions of Sections 349 and 350 of the Companies Act, 1956 which would be paid after the members approve the audited accounts for the year ended March 31, 2014, at the forthcoming Annual General Meeting.
(c) On October 7, 2013, 50,000 stock options were granted to Dr. Kamal K. Sharma at an exercise price of H 439.43 (being 50% of the market price) under the ‘Lupin Employees Stock Option Plan 2003’. The vesting period of the options is 12 months and the same are exercisable within ten years from the date of the grant.
Note: The members vide a Special Resolution by postal ballot, the result of which was announced on December 21, 2010, approved payment of commission to the non-executive directors, not exceeding in the aggregate 0.5% p.a. of the Company’s net profit, computed in the manner laid down by the provisions of Sections 198, 349 and 350 and other applicable provisions, if any, of the Companies Act, 1956,
for a period of five years commencing from April 1, 2010.The Board is authorised to decide upon the eligibility criteria and the quantum of commission payable to each non-executive director. An amount of H 14.07 million has been provided towards commission payable to non-executive directors for the year 2013-14 which would be paid after the members approve the audited accounts for the year ended March 31, 2014, at the forthcoming Annual General Meeting.
Remuneration to Non - Executive Directors
Sl. No.
Name of the director No. of equity shares held as on March 31, 2014
Remuneration during 2013-14 (I million)Sitting fees Commission [See Note ] Total
1. Ms. Vinita Gupta (up to August 31, 2013) 51600 0.04 - 0.042. Dr. Vijay Kelkar Nil 0.14 3.00 3.143. Mr. Richard Zahn Nil 0.08 3.07 3.154. Mr. R. A. Shah 15000 0.12 3.00 3.125. Dr. K. U. Mada 3500 0.35 2.50 2.856. Mr. Dileep C. Choksi Nil 0.22 2.50 2.72
Total: 0.95 14.07 15.02
60 | Lupin Limited

Dr. Kamal K. SharmaDr. Kamal K. Sharma is a chemical engineer from the Indian Institute of Technology (lIT), Kanpur with a post-graduate diploma in industrial management from the Jamnalal Bajaj Institute of Management Studies, Mumbai and a Ph.D. in Economics from lIT, Mumbai. He has also completed an advanced management programme from Harvard Business School, Boston. Dr. Sharma has vast industry experience spanning over four decades and has held a range of senior
management positions in the fields of projects, operations, corporate development and general management in pharma and chemical industries.
The Board at its meeting held on May 8, 2013 elevated him as Vice Chairman w.e.f. September 1, 2013. The members vide Postal Ballot, the result of which was announced on September 27, 2013, approved the terms of appointment of Dr. Sharma as the Vice Chairman.
Dr. Vijay KelkarDr. Vijay Kelkar is a Ph.D. from the University of California at Berkeley, M.S. from the University of Minnesota and B.S. from Pune University. He held senior positions in the Government of India and was Chairman/Member of several high-powered committees, councils, task forces, working groups, set up by different ministries and departments of the Government of India. Dr. Kelkar had delivered lectures at the Universities of California, Pennsylvania, Vanderbilt, Harvard and Cornell in the US and was visiting Professor at
the South Asia Institute, Heidelberg University, West Germany and Center for Economic Development and Administration, Government of Nepal. He was a senior faculty member of the Administrative Staff College of India, Hyderabad and Instructor - Microeconomics, University of California, U.S.A. Dr. Kelkar has authored many books, publications and journals on micro and macroeconomics, reforms of union public sector, emerging challenges and on trade policies. In 2011, Dr. Kelkar was conferred ‘Padma Vibhushan’ for his distinguished and exemplary service to the nation.
Mr. Richard ZahnMr. Richard Zahn is a B. S. (Business Administration) with Honors, Kansas State Teachers College, Kansas. He has completed Executive Education with Amos Tuck School, Dartmouth University, Harvard/MIT Program on Negotiation, The Wharton School, University of Pennsylvania, National Association of Corporate Directors - Certificate of Director
Education. Mr. Zahn has also completed program in Executive Leadership, Cornell University.
Mr. Richard is the Managing Partner of HMJ Global Partners, a corporate governance and not-for-profit public policy advisory group. With more than 30 years of experience in the biotechnology and pharmaceutical industries, he is an established leader and strategist in healthcare research and
Brief profiles, other directorships and committee memberships etc. of directors seeking appointment/re-appointment at the 32nd Annual General Meeting: -
List of other directorships Chairman/Member of the Committees of the board of the companies on which he is a director
Kyowa Pharmaceutical Industry Co., Ltd., Japan, DirectorGeneric Health Pty Ltd., Australia, DirectorPharma Dynamics (Proprietary) Ltd., South Africa, DirectorLupin GmbH, Switzerland, DirectorLupin Healthcare Ltd., DirectorFaisa Financial Pvt. Ltd., DirectorTempletree Properties Pvt. Ltd., Director
-
List of other directorships Chairman/Member of the Committees of the Board of the companies on which he is a director
Green Infra Ltd., ChairmanCSIR - Tech Pvt. Ltd., ChairmanTata Consultancy Services Ltd., DirectorTata Chemicals Ltd., DirectorJSW Steel Ltd., Director J. M. Financial Ltd., Director Indian Institute for Human Settlements, DirectorBritannia Industries Ltd., DirectorGo Airlines (India) Ltd., Director
J. M. Financial Ltd., Member of Audit Committee and Investors’ Grievances Committee. Tata Consultancy Services Ltd., Member of Audit Committee.
Annual Report 2014 | 61
development, marketing management, managed care, and human resources. He is widely recognised as an insightful speaker on economic and policy issues.
Mr. Richard was President of Schering Laboratories, U.S., Director, Schering Corporation and Corporate Vice President of Schering-Plough Corporation, a global research-based company engaged in the discovery, development,
manufacturing and marketing of pharmaceutical, biotechnology and healthcare prescription pharmaceutical marketing arm for Schering-Plough. Mr. Richard spent 20 years at Johnson & Johnson. Mr. Richard has focused his efforts on rural economic development and public policy. He has received several awards for his devoted work towards various organisations and charities with particular focus on health care and minority issues.
Dr. K. U. MadaDr. K. U. Mada is an eminent economist and was a development banker. He holds a Ph.D. (Economics) degree from Bombay University and a certificate in financial management from Jamnalal Bajaj Institute, Mumbai. He taught Economics at Jai Hind College, Mumbai, for seven years. Thereafter, he worked for the Reserve Bank of India and Industrial Development Bank of India (IDBI) and held senior positions, including as Executive Director, IDBI, and a stint as chief of a bank. Dr. Mada was Chairman/Member of several committees constituted by
lDBI/other financial institutions and the Government of India. He brought out books, including ‘A Journey through Development Banking (2005)’ and published articles in well-known journals. He represented lDBI as Speaker/participant at several national and international conferences/seminars on economic, corporate and institutional affairs. He was a visiting faculty at management institutes. Dr. Mada was on the boards of corporate entities and all-India financial institutions, including the Management Development Institute, Gurgaon.
Mr. R. A. ShahMr. R. A. Shah is an eminent Solicitor and senior partner of M/s. Crawford Bayley & Company, a leading firm of Solicitors and Advocates in Mumbai. He specialises in a broad spectrum of Corporate Laws in general, with special focus on foreign investments, joint ventures, technology and
license agreements, intellectual property rights, mergers and acquisitions, competition law and insider trading regulations. Mr. Shah is a member of the Managing Committee of Bombay Chamber of Commerce and Indo German Chamber of Commerce.
List of other directorships Chairman/member of the Committees of the board of the companies on which he is a director
Metagenics Private Limited, Director -
List of other directorships Chairman/Member of the Committees of the Board of the companies on which he is a director
Godfrey Phillips India Ltd., ChairmanPfizer Ltd., ChairmanClariant Chemicals (India) Ltd., ChairmanProcter & Gamble Hygiene and Healthcare Ltd., ChairmanColgate Palmolive India Ltd., Vice-ChairmanAbbott India Ltd., DirectorAsian Paints Ltd., DirectorThe Bombay Dyeing & Mfg. Co. Ltd., DirectorBASF India Ltd., DirectorDeepak Fertilisers & Petrochemicals Corporation Ltd., DirectorJumbo World Holdings Ltd.(Foreign Company), DirectorWockhardt Ltd., DirectorCentury Enka Ltd., DirectorAtul Ltd., DirectorModicare Ltd., Alternate DirectorRPG Life Sciences Ltd., Alternate DirectorSchrader Duncan Ltd., Alternate DirectorUhde India Pvt. Ltd., Alternate Director
Pfizer Ltd., Chairman of Audit CommitteeColgate Palmolive India Ltd., Chairman of Audit Committee. Clariant Chemicals (India) Ltd., Chairman of Audit Committee Procter & Gamble Hygiene and Healthcare Ltd., Chairman of Audit Committee.BASF India Ltd., Member of Audit Committee. The Bombay Dyeing & Mfg. Co. Ltd., Member of Audit Committee.Abbott India Ltd., Member of Audit Committee. Century Enka Ltd., Member of Audit Committee. Wockhardt Ltd., Member of Audit Committee.
62 | Lupin Limited
Mr. Dileep C. ChoksiMr. Dileep C. Choksi is a leading Chartered Accountant, qualified lawyer and a Cost Accountant with over 35 years of experience. His areas of specialisation include tax planning and structuring for domestic and international clients, including expatriates, finalising collaborations and joint ventures, executive advisory and decision support, corporate
restructuring with a focus on start-ups, turnaround and change management strategies and analysing tax impact of various instruments. Mr. Choksi advises some of India’s large business houses on various strategic matters and multinational clients on cross border structuring. He has set up C. C. Chokshi Advisors Pvt. Ltd., the activities of which aim to provide complete solutions for all business requirements.
[3] Audit Committee: The Audit Committee comprises Dr. K. U. Mada, Chairman
and Mr. Dileep C. Choksi, independent directors, and Dr. Kamal K. Sharma, Vice Chairman. Mr. R. V. Satam, Company Secretary & Compliance Officer, acts as the Secretary of the Committee. Dr. Mada is an eminent economist and development banker and Mr. Choksi is a leading Chartered Accountant. All members of the Committee are financially literate. The Chairman of the Committee attended the last Annual General Meeting of the members held on August 7, 2013. The meetings of the Audit Committee are attended by the Chief Financial Officer, President - Finance, representatives of accounts, and statutory, internal and cost auditors. The Committee acts as a link between statutory auditors, internal auditors, cost auditors and the Board. The Audit Committee addresses matters pertaining to the appropriateness of audit test checks, reliability of financial statements, adequacy of provisions for liabilities and internal controls. The Committee lays emphasis on adequate disclosures and compliance with all relevant statutes.
The Committee performs the functions enumerated in Clause 49 of the Listing Agreement and Section 292A of
the Companies Act, 1956. The matters deliberated upon and reviewed by the Committee inter alia include: -
1) Oversight of the Company’s financial reporting process and the disclosure of its financial information to ensure that the financial statements are correct, sufficient and credible.
2) Recommending to the Board, the appointment of statutory auditors, fixation of audit fees and approval of payments for any other services rendered by them.
3) Reviewing with the management the quarterly and annual financial statements before submission to the Board for approval with particular reference to: -
a) matters required to be included in the Directors’ Responsibility Statement included in the Board’s Report in terms of Clause (2AA) of Section 217 of the Companies Act, 1956;
b) changes, if any, in accounting policies and practices and reasons therefor;
c) major accounting entries involving estimates based on the exercise of judgment by management;
List of other directorships Chairman/Member of the Committees of the Board of the companies on which he is a director
Hotel Leelaventure Ltd., DirectorTamilnadu Petroproducts Ltd., DirectorP.C.I. Ltd., Director
Hotel Leelaventure Ltd., Member Audit Committee and Chairman of the Investors’ Grievances CommitteeTamilnadu Petroproducts Ltd., Member of the Audit CommitteeP.C.I. Ltd., Member Audit Committee and Chairman of the Investors’ Grievances Committee
List of other directorships Chairman/Member of the Committees of the Board of the companies on which he is a director
ICICI Lombard General Insurance Company Limited, DirectorICICI Home Finance Company Limited, DirectorAce Derivatives and Commodity Exchange Limited, DirectorDatamatics Global Services Limited, Director Mafatlal Cipherspace Private Limited, DirectorICICI Bank Limited, DirectorNational Securities Clearing Corporation Limited, DirectorHexaware Technologies Limited, DirectorIncube Ventures Private Limited, Additional DirectorAIA Engineering Limited, Additional Director
ICICI Lombard General Insurance Company Limited,Chairman of Audit Committee. ICICI Home Finance Company Limited, Member of Audit Committee. Ace Derivatives and Commodity Exchange Limited, Member of Audit Committee. ICICI Bank Limited, Member of Audit Committee.Hexaware Technologies Limited, Chairman of Audit Committee and Member of Investors’ Grievances Committee. AIA Engineering Limited, Member of Audit Committee.
Annual Report 2014 | 63

d) significant adjustments made in the financial statements arising out of audit findings, if any;
e) compliance with listing and other legal requirements relating to financial statements;
f) disclosure of related party transactions; and
g) qualifications in the draft audit report, if any.
4) Reviewing the financial statements of subsidiary companies as also the consolidated financial statements, including investments made by the subsidiary companies.
5) Reviewing with the management, the performance of statutory and internal auditors and adequacy of the internal control systems.
6) Reviewing the adequacy of internal audit function, including the structure of the internal audit department, its staffing, reporting structure, coverage and frequency of audits.
7) Discussion with the internal auditors on their significant findings and follow-up thereon.
8) Reviewing the findings of internal auditors and reporting them to the Board.
9) Discussion with statutory auditors before the audit commences as to the nature and scope of audit
as also post-audit discussion to ascertain areas of concern.
10) Looking into the reasons for any defaults in the payment to depositors, debenture holders, members (in case of non-payment of declared dividends) and creditors.
11) Review the functioning of the Whistle Blower mechanism.
12) Review and discuss with the management the status and implications of major legal cases.
13) Recommend to the Board, the appointment of a Cost Accountant within the meaning of the Cost
& Works Accountants Act, 1959 to conduct audit of cost records of the Company in compliance with the provisions of the Companies Act, 1956 and rules made thereunder and
14) Carrying out such other functions as may be mentioned in the terms of reference of the Audit Committee.
In addition to the above, the Committee reviews the management discussion and analysis, statements of significant related party transactions, management letters etc.
[4] Investors’ Grievances Committee: The Investors’ Grievances Committee consists of
independent directors Dr. Vijay Kelkar, Chairman and Dr. K. U. Mada, a member. Mr. R. V. Satam, Company Secretary & Compliance Officer, acts as the Secretary of the Committee. Meetings of the Investors’ Grievances Committee are also attended by the President - Finance and head of Investors’ Services Department.
The Committee oversees multifaceted activities of the Investors’ Services Department viz. transfer of shares in physical form, implementation of employee stock options
plans, dividend disbursement, depository operations and compliances of regulatory provisions etc. to ensure that the highest standards of service levels are maintained.
The Committee also evaluates investor grievances redressal system of the Department.
During the year, 47 investors grievances were received and all of them have been resolved. No shareholder complaint was pending at the beginning and at the end of the year. The company has acted upon all valid requests for share transfer received during the year and no such transfer remained pending for over 15 days.
Details of Audit Committee MeetingsDuring the year, seven meetings of the Audit Committee were held on May 8, 2013, August 7, 2013, September 25, 2013, October 30, 2013, December 24, 2013, February 3, 2014 and March 11, 2014 and the attendance was as follows: -
Sl. No. Name of the director No. of MeetingsHeld Attended
a. Dr. K. U. Mada, Chairman 7 7b. Dr. Kamal K. Sharma 7 2c. Mr. Dileep C. Choksi 7 7
64 | Lupin Limited
[5] Remuneration Committee: The Remuneration Committee comprises Dr. K. U. Mada,
Chairman and Mr. R. A. Shah, independent directors. Mr. R. V. Satam, Company Secretary & Compliance
Officer, is the Secretary of the Committee. The Committee performs functions enumerated in Clause 49 of the Listing Agreement and Schedule XIII of the Companies Act, 1956. The Committee reviews as well as recommends to the Board, the remuneration payable to executive directors. The Committee recommends the remuneration package
after considering factors, such as experience, expertise, position, responsibilities shouldered by the individual, leadership qualities, the volume of Company’s business and profits earned by it. The Company has formulated employees’ stock options plans to attract, reward and retain talented and qualified personnel and create a sense of belonging among them. The Company follows a market-linked remuneration policy. The Committee approves grant of stock options to employees of the Company and its subsidiaries.
Details of Investors’ Grievances Committee MeetingsDuring the year, two meetings of the Investors’ Grievances Committee were held on September 26, 2013 and March 11, 2014 and the attendance was as under: -
Details of the Remuneration Committee MeetingsDuring the year, two meetings of the Remuneration Committee were held on July 26, 2013 and August 7, 2013 and the attendance was as under: -
Sl. No. Name of the director No. of MeetingsHeld Attended
a. Dr. Vijay Kelkar, Chairman 2 2b. Dr. K. U. Mada 2 2
Sl. No. Name of the director No. of MeetingsHeld Attended
a. Dr. K. U. Mada, Chairman 2 2b. Mr. R. A. Shah 2 2
The Committee passed by circulation six resolutions dated August 2, 2013, August 13, 2013, October 7, 2013, December 27, 2013, January 20, 2014 and February 14, 2014.
[6] General Body Meetings: Details of the last three Annual General Meetings: -
Year Day, Date and Time Location No. of Special Resolutions passed
2010 - 11 Wednesday, July 27, 2011 at 2.30 p.m. Rang Sharda Natyamandir, Bandra Reclamation,Bandra (West), Mumbai - 400 050
-
2011 - 12 Tuesday, July 24, 2012 at 2.30 p.m. Rang Sharda Natyamandir, Bandra Reclamation,Bandra (West), Mumbai - 400 050
-
2012 - 13 Wednesday, August 7, 2013 at 2.30 p.m. Rang Sharda Natyamandir, Bandra Reclamation,Bandra (West), Mumbai - 400 050
OneSpecial Resolution
for raising the investment limit of FIIs in the equity
share capital of the Company from 33%
to 49%.
Annual Report 2014 | 65

No business was required to be transacted through postal ballot at the above meetings. Similarly, no business is required to be transacted through postal ballot at the forthcoming Annual General Meeting.
During the year, the following Resolutions were passed by postal ballot, results of which were declared on September 27, 2013: -
1. An Ordinary Resolution with a majority of (96.96%) for approving the terms of appointment of Dr. Kamal K. Sharma, as Vice Chairman of the Company, w.e.f. September 1, 2013.
2. A Special Resolution with a majority of (98.55%) for approving the terms of appointment of Ms. Vinita Gupta, as Chief Executive Officer of the Company, w.e.f. September 1, 2013 and
3. An Ordinary Resolution with a majority of (97.46%) for approving the terms of appointment of Mr. Nilesh Gupta, as Managing Director of the Company, w.e.f. September 1, 2013.
Ms. Neena Bhatia, practicing Company Secretary, acted as the Scrutiniser for conducting the ballots. Procedure prescribed by Section 192A of the Companies Act, 1956 read with the Companies (Passing of the Resolution by Postal Ballot) Rules, 2011, were followed for conducting the said ballots. Postal ballot forms with full particulars of shareholders duly printed thereon were sent in self-addressed postage pre-paid envelopes together with the notice and explanatory statement specifying the resolutions proposed to be passed by postal ballot.
The Company offered e-voting facility to its shareholders through the e-voting system of the National Securities Depository Limited (NSDL) as an alternate. E-mails containing detailed procedure for e-voting were sent to those Members whose e-mail IDs were registered for receipt of documents in electronic mode under the Green Initiative of the Ministry of Corporate Affairs, Government of India. Members holding shares in physical/demat form could opt to exercise voting rights through physical ballot or e-voting. Shareholders were requested to return the duly completed postal ballot forms to the Scrutiniser within the prescribed time. Similarly, e-voting could be exercised up to the prescribed time. Physical postal ballot forms received from shareholders were duly numbered, segregated and scrutinized by the Scrutiniser. A Report was received from NSDL on e-voting. The Scrutiniser considered valid physical postal ballot forms received as also the data received from NSDL in her Report, which was handed over to the Chairman of the Company who
announced the results. Results of the postal ballot were displayed promptly on the notice board at the registered office of the Company, published in the newspapers and hoisted on the Company’s website.
[7] Disclosure on materially significant related party transactions:
During the year under review, there were no materially significant related party transactions between the Company and its promoters, directors and/or their relatives, management etc. which may have potential conflict with the interests of the Company. Statements of transactions in summary form with related parties in the ordinary course of business are placed at Audit Committee meetings and reviewed by the Committee. Details of transactions in which directors are interested are recorded in the Register of Contracts maintained pursuant to the provisions of Section 301 of the Companies Act, 1956 and the same is placed before the Board at every Board meeting and signed by the directors present. Apart from sitting fees, commission and professional fees, there is no pecuniary transaction with non-executive directors of the Company. In compliance with Accounting Standard AS 18, details of related party transactions are disclosed in the notes to accounts that form part of the Balance Sheet and the Statement of Profit and Loss.
The Company has complied with all requirements of the Stock Exchanges, SEBI and other statutory authorities
on all matters relating to capital markets during the last three years and they have not imposed any penalties on, or passed any strictures against the Company.
[8] Means of communication: Quarterly and annual financial results of the Company
are submitted to the stock exchanges immediately after the Board approves them. Thereafter, they are published in prominent English (The Economic Times, all editions) and Marathi (Maharashtra Times, Mumbai edition) newspapers. The results are also posted on the Company’s website viz. www.lupinworld.com. In compliance of Clause 52 of the Listing Agreement, annual report, financial results, quarterly corporate governance compliance reports as also quarterly shareholding pattern are uploaded on the ‘Corporate Filing and Disseminations System’ website www.corpfiling.co.in. The Company’s website also displays official news releases and presentations made to institutional investors and analysts. Disclosures pursuant to various clauses of the Listing Agreement are promptly communicated to the stock exchanges from time to time.
66 | Lupin Limited

[9] General Members’ information: INVESTORS’ SERVICES DEPARTMENT - AT THE SERVICE
OF THE ESTEEMED INVESTORS Your Company accords top priority for the services to the
investors, who are its perpetual partners. The Investors’ Services Department (ISD) comprising experienced and committed employees endeavours to provide services benchmarked to the highest standards. Expeditious response to the investors’ queries/complaints and maintaining highest standards of regulatory compliances related to shares are the thrust areas of the ISD.
The ISD has established direct connectivity with both the depositories’ viz. the National Securities Depository Limited (NSDL) and the Central Depository Services (India) Limited (CDSL) and is equipped with state-of-the-art hardware infrastructure; investor service oriented software and advanced communication systems ensuring reliability, security and integrity of vital and voluminous data base.
The ISD provides multitude of services, comprising:
• Transferandtransmissionofsharesinphysicalmode
• Dematerialisation/rematerialisationofshares
• Regulatorycompliancespertainingtoshares
• Redressalofinvestorgrievances
• Disbursementofdividend
• Executionofcorporateactionsandotherdepositoryoperations
• ImplementationofCodeofConduct forpreventionof insider trading
• Allotmentofsharesandlistingthereofonthestockexchanges
• Liasoning with stock exchanges, depositories andother regulatory bodies
• Implementationofemployeesstockoptionplans
• InvestorEducationandProtectionFund(IEPF)relatedactivities
• Activitiesrelatedtounclaimedshares
• Managementofpostalballots
• Dissemination of share related information on theCompany’s website, NSE’s Electronic Application Processing System (NEAPS), Corporate Filing
& Dissemination System (CFDS) and SEBI Complaints Redress System (SCORES)
The ISD is located at the Registered Office of the Company and can be approached for any query or assistance through letter, telephone, fax, email or in-person at
159, C.S.T. Road, Kalina, Santacruz (East),
Mumbai - 400 098, India. Tel: +91 22 6640 2402/03 Fax: +91 22 2652 8806.
Exclusive email id for investors: Pursuant to Clause 47(f) of the Listing Agreement,
following email id has been designated exclusively for communicating investors’ grievances:
For the convenience of investors, a link at the Company’s website www.lupinworld.com has also been provided to contact ISD.
Person in-charge of the Department: Mr. Pradeep S. Bhagwat, General Manager - Investors’ Services.
ANNUAL GENERAL MEETING The 32nd Annual General Meeting will be held at 2.30
p.m. on Wednesday, July 30, 2014, at Rang Sharda Natyamandir, Bandra Reclamation, Bandra (West), Mumbai - 400 050.
FINANCIAL CALENDARFirst quarter results : July/August 2014Second quarter results : October/November 2014Third quarter results : January/February 2015Annual results : April/May 2015Annual General Meeting : July/August 2015
INVESTORS’ BOOK CLOSURE The Register of Members and the Share Transfer Register
will remain closed from Wednesday, July 23, 2014 to Wednesday, July 30, 2014, (both days inclusive).
Final dividend for the year ended March 31, 2014, if declared, at the Annual General Meeting, shall be paid to:
a) beneficial owners at the end of business day on Tuesday, July 22, 2014 as per lists furnished by NSDL and CDSL in respect of shares held in electronic form; and
b) persons whose names appear on the Register of Members as at the end of the business day on Tuesday, July 22, 2014 in respect of shares held in physical form.
DIVIDEND PAYMENT DATE In the Board Meeting held on February 3, 2014, the directors approved an interim dividend of H 3/- per
share (150%) which was paid on February 21, 2014.
Final dividend if declared, shall be paid within three working days from the date of the Annual General Meeting. Dividend shall be remitted electronically i.e. through NECS/NEFT etc., wherever bank details of shareholders are available with the Company, and in other cases, through physical warrants, payable at par.
Annual Report 2014 | 67

BSE NSEI I I I
MONTH High Date Low Date High Date Low DateApr-2013 703.95 30.04.13 606.20 09.04.13 704.80 30.04.13 605.50 09.04.13May-2013 810.80 16.05.13 695.10 06.05.13 811.00 16.05.13 694.20 02.05.13Jun-2013 803.70 19.06.13 742.10 03.06.13 804.85 19.06.13 742.50 03.06.13Jul-2013 908.00 19.07.13 773.45 01.07.13 907.95 19.07.13 773.05 01.07.13Aug-2013 903.65 05.08.13 742.30 28.08.13 903.50 05.08.13 742.55 28.08.13Sep-2013 895.50 05.09.13 799.50 02.09.13 896.00 05.09.13 798.45 02.09.13Oct-2013 946.35 11.10.13 846.00 01.10.13 945.65 11.10.13 846.00 01.10.13Nov-2013 896.85 01.11.13 841.10 21.11.13 896.95 01.11.13 840.40 21.11.13Dec-2013 929.55 24.12.13 851.25 09.12.13 929.80 24.12.13 851.65 09.12.13Jan-2014 951.00 06.01.14 855.00 30.01.14 950.95 06.01.14 855.40 30.01.14Feb-2014 1001.00 28.02.14 885.00 03.02.14 1002.40 28.02.14 882.00 03.02.14Mar-2014 1003.00 03.03.14 923.55 27.03.14 1003.70 04.03.14 920.00 31.03.14
SHARES LISTED AT The equity shares of the Company are listed at:
BSE Limited (BSE) Phiroze Jeejeebhoy Towers, Dalal Street, Mumbai Samachar Marg, Mumbai - 400 001.
National Stock Exchange of India Limited (NSE) Exchange Plaza, Bandra Kurla Complex, Bandra (East), Mumbai - 400 051.
Annual Listing fees for the year 2014 - 15 have been paid to the stock exchanges. The Company has also paid the Annual Custodial fees to both the depositories.
STOCK CODES The stock codes of the Company are: BSE : 500257 NSE : LUPIN
INTERNATIONAL SECURITIES IDENTIFICATION NUMBER (ISIN)
ISIN is an unique identification number allotted to dematerialised scrip. The ISIN has to be quoted in each transaction relating to dematerialised shares of the Company. The ISIN of the equity shares of the Company is INE 326A 01037.
CORPORATE IDENTITY NUMBER (CIN) CIN of the Company, allotted by the Ministry of Corporate
Affairs, Government of India:
L24100MH1983PLC029442.
MARKET PRICE DATA Equity shares of the Company are traded in A group and
also forms a part of CNX Nifty. The market price data covering the year April 2013 to March 2014 is given below:
68 | Lupin Limited

Lupin Share price movementThe closing market price on the bourses at the end of each financial year:
* Share prices are adjusted considering issue of bonus shares in the ratio of 1:1 on August 17, 2006 and further, sub-division of face value of shares from H 10/- each to H 2/- each, effective August 30, 2010.
Note: The stock price performance shown above should not be considered indicative of potential future stock price performance.
(Value in mn. H)Month BSE NSE Total
Shares Value (I) Shares Value (I) Shares Value (I)
Apr-2013 925171 607.62 14425148 9448.65 15350319 10056.27May-2013 2673161 2013.73 31886956 24083.78 34560117 26097.51Jun-2013 1281843 992.53 18235844 14130.01 19517687 15122.54Jul-2013 2489573 2129.45 22687810 19409.29 25177383 21538.74Aug-2013 2486102 2019.61 30548284 24774.78 33034386 26794.39Sep-2013 2670116 2279.86 20754426 17654.40 23424542 19934.26Oct-2013 2448537 2214.91 16352522 14728.53 18801059 16943.44Nov-2013 1126060 981.53 8970772 7792.53 10096832 8774.06Dec-2013 1367951 1214.90 11772352 10460.85 13140303 11675.75Jan-2014 1329967 1218.72 11656350 10622.94 12986317 11841.66Feb-2014 1602513 1488.37 11925383 11059.29 13527896 12547.66Mar-2014 1111730 1065.34 9957627 9515.56 11069357 10580.90Total: 21512724 18226.57 209173474 173680.61 230686198 191907.18
0.00
100.00
200.00
300.00
400.00
500.00
600.00
700.00
800.00
900.00
1000.00
Mar-02
Mar-06
Mar-04
Mar-08
Mar-11
Mar-03
Mar-07
Mar-10
Mar-05
Mar-09
Mar-12
Mar-13
Mar-14
Rupe
es (H
)
Closing Rate (BSE) Closing Rate (NSE)
11.70
11.66
12.53
12.53
65.00
65.00
55.31
54.71
98.78
99.70
101.86
101.40
121.13
121.24
137.84
136.91
324.91
325.47
415.35
416.65
529.65
529.50
629.05 628.55
935.90
933.15
BSE
NSE
DEMATERIALISATION OF SHARES AND LIQUIDITY Trading in shares of the Company is permitted only in
dematerialised form and the same are available with both the depositories i.e. the National Securities Depository Limited and the Central Depository Services (India) Limited with whom the Company has established direct connectivity. The requests for dematerialization of shares, received by the Company are continually monitored to expedite the process of dematerialisation.
During the year, the Company has electronically confirmed requests for dematerialisation of 200735 equity shares. As on March 31, 2014, 99.48% of the share capital of the
Company was held in dematerialised form.
To enable us to serve better, we request shareholders holding shares in physical form to dematerialise the same. Shareholders holding shares in dematerialised form are requested to promptly update their bank details including the nine digit MICR, IFSC code and the e-mail id with their respective depository participant.
Company’s shares are fairly liquid on the bourses forming part of major indices and are traded actively at the BSE and the NSE. Trading data of the same for the year April 2013 to March 2014 is as under:
Annual Report 2014 | 69
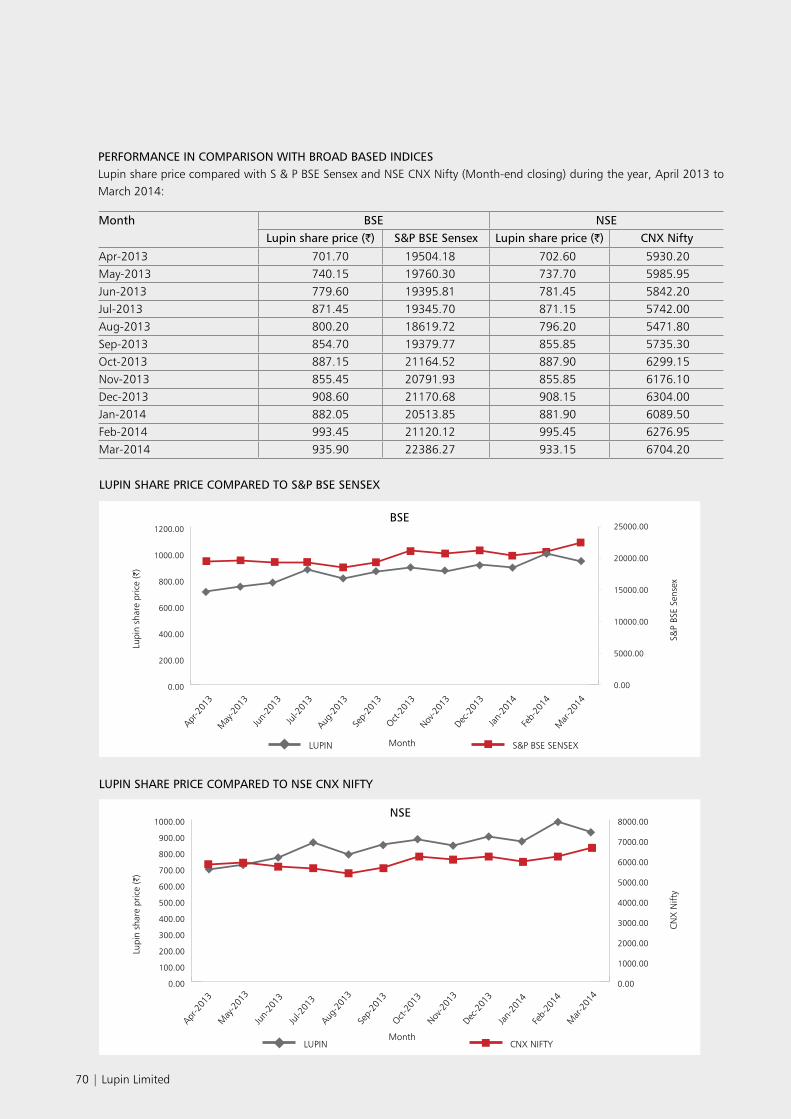
Month BSE NSELupin share price (I) S&P BSE Sensex Lupin share price (I) CNX Nifty
Apr-2013 701.70 19504.18 702.60 5930.20May-2013 740.15 19760.30 737.70 5985.95Jun-2013 779.60 19395.81 781.45 5842.20Jul-2013 871.45 19345.70 871.15 5742.00Aug-2013 800.20 18619.72 796.20 5471.80Sep-2013 854.70 19379.77 855.85 5735.30Oct-2013 887.15 21164.52 887.90 6299.15Nov-2013 855.45 20791.93 855.85 6176.10Dec-2013 908.60 21170.68 908.15 6304.00Jan-2014 882.05 20513.85 881.90 6089.50Feb-2014 993.45 21120.12 995.45 6276.95Mar-2014 935.90 22386.27 933.15 6704.20
PERFORMANCE IN COMPARISON WITH BROAD BASED INDICES Lupin share price compared with S & P BSE Sensex and NSE CNX Nifty (Month-end closing) during the year, April 2013 to
March 2014:
LUPIN SHARE PRICE COMPARED TO S&P BSE SENSEX
0.00
200.00
400.00
600.00
800.00
1000.00
1200.00
5000.00
0.00
10000.00
15000.00
20000.00
25000.00
S&P BSE SENSEX LUPIN
Apr-2
013
May
-201
3Ju
n-20
13Ju
l-201
3Aug
-201
3Se
p-20
13Oct-
2013
Nov-2
013
Dec-2
013
Jan-
2014
Feb-
2014
Mar
-201
4
BSE
Lupi
n sh
are
pric
e (H
)
S&P
BSE
Sens
ex
Month
LUPIN SHARE PRICE COMPARED TO NSE CNX NIFTY
0.00
100.00
200.00
300.00
400.00
500.00
600.00
700.00
800.00
900.00
1000.00
0.00
1000.00
2000.00
3000.00
4000.00
5000.00
6000.00
7000.00
8000.00
Apr-2
013
May
-201
3Ju
n-20
13Ju
l-201
3Aug
-201
3Se
p-20
13Oct-
2013
Nov-2
013
Dec-2
013
Jan-
2014
Feb-
2014
Mar
-201
4
NSE
Lupi
n sh
are
pric
e (H
)
Month
CNX
Nift
y
CNX NIFTYLUPIN
70 | Lupin Limited

SHARE TRANSFER SYSTEM Equity shares of the Company traded in dematerialised
form and are transferred only through depository system. The activities related to transfer of shares in physical form are carried out by the Investors’ Services Department of the Company.
With a view to expedite the process of share transfer, the Board has delegated the powers of share transfers to the Share Transfer Committee comprising, Dr. Desh Bandhu Gupta, or in his absence, Dr. Kamal K. Sharma as the Chairman of the Committee and Mrs. M. D. Gupta and Dr. K. U. Mada as the members.
After processing valid share transfer documents, the shares are transferred favouring respective transferees within 15 days from the date of receipt and the share certificates are forwarded to them duly endorsed their names. During the year, 24 meetings of the Share Transfer Committee were held to approve transfer of 40150 equity shares in physical form.
Pursuant to Clause 47 C of the Listing Agreement, an audit of share transfer related activities are being undertaken on a half-yearly basis by a qualified Company Secretary in practice and the compliance certificate issued upon audit is submitted to the stock exchanges.
ALLOTMENT COMMITTEE The Board has constituted Allotment Committee to
approve the allotment of shares, comprising Dr. Desh Bandhu Gupta, or in his absence, Dr. Kamal K. Sharma
as Chairman of the Committee and Mrs. M. D. Gupta as member.
The Allotment Committee met 13 times during the year. It approved allotment of 846311 shares to the employees,
upon exercising the vested options granted to them under the Lupin Employees Stock Option Plans.
Allotment Committee delegated powers to the executives of the Company to comply with pre and post formalities in respect of allotment of shares viz. execution of corporate actions for crediting allotted shares to the demat account of the respective allotees and listing them with the stock exchanges, etc.
UNCLAIMED SHARES In terms of Clause 5A of the Listing Agreement, on
February, 29, 2012, the Company had transferred 375150 unclaimed shares held by 1592 shareholders to the ‘Lupin Limited - Unclaimed Suspense Account’.
No claims were lodged by shareholders till March 31, 2012. Thereafter, claims were lodged by shareholders for 3750 shares during 2012-13 and for 8450 shares during 2013-14 which were duly transferred by the Company in the name of respective claimant shareholder from the Unclaimed Suspense Account, on the basis of claim documents submitted by them.
As on March 31, 2014, the balance in the Unclaimed Suspense Account was 362950 shares. Voting rights on these shares shall remain frozen till the claim of the rightful shareowner is approved by the Company.
EVOLUTION OF SHARE CAPITAL Particulars of Equity Share Capital of the Company:
Year Allotment of shares (of the face value of I10/- each) Total issued No. of shares during
the yearCapital at the end of
the year (I)2001 - 02 40141134 shares upon amalgamation * 40141134 4014113402006 - 07 11360 shares under ESOP (Pre - Bonus)
40152494 shares as bonus (in the ratio of 1:1)39576 shares under ESOP (Post - Bonus)
40203430 803445640
2007 - 08 1656100 shares upon conversion of FCCB80231 shares under ESOP
1736331 820808950
2008 - 09 571069 shares upon conversion of FCCB167586 shares under ESOP
738655 828195500
2009 - 10 5816742 shares upon conversion of FCCB307541 shares under ESOP
6124283 889438330
2010 - 11 170691 shares under ESOP (Pre Sub-division) 799260 892402378Allotment of shares (of the face value of I 2/- each)628569 shares under ESOP (Post Sub-division)
2011 - 12 440492 shares under ESOP 440492 8932833622012 - 13 887812 shares under ESOP 887812 8950589862013 - 14 846311 shares under ESOP 846311 896751608
* Amalgamation of Lupin Laboratories Limited with Lupin Chemicals Limited whose name was changed to Lupin Limited.
Annual Report 2014 | 71

SHAREHOLDING PROFILE AS ON MARCH 31, 2014 i. Distribution of Shareholding
Shareholding range Shareholders ShareholdingNumbers % Numbers %
1 - 500 88458 90.03 6919819 1.54501 - 1000 3328 3.39 2572968 0.571001 - 2000 3889 3.96 5071599 1.132001 - 3000 681 0.69 1708244 0.383001 - 4000 246 0.25 879682 0.204001 - 5000 215 0.22 1010661 0.235001 - 10000 396 0.40 2887825 0.6410001 and above 1046 1.06 427325006 95.31Total: 98259 100.00 448375804 100.00
ii. Shareholding Pattern
Category As on 31.03.2014 As on 31.03.2013No. of shares % No. of shares %
Promoters 209599940 46.75 209601940 46.84Mutual Funds 22401111 5.00 23085600 5.16Insurance Cos./Banks/Financial Institutions 28324972 6.32 41036932 9.17Foreign Institutional Investors (FIIs) 142832871 31.86 128874302 28.80Foreign Bodies 7079 0.00 2079 0.00Non Residents 1071955 0.24 1614532 0.36Public 44137876 9.84 43314108 9.67Total: 448375804 100.00 447529493 100.00
iii. Shareholding Profile
Category Demat Physical Total(nos.) % (nos.) % (nos.)
Shareholding 446047495 99.48 2328309 0.52 448375804Shareholders 90394 92.00 7865 8.00 98259
Shareholding Pattern as on March 31, 2014
Foreign Institutional Investors (FIIs)
Foreign Bodies/Banks
Public
Promoters
Mutual Funds
Insurance Cos./Banks/Financial Institutions
Non Residents
9.84 0.00
0.24
31.86
6.32
46.75
5.00
72 | Lupin Limited
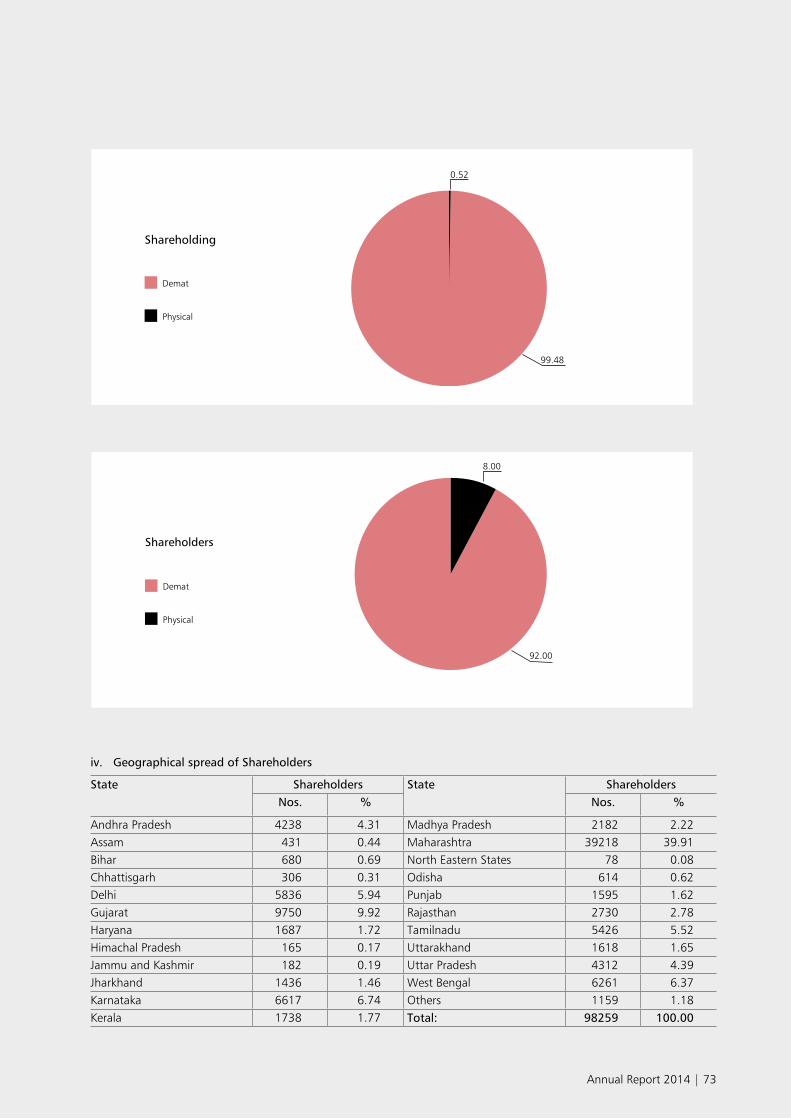
iv. Geographical spread of Shareholders
State Shareholders State ShareholdersNos. % Nos. %
Andhra Pradesh 4238 4.31 Madhya Pradesh 2182 2.22Assam 431 0.44 Maharashtra 39218 39.91Bihar 680 0.69 North Eastern States 78 0.08Chhattisgarh 306 0.31 Odisha 614 0.62Delhi 5836 5.94 Punjab 1595 1.62Gujarat 9750 9.92 Rajasthan 2730 2.78Haryana 1687 1.72 Tamilnadu 5426 5.52Himachal Pradesh 165 0.17 Uttarakhand 1618 1.65Jammu and Kashmir 182 0.19 Uttar Pradesh 4312 4.39Jharkhand 1436 1.46 West Bengal 6261 6.37Karnataka 6617 6.74 Others 1159 1.18Kerala 1738 1.77 Total: 98259 100.00
Shareholding
Physical
Demat
0.52
99.48
8.00
92.00
Shareholders
Physical
Demat
Annual Report 2014 | 73

DIVIDEND PROFILE Particulars of dividend paid by the Company:
Financial year Book closure/Record date Dividend declared % Date of declaration Date of payment 2013 - 14 (Interim) 14.02.2014 150 03.02.2014 21.02.20142012 - 13 31.07.13 - 07.08.13 200 07.08.2013 08.08.20132011 - 12 17.07.12 - 24.07.12 160 24.07.2012 25.07.20122010 - 11 20.07.11 - 27.07.11 150 27.07.2011 28.07.20112009 - 10 21.07.10 - 28.07.10 135 28.07.2010 29.07.20102008 - 09 22.07.09 - 29.07.09 125 29.07.2009 30.07.20092007 - 08 15.07.08 - 22.07.08 100 22.07.2008 23.07.20082006 - 07 12.07.07 - 19.07.07 50 19.07.2007 20.07.20072005 - 06 11.07.06 - 12.07.06 65 25.07.2006 26.07.20062004 - 05 19.07.05 - 20.07.05 65 28.07.2005 29.07.20052003 - 04 15.07.04 - 16.07.04 65 29.07.2004 30.07.20042002 - 03 17.07.03 - 18.07.03 50 06.08.2003 07.08.20032001 - 02 (Final) 20.08.02 - 21.08.02 25 02.09.2002 03.09.20022001 - 02 (Interim) 07.02.02 25 17.01.2002 15.02.2002
Note: Dividend for the year 2006-07 onwards was on enhanced share capital, consequent to the Bonus Issue in the ratio of 1:1.
CODE OF CONDUCT FOR PREVENTION OF INSIDER TRADING
The Company has adopted a comprehensive Code of Conduct for prevention of insider trading in shares of the Company, in terms of the provisions of the SEBI (Prohibition of Insider Trading) Regulations, 1992.
The Code is designed to maintain the highest ethical standards and elaborately prescribes the procedures to be followed while dealing in the shares of the Company.
The Code is applicable to promoters, directors, auditors, senior officials of the Company and their dependents.
The Code restricts the said persons to deal in the shares of the Company whilst in the possession of any unpublished price sensitive information. They are also prohibited from dealing in the shares of the Company during the trading window closure periods announced by the Company, from time to time.
The Code has been disseminated through the Company’s intranet for easy access and increased awareness and is updated from time to time.
RECONCILIATION OF SHARE CAPITAL AUDIT REPORT As a measure of good corporate governance practice, an
exhaustive audit is conducted for each calendar quarter,
by a qualified practicing Company Secretary, to reconcile the total admitted capital with NSDL and CDSL and those held in physical form with the total issued, paid up and listed capital of the Company.
The audit report, inter alia, covers and certifies that the total shares held in NSDL, CDSL and those in physical form tally with the issued, paid up and listed capital of the Company, Register of Members is duly updated, demat requests are confirmed within stipulated time etc. Details of changes, in the share capital of the Company during the quarter, are also covered in the report.
The Reconciliation of Share Capital Audit Report is submitted with BSE and NSE and is also placed before the meetings of the Board of Directors and the Investors’ Grievances Committee.
EMPLOYEES STOCK OPTION PLANS With a view to attract, retain and motivate the employees
of the Company and those of its subsidiaries, the Company has structured Employees Stock Option Plans (ESOPs). Pursuant to ESOPs, each option is convertible into one fully paid-up equity share of the face value of
H 2/- each with an exercise period of 10 years from the date of each grant. The ESOPs are implemented according
74 | Lupin Limited

to the provisions of SEBI (Employee Stock Option Scheme and Employee Stock Purchase Scheme) Guidelines, 1999.
During the year under review, the Company granted 50000 options under the ‘Lupin Employees Stock Option Plan 2003’ and 946250 options under the ‘Lupin Employees Stock Option Plan 2011’ to its employees and 185090 options under the ‘Lupin Subsidiary Companies Employees Stock Option Plan 2011’ to the employees of the subsidiary companies, in eight separate grants.
In accordance with the terms of the respective stock option plan and other applicable provisions, the Company allotted 846311 shares during the year to those employees who have exercised their vested option, the details of which are as under:
Sl. No. Date of allotment No. of shares1. April 23, 2013 1076092. May 27, 2013 767663. June 25, 2013 287194. July 16, 2013 674755. August 20, 2013 890396. September 5, 2013 859447. September 24, 2013 379898. October 22, 2013 472239. November 21, 2013 107669
10. December 24, 2013 4816811. January 24, 2014 9242212. February 25, 2014 3682613. March 24, 2014 20462
Total: 846311
The Company has obtained necessary approvals for grant of options and allotment of shares. The allotted shares have been listed with the BSE and NSE.
The particulars of options as on March 31, 2014 have been provided in Annexure ‘B’ to the Directors’ Report in terms of Clause 12.1 of the SEBI (Employee Stock Option Scheme and Employee Stock Purchase Scheme) Guidelines, 1999.
UNCLAIMED DIVIDENDS In the interest of the esteemed shareholders, the
Company follows the practice of sending personalized
reminders to the shareholders concerned to claim their unpaid dividend, from time to time and also before transferring them to Investor education and Protection Fund (IEPF). Data of dividend which remained unclaimed/ unpaid are uploaded on the websites of the Ministry of Corporate Affairs (MCA), Government of India, and also on the Company’s official website www.lupinworld.com.
Pursuant to the relevant provisions, the unclaimed/ unpaid dividends of the Company up to the financial year 2005-06 have been transferred to the Investor Education and Protection Fund (IEPF) as and when the same were due. Further, the unclaimed/unpaid dividends for the year 2006-07 onwards will be transferred to the IEPF, in accordance with the following schedule:
Financial Year Date of Declaration Due date for transfer to IEPF
2006 - 07 19.07.2007 24.08.20142007 - 08 22.07.2008 27.08.20152008 - 09 29.07.2009 03.09.20162009 - 10 28.07.2010 02.09.20172010 - 11 27.07.2011 01.09.20182011 - 12 24.07.2012 29.08.20192012 - 13 07.08.2013 12.09.20202013 - 14 (Interim)
03.02.2014 11.03.2021
Shareholders are advised to confirm with their records and claim their dividend before the due date of transfer to IEPF, if not encashed earlier.
OUTSTANDING GDRs/ADRs/WARRANTS/CONVERTIBLE INSTRUMENTS
The Company has granted stock options to its employees and those of its subsidiaries under the employee stock option plans. The Company shall allot equity shares from time to time, upon the employees exercising the options vested in them, pursuant to the provisions of SEBI (Employee Stock Option Scheme and Employee Stock Purchase Scheme) Guidelines, 1999 and the terms and conditions of the respective employee stock option plan.
There are no outstanding warrants. The Company has not issued any GDR/ADR.
Annual Report 2014 | 75
PLANT LOCATIONS The Company’s plants are located at:
i) T-142, MIDC, Tarapur Industrial Area, Boisar, Dist. Thane,Maharashtra - 401 506.
v) B-15, Phase IA,Verna Industrial Area,Verna Salcette,Goa - 403 722.
ix) Plot Nos. 2 and M-1, Special Economic Zone, Phase-IIMisc. Zone, Apparel Park,Pithampur, Dist. Dhar,Madhya Pradesh - 454 775.
ii) 198-202, New Industrial Area 2, Mandideep, Dist. Raisen,Madhya Pradesh - 462 046.
vi) Export Promotion Industrial Park, SIDCO Industrial Complex, Kartholi, Bari Brahmana,Jammu - 181 133.
x) Plot 6A, Sector-17,Special Economic Zone,Mihan Notified Area,Nagpur - 441 108.
iii) Plot Nos. 124 and 2201/2202GIDC Estate,Ankleshwar, Gujarat - 393 002.
vii) Gat No. 1156, Village Ghotawade,Taluka Mulshi, Dist. Pune,Maharashtra - 411 042.
xi) Kyowa PharmaceuticalIndustry Co. Ltd.,11-1 Techno Park, Sanda,Hyogo 669 - 1339,Japan.
iv) A-28/1, MIDC Area,Chikalthana, Aurangabad,Maharashtra - 431 210.
viii) Block 21, Dabhasa Padra TalukaVadodara,Gujarat - 391 440.
xii) I’rom Pharmaceutical Co., Ltd.,Post code 243-00144-18-29, Asahi-cho, Atsugi city, Kanagawa prefectureJapan.
CONTACT PERSONS FOR ENQUIRIES Financial matters : Mr. Sunil Makharia, email: [email protected] Secretarial matters : Mr. Rajvardhan V. Satam, email: [email protected] Investors related matters : Mr. Pradeep Bhagwat, email: [email protected]
ADDRESS FOR CORRESPONDENCE Members may address their queries/communications to:
Registered Office/Investors’ Services Department: 159, C.S.T. Road, Kalina, Santacruz (East), Mumbai - 400 098, India. Tel: +91 22 6640 2323 Ext: 2402/2403 Fax: +91 22 2652 8806.
For and on behalf of the Board of Directors
Dr. Desh Bandhu Gupta
Chairman
Mumbai, May 7, 2014
76 | Lupin Limited

CERTIFICATE PURSUANT TO CLAUSE 49 V OF THE LISTING AGREEMENT
We, Mr. Nilesh Gupta, Managing Director and Mr. Ramesh Swaminathan, Chief Financial Officer do hereby certify to the Board that: -
(a) We have reviewed the Balance Sheet as at March 31, 2014, Statement of Profit and Loss and the Cash Flow Statement for the year ended on that date and that to the best of our knowledge and belief: -
(i) the said statements do not contain any false, misleading or materially untrue statements or figures or omit any material fact, which may make the statements or figures contained therein misleading;
(ii) the said statements together present a true and fair view of the Company’s affairs and are in compliance with existing accounting standards, applicable laws and regulations.
(b) There are, to the best of our knowledge and belief, no transactions entered into by the Company during the year which are fraudulent, illegal or violative of the Company’s code of conduct.
(c) We accept responsibility for establishing and maintaining internal controls for financial reporting and that we have evaluated the effectiveness of the internal control systems of the Company pertaining to financial reporting and have disclosed to the Auditors and the Audit Committee, deficiencies in the design or operation of such internal controls, if any, of which we are aware and the steps we have taken or propose to take to rectify these deficiencies.
(d) We have indicated to the Auditors and the Audit Committee: -
(i) significant changes in internal control over financial reporting during the year, if any;
(ii) significant changes in accounting policies during the year, if any, and that the same have been disclosed in the notes to the financial statements; and
(iii) instances of significant fraud of which we have become aware and the involvement therein, if any, of the management or an employee having a significant role in the Company’s internal control system over financial reporting.
For LUPIN LIMITED For LUPIN LIMITED
NILESH GUPTA RAMESH SWAMINATHANMANAGING DIRECTOR CHIEF FINANCIAL OFFICER
Mumbai, May 7, 2014
DECLARATION PURSUANT TO CLAUSE 49 1(D) (ii) OF THE LISTING AGREEMENT
In accordance with Clause 49 1(D)(ii) of the Listing Agreement with the Stock Exchanges, I hereby declare that the Directors and Senior Management of the Company have affirmed compliance with the Code of Conduct as applicable to them for the year ended March 31, 2014.
For LUPIN LIMITED
NILESH GUPTAMANAGING DIRECTOR
Mumbai, May 7, 2014
Annual Report 2014 | 77

auditoRs’ ceRtiFicate on coRpoRate GoveRnance
TO,THE MEMBERS OF LUPIN LIMITED
We have examined the compliance of the conditions of corporate governance by LUPIN LIMITED (“the Company”) for the year ended on March 31, 2014, as stipulated in Clause 49 of the listing agreements of the said Company with relevant stock exchanges.
The compliance of the conditions of corporate governance is the responsibility of the Management. Our examination has been limited to procedures and implementation thereof, adopted by the Company for ensuring compliance of the conditions of corporate governance. It is neither an audit nor an expression of opinion on the financial statements of the Company.
In our opinion and to the best of our information and according to the explanations given to us, we certify that the Company has complied with the conditions of corporate governance as stipulated in the above mentioned listing agreements.
We state that such compliance is neither an assurance as to the future viability of the Company nor the efficiency or effectiveness with which the Management has conducted the affairs of the Company.
For DELOITTE HASKINS & SELLS LLPChartered Accountants
(Registration No.117366W/W-100018)
K. A. KatkiPartner
(Membership No. 038568)Mumbai, May 07, 2014
78 | Lupin Limited

Business ResponsiBility RepoRt The Company firmly believes that how it does business is as important as what it does. Business Enterprises are seen as critical components of the social system and are considered accountable not merely to the shareholders but to the larger society which are also its stakeholders. In pursuance of its commitment to responsible business, the Company has prepared the Business Responsibility Report based on the framework prescribed by the Securities and Exchange Board of India.
Section A: General Information about the Company1. Corporate Identity Number (CIN) of the Company: L24100MH1983PLC029442
2. Name of the Company: LUPIN LIMITED
3. Registered address: 159, C.S.T. Road, Kalina, Santacruz (East), Mumbai - 400 098.
4. Website: www.lupinworld.com
5. E-mail id: [email protected]
6. Financial Year reported: Year ended March 31, 2014.
7. Sector(s) that the Company is engaged in (industrial activity code-wise):
Industrial Group Description210 Manufacture of Pharmaceuticals.
As per National Industrial Classification - Ministry of Statistics and Programme Implementation.
8. List three key products/services that the Company manufactures/provides (as in balance sheet):
Cardiovascular, Anti-Infective and Diabetology.
9. Total number of locations where business activity is undertaken by the Company:
i. Number of International Locations: The Company has 22 international subsidiaries located in 14 countries. The Company also has Representative Offices in
China, Russia, Ukraine, Kazakhstan, Uzbekistan and Vietnam.
ii. Number of National Locations: The Company has ten plants situated at Aurangabad, Tarapur, Pune and Nagpur in Maharashtra, Ankleshwar and
Dabhasa in Gujarat, Mandideep and Indore in Madhya Pradesh, Goa and Jammu. R&D Centre is located at Pune. The Registered office and Corporate office are in Mumbai. The Company has 30 Carrying & Forwarding Agents and six Central Warehouses.
10. Markets served by the Company - Local/State/National/International:
In addition to serving the Indian market, the Company exports to around 75 countries worldwide.
Section B: Financial Details of the Company1. Paid up Capital (INR): H 896.8 million.
2. Total Turnover (INR): H 88576.6 million (Standalone).
3. Total profit after taxes (INR): H 23242.2 million (Standalone).
4. Total spending on Corporate Social Responsibility (CSR) as percentage of profit after tax (%): The Company’s total spending on CSR for the year ended March 31, 2014 was H 145.2 million which is 0.62% of profit after tax.
5. List of activities in which expenditure in 4 above has been incurred:
a. Economic upliftment through agricultural development, animal husbandry, promotion of rural industries, skill enhancement and financial assistance to the rural poor especially those under the poverty line.
b. Social development through women empowerment, community health management, sports activities, education and training and
c. Natural resource management and infrastructure development.
Annual Report 2014 | 79

Section C: Other Details1. Does the Company have Subsidiary Companies?: As on March 31, 2014, the Company had 23 subsidiaries.
2. Do the Subsidiary Companies participate in the BR Initiatives of the parent company? If yes, then indicate the number of such subsidiary company(s):
Of the 23 subsidiaries, 22 are foreign, which comply with the requirements of their respective countries and have independent business responsibility initiatives. Lupin Healthcare Limited, the Indian subsidiary, has not commenced commercial operations.
3. Do any other entity/entities (e.g. suppliers, distributors etc.) that the Company does business with; participate in the BR initiatives of the Company? If yes, then indicate the percentage of such entity/entities? [Less than 30%, 30-60%, More than 60%]:
Though other entities like suppliers, distributors, etc. do not directly participate in the BR initiatives of the Company, they support the same.
Section D: BR Information1. Details of Director/Directors responsible for BR:
a) Details of the Director/Directors responsible for implementation of the BR policy/policies:
• DIN Number: 01734642
• Name: Mr. Nilesh Gupta
• Designation: Managing Director
b) Details of the BR head:
Sl. No. Particulars Details1. DIN Number 017346422. Name Mr. Nilesh Gupta3. Designation Managing Director 4. Telephone number +9122 6640 22225. E-mail id [email protected]
2. Principle-wise (as per NVGs) BR Policy/policies (Reply in Y/N):
Sl.No.
Questions
Busi
ness
Eth
ics
Prod
uct
Resp
onsi
bilit
y
Wel
l-bei
ng o
f em
ploy
ees
Stak
ehol
der
enga
gem
ent
Hum
an R
ight
s
Envi
ronm
ent
Publ
ic P
olic
y
CSR
Cus
tom
er R
elat
ions
P1 P2 P3 P4 P5 P6 P7 P8 P9
1. Do you have a policy / policies for....
Y Y Y Y Y(The
policy is broadly covered
in various HR
policies and
practices as also
codes of conduct)
Y N Y Y
80 | Lupin Limited

Sl.No.
Questions
Busi
ness
Eth
ics
Prod
uct
Resp
onsi
bilit
y
Wel
l-bei
ng o
f em
ploy
ees
Stak
ehol
der
enga
gem
ent
Hum
an R
ight
s
Envi
ronm
ent
Publ
ic P
olic
y
CSR
Cus
tom
er R
elat
ions
P1 P2 P3 P4 P5 P6 P7 P8 P9
2. Has the policy being formulated in consultation with the relevant stakeholders?
Y Y Y Y Y Y - Y Y
3. Does the policy conform to any national / international standards?If yes, specify? (50 words)
Y Y Y Y Y Y - Y Y
The policies are broadly based on the National Voluntary Guidelines on social, environmental and economical responsibilities of business issued by the Ministry of Corporate Affairs, Government of India. International Standards namely, ISO 14001 and 18001 are in place to respect, protect and restore the environment.
4. Has the policy being approved by the Board?If yes, has it been signed by MD/owner/CEO/appropriate Board Director?
Y(Signed by the MD)
Y(Signed by the
QA Head)
Y(Signed
by the HR Head)
Y(Signed by
the CSR Head)
Y(Signed
by the HR Head)
Y(Signed by the MD)
- Y(Signed by
the CSR Head)
Y(Signed by
the Marketing
Head)
5. Does the Company have a specified committee of the Board/Director/Official to oversee the implementation of the policy?
Y Y Y Y Y Y - Y Y
6. Indicate the link for the policy to be viewed online? * @ @ @ * @ - * *
7. Has the policy been formally communicated to all relevant internal and external stakeholders?
Y Y Y Y Y Y - Y Y
8. Does the Company have in-house structure to implement the policy/policies?
Y Y Y Y Y Y - Y Y
9. Does the Company have a grievance redressal mechanism related to the policy/policies to address stakeholders’ grievances related to the policy/policies?
Y Y Y Y Y Y - Y Y
10. Has the Company carried out independent audit/evaluation of the working of this policy by an internal or external agency?
Y Y Y Y Y Y - Y Y
* URL: http://www.lupinworld.com
@ http://home.lupinworld.com
Annual Report 2014 | 81

2 a. If answer to Sl.No.1 against any principle, is ‘No’, please explain why: (Tickup to 2 options)
Sl. No.
Questions P P P P P P P P P
1 2 3 4 5 6 7 8 9
1. The Company has not understood the Principles
- - - - - - - - -
2. The Company is not at a stage where it finds itself in a position to formulate and implement the policies on specified principles
- - - - - - - - -
3. The Company does not have financial or manpower resources available for the task
- - - - - - - - -
4. It is planned to be done within next 6 months - - - - - - - - -
5. It is planned to be done within the next 1 year
- - - - - - - - -
6. Any other reason (please specify) - - - - - - The Company is a member of various trade bodies, chambers and associations through which it has been advocating from time to time in a responsible manner, about measures to be taken by the government to address issues related to the pharmaceutical industry. However, no need has been felt to formulate a specific policy for the same.
- -
3. Governance related to BR: • Indicate the frequency with which the Board of Directors, Committee of the Board or CEO to assess the BR
performance of the Company. Within 3 months, 3-6 months, Annually, More than 1 year.
Annually.
• Does the Company publish a BR or a Sustainability Report? What is the hyperlink for viewing this report? How frequently it is published?
The Company does not publish a BR or a Sustainability Report; however, details pertaining to Corporate Social Responsibility have been presented in the Management Discussion and Analysis Report which forms part of the Annual Report.
Section E: Principle-wise performancePrinciple 1
1. Does the policy relating to ethics, bribery and corruption cover only the Company? Yes/ No. Does it extend to the Group/Joint Ventures/Suppliers/Contractors/NGOs/Others?
The Company has a legacy of good corporate governance and firmly believes and adheres to the highest standards of ethical, moral and legal conduct of its business operations. Codes of Conduct have been adopted by the directors and senior management personnel and the same have been posted on the website of the Company www.lupinworld.com.
The Company has instituted an initiative encompassing three important policies namely, Code of Conduct, Whistle Blower Policy and Prevention of Workplace Harassment. Employees are encouraged to come forward and express their concerns about suspected misconduct without fear of punishment or unfair treatment. Employees are free to raise their concerns and report any potential violations of Company policies or Code of Conduct.
2. How many stakeholder complaints have been received in the past financial year and what percentage was satisfactorily resolved by the management? If so, provide details thereof, in about 50 words or so.
As stated in the Corporate Governance Report, the Company received and resolved 47 shareholder complaints during the year ended March 31, 2014.
Principle 2
1. List up to 3 of your products or services whose design has incorporated social or environmental concerns, risks and/or opportunities.
i. ‘Cognistar’ (Cerebroprotein Hydrolysate) for treatment of Stroke, TBI and Dementia.
ii. ‘Tonact’ (Atorvastatin) for reducing Cholesterol.
iii ‘Gluconorm’ (Metformin) an Anti-Diabetes drug.
82 | Lupin Limited

2. For each such product, provide the following details in respect of resource use (energy, water, raw material etc.) per unit of product (optional):
i. Reduction during sourcing/production/distribution achieved since the previous year throughout the value chain? The Company manufactures and distributes a wide range of generics and branded Formulations and APIs at its world
class plants. Consumption per unit depends on the product mix, thus there are no specific standards to ascertain reduction achieved at product level.
ii Reduction during usage by consumers (energy, water) has been achieved since the previous year? The products of the Company do not have any broad-based impact on energy and water consumption by consumers.
3. Does the Company have procedures in place for sustainable sourcing (including transportation)? If yes, what percentage of your inputs was sourced sustainably? Also, provide details thereof, in about 50 words or
so.
The Company has in place a formulated operating procedure for approving vendors. Materials, both local and international, are procured from approved vendors. The Company has long standing business relations with regular vendors. The quality assurance team of the Company conducts periodic audits of the Vendors, especially those who supply key materials.
The Company enters into annual freight contracts with leading transporters for movement of materials. The Company has received continous support from its vendors.
4. Has the Company taken any steps to procure goods and services from local and small producers, including communities surrounding their place of work?
If yes, what steps have been taken to improve their capacity and capability of local and small vendors?
The Company encourages procurement of goods and availment of services from local and small vendors, particularly those located around its plants. The Company provides technical support and guides its vendors in developing products. Procurement from local vendors helps the company to save on transportation and inventory carrying costs.
5. Does the Company have a mechanism to recycle products and waste? If yes what is the percentage of recycling of products and waste (separately as <5%, 5-10%, >10%). Also, provide details thereof, in about 50 words or so.
The Company has in place, a mechanism for recycling products and waste. About 38% of the waste water generated in plants, is recovered, recycled and reused, which saves usage of fresh water. Treated waste water is used for gardening Company premises thereby reducing consumption of fresh water.
About 60% of incinerable waste generated at plants is sent for co-processing in cement kilns which is used in place of fossil fuel by the cement industry. Most of the solvents are recycled and reused.
Principle 3
1. Please indicate the total number of employees. 12,984 permanent employees as on March 31, 2014.
2. Please indicate the total number of employees hired on temporary/contractual/casual basis. 4,484 as on March 31, 2014.
3. Please indicate the number of permanent women employees. 900 as on March 31, 2014.
4. Please indicate the number of permanent employees with disabilities. 30 as on March 31, 2014.
5. Do you have an employee association that is recognized by management? As the Company’s plants and offices are situated at multiple places, there are unions and association of employees at the
respective locations.
6. What percentage of your permanent employees is members of this recognized employee association? About 6% ofthe permanent employees are members of recognised employee associations.
Annual Report 2014 | 83

7. Please indicate the Number of complaints relating to child labour, forced labour, involuntary labour, sexual harassment in the last financial year and pending, as on the end of the financial year.
Sl.No. Category No. of complaints filed during the financial year No. of complaints pending as on end of the financial year
1. Child labour/forced labour/involuntary labour
Nil, as the Company does not hire child labour, forced labour or involuntary labour.
N.A.
2. Sexual harassment Nil N.A.3. Discriminatory employment Nil N.A.
8. What percentage of your under mentioned employees were given safety and skill up-gradation training in the last year? (only safety training)
Permanent Employees: - About 90% of operating personnel are trained in safety. Safety training is imparted to employees at the time of joining the Company, which includes firefighting, first-aid, procedural, chemical safety, etc. While procedural safety trainings are imparted regularly, first-aid and firefighting trainings are imparted at scheduled intervals.
Permanent Women Employees: - About 90% are trained in safety with no discrimination being made in imparting training to women employees vis-a-vis their male counterparts. While, induction safety training is given to newly recruited women employees, other trainings like first aid etc. are imparted periodically.
Casual/Temporary/Contractual Employees: - 100% in operating functions are trained.
Employees with Disabilities: - No discrimination is made while imparting training to differently abled employees vis-a-vis their fellow employees.
Principle 4
1. Has the Company mapped its internal and external stakeholders? Yes / No.
The Company has mapped its stakeholders.
2. Out of the above, has the Company identified the disadvantaged, vulnerable and marginalized stakeholders?
The Company has identified the disadvantaged, vulnerable and marginalized stakeholders.
3. Are there any special initiatives taken by the Company to engage with the disadvantaged, vulnerable and marginalized stakeholders. If so, provide details thereof, in about 50 words or so.
In line with its commitment to educate patients about different diseases and their management, the Company created a dedicated multilingual website ‘Right2breathe’ for education about Asthma and Chronic Obstructive Pulmonary Disease (COPD). The Company also identified and collaborated with doctors and created heart failure clinics across the country to increase awareness of heart failure management. Using diabetes educators, the Company through ‘Humrahi’, has been endeavoring to educate diabetic patients on a regular basis. Programs like ‘Arogya Diabetes’ screened more than 37000 patients. Medical camps were conducted for screening and diagnosis of various therapy areas like Asthma, COPD, Lipids, Anemia, Diabetes, Hypertension, Bone Mineral Density. About 650 free Spirometry camps were also conducted.
The ’Lupin Blue Eyes’ division of the Company continued the ‘Punarjyoti’ (‘Rebirth of Eyes’), campaign, which promotes the noble message of eye donation after death. Every product pack contains an insert of the eye donation form, helpline numbers and provides patients with detailed information about the eye donation process.
Principle 5
1. Does the policy of the Company on human rights cover only the Company or extend to the Group/Joint Ventures/Suppliers/Contractors/NGOs/Others?
The Company remains committed to protect as also respect human rights. The Company’s codes of conduct and human resource practices cover most of these aspects. The Company does not hire child labour, forced labour or involuntary labour and does not discriminate its employees.
2. How many stakeholder complaints have been received in the past financial year and what percent was satisfactorily resolved by the management?
During the year under review, the Company did not receive any such complaint.
84 | Lupin Limited
Principle 6
1. Does the policy related to Principle 6 cover only the Company or extends to the Group/Joint Ventures/Suppliers/Contractors/NGOs/others?
The policy covers the Company, its subsidiaries as well as all contractors working within the premises of the Company.
2. Does the Company have strategies/initiatives to address global environmental issues such as climate change, global warming, etc.? Y/N. If yes, please give hyperlink for webpage etc.
The Company has always accorded the highest priority for conservation and optimum utilization of natural resources. The Environment, Health and Safety policy of the Company stresses on operating in environmentally responsible manner.
Energy-efficient initiatives are embarked upon with a view to reduce overall consumption. Continuous efforts are made to conserve energy by eliminating/reducing waste (http://home.lupinworld.com). Water being a precious resource, a mechanism for recycling waste water is in place.
The Company has initiated the process of shifting from high Ozone depleting substances (R 11) being used as refrigerants to less/zero potential refrigerants like R 22/R 134A.
3. Does the Company identify and assess potential environmental risks? Y/N.
Yes, all new facilities and products of the Company are assessed for risks through internal and external mechanism viz. environmental impact assessments and development of environmental management plans. The environmental management plans are reviewed during internal meetings. The Company received the prestigious International Sustainability Rating System (ISRS) certification after audit by external independent parties. The Company is the first in the pharmaceutical industry in India to have received the certification for three of its units.
4. Does the Company have any project related to Clean Development Mechanism? If so, provide details thereof, in about 50 words or so. Also, if yes, whether any environmental compliance report is filed?
At present, the Company does not have any project related to Clean Development Mechanism.
5. Has the Company undertaken any other initiatives on - clean technology, energy efficiency, renewable energy, etc. Y/N. If yes, please give hyperlink for webpage etc.
The Company saved fossil fuel by replacing steam generating boilers which run on fossil fuel to agro waste.
The following energy-efficient and clean technology initiatives were carried out at different locations of the Company: -
• Manufacturing products by enzymatic route in place of chemical route resulted in lesser generation of waste, reduced emissions to the air and reduction of greenhouse emissions.
• Replaced certain operations like centrifuging by agitated nutsche filtration to reduce workplace solvent levels.
• Shifted load of reciprocating refrigeration compressor on screw compressor having better specific power consumption.
• Installed automatic solar light sensors for external street lighting.
• Improved load Factor on purchased power by utilization of maximum load.
• Reduced water load on ETP by utilizing RO reject water in cooling tower.
• Saved energy in HVAC system by shifting load from chilled brine to chilled water.
• Replaced FTL Lamps with Energy Saving T5 Lamps.
• Installed AHF for power quality improvement and losses.
6. Are the Emissions/Waste generated by the Company within the permissible limits given by CPCB/SPCB for the financial year being reported?
Yes. The same are monitored by both internal and approved external agencies.
7. Number of show cause/legal notices received from CPCB/SPCB which are pending (i.e. not resolved to satisfaction) as on end of Financial Year.
There were no unresolved show cause/legal notices received from CPCB/SPCB.
Annual Report 2014 | 85

Principle 7
1. Is your Company a member of any trade and chamber or association? If Yes, Name only those major ones that your business deals with:
The Company is a member of various trade bodies, task forces and forums, chambers and associations inter alia: - a. Federation of Indian Chambers of Commerce and Industry (FICCI);
b. Confederation of Indian Industry (CII);
c. The Associated Chambers of Commerce and Industry (ASSOCHAM);
d. Indian Pharmaceutical Alliance (IPA);
e. Indian Drugs Manufacturers Association (IDMA);
f. Bulk Drugs Manufacturers Association (BDA);
g. Pharmaceutical Export Promotion Council of India (PHARMAEXCIL);
h. Bombay Chamber of Commerce and Industry; and
i. Federation of Indian Export Organisation (FIEO).
2. Have you advocated/lobbied through above associations for the advancement or improvement of public good? Yes/No; if yes specify the broad areas (drop box: Governance and Administration, Economic Reforms,
Inclusive Development Policies, Energy security, Water, Food Security, Sustainable Business Principles, Others).
The Company has been advocating at various forums, the measures to be undertaken to address basic issues related to improvement of public health in order to promote a balanced and sustainable economic development. The Company has been making continuous efforts to promote the use of generic medicines with a view to make available affordable medical treatment to the under-privileged sections of the society. The Company supports the government in its efforts to harness the country’s innovation capabilities, and suggests measures to offer facilities and incentives viz., infrastructure as well as weighted tax deductions on expenditure incurred by Indian companies on research & development (R&D), in order to encourage investments in R&D.
Principle 8
1. Does the Company have specified programmes/initiatives/projects in pursuit of the policy related to Principle 8? If yes details thereof.
The Company firmly believes that it is its duty to give back to the society which helped it flourish, in order to ensure collective and balanced progress of all the sections.The Company undertakes its Corporate Social Responsibility (CSR) activities with a mission to assist the less fortunate strata of rural India.
In pursuance of its mission of achieving inclusive growth and development, the Company carried out CSR activities focusing mainly on: -
• Agriculturaldevelopment;
• Promotionofruralindustries;
• Womenempowerment;
• Animalhusbandry;
• Communityhealthmanagement;
• Sportsactivities;
• Floodandfirereliefactivities;
• Educationandtraining;
• Naturalresourcemanagement;
• Infrastructuredevelopment;and
• Learnandearnactivities.
86 | Lupin Limited

2. Are the programmes/projects undertaken through in-house team/own foundation/external NGO/government structures/any other organization?
The CSR activities of the Company are implemented mainly through Lupin Human Welfare and Research Foundation (LHWRF) and Matashree Gomati Devi Jana Seva Nidhi, a sister organisation of LHWRF. Both have a common long-term commitment to transform rural lives across India and whose main objectives are social and economic upliftment of families below the poverty line with special focus on women empowerment, healthcare, sports and education. The emphasis is to make less privileged sections of the society self-reliant.
3. Have you done any impact assessment of your initiative? Impact assessments of CSR initiatives are done through qualitative feedbacks from beneficiaries of projects undertaken.
Projects undertaken in partnership with central/state governments and semi-government agencies have their own monitoring mechanisms.
4. What is your Company’s direct contribution to community development projects - Amount in INR and the details of the projects undertaken?
During the year ended March 31, 2014, an amount of H 145.2 million was spent on various community development projects namely economic upliftment through Agricultural development, Promotion of rural industries, Women empowerment, Animal husbandry, Community health management, Sports activities, Flood and fire relief activities, Education and training, Natural resource management, Infrastructure development and Learn and earn activities.
5. Have you taken steps to ensure that this community development initiative is successfully adopted by the community? Please explain in 50 words, or so.
Public partnership model is followed in the CSR activities by actively involving the community in the decision making process. Before initiating any CSR activity, needs of the community are identified. The Company implements its CSR activities through community groups such as women self-help groups, farmer clubs and village development communities.
Principle 9
1. What percentage of customer complaints/consumer cases are pending as on the end of financial year?
As on March 31, 2014, about 1% of customer complaints received during the year, were pending, which have since been resolved.
2. Does the Company display product information on the product label, over and above what is mandated as per local laws? Yes/No/N.A./Remarks (additional information).
The Company follows all legal statutes with respect to product labeling and displaying of product information.
3. Is there any case filed by any stakeholder against the Company regarding unfair trade practices, irresponsible advertising and/or anti-competitive behaviour during the last five years and pending as on end of financial year. If so, provide details thereof, in about 50 words or so.
Nil.
4. Did your Company carry out any consumer survey/consumer satisfaction trends?
Consumer surveys are regularly carried out by the Company at doctor level.
For and on behalf of the Board of Directors
Dr. Desh Bandhu GuptaChairman
Mumbai, May 7, 2014
Annual Report 2014 | 87

consolidatedaccounts
88 | Lupin Limited

independent auditoRs’ RepoRtto tHe BoaRd oF diRectoRs oF lupin limited
Report on the Consolidated Financial StatementsWe have audited the accompanying consolidated financial statements of LUPIN LIMITED (the “Company”), and its subsidiaries (the Company and its subsidiaries constitute “the Group”), which comprise the Consolidated Balance Sheet as at March 31, 2014, the Consolidated Statement of Profit and Loss and the Consolidated Cash Flow Statement for the year then ended, and a summary of the significant accounting policies and other explanatory information.
Management’s Responsibility for the Consolidated Financial StatementsThe Company’s Management is responsible for the preparation of these consolidated financial statements that give a true and fair view of the consolidated financial position, consolidated financial performance and consolidated cash flows of the Group in accordance with the accounting principles generally accepted in India. This responsibility includes the design, implementation and maintenance of internal control relevant to the preparation and presentation of the consolidated financial statements that give a true and fair view and are free from material misstatement, whether due to fraud or error.
Auditors’ ResponsibilityOur responsibility is to express an opinion on these consolidated financial statements based on our audit. We conducted our audit in accordance with the Standards on Auditing issued by the Institute of Chartered Accountants of India. Those Standards require that we comply with ethical requirements and plan and perform the audit to obtain reasonable assurance about whether the consolidated financial statements are free from material misstatement.
An audit involves performing procedures to obtain audit evidence about the amounts and the disclosures in the consolidated financial statements. The procedures selected depend on the auditor’s judgement, including the assessment of the risks of material misstatement of the consolidated financial statements, whether due to fraud or error. In making those risk assessments, the auditor considers internal control relevant to the Company’s preparation and presentation of the consolidated financial statements that give a true and fair view in order to design audit procedures that are appropriate in the circumstances, but not for the purpose of expressing an opinion on the effectiveness of the Company’s internal control. An audit also includes evaluating the appropriateness of the accounting policies used and the reasonableness of the accounting estimates made by the Management, as well as
evaluating the overall presentation of the consolidated financial statements.
We believe that the audit evidence we have obtained is sufficient and appropriate to provide a basis for our audit opinion.
OpinionIn our opinion and to the best of our information and according to the explanations given to us, and based on the consideration of the reports of the other auditors on the financial statements / financial information of the subsidiaries referred to below in the Other Matter paragraph, the aforesaid consolidated financial statements give a true and fair view in conformity with the accounting principles generally accepted in India:
(a) in the case of the Consolidated Balance Sheet, of the state of affairs of the Group as at March 31, 2014;
(b) in the case of the Consolidated Statement of Profit and Loss, of the profit of the Group for the year ended on that date; and
(c) in the case of the Consolidated Cash Flow Statement, of the cash flows of the Group for the year ended on that date.
Other MatterWe did not audit the financial statements / financial information of 18 subsidiaries, whose financial statements / financial information reflect total assets (net) of H 19,268.8 million as at March 31, 2014, total revenues of H 21,982.9 million and net cash outflows amounting to H 990.8 million for the year ended on that date, as considered in the consolidated financial statements. These financial statements / financial information have been audited by other auditors, whose reports have been furnished to us by the Management and our opinion, in so far as it relates to the amounts and disclosures included in respect of these subsidiaries, is based solely on the reports of the other auditors.
Our opinion is not qualified in respect of this matter.
For Deloitte Haskins & Sells LLPChartered Accountants
(Firm’s Registration No. 117366W/W-100018)
K. A. KatkiPartner
Place : Mumbai (Membership No.: 038568)Dated : May 7, 2014
Annual Report 2014 | 89

consolidated Balance sHeet as at maRcH 31, 2014
As at 31.03.2014 As at 31.03.2013
Note I in million I in million
EQUITY AND LIABILITIES
Shareholders’ Funds
Share Capital 2 896.8 895.1
Reserves and Surplus 3 68,418.9 51,146.7
69,315.7 52,041.8
Minority Interest 44 669.4 594.5
Non-Current Liabilities
Long-Term Borrowings 4 1,509.6 2,470.6
Deferred Tax Liabilities (net) 5 2,486.6 2,336.8
Other Long-Term Liabilities 6 458.6 501.2
Long-Term Provisions 7 1,324.9 1,124.5
5,779.7 6,433.1
Current Liabilities
Short-Term Borrowings 8 4,023.8 7,268.2
Trade Payables 9 15,941.3 15,428.8
Other Current Liabilities 10 2,876.4 3,812.5
Short-Term Provisions 11 3,454.0 3,559.7
26,295.5 30,069.2
TOTAL 102,060.3 89,138.6
ASSETS
Non-Current Assets
Fixed Assets 12
Tangible Assets 26,038.3 24,133.9
Intangible Assets - Acquired 939.0 794.6
Capital Work-in-Progress 2,842.6 2,496.9
Intangible Assets Under Development 198.6 610.1
30,018.5 28,035.5
Goodwill on Consolidation 42 (e) 6,578.7 5,073.2
Non-Current Investments 13 20.6 20.6
Deferred Tax Assets (net) 14 708.1 704.4
Long-Term Loans and Advances 15 3,729.9 3,873.6
41,055.8 37,707.3
Current Assets
Current Investments 16 1,764.1 -
Inventories 17 21,294.5 19,489.3
Trade Receivables 18 24,641.0 21,869.9
Cash and Bank Balances 19 7,975.0 4,348.8
Short-Term Loans and Advances 20 3,016.9 3,396.7
Other Current Assets 21 2,313.0 2,326.6
61,004.5 51,431.3
TOTAL 102,060.3 89,138.6
See accompanying notes forming part of the consolidated financial statements
In terms of our report attachedFor Deloitte Haskins & Sells LLP For Lupin LimitedChartered Accountants
K. A. Katki Dr. Desh Bandhu Gupta Dr. Kamal K. Sharma Vinita GuptaPartner Chairman Vice Chairman Chief Executive Officer
Nilesh Gupta M. D. Gupta Dr. Vijay Kelkar Managing Director Executive Director Director
Richard Zahn R. A. Shah Dr. K. U. Mada Director Director Director
Dileep C. Choksi Director
Place : Mumbai R. V. SatamDated : May 7, 2014 Company Secretary
90 | Lupin Limited

consolidated statement oF pRoFit and loss FoR tHe yeaR ended maRcH 31, 2014
For the Current
Year ended
31.03.2014
For the Previous
Year ended
31.03.2013
Note I in million I in million
INCOME:
Revenue from Operations (Gross) 22 113,670.5 97,032.0
Less : Excise Duty 804.8 619.0
Revenue from Operations (Net) 112,865.7 96,413.0
Other Income 23 1,164.8 278.5
Total Revenue 114,030.5 96,691.5
EXPENSES:
Cost of Raw and Packing Materials Consumed 24 24,213.6 22,247.8
Purchases of Stock-in-Trade 15,964.3 15,159.2
Changes in Inventories 25 (2,004.1) (1,922.0)
of Finished Goods, Work-in-Process and Stock-in-Trade
Employee Benefits Expense 26 14,646.5 12,666.2
Finance Costs 27 266.5 409.5
Depreciation and Amortisation Expense 12 2,609.7 3,321.9
Other Expenses 28 30,017.5 25,562.9
Total Expenses 85,714.0 77,445.5
Profit before Tax 28,316.5 19,246.0
Tax Expense / (Benefit):
- Current Tax Expense 9,551.7 5,647.6
- Tax Expense / (Benefit) for Prior Years (15.7) 23.5
- Add : Reversal of MAT Credit for Prior Years - 157.9
Net Current Tax Expense 9,536.0 5,829.0
- Deferred Tax (net) 85.5 12.6
Profit after Tax before Minority Interest 18,695.0 13,404.4
Less : Minority Interest 331.3 262.8
Profit for the year 18,363.7 13,141.6
Earnings per equity share (in H) 34
Basic 40.99 29.39
Diluted 40.79 29.26
Face Value of Equity Share (in H) 2.00 2.00
See accompanying notes forming part of the consolidated financial statements
In terms of our report attachedFor Deloitte Haskins & Sells LLP For Lupin LimitedChartered Accountants
K. A. Katki Dr. Desh Bandhu Gupta Dr. Kamal K. Sharma Vinita GuptaPartner Chairman Vice Chairman Chief Executive Officer
Nilesh Gupta M. D. Gupta Dr. Vijay Kelkar Managing Director Executive Director Director
Richard Zahn R. A. Shah Dr. K. U. Mada Director Director Director
Dileep C. Choksi Director
Place : Mumbai R. V. SatamDated : May 7, 2014 Company Secretary
Annual Report 2014 | 91

consolidated casH FloW statement FoR tHe yeaR ended maRcH 31, 2014
For the Current Year ended31.03.2014
For the Previous Year ended31.03.2013
I in million I in million
A. Cash Flow from Operating Activities
Profit before Tax 28,316.5 19,246.0
Adjustments for:
Depreciation and Amortisation Expense 2,609.7 3,321.9
Loss on sale / write-off of Fixed Assets (net) 119.4 144.9
Finance Costs 266.5 409.5
Net Gain on Sale of Current Investments (5.5) -
Interest on Fixed Deposits with Banks (138.6) (115.9)
Dividend on Current Investments (26.0) -
Dividend on Long-Term Investment (0.2) (0.5)
Provision for Doubtful Trade Receivables / Advances / Deposits 273.7 59.1
Provision for Doubtful Advances written back (7.3) -
Credit Balances Written Back (176.8) -
Expenses on Employees Stock Options / Stock Appreciation Rights 211.0 43.7
Impairment of Assets 429.0 256.8
Profit on Disposal of Subsidiary - (0.2)
Provision for Diminution in value of Non-Current Investments written back - (0.2)
Unrealised Exchange loss on revaluation (net) 595.5 72.5
Net unrealised exchange difference during the year (45.4) 4.2
Operating Profit before Working Capital Changes 32,421.5 23,441.8
Changes in working capital:
Adjustments for (increase) / decrease in operating assets:
Inventories (1,563.3) (2,009.1)
Trade Receivables (3,360.3) (3,924.8)
Short-Term Loans and Advances 415.8 (366.2)
Long-Term Loans and Advances (858.5) (277.3)
Other Current Assets 111.3 (989.4)
Adjustments for increase / (decrease) in operating liabilities:
Trade Payables 256.5 1,462.1
Other Current Liabilities 311.7 39.5
Other Long-Term Liabilities (71.7) (20.8)
Short-Term Provisions (82.9) 254.7
Long-Term Provisions 178.3 337.7
Cash Generated from Operations 27,758.4 17,948.3
Net Income tax paid (7,719.1) (5,438.7)
Net Cash Flow from Operating Activities 20,039.3 12,509.6
B. Cash Flow from Investing Activities
Capital expenditure on fixed assets, including capital advances (5,286.4) (5,511.1)
Proceeds from sale of fixed assets 34.0 98.7
Net Gain on sale of Current Investments 5.5 -
Proceeds from sale of Long-Term Investments - 4.7
Consideration for acquisition of subsidiary companies (886.8) (102.1)
Bank balances not considered as Cash and cash equivalents (net) (2,616.5) 174.8
Interest on Fixed Deposits with Banks 138.6 115.9
Dividend on Current Investments 26.0 -
Dividend on Long-Term Investments 0.2 0.5
Net Cash used in Investing Activities (8,585.4) (5,218.6)
92 | Lupin Limited

For the Current Year ended31.03.2014
For the Previous Year ended31.03.2013
I in million I in million
C. Cash Flow from Financing Activities
Repayment of Long-Term Borrowings (net) (1,984.6) (1,468.8)
Repayment of Short-Term Borrowings - Loans from banks (net) (3,313.6) (3,176.6)
Proceeds from issue of equity shares (ESOPs) 1.7 1.7
Securities Premium Received (ESOPs) 237.7 126.7
Finance Costs (278.2) (422.0)
Dividend paid (3,214.9) (1,434.0)
Corporate Tax on Dividend (19.2) (255.2)
Net Cash used in Financing Activities (8,571.1) (6,628.2)
Net increase in Cash and Cash Equivalents 2,882.8 662.8
Cash and Cash equivalents as at the beginning of the year 3,109.3 2,446.5
Cash and Cash equivalents taken over on acquisition of subsidiary companies 74.1 -
Cash and Cash equivalents as at the end of the year 6,066.2 3,109.3
Reconciliation of Cash and Cash equivalents with the Balance Sheet
Cash and Bank Balances as per Balance Sheet (Refer note 19) 7,975.0 4,348.8
Unrealised loss / (gain) on foreign currency cash and cash equivalents 180.1 (3.0)
Less : Bank balances not considered as Cash and Cash equivalents as defined in AS-3 - Cash Flow Statements (Refer note 19)
3,853.0 1,236.5
Add : Current investments considered as part of Cash and cash equivalents (Refer Note 16)
1,764.1 -
Cash and Cash equivalents as restated as at the year end 6,066.2 3,109.3
Notes :1. The above Cash Flow Statement has been prepared under the ‘Indirect Method’ as set out in the Accounting Standard 3 (AS-3), “Cash
Flow Statements”.
2. Cash comprises cash on hand, Current Accounts and deposits with banks. Cash equivalents are short-term balances (with an original maturity of three months or less from the date of acquisition), highly liquid investments that are readily convertible into known amounts of cash and which are subject to insignificant risk of changes in value.
In terms of our report attachedFor Deloitte Haskins & Sells LLP For Lupin LimitedChartered Accountants
K. A. Katki Dr. Desh Bandhu Gupta Dr. Kamal K. Sharma Vinita GuptaPartner Chairman Vice Chairman Chief Executive Officer
Nilesh Gupta M. D. Gupta Dr. Vijay Kelkar Managing Director Executive Director Director
Richard Zahn R. A. Shah Dr. K. U. Mada Director Director Director
Dileep C. Choksi Director
Place : Mumbai R. V. SatamDated : May 7, 2014 Company Secretary
Annual Report 2014 | 93

notes FoRminG paRt oF tHe consolidated Financial statements
1. SIGNIFICANT ACCOUNTING POLICIES:
a) Basis of accounting and preparation of Consolidated Financial Statements: i) The financial statements of the subsidiaries and associate used in the consolidation are drawn upto the same reporting
date as that of Lupin Limited (“the Company”), namely March 31, 2014.
ii) The Consolidated Financial Statements of the Company have been prepared in accordance with the Generally Accepted Accounting Principles in India (Indian GAAP) to comply with the Accounting Standards notified under Section 211(3C) of the Companies Act, 1956 (“the 1956 Act”) (which continue to be applicable in respect of Section 133 of the Companies Act, 2013 (“the 2013 Act”) in terms of General Circular 15/2013 dated 13 September, 2013 of the Ministry of Corporate Affairs) and the relevant provisions of the 1956 Act / 2013 Act, as applicable. The Consolidated Financial Statements have been prepared on accrual basis under the historical cost convention. The accounting policies adopted in the preparation of the Consolidated Financial Statements are consistent with those followed in the previous year.
b) Principles of Consolidation: i) The Consolidated Financial Statements of the Company and its subsidiaries (“the Group”) have been consolidated in
accordance with the Accounting Standard 21 (AS-21) “Consolidated Financial Statements”, on line-by-line basis by adding together like items of assets, liabilities, income and expenses, after eliminating intra-group balances, intra–group transactions and the unrealised profits / losses. Reference in these notes to Company, Holding Company, Companies or Group shall mean to include Lupin Limited, or any of its subsidiaries, unless otherwise stated.
ii) The financial statements of the Company and its subsidiaries have been consolidated using uniform accounting policies for like transactions and other events in similar circumstances as mentioned in those policies.
iii) The excess of cost to the Group of its investment in the subsidiaries, on the acquisition dates over and above the Company’s share of equity in the subsidiaries, is recognised in the Consolidated Financial Statements as “Goodwill on Consolidation” and carried forward in the accounts. The said Goodwill is not amortised, however, it is tested for impairment at each Balance Sheet date and the impairment loss, if any, is provided for. On the other hand, where the share of equity in the subsidiaries as on the date of investment is in excess of cost of investments of the Group, it is recognised as “Capital Reserve” and shown under the head “Reserves and Surplus”.
iv) Minority Interest in the net assets of the consolidated subsidiaries consist of: a) The amount of equity attributable to minorities as at the date on which the investment in a subsidiary is made
and,
b) The Minorities share of movements in equity since the date the parent-subsidiary relationship came into existence. The losses applicable to the minority in excess of the minority interest in the equity of the subsidiary and further losses applicable to the minority, are adjusted against the majority interest except to the extent that the minority has a binding obligation to and is able to make good the losses. If the subsidiaries subsequently reports profit, all such profits are allocated to the majority interest until the minority’s share of losses previously absorbed by the majority has been recovered.
c) Minority Interest is presented separately from the liabilities or assets and the equity of the shareholders in the Consolidated Balance Sheet. Minority Interest in the income or loss of the Company is separately presented.
v) In case of associate, where the Company directly or indirectly through subsidiaries holds more than 20% of equity, investments in associate are accounted for using equity method in accordance with Accounting Standard 23 (AS-23) “Accounting for Investment in Associates in Consolidated Financial Statements”.
The Company accounts for its share in the change in the net assets of the associate, post acquisition, after eliminating unrealised profit and losses resulting from transactions between the Company and its associate, through its Consolidated Statement of Profit and Loss to the extent such change is attributable to the Associates’ Statement of Profit and Loss and through its reserves for the balance.
The difference between the cost of investment in the associate and the share of net assets at the time of acquisition of share in the associate is identified as Goodwill or Capital Reserve, as the case may be, and included in the carrying amount of investment in the associate, and so disclosed.
vi) The difference between the proceeds from sale / disposal of investment in a subsidiary and the carrying amount of
94 | Lupin Limited

assets less liabilities as of the date of sale / disposal is recognised in the Consolidated Statement of Profit and Loss as the profit or loss on sale / disposal of investment in subsidiary.
c) Use of Estimates: The preparation of the Consolidated Financial Statements in conformity with Indian GAAP requires the Management
to make estimates and assumptions considered in the reported amounts of assets and liabilities (including contingent liabilities) and the reported income and expenses during the year. The Management believes that the estimates used in the preparation of the Consolidated Financial Statements are prudent and reasonable. Future results could differ due to these estimates and the differences between the actual results and the estimates are recognised in the periods in which the results are known / materialise.
d) Tangible Fixed Assets: Fixed Assets are carried at cost less accumulated depreciation and impairment losses, if any. The cost of fixed assets includes
interest on borrowings attributable to acquisition of qualifying fixed assets up to the date the asset is ready for its intended use and other incidental expenses incurred up to that date. The Company has adopted the provisions of paragraph 46A of AS-11 “The Effects of Changes in Foreign Exchange Rates”, accordingly, exchange differences arising on restatement / settlement of long-term foreign currency borrowings relating to acquisition of depreciable fixed assets are adjusted to the cost of the respective assets and depreciated over the remaining useful life of such assets. Subsequent expenditure relating to fixed assets is capitalised only if such expenditure results in an increase in the future benefits from such asset beyond its previously assessed standard of performance.
Capital work-in-progress in respect of assets which are not ready for their intended use are carried at cost, comprising of direct costs, related incidental expenses and attributable interest.
e) Intangible Assets: Intangible assets are carried at cost less accumulated amortisation and impairment losses, if any. The cost of an intangible
asset comprises of its purchase price, including any import duties and other taxes (other than those subsequently recoverable from the taxing authorities), and any directly attributable expenditure on making the asset ready for its intended use.
Expenditure on research and development eligible for capitalisation are carried as Intangible assets under development where such assets are not yet ready for their intended use.
f) Foreign Currency Transactions / Translations: i) Transactions denominated in foreign currency are recorded at exchange rates prevailing at the date of transaction or
at rates that closely approximate the rate at the date of the transaction.
ii) Foreign currency monetary items (other than derivative contracts) of the Company, outstanding at the balance sheet date are restated at the year-end rates. Non-monetary items of the Company are carried at historical cost.
iii) Exchange differences arising on settlement / restatement of short-term foreign currency monetary assets and liabilities of the Company and its integral foreign operations are recognised as income or expense in the Consolidated Statement of Profit and Loss.
The exchange differences arising on restatement / settlement of long-term foreign currency monetary items are capitalised as part of the depreciable fixed assets to which the monetary item relates and depreciated over the remaining useful life of such assets or amortised on settlement over the maturity period of such items if such items do not relate to acquisition of depreciable fixed assets. The unamortised exchange difference is carried under Reserves and Surplus as “Foreign currency monetary item translation difference account” net of the tax effect thereon, where applicable.
iv) Premium / discount on forward exchange contracts, which are not intended for trading or speculation purposes, are amortised over the period of the contracts if such contracts relate to monetary items as at the Balance Sheet date.
v) In respect of the foreign offices / branches, which are integral foreign operations, all revenues and expenses during the year are reported at average rates. Outstanding balances in respect of monetary assets and liabilities are restated at the year end exchange rates. Outstanding balances in respect of non-monetary assets and liabilities are stated at the rates prevailing on the date of the transaction. Net gain / loss on foreign currency translation is recognised in the Consolidated Statement of Profit and Loss.
Annual Report 2014 | 95

vi) Foreign Subsidiaries: In case of foreign subsidiaries, the local accounts are maintained in their local currency except the subsidiary companies
at Switzerland whose accounts are maintained in USD.
a) The financial statements of the subsidiaries, whose operations are integral foreign operations for the Company, have been translated to Indian Rupees on the following basis:
i) All income and expenses are translated at the average rate of exchange prevailing during the year.
ii) Monetary assets and liabilities are translated at the closing rate on the Balance Sheet date.
iii) Non monetary assets and liabilities are translated at historical rates.
iv) The resulting exchange difference is accounted in ‘Exchange Rate Difference on Translation Account’ and is charged / credited to the Consolidated Statement of Profit and Loss.
b) The financial statements of subsidiaries, whose operations are non-integral foreign operations for the Company, have been translated to Indian Rupees on the following basis:
i) All income and expenses are translated at the average rate of exchange prevailing during the year.
ii) Monetary and non monetary assets and liabilities are translated at the closing rate as on the Balance Sheet date.
iii) The resulting exchange difference is accounted in ‘Foreign Currency Translation Reserve’ and carried in the Balance Sheet.
c) When a non-integral foreign operation is reclassified as an integral foreign operation, the translated amounts for non-monetary items at the date of the change are treated as the historical cost for those items in the period of change and subsequent periods. Exchange differences that have been deferred are not recognised as income or expense until the disposal of the operation.
Subsequent to the date of change in classification of the foreign operation, transactions and balances in such operations are accounted as per the accounting policy applicable to the new classification.
g) Hedge Accounting: The Company uses foreign currency forward contracts and currency options to hedge its risks associated with foreign
currency fluctuations relating to highly probable forecast transactions. The Company designates such forward / option contracts in a cash flow hedging relationship by applying the hedge accounting principles set out in Accounting Standard 30 (AS-30) “Financial Instruments: Recognition and Measurement”. These forward / option contracts are stated at fair value at each reporting date. Changes in the fair value of these forward / option contracts that are designated and effective as hedges of future cash flows are recognised directly in “Cash Flow Hedge Reserve Account” under Reserves and Surplus, net of applicable deferred income taxes and the ineffective portion is recognised immediately in the Consolidated Statement of Profit and Loss. Amounts accumulated in the “Cash Flow Hedge Reserve Account” are reclassified to the Consolidated Statement of Profit and Loss in the same period during which the forecasted transaction affects profit and loss. Hedge accounting is discontinued when the hedging instrument expires or is sold, terminated, or exercised, or no longer qualifies for hedge accounting. For forecasted transactions, any cumulative gain or loss on the hedging instrument recognised in “Cash Flow Hedge Reserve Account” is retained until the forecasted transaction occurs. If the forecasted transaction is no longer expected to occur, the net cumulative gain or loss recognised in “Cash Flow Hedge Reserve Account” is immediately transferred to the Consolidated Statement of Profit and Loss.
h) Derivative Contracts: The Company enters into derivative contracts in the nature of currency options and forward contracts with an intention to
hedge its existing assets and liabilities and highly probable forecast transactions in foreign currency. Derivative contracts which are closely linked to the existing assets and liabilities are accounted as per the policy stated for Foreign Currency Transactions / Translations.
Derivative contracts designated as a hedging instrument for highly probable forecast transactions are accounted as per the policy stated for Hedge Accounting.
All other derivative contracts are marked-to-market on a portfolio basis and losses, if any, are recognised in the Consolidated Statement of Profit and Loss. Gains arising on the same are not recognised, until realised, on grounds of prudence.
i) Investments: Long-Term investments are carried individually at cost, less provision for diminution, other than temporary, in the value
of such investments. Cost of investments includes expenses directly incurred on acquisition of investments. Current investments are carried individually at lower of cost and fair value.
96 | Lupin Limited

j) Inventories: Inventories of all procured materials and Stock-in-Trade are valued at the lower of cost (on moving weighted average
basis) and the net realisable value after providing for obsolescence and other losses, where considered necessary. Cost includes all charges in bringing the goods to their present location and condition, including octroi and other levies, transit insurance and receiving charges. Work-in-process and finished goods include appropriate proportion of overheads and, where applicable, excise duty.
k) Revenue Recognition: Revenue from sale of goods is recognised net of returns, product expiry claims and trade discounts, on transfer of significant
risks and rewards in respect of ownership to the buyer. Sales include excise duty but exclude sales tax and value added tax. Sales are also netted off for probable non-saleable return of goods from the customers, estimated on the basis of historical data of such returns.
Income from Research Services including sale of technology / know-how (rights, licenses, dossiers and other intangibles) is recognised in accordance with the terms of the contract with customers when the related performance obligation is completed, or when risks and rewards of ownership are transferred, as applicable.
Revenue is recognised when it is reasonable to expect that the ultimate collection will be made.
Interest income is accounted on accrual basis. Dividend from investment is recognised as revenue when right to receive is established.
Revenue from service charges is recognised on rendering of the related services in accordance with the terms of the agreement.
l) Depreciation and Amortisation: Depreciation on fixed assets is provided on straight line basis in the manner and at the rates prescribed in Schedule XIV to
the Companies Act, 1956, except in respect of the following category of assets, in whose case life of assets is assessed as under:
i) The Company and Subsidiary in India
Assets Estimated Useful LifeCaptive Power Plant at Tarapur 15 yearsCertain assets provided to employees 3 yearsLeasehold Land Over the period of leaseIntangible Assets (Computer Software) 3 to 6 yearsIntangible Assets (Goodwill - Acquired) 5 yearsIntangible Assets (Trademark and Licences) 5 years
Assets costing H 5000/- or less are depreciated at 100% rate on prorata basis in the year of purchase.
ii) Subsidiaries in Japan
Assets Estimated Useful LifeBuildings* 7 to 38 yearsAttached facilities* 3 to 18 yearsPlant and Equipment 4 to 10 yearsTools 5 yearsFurniture and Fixtures 2 to 20 yearsVehicles 3 to 7 yearsIntangibles
- Marketing Rights 5 years- Computer Software 5 years- Trademark and Licences 3 to 10 years
* For assets acquired from April 1, 1998, straight line method is followed.
iii) Subsidiaries in USA
Assets Estimated Useful LifeComputers 3 yearsFurniture and Fixtures 5 yearsOffice and Other Equipment 7 yearsSoftware 5 years
Annual Report 2014 | 97

iv) Subsidiaries in Australia
Assets Estimated Useful LifeFurniture and Fixtures 10 yearsComputers 3 yearsOther Equipment 6.7 yearsProduct Licences 5 to 10 yearsTrademarks 5 yearsComputer Software 3 yearsGoodwill Acquired 5 yearsDossiers / Marketing Rights 5 years
v) Subsidiary in South Africa
Assets Estimated Useful LifePlant and Equipment 5 yearsVehicles 5 yearsFurniture and Fixtures 6 yearsOffice Equipment (including assets under finance lease) 5 yearsComputers 3 yearsComputer Software 2 yearsTrademarks 10 yearsDossiers / Licences 10 to 20 years *
* Considering product life cycle, market demand for products, expected usage and future economic benefits to the Subsidiary.
vi) Subsidiary in Germany
Assets Estimated Useful LifeBuildings* 10 to 30 yearsPlant and Equipment 5 to 15 yearsFurniture and Fixtures 3 to 14 yearsComputers 3 to 5 years Computer Software 3 to 5 yearsMarketing Rights 3 to 10 years
* Building annex completed in 1989 (estimated useful life – 25 years) and the residential building purchased in 2005 (estimated useful life – 50 years) are depreciated according to the reducing-balance method in accordance with tax regulations.
vii) Subsidiaries in Philippines
Assets Estimated Useful LifeBuildings 5 yearsVehicles (including under finance lease) 5 yearsFurniture and Fixtures 5 yearsOffice Equipment 3 yearsPlant and Equipment 3 to 5 yearsComputer Software 3 yearsMarketing Rights 10 years
viii) Subsidiary in Switzerland
Assets Estimated Useful LifeComputers 3 yearsMarketing Rights 5 years
ix) Subsidiary in Netherlands
Assets Estimated Useful LifePlant and Equipment 5 yearsOffice Equipment 5 yearsIntangible Assets (Trademarks and Licenses Acquired) 5 to 14 years *
* Considering expected usage and future economic benefits to the Subsidiary.
98 | Lupin Limited

x) Subsidiary in Brazil
Assets Estimated Useful LifeFurniture and Fixtures 10 yearsOffice Equipment 5 years
xi) Subsidiary in Mexico
Assets Estimated Useful LifeFurniture and Fixtures 10 years
The estimated useful lives of intangible assets and the amortisation period are reviewed at the end of each financial year and the amortisation method is revised to reflect the changed pattern.
m) Employee Benefits: Employee benefits include provident fund, social security, gratuity fund, compensated absences, post employment and
other long-term benefits. a. Post Employment Benefits and Other Long-Term Benefits: i) Defined Contribution Plan: The Group’s contribution towards provident fund, social security and superannuation fund for certain eligible
employees are considered to be defined contribution plans as the Group does not carry any further obligations, apart from the contributions made on a monthly basis. Such contributions are charged as an expense to the Consolidated Statement of Profit and Loss when services are rendered by the employees.
ii) Defined Benefit and Other Long-Term Benefit Plans: Company’s liabilities towards defined benefit plans and other long-term benefits viz. gratuity and compensated
absences not expected to occur within twelve months, after the end of the period in which employee renders service, are determined using the Projected Unit Credit Method. Actuarial valuations under the Projected Unit Credit Method are carried out at the Balance Sheet date. Actuarial gains and losses are recognised in the Consolidated Statement of Profit and Loss in the period of occurrence of such gains and losses. Past service cost is recognised immediately to the extent benefits are vested, otherwise it is amortised on straight-line basis over the remaining average period until the benefits become vested.
The retirement benefit obligation recognised in the balance sheet represents the present value of the defined benefit obligation as adjusted for unrecognised past service cost, and as reduced by the fair value of plan assets. Any asset resulting from this calculation is limited to past service cost, plus the present value of available refunds and reductions in future contributions to the scheme.
Provident Fund for certain employees is administered through the “Lupin Limited Employees Provident Fund Trust”. Periodic contributions to the Fund are charged to the Consolidated Statement of Profit and Loss. The Company has an obligation to make good the shortfall, if any, between the return from the investment of the Trust and interest rate notified by the Government.
b. Short-Term Employee Benefits: Short-Term employee benefits expected to be paid in exchange for the services rendered by employees are recognised
at their undiscounted amounts during the period employee renders services. Short-Term compensated absences are provided for based on estimates in accordance with Company rules.
n) Taxes on Income: Income taxes are accounted for in accordance with Accounting Standard 22 (AS-22) “Accounting for Taxes on Income”.
Tax expense comprises both Current Tax and Deferred Tax. Current tax is the amount of tax payable on taxable income for the year as determined in accordance with the provisions of applicable tax laws of the respective jurisdiction where the Company and its Subsidiaries are located.
Minimum Alternate Tax (MAT) paid in accordance with the tax laws, which gives future economic benefits in the form of adjustment to future income tax liability, is considered as an asset if there is convincing evidence that the Company will pay normal income tax. Accordingly, MAT is recognised as an asset in the Balance Sheet when it is highly probable that future economic benefit associated with it will flow to the Company.
Deferred tax is recognised on timing differences, being the differences between the taxable income and the accounting income that originate in one period and are capable of reversal in one or more subsequent periods. Deferred tax is measured using the tax rates and the tax laws enacted or substantively enacted as at the reporting date. Deferred tax liabilities are recognised for all timing differences. Deferred tax assets in respect of unabsorbed depreciation and carry forward of losses are recognised only if there is virtual certainty that there will be sufficient future taxable income available to realise such
Annual Report 2014 | 99

assets. Deferred tax assets are recognised for timing differences of other items only to the extent that reasonable certainty exists that sufficient future taxable income will be available against which these can be realised. Deferred tax assets and liabilities are offset if such items relate to taxes on income levied by the same governing tax laws and the Group has a legally enforceable right for such set off. Deferred tax assets are reviewed at each Balance Sheet date for their realisability.
o) Operating Leases: Assets taken on lease under which all risks and rewards of ownership are effectively retained by the lessor are classified as
operating lease. Lease payments under operating leases are recognised in the Consolidated Statement of Profit and Loss on a straight line basis in accordance with the respective lease agreements.
p) Finance Leases: Assets acquired under lease where the Company has substantially all the risks and rewards of ownership are classified as
finance leases. Such assets are capitalised at the inception of the lease at the lower of the fair value or the present value of minimum lease payments and a liability is created for an equivalent amount. The rent obligations net of interest charges are reflected as secured loans.
q) Provisions, Contingent Liabilities and Contingent Assets: A provision is recognised when the Company has a present obligation as a result of past events and it is probable that an
outflow of resources will be required to settle the obligation in respect of which a reliable estimate can be made. Provisions (excluding retirement benefits) are not discounted to their present value and are determined based on the best estimate required to settle the obligation at the Balance Sheet date. These are reviewed at each Balance Sheet date and adjusted to reflect the current best estimates. Contingent liabilities are disclosed in the Notes. Contingent liabilities are disclosed for (1) possible obligations which will be confirmed only by future events not wholly within the control of the Company or (2) present obligations arising from past events where it is not probable that an outflow of resources will be required to settle the obligation or a reliable estimate of the amount of the obligation cannot be made. Contingent assets are not recognised in the Consolidated Financial Statements.
r) Borrowing Costs: Borrowing costs include interest, amortisation of ancillary costs incurred and exchange differences arising from foreign
currency borrowings to the extent they are regarded as an adjustment to the interest cost. Costs in connection with the borrowing of funds to the extent not directly related to the acquisition of qualifying assets are charged to the Consolidated Statement of Profit and Loss over the tenure of the loan. Borrowing costs, allocated to and utilised for qualifying assets, pertaining to the period from commencement of activities relating to construction / development of the qualifying asset upto the date of capitalisation of such asset is added to the cost of the assets. Capitalisation of borrowing costs is suspended and charged to the Consolidated Statement of Profit and Loss during extended periods when active development activity on the qualifying assets is interrupted.
s) Stock based Compensation: i) Employees Stock Option Plans (“ESOPs”): The compensation cost of stock options granted to employees is measured by the intrinsic value method, i.e. the
difference between the market price of the Company’s shares on the date of the grant of options and the exercise price to be paid by the option holders. The compensation cost, if any, is amortised uniformly over the vesting period of the options.
ii) Stock Appreciation Rights (“SARs”): The compensation cost of SARs granted to employees is measured by the intrinsic value method, i.e. the excess of
the market price of the Company’s shares as at the period end and the acquisition price as on the date of grant. The compensation cost is amortised uniformly over the vesting period of the SARs.
t) Government Grants, subsidies and export incentives: Government grants and subsidies are accounted when there is reasonable assurance that the Company will comply with the
conditions attached to them and it is reasonably certain that the ultimate collection will be made. Capital grants relating to specific fixed assets are reduced from the gross value of the respective fixed assets. Revenue grants are recognised in the Consolidated Statement of Profit and Loss.
Export benefits available under prevalent schemes are accrued in the year in which the goods are exported and there is no uncertainty in receiving the same.
u) Research and Development: Revenue expenditure pertaining to research is charged to the Consolidated Statement of Profit and Loss. Development costs
of products are also charged to the Consolidated Statement of Profit and Loss in the year it is incurred, unless a product’s technological feasibility has been established, in which case such expenditure is capitalised. These costs are charged to
100 | Lupin Limited

the respective heads in the Statement of Profit and Loss in the year it is incurred. The amount capitalised comprises of expenditure that can be directly attributed or allocated on a reasonable and consistent basis for creating, producing and making the asset ready for its intended use. Fixed assets utilised for research and development are capitalised and depreciated in accordance with the policies stated for Tangible Fixed Assets and Intangible Assets.
Expenditure on in-licensed development activities, whereby research findings are applied to a plan or design for the production of new or substantially improved products and processes, is capitalised, if the cost can be reliably measured, the product or process is technically and commercially feasible and the Company has sufficient resources to complete the development and to use and sell the asset.
v) Impairment of Assets: The carrying values of assets / cash generating units at each Balance Sheet date, are reviewed for impairment. If any
indication of impairment exists, the recoverable amount of such assets is estimated and impairment is recognised, if the carrying amount of these assets exceeds their recoverable amount. The recoverable amount is the greater of the net selling price and their value in use. Value in use is arrived at by discounting the future cash flows to their present value based on an appropriate discount factor. When there is indication that an impairment loss recognised for an asset in earlier accounting periods no longer exists or may have decreased, such reversal of impairment loss is recognised in the Consolidated Statement of Profit and Loss, except in case of revalued assets.
w) Earnings per share: Basic earnings per share is computed by dividing the profit / (loss) after tax (including the post tax effect of extraordinary
items, if any) by the weighted average number of equity shares outstanding during the year. Diluted earnings per share is computed by dividing the profit / (loss) after tax (including the post tax effect of extraordinary items, if any) by the weighted average number of equity shares outstanding during the year adjusted for the effects of all dilutive potential equity shares.
x) Insurance claims: Insurance claims are accounted for on the basis of claims admitted / expected to be admitted and to the extent that the
amount recoverable can be measured reliably and it is reasonable to expect the ultimate collection.
y) Service tax input credit: Service tax input credit is accounted for in the books in the period in which the underlying service received is accounted
and when there is reasonable certainty in availing / utilising the credits.
Annual Report 2014 | 101

2. SHARE CAPITAL a) Share Capital
As at 31 March 2014 As at 31 March 2013 No. of Shares H in million No. of Shares H in million
AuthorisedEquity Shares of H 2 each 500,000,000 1,000.0 500,000,000 1,000.0 Issued, Subscribed and Paid upEquity Shares of H 2 each fully paid 448,375,804 896.8 447,529,493 895.1
Total 448,375,804 896.8 447,529,493 895.1
b) Reconciliation of the number of shares and amount outstanding at the beginning and at the end of the reporting period
Particulars As at 31 March 2014 As at 31 March 2013 No. of Shares H in million No. of Shares H in million
Equity Shares outstanding at the beginning of the year 447,529,493 895.1 446,641,681 893.3 Equity Shares issued during the year in the form of ESOPs 846,311 1.7 887,812 1.8 Equity Shares outstanding at the end of the year 448,375,804 896.8 447,529,493 895.1
c) Rights attached to Equity Shares The Company has only one class of equity shares with voting rights having a par value of H 2 per share. The Company declares
and pays dividends in Indian Rupees. The final dividend proposed by the Board of Directors is subject to the approval of the shareholders at the ensuing Annual General Meeting, except in case of interim dividend.
During the year ended 31 March 2014, the Company declared an interim dividend of H 3 per equity share. A final dividend of H 3 per equity share has been recommended by the Board of Directors at its meeting held on 7 May 2014. On approval by the shareholders of the final dividend of H 3 per equity share, the total dividend for the year would be H 6 (previous year H 4) per equity share.
In the event of liquidation of the Company, the shareholders of equity shares will be entitled to receive remaining assets of the Company after distribution of all preferential amounts. The distribution will be in proportion to the number of equity shares held by the shareholders.
d) Details of shares held by each shareholder holding more than 5% equity shares
Name of Shareholder As at 31 March 2014 As at 31 March 2013 No. of Shares % of Holding No. of Shares % of Holding
Zyma Laboratories Limited 54,960,490 12.26 54,960,490 12.28Rahas Investments Pvt. Limited 45,699,510 10.19 45,699,510 10.21Visiomed Investments Pvt. Limited[formerly Visiomed (India) Pvt. Limited]
43,514,660 9.70 43,514,660 9.72
Lupin Holdings Pvt. Limited[formerly Lupin Marketing Pvt. Limited]
40,401,000 9.01 40,401,000 9.03
e) Shares reserved for issuance under Stock Option Plans of the Company
Particulars As at 31 March 2014
As at 31 March 2013
No. of Shares No. of SharesLupin Employees Stock Option Plan 2003 687,134 961,360 Lupin Employees Stock Option Plan 2005 532,479 784,995 Lupin Employees Stock Option Plan 2011 3,297,482 3,546,178 Lupin Subsidiary Companies Employees Stock Option Plan 2005 371,103 437,089 Lupin Subsidiary Companies Employees Stock Option Plan 2011 895,113 900,000
f) Aggregate number of shares issued during last five years pursuant to Stock Option Plans of the Company
Particulars As at 31 March 2014
As at 31 March 2013
Aggregate No. of Shares
Aggregate No. of Shares
Equity Shares:Issued under various Stock Option Plans of the Company 5,194,344 5,185,963
g) No shares have been alloted without payment being received in cash or by way of bonus shares during the period of five years immediately preceding the Balance Sheet date.
102 | Lupin Limited

3. RESERVES AND SURPLUSAs at
31.03.2014As at
31.03.2013I in million I in million
Capital Reserve- Investment Subsidies from Central Government
Opening and Closing Balance as per last Balance Sheet 1.0 1.0 - Investment Subsidies from State Government
Opening and Closing Balance as per last Balance Sheet 8.2 8.2 - On restructuring of capital of the Company under the Scheme of Amalgamation
Opening and Closing Balance as per last Balance Sheet 254.7 254.7 263.9 263.9
Capital Redemption ReserveOpening and Closing Balance as per last Balance Sheet 126.5 126.5
126.5 126.5 Securities Premium Account
Balance as per last Balance Sheet 5,378.1 5,248.6 Add : Addition during the year* 255.2 129.5 Balance as at the year end 5,633.3 5,378.1
Employees Stock Options Outstanding (Refer note 36)- Employees Stock Options Outstanding
Opening Balance as per last Balance Sheet 43.2 31.5 Add : Options granted during the year 22.0 14.6 Less : Exercised during the year 17.5 2.9 Balance as at the year end (A) 47.7 43.2
- Deferred Employees Stock Options Cost Opening Balance as per last Balance Sheet 8.7 7.0 Add : Options granted during the year 22.0 14.6 Less : Amortisation during the year 19.4 12.9 Balance as at the year end (B) 11.3 8.7
(A-B) 36.4 34.5 Employee Stock Appreciation Rights Outstanding (Refer note 37)
Opening Balance as per last Balance Sheet 34.3 3.5 Add : Additions during the year 191.6 30.8 Balance as at the year end 225.9 34.3
General ReserveOpening Balance as per last Balance Sheet 13,015.4 11,515.4 Add : Transferred from Surplus in the Consolidated Statement of Profit and Loss 2,500.0 1,500.0 Balance as at the year end 15,515.4 13,015.4
Amalgamation ReserveOpening and Closing Balance as per last Balance Sheet 317.9 317.9
317.9 317.9 Cash Flow Hedge Reserve (Refer note 40)
Opening Balance as per last Balance Sheet (137.9) (579.8) Add : Effect of foreign exchange rate variations on hedging instruments outstanding
[net of deferred tax of H 102.5 million (previous year H 160.1 million)]302.3 430.1
Add / (Less) : Tranferred to the Statement of Profit and Loss (36.8) 11.8 Balance as at the year end 127.6 (137.9)
Foreign Currency Translation Reserve (Refer note 46)Opening Balance as per last Balance Sheet 941.9 969.9 Add / (Less) : Exchange Rate Difference on Translation (net) 829.1 (28.0)Balance as at the year end 1,771.0 941.9
Surplus in the Consolidated Statement of Profit and LossOpening Balance as per last Balance Sheet 31,172.1 21,345.2 Add : Profit for the year 18,363.7 13,141.6 Less : Transfer to General Reserve 2,500.0 1,500.0 Less : Interim Dividend paid on Equity Shares [Refer note 2 (c)] 1,345.0 - Add : Transfer from Minority Interest (Refer note 44) - 280.6 Less : Proposed Final Dividend on Equity Shares [Refer note 2 (c)] 1,345.1 1,790.1 Less : Dividend for previous year on Equity Shares issued after year end pursuant to ESOPs allotment 1.1 0.9 Add : Reversal of Corporate Tax on Final Dividend for previous year (in terms of Section 115-O / 115BBD of the Income-tax Act, 1961)
(304.2) -
Less : Corporate Tax on Final Dividend ** 247.8 304.3 Balance as at the year end 44,401.0 31,172.1
Total 68,418.9 51,146.7
* Represents amount received on allotment of 846,311 (previous year 887,812) Equity Shares of H 2 each, pursuant to “Lupin Employees Stock Option Plans”. [Refer note 36 (a)].
** Represents Corporate tax on Proposed Dividend H 228.6 million (previous year H 304.2 million), on Interim Dividend H 19.2 million (previous year H nil) and on dividend paid for previous year on Equity Shares issued after the year end pursuant to ESOPs allotment H nil (previous year H 0.1 million).
Annual Report 2014 | 103

4. LONG-TERM BORROWINGS
As at 31.03.2014
As at 31.03.2013
I in million I in million(Refer note 10)
Secured Foreign Currency Term Loans from Banks 232.9 344.2 Long Term Maturities of Finance Lease Obligations [Refer note 35 (b)] 11.3 35.3
244.2 379.5
Unsecured Bonds - 218.6 Foreign Currency Term Loans from Banks 1,023.0 1,580.5 Deferred Sales Tax Loan from Government of Maharashtra 46.2 54.6 Term Loans from Council for Scientific and Industrial Research (CSIR) 154.7 185.6 Term Loans from Department of Science and Technology (DST) 41.5 51.8
1,265.4 2,091.1
Total 1,509.6 2,470.6
a) Term Loans of a subsidiary company located in Japan aggregating H 293.5 milllion carries interest rate in the range of 1.25% to 2.15% p.a. and are secured by first legal / equitable mortgage on immovable assets of the said subsidiary. Unsecured Term Loans aggregating to H 1,585.1 million carries interest rate in the range of 0.50% to 0.59% p.a. and guaranteed by the Company. The loan matures at various dates beginning from year 2014 upto year 2017.
b) Secured Term Loans of a subsidiary company located in Germany consists of 2 loans and carries interest rate in the range of 4.25% - 5.05% p.a. Loans are secured against mortgage of immovable property. First loan of H 44.2 million is repayable in monthly installments of H 0.5 million till 30 November 2020. Second loan of H 14.9 million repayable in monthly installments (including interest) of H 0.1 million till February 2042.
c) Unsecured Term Loans of a subsidiary company located in Germany consists of 2 loans and carries interest rate in the range of 4.85% - 5.80% p.a. Loans have been guaranteed by the Company. First loan of H 6.4 million is repayable in 6 monthly installments of H 1.3 million till 30 September 2016. Second loan of H 17.1 million is repayable in 6 biannual installments of H 3.4 million starting from 30 March 2014.
d) Deferred Sales Tax Loan is interest free and payable in 5 equal annual installments after expiry of initial 10 years moratorium period from each such year of deferral period from 1998-99 to 2009-10.
e) Term Loans from CSIR carry interest of 3% p.a. and is payable in 6 annual installments of H 30.9 million each alongwith interest.f) Term Loans from DST carry interest of 3% p.a. and is payable in 5 annual installments of H 10.4 million each alongwith interest.g) Finance lease obligations to Financial Institutions represents present value of minimum lease rentals payable and are secured by
hypothecation of concerned plant, machinery, equipments and vehicles.
h) The Group has not defaulted on repayment of loans and interest during the year.
5. DEFERRED TAX LIABILITIES (NET)
As at 31.03.2014
As at 31.03.2013
I in million I in million
Tax effect of items constituting Deferred Tax LiabilitiesOn differences between book and tax depreciation 3,022.7 2,822.3 Cash Flow Hedge Reserve 48.6 - Amortisation of Intangibles 15.4 12.6 Others 2.8 1.9
3,089.5 2,836.8
Less : Tax effect of items constituting Deferred Tax AssetsProvision for doubtful trade receivables 127.4 38.2 Provision for VRS Compensation 47.9 53.2 Provision for Employee Benefits 276.2 231.1 Provision for Expenses 6.1 5.0 Leasing Liability 0.4 0.7 Cash Flow Hedge Reserve - 53.9 Others 144.9 117.9
602.9 500.0
Total 2,486.6 2,336.8
104 | Lupin Limited

6. OTHER LONG-TERM LIABILITIES
As at 31.03.2014
As at 31.03.2013
I in million I in million
Trade Payables 95.1 137.6 Mark to Market Derivative Liabilities - 2.8 Interest Accrued but not due on Borrowings - 9.9 Deposits (at subsidiary) 326.3 339.1 Payable for Purchase of Fixed Assets 24.0 - Other Payables 13.2 11.8
Total 458.6 501.2
7. LONG-TERM PROVISIONS
Provisions for Employee BenefitsGratuity [Refer note 38 (ii) (a) (A)] 431.8 360.3 Retirement Benefits [Refer note 38 (ii) (b) (c) (d)] 555.7 441.0 Compensated Absences 328.4 303.3 Provident Fund [Refer note 38 (ii) (a) (B)] 9.0 19.9
Total 1,324.9 1,124.5
8. SHORT-TERM BORROWINGS
Secured Loans from Banks 806.2 5,785.9
806.2 5,785.9 Unsecured
Loans from Banks 3,217.6 1,482.3 3,217.6 1,482.3
Total 4,023.8 7,268.2
a) Secured Loans aggregating H 500.0 million comprise of Cash Credit, Short-Term Loans, Packing Credit, Post Shipment Credit, Bills Discounted and Overseas Import Credit and are secured by hypothecation of inventories and trade receivables and all other moveable assets including current assets at godowns, depots, in course of transit or on high seas and a second charge on immovable properties and moveable assets of the Company both present and future. Loans in Indian rupees carries interest rate in the range of 10.00% to 12.75% p.a.
b) Secured Loan of H 227.3 million being overdraft facility availed by a subsidiary company located in Australia carries interest rate in the range of 3.50% to 3.95% p.a. and is secured by fixed and floating charge over all assets of the said subsidiary.
c) Secured Loan of H 78.9 million being loan availed by a subsidiary company located in Philippines are secured by way of hypothecation of trade receivables of the said subsidiary and carries interest rate in the range of 3.75% to 5.50% p.a.
d) Secured Loans include foreign currency loans of H 306.2 million.
e) Unsecured Loans aggregating to H 651.6 million comprise of Short-Term Loans, Packing Credit, Post Shipment Credit, Bills Discounted and Overseas Import Credit. Loans in foreign currency carries interest rate in the range of 0.28% to 0.54% p.a. and those in Indian rupees carries interest rate in the range of 10.00% to 12.75% p.a.
f) Unsecured Loans aggregating to H 2,224.5 million availed by the subsidiary companies located in Japan carries interest rate of 0.55 % p.a.
g) Unsecured Loan of H 288.1 million availed by a subsidiary company located in Germany carries interest rate of 1.27% p.a. and guaranteed by the Company.
h) Unsecured Loans aggregating to H 53.4 million availed by a subsidiary company located in Philippines out of which H 26.7 million are supported by letter of comfort by the Company. The loans carry interest rate in the range of 3.75% to 5.50% p.a.
i) Unsecured Loans include foreign currency loans of H 3,174.1 million.
j) The Group has not defaulted on repayment of loans and interest during the year.
Annual Report 2014 | 105

9. TRADE PAYABLES
As at 31.03.2014
As at 31.03.2013
I in million I in millionAcceptances 2,238.7 2,428.3 Other than Acceptances 13,702.6 13,000.5
Total 15,941.3 15,428.8
10. OTHER CURRENT LIABILITIES
Current Maturities of Long-Term Borrowings (Refer note 4)- Bonds (Refer note below) 222.5 - - Foreign Currency Term Loans from Banks 705.2 1,830.8 - Current Maturities of Finance Lease Obligations [Refer note 35 (b)] 25.6 27.1 - Deferred Sales Tax Loan from Government of Maharashtra 9.4 6.9 - Term Loans from CSIR 30.9 30.9 - Term Loans from DST 10.4 10.4
Interest Accrued but not due on Borrowings 15.1 16.8 Unpaid Dividend* 25.7 16.5 Unpaid Matured Deposits* - 0.1 Unpaid Interest Warrants* - 0.1 Mark to Market Derivative Liabilities 86.6 392.1 Deposits 3.8 - Payable for Purchase of Fixed Assets 708.0 758.8 Advances from customers 450.4 81.7 Other Payables 582.8 640.3 (Includes Statutory liabilities, Deposits received, etc.)
Total 2,876.4 3,812.5
* There are no amounts due and outstanding to be credited to Investor Education and Protection Fund.
Bonds of a subsidiary company located in Japan are redeemable at par at the end of three years from the date of respective allotment. They carry interest rate in the range of 0.90% to 1.08% p.a. The said subsidiary has an option to redeem these bonds earlier.
11. SHORT-TERM PROVISIONS
As at 31.03.2014
As at 31.03.2013
I in million I in millionProvisions for Employee Benefits
Gratuity [Refer note 38 (ii) (a) (A)] 71.5 125.5 Compensated Absences 238.5 191.3
Other ProvisionsFor Sales Returns (Refer note 50) 672.2 721.7 For Taxation (net of Advance Tax) 898.1 339.0 For Proposed Dividend on Equity Shares 1,345.1 1,878.0 For Corporate Tax on Dividend 228.6 304.2
Total 3,454.0 3,559.7
106 | Lupin Limited

12.
FIX
ED A
SSET
S
(I in
mill
ion)
Part
icul
ars
Gro
ss B
lock
Acc
umul
ated
Dep
reci
atio
n an
d A
mor
tisa
tion
N
et B
lock
As
at01
.04.
2013
Add
ition
s on
Acq
uist
ion
ofSu
bsid
iary
Co
mpa
ny
Effe
ct o
f Fo
reig
n Cu
rren
cy
exch
ange
di
ffer
ence
s
Add
ition
sTr
ansl
atio
nA
djus
tmen
tsD
educ
tions
A
s at
31.0
3.20
14A
s at
01.0
4.20
13A
dditi
ons
on
Acq
uist
ion
ofSu
bsid
iary
Co
mpa
ny
For
the
Year
Tra
nsla
tion
Adj
ustm
ents
Ded
uctio
nsA
s at
31.0
3.20
14A
s at
31.0
3.20
14
A. T
angi
ble
Ass
ets
Free
hold
Lan
d 1
,213
.1
-
-
-
25.
7 1
.4
1,2
37.4
-
-
-
-
-
-
1
,237
.4
1,2
44.5
-
-
4
9.0
(80.
3) 0
.1
1,2
13.1
-
-
-
-
-
-
1
,213
.1
Leas
ehol
d La
nd 6
33.7
-
-
5
.1
-
-
638
.8
54.
5 -
1
0.4
-
-
64.
9 5
73.9
5
40.1
-
-
9
3.6
-
-
633
.7
44.
3 -
1
0.2
-
-
54.
5 5
79.2
Build
ings
8,7
92.3
-
9
.2
828
.8
57.
6 1
2.6
9,6
75.3
2
,336
.2
-
286
.3
37.
0 2
.3
2,6
57.2
7
,018
.1
7,4
99.6
-
3
0.2
1,4
84.4
(1
69.7
) 5
2.2
8,7
92.3
2
,185
.9
-
272
.9
(74.
6) 4
8.0
2,3
36.2
6
,456
.1
Plan
t an
d Eq
uipm
ent
24,
089.
4 2
8.6
56.
4 2
,873
.2
85.
4 3
96.6
2
6,73
6.4
9,6
17.6
1
2.3
1,61
9.0
62.
2 2
97.9
1
1,01
3.2
15,
723.
2 2
1,02
8.6
-
103
.9
3,9
50.2
(4
83.9
) 5
09.4
2
4,08
9.4
8,7
73.1
-
1
,478
.4
(327
.7)
306
.2
9,6
17.6
1
4,47
1.8
Furn
iture
and
Fix
ture
s 1
,262
.7
0.2
2
.8
205
.8
9.6
7
5.3
1,4
05.8
6
47.6
-
1
61.2
7
.0
62.
5 7
53.3
6
52.5
1
,145
.3
-
5.3
1
97.1
(4
7.7)
37.
3 1
,262
.7
629
.1
-
142
.1
(30.
6) 9
3.0
647
.6
615
.1
Veh
icle
s 1
66.6
0
.3
-
29.
5 0
.1
7.7
1
88.8
7
6.2
0.3
2
6.5
(0.
2) 3
.6
99.
2 8
9.6
138
.9
-
-
38.
3 7
.5
18.
1 1
66.6
9
4.2
-
11.
8 1
.7
31.
5 7
6.2
90.
4
Off
ice
Equi
pmen
t 1
,176
.2
1.0
3
.4
221
.6
2.9
1
41.8
1
,263
.3
536
.5
0.6
1
48.8
2
.5
125
.8
562
.6
700
.7
1,0
93.6
-
5
.1
122
.3
(3.0
) 4
1.8
1,1
76.2
4
92.7
-
7
0.6
(2.5
) 2
4.3
536
.5
639
.7
Ass
ets
unde
r Le
ase
:
- Pl
ant
and
Equi
pmen
t 1
62.2
-
-
-
2
.8
-
165
.0
100
.1
-
24.
3 0
.9
-
125
.3
39.
7 1
74.9
-
-
-
(1
2.7)
-
162
.2
83.
1 -
2
6.4
(9.4
) -
1
00.1
6
2.1
- V
ehic
les
29.
1 -
-
1
1.2
0.2
2
1.4
19.
1 2
2.7
-
5.3
0
.1
12.
2 1
5.9
3.2
3
9.3
-
-
1.1
2
.6
13.
9 2
9.1
25.
4 -
8
.4
1.8
1
2.9
22.
7 6
.4
Tota
l - T
angi
ble
Ass
ets
(A)
37,
525.
3 3
0.1
71.
8 4
,175
.2
184
.3
656
.8
41,
329.
9 1
3,39
1.4
13.
2 2,
281.
8 1
09.5
5
04.3
1
5,29
1.6
26,
038.
3 3
2,90
4.8
-
144
.5
5,9
36.0
(7
87.2
) 6
72.8
3
7,52
5.3
12,
327.
8 -
2
,020
.8
(441
.3)
515
.9
13,
391.
4 2
4,13
3.9
B. In
tang
ible
Ass
ets
- A
cqui
red
Goo
dwill
630
.5
-
-
-
(7.
7) -
6
22.8
5
86.9
-
4
3.6
(7.
7) -
6
22.8
-
6
04.5
-
-
-
2
6.0
-
630
.5
439
.9
-
125
.5
21.
5 -
5
86.9
4
3.6
Com
pute
r So
ftw
are
363
.4
-
-
146
.4
2.4
2
.3
509
.9
163
.4
-
81.
1 0
.7
2.2
2
43.0
2
66.9
2
64.4
-
-
1
29.0
(9
.8)
20.
2 3
63.4
1
40.1
-
4
6.7
(5.2
) 1
8.2
163
.4
200
.0
Trad
emar
ks a
nd L
icen
ces
391
.8
5.3
-
1
13.1
(
8.0)
1.8
5
00.4
2
51.5
5
.2
120
.9
(5.
8) 1
.7
370
.1
130
.3
422
.4
-
-
16.
4 2
5.8
72.
8 3
91.8
1
92.6
-
4
7.6
11.
3 -
2
51.5
1
40.3
Dos
sier
s / M
arke
ting
right
s 2
,857
.9
-
-
194
.7
263
.1
18.
4 3
,297
.3
2,4
47.2
-
8
2.3
243
.7
17.
7 2
,755
.5
541
.8
2,6
82.3
-
-
9
5.7
97.
9 1
8.0
2,8
57.9
1
,321
.4
-
1,0
81.3
5
0.6
6.1
2
,447
.2
410
.7
Tota
l - In
tang
ible
Ass
ets
(B)
4,2
43.6
5
.3
-
454
.2
249
.8
22.
5 4
,930
.4
3,4
49.0
5
.2
327
.9
230
.9
21.
6 3
,991
.4
939
.0
3,9
73.6
-
-
2
41.1
1
39.9
1
11.0
4
,243
.6
2,0
94.0
-
1
,301
.1
78.
2 2
4.3
3,4
49.0
7
94.6
Tota
l (A
+B)
41,
768.
9 3
5.4
71.
8 4
,629
.4
434
.1
679
.3
46,
260.
3 1
6,84
0.4
18.
4 2,
609.
7 3
40.4
5
25.9
1
9,28
3.0
26,
977.
3 3
6,87
8.4
-
144
.5
6,1
77.1
(6
47.3
) 7
83.8
4
1,76
8.9
14,
421.
8 -
3
,321
.9
(363
.1)
540
.2
16,
840.
4 2
4,92
8.5
Capi
tal W
ork-
in-P
rogr
ess
(Ref
er n
ote
32)
2,8
42.6
2
,496
.9
Inta
ngib
le A
sset
s U
nder
Dev
elop
men
t 1
98.6
6
10.1
Tota
l 3
0,01
8.5
28,
035.
5
1. C
ost
of B
uild
ings
incl
ude
cost
of
shar
es in
co-
oper
ativ
e so
ciet
ies
of H
1,0
00/-
(pre
viou
s ye
ar H
1,0
00/-
).
2. A
dditi
ons
to F
ixed
Ass
ets
incl
ude
item
s of
fix
ed a
sset
s ag
greg
atin
g H
635
.1 m
illio
n (p
revi
ous
year
H 8
89.9
mill
ion)
loca
ted
at R
esea
rch
and
Dev
elop
men
t Ce
ntre
s of
the
Gro
up.
3. A
dditi
ons
to P
lant
and
Equ
ipm
ent
incl
ude
H 3
.0 m
illio
n (p
revi
ous
year
H n
il) o
n ac
coun
t of
Cap
ital I
nves
tmen
t Su
bsid
y.
4. P
revi
ous
year
fig
ures
are
giv
en in
ital
ics
belo
w c
urre
nt y
ear
figur
es in
eac
h cl
ass
of a
sset
s.
Annual Report 2014 | 107

13. NON-CURRENT INVESTMENTS
As at 31.03.2014
As at 31.03.2013
I in million I in millionTrade Investmentsa) Others - UnquotedIn Equity Instruments: Number Face Value
- Biotech Consortium India Ltd., India 50,000 H 0.5 0.5 (50,000) 10
- Enviro Infrastructure Co. Ltd., India 100,000 H 1.0 1.0 (100,000) 10
- Bharuch Enviro Infrastructure Ltd., India 4,585 H
[31.03.2014- H 45,850/- (previous year H 45,850/-)] (4,585) 10- Narmada Clean Tech Ltd., India 1,145,190 H 11.5 11.5
(1,145,190) 10- Tarapur Environment Protection Society, India 72,358 H 7.2 7.2
(72,358) 100 - Japan Medical Products Exporter's Association, Japan 10 JPY
[31.03.2014- H 29,270/- (previous year H 28,765/-)] (10) 5,000 - The Pharmaceuticals and Medical Devices Agency, Japan 30 JPY 0.2 0.2
(30) 10,000 - Osaka Fire Mutual Aid Association, Japan 10 JPY
[31.03.2014- H 585/- (previous year H 575/-)] (10) 100 - Frankfurter Volksbank eG Bank, Germany 10 Eur
[31.03.2014- H 41,157/- (previous year H 34,760/-)] (10) 50- Philippines Long Distance Telephone Co., Philippines 200 PHP
[31.03.2014- H 21,360/- (previous year H 21,280/-)] (200) 1- Atsugi Gas Corporation, Japan 600 Nil 0.2 0.2
(600) 20.6 20.6
(Figures in brackets are for previous year)b) In Government Securities
National Saving Certificates [31.03.2014- H 6,000/- (previous year H 6,000/-)]
Deposited with Government Authority [31.03.2014- H 6,000/- (previous year H 6,000/-)]
Total 20.6 20.61) All investments in shares are fully paid up.2) All investments are stated at cost.3) Aggregate amount of unquoted investments 20.6 20.6
108 | Lupin Limited

14. DEFERRED TAX ASSETS (NET)
As at 31.03.2014
As at 31.03.2013
I in million I in millionTax effect of items constituting Deferred Tax Assets
Provision for Bonus 107.5 126.3 Provision for Leave Encashment 15.5 14.4 Provision for Retirement Benefits 44.4 73.1 Provision for Expenses 34.3 30.0 Provision for Price Differential 88.4 37.8 Provision for Sales Return 244.6 263.9 On differences between book and tax depreciation 36.9 41.5 Others 226.8 158.0
798.4 745.0 Less: Tax effect of items constituting Deferred Tax Liabilities
On differences between book and tax depreciation 21.5 -Reserved for Deferred Capital Gain 15.8 17.9 Others 53.0 22.7
Total 708.1 704.4
15. LONG-TERM LOANS AND ADVANCES
Unsecured, considered good unless otherwise statedCapital Advances 1,069.0 802.0 Loans and Advances to related parties [Refer note 53 (C)] 54.7 - Security Deposits 285.1 319.6 Advance payment of Income Tax (net of Provision) 473.7 266.2 MAT Credit Entitlement 523.4 1,993.8 Balances with Government Authorities (Drawback / Customs duties receivable) 845.0 - Loans to Employees Benefit Trust (Refer note 37) 258.0 476.9 Loans to Employees 5.3 4.3 Other Loans and Advances 215.7 10.8
Total 3,729.9 3,873.6
16. CURRENT INVESTMENTS
Non Trade Investments - Unquoted- In Mutual Funds Number of Units
- Birla Sun Life Cash Plus 3,423,542 343.0 - (-)
- ICICI Prudential Liquid 7,051,651 705.6 - (-)
- HDFC Liquid 70,154,424 715.5 - (-)
(Figures in brackets are for previous year)Total 1,764.1 -
1) All investments are stated at lower of cost and fair value unless otherwise stated.2) Aggregate amount of unquoted investments 1,764.1 -
Annual Report 2014 | 109

17. INVENTORIES
As at 31.03.2014
As at 31.03.2013
I in million I in millionRaw Materials 4,516.1 4,583.6 Packing Materials 836.0 854.0 Work-in-Process 3,656.7 3,318.8 Finished Goods 4,495.0 4,202.8 Stock-in-Trade 5,348.8 4,709.0 Consumable Stores and Spares 666.7 543.8 Goods-in-Transit
- Raw Materials 121.6 331.0 - Packing Materials 13.2 12.0 - Stock-in-Trade 1,619.4 885.2 - Consumable Stores and Spares 21.0 49.1
Total 21,294.5 19,489.3
18. TRADE RECEIVABLES
UnsecuredTrade receivables outstanding for a period exceedingsix months from the date they were due for payment
- Considered Good 416.6 405.0 - Considered Doubtful 385.9 128.6
802.5 533.6
Other Trade Receivables- Considered Good 24,224.4 21,464.9 - Considered Doubtful 0.8 -
24,225.2 21,464.9 25,027.7 21,998.5
Less : Provision for Doubtful Trade Receivables 386.7 128.6 Total 24,641.0 21,869.9
19. CASH AND BANK BALANCES
Cash and Cash EquivalentsBank Balances
- In Current Accounts (including money-in-transit) 3,421.7 2,220.3 - In Deposit Accounts 588.4 792.4
Cheques on hand 106.6 95.6 Cash on hand 5.3 4.0
4,122.0 3,112.3 Other Bank Balances (Refer note below)
Earmarked Balances with Banks - Unpaid dividend accounts 21.5 16.5 - Unpaid matured deposits - 0.1 - Unpaid interest warrants - 0.1 - Deposits against borrowings, guarantees and other commitments 10.4 2.9
Bank Deposits maturing more than 3 months but less than 12 months 3,821.1 1,216.9 3,853.0 1,236.5
Total 7,975.0 4,348.8
Other Bank Balances - Earmarked Balances with Banks include deposits H 10.4 million (previous year H 2.9 million) which have an original maturity of more than 12 months.
110 | Lupin Limited

20. SHORT-TERM LOANS AND ADVANCES
As at 31.03.2014
As at 31.03.2013
I in million I in millionUnsecured, considered good unless otherwise statedLoans and Advances to related parties [Refer note 53 (C)] - 62.2 Security Deposits
- Considered Good 79.6 106.5 - Considered Doubtful 6.6 -
86.2 106.5 Less : Provision for Doubtful Deposits 6.6 -
79.6 106.5 Advance payment of Income Tax (net of Provision) 14.3 8.5 Balances with Government Authorities (VAT / Cenvat / Service tax credit receivable / other taxes) 1,573.2 1,736.6 Advance to Vendors
- Considered Good 573.8 750.6 - Considered Doubtful - 7.3
573.8 757.9 Less : Provision for Doubtful Advances - 7.3
573.8 750.6 Loans to Employees Benefit Trust (Refer note 15 and 37) 218.9 - Other Loans and Advances 557.1 732.3 (includes Loans and Advances to employees, Prepaid expenses, etc.)
Total 3,016.9 3,396.7
21. OTHER CURRENT ASSETS
Mark to Market Derivative Assets 256.9 160.4 Export Benefits Receivable 1,699.7 1,133.4 Other Current Assets 356.4 1,032.8 (includes receivable from Government Authorities, Interest receivables, etc.)
Total 2,313.0 2,326.6
Annual Report 2014 | 111

22. REVENUE FROM OPERATIONS (GROSS)
For the CurrentYear ended31.03.2014
For the PreviousYear ended
31.03.2013I in million I in million
SaleGoods 110,147.6 94,313.4 Research Services 1,523.6 921.9
111,671.2 95,235.3 Other Operating Revenue
Export Benefits and Other Incentives 1,199.1 783.9 Service Charges 208.0 584.8 Insurance Claims 17.9 47.8 Compensation and Settlement Income 230.2 280.5 Provision for Doubtful Trade Advances / Receivables written back 7.3 0.2 Credit Balances Written Back 176.8 - Miscellaneous Income 160.0 99.5
1,999.3 1,796.7 Total 113,670.5 97,032.0
23. OTHER INCOME
Interest on Fixed Deposits with Banks 138.6 115.9 [Tax Deducted at Source H 6.0 million (previous year H 5.8 million)]Other Interest (including interest on income tax refunds) 20.0 25.6 [Tax Deducted at Source H 0.9 million (previous year H 0.5 million)]Dividend on Current Investments 26.0 - Dividend on Long-Term Investment 0.2 0.5 Provision for Diminution in value of Non-Current Investments written back - 0.2 Net gain on Foreign Currency Transactions 895.7 116.2 Net gain on Sale of Current Investments 5.5 - Provisions no longer required written back 51.5 - Other Non-Operating Income 27.3 20.1
Total 1,164.8 278.5
24. COST OF RAW AND PACKING MATERIALS CONSUMED
Raw Materials Consumed 20,730.9 18,861.2 Packing Materials Consumed 3,482.7 3,386.6
Total 24,213.6 22,247.8
25. CHANGES IN INVENTORIES OF FINISHED GOODS, WORK-IN-PROCESS AND STOCK-IN-TRADE
Opening Stock:Finished Goods 4,202.8 3,958.3 Stock-in-Trade 5,594.2 4,416.7 Work-in-Process 3,318.8 2,818.8
13,115.8 11,193.8 Less:Closing Stock:
Finished Goods 4,495.0 4,202.8 Stock-in-Trade 6,968.2 5,594.2 Work-in-Process 3,656.7 3,318.8
15,119.9 13,115.8 Changes In Inventories:
Finished Goods (292.2) (244.5)Stock-in-Trade (1,374.0) (1,177.5)Work-in-Process (337.9) (500.0)
Total (2,004.1) (1,922.0)
112 | Lupin Limited

26. EMPLOYEE BENEFITS EXPENSE
For the CurrentYear ended31.03.2014
For the PreviousYear ended
31.03.2013I in million I in million
Salaries and Wages 12,322.5 10,513.5 Contribution to Provident and Other Funds 1,074.3 1,073.8 Retirement Benefits Expense [Refer note 38 (ii)] 137.2 332.8 Expenses on Employees Stock Options / Stock Appreciation Rights 211.0 43.7 (Refer note 36 and 37)Staff Welfare Expenses 901.5 702.4
Total 14,646.5 12,666.2
27. FINANCE COSTS
Interest on Borrowings 85.1 239.2 Other Borrowing Costs (includes bank charges, etc.) 167.5 169.2 Interest on Income Tax 13.9 1.1
Total 266.5 409.5
28. OTHER EXPENSES
Processing Charges 1,204.9 956.9 Stores and Spares Consumed 2,787.3 2,383.6 Repairs and Maintenance: - Buildings 237.4 246.1 - Plant and Machinery 702.4 581.0 - Others 722.1 630.2 Rent 333.1 273.3 Rates and Taxes 776.3 718.8 Insurance 401.9 342.1 Power and Fuel 3,342.9 3,202.2 Contract Labour Charges 848.1 690.5 Excise Duty (net) (Refer note 48) 163.9 116.6 Selling and Promotion Expenses 5,057.1 4,680.7 Commission, Brokerage and Discount 1,230.9 1,060.4 [Including cash discount of H 7.3 million (previous year H 6.8 million)]Freight and Forwarding 1,464.6 1,355.1 Lease Rent and Hire Charges (Refer note 35) 638.9 600.6 Postage and Telephone Expenses 327.1 296.5 Travelling and Conveyance 1,722.2 1,594.1 Legal and Professional Charges 3,841.8 3,036.3 [Net of recoveries of H 79.3 million (previous year H nil)]Donations 230.0 169.5 Clinical and Analytical Charges 1,311.0 890.2 Loss on sale / write-off of Fixed Assets (net) 119.4 144.9 Bad Trade Receivables / Advances written off 8.9 38.6 Impairment of Assets 429.0 256.8 Provision for Doubtful Trade Receivables / Advances / Deposits 273.7 59.1 Directors Sitting Fees 2.7 2.7 Exchange Rate Difference on Translation (net) 482.1 243.4 Miscellaneous Expenses 1,357.8 992.7
Total 30,017.5 25,562.9
Annual Report 2014 | 113

29. The Consolidated Financial Statements present the consolidated accounts of Lupin Limited (“the Company”) and the following subsidiaries (“the Group”):
Name of Subsidiaries Country ofIncorporation
Proportion ofOwnership Interest
Lupin Pharmaceuticals, Inc. USA 100%@Kyowa Pharmaceutical Industry Co., Limited Japan 100%+I’rom Pharmaceutical Co., Limited Japan 100%*Amel Touhoku (upto 28 February 2013) Japan 100%*Hormosan Pharma GmbH Germany 100%+Pharma Dynamics (Proprietary) Limited South Africa 60%+Lupin Australia Pty Limited Australia 100%Lupin Holdings B.V. Netherlands 100%Lupin Atlantis Holdings SA Switzerland 100%Multicare Pharmaceuticals Philippines Inc. Philippines 51%+Lupin (Europe) Limited UK 100%Lupin Pharma Canada Limited Canada 100%+Lupin Healthcare Limited India 100%Generic Health Pty Limited Australia 91.04%+Bellwether Pharma Pty Limited Australia 91.04%#Max Pharma Pty Limited Australia 91.04%#Lupin Mexico SA de CV Mexico 100%+Lupin Philippines Inc. Philippines 100%+Generic Health SDN. BHD. Malaysia 100%+Lupin Middle East FZ-LLC (from 13 June 2012) UAE 100%Lupin GmbH (from 15 August 2013) Switzerland 100%**Lupin Inc. (from 27 June 2013) USA 100%**Farma World Importacao e Exportacao De MedicamentosLTDA - EPP (from 17 December 2013)
Brazil 100%+
Nanomi B.V. (from 30 January 2014) Netherlands 100%**
@ 80% interest held through Lupin Inc., USA (from 31 March 2014).
+Ownership interest held through Lupin Holdings B.V., Netherlands.
* Wholly owned subsidiary of Kyowa Pharmaceutical Industry Co., Limited, Japan.
# Wholly owned subsidiaries of Generic Health Pty Limited, Australia.
** Wholly owned subsidiaries of Lupin Atlantis Holdings SA, Switzerland.
The consolidated financial statements include the results of the aforesaid subsidiaries and there are no other bodies corporate / entities, where the Company holds more than 50% of the share capital or where the Company can control the composition of the Board of Directors / Governing Bodies of such entities, where the holding may be less than 50%.
During the year, the Company through its subsidiary in Switzerland has entered into an agreement dated 25 March 2014 to acquire 100% shares in “Laboratorios Grin S.A. de C.V., Mexico”. The agreement is subject to compliance to certain conditions which were yet to be fulfilled as at the year end. Consequently, no consideration has been paid / control is yet established as at the year end and hence, the entity does not form part of the Consolidated Financial Statements as at 31 March 2014.
30. Commitments: a) Estimated amount of contracts remaining to be executed on capital account and not provided for, net of advances, H 2140.1 million (previous year H 1320.8 million).
b) Commitments for research activities amounting to H 1028.9 million (net of advances) (previous year H nil).
c) Other commitments – Non-cancellable operating and finance leases (Refer note 35).
d) The Company is committed to operationally, technically and financially support the operations of its subsidiaries.
114 | Lupin Limited

31. Contingent Liabilities:
As at 31.03.2014 As at 31.03.2013I in million I in million
a) Income tax demands / matters on account of deductions / disallowances in earlier years, pending in appeals [H 49.7 million (previous year H 49.7 million) consequent to department preferring appeals against the orders of the Appellate Authorities passed in favour of the Company].
Amount paid there against and included under note 15 “Long-Term Loans and Advances” H 26.3 million (previous year H 23.5 million).
173.2 82.3
b) Excise duty, Service tax and Sales tax demands for input tax credit disallowances and demand for additional Entry Tax arising from dispute on applicable rate are in appeals and pending decisions. Amount paid there against and included under
note 20 “Short-Term Loans and Advances” H 30.4 million (previous year H 31.7 million).
355.5 424.4
c) Claims against the Company not acknowledged as debts [excluding interest (amount unascertained) in respect of a claim] for transfer charges of land, octroi duty, local body tax, employee claims, power, trademarks, pricing, indemnity and stamp duty.
Amount paid there against without admitting liability and included under note 20 “Short-Term Loans and Advances” H 12.6 million (previous year H 12.6 million).
6223.2 419.9
d) Counter guarantee given to GIDC in connection with repayment of loan sanctioned by a financial institution to a company, jointly promoted by an Association of Industries (of which, the Company is a member) and GIDC.
7.5 7.5
Future cash outflows in respect of the above, if any, is determinable only on receipt of judgement / decisions pending with the relevant authorities. The Group does not expect the outcome of the matters stated above to have a material adverse impact on the Group’s financial condition, results of operations or cash flows.
The Group does not envisage any likely reimbursements in respect of the above.
The Company and its subsidiaries are involved in various legal proceedings, including product liability related claims, employment claims and other regulatory matters relating to conduct of its business. The Group carries product liability insurance policy with an amount it believes is sufficient for its needs. In respect of other claims, the Group believes, these claims do not constitute material litigation matters and with its meritorious defenses the ultimate disposition of these matters will not have material adverse effect on its Consolidated Financial Statements.
32. Pre-operative expenses pending capitalisation included in Capital Work-In-Progress (Refer note 12) represent direct attributable expenditure for setting up of plants prior to the date of commencement of commercial production. The same will be capitalised on completion of projects and commencement of commercial operations. The details of the pre-operative expenses are:
Particulars 2013-2014 2012-2013I in million I in million
Opening balance 222.6 88.8Incurred during the current year:Salaries, allowances and contribution to funds 11.2 65.8Professional fees 0.3 1.4Travelling expenses 1.6 10.2Others 4.4 118.1Total 17.5 195.5Less : Capitalised during the year 57.9 61.7Closing balance 182.2 222.6
Annual Report 2014 | 115

33. Segment Reporting: i) Primary segment: The Group operates exclusively in the Pharmaceutical business segment which is the only reportable business segment.
ii) Secondary segment data:
(Current year I in million)Particulars India USA Japan Others TotalRevenue by Geographical Segment 28641.0 48299.9 12997.9 22926.9 112865.7Carrying amount of Segment Assets 50246.9 16406.6 16932.3 16755.0 100340.8Capital Expenditure 3389.0 137.5 808.3 1357.2 5692.0
(Previous year I in million)Particulars India USA Japan Others TotalRevenue by Geographical Segment 26044.3 38198.3 13151.1 19019.3 96413.0Carrying amount of Segment Assets 45615.2 13258.1 15682.3 11610.1 86165.7Capital Expenditure 4190.5 136.3 1250.2 247.2 5824.2
a) The segment revenue in geographical segments considered for disclosure is as follows:
i) Revenue within India includes sales to customers located within India and other operating income earned in India.
ii) Revenue outside India includes sales to customers located outside India and other operating income outside India.
b) Segment revenue comprises:
(Current year I in million)Particulars India USA Japan Others TotalSales (net of excise duty) 27999.2 48091.2 12954.7 21821.3 110866.4Other Operating Income 641.8 208.7 43.2 1105.6 1999.3Total Revenue 28641.0 48299.9 12997.9 22926.9 112865.7
(Previous year I in million)Particulars India USA Japan Others TotalSales (net of excise duty) 25598.1 37616.0 13040.4 18361.8 94616.3Other Operating Income 446.2 582.3 110.7 657.5 1796.7Total Revenue 26044.3 38198.3 13151.1 19019.3 96413.0
34. Basic and Diluted Earnings per Share is calculated as under:
Particulars 2013-2014 2012-2013I in million I in million
Net Profit after minority interest attributable to equity shareholders 18363.7 13141.6Weighted average number of Equity Shares:
- Basic 447982156 447125025Add : Effect of dilutive issue of employees stock options (ESOPs) - converted during the year and ESOPs outstanding as on 31.03.2014
2262690 1968120
- Diluted 450244846 449093145Earnings per Share (in H)
- Basic 40.99 29.39- Diluted 40.79 29.26
35. a) The Group procures equipments, vehicles and office premises under operating leases. The initial tenure of the lease is generally between 12 months to 60 months. The lease rentals recognised in the Consolidated Statement of Profit and Loss (Refer note 28) for the year are H 550.3 million (previous year H 474.8 million). The future minimum lease payments and payment profile of non-cancellable operating leases are as under:
Particulars 2013-2014 2012-2013I in million I in million
Not later than one year 460.0 326.0Later than one year but not later than five years 878.9 532.0Later than five years 129.7 25.1
Total 1468.6 883.1
116 | Lupin Limited

b) Subsidiary companies in Japan, South Africa and Philippines have future obligations under finance lease for procurement of Plant and Equipment and Vehicles which are payable as under:
(I in million)Particulars 2013-2014
Present Value ofminimum lease payment
Future Interest Cost Minimum lease payment
Not later than one year25.6 1.0 26.6
(27.1) (1.6) (28.7)Later than one year but not later than five years
11.3 0.5 11.8(35.3) (1.4) (36.7)
Later than five years- - -
(-) (-) (-)
Total36.9 1.5 38.4
(62.4) (3.0) (65.4) Previous year figures are given in bracket.
36. Employees Stock Option Plans: a) The Group implemented “Lupin Employees Stock Option Plan 2003” (ESOP 2003), “Lupin Employees Stock Option Plan
2005” (ESOP 2005), “Lupin Subsidiary Companies Employees Stock Option Plan 2005” (SESOP 2005), “Lupin Employees Stock Option Plan 2011” (ESOP 2011) and “Lupin Subsidiary Companies Employees Stock Option Plan 2011” (SESOP 2011)as approved in earlier years by the Shareholders of the Company and the Remuneration / Compensation Committee of the Board of Directors. Details of the options granted during the year under the plans are as under:
Lupin Employees Stock Option Plan 2003 (ESOP 2003):
Grant Date No. of Options Exercise Price I Vesting Period
October 07, 201350000 439.43 07.10.2013 to 07.10.2014
50000
Lupin Employees Stock Option Plan 2011 (ESOP 2011):
Grant Date No. of Options Exercise Price I Vesting Period
July 26, 2013
236375 864.75 26.07.2013 to 26.07.2014
236375 864.75 26.07.2013 to 26.07.2015
236375 864.75 26.07.2013 to 26.07.2016
236375 864.75 26.07.2013 to 26.07.2017
945500
November 13, 2013
188 873.50 13.11.2013 to 13.11.2014
188 873.50 13.11.2013 to 13.11.2015
187 873.50 13.11.2013 to 13.11.2016
187 873.50 13.11.2013 to 13.11.2017
750
Annual Report 2014 | 117

Lupin Subsidiary Companies Employees Stock Option Plan 2011 (SESOP 2011):
Grant Date No. of Options Exercise Price I Vesting Period
August 02, 2013
21230 873.85 02.08.2013 to 02.08.2014
21230 873.85 02.08.2013 to 02.08.2015
21230 873.85 02.08.2013 to 02.08.2016
21230 873.85 02.08.2013 to 02.08.2017
84920
August 13, 2013
3418 820.05 13.08.2013 to 13.08.2014
3418 820.05 13.08.2013 to 13.08.2015
3417 820.05 13.08.2013 to 13.08.2016
3417 820.05 13.08.2013 to 13.08.2017
13670
November 13, 2013
4175 873.50 13.11.2013 to 13.11.2014
4175 873.50 13.11.2013 to 13.11.2015
4175 873.50 13.11.2013 to 13.11.2016
4175 873.50 13.11.2013 to 13.11.2017
16700
December 27, 2013
4175 907.00 27.12.2013 to 27.12.2014
4175 907.00 27.12.2013 to 27.12.2015
4175 907.00 27.12.2013 to 27.12.2016
4175 907.00 27.12.2013 to 27.12.2017
16700
February 14, 2014
13275 894.05 14.02.2014 to 14.02.2015
13275 894.05 14.02.2014 to 14.02.2016
13275 894.05 14.02.2014 to 14.02.2017
13275 894.05 14.02.2014 to 14.02.2018
53100
The options are granted at an exercise price, which is in accordance with the relevant SEBI guidelines in force, at the time of such grants. Each option entitles the holder to exercise the right to apply for and seek allotment of one equity share of H 2 each. The options have vesting periods as stated above in accordance with the vesting schedule as per the said plans with an exercise period of ten years from the respective grant dates.
The particulars of the options granted and lapsed under the Schemes are as below:
Particulars Year Ended 31.03.2014
Year Ended 31.03.2013
Nos. Nos.Lupin Employees Stock Option Plan 2003 (ESOP 2003):Options outstanding as at the beginning of the year 763615 1085783Add: Options granted during the year 50000 -Less: Options lapsed during the year - 73125Less: Options exercised during the year 274226 249043Options outstanding as at the year end 539389 763615
118 | Lupin Limited

Particulars Year Ended 31.03.2014
Year Ended 31.03.2013
Nos. Nos.Lupin Employees Stock Option Plan 2005 (ESOP 2005):Options outstanding as at the beginning of the year 751920 1250090Add: Options granted during the year - 59500Less: Options lapsed during the year 4875 36375Less: Options exercised during the year 252516 521295Options outstanding as at the year end 494529 751920
Lupin Subsidiary Companies Employees Stock Option Plan 2005 (SESOP 2005):
Options outstanding as at the beginning of the year 430119 500421Add: Options granted during the year - -Less: Options lapsed during the year - 6650Less: Options exercised during the year 65986 63652Options outstanding as at the year end 364133 430119
Lupin Employees Stock Option Plan 2011 (ESOP 2011):
Options outstanding as at the beginning of the year 2259047 1759250Add: Options granted during the year 946250 699750Less: Options lapsed during the year 219062 146131Less: Options exercised during the year 248696 53822Options outstanding as at the year end 2737539 2259047
Lupin Subsidiary Companies Employees Stock Option Plan 2011 (SESOP 2011):
Options outstanding as at the beginning of the year 306780 161380Add: Options granted during the year 185090 145400Less: Options lapsed during the year 57950 -Less: Options exercised during the year 4887 -Options outstanding as at the year end 429033 306780
b. The Group has followed the intrinsic value based method of accounting for stock options granted after April 1, 2005 based on Guidance Note on Accounting for Employee Share-based Payments, issued by the Institute of Chartered Accountants of India (ICAI). Had the compensation cost for the Group’s stock based compensation plans been determined in the manner consistent with the fair value approach as described in the said Guidance Note, the Group’s net income would be lower by H 291.5 million (previous year H 229.5 million) and earnings per share as reported would be as indicated below:
Particulars Year Ended 31.03.2014
Year Ended 31.03.2013
I in million I in millionNet profit as reported 18363.7 13141.6Less: Total stock-based employee compensation expense determined under fair value based method
310.9 242.4
Add: Total stock-based employee compensation expense determined under intrinsic value based method
19.4 12.9
Adjusted net profit 18072.2 12912.1Basic earnings per share
- As reported (in H)* 40.99 29.39- Adjusted (in H) 40.34 28.88
Diluted earnings per share- As reported (in H)* 40.79 29.26- Adjusted (in H) 40.14 28.75
* Refer note 34
Annual Report 2014 | 119

The fair value of each option granted during the year is estimated on the date of grant based on the following assumptions:
ESOP 2003 Plan
ESOP 2011 Plan SESOP 2011 Plan
Grant Dated Oct 07,2013
Jul 26,2013
Nov 13, 2013
Aug 02, 2013
Aug 13, 2013
Nov 13, 2013
Dec 27, 2013
Feb 14, 2014
ParticularsDividend yield (%) 0.72 0.72 0.72 0.72 0.72 0.72 0.72 0.72Expected life (years) 5.50 6.25 6.25 6.25 6.25 6.25 6.25 6.25Risk free interestrate (%)
8.62 8.44 8.88 8.52 8.41 8.88 9.02 9.02
Volatility (%) 32.39 32.62 32.48 32.60 32.71 32.48 32.19 31.92
37. Stock Appreciation Rights: The Company has granted Stock Appreciation Rights (“SARs”) to certain eligible employees in accordance with Lupin Employees
Stock Appreciation Rights Scheme 2011 (“LESARs 2011”) approved by the Board of Directors (Board) at their Board Meeting held on September 13, 2011. Such SARs were granted during the prior years. Under the scheme, eligible employees are entitled to receive appreciation in value of shares on completion of the vesting period.
The Scheme is administered through the Lupin Employees Benefit Trust (the “Trust”) as settled by the Company. The Trust is administered by an independent Trustee. At the end of the vesting period of 3 years, the equity shares will be sold in the market by the Trust and the appreciation on the same (if any) will be distributed to the said employees, subject to vesting conditions.
Pursuant to circular no. CIR/CFD/DIL/3/2013 dated January 17, 2013 (the “Circular”) issued by the Securities and Exchange Board of India (SEBI), the Company has submitted the required details with the stock exchanges within the prescribed period. Further during the year, SEBI has extended timeline for alignment of the scheme to June 30, 2014 vide circular no. CIR/CFD/POLICYCELL/14/2013 dated November 29, 2013.
As approved by the Board, the Company has, prior to the Circular, advanced an interest free loan of H nil (previous year H 256.8 million) to the Trust during the year to acquire appropriate number of Equity Shares of the Company from the market on the grant date of SARs and the loan outstanding as at the balance sheet date aggregating to H 258.0 million (previous year H 476.9 million) is included under “Long-Term Loans and Advances” (Refer note 15) and H 218.9 million (previous year H nil) is included under “Short-Term Loans and Advances” (Refer note 20).
The particulars of the rights assigned and lapsed under the Scheme are as below:
Lupin Employees Stock Appreciation Rights 2011:
Particulars Year Ended 31.03.2014
Year Ended 31.03.2013
Rights outstanding as at the beginning of the year 860098 455290Add: Rights assigned prior to the Circular during the year - 443049Less: Rights lapsed during the year 16702 38241Rights outstanding as at the year end 843396 860098
The related compensation cost for outstanding SARs amounting to H 191.6 million (previous year H 30.8 million) has been recognized as Employee Benefits Expense and the corresponding credit is included under “Reserves and Surplus” as Employee Stock Appreciation Rights Outstanding. Had the compensation cost for the Company’s stock based compensation plans been determined in the manner consistent with the fair value approach as described in the Guidance Note on Accounting for Employee Share-based Payments issued by ICAI, the Group’s net income would be higher by H 110.3 million (previous year would be lower by H 7.9 million) and earnings per share as reported would be as indicated below:
120 | Lupin Limited

Particulars Year Ended 31.03.2014
Year Ended 31.03.2013
I in million I in millionNet profit as reported 18363.7 13141.6Less: Total stock-based employee compensation expense determined under fair value based method
81.3 38.7
Add: Total stock-based employee compensation expense determined under intrinsic value based method
191.6 30.8
Adjusted net profit 18474.0 13133.7Basic earnings per share
- As reported (in H)* 40.99 29.39- Adjusted (in H) 41.24 29.37
Diluted earnings per share- As reported (in H)* 40.79 29.26- Adjusted (in H) 41.03 29.24
* Refer note 34
38. Post Employment Benefits: (i) Defined Contribution Plans: The Group makes contributions towards provident fund, superannuation fund and other retirement benefits to a defined
contribution retirement benefit plan for qualifying employees. Under the plan, the Group is required to contribute a specified percentage of payroll cost to the retirement benefit plan to fund the benefits.
The Group recognised H 360.4 million (previous year H 311.0 million) for superannuation contribution and other retirement benefit contributions in the Consolidated Statement of Profit and Loss.
The contributions payable to these plans by the Group are at rates specified in the rules of the schemes.
The Company recognised H 92.5 million (previous year H 82.9 million) for provident fund contributions in the Consolidated Statement of Profit and Loss.
(ii) Defined Benefit Plan: a) The Company
A) The Company makes annual contributions to the Group Gratuity cum Life Assurance Schemes administered by the LIC of India, a funded defined benefit plan for qualifying employees. The scheme provides for payment as under:
i) On normal retirement / early retirement / withdrawal / resignation: As per the provisions of the Payment of Gratuity Act, 1972 with vesting period of 5 years of service.
ii) On death in service: As per the provisions of the Payment of Gratuity Act, 1972 without any vesting period.
In addition to the above mentioned scheme, the Company also pays additional gratuity as an ex-gratia and the said amount is provided as non-funded liability based on actuarial valuation.
The most recent actuarial valuation of plan assets and the present value of the defined benefit obligation for gratuity were carried out as at March 31, 2014. The present value of the defined benefit obligations and the related current service cost and past service cost, were measured using the Projected Unit Credit Method.
Based on the actuarial valuation obtained in this respect, the following table sets out the status of the gratuity plan and the amounts recognised in the Group’s financial statements as at balance sheet date:
Sr. No.
Particulars Gratuity (Funded) Gratuity (Unfunded)
As on 31.03.2014
As on 31.03.2013
As on 31.03.2014
As on 31.03.2013
I in million I in million I in million I in millionI) Reconciliation in present value of
obligations (‘PVO’) – defined benefit obligation:Current service cost 102.6 94.4 70.8 252.6Past service cost - - - -
Annual Report 2014 | 121

Sr. No.
Particulars Gratuity (Funded) Gratuity (Unfunded)
As on 31.03.2014
As on 31.03.2013
As on 31.03.2014
As on 31.03.2013
I in million I in million I in million I in millionInterest cost 45.4 38.6 29.0 24.4Actuarial loss / (gain) (27.0) 33.9 (28.3) (6.7)Benefits paid (63.5) (34.7) - -PVO at the beginning of the year 594.9 462.7 360.3 90.0PVO at the end of the year 652.4 594.9 431.8 360.3
II) Change in fair value of plan assets:Expected return on plan assets 45.3 40.3 - -Actuarial gain / (loss) 4.2 (0.1) - -Contributions by the employer 125.5 45.0 - -Benefits paid (63.5) (34.7) - -Fair value of plan assets at thebeginning of the year
469.4 417.7 - -
Adjustment to opening balance - 1.2 - -Fair value of plan assets at the end of the year 580.9 469.4 - -
III) Reconciliation of PVO and fair value of plan assets:PVO at end of the year 652.4 594.9 431.8 360.3Fair Value of plan assets at the end of the year 580.9 469.4 - -Funded status (71.5) (125.5) (431.8) (360.3)Unrecognised actuarial gain / (loss) - - - -Net liability recognised in the balance sheet (71.5) (125.5) (431.8) (360.3)
IV) Net cost for the year:Current service cost 102.6 94.4 70.8 252.6Past service cost - - - -Interest cost 45.4 38.6 29.0 24.4Expected return on plan assets (45.3) (40.3) - -Actuarial losses / (gain) (31.2) 34.0 (28.3) (6.7)Total expense recognised in the ConsolidatedStatement of Profit and Loss (Refer note 26)
71.5 126.7 71.5 270.3
V) Category of assets as at the end of the year:Insurer Managed Funds (100%)(Fund is Managed by LIC as per IRDA guidelines, category-wise composition of the plan assets is not available)
580.9 469.4 NA NA
VI) Actual return on the plan assets: 49.5 40.2 NA NAVII) Assumptions used in accounting for the
gratuity plan:Discount rate (%) 9.2 8.1 9.2 8.1Salary escalation rate (%) 6.0 6.0 6.0 6.0Expected rate of return on plan assets (%) 9.1 9.5 NA NAEstimate of amount of contribution in immediate next year
71.5 125.5 NA NA
The estimates of salary escalation, considered in actuarial valuation, take account of inflation, seniority, promotion and other relevant factors, such as supply and demand in the employment market.
122 | Lupin Limited

(I in million)Gratuity (Funded) Year Ended
31.03.2014 31.03.2013 31.03.2012 31.03.2011 31.03.2010Experience adjustment
- On plan liabilities 32.6 6.1 90.5 # #- On plan assets 4.2 0.1 2.3 # #
Present value of benefit obligation (652.4) (594.9) (462.7) (384.6) (244.3)Fair value of plan assets 580.9 469.4 417.7 365.4 213.3Excess of (obligation over plan assets) / plan assets over obligation
(71.5) (125.5) (45.0) (19.2) (31.0)
# Experience adjustment information in respect of previous two years is not available, hence not disclosed.
B) The provident fund plan of the Company, except two plants, is operated by the “Lupin Limited Employees Provident Fund Trust” (the “Trust”). Eligible employees receive benefits from the said Provident Fund. Both the employees and the Company make monthly contributions to the Provident Fund Plans equal to a specified percentage of the covered employee’s salary. The minimum interest rate payable by the Trust to the beneficiaries every year is being notified by the Government. The Company has an obligation to make good the shortfall, if any, between the return from the investments of the Trust and the notified interest rate.
The ASB Guidance on Implementing AS-15, Employee Benefits (revised 2005) issued by Accounting Standards Board (ASB) states that benefit plans involving employer established provident funds, which require interest shortfalls to be recompensed are to be considered as defined benefit plans. As per the Guidance Note from the Actuarial Society of India, the Company has obtained the actuarial valuation of interest rate obligation in respect of Provident Fund as at March 31, 2014 and shortfall aggregating H 9.0 million (previous year H 19.9 million) has been provided for. The Company has an obligation to service the shortfall on account of interest generated by the fund and on maturity of fund investments and hence the same has been classified as Defined Benefit Plan.
The Company recognised H 257.0 million (previous year H 186.6 million) for provident fund contributions in the Consolidated Statement of Profit and Loss.
Based on the actuarial valuation obtained in this respect, the following table sets out the status of the provident fund plan and the amounts recognised in the Group’s financial statements as at balance sheet date:
Sr. No.
Particulars Provident Fund (Funded)
As on 31.03.2014 As on 31.03.2013I in million I in million
I) Reconciliation in present value of obligations (‘PVO’) – defined benefit obligation:Current service cost 885.6 751.8Past service cost - -Interest cost 1.6 2.1Actuarial loss / (gain) (12.5) (6.8)Benefits paid (224.9) (160.8)PVO at the beginning of the year 2739.1 2152.8PVO at the end of the year 3388.9 2739.1
II) Change in fair value of plan assets:Expected return on plan assets 243.2 208.3Adjustment to opening balance - (7.6)Actuarial gain / (loss) - -Contributions by the employer 642.4 551.1Benefits paid (224.9) (160.8)Fair value of plan assets at the beginning of the year 2719.2 2128.2Fair value of plan assets at the end of the year 3379.9 2719.2
III) Reconciliation of PVO and fair value of plan assets:PVO at end of the year 3388.9 2739.1Fair Value of plan assets at the end of the year 3379.9 2719.2Funded status (9.0) (19.9)
Annual Report 2014 | 123

Sr. No.
Particulars Provident Fund (Funded)
As on 31.03.2014 As on 31.03.2013I in million I in million
Unrecognised actuarial gain / (loss) - -Net liability recognised in the balance sheet (9.0) (19.9)
IV) Net cost for the year:Current service cost 885.6 751.8Past service cost - -Interest cost 1.6 2.1Expected return on plan assets (243.2) (208.3)Actuarial losses / (gain) (12.5) (6.8)Interest expense pertaining to the Trust 642.4 543.5Net expense recognised in the Consolidated Statementof Profit and Loss (Refer note 26)
(10.9) (4.7)
V) Category of assets as at the end of the year:Investment in PSU bonds 22% 56%Investment in Government Securities 44% 29%Bank Special Deposit 6% 8%Investment in other securities 26% 5%Bank Savings Deposit 2% 2%
VI) Actual return on the plan assets: 243.2 208.3VII) Assumptions used in accounting for the provident fund plan:
Discount rate (%) 9.2 8.1Salary escalation rate (%) 6.0 6.0Expected rate of return on plan assets (%) 8.8 8.7
b) Kyowa Pharmaceutical Industry Co., Limited, Japan The Group’s subsidiary at Japan has retirement plan to cover all its employees. The plan consist of a defined benefit
non funded pension plan (referred as “plan”).
Under the plan, employees are entitled to benefits based on level of salaries, length of service and certain other factors at the time of retirement or termination.
The present value of the defined benefit obligations and the related current service cost and past service cost, were measured using the Projected Unit Credit Method.
Retirement allowances for directors are provided for liability of the amount that would be required if all directors retired at the balance sheet date.
The following table sets out the status of the retirement plan and the amounts recognised in the Group’s financial statements as at balance sheet date:
Sr. No.
Particulars Lump sum Retirement Benefits(non funded)
As on 31.03.2014 As on 31.03.2013I in million I in million
I) Reconciliation in present value of obligations (‘PVO’) – defined benefit obligation:Current service cost 15.6 14.5Interest cost 1.6 1.7Actuarial (gain) / loss 11.2 4.2Benefits paid (4.5) (5.8)Past service cost - -Foreign exchange translation difference 1.2 (9.7)PVO at the beginning of the year 113.4 108.5PVO at end of the year 138.5 113.4
124 | Lupin Limited

Sr. No.
Particulars Lump sum Retirement Benefits(non funded)
As on 31.03.2014 As on 31.03.2013I in million I in million
II) Reconciliation of PVO and fair value of plan assets:PVO at end of the year 138.5 113.4Fair Value of plan assets at end of the year - -Funded status (138.5) (113.4)Unrecognised actuarial gain / (loss) - -Net asset / (liability) recognised in the balance sheet (138.5) (113.4)
III) Net cost for the year:Current service cost 15.6 14.5Interest cost 1.6 1.7Actuarial (gain) / losses 11.2 4.2Total expense recognised in the Consolidated Statementof Profit and Loss (Refer note 26)
28.4 20.4
IV) Assumptions used in accounting for the retirement benefit plan:Discount rate (%) 0.9 1.3Salary escalation rate (%) - -Expected rate of return on plan assets (%) - -
Liability of lump sum retirement benefit as above along with liability for retirement benefits of directors H 18.2 million (previous year H 13.4 million) is shown under “Long-Term Provisions” (Refer note 7).
(I in million)Year Ended
31.03.2014 31.03.2013 31.03.2012 31.03.2011 31.03.2010Experience adjustment
- On plan liabilities 3.9 1.3 2.0 # #- On plan assets - - - # #
Present value of benefit obligation (138.5) (113.4) (108.5) (81.1) (64.4)Fair value of plan assets - - - - -Excess of obligation over plan assets (138.5) (113.4) (108.5) (81.1) (64.4)
# Experience adjustment information in respect of previous two years is not available, hence not disclosed.
c) I’rom Pharmaceutical Co., Limited, Japan The Group’s another subsidiary at Japan has retirement plan to cover its employees.
Under the plan, employees are entitled to benefits based on level of salaries, length of service and certain other factors at the time of retirement or termination.
The most recent actuarial valuation of the present value of the defined benefit obligation for retirement benefits were carried out as at March 31, 2014. The present value of the defined benefit obligations and the related current service cost and past service cost, were measured using the Projected Unit Credit Method.
The following table sets out the status of the retirement plan and the amounts recognised in the Group’s financial statements as at balance sheet date:
Sr. No.
Particulars Lump sum Retirement Benefits(non funded)
As on 31.03.2014 As on 31.03.2013I in million I in million
I) Reconciliation in present value of obligations (‘PVO’) – defined benefit obligation:Current Service Cost 26.9 27.2Interest Cost 2.8 4.2Actuarial (gain) / loss 5.9 6.4Prior Service Cost (2.9) -Benefits paid (36.8) (31.7)
Annual Report 2014 | 125
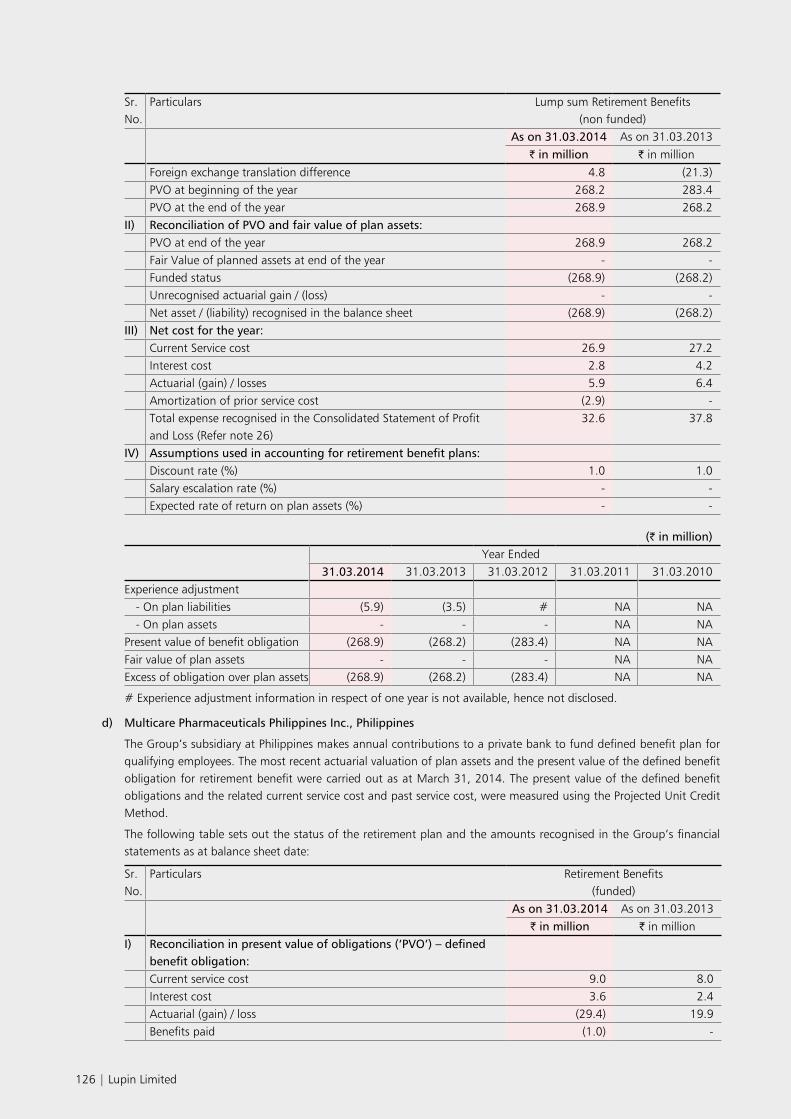
Sr. No.
Particulars Lump sum Retirement Benefits(non funded)
As on 31.03.2014 As on 31.03.2013I in million I in million
Foreign exchange translation difference 4.8 (21.3)PVO at beginning of the year 268.2 283.4PVO at the end of the year 268.9 268.2
II) Reconciliation of PVO and fair value of plan assets:PVO at end of the year 268.9 268.2Fair Value of planned assets at end of the year - -Funded status (268.9) (268.2)Unrecognised actuarial gain / (loss) - -Net asset / (liability) recognised in the balance sheet (268.9) (268.2)
III) Net cost for the year:Current Service cost 26.9 27.2Interest cost 2.8 4.2Actuarial (gain) / losses 5.9 6.4Amortization of prior service cost (2.9) -Total expense recognised in the Consolidated Statement of Profit and Loss (Refer note 26)
32.6 37.8
IV) Assumptions used in accounting for retirement benefit plans:Discount rate (%) 1.0 1.0Salary escalation rate (%) - -Expected rate of return on plan assets (%) - -
(I in million)Year Ended
31.03.2014 31.03.2013 31.03.2012 31.03.2011 31.03.2010Experience adjustment
- On plan liabilities (5.9) (3.5) # NA NA- On plan assets - - - NA NA
Present value of benefit obligation (268.9) (268.2) (283.4) NA NAFair value of plan assets - - - NA NAExcess of obligation over plan assets (268.9) (268.2) (283.4) NA NA
# Experience adjustment information in respect of one year is not available, hence not disclosed.
d) Multicare Pharmaceuticals Philippines Inc., Philippines
The Group’s subsidiary at Philippines makes annual contributions to a private bank to fund defined benefit plan for qualifying employees. The most recent actuarial valuation of plan assets and the present value of the defined benefit obligation for retirement benefit were carried out as at March 31, 2014. The present value of the defined benefit obligations and the related current service cost and past service cost, were measured using the Projected Unit Credit Method.
The following table sets out the status of the retirement plan and the amounts recognised in the Group’s financial statements as at balance sheet date:
Sr. No.
Particulars Retirement Benefits(funded)
As on 31.03.2014 As on 31.03.2013I in million I in million
I) Reconciliation in present value of obligations (‘PVO’) – defined benefit obligation:Current service cost 9.0 8.0Interest cost 3.6 2.4Actuarial (gain) / loss (29.4) 19.9Benefits paid (1.0) -
126 | Lupin Limited

Sr. No.
Particulars Retirement Benefits(funded)
As on 31.03.2014 As on 31.03.2013I in million I in million
Past service cost - -Foreign exchange translation difference 0.9 4.8PVO at the beginning of the year 69.7 34.6PVO at end of the year 52.8 69.7
II) Change in fair value of plan assets:Expected return on plan assets 1.4 0.8Actuarial gain / (loss) (H 22674) 1.4Contributions by the employer 6.8 7.8Benefits paid (1.0) -Foreign exchange translation difference (0.1) 1.7Fair value of plan assets at beginning of the year 23.7 12.0Fair value of plan assets at end of the year 30.8 23.7
III) Reconciliation of PVO and fair value of plan assets:PVO at end of year 52.8 69.7Fair Value of plan assets at end of year 30.7 23.7Funded status (22.1) (46.0)Unrecognised actuarial (loss) / gain - -Net asset / (liability) recognised in the balance sheet (22.1) (46.0)
IV) Net cost for the year:Current Service cost 9.0 8.0Interest cost 3.6 2.4Expected return on plan assets (1.4) (0.8)Actuarial (gain) / losses (29.4) 18.5Total expense recognised in the Consolidated Statement of Profit and Loss (Refer note 26)
(18.2) 28.1
V) Category of assets as at the end of the year:Investment in government securities 20% 41%Investment in common trust fund 37% 44%Investment in other securities and debt instruments 18% 8%Investment in loans and bill discounts 22% 5%Bank savings deposit 3% 2%
VI) Actual return on the plan assets 1.4 2.2VII) Assumptions used in accounting for retirement benefit plan:
Discount rate (%) 5.5 4.9Salary escalation rate (%) 7.0 7.0Expected rate of return on plan assets (%) 7.0 7.5
(I in million)Year Ended
31.03.2014 31.03.2013 31.03.2012 31.03.2011 31.03.2010Experience adjustment
- On plan liabilities (1.7) 19.9 0.3 # #- On plan assets H 22674 1.3 H (33109) # #
Present value of benefit obligation (52.8) (69.7) (34.6) (22.8) (13.4)Fair value of plan assets 30.7 23.7 12.0 10.0 8.0Excess of obligation over plan assets (22.1) (46.0) (22.6) (12.8) (5.4)
# Experience adjustment information in respect of previous two years is not available, hence not disclosed.
Annual Report 2014 | 127

39. (i) The Company has entered into foreign currency forward contracts which are not intended for trading or speculative purposes but for hedge purposes to establish the amount of reporting currency required or available at the settlement date of certain payables. The following are the outstanding foreign currency forward contracts entered into by the Company:
Currency Amount Buy or Sell Cross CurrencyAs on 31.03.2014 As on 31.03.2013
USD 10149602 - Buy INR
(ii) The year-end foreign currency exposures that have not been hedged by a derivative instrument or otherwise are given below:
a. Amount receivable in foreign currency on account of the following:
Particulars Foreign Currency As on 31.03.2014 As on 31.03.2013I in million Amount in
Foreign CurrencyI in million Amount in
Foreign CurrencyExport of goods
AUD 31.9 574748 53.2 941600ACUD 9.1 152575 2.0 36850EURO 405.8 4930367 463.0 6661034JPY 1.0 1768559 - -USD 3247.4 54200582 3047.0 56127585
Fixed Deposits USD 3170.2 52970000 - -Interest receivable on bank fixed deposits
USD 24.6 410691 - -
Other receivablesJPY 6.9 11727001 - -UZS 0.1 2973852 H 30188 1161058
EURO 7.1 86818 - -USD 759.8 12680846 14.1 259596RUB 0.1 47325 1.1 646264KZT 1.9 5710111 0.6 1689291RMB 3.4 348403 1.1 122533UAH 0.1 25879 H 26009 3822
b. Amount payable in foreign currency on account of the following:
Particulars Foreign Currency As on 31.03.2014 As on 31.03.2013I in million Amount in
Foreign CurrencyI in million Amount in
Foreign CurrencyImport of goods and services
USD 626.9 10532002 1545.4 28871855GBP 18.5 185281 103.8 1263411
EURO 392.7 4903537 416.9 5920410AUD 0.1 929 - -CHF 1.2 17808 0.4 6618JPY 1.6 2807377 5.5 9510000KZT - - 0.1 391061SGD - - 0.6 14434BRL - - 1.1 39756SEK 0.2 22593 0.1 15751CAD 1.8 33296 - -
Secured and Unsecured Loans payable
USD - - 5703.7 105069863
128 | Lupin Limited

Particulars Foreign Currency As on 31.03.2014 As on 31.03.2013I in million Amount in
Foreign CurrencyI in million Amount in
Foreign Currency
Interest accrued and not due on Secured and Unsecured loans
USD - - 0.2 2964
Other payablesUSD 289.4 4830371 348.4 6439959RUB 0.5 297112 0.7 420588JPY 0.3 500000 - -BRL 0.5 18684 - -KZT 0.4 1120778 0.9 2544909
ACUD 0.9 15187 0.7 12112UAH 2.7 489197 2.9 422213EURO 51.5 631016 69.2 986454AUD 9.8 176834 2.0 34562CHF 3.1 46044 1.1 18440AED 0.3 18594 0.3 18594RMB H 10224 1060 - -UZS 0.1 4809250 - -
40. Details of Derivative Contracts: The Company enters into forward and option contracts in order to hedge and manage its foreign currency exposures towards
future export earnings. Such derivative contracts are entered into by the Company for hedging purposes only, and are accordingly classified as cash flow hedges.
The category wise break-up thereof is as under:
(Amount in million)Particulars Currency As at 31.03.2014 As at 31.03.2013 Cross CurrencyForward contracts USD 129.0 244.0 INROption contracts USD 0.8 7.5 INR
The changes in the fair value of the derivative contracts during the year ended March 31, 2014, aggregating H 265.5 million (previous year H 441.9 million) designated and effective as hedges have been credited to the Cash Flow Hedge Reserve and H 36.8 million (previous year H 11.8 million debited) is credited to the Consolidated Statement of Profit and Loss, being the ineffective portion thereof.
41. The aggregate amount of revenue expenditure incurred by the Group during the year on Research and Development and shown in the respective heads of account is H 9294.1million (previous year H 7098.4 million).
42. a) During the year, the Company purchased 100% stake consisting of Equity and Capital contribution of Lupin Atlantis Holdings SA, Switzerland (LAHSA) from its wholly owned subsidiary Lupin Holdings B.V., Netherlands at a total cost of
H 2993.7 million pursuant to which LAHSA has become direct wholly owned subsidiary of the Company. b) During the year, the Company, through its wholly owned subsidiary LAHSA acquired / subscribed to the equity stake of the
following subsidiaries: i) 100% equity stake in Nanomi B.V., Netherlands at a total cost of H 857.0 million.
ii) 100% equity stake in Lupin Inc., USA at a total cost of H 325.0 million (including additional paid-in capital – securities premium of H 321.9 million).
iii) 100% equity stake in Lupin GmbH, Switzerland at a total cost of H 1.3 million.
c) During the year, Lupin Inc., USA, (LINC) wholly owned subsidiary of LAHSA has subscribed to equity stake of Company’s wholly owned subsidiary Lupin Pharmaceutical Inc., USA (LPI) resulting into LINC holding 80% and the Company holding 20% of LPI’s equity stake.
Annual Report 2014 | 129

d) During the year, the Company, through its wholly owned subsidiary Lupin Holdings B.V., Netherlands (LHBV), acquired / subscribed to the equity stake of the following subsidiaries:
i) Additional investment in Hormosan Pharma GmbH, Germany at a total cost of H 237.6 million (previous year H 262.2 million).
ii) Additional investment in Lupin Mexico SA de CV, Mexico at a total cost of H 32.8 million (previous year H 10.7 million).
iii) Additional Investment in Lupin Pharma Canada Limited, Canada at a total cost of H 30.2 million (previous year H nil).
iv) 100% equity stake of Farma World Importacao e Exportacao De Medicamentos LTDA – EPP, Brazil at a total cost of H 29.8 million.
v) Additional investment in Lupin Philippines Inc., Philippines at a total cost of H 10.9 million (previous year H 33.7 million).
vi) Additional Investment in Generic Health Pty Ltd., Australia at a total cost of H nil (previous year H 465.1 million).
vii) Additional Investment in Generic Health SDN. BHD., Malaysia at a total cost of H 2.2 million (previous year H nil)
The above acquisitions / subscriptions are based on the net asset values, the future projected revenues, operating profits, cash flows and independent valuation reports; as applicable, of the investee companies.
e) Goodwill on Consolidation comprises of:
Particulars 2013-2014 2012-2013I in million I in million
Opening Balance 5073.2 5040.0Add: On acquisition of stake / increase in subsidiaries during the year 844.3 62.3Add / (Less): Exchange difference during the year on translation of Goodwill of foreign subsidiaries
661.2 (29.1)
Total 6578.7 5073.2
43. a) The Company holds 100% equity stake at a cost of H 20.0 million in Lupin (Europe) Limited, UK (LEL). The said subsidiary has incurred losses during the year and has negative net worth as at the end of the year. Considering the financial, technical and operational support from the Company and LEL’s projections / plans for introducing new products (including products from Lupin Limited, India) in the UK Market in the near future, growth in the turnover and profitability is expected, which would result in improvement in net worth, over a period of time.
b) The Company through its wholly owned subsidiary at Netherlands, namely Lupin Holdings B.V. (“LHBV”), holds 100% equity stake at cost of H 310.7 million in Hormosan Pharma GmbH, Germany (Hormosan). Hormosan continued to incur losses during the year and net worth is substantially eroded as at the end of the year. LHBV, considering the growth & business plans of Hormosan, has made further capital contribution of H 237.6 million (previous year H 262.2 million) during the year. Considering the financial, technical and operational support from Lupin Limited (the holding company of LHBV) and Hormosan’s projections / plans for introducing new products (including products from Lupin Limited, India) in the German Market in the near future, the Company is of the view that this would lead to an improvement in growth, turnover and profitability, which would result in improvement in net worth, over a period of time.
c) During the previous year, the Company through its wholly owned subsidiary at Netherlands, namely LHBV, had increased its stake in Generic Health Pty Ltd. (GH) to 91.04% representing 188405378 shares, costing H 1044.2 million, including 60000000 shares issued on conversion of interest bearing loan of H 170.6 million. LHBV considers its investments in GH to be long term and strategic in nature. GH has incurred losses in the current year and its networth is substantially eroded as at the end of the year. GH has plans to introduce new products (including products from Lupin Limited, India) in the Australian market in the near future. As a result of this it is expected that the Company’s turnover would increase leading to profitability and improvement in net worth over a period of time.
d) During the previous year, based on notice of termination from its toll manufacturing set-up vendor, Lupin Pharma Canada Limited (LPCL), 100% subsidiary of LHBV, had impaired its Capital Work-In-Progress amounting to H 128.6 million. The total investments made by LHBV is H 155.5 million and accumulated losses of LPCL is H 120.6 million as at March 31, 2014. As a result, net worth of LPCL has been eroded substantially. Further, during the year, LPCL has commenced rendering of marketing services in terms of the marketing and service agreement with Lupin Limited for registration and sale of products of Lupin Limited in Canada. As a result of this it is expected that LPCL’s revenue from operations would increase leading to profitability and improvement in net worth over a period of time.
e) Further, networth of Generic Health SDN. BHD., Farma World Importacao e Exportacao De Medicamentos LTDA – EPP, Lupin Philippines Inc., Lupin Mexico SA de CV, Lupin Middle East FZ-LLC, Lupin Atlantis Holdings SA, I’rom Pharmaceutical Co., Limited and Lupin Inc. is substantially less than the carrying amount of investments made by the Company directly or through its subsidiaries.
The Company considers its investments in subsidiaries as strategic and long-term in nature and accordingly, in view of
130 | Lupin Limited
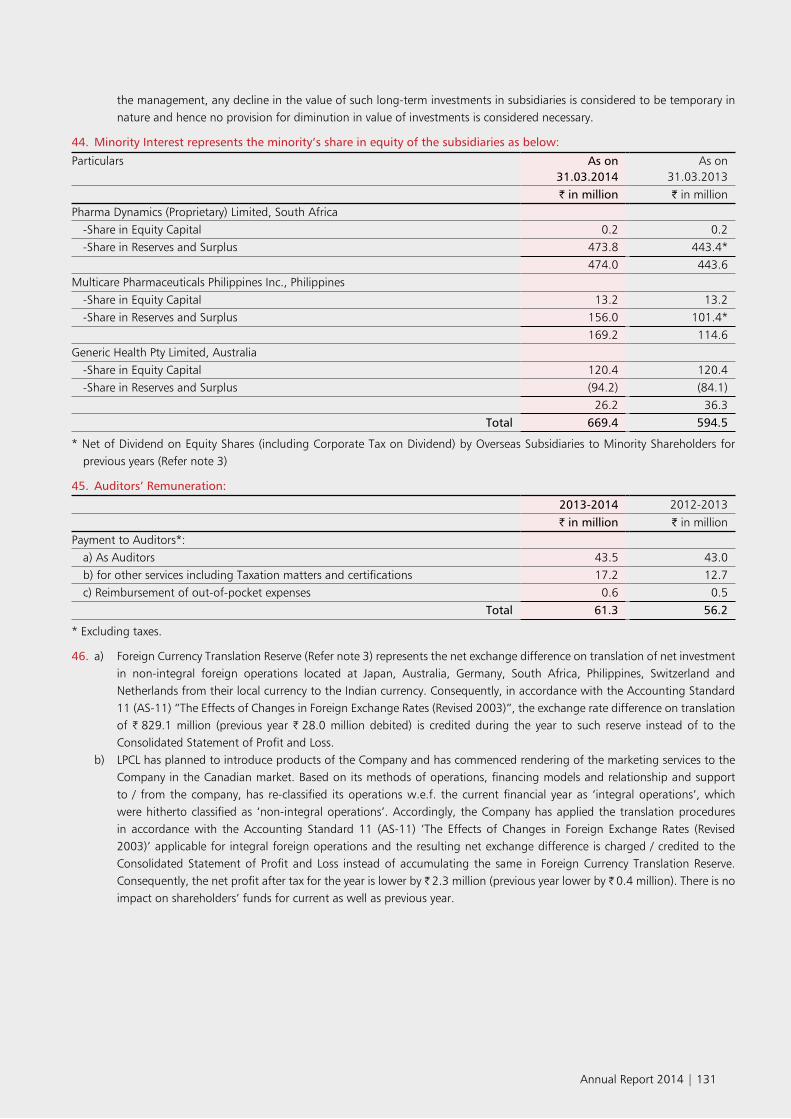
the management, any decline in the value of such long-term investments in subsidiaries is considered to be temporary in nature and hence no provision for diminution in value of investments is considered necessary.
44. Minority Interest represents the minority’s share in equity of the subsidiaries as below:
Particulars As on 31.03.2014
As on 31.03.2013
I in million I in millionPharma Dynamics (Proprietary) Limited, South Africa
-Share in Equity Capital 0.2 0.2-Share in Reserves and Surplus 473.8 443.4*
474.0 443.6Multicare Pharmaceuticals Philippines Inc., Philippines
-Share in Equity Capital 13.2 13.2-Share in Reserves and Surplus 156.0 101.4*
169.2 114.6Generic Health Pty Limited, Australia
-Share in Equity Capital 120.4 120.4-Share in Reserves and Surplus (94.2) (84.1)
26.2 36.3Total 669.4 594.5
* Net of Dividend on Equity Shares (including Corporate Tax on Dividend) by Overseas Subsidiaries to Minority Shareholders for previous years (Refer note 3)
45. Auditors’ Remuneration:
2013-2014 2012-2013I in million I in million
Payment to Auditors*:a) As Auditors 43.5 43.0b) for other services including Taxation matters and certifications 17.2 12.7c) Reimbursement of out-of-pocket expenses 0.6 0.5
Total 61.3 56.2
* Excluding taxes.
46. a) Foreign Currency Translation Reserve (Refer note 3) represents the net exchange difference on translation of net investment in non-integral foreign operations located at Japan, Australia, Germany, South Africa, Philippines, Switzerland and Netherlands from their local currency to the Indian currency. Consequently, in accordance with the Accounting Standard 11 (AS-11) “The Effects of Changes in Foreign Exchange Rates (Revised 2003)”, the exchange rate difference on translation of H 829.1 million (previous year H 28.0 million debited) is credited during the year to such reserve instead of to the Consolidated Statement of Profit and Loss.
b) LPCL has planned to introduce products of the Company and has commenced rendering of the marketing services to the Company in the Canadian market. Based on its methods of operations, financing models and relationship and support to / from the company, has re-classified its operations w.e.f. the current financial year as ‘integral operations’, which were hitherto classified as ‘non-integral operations’. Accordingly, the Company has applied the translation procedures in accordance with the Accounting Standard 11 (AS-11) ‘The Effects of Changes in Foreign Exchange Rates (Revised 2003)’ applicable for integral foreign operations and the resulting net exchange difference is charged / credited to the Consolidated Statement of Profit and Loss instead of accumulating the same in Foreign Currency Translation Reserve. Consequently, the net profit after tax for the year is lower by H 2.3 million (previous year lower by H 0.4 million). There is no impact on shareholders’ funds for current as well as previous year.
Annual Report 2014 | 131
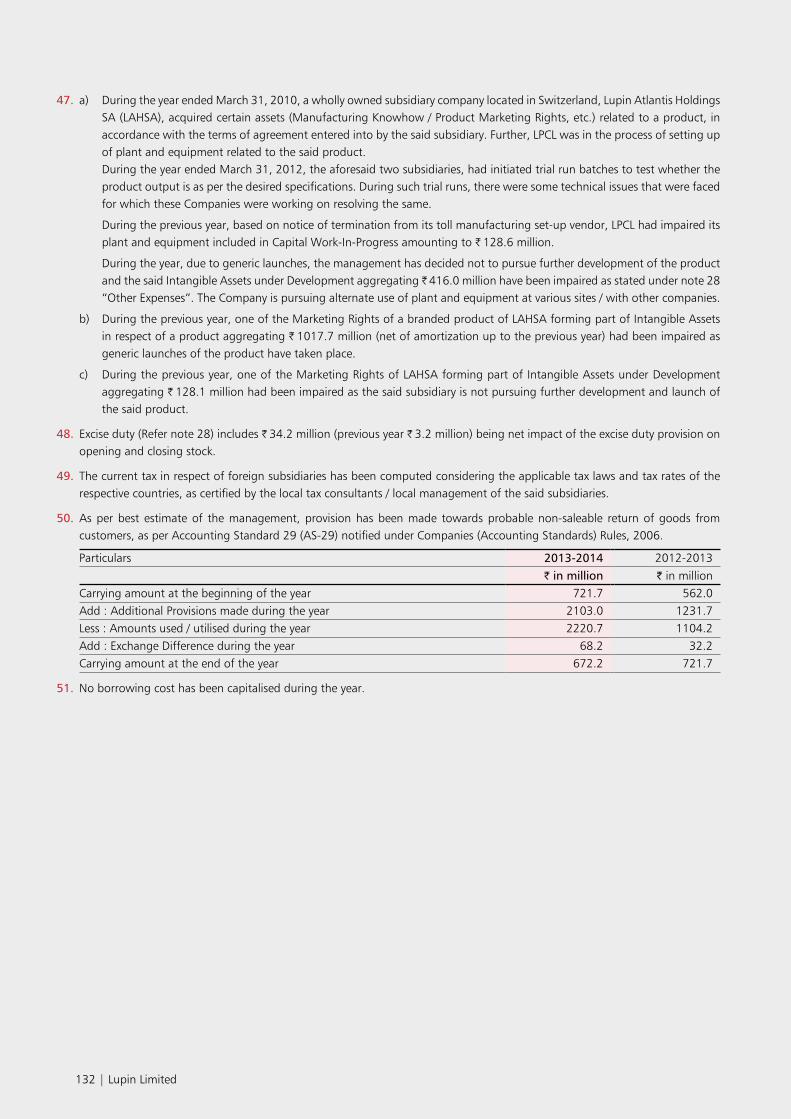
47. a) During the year ended March 31, 2010, a wholly owned subsidiary company located in Switzerland, Lupin Atlantis Holdings SA (LAHSA), acquired certain assets (Manufacturing Knowhow / Product Marketing Rights, etc.) related to a product, in accordance with the terms of agreement entered into by the said subsidiary. Further, LPCL was in the process of setting up of plant and equipment related to the said product.
During the year ended March 31, 2012, the aforesaid two subsidiaries, had initiated trial run batches to test whether the product output is as per the desired specifications. During such trial runs, there were some technical issues that were faced for which these Companies were working on resolving the same.
During the previous year, based on notice of termination from its toll manufacturing set-up vendor, LPCL had impaired its plant and equipment included in Capital Work-In-Progress amounting to H 128.6 million.
During the year, due to generic launches, the management has decided not to pursue further development of the product and the said Intangible Assets under Development aggregating H 416.0 million have been impaired as stated under note 28 “Other Expenses”. The Company is pursuing alternate use of plant and equipment at various sites / with other companies.
b) During the previous year, one of the Marketing Rights of a branded product of LAHSA forming part of Intangible Assets in respect of a product aggregating H 1017.7 million (net of amortization up to the previous year) had been impaired as generic launches of the product have taken place.
c) During the previous year, one of the Marketing Rights of LAHSA forming part of Intangible Assets under Development aggregating H 128.1 million had been impaired as the said subsidiary is not pursuing further development and launch of the said product.
48. Excise duty (Refer note 28) includes H 34.2 million (previous year H 3.2 million) being net impact of the excise duty provision on opening and closing stock.
49. The current tax in respect of foreign subsidiaries has been computed considering the applicable tax laws and tax rates of the respective countries, as certified by the local tax consultants / local management of the said subsidiaries.
50. As per best estimate of the management, provision has been made towards probable non-saleable return of goods from customers, as per Accounting Standard 29 (AS-29) notified under Companies (Accounting Standards) Rules, 2006.
Particulars 2013-2014 2012-2013I in million I in million
Carrying amount at the beginning of the year 721.7 562.0Add : Additional Provisions made during the year 2103.0 1231.7Less : Amounts used / utilised during the year 2220.7 1104.2Add : Exchange Difference during the year 68.2 32.2Carrying amount at the end of the year 672.2 721.7
51. No borrowing cost has been capitalised during the year.
132 | Lupin Limited

52.
Info
rmat
ion
rela
ting
to S
ubsi
diar
ies
incl
udin
g su
bsid
iarie
s of
sub
sidi
arie
s (In
ter
ms
of G
over
nmen
t of
Indi
a, M
inis
try
of C
orpo
rate
Aff
airs
Gen
eral
Circ
ular
No:
2/2
011,
No:
5/1
2/20
07-C
L-III
dat
ed 8
th F
ebru
ary,
201
1) f
or t
he y
ear
ende
d M
arch
31,
201
4
Nam
e of
the
su
bsid
iary
co
mpa
ny
Year
Lupi
n Ph
arm
a-ce
utic
als,
In
c., U
SA
Kyow
a Ph
arm
a-ce
utic
al
Indu
stry
Co
., Lt
d.,
Japa
n
Lupi
n A
ustr
alia
(P
ty) L
td.,
Aus
tral
ia
Lupi
n H
old-
ings
B.V
., N
ethe
r-la
nds
Phar
ma
Dyn
amic
s (P
ropr
i-et
ary)
Ltd
., So
uth
Afr
ica
Hor
mos
an
Phar
ma
Gm
bH,
Ger
man
y
Mul
ticar
e Ph
arm
a-ce
utic
als
Phili
ppin
es
Inc.
, Phi
lip-
pine
s
Lupi
n A
tlant
is
Hol
ding
s SA
, Sw
it-ze
rland
Lupi
n (E
urop
e)
Ltd.
,U.K
.
Am
el
Touh
oku,
Ja
pan
(a)
Lupi
n Ph
arm
a Ca
nada
Lt
d.,
Cana
da
Lupi
n M
exic
o SA
de
CV,
Mex
ico
Gen
eric
H
ealth
Pt
y Lt
d.,
Aus
tral
ia
Bell-
wet
her
Phar
ma
Pty
Ltd.
, A
ustr
alia
Max
Ph
arm
a Pt
y Lt
d.,
Aus
tral
ia
Lupi
n Ph
ilip-
pine
s In
c.,
Phili
p-pi
nes
Lupi
n H
ealth
-ca
re L
td.,
Indi
a
Gen
eric
H
ealth
SD
N.
BHD
., M
alay
sia
I’rom
Ph
arm
a-ce
utic
al
Co.,
Ltd,
Ja
pan
Lupi
n M
iddl
e Ea
st F
Z -
LLC,
U
AE
(b)
Farm
awor
ld
Impo
rtac
ao
e Ex
port
acao
D
e M
edi-
cam
ento
s LT
DA
- E
PP,
Braz
il
Lupi
n G
mbH
, Sw
itzer
-la
nd
Lupi
n In
c., U
SAN
anom
i B.
V.,
Net
h-er
land
s
The
finan
cial
ye
ar /
perio
d en
ded
on
Year
end
ed
Mar
ch 3
1,20
14
Year
end
ed
Mar
ch 3
1,20
14
Year
en
ded
Mar
ch
31,
2014
Year
end
ed
Mar
ch 3
1,20
14
Year
end
ed
Mar
ch 3
1,20
14
Year
end
ed
Mar
ch 3
1,20
14
Year
end
ed
Mar
ch 3
1,20
14
Year
end
ed
Mar
ch 3
1,20
14
Year
en
ded
Mar
ch
31,
2014
Year
en
ded
Mar
ch
31,
2014
Year
en
ded
Mar
ch
31,
2014
Year
end
ed
Mar
ch 3
1,
2014
Year
en
ded
Mar
ch
31, 2
014
Year
en
ded
Mar
ch 3
1,
2014
Year
en
ded
Mar
ch 3
1,
2014
Year
en
ded
Mar
ch
31, 2
014
Year
en
ded
Mar
ch 3
1,
2014
Year
en
ded
Mar
ch 3
1,
2014
Year
en
ded
Mar
ch
31, 2
014
From
D
ecem
ber
17, 2
013
to
Mar
ch 3
1,
2014
From
A
ugus
t 15
, 201
3 to
Mar
ch
31, 2
014
From
Jun
e 27
, 201
3 to
Mar
ch
31, 2
014
From
Ja
nuar
y 30
, 201
4 to
Mar
ch
31, 2
014
H in
mill
ion
H in
mill
ion
H in
mill
ion
H in
mill
ion
H in
mill
ion
H in
mill
ion
H in
mill
ion
H in
mill
ion
H in
mill
ion
H in
mill
ion
H in
mill
ion
H in
mill
ion
H in
mill
ion
H in
mill
ion
H in
mill
ion
H in
mill
ion
H in
mill
ion
H in
mill
ion
I in
mill
ion
I in
mill
ion
I in
mill
ion
I in
mill
ion
I in
mill
ion
I in
mill
ion
Capi
tal
2013
-14
85.
7 3
4.9
33.
3 6
,720
.3
0.5
8
.1
105
.5
2,3
52.6
2
0.0
-
155
.5
52.
2 1
,344
.3
264
.5
125
.1
59.
9 2
6.2
2.2
3
33.9
7
.5
0.5
1
.3
3.1
1
.6
2012
-13
13.
8 3
4.9
16.
9 6
,720
.3
0.5
8
.1
71.
4 2
,352
.6
20.
0 1
.0
125
.3
19.
4 1
,344
.3
264
.5
125
.1
49.
0 2
6.2
333
.9
7.5
-
-
-
-
Rese
rves
2013
-14
1,1
28.2
5
,949
.6
(7.
0) 2
,668
.3
1,2
82.3
(
2.9)
239
.4
(1,
097.
8) (
147.
4) -
(
120.
6) (
29.0
)(1
,045
.4)
(27
4.4)
(11
9.3)
(18
.0)
52.
2 (
2.2)
532
.0
(13
.3)
(11
.0)
3
7.7
(11
.3)
2012
-13
2,7
23.6
4
,951
.9
(0.5
) 1
,616
.8
1,2
06.0
(7
.5)
162
.3
(69.
9) (3
0.3)
(1.0
) (1
19.1
) (1
6.5)
(932
.8)
(796
.8)
(119
.2)
(49.
5) 5
1.8
(1.4
) 5
26.1
(3
.0)
-
-
-
-
Tota
l Li
abili
ties
2013
-14
24,
180.
5 7
,716
.2
1.2
4
9.2
674
.6
831
.7
449
.8
2,1
13.2
4
72.2
-
2
9.5
644
.0
9.8
-
3
94.8
0
.5
2,0
80.6
1
5.2
26.
7 4
8.0
294
.5
54.
4
2012
-13
16,
589.
5 7
,663
.0
0.6
1
64.4
8
15.4
6
76.6
3
20.8
5
47.2
3
24.1
-
0
.5
569
.7
532
.3
-
5.6
1
.8
2,2
14.7
0
.1
-
-
-
-
Tota
l Ass
ets
2013
-14
25,
394.
4 1
3,70
0.7
27.
5 9
,437
.8
1,9
57.4
8
36.9
7
94.7
3
,367
.9
344
.8
-
64.
4 2
3.2
942
.8
-
5.8
4
36.6
7
8.3
0.5
2
,946
.5
9.4
1
6.2
49.
4 3
35.3
4
4.7
2012
-13
19,
326.
9 1
2,64
9.8
17.
0 8
,501
.5
2,0
21.9
6
77.2
5
54.4
2
,829
.9
313
.8
-
6.7
2
.9
981
.2
-
5.9
5
.1
77.
9 0
.4
3,0
74.7
4
.6
-
-
-
-
Inve
stm
ent
(Oth
er
than
in
subs
idia
ries)
2013
-14
-
0.2
-
-
-
-
-
-
-
-
-
-
-
-
-
-
0
.2
-
-
-
-
-
2012
-13
-
0.2
-
-
-
-
-
-
-
-
-
-
-
-
-
-
0
.2
-
-
-
-
-
Turn
over
(N
et)
2013
-14
48,
091.
2 9
,636
.7
-
528
.9
3,8
00.3
7
91.8
1
,262
.3
1,2
96.5
3
09.8
-
-
-
1
,678
.7
-
-
591
.8
-
-
3,3
37.1
-
-
4
6.5
-
10.
2
2012
-13
37,
616.
0 9
,175
.9
-
658
.2
3,2
10.4
4
43.4
8
59.4
1
,448
.7
152
.2
82.
5 -
-
1
,367
.4
-
-
-
-
-
3,8
44.5
-
-
-
-
-
Prof
it /
(Los
s)
befo
re T
ax
2013
-14
1,9
82.4
1
,506
.2
(6.
5) 1
,091
.5
972
.7
(17
1.9)
202
.3
(1,
278.
5) (
114.
6) -
(
2.5)
(12
.6)
(11
3.3)
517
.8
-
22.
1 0
.4
0.8
2
7.3
(10
.2)
(2.
5) (
284.
1) (
55.3
)
2012
-13
1,4
62.8
1
,414
.9
0.1
6
59.0
8
51.4
(2
52.8
) 9
9.9
(1,1
76.1
) (4
0.0)
(3.7
) (1
29.6
) (9
.1)
(689
.0)
-
-
(30.
2) 0
.7
(1.4
) 2
07.6
(3
.0)
-
-
-
-
Prov
isio
n fo
r Ta
x20
13-1
4 5
57.5
5
08.9
-
4
0.0
279
.9
70.
9 0
.1
2.4
-
(
1.0)
-
-
-
-
(9.
4)
-
23.
4 -
-
-
-
2012
-13
488
.6
536
.9
-
0.2
2
58.8
(0
.1)
30.
2 (6
.5)
-
0.1
-
-
-
-
-
-
0
.4
-
(100
.7)
-
-
-
-
-
Prof
it /
(Los
s) a
fter
Ta
x
2013
-14
1,4
24.9
9
97.3
(
6.5)
1,0
51.5
6
92.7
(
171.
9) 1
31.3
(
1,27
8.6)
(11
7.0)
-
(1.
5) (
12.6
) (
113.
3) 5
17.8
-
3
1.5
0.4
0
.8
3.9
(
10.2
) (
2.5)
(28
4.1)
(55
.3)
2012
-13
974
.2
878
.0
0.1
6
58.8
5
92.6
(2
52.7
) 6
9.7
(1,1
69.6
) (4
0.0)
(3.8
) (1
29.6
) (9
.1)
(689
.0)
-
-
(30.
2) 0
.3
(1.4
) 3
08.3
(3
.0)
-
-
-
-
Prop
osed
di
vide
nd20
13-1
4 -
-
-
-
-
-
-
-
-
-
-
-
-
-
-
-
-
-
-
-
-
-
-
-
2012
-13
-
-
-
-
258
.4
-
16.
7 4
94.7
-
-
-
-
-
-
-
-
-
-
-
-
-
-
-
-
Repo
rtin
g Cu
rren
cy20
13-1
4 U
SD
JPY
AU
D
EU
RO
ZA
R E
URO
P
HP
USD
G
BP
C
AD
M
XN
A
UD
A
UD
A
UD
P
HP
INR
RM
J
PY
AED
B
RL
USD
U
SD
EU
RO
2012
-13
USD
J
PY
AU
D
EU
RO
ZA
R E
URO
P
HP
USD
G
BP
JPY
C
AD
M
XN
A
UD
A
UD
A
UD
P
HP
INR
RM
J
PY
AED
-
-
-
-
Exch
ange
Ra
te a
s on
M
arch
31,
20
14
59.
92
0.59
55.
45
82.
31
5.6
5 8
2.31
1
.33
59.
92
99.
64
54.
38
4.5
9 5
5.45
5
5.45
5
5.45
1
.33
-
18.
33
0.59
16.
31
26.
35
59.
92
59.
92
82.
31
Exch
ange
Ra
te a
s on
M
arch
31,
20
13
54.
29
0.5
8 5
6.50
6
9.52
5
.87
69.
52
1.3
3 5
4.29
8
2.10
0
.58
53.
42
4.4
1 5
6.50
5
6.50
5
6.50
1
.33
-
17.
60
0.5
8 1
4.78
-
-
-
-
a) P
.Y. f
igur
es a
re f
or t
he p
erio
d fr
om A
pril
01, 2
012
to F
ebru
ary
28, 2
013
b) P
.Y. f
igur
es a
re f
or t
he p
erio
d fr
om J
une
13, 2
012
to M
arch
31,
201
3
1. I
nves
tmen
t (O
ther
tha
n in
sub
sidi
arie
s) b
y H
orm
osan
Pha
rma
Gm
bH t
o Fr
ankf
urte
r V
olks
bank
eG
Ban
k fo
r th
is y
ear
H 4
1157
(pre
viou
s ye
ar H
347
60)
2. I
nves
tmen
t (O
ther
tha
n in
sub
sidi
arie
s) b
y M
ultic
are
Phar
mac
eutic
als
Phili
ppin
es In
c. t
o Ph
ilipp
ines
Lon
g D
ista
nce
Tele
phon
e Co
. for
thi
s ye
ar H
213
60 (p
revi
ous
year
H 2
1280
)3.
Lup
in M
exic
o SA
de
CV T
otal
Lia
bilit
ies
for
this
yea
r is
H 6
3897
(pre
viou
s ye
ar H
114
66)
4.
Lup
in H
ealth
care
Lim
ited
Tota
l Lia
bilit
ies
for
this
yea
r is
H 2
2472
(pre
viou
s ye
ar H
224
92)
5.
Gen
eric
Hea
lth S
DN
. BH
D. S
hare
Cap
ital f
or p
revi
ous
year
H 6
8
6. L
upin
Gm
bH is
hav
ing
Rese
rves
of
H 2
8362
, Pro
fit b
efor
e ta
x H
423
95, P
rovi
sion
for
Tax
is H
140
33 a
nd P
rofit
aft
er t
ax is
H 2
8362
7. H
orm
osan
Pha
rma
Gm
bH h
avin
g Pr
ovis
ion
for
tax
(H 6
488)
in c
urre
nt y
ear.
8. L
upin
Hea
lthca
re L
td. h
avin
g Pr
ovis
ion
for
tax
H 2
9143
in c
urre
nt y
ear.
9. T
he n
egat
ive
figur
es o
f Re
serv
es in
cas
e of
few
sub
sidi
arie
s ar
e ne
t im
pact
of
accu
mul
ated
loss
es.
10. In
com
plia
nce
with
Cla
use
32 o
f th
e Li
stin
g A
gree
men
t, a
udite
d co
nsol
idat
ed f
inan
cial
sta
tem
ents
for
m p
art
of t
his
Ann
ual R
epor
t.
11. F
ull a
ccou
nts
of t
he a
fore
said
sub
sidi
arie
s ar
e av
aila
ble
for
insp
ectio
n at
the
Reg
iste
red
Off
ice
of t
he C
ompa
ny a
nd o
n re
ques
t w
ill b
e se
nt t
o m
embe
rs f
ree
of c
ost.
Annual Report 2014 | 133

53. Related Party Disclosures, as required by Accounting Standard 18 (AS-18) are given below : A. Relationships - Category I: Key Management Personnel:
Dr. D. B. Gupta Chairman Dr. Kamal K. Sharma Vice Chairman Mrs. Vinita Gupta Chief Executive Officer Mr. Nilesh Gupta Managing Director Mrs. M. D. Gupta Executive Director
Category II: Others (Relatives of Key Management Personnel and Entities in which the Key Management Personnel have control or significant influence) Dr. Anuja Gupta (Daughter of Chairman) Mrs. Kavita Gupta Sabharwal (Daughter of Chairman) Dr. Richa Gupta (Daughter of Chairman) Mrs. Pushpa Khandelwal (Sister of Chairman) Bharat Steel Fabrication and Engineering Works D. B. Gupta (HUF) Lupin Human Welfare and Research Foundation Lupin International Pvt. Limited Lupin Investments Pvt. Limited Lupin Holdings Pvt. Limited (formerly Lupin Marketing Pvt. Limited) Matashree Gomati Devi Jana Seva Nidhi Novamed Investments Pvt. Limited Polynova Industries Limited Rahas Investments Pvt. Limited Synchem Investments Pvt. Limited Visiomed Investments Pvt. Limited (formerly Visiomed (India) Pvt. Limited) Zyma Laboratories Limited
B. Transactions with the related parties:
(I in million)
Sr.No.
TransactionsKey Management
PersonnelOthers Total
1. Rent Expenses - 90.9 90.9
( - ) (101.0) (101.0)
2. Expenses Recovered / Rent Received - 3.0 3.0
( - ) (2.9) (2.9)
3. Remuneration Paid 707.9 - 707.9
(510.2) ( - ) (510.2)
4. Donations Paid - 135.9 135.9
( - ) (91.4) (91.4)
5. Dividend Paid 46.6 1,424.6 1,471.3
(20.3) (651.4) (671.7)
6. Deposits paid for Leave and Licence arrangement for premises - 0.4 0.4
( - ) ( - ) ( - )
7. Refund of Deposits paid for Leave and Licence arrangement for premises - 7.9 7.9
( - ) ( - ) ( - )
8. Deposits received for Leave and Licence arrangement for premises - 0.1 0.1
( - ) ( - ) ( - )
Out of the above items transactions in excess of 10% of the total related party transactions are as under :
(I in million)
Sr.No.
Transactions Related party relation
For the year ended 31.03.2014
For the year ended 31.03.2013
1. Rent Expenses
Lupin Investments Pvt. Limited Others 72.2 82.0
Bharat Steel Fabrication and Engineering Works Others 10.3 10.3
2. Expenses Recovered / Rent Received
Polynova Industries Limited Others 3.0 2.9
3. Remuneration Paid
Dr. D. B. Gupta Key Management Personnel
371.5 219.7
Dr. Kamal K. Sharma Key Management Personnel
134.7 123.4
Mrs. Vinita Gupta Key Management Personnel
135.8 111.8
134 | Lupin Limited

(I in million)
Sr.No.
Transactions Related party relation
For the year ended 31.03.2014
For the year ended 31.03.2013
Mr. Nilesh Gupta Key Management Personnel
60.7 50.1
4. Donations Paid
Lupin Human Welfare and Research Foundation Others 129.2 83.6
5. Dividend Paid
Lupin Holdings Pvt. Limited Others 282.8 129.3
Rahas Investments Pvt. Limited Others 319.9 146.2
Visiomed Investments Pvt. Limited Others 304.6 139.2
Zyma Laboratories Limited Others 384.7 175.9
6. Deposits paid for Leave and Licence arrangement for premises
Bharat Steel Fabrication and Engineering Works Others 0.4 -
7. Refund of Deposits paid for Leave and Licence arrangement for premises
Lupin Investments Pvt. Limited Others 7.9 -
8. Deposits received for Leave and Licence arrangement for premises
Polynova Industries Limited Others 0.1 -
Ms. Vinita Gupta, who was appointed as Chief Executive Officer of the Company w.e.f. September 1, 2013, is an Executive Director but not in whole-time employment of the Company. She is an employee of Lupin GmbH, Switzerland, a wholly-owned subsidiary of Lupin Atlantis Holdings SA, Switzerland. Ms. Vinita Gupta renders management services to the Company in terms of the Services Agreement between the Company and Lupin GmbH, effective January 1, 2014. No amount is charged to the Company for the year in respect of her services pending approval of the same from the Reserve Bank of India, which has been received subsequent to the year end.
C. Balances due from / to the related parties:
(I in million)
Sr.No.
Transactions Key ManagementPersonnel
Others Total
1. Deposits paid under Leave and Licence arrangement for office premises - 54.7 54.7
( - ) (62.2) (62.2)
2. Trade Payables 58.9 - 58.9
(44.4) ( - ) (44.4)
3. Commission Payable 328.5 - 328.5
(178.0) ( - ) (178.0)
4. Expenses Receivable - 0.1 0.1
( - ) ( - ) ( - )
5. Deposits received under Leave and Licence arrangement for office premises - 0.1 0.1
( - ) ( - ) ( - )
i) Figures in brackets are for previous year.
ii) Related party relationship is as identified by the Company and relied upon by the Auditors.
54. The Consolidated Financial Statements include results of operations of two new subsidiaries incorporated and two new subsidiaries acquired during the year, results of operations of the entire twelve months of one subsidiary incorporated during the previous year and excluding the results of operations of one subsidiary liquidated during the previous year. Accordingly, the current year figures are not strictly comparable with those of the previous year.
55. Previous year’s figures have been regrouped / reclassified wherever necessary to correspond with the current year’s classification / disclosure.
Signatures to Note 1 to 55
For Lupin Limited
Dr. Desh Bandhu Gupta Dr. Kamal K. Sharma Vinita GuptaChairman Vice Chairman Chief Executive Officer
Nilesh Gupta M. D. Gupta Dr. Vijay KelkarManaging Director Executive Director Director
Richard Zahn R. A. Shah Dr. K. U. MadaDirector Director Director
Dileep C. ChoksiDirector
Place : Mumbai R. V. SatamDated : May 7, 2014 Company Secretary
Annual Report 2014 | 135

standaloneaccounts
136 | Lupin Limited

independent auditoRs’ RepoRtto tHe memBeRs oF lupin limited
Report on the Financial Statements We have audited the accompanying financial statements of LUPIN LIMITED (“the Company”), which comprise the Balance Sheet as at March 31, 2014, the Statement of Profit and Loss and the Cash Flow Statement for the year then ended, and a summary of the significant accounting policies and other explanatory information.
Management’s Responsibility for the Financial StatementsThe Company’s Management is responsible for the preparation of these financial statements that give a true and fair view of the financial position, financial performance and cash flows of the Company in accordance with the Accounting Standards notified under the Companies Act, 1956 (“the Act”) (which continue to be applicable in respect of Section 133 of the Companies Act, 2013 in terms of General Circular 15/2013 dated September 13, 2013 of the Ministry of Corporate Affairs) and in accordance with the accounting principles generally accepted in India. This responsibility includes the design, implementation and maintenance of internal control relevant to the preparation and presentation of the financial statements that give a true and fair view and are free from material misstatement, whether due to fraud or error.
Auditors’ ResponsibilityOur responsibility is to express an opinion on these financial statements based on our audit. We conducted our audit in accordance with the Standards on Auditing issued by the Institute of Chartered Accountants of India. Those Standards require that we comply with ethical requirements and plan and perform the audit to obtain reasonable assurance about whether the financial statements are free from material misstatement.
An audit involves performing procedures to obtain audit evidence about the amounts and the disclosures in the financial statements. The procedures selected depend on the auditor’s judgment, including the assessment of the risks of material misstatement of the financial statements, whether due to fraud or error. In making those risk assessments, the auditor considers internal control relevant to the Company’s preparation and fair presentation of the financial statements in order to design audit procedures that are appropriate in the circumstances, but not for the purpose of expressing an opinion on the effectiveness of the Company’s internal control. An audit also includes evaluating the appropriateness of the accounting policies used and the reasonableness of the accounting estimates made by the Management, as well as evaluating the overall presentation of the financial statements.
We believe that the audit evidence we have obtained is sufficient and appropriate to provide a basis for our audit opinion.
OpinionIn our opinion and to the best of our information and according
to the explanations given to us, the aforesaid financial statements give the information required by the Act in the manner so required and give a true and fair view in conformity with the accounting principles generally accepted in India:
(a) in the case of the Balance Sheet, of the state of affairs of the Company as at March 31, 2014;
(b) in the case of the Statement of Profit and Loss, of the profit of the Company for the year ended on that date; and
(c) in the case of the Cash Flow Statement, of the cash flows of the Company for the year ended on that date.
Report on Other Legal and Regulatory Requirements1. As required by the Companies (Auditor’s Report) Order,
2003 (“the Order”) issued by the Central Government in terms of Section 227(4A) of the Act, we give in the Annexure a statement on the matters specified in paragraphs 4 and 5 of the Order.
2. As required by Section 227(3) of the Act, we report that:
(a) We have obtained all the information and explanations which to the best of our knowledge and belief were necessary for the purposes of our audit.
(b) In our opinion, proper books of account as required by law have been kept by the Company so far as it appears from our examination of those books.
(c) The Balance Sheet, the Statement of Profit and Loss, and the Cash Flow Statement dealt with by this Report are in agreement with the books of account.
(d) In our opinion, the Balance Sheet, the Statement of Profit and Loss, and the Cash Flow Statement comply with the Accounting Standards notified under the Act (which continue to be applicable in respect of Section 133 of the Companies Act, 2013 in terms of General Circular 15/2013 dated September 13, 2013 of the Ministry of Corporate Affairs).
(e) On the basis of the written representations received from the directors as on March 31, 2014 taken on record by the Board of Directors, none of the directors is disqualified as on March 31, 2014 from being appointed as a director in terms of Section 274(1)(g) of the Act.
For Deloitte Haskins & Sells LLPChartered Accountants
(Firm’s Registration No. 117366W/W-100018)
K. A. KatkiPartner
Place : Mumbai (Membership No.: 038568)Dated : May 7, 2014
Annual Report 2014 | 137

anneXuRe totHe independent auditoRs’ RepoRt
(Referred to in paragraph 1 under ‘Report on Other Legal and Regulatory Requirements’ section of our report of even date)
Having regard to the nature of the Company’s business / activities / results during the year, clauses (xii), (xiii), (xiv), (xix) and (xx) of paragraph 4 of the Order are not applicable to the Company.
(i) In respect of its fixed assets:
(a) The Company has maintained proper records showing full particulars, including quantitative details and situation of fixed assets.
(b) The fixed assets were physically verified during the year by the Management in accordance with a regular programme of verification which, in our opinion, provides for physical verification of all the fixed assets at reasonable intervals. According to the information and explanation given to us, no material discrepancies were noticed on such verification.
(c) The fixed assets disposed off during the year, in our opinion, do not constitute a substantial part of the fixed assets of the Company and such disposal has, in our opinion, not affected the going concern status of the Company.
(ii) In respect of its inventories:
(a) As explained to us, the inventories were physically verified during the year by the Management at reasonable intervals.
(b) In our opinion and according to the information and explanations given to us, the procedures of physical verification of inventories followed by the Management were reasonable and adequate in relation to the size of the Company and the nature of its business.
(c) In our opinion and according to the information and explanations given to us, the Company has maintained proper records of its inventories and no material discrepancies were noticed on physical verification.
(iii) The Company has neither granted nor taken any loans, secured or unsecured, to / from companies, firms or other parties covered in the Register maintained under Section 301 of the Companies Act, 1956.
(iv) In our opinion and according to the information and explanations given to us, having regard to the explanations that some of the items purchased are of special nature and suitable alternative sources are not readily available for obtaining comparable quotations, there is an adequate internal control system commensurate with the size of the Company and the nature of its business with regard to purchases of inventory and fixed assets and the sale of goods and services. During the course of our audit, we
have not observed any major weakness in such internal control system.
(v) In respect of contracts or arrangements entered in the Register maintained in pursuance of Section 301 of the Companies Act, 1956, to the best of our knowledge and belief and according to the information and explanations given to us:
(a) The particulars of contracts or arrangements referred to in Section 301 that needed to be entered in the Register maintained under the said Section have been so entered.
(b) Where each of such transaction is in excess of H 5 lakhs in respect of any party, having regard to our comments in paragraph (iv) above, the transactions have been made at prices which are prima facie reasonable having regard to the prevailing market prices at the relevant time, other than certain purchases which are of a special nature for which comparable quotations are not available.
(vi) According to the information and explanations given to us, the Company has not accepted any deposit from the public during the year. In respect of unclaimed deposits, the Company has complied with the provisions of Sections 58A, 58AA or any other relevant provisions of the Companies Act, 1956.
(vii) In our opinion, the internal audit functions carried out during the year by an external agency and a firm of Chartered Accountants appointed by the Management, have been commensurate with the size of the Company and the nature of its business.
(viii) We have broadly reviewed the cost records maintained by the Company pursuant to the Companies (Cost Accounting Records) Rules, 2011 and the Cost Accounting Records (Pharmaceutical Industry) Rules, 2011 prescribed by the Central Government under Section 209(1)(d) of the Companies Act, 1956 and are of the opinion that, prima facie, the prescribed cost records have been made and maintained. We have, however, not made a detailed examination of the cost records with a view to determine whether they are accurate or complete.
(ix) According to the information and explanations given to us, in respect of statutory dues:
(a) The Company has generally been regular in depositing undisputed statutory dues, including Provident Fund, Investor Education and Protection Fund, Employees’ State Insurance, Income-tax, Sales Tax, Wealth Tax, Service Tax, Customs Duty, Excise Duty, Cess and other material statutory dues applicable to it with the appropriate authorities.
138 | Lupin Limited

Name of Statute Nature of Dues Forum where Dispute is Pending
Period to which the Amount Relates
Amount Involved(I In million)
Income-tax Act, 1961 Income taxCommissioner of Income-tax
(Appeals) – LTU2005-2006, 2006-2007,
2007-200888.0
Central Excise Act, 1944Excise duty
Customs, Excise and Service Tax Appellate Tribunal (CESTAT)
1996-1997, 1998-2000, 2001-2010
48.6
Commissioner of Central Excise (Appeals)
1997-19982002-2007
1.1
Service tax credit matters
Customs, Excise and Service Tax Appellate Tribunal (CESTAT)
2005-2008 202.3
Central and various States’ Sales Tax Acts
Sales tax
Sales Tax Tribunal 2004-2005, 2006-2009 21.5Commissioner of Sales Tax
(Appeals)2006-2007, 2008-2009,
2011-20121.4
Assistant Commissioner of Sales Tax (Investigations)
2006-2008, 2009-2011 20.7
Additional Commissioner 2002-2003 3.0Deputy Commissioner 2000-2001 0.3
There were no unpaid disputed dues in respect of Wealth Tax, Customs Duty and Cess during the year.
(b) There were no undisputed amounts payable in respect of Provident Fund, Investor Education and Protection Fund, Employees’ State Insurance, Income-tax, Sales Tax, Wealth Tax, Service Tax, Customs Duty, Excise Duty, Cess and other material statutory dues in arrears as at March 31, 2014 for a period of more than six
months from the date they became payable.
(c) Details of dues of Income-tax, Sales Tax, Service Tax and Excise Duty which have not been deposited as on March 31, 2014 on account of disputes are given below:
(x) The Company does not have accumulated losses at the end of the financial year and the Company has not incurred cash losses during the financial year covered by our audit and in the immediately preceding financial year.
(xi) In our opinion and according to the information and explanations given to us, the Company has not defaulted in the repayment of dues to financial institutions and banks. The Company has not issued any debentures.
(xii) In our opinion and according to the information and explanations given to us, the terms and conditions of the guarantees given by the Company for loans taken by others from banks and financial institutions are not, prima facie, prejudicial to the interests of the Company.
(xiii) In our opinion and according to the information and explanations given to us, the term loans have been applied by the Company during the year for the purposes for which they were obtained, other than temporary deployment pending application.
(xiv) In our opinion and according to the information and explanations given to us, and on an overall examination of the Balance Sheet of the Company, we report that funds raised on short-term basis have, prima facie, not been used during the year for long-term investment.
(xv) According to the information and explanations given to us, during the year the Company has not made any preferential allotment of shares to the parties and companies covered in the Register maintained under Section 301 of the Companies Act, 1956.
(xvi) To the best of our knowledge and according to the information and explanations given to us, no fraud by the Company and no material fraud on the Company has been noticed or reported during the year.
For Deloitte Haskins & Sells LLPChartered Accountants
(Firm’s Registration No. 117366W/W-100018)
K. A. KatkiPartner
Place : Mumbai (Membership No.: 038568)Dated : May 7, 2014
Annual Report 2014 | 139

Balance sHeet as at maRcH 31, 2014
As at 31.03.2014 As at 31.03.2013
Note I in million I in million
EQUITY AND LIABILITIESShareholders’ Funds
Share Capital 2 896.8 895.1 Reserves and Surplus 3 68,893.6 47,572.0
69,790.4 48,467.1 Non-Current Liabilities
Long-Term Borrowings 4 242.4 292.0 Deferred Tax Liabilities (net) 5 2,479.3 2,329.2 Other Long-Term Liabilities 6 95.1 114.0 Long-Term Provisions 7 769.2 683.5
3,586.0 3,418.7 Current Liabilities
Short-Term Borrowings 8 1,151.6 5,260.9 Trade Payables 9 9,838.5 8,694.2 Other Current Liabilities 10 1,265.1 2,189.3 Short-Term Provisions 11 2,358.0 2,427.1
14,613.2 18,571.5 TOTAL 87,989.6 70,457.3
ASSETSNon-Current Assets
Fixed Assets 12Tangible Assets 21,709.1 20,006.3 Intangible Assets - Acquired 85.5 130.2 Capital Work-in-Progress 2,670.5 2,401.2
24,465.1 22,537.7 Non-Current Investments 13 9,890.5 6,880.4 Long-Term Loans and Advances 14 3,197.0 3,620.3
37,552.6 33,038.4 Current Assets
Current Investments 15 1,746.1 - Inventories 16 13,722.4 13,308.3 Trade Receivables 17 28,599.2 18,742.7 Cash and Bank Balances 18 1,462.8 201.2 Short-Term Loans and Advances 19 2,594.4 2,840.1 Other Current Assets 20 2,312.1 2,326.6
50,437.0 37,418.9 TOTAL 87,989.6 70,457.3
See accompanying notes forming part of the financial statements
In terms of our report attachedFor Deloitte Haskins & Sells LLP For Lupin LimitedChartered Accountants
K. A. Katki Dr. Desh Bandhu Gupta Dr. Kamal K. Sharma Vinita GuptaPartner Chairman Vice Chairman Chief Executive Officer
Nilesh Gupta M. D. Gupta Dr. Vijay Kelkar Managing Director Executive Director Director
Richard Zahn R. A. Shah Dr. K. U. Mada Director Director Director
Dileep C. Choksi Director
Place : Mumbai R. V. SatamDated : May 7, 2014 Company Secretary
140 | Lupin Limited

statement oF pRoFit and loss FoR tHe yeaR ended maRcH 31, 2014
For the Current Year ended31.03.2014
For the Previous Year ended31.03.2013
Note I in million I in million
INCOME:
Revenue from Operations (Gross) 21 90,198.6 71,844.1
Less : Excise Duty 804.8 619.0
Revenue from Operations (Net) 89,393.8 71,225.1
Other Income 22 4,153.8 233.1
Total Revenue 93,547.6 71,458.2
EXPENSES:
Cost of Raw and Packing Materials Consumed 23 21,320.0 19,272.1
Purchases of Stock-in-Trade 46(A) 8,291.9 7,760.3
Changes in Inventories 24 (762.1) (1,824.4)
of Finished Goods, Work-in-Process and Stock-in-Trade
Employee Benefits Expense 25 8,443.2 7,264.4
Finance Costs 26 209.9 332.8
Depreciation and Amortisation Expense 12 1,676.3 1,501.4
Other Expenses 27 22,977.5 19,913.5
Total Expenses 62,156.7 54,220.1
Profit before Tax 31,390.9 17,238.1
Tax Expense / (Benefit):
- Current Tax Expense 8,117.0 4,181.6
- Tax Expense / (Benefit) for Prior Years (15.9) 30.2
- Add : Reversal of MAT Credit for Prior Years - 157.9
Net Current Tax Expense 8,101.1 4,369.7
- Deferred Tax (net) 47.6 264.1
Profit for the year 23,242.2 12,604.3
Earnings per equity share (in H) 37
Basic 51.88 28.19
Diluted 51.62 28.07
Face Value of Equity Share (in H) 2.00 2.00
See accompanying notes forming part of the financial statements
In terms of our report attachedFor Deloitte Haskins & Sells LLP For Lupin LimitedChartered Accountants
K. A. Katki Dr. Desh Bandhu Gupta Dr. Kamal K. Sharma Vinita GuptaPartner Chairman Vice Chairman Chief Executive Officer
Nilesh Gupta M. D. Gupta Dr. Vijay Kelkar Managing Director Executive Director Director
Richard Zahn R. A. Shah Dr. K. U. Mada Director Director Director
Dileep C. Choksi Director
Place : Mumbai R. V. SatamDated : May 7, 2014 Company Secretary
Annual Report 2014 | 141

casH FloW statement FoR tHe yeaR ended maRcH 31, 2014
For the Current Year ended31.03.2014
For the Previous Year ended31.03.2013
I in million I in million
A. Cash Flow from Operating Activities
Profit before Tax 31,390.9 17,238.1
Adjustments for:
Depreciation and Amortisation Expense 1,676.3 1,501.4
Loss on Sale / Write-off of Fixed Assets (net) 99.6 139.8
Net Gain on sale of Current Investments (5.5) -
Finance Costs 209.9 332.8
Interest on Fixed Deposits with Banks (63.5) (57.7)
Dividend on Current Investments (25.0) -
Dividend on Long-Term Investment from Subsidiary company (3,020.2) -
Dividend on Long-Term Investment from Others (0.2) (0.2)
Provision for Doubtful Trade Receivables / Advances / Deposits 269.4 40.0
Provision for Doubtful Advances Written Back (7.3) -
Expenses on Employees Stock Options / Stock Appreciation Rights 211.0 43.7
Unrealised Exchange loss on revaluation (net) 595.5 72.5
Operating Profit before Working Capital Changes 31,330.9 19,310.4
Changes in working capital:
Adjustments for (increase) / decrease in operating assets:
Inventories (414.1) (2,072.7)
Trade Receivables (10,769.1) (3,908.6)
Short-Term Loans and Advances 261.0 (163.0)
Long-Term Loans and Advances (657.3) (283.8)
Other Current Assets 111.0 (989.4)
Adjustments for increase / (decrease) in operating liabilities:
Trade Payables 1,171.9 1,720.5
Other Current Liabilities 362.7 55.5
Other Long-Term Liabilities (6.2) (13.3)
Short-Term Provisions 6.5 110.0
Long-Term Provisions 85.7 337.4
Cash Generated from Operations 21,483.0 14,103.0
Net Income tax paid (6,201.7) (4,020.6)
Net Cash Flow from Operating Activities 15,281.3 10,082.4
B. Cash Flow from Investing Activities
Capital expenditure on fixed assets, including capital advances (3,941.5) (3,776.7)
Proceeds from sale of fixed assets 22.9 3.5
Purchase of Non-Current investment in subsidiaries (3,010.1) (7.5)
Advance against Investment in subsidiary (14.6) -
Net Gain on sale of Current Investments 5.5 -
Bank balances not considered as Cash and cash equivalents (net) (636.2) 3.6
Dividend on Current Investments 25.0 -
Dividend on Long-Term Investment from Subsidiary company 3,020.2 -
Dividend on Long-Term Investment from Others 0.2 0.2
Interest on Fixed Deposits with Banks 63.5 57.7
Net Cash Used in Investing Activities (4,465.1) (3,719.2)
142 | Lupin Limited

For the Current Year ended31.03.2014
For the Previous Year ended31.03.2013
I in million I in million
C. Cash Flow from Financing Activities
Repayment of Long-Term Borrowings (net) (1,204.7) (1,132.1)
Repayment of Short-Term Borrowings - Loans from banks (net) (4,111.5) (3,341.3)
Proceeds from issue of equity shares (ESOPs) 1.7 1.7
Securities Premium Received (ESOPs) 237.7 126.7
Finance Costs (221.7) (344.5)
Dividend paid (3,127.0) (1,428.9)
Corporate Tax on Dividend (19.2) (232.0)
Net Cash Used in Financing Activities (8,444.7) (6,350.4)
Net increase in Cash and Cash equivalents 2,371.5 12.8
Cash and Cash equivalents as at the beginning of the year 181.6 168.8
Cash and Cash equivalents as at the end of the year 2,553.1 181.6
Reconciliation of Cash and cash equivalents with the Balance Sheet
Cash and Bank Balances as per Balance Sheet (Refer note 18) 1,462.8 201.2
Less : Bank balances not considered as Cash and cash equivalents as defined in AS-3 - Cash Flow Statements (Refer note 18)
655.8 19.6
Add : Current investments considered as part of Cash and cash equivalents (Refer note 15)
1,746.1 -
Cash and cash equivalents as restated as at the year end 2,553.1 181.6
Notes :1. The above Cash Flow Statement has been prepared under the ‘Indirect Method’ as set out in the Accounting Standard 3 (AS-3) “Cash Flow
Statements”.
2. Cash comprises cash on hand and Current Accounts with banks. Cash equivalents are short-term balances (with an original maturity of three months or less from the date of acquisition), highly liquid investments that are readily convertible into known amounts of cash and which are subject to insignificant risk of changes in value.
In terms of our report attachedFor Deloitte Haskins & Sells LLP For Lupin LimitedChartered Accountants
K. A. Katki Dr. Desh Bandhu Gupta Dr. Kamal K. Sharma Vinita GuptaPartner Chairman Vice Chairman Chief Executive Officer
Nilesh Gupta M. D. Gupta Dr. Vijay Kelkar Managing Director Executive Director Director
Richard Zahn R. A. Shah Dr. K. U. Mada Director Director Director
Dileep C. Choksi Director
Place : Mumbai R. V. SatamDated : May 7, 2014 Company Secretary
Annual Report 2014 | 143
notes FoRminG paRt oF tHe Financial statements
1A. OVERVIEW: Lupin Limited, (‘the Company’) was incorporated in 1983 as Lupin Chemicals Private Limited. Lupin Laboratories Limited which
was incorporated in 1972 was amalgamated with the Company w.e.f. 01.04.2000, pursuant to an Order passed by the Mumbai High Court. The Company is an innovation led Transnational Pharmaceutical Company producing, developing and marketing a wide range of branded and generic formulations and APIs. The Company along with its subsidiaries has manufacturing locations spread across India and Japan with trading and other incidental & related activities extending to the world markets.
1B. SIGNIFICANT ACCOUNTING POLICIES: a) Basis of accounting and preparation of Financial Statements: The financial statements of the Company have been prepared in accordance with the Generally Accepted Accounting
Principles in India (Indian GAAP) to comply with the Accounting Standards notified under Section 211(3C) of the Companies Act, 1956 (“the 1956 Act”) (which continue to be applicable in respect of Section 133 of the Companies Act, 2013 (“the 2013 Act”) in terms of General Circular 15/2013 dated September 13, 2013 of the Ministry of Corporate Affairs) and the relevant provisions of the 1956 Act / 2013 Act, as applicable. The financial statements have been prepared on accrual basis under the historical cost convention. The accounting policies adopted in the preparation of the financial statements are consistent with those followed in the previous year.
b) Use of Estimates: The preparation of the financial statements in conformity with Indian GAAP requires the Management to make estimates
and assumptions considered in the reported amounts of assets and liabilities (including contingent liabilities) and the reported income and expenses during the year. Future results could differ due to these estimates and the differences between the actual results and the estimates are recognised in the periods in which the results are known / materialise.
c) Tangible Fixed Assets: Fixed Assets are carried at cost less accumulated depreciation and impairment losses, if any. The cost of fixed assets includes
interest on borrowings attributable to acquisition of qualifying fixed assets up to the date the asset is ready for its intended use and other incidental expenses incurred up to that date. The Company has adopted the provisions of paragraph 46A of AS-11 “The Effects of Changes in Foreign Exchange Rates”, accordingly, exchange differences arising on restatement / settlement of long-term foreign currency borrowings relating to acquisition of depreciable fixed assets are adjusted to the cost of the respective assets and depreciated over the remaining useful life of such assets. Subsequent expenditure relating to fixed assets is capitalised only if such expenditure results in an increase in the future benefits from such asset beyond its previously assessed standard of performance.
Capital work-in-progress in respect of assets which are not ready for their intended use are carried at cost, comprising of direct costs, related incidental expenses and attributable interest.
d) Intangible Assets: Intangible assets are carried at cost less accumulated amortisation and impairment losses, if any. The cost of an intangible
asset comprises its purchase price, including any import duties and other taxes (other than those subsequently recoverable from the taxing authorities), and any directly attributable expenditure on making the asset ready for its intended use.
Expenditure on Research and development eligible for capitalisation are carried as Intangible assets under development where such assets are not yet ready for their intended use.
e) Foreign Currency Transactions / Translations: i) Transactions denominated in foreign currency are recorded at exchange rates prevailing at the date of transaction or
at rates that closely approximate the rate at the date of the transaction.
ii) Foreign currency monetary items (other than derivative contracts) of the Company, outstanding at the balance sheet date are restated at the year-end rates. Non-monetary items of the Company are carried at historical cost.
iii) Exchange differences arising on settlement / restatement of short-term foreign currency monetary assets and liabilities of the Company and its integral foreign operations are recognised as income or expense in the Statement of Profit and Loss.
The exchange differences arising on restatement / settlement of long-term foreign currency monetary items are capitalised as part of the depreciable fixed assets to which the monetary item relates and depreciated over the remaining useful life of such assets or amortised on settlement over the maturity period of such items if such items do not relate to acquisition of depreciable fixed assets. The unamortised exchange difference is carried under Reserves
144 | Lupin Limited

and Surplus as “Foreign currency monetary item translation difference account” net of the tax effect thereon, where applicable.
iv) Premium / discount on forward exchange contracts, which are not intended for trading or speculation purposes, are amortised over the period of the contracts if such contracts relate to monetary items as at the Balance Sheet date.
v) In respect of the foreign offices / branches, which are integral foreign operations, all revenues and expenses during the year are reported at average rates. Outstanding balances in respect of monetary assets and liabilities are restated at the year end exchange rates. Outstanding balances in respect of non-monetary assets and liabilities are stated at the rates prevailing on the date of the transaction. Net gain / loss on foreign currency translation is recognised in the Statement of Profit and Loss.
f) Hedge Accounting: The Company uses foreign currency forward contracts and currency options to hedge its risks associated with foreign
currency fluctuations relating to highly probable forecast transactions. The Company designates such forward / option contracts in a cash flow hedging relationship by applying the hedge accounting principles set out in Accounting Standard 30 (AS-30) “Financial Instruments: Recognition and Measurement”. These forward / option contracts are stated at fair value at each reporting date. Changes in the fair value of these forward / option contracts that are designated and effective as hedges of future cash flows are recognised directly in “Cash Flow Hedge Reserve Account” under Reserves and Surplus, net of applicable deferred income taxes and the ineffective portion is recognised immediately in the Statement of Profit and Loss. Amounts accumulated in the “Cash Flow Hedge Reserve Account” are reclassified to the Statement of Profit and Loss in the same period during which the forecasted transaction affects profit and loss. Hedge accounting is discontinued when the hedging instrument expires or is sold, terminated, or exercised, or no longer qualifies for hedge accounting. For forecasted transactions, any cumulative gain or loss on the hedging instrument recognised in “Cash Flow Hedge Reserve Account” is retained until the forecasted transaction occurs. If the forecasted transaction is no longer expected to occur, the net cumulative gain or loss recognised in “Cash Flow Hedge Reserve Account” is immediately transferred to the Statement of Profit and Loss.
g) Derivative Contracts: The Company enters into derivative contracts in the nature of currency options and forward contracts with an intention to
hedge its existing assets and liabilities and highly probable forecast transactions in foreign currency. Derivative contracts which are closely linked to the existing assets and liabilities are accounted as per the policy stated for Foreign Currency Transactions / Translations.
Derivative contracts designated as a hedging instrument for highly probable forecast transactions are accounted as per the policy stated for Hedge Accounting.
All other derivative contracts are marked-to-market on a portfolio basis and losses, if any, are recognised in the Statement of Profit and Loss. Gains arising on the same are not recognised, until realised, on grounds of prudence.
h) Investments: Long-Term investments are carried individually at cost, less provision for diminution, other than temporary, in the value
of such investments. Cost of investments includes expenses directly incurred on acquisition of investments. Current investments are carried individually at lower of cost and fair value.
i) Inventories: Inventories of all procured materials and Stock-in-Trade are valued at the lower of cost (on moving weighted average
basis) and the net realisable value after providing for obsolescence and other losses, where considered necessary. Cost includes all charges in bringing the goods to their present location and condition, including octroi and other levies, transit insurance and receiving charges. Work-in-process and finished goods include appropriate proportion of overheads and, where applicable, excise duty.
j) Revenue recognition: Revenue from sale of goods is recognised net of returns, product expiry claims and trade discounts, on transfer of significant
risks and rewards in respect of ownership to the buyer. Sales include excise duty but exclude sales tax and value added tax. Sales are also netted off for probable non-saleable return of goods from the customers, estimated on the basis of historical data of such returns.
Annual Report 2014 | 145

Income from Research Services including sale of technology / know-how (rights, licenses, dossiers and other intangibles) is recognised in accordance with the terms of the contract with customers when the related performance obligation is completed, or when risks and rewards of ownership are transferred, as applicable.
Revenue is recognised when it is reasonable to expect that the ultimate collection will be made.
Interest income is accounted on accrual basis. Dividend from investment is recognised as revenue when right to receive is established.
k) Depreciation and Amortisation: Depreciation on fixed assets is provided on straight line basis in the manner and at the rates prescribed in Schedule XIV to
the Companies Act, 1956, except in respect of the following category of assets, in whose case life of assets is assessed as under:
Assets Estimated Useful LifeCaptive Power Plant at Tarapur 15 yearsCertain assets provided to employees 3 yearsLeasehold Land Over the period of leaseIntangible Assets (Computer Software) 3 to 6 yearsIntangible Assets (Goodwill - Acquired) 5 yearsIntangible Assets (Trademark and Licences) 5 years
The estimated useful lives of intangible assets and the amortisation period are reviewed at the end of each financial year and the amortisation method is revised to reflect the changed pattern. Assets costing H 5000/- or less are depreciated at 100% rate on prorata basis in the year of purchase.
l) Employee Benefits: Employee benefits include provident fund, gratuity fund, compensated absences and post employment and other long-
term benefits. a) Post Employment Benefits and Other Long-Term Benefits:
i) Defined Contribution Plan: The Company’s contribution towards provident fund and superannuation fund for certain eligible employees are
considered to be defined contribution plans as the Company does not carry any further obligations, apart from the contributions made on a monthly basis. Such contributions are charged as an expense to the Statement of Profit and Loss when services are rendered by the employees.
ii) Defined Benefit and Other Long-Term Benefit Plans: Company’s liabilities towards defined benefit plans and other long-term benefits viz. gratuity and compensated
absences not expected to occur within twelve months, after the end of the period in which employee renders service, are determined using the Projected Unit Credit Method. Actuarial valuations under the Projected Unit Credit Method are carried out at the Balance Sheet date. Actuarial gains and losses are recognised in the Statement of Profit and Loss in the period of occurrence of such gains and losses. Past service cost is recognised immediately to the extent benefits are vested, otherwise it is amortised on straight-line basis over the remaining average period until the benefits become vested.
The retirement benefit obligation recognised in the balance sheet represents the present value of the defined benefit obligation as adjusted for unrecognised past service cost, and as reduced by the fair value of plan assets. Any asset resulting from this calculation is limited to past service cost, plus the present value of available refunds and reductions in future contributions to the scheme.
Provident Fund for certain employees is administered through the “Lupin Limited Employees Provident Fund Trust”. Periodic contributions to the Fund are charged to the Statement of Profit and Loss. The Company has an obligation to make good the shortfall, if any, between the return from the investment of the trust and interest rate notified by the Government.
b) Short-Term Employee Benefits: Short-Term employee benefits expected to be paid in exchange for the services rendered by employees are recognised
at their undiscounted amounts during the period employee renders services. Short-Term compensated absences are provided for based on estimates in accordance with Company rules.
146 | Lupin Limited

m) Taxes on Income: Income taxes are accounted for in accordance with Accounting Standard 22 (AS-22) “Accounting for Taxes on Income”.
Tax expense comprises both Current Tax and Deferred Tax. Current tax is the amount of tax payable on taxable income for the year as determined in accordance with the provisions of the Income-tax Act, 1961.
Minimum Alternate Tax (MAT) paid in accordance with the tax laws, which gives future economic benefits in the form of adjustment to future income tax liability, is considered as an asset if there is convincing evidence that the Company will pay normal income tax. Accordingly, MAT is recognised as an asset in the Balance Sheet when it is highly probable that future economic benefit associated with it will flow to the Company.
Deferred tax is recognised on timing differences, being the differences between the taxable income and the accounting income that originate in one period and are capable of reversal in one or more subsequent periods. Deferred tax is measured using the tax rates and the tax laws enacted or substantively enacted as at the reporting date. Deferred tax liabilities are recognised for all timing differences. Deferred tax assets in respect of unabsorbed depreciation and carry forward of losses are recognised only if there is virtual certainty that there will be sufficient future taxable income available to realise such assets. Deferred tax assets are recognised for timing differences of other items only to the extent that reasonable certainty exists that sufficient future taxable income will be available against which these can be realised. Deferred tax assets and liabilities are offset if such items relate to taxes on income levied by the same governing tax laws and the Company has a legally enforceable right for such set off. Deferred tax assets are reviewed at each Balance Sheet date for their realisability.
n) Operating Leases: Assets taken on lease under which all risks and rewards of ownership are effectively retained by the lessor are classified as
operating lease. Lease payments under operating leases are recognised in the Statement of Profit and Loss on a straight line basis in accordance with the respective lease agreements.
o) Provisions, Contingent Liabilities and Contingent Assets: A provision is recognised when the Company has a present obligation as a result of past events and it is probable that an
outflow of resources will be required to settle the obligation in respect of which a reliable estimate can be made. Provisions (excluding retirement benefits) are not discounted to their present value and are determined based on the best estimate required to settle the obligation at the Balance Sheet date. These are reviewed at each Balance Sheet date and adjusted to reflect the current best estimates. Contingent liabilities are disclosed in the Notes. Contingent liabilities are disclosed for (1) possible obligations which will be confirmed only by future events not wholly within the control of the Company or (2) present obligations arising from past events where it is not probable that an outflow of resources will be required to settle the obligation or a reliable estimate of the amount of the obligation cannot be made. Contingent assets are not recognised in the financial statements.
p) Borrowing Costs: Borrowing costs include interest, amortisation of ancillary costs incurred and exchange differences arising from foreign
currency borrowings to the extent they are regarded as an adjustment to the interest cost. Costs in connection with the borrowing of funds to the extent not directly related to the acquisition of qualifying assets are charged to the Statement of Profit and Loss over the tenure of the loan. Borrowing costs, allocated to and utilised for qualifying assets, pertaining to the period from commencement of activities relating to construction / development of the qualifying asset upto the date of capitalisation of such asset is added to the cost of the assets. Capitalisation of borrowing costs is suspended and charged to the Statement of Profit and Loss during extended periods when active development activity on the qualifying assets is interrupted.
q) Stock based Compensation: i) Employees Stock Option Plans (“ESOPs”): The compensation cost of stock options granted to employees is measured by the intrinsic value method, i.e. the
difference between the market price of the Company’s shares on the date of the grant of options and the exercise price to be paid by the option holders. The compensation cost, if any, is amortised uniformly over the vesting period of the options.
ii) Stock Appreciation Rights (“SARs”): The compensation cost of SARs granted to employees is measured by the intrinsic value method, i.e. the excess of
the market price of the Company’s shares as at the period end and the acquisition price as on the date of grant. The compensation cost is amortised uniformly over the vesting period of the SARs.
r) Government Grants, subsidies and export incentives: Government grants and subsidies are accounted when there is reasonable assurance that the Company will comply with the
conditions attached to them and it is reasonably certain that the ultimate collection will be made. Capital grants relating
Annual Report 2014 | 147

to specific fixed assets are reduced from the gross value of the respective fixed assets. Revenue grants are recognised in the Statement of Profit and Loss.
Export benefits available under prevalent schemes are accrued in the year in which the goods are exported and there is no uncertainty in receiving the same.
s) Research and Development: Revenue expenditure pertaining to research is charged to the Statement of Profit and Loss. Development costs of products
are also charged to the Statement of Profit and Loss in the year it is incurred, unless a product’s technological feasibility has been established, in which case such expenditure is capitalised. These costs are charged to the respective heads in the Statement of Profit and Loss in the year it is incurred. The amount capitalised comprises of expenditure that can be directly attributed or allocated on a reasonable and consistent basis for creating, producing and making the asset ready for its intended use. Fixed assets utilised for research and development are capitalised and depreciated in accordance with the policies stated for Tangible Fixed Assets and Intangible Assets.
t) Impairment of Assets: The carrying values of assets / cash generating units at each Balance Sheet date, are reviewed for impairment. If any
indication of impairment exists, the recoverable amount of such assets is estimated and impairment is recognised, if the carrying amount of these assets exceeds their recoverable amount. The recoverable amount is the greater of the net selling price and their value in use. Value in use is arrived at by discounting the future cash flows to their present value based on an appropriate discount factor. When there is indication that an impairment loss recognised for an asset in earlier accounting periods no longer exists or may have decreased, such reversal of impairment loss is recognised in the Statement of Profit and Loss, except in case of revalued assets.
u) Earnings per share: Basic earnings per share is computed by dividing the profit / (loss) after tax (including the post tax effect of extraordinary
items, if any) by the weighted average number of equity shares outstanding during the year. Diluted earnings per share is computed by dividing the profit / (loss) after tax (including the post tax effect of extraordinary items, if any) by the weighted average number of equity shares outstanding during the year adjusted for the effects of all dilutive potential equity shares.
v) Insurance claims: Insurance claims are accounted for on the basis of claims admitted / expected to be admitted and to the extent that the
amount recoverable can be measured reliably and it is reasonable to expect the ultimate collection.
w) Service tax input credit: Service tax input credit is accounted for in the books in the period in which the underlying service received is accounted
and when there is reasonable certainty in availing / utilising the credits.
148 | Lupin Limited

2. SHARE CAPITAL a) Share Capital
As at 31 March 2014 As at 31 March 2013 No. of Shares H in million No. of Shares H in million
AuthorisedEquity Shares of H 2 each 500,000,000 1,000.0 500,000,000 1,000.0 Issued, Subscribed and Paid upEquity Shares of H 2 each fully paid 448,375,804 896.8 447,529,493 895.1
Total 448,375,804 896.8 447,529,493 895.1
b) Reconciliation of the number of shares and amount outstanding at the beginning and at the end of the reporting period
Particulars As at 31 March 2014 As at 31 March 2013 No. of Shares H in million No. of Shares H in million
Equity Shares outstanding at the beginning of the year 447,529,493 895.1 446,641,681 893.3 Equity Shares issued during the year in the form of ESOPs 846,311 1.7 887,812 1.8 Equity Shares outstanding at the end of the year 448,375,804 896.8 447,529,493 895.1
c) Rights attached to Equity Shares The Company has only one class of equity shares with voting rights having a par value of H 2 per share. The Company declares
and pays dividends in Indian Rupees. The dividend proposed by the Board of Directors is subject to the approval of the shareholders at the ensuing Annual General Meeting, except in case of interim dividend.
During the year ended 31 March 2014, the Company declared an interim dividend of H 3 per equity share. A final dividend of H 3 per equity share has been recommended by the Board of Directors at its meeting held on 7 May 2014. On approval by the shareholders of the final dividend of H 3 per equity share, the total dividend for the year would be H 6 (previous year H 4) per equity share.
In the event of liquidation of the Company, the shareholders of equity shares will be entitled to receive remaining assets of the Company after distribution of all preferential amounts. The distribution will be in proportion to the number of equity shares held by the shareholders.
d) Details of shares held by each shareholder holding more than 5% equity shares
Name of Shareholder As at 31 March 2014 As at 31 March 2013 No. of Shares % of Holding No. of Shares % of Holding
Zyma Laboratories Limited 54,960,490 12.26 54,960,490 12.28Rahas Investments Pvt. Limited 45,699,510 10.19 45,699,510 10.21Visiomed Investments Pvt. Limited[formerly Visiomed (India) Pvt. Limited]
43,514,660 9.70 43,514,660 9.72
Lupin Holdings Pvt. Limited[formerly Lupin Marketing Pvt. Limited]
40,401,000 9.01 40,401,000 9.03
e) Shares reserved for issuance under Stock Option Plans of the Company
Particulars As at 31 March 2014
As at 31 March 2013
No. of Shares No. of SharesLupin Employees Stock Option Plan 2003 687,134 961,360 Lupin Employees Stock Option Plan 2005 532,479 784,995 Lupin Employees Stock Option Plan 2011 3,297,482 3,546,178 Lupin Subsidiary Companies Employees Stock Option Plan 2005 371,103 437,089 Lupin Subsidiary Companies Employees Stock Option Plan 2011 895,113 900,000
f) Aggregate number of shares issued during last five years pursuant to Stock Option Plans of the Company
Particulars As at 31 March 2014
As at 31 March 2013
Aggregate No. of Shares
Aggregate No. of Shares
Equity Shares :Issued under various Stock Option plans of the Company 5,194,344 5,185,963
g) No shares have been allotted without payment being received in cash or by way of bonus shares during the period of five years immediately preceding the Balance Sheet date.
Annual Report 2014 | 149

3. RESERVES AND SURPLUSAs at
31.03.2014As at
31.03.2013I in million H in million
Capital Reserve- Investment Subsidies from Central Government
Opening and Closing Balance as per last Balance Sheet 1.0 1.0 - Investment Subsidies from State Government
Opening and Closing Balance as per last Balance Sheet 8.2 8.2 - On restructuring of capital of the Company under the Scheme of Amalgamation
Opening and Closing Balance as per last Balance Sheet 254.7 254.7 263.9 263.9
Capital Redemption ReserveOpening and Closing Balance as per last Balance Sheet 126.5 126.5
126.5 126.5 Securities Premium Account
Opening Balance as per last Balance Sheet 5,378.2 5,248.7 Add : Additions during the year* 255.2 129.5 Balance as at the year end 5,633.4 5,378.2
Employee Stock Options Outstanding (Refer note 38)- Employees Stock Options Outstanding
Opening Balance as per last Balance Sheet 43.2 31.5 Add : Options granted during the year 22.0 14.6 Less : Exercised during the year 17.5 2.9 Balance as at the year end (A) 47.7 43.2
- Deferred Employees Stock Options CostOpening Balance as per last Balance Sheet 8.7 7.0 Add : Options granted during the year 22.0 14.6 Less : Amortisation during the year 19.4 12.9 Balance as at the year end (B) 11.3 8.7
(A-B) 36.4 34.5 Employee Stock Appreciation Rights Outstanding (Refer note 39)
Opening Balance as per last Balance Sheet 34.3 3.5 Add : Additions during the year 191.6 30.8 Balance as at the year end 225.9 34.3
General ReserveOpening Balance as per last Balance Sheet 13,015.4 11,515.4 Add : Transferred from Surplus in the Statement of Profit and Loss 2,500.0 1,500.0 Balance as at the year end 15,515.4 13,015.4
Amalgamation ReserveOpening and Closing Balance as per last Balance Sheet 317.9 317.9
317.9 317.9 Cash Flow Hedge Reserve (Refer note 42)
Opening Balance as per last Balance Sheet (137.9) (579.8) Add : Effect of foreign exchange rate variations on hedging instruments outstanding
[net of deferred tax of H 102.5 million (previous year H 160.1 million)]302.3 430.1
(Less) / Add : Transferred to the Statement of Profit and Loss (36.8) 11.8 Balance as at the year end 127.6 (137.9)
Surplus in the Statement of Profit and LossOpening Balance as per last Balance Sheet 28,539.2 19,530.2 Add : Profit for the year 23,242.2 12,604.3 Less : Transfer to General Reserve 2,500.0 1,500.0 Less : Interim Dividend paid on Equity Shares [Refer note 2(c)] 1,345.0 - Less : Proposed Final Dividend on Equity Shares [Refer note 2(c)] 1,345.1 1,790.1 Less : Dividend for previous year on Equity Shares issued after year end pursuant to ESOPs allotment 1.1 0.9 Add : Reversal of Corporate Tax on Final Dividend for previous year (in terms of Section 115-O / 115BBD of the Income-tax Act, 1961)
(304.2) -
Less : Corporate Tax on Dividend ** 247.8 304.3 Balance as at the year end 46,646.6 28,539.2
Total 68,893.6 47,572.0
* Represents amount received on allotment of 846,311 (previous year 887,812) Equity Shares of H 2 each, pursuant to “Lupin Employees Stock Option Plans”. [Refer note 38 (a)]
** Represents Corporate Tax on Proposed Final Dividend H 228.6 million (previous year H 304.2 million), on Interim Dividend H 19.2 million (previous year H nil) and on dividend paid for previous year on Equity Shares issued after year end pursuant to ESOPs allotment H nil (previous
year H 0.1 million).
150 | Lupin Limited

4. LONG-TERM BORROWINGS
As at 31.03.2014
As at 31.03.2013
I in million H in million(Refer note 10)Term Loans - from other parties
Unsecured Deferred Sales Tax Loan from Government of Maharashtra 46.2 54.6 Term Loans from Council for Scientific and Industrial Research (CSIR) 154.7 185.6 Term Loans from Department of Science and Technology (DST) 41.5 51.8
Total 242.4 292.0
a) Deferred Sales Tax Loan is interest free and payable in 5 equal annual installments after expiry of initial 10 years moratorium period from each such year of deferral period from 1998-99 to 2009-10.
b) Term Loans from CSIR carry interest of 3% p.a. and is payable in 6 annual installments of H 30.9 million each alongwith interest.c) Term Loans from DST carry interest of 3% p.a. and is payable in 5 annual installments of H 10.4 million each alongwith interest.d) The Company has not defaulted on repayment of loans and interest during the year.
5. DEFERRED TAX LIABILITIES (NET)
As at 31.03.2014
As at 31.03.2013
I in million H in millionTax effect of items constituting Deferred Tax Liabilities
On differences between book and tax depreciation 3,022.2 2,821.7 Cash Flow Hedge Reserve 48.6 -
3,070.8 2,821.7 Less : Tax effect of items constituting Deferred Tax Assets
Provision for Doubtful Trade Receivables / Advances 127.2 38.1 VRS Compensation 47.9 53.2 Provision for Employee Benefits 276.2 231.1 Cash Flow Hedge Reserve - 53.9 Others 140.2 116.2
591.5 492.5 Total 2,479.3 2,329.2
6. OTHER LONG-TERM LIABILITIES
Trade Payables (Refer note 44) 95.1 101.3 Mark to Market Derivative Liabilities - 2.8 Interest Accrued but not due on Borrowings - 9.9
Total 95.1 114.0
7. LONG-TERM PROVISIONS
Provisions for Employee BenefitsGratuity [Refer note 40 (ii) (A)] 431.8 360.3 Compensated Absences 328.4 303.3 Provident Fund [Refer note 40 (ii) (B)] 9.0 19.9
Total 769.2 683.5
Annual Report 2014 | 151

8. SHORT-TERM BORROWINGS
As at 31.03.2014
As at 31.03.2013
I in million H in millionSecured
Loans from Banks 500.0 4,113.0 500.0 4,113.0
Unsecured Loans from Banks 651.6 1,147.9
651.6 1,147.9 Total 1,151.6 5,260.9
a) Secured loans comprise of Cash Credit, Short-Term Loans, Packing Credit, Post Shipment Credit, Bills Discounted and Overseas Import Credit and are secured by hypothecation of inventories and trade receivables, and all other moveable assets, including current assets at godowns, depots, in course of transit or on high seas and a second charge on immovable properties and moveable assets of the Company both present and future. It includes foreign currency loans of H nil (previous year H 3,532.3 million).
b) Unsecured loans comprise of Short-Term Loans, Packing Credit, Post Shipment Credit, Bills Discounted and Overseas Import Credit. It includes foreign currency loans of H 608.1 million (previous year H 1,085.7 million).
c) Foreign Currency loans carry interest rate in the range of 0.28% to 0.54% p.a. and those in Indian Rupees carries interest rate in the range of 10.00% to 12.75% p.a.
d) The Company has not defaulted on repayment of loans and interest during the year.
9. TRADE PAYABLES
As at 31.03.2014
As at 31.03.2013
I in million H in millionAcceptances 909.2 981.0 Other than Acceptances (Refer note 44) 8,929.3 7,713.2
Total 9,838.5 8,694.2
152 | Lupin Limited

10. OTHER CURRENT LIABILITIES
As at 31.03.2014
As at 31.03.2013
I in million H in millionCurrent Maturities of Long-Term Borrowings (Refer note 4)
- Foreign Currency Term Loans from Banks - 1,085.7 - Deferred Sales Tax Loan from Government of Maharashtra 9.4 6.9 - Term Loans from CSIR 30.9 30.9 - Term Loans from DST 10.4 10.4
Interest Accrued but not due on Borrowings 12.0 13.8 Unpaid Dividend* 25.7 16.5 Unpaid Matured Deposits* - 0.1 Unpaid Interest Warrants* - 0.1 Mark to Market Derivative Liabilities 86.6 392.1 Payables on Purchase of Fixed Assets (Refer note 44) 317.2 230.5 Advances from customers 387.8 81.7 Other Payables 385.1 320.6 (Includes Statutory liabilities, Deposits received, etc.)
Total 1,265.1 2,189.3
* There are no amounts due and outstanding to be credited to Investor Education and Protection Fund.
11. SHORT-TERM PROVISIONS
As at 31.03.2014
As at 31.03.2013
I in million H in millionProvisions for Employee Benefits (Refer note 7)
Gratuity [Refer note 40 (ii) (A)] 71.5 125.5 Compensated Absences 165.3 129.3
Other ProvisionsFor Sales Returns (Refer note 45) 102.5 78.0 For Taxation (net of Advance Tax) 445.0 - For Proposed Dividend on Equity Shares 1,345.1 1,790.1 For Corporate Tax on Dividend 228.6 304.2
Total 2,358.0 2,427.1
Annual Report 2014 | 153
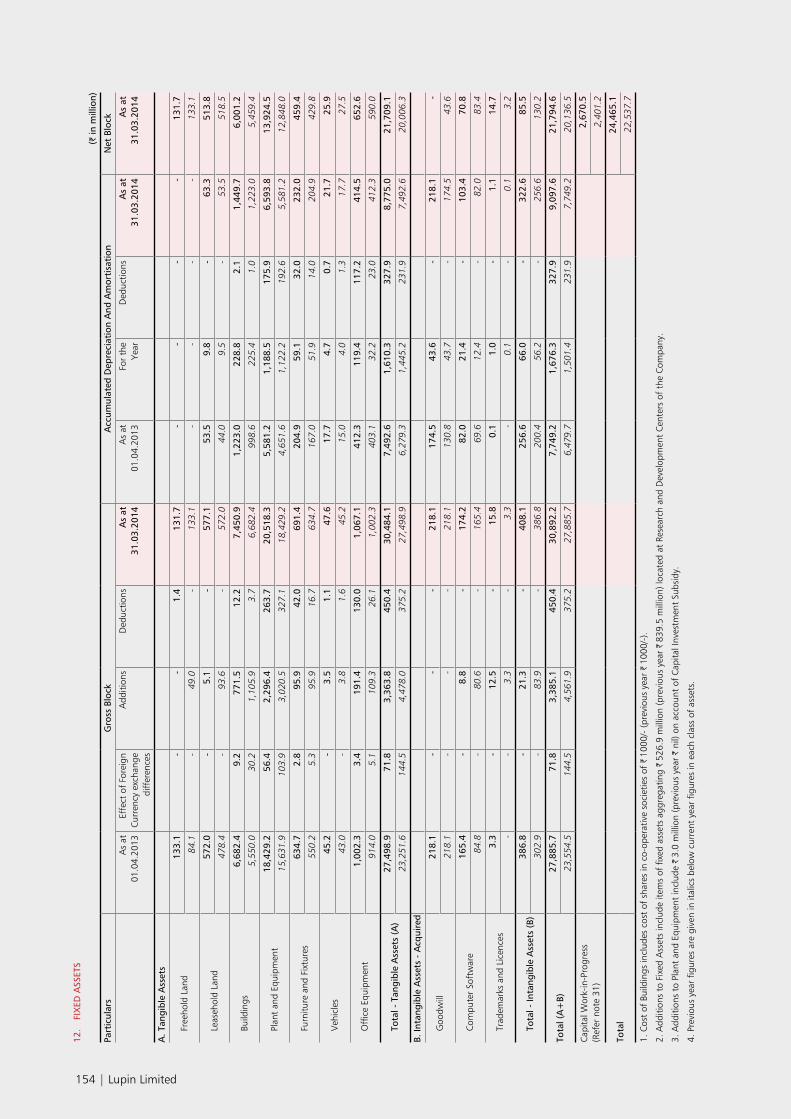
12.
FIX
ED A
SSET
S
(I in
mill
ion)
Part
icul
ars
Gro
ss B
lock
Acc
umul
ated
Dep
reci
atio
n A
nd A
mor
tisa
tion
N
et B
lock
As
at01
.04.
2013
Effe
ct o
f Fo
reig
nCu
rren
cy e
xcha
nge
diff
eren
ces
Add
ition
sD
educ
tions
As
at31
.03.
2014
As
at01
.04.
2013
For
the
Year
Ded
uctio
nsA
s at
31.0
3.20
14A
s at
31.0
3.20
14
A. T
angi
ble
Ass
ets
Free
hold
Lan
d 1
33.1
-
-
1
.4
131
.7
-
-
-
-
131
.7
84.1
-
4
9.0
-
133
.1
-
-
-
-
133
.1
Leas
ehol
d La
nd 5
72.0
-
5
.1
-
577
.1
53.
5 9
.8
-
63.
3 5
13.8
478.
4 -
93
.6
-
572
.0
44.0
9.
5 -
5
3.5
518
.5
Build
ings
6,6
82.4
9
.2
771
.5
12.
2 7
,450
.9
1,2
23.0
2
28.8
2
.1
1,4
49.7
6
,001
.2
5,55
0.0
30.2
1,
105.
9 3.
7 6
,682
.4
998.
6 22
5.4
1.0
1,2
23.0
5
,459
.4
Plan
t an
d Eq
uipm
ent
18,
429.
2 5
6.4
2,2
96.4
2
63.7
2
0,51
8.3
5,5
81.2
1
,188
.5
175
.9
6,5
93.8
1
3,92
4.5
15,6
31.9
10
3.9
3,02
0.5
327.
1 1
8,42
9.2
4,65
1.6
1,12
2.2
192.
6 5
,581
.2
12,
848.
0
Furn
iture
and
Fix
ture
s 6
34.7
2
.8
95.
9 4
2.0
691.
4 2
04.9
5
9.1
32.
0 2
32.0
4
59.4
550.
2 5.
3 95
.9
16.7
6
34.7
16
7.0
51.9
14
.0
204
.9
429
.8
Veh
icle
s 4
5.2
-
3.5
1
.1
47.
6 1
7.7
4.7
0
.7
21.
7 2
5.9
43.0
-
3.
8 1.
6 4
5.2
15.0
4.
0 1.
3 1
7.7
27.
5
Off
ice
Equi
pmen
t 1
,002
.3
3.4
1
91.4
1
30.0
1
,067
.1
412
.3
119
.4
117
.2
414
.5
652
.6
914.
0 5.
1 10
9.3
26.1
1
,002
.3
403.
1 32
.2
23.0
4
12.3
5
90.0
Tota
l - T
angi
ble
Ass
ets
(A)
27,
498.
9 7
1.8
3,3
63.8
4
50.4
3
0,48
4.1
7,4
92.6
1
,610
.3
327
.9
8,7
75.0
2
1,70
9.1
23,
251.
6 1
44.5
4
,478
.0
375
.2
27,
498.
9 6,
279.
3 1,
445.
2 23
1.9
7,49
2.6
20,
006.
3
B. In
tang
ible
Ass
ets
- A
cqui
red
Goo
dwill
218
.1
-
-
-
218
.1
174
.5
43.
6 -
2
18.1
-
218.
1 -
-
-
2
18.1
13
0.8
43.7
-
1
74.5
4
3.6
Com
pute
r So
ftw
are
165
.4
-
8.8
-
1
74.2
8
2.0
21.
4 -
1
03.4
7
0.8
84.8
-
8
0.6
-
165
.4
69.6
12
.4
-
82.
0 8
3.4
Trad
emar
ks a
nd L
icen
ces
3.3
-
1
2.5
-
15.
8 0
.1
1.0
-
1
.1
14.
7
-
-
3.3
-
3
.3
-
0.1
-
0
.1
3.2
Tota
l - In
tang
ible
Ass
ets
(B)
386
.8
-
21.
3 -
4
08.1
2
56.6
6
6.0
-
322
.6
85.
5
302
.9
-
83.
9 -
3
86.8
2
00.4
5
6.2
-
256
.6
130
.2
Tota
l (A
+B)
27,
885.
7 7
1.8
3,3
85.1
4
50.4
3
0,89
2.2
7,7
49.2
1
,676
.3
327
.9
9,0
97.6
2
1,79
4.6
23,
554.
5 1
44.5
4
,561
.9
375
.2
27,
885.
7 6
,479
.7
1,5
01.4
2
31.9
7
,749
.2
20,
136.
5
Capi
tal W
ork-
in-P
rogr
ess
(Ref
er n
ote
31)
2,6
70.5
2,4
01.2
Tota
l 2
4,46
5.1
22,
537.
7
1. C
ost
of B
uild
ings
incl
udes
cos
t of
sha
res
in c
o-op
erat
ive
soci
etie
s of
H 1
000/
- (p
revi
ous
year
H 1
000/
-).
2. A
dditi
ons
to F
ixed
Ass
ets
incl
ude
item
s of
fix
ed a
sset
s ag
greg
atin
g H
526
.9 m
illio
n (p
revi
ous
year
H 8
39.5
mill
ion)
loca
ted
at R
esea
rch
and
Dev
elop
men
t Ce
nter
s of
the
Com
pany
.
3. A
dditi
ons
to P
lant
and
Equ
ipm
ent
incl
ude
H 3
.0 m
illio
n (p
revi
ous
year
H n
il) o
n ac
coun
t of
Cap
ital I
nves
tmen
t Su
bsid
y.
4. P
revi
ous
year
fig
ures
are
giv
en in
ital
ics
belo
w c
urre
nt y
ear
figur
es in
eac
h cl
ass
of a
sset
s.
154 | Lupin Limited

13. NON-CURRENT INVESTMENTS
As at 31.03.2014
As at 31.03.2013
I in million H in millionTrade Investments - Unquoteda) In Subsidiary Companies
In Equity Instruments: Number Face Value- Lupin Holdings B.V., Netherlands 105,829 Euro 6,720.3 6,720.3
(105,829) 1000- Lupin Pharmaceuticals, Inc., USA [Refer note 30 (c)] 300,000 USD 13.8 13.8
(300,000) 1- Lupin Australia Pty Ltd., Australia 800,000 AUD 33.3 16.9
(500,000) 1- Lupin Healthcare Ltd., India 2,616,677 H 81.7 81.7 (Including 6 shares held by nominees) (2,616,677) 10- Lupin Europe Ltd., UK 251,000 GBP 20.0 20.0
(251,000) 1- Lupin Middle East FZ-LLC, UAE 500 AED 7.5 7.5
(500) 1000- Lupin Atlantis Holdings SA, Switzerland [Refer note 30 (a)] 2,486 CHF 2,993.7 -
(-) 1000 9,870.3 6,860.2
b) OthersIn Equity Instruments:- Biotech Consortium India Ltd., India 50,000 H 0.5 0.5
(50,000) 10- Enviro Infrastructure Co. Ltd., India 100,000 H 1.0 1.0
(100,000) 10- Bharuch Enviro Infrastructure Ltd., India 4,585 H
[31.03.2014 - H 45,850/- (previous year H 45,850/-)] (4,585) 10- Narmada Clean Tech Ltd., India 1,145,190 H 11.5 11.5
(1,145,190) 10- Tarapur Environment Protection Society, India 72,358 H 7.2 7.2
(72,358) 100 (Figures in brackets are for previous year)
20.2 20.2 c) In Government Securities
National Saving Certificates[31.03.2014 H 6,000/- (previous year H 6,000/-)]Deposited with Government Authority[31.03.2014 H 6,000/- (previous year H 6,000/-)]
Total 9,890.5 6,880.4 1) All investments in shares are fully paid up.2) All investments are stated at cost.3) All the above subsidiaries are directly or indirectly, wholly owned by the Company.4) Aggregate amount of unquoted investments 9,890.5 6,880.4
Annual Report 2014 | 155

14. LONG-TERM LOANS AND ADVANCES
As at 31.03.2014
As at 31.03.2013
I in million H in millionUnsecured, considered good unless otherwise statedCapital Advances 1,066.6 692.8 Loans and Advances to related parties [Refer note 47 (C)] 54.7 - Security Deposits 188.8 213.3 Loans to Employees 5.3 4.3 Advance payment of Income Tax (net of Provision) 255.2 239.2 MAT Credit Entitlement 523.4 1,993.8 Balances with Government Authorities (Drawback / Customs duties receivable) 845.0 - Loans to Employees Benefit Trust (Refer note 39) 258.0 476.9
Total 3,197.0 3,620.3
15. CURRENT INVESTMENTS
Non Trade Investments - Unquoted- In Mutual Funds Number of Units
- Birla Sun Life Cash Plus 3,243,608 325.0 - (-)
- ICICI Prudential Liquid 7,051,651 705.6 - (-)
- HDFC Liquid 70,154,424 715.5 - (-)
(Figures in brackets are for previous year)Total 1,746.1 -
1) All investments are stated at lower of cost and fair value unless otherwise stated.2) Aggregate amount of unquoted investments 1,746.1 -
16. INVENTORIES
As at 31.03.2014
As at 31.03.2013
I in million H in millionRaw Materials 4,108.7 4,260.7 Packing Materials 559.5 642.1 Work-in-Process 3,131.0 2,772.8 Finished Goods 3,212.4 3,229.0 Stock-in-Trade 1,879.2 1,467.8 Consumable Stores and Spares 666.7 543.8 Goods-in-Transit
- Raw Materials 121.6 331.0 - Packing Materials 13.2 12.0 - Stock-in-Trade 9.1 - - Consumable Stores and Spares 21.0 49.1
[Refer note 1B (i), 46 (C) & (D)] Total 13,722.4 13,308.3
156 | Lupin Limited

17. TRADE RECEIVABLES
As at 31.03.2014
As at 31.03.2013
I in million H in millionUnsecuredTrade receivables outstanding for a period exceedingsix months from the date they were due for payment
- Considered Good 350.6 433.7 - Considered Doubtful 367.5 104.7
718.1 538.4 Other Trade Receivables Considered Good 28,248.6 18,309.0
28,966.7 18,847.4 Less : Provision for Doubtful Trade Receivables 367.5 104.7
Total 28,599.2 18,742.7
Trade receivables include debts due from subsidiary companies H 22,077.2 million (previous year H 12,236.2 million) [Refer note 47 (C)]
18. CASH AND BANK BALANCES
As at 31.03.2014
As at 31.03.2013
I in million H in millionCash and Cash Equivalents
Bank Balances - In Current Accounts (including money-in-transit) 698.5 82.8 - In Deposit Accounts - 0.2
Cheques on hand 103.6 95.1 Cash on hand 4.9 3.5
807.0 181.6 Other Bank Balances (Refer note below)
Earmarked Balances with Banks - Unpaid dividend accounts 21.5 16.5 - Unpaid matured deposits - 0.1 - Unpaid interest warrants - 0.1 - Deposits against borrowings, guarantees and other commitments 10.4 2.9
Bank Deposits maturing more than 3 months but less than 12 months 623.9 - 655.8 19.6
Total 1,462.8 201.2
Other Bank Balances - Earmarked Balances with Banks include deposits H 10.4 million (previous year H 2.9 million) which have an original maturity of more than 12 months.
Annual Report 2014 | 157

19. SHORT-TERM LOANS AND ADVANCES
As at 31.03.2014
As at 31.03.2013
I in million H in millionUnsecured, considered good unless otherwise statedLoans and Advances to Related Parties [Refer note 47 (C)] 23.6 63.6 Security Deposits
- Considered Good 75.5 104.1 - Considered Doubtful 6.6 -
82.1 104.1 Less : Provision for Doubtful Deposits 6.6 -
75.5 104.1 Balances with Government Authorities (VAT / Cenvat / Service tax credit receivable) 1,542.9 1,730.7 Advance to Vendors
- Considered Good 500.6 748.0 - Considered Doubtful - 7.3
500.6 755.3 Less : Provision for Doubtful Advances - 7.3
500.6 748.0 Loans to Employees Benefit Trust (Refer note 14 & 39) 218.9 - Other Loans and Advances 232.9 193.7 (includes Loans and Advances to employees, Prepaid expenses, etc.)
Total 2,594.4 2,840.1
20. OTHER CURRENT ASSETS
Mark to Market Derivative Assets 256.9 160.4 Export Benefits receivable 1,699.7 1,133.4 Other Current Assets 355.5 1,032.8 (includes receivable from Government authorities, Interest receivables, etc.)
Total 2,312.1 2,326.6
158 | Lupin Limited

21. REVENUE FROM OPERATIONS (GROSS)
For the CurrentYear ended31.03.2014
For the PreviousYear ended
31.03.2013I in million H in million
SaleGoods [Refer note 46 (B)] 86,273.8 69,654.7 Research Services 2,302.8 1,069.2
88,576.6 70,723.9 Other Operating Revenue
Export Benefits and Other Incentives 1,199.1 783.9 Insurance Claims 10.3 43.0 Compensation and Settlement Income 204.8 186.0 Provision for Doubtful Advances Written Back 7.3 - Miscellaneous Income 200.5 107.3
1,622.0 1,120.2 Total 90,198.6 71,844.1
22. OTHER INCOME
Interest on Fixed Deposits with Banks 63.5 57.7 [Tax Deducted at Source H 6.0 million (previous year H 5.8 million)]Other Interest (including interest on income tax refunds) 18.2 21.5 [Tax Deducted at Source H 0.9 million (previous year H 0.5 million)]Dividend on Current Investments 25.0 - Dividend on Long-Term Investment from Subsidiary company [Refer note 47 (B)] 3,020.2 - Dividend on Long-Term Investment from Others 0.2 0.2 Net gain on Sale of Current Investments 5.5 - Net gain on Foreign Currency Transactions 969.7 153.7 Provisions no longer required written back 51.5 -
Total 4,153.8 233.1
23. COST OF RAW AND PACKING MATERIALS CONSUMED
Raw Materials Consumed [Refer note 33 (a)(i) and 46 (E)] 18,727.2 16,880.3 Packing Materials Consumed 2,592.8 2,391.8
Total 21,320.0 19,272.1
24. CHANGES IN INVENTORIES OF FINISHED GOODS, WORK-IN-PROCESS AND STOCK-IN-TRADE
Opening Stock:Finished Goods 3,229.0 2,296.8 Stock-in-Trade 1,467.8 1,040.1 Work-in-Process 2,772.8 2,308.3
7,469.6 5,645.2 Less:Closing Stock:
Finished Goods 3,212.4 3,229.0 Stock-in-Trade 1,888.3 1,467.8 Work-in-Process 3,131.0 2,772.8
8,231.7 7,469.6 Changes In Inventories:
Finished Goods 16.6 (932.2)Stock-in-Trade (420.5) (427.7)Work-in-Process (358.2) (464.5)
Total (762.1) (1,824.4)
Annual Report 2014 | 159
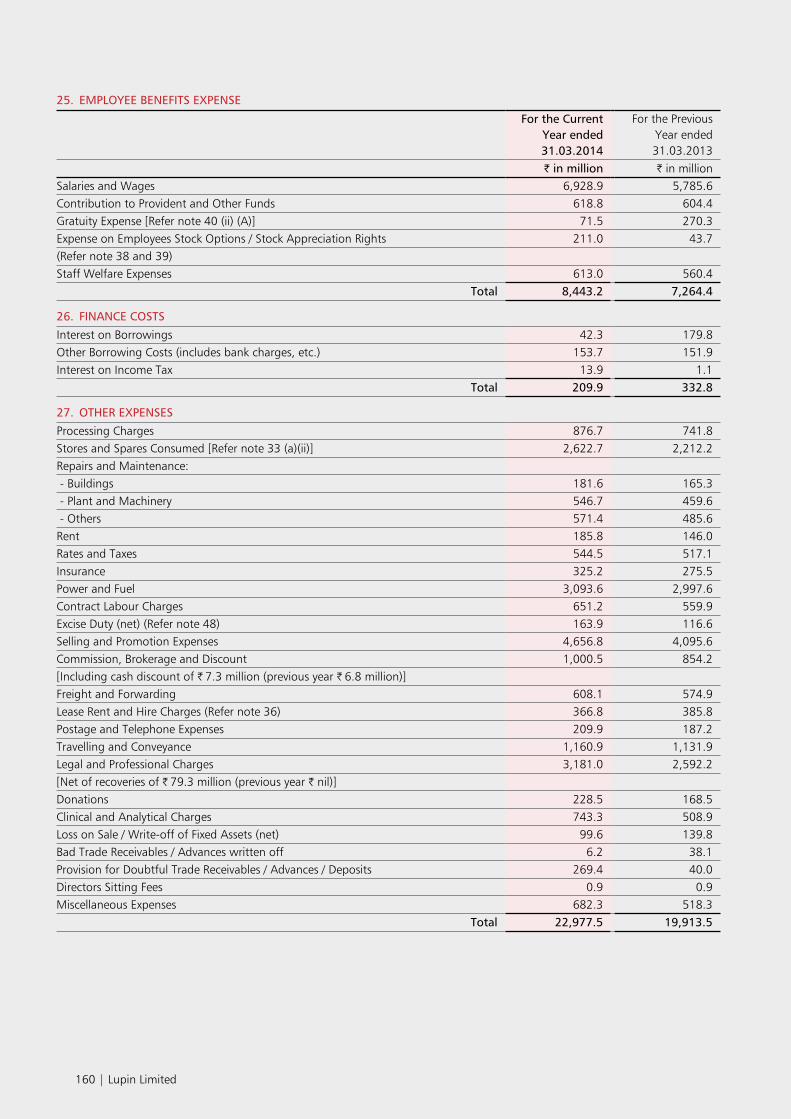
25. EMPLOYEE BENEFITS EXPENSE
For the CurrentYear ended31.03.2014
For the PreviousYear ended
31.03.2013I in million H in million
Salaries and Wages 6,928.9 5,785.6 Contribution to Provident and Other Funds 618.8 604.4 Gratuity Expense [Refer note 40 (ii) (A)] 71.5 270.3 Expense on Employees Stock Options / Stock Appreciation Rights 211.0 43.7 (Refer note 38 and 39)Staff Welfare Expenses 613.0 560.4
Total 8,443.2 7,264.4
26. FINANCE COSTS
Interest on Borrowings 42.3 179.8 Other Borrowing Costs (includes bank charges, etc.) 153.7 151.9 Interest on Income Tax 13.9 1.1
Total 209.9 332.8
27. OTHER EXPENSES
Processing Charges 876.7 741.8 Stores and Spares Consumed [Refer note 33 (a)(ii)] 2,622.7 2,212.2 Repairs and Maintenance: - Buildings 181.6 165.3 - Plant and Machinery 546.7 459.6 - Others 571.4 485.6 Rent 185.8 146.0 Rates and Taxes 544.5 517.1 Insurance 325.2 275.5 Power and Fuel 3,093.6 2,997.6 Contract Labour Charges 651.2 559.9 Excise Duty (net) (Refer note 48) 163.9 116.6 Selling and Promotion Expenses 4,656.8 4,095.6 Commission, Brokerage and Discount 1,000.5 854.2 [Including cash discount of H 7.3 million (previous year H 6.8 million)]Freight and Forwarding 608.1 574.9 Lease Rent and Hire Charges (Refer note 36) 366.8 385.8 Postage and Telephone Expenses 209.9 187.2 Travelling and Conveyance 1,160.9 1,131.9 Legal and Professional Charges 3,181.0 2,592.2 [Net of recoveries of H 79.3 million (previous year H nil)]Donations 228.5 168.5 Clinical and Analytical Charges 743.3 508.9 Loss on Sale / Write-off of Fixed Assets (net) 99.6 139.8 Bad Trade Receivables / Advances written off 6.2 38.1 Provision for Doubtful Trade Receivables / Advances / Deposits 269.4 40.0 Directors Sitting Fees 0.9 0.9 Miscellaneous Expenses 682.3 518.3
Total 22,977.5 19,913.5
160 | Lupin Limited

28. Commitments: a) Estimated amount of contracts remaining to be executed on capital account and not provided for, net of advances, H 1867.4 million (previous year H 1225.3 million).
b) Letters of comfort for support in respect of certain subsidiaries. The Company considers its investments in subsidiaries as strategic and long-term in nature. The Company is committed to operationally, technically and financially support the operations of its subsidiaries.
c) Other commitments – Non-cancellable operating leases (Refer note 36).
29. Contingent Liabilities:
As at 31.03.2014 As at 31.03.2013I in million H in million
a) Income tax demands / matters on account of deductions / disallowances in earlier years, pending in appeals [H 49.7 million (previous year H 49.7 million) consequent to department preferring appeals against the orders of the Appellate Authorities passed in favour of the Company].
Amount paid there against and included under note 14 “Long-Term Loans and Advances” H 26.3 million (previous year H 23.5 million).
173.2 82.3
b) Excise duty, Service tax and Sales tax demands for input tax credit disallowances and demand for additional Entry Tax arising from dispute on applicable rate are in appeals and pending decisions. Amount paid there against and included under note 19 “Short-Term Loans and Advances” H 30.4 million (previous year H 31.7 million).
355.5 424.4
c) Claims against the Company not acknowledged as debts [excluding interest (amount unascertained) in respect of a claim] for transfer charges of land, octroi duty, local body tax, employee claims, power, trade marks, pricing, indemnity and stamp duty.
Amount paid there against without admitting liability and included under note 19 “Short-Term Loans and Advances” H 12.6 million (previous year H 12.6 million).
830.8 419.9
d) Counter guarantee given to GIDC in connection with repayment of loan sanctioned by a financial institution to a company, jointly promoted by an Association of Industries (of which, the Company is a member) and GIDC.
7.5 7.5
e) Letter of comfort issued by the Company towards the credit facilities sanctioned by the bankers of subsidiary companies aggregating H 133.5 million (previous year H 133.0 million).
26.7 39.9
f) Corporate guarantee given in respect of credit facility sanctioned by bankers of subsidiary companies aggregating H 2264.2 million (previous year H 2738.9 million).
2124.1 2645.8
Future cash outflows in respect of the above, if any, is determinable only on receipt of judgement / decisions pending with the relevant authorities. The Company does not expect the outcome of the matters stated above to have a material adverse impact on the Company’s financial condition, results of operations or cash flows.
The Company does not envisage any likely reimbursements in respect of the above.
The Company is involved in various legal proceedings, including product liability related claims, employment claims and other regulatory matters relating to conduct of its business. The Company carries product liability insurance policy with an amount it believes is sufficient for its needs. In respect of other claims, the Company believes, these claims do not constitute material litigation matters and with its meritorious defenses the ultimate disposition of these matters will not have material adverse effect on its Financial Statements.
30. a) During the year, the Company purchased 100% stake consisting of Equity and Capital contribution of Lupin Atlantis Holdings SA, Switzerland (LAHSA) from its wholly owned subsidiary Lupin Holdings B.V., Netherlands at a total cost of
H 2993.7 million pursuant to which LAHSA has become direct wholly owned subsidiary of the Company [Refer note 13(a)]. b) During the year, the Company, through its wholly owned subsidiary LAHSA acquired / subscribed to the equity stake of the
following subsidiaries: i) 100% equity stake in Nanomi B.V., Netherlands at a total cost of H 857.0 million.
ii) 100% equity stake in Lupin Inc., USA at a total cost of H 325.0 million (including additional paid-in capital – securities premium of H 321.9 million).
iii) 100% equity stake in Lupin GmbH, Switzerland at a total cost of H 1.3 million.
Annual Report 2014 | 161

c) During the year, Lupin Inc., USA (LINC) wholly owned subsidiary of LAHSA has subscribed to equity stake of Company’s wholly owned subsidiary Lupin Pharmaceuticals, Inc., USA (LPI) resulting into LINC holding 80% and the Company holding 20% of LPI’s equity stake.
d) During the year, the Company, through its wholly owned subsidiary Lupin Holdings B.V., Netherlands (LHBV), acquired / subscribed to the equity stake of the following subsidiaries:
i) Additional investment in Hormosan Pharma GmbH, Germany at a total cost of H 237.6 million (previous year H 262.2 million).
ii) Additional investment in Lupin Mexico SA de CV, Mexico at a total cost of H 32.8 million (previous year H 10.7 million).
iii) Additional investment in Lupin Pharma Canada Limited, Canada at a total cost of H 30.2 million (previous year H nil).
iv) 100% equity stake of Farma World Importacao e Exportacao De Medicamentos LTDA – EPP, Brazil at a total cost of H 29.8 million.
v) Additional investment in Lupin Philippines Inc., Philippines at a total cost of H 10.9 million (previous year H 33.7 million).
vi) Additional investment in Generic Health Pty Ltd., Australia at a total cost of H nil (previous year H 465.1 million).
vii) Additional investment in Generic Health SDN. BHD., Malaysia at a total cost of H 2.2 million (previous year H nil).
The above acquisitions / subscriptions are based on the net asset values, the future projected revenues, operating profits, cash flows and independent valuation reports; as applicable, of the investee companies.
e) The Company considers its investments in subsidiaries as strategic and long-term in nature and accordingly, in view of the management, any decline in the value of such long-term investments in subsidiaries is considered to be temporary in nature and hence no provision for diminution in value of investments is considered necessary.
31. Pre-operative expenses pending capitalisation included in Capital Work-In- Progress (Refer note 12) represent direct attributable expenditure for setting up of plants prior to the date of commencement of commercial production. The same will be capitalised on completion of projects and commencement of commercial operations. The details of pre-operative expenses are:
Particulars 2013-2014 2012-2013I in million H in million
Opening balance 222.6 88.8Incurred during the current year:Salaries, allowances and contribution to funds 11.2 65.8Professional fees 0.3 1.4Travelling expenses 1.6 10.2Others 4.4 118.1Total 17.5 195.5Less : Capitalised during the year 57.9 61.7Closing balance 182.2 222.6
32. Segment Reporting:The Company has presented data relating to its segments based on its consolidated financial statements, which are presented in the same Annual Report. Accordingly, in terms of paragraph 4 of the Accounting Standard 17 (AS-17) “Segment Reporting”, no disclosures related to segments are presented in this standalone financial statement.
33. Additional information pursuant to the provisions of Paragraph 5 (viii) of Part II of Schedule VI to the Companies Act, 1956. a) Value of Imported and Indigenous consumption: i) Consumption of Raw Materials:
2013-2014 2012-2013% I in million % H in million
Imported 38.3 7173.3 38.4 6474.4Indigenous 61.7 11553.9 61.6 10405.9
Total 100.0 18727.2 100.0 16880.3
162 | Lupin Limited

ii) Consumption of Stores and Spares:
2013-2014 2012-2013% I in million % H in million
Imported 0.4 9.9 2.0 44.0Indigenous 99.6 2612.8 98.0 2168.2
Total 100.0 2622.7 100.0 2212.2
b) CIF Value of Imports:
2013-2014 2012-2013I in million H in million
i) Capital Goods 992.9 728.4ii) Raw Materials 7206.3 6615.6iii) Packing Materials 405.2 284.7iv) Purchases of Stock-in-Trade 488.4 388.3v) Consumable Stores and Spares 560.7 374.0
Total 9653.5 8391.0
c) Expenditure in Foreign currencies (subject to deduction of tax where applicable) on account of:
i) Finance Costs 27.7 52.8ii) Travelling 39.6 29.9iii) Commission 279.1 205.4iv) Selling and Promotion expenses 2554.6 2245.7v) Clinical and Analytical charges 391.9 199.9vi) Legal and Professional Charges (net of recoveries) 2320.7 1644.1vii) Employee Benefits Expense 109.5 85.4viii) Rates and Taxes 330.6 306.0ix) Others 343.8 251.3
Total 6397.5 5020.5
d) Earnings in Foreign Exchange (subject to deduction of tax where applicable) on account of:
i) FOB value of Exports 57177.0 43156.5ii) Sale - Research Services 2302.8 1066.3iii) Reimbursement of freight and insurance on Exports 292.8 281.2iv) Compensation and Settlement Income 200.3 186.0v) Dividend Income 3020.2 -vi) Others 83.0 59.2
Total 63076.1 44749.2
34. Remittance in Foreign currency on account of dividend: The Company has paid dividend in respect of shares held by Non-Resident Shareholders on repatriation basis. This inter-alia
includes portfolio investment and direct investment, where the amount is also credited to Non Resident External Account (NRE A/c). The total amount remittable in this respect is given below:
Year to which the dividend relates 2013-2014 2012-2013 2011-2012Number of non-resident shareholders 2214 1970 1551Number of shares held by them 143097779 142217266 127770018Amount of dividend (H in million) 429.3 568.9 408.9
The Company does not have any information as to the extent to which remittances, if any, in foreign currencies on account of dividends have been made by non-resident shareholders.
Annual Report 2014 | 163

35. Auditors’ Remuneration:
2013-2014 2012-2013I in million H in million
Payment to Auditors*: a) As Auditors 11.4 9.2b) in respect of Taxation matters** 5.2 4.6c) for other services – Certification 1.8 2.0d) Reimbursement of out-of-pocket expenses 0.5 0.4
Total 18.9 16.2
* Excluding service tax.** Includes payment for taxation matters to an affiliated firm covered by a networking arrangement which is registered with the
Institute of Chartered Accountants of India.
36. The Company procures equipments, vehicles and office premises under operating lease agreements that are renewable on a periodic basis at the option of both lessor and lessee. The initial tenure of the lease is generally between 12 months to 60 months. The lease rentals recognised in the Statement of Profit and Loss (Refer note 27) for the year are H 321.1 million (previous year H 294.8 million). The future minimum lease payments and payment profile of non-cancellable operating leases are as under:
Particulars 2013-2014 2012-2013I in million H in million
Not later than one year 263.2 189.4Later than one year but not later than five years 380.6 301.3Later than five years 23.9 25.1
Total 667.7 515.8
37. Basic and Diluted Earnings per Share is calculated as under:
Particulars 2013-2014 2012-2013I in million H in million
Profit attributable to Equity Shareholders 23242.2 12604.3Weighted average number of Equity Shares:
- Basic 447982156 447125025Add: Effect of dilutive issue of employees stock options (ESOPs) - converted during the year and ESOPs outstanding as on 31.03.2014
2262690 1968120
- Diluted 450244846 449093145Earnings per Share (in H)
- Basic 51.88 28.19- Diluted 51.62 28.07
38. Employees Stock Option Plans: a) The Company implemented “Lupin Employees Stock Option Plan 2003” (ESOP 2003), “Lupin Employees Stock Option Plan
2005” (ESOP 2005), “Lupin Subsidiary Companies Employees Stock Option Plan 2005” (SESOP 2005), “Lupin Employees Stock Option Plan 2011” (ESOP 2011) and “Lupin Subsidiary Companies Employees Stock Option Plan 2011” (SESOP 2011)as approved in earlier years by the Shareholders of the Company and the Remuneration / Compensation Committee of the Board of Directors. Details of the options granted during the year under the plans are as under:
Lupin Employees Stock Option Plan 2003 (ESOP 2003):
Grant Date No. of Options Exercise Price I Vesting Period
October 07, 201350000 439.43 07.10.2013 to 07.10.2014
50000
164 | Lupin Limited

Lupin Employees Stock Option Plan 2011 (ESOP 2011):
Grant Date No. of Options Exercise Price I Vesting Period
July 26, 2013
236375 864.75 26.07.2013 to 26.07.2014
236375 864.75 26.07.2013 to 26.07.2015
236375 864.75 26.07.2013 to 26.07.2016
236375 864.75 26.07.2013 to 26.07.2017
945500
November 13, 2013
188 873.50 13.11.2013 to 13.11.2014
188 873.50 13.11.2013 to 13.11.2015
187 873.50 13.11.2013 to 13.11.2016
187 873.50 13.11.2013 to 13.11.2017
750
Lupin Subsidiary Companies Employees Stock Option Plan 2011 (SESOP 2011):
Grant Date No. of Options Exercise Price I Vesting Period
August 02, 2013
21230 873.85 02.08.2013 to 02.08.2014
21230 873.85 02.08.2013 to 02.08.2015
21230 873.85 02.08.2013 to 02.08.2016
21230 873.85 02.08.2013 to 02.08.2017
84920
August 13, 2013
3418 820.05 13.08.2013 to 13.08.2014
3418 820.05 13.08.2013 to 13.08.2015
3417 820.05 13.08.2013 to 13.08.2016
3417 820.05 13.08.2013 to 13.08.2017
13670
November 13, 2013
4175 873.50 13.11.2013 to 13.11.2014
4175 873.50 13.11.2013 to 13.11.2015
4175 873.50 13.11.2013 to 13.11.2016
4175 873.50 13.11.2013 to 13.11.2017
16700
December 27, 2013
4175 907.00 27.12.2013 to 27.12.2014
4175 907.00 27.12.2013 to 27.12.2015
4175 907.00 27.12.2013 to 27.12.2016
4175 907.00 27.12.2013 to 27.12.2017
16700
February 14, 2014
13275 894.05 14.02.2014 to 14.02.2015
13275 894.05 14.02.2014 to 14.02.2016
13275 894.05 14.02.2014 to 14.02.2017
13275 894.05 14.02.2014 to 14.02.2018
53100
Annual Report 2014 | 165

The options are granted at an exercise price, which is in accordance with the relevant SEBI guidelines in force, at the time of such grants. Each option entitles the holder to exercise the right to apply for and seek allotment of one equity share of H 2 each. The options have vesting periods as stated above in accordance with the vesting schedule as per the said plans with an exercise period of ten years from the respective grant dates.
The particulars of the options granted and lapsed under the Schemes are as below:
Particulars Year Ended 31.03.2014
Year Ended 31.03.2013
Nos. Nos.Lupin Employees Stock Option Plan 2003 (ESOP 2003):Options outstanding as at the beginning of the year 763615 1085783Add : Options granted during the year 50000 -Less : Options lapsed during the year - 73125Less : Options exercised during the year 274226 249043Options outstanding as at the year end 539389 763615
Lupin Employees Stock Option Plan 2005 (ESOP 2005):Options outstanding as at the beginning of the year 751920 1250090Add : Options granted during the year - 59500Less : Options lapsed during the year 4875 36375Less : Options exercised during the year 252516 521295Options outstanding as at the year end 494529 751920
Lupin Subsidiary Companies Employees Stock Option Plan 2005 (SESOP 2005):Options outstanding as at the beginning of the year 430119 500421Add : Options granted during the year - -Less : Options lapsed during the year - 6650Less : Options exercised during the year 65986 63652Options outstanding as at the year end 364133 430119
Lupin Employees Stock Option Plan 2011 (ESOP 2011):Options outstanding as at the beginning of the year 2259047 1759250Add : Options granted during the year 946250 699750Less : Options lapsed during the year 219062 146131Less : Options exercised during the year 248696 53822Options outstanding as at the year end 2737539 2259047
Lupin Subsidiary Companies Employees Stock Option Plan 2011 (SESOP 2011):Options outstanding as at the beginning of the year 306780 161380Add : Options granted during the year 185090 145400Less : Options lapsed during the year 57950 -Less : Options exercised during the year 4887 -Options outstanding as at the year end 429033 306780
b. The Company has followed the intrinsic value based method of accounting for stock options granted after April 1, 2005 based on Guidance Note on Accounting for Employee Share-based Payments, issued by the Institute of Chartered Accountants of India (ICAI). Had the compensation cost for the Company’s stock based compensation plans been determined in the manner consistent with the fair value approach as described in the said Guidance Note, the Company’s net income would be lower by H 291.5 million (previous year H 229.5 million) and earnings per share as reported would be as indicated below:
166 | Lupin Limited
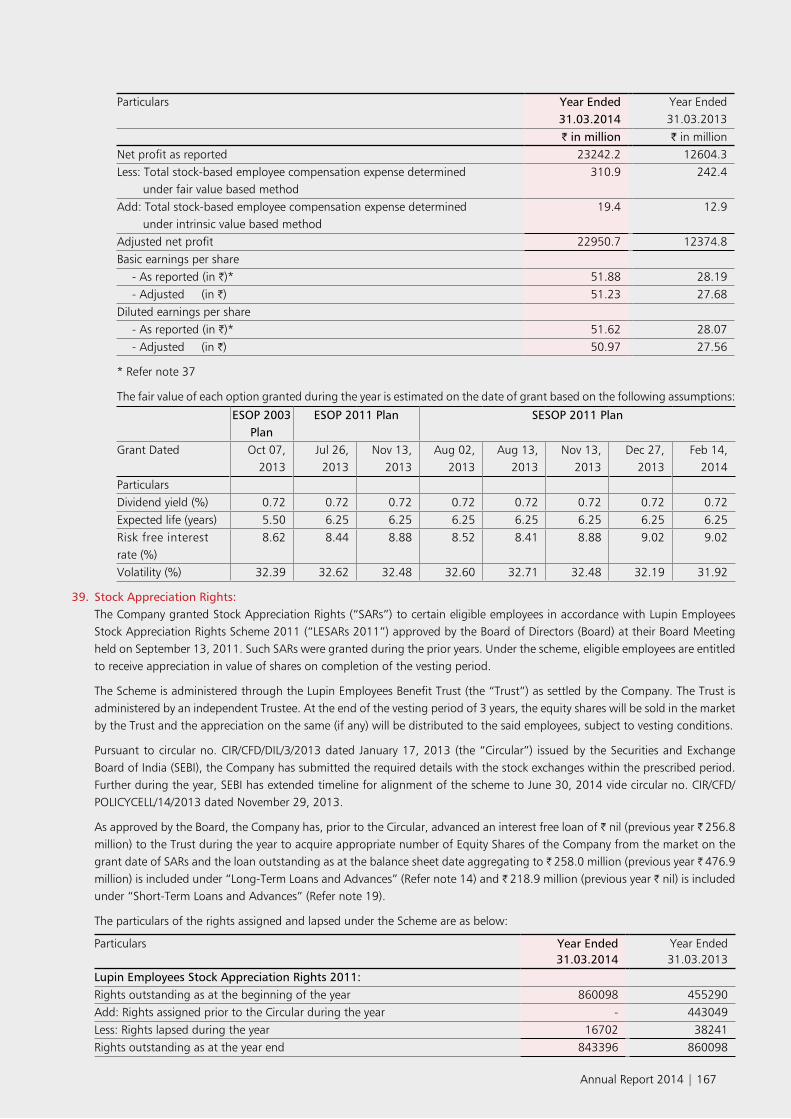
Particulars Year Ended 31.03.2014
Year Ended 31.03.2013
I in million I in millionNet profit as reported 23242.2 12604.3Less: Total stock-based employee compensation expense determined under fair value based method
310.9 242.4
Add: Total stock-based employee compensation expense determined under intrinsic value based method
19.4 12.9
Adjusted net profit 22950.7 12374.8Basic earnings per share
- As reported (in H)* 51.88 28.19- Adjusted (in H) 51.23 27.68
Diluted earnings per share- As reported (in H)* 51.62 28.07- Adjusted (in H) 50.97 27.56
* Refer note 37
The fair value of each option granted during the year is estimated on the date of grant based on the following assumptions:
ESOP 2003 Plan
ESOP 2011 Plan SESOP 2011 Plan
Grant Dated Oct 07,2013
Jul 26,2013
Nov 13, 2013
Aug 02, 2013
Aug 13, 2013
Nov 13, 2013
Dec 27, 2013
Feb 14, 2014
ParticularsDividend yield (%) 0.72 0.72 0.72 0.72 0.72 0.72 0.72 0.72Expected life (years) 5.50 6.25 6.25 6.25 6.25 6.25 6.25 6.25Risk free interestrate (%)
8.62 8.44 8.88 8.52 8.41 8.88 9.02 9.02
Volatility (%) 32.39 32.62 32.48 32.60 32.71 32.48 32.19 31.92
39. Stock Appreciation Rights: The Company granted Stock Appreciation Rights (“SARs”) to certain eligible employees in accordance with Lupin Employees
Stock Appreciation Rights Scheme 2011 (“LESARs 2011”) approved by the Board of Directors (Board) at their Board Meeting held on September 13, 2011. Such SARs were granted during the prior years. Under the scheme, eligible employees are entitled to receive appreciation in value of shares on completion of the vesting period.
The Scheme is administered through the Lupin Employees Benefit Trust (the “Trust”) as settled by the Company. The Trust is administered by an independent Trustee. At the end of the vesting period of 3 years, the equity shares will be sold in the market by the Trust and the appreciation on the same (if any) will be distributed to the said employees, subject to vesting conditions.
Pursuant to circular no. CIR/CFD/DIL/3/2013 dated January 17, 2013 (the “Circular”) issued by the Securities and Exchange Board of India (SEBI), the Company has submitted the required details with the stock exchanges within the prescribed period. Further during the year, SEBI has extended timeline for alignment of the scheme to June 30, 2014 vide circular no. CIR/CFD/POLICYCELL/14/2013 dated November 29, 2013.
As approved by the Board, the Company has, prior to the Circular, advanced an interest free loan of H nil (previous year H 256.8 million) to the Trust during the year to acquire appropriate number of Equity Shares of the Company from the market on the grant date of SARs and the loan outstanding as at the balance sheet date aggregating to H 258.0 million (previous year H 476.9 million) is included under “Long-Term Loans and Advances” (Refer note 14) and H 218.9 million (previous year H nil) is included under “Short-Term Loans and Advances” (Refer note 19).
The particulars of the rights assigned and lapsed under the Scheme are as below:
Particulars Year Ended 31.03.2014
Year Ended 31.03.2013
Lupin Employees Stock Appreciation Rights 2011:Rights outstanding as at the beginning of the year 860098 455290Add: Rights assigned prior to the Circular during the year - 443049Less: Rights lapsed during the year 16702 38241Rights outstanding as at the year end 843396 860098
Annual Report 2014 | 167

The related compensation cost for outstanding SARs amounting to H 191.6 million (previous year H 30.8 million) has been recognized as Employee Benefits Expense and the corresponding credit is included under “Reserves and Surplus” as Employee Stock Appreciation Rights Outstanding. Had the compensation cost for the Company’s stock based compensation plans been determined in the manner consistent with the fair value approach as described in the Guidance Note on Accounting for Employee Share-based Payments issued by ICAI, the Company’s net income would be higher by H 110.3 million (previous year would be lower by H 7.9 million) and earnings per share as reported would be as indicated below:
Particulars Year Ended 31.03.2014
Year Ended 31.03.2013
I in million I in millionNet profit as reported 23242.2 12604.3Less: Total stock-based employee compensation expense determined under fair value based method
81.3 38.7
Add: Total stock-based employee compensation expense determined under intrinsic value based method
191.6 30.8
Adjusted net profit 23352.5 12596.4Basic earnings per share
- As reported (in H)* 51.88 28.19- Adjusted (in H) 52.13 28.17
Diluted earnings per share- As reported (in H)* 51.62 28.07- Adjusted (in H) 51.87 28.05
* Refer note 37
40. Post Employment Benefits: (i) Defined Contribution Plans: The Company makes contributions towards provident fund and super annuation fund to a defined contribution retirement
benefit plan for qualifying employees. The superannuation fund is administered by the Life Insurance Corporation of India (LIC). Under the plan, the Company is required to contribute a specified percentage of payroll cost to the retirement benefit plan to fund the benefits.
The Company recognised H 161.6 million (previous year H 141.9 million) for superannuation contribution and H 92.5 million (previous year H 82.9 million) for provident fund and pension contributions in the Statement of Profit and Loss.
(ii) Defined Benefit Plan: A) The Company makes annual contributions to the Group Gratuity cum Life Assurance Schemes administered by the LIC
of India, a funded defined benefit plan for qualifying employees. The scheme provides for payment as under: a) On normal retirement / early retirement / withdrawal / resignation: As per the provisions of the Payment of Gratuity Act, 1972 with vesting period of 5 years of service.
b) On death in service: As per the provisions of the Payment of Gratuity Act, 1972 without any vesting period.
In addition to the above mentioned scheme, the Company also pays additional gratuity as an ex-gratia and the said amount is provided as non-funded liability based on actuarial valuation.
The most recent actuarial valuation of plan assets and the present value of the defined benefit obligation for gratuity were carried out as at March 31, 2014. The present value of the defined benefit obligations and the related current service cost and past service cost, were measured using the Projected Unit Credit Method.
Based on the actuarial valuation obtained in this respect, the following table sets out the status of the gratuity plan and the amounts recognised in the Company’s financial statements as at the balance sheet date.
168 | Lupin Limited

Sr. No.
Particulars Gratuity (Funded) Gratuity (Unfunded)
As on 31.03.2014
As on 31.03.2013
As on 31.03.2014
As on 31.03.2013
I in million I in million I in million I in millionI) Reconciliation in present value of obligations
(‘PVO’) – defined benefit obligation:Current service cost 102.6 94.4 70.8 252.6Past service cost - - - -Interest cost 45.4 38.6 29.0 24.4Actuarial loss / (gain) (27.0) 33.9 (28.3) (6.7)Benefits paid (63.5) (34.7) - -PVO at the beginning of the year 594.9 462.7 360.3 90.0PVO at the end of the year 652.4 594.9 431.8 360.3
II) Change in fair value of plan assets:Expected return on plan assets 45.3 40.3 - -Actuarial gain / (loss) 4.2 (0.1) - -Contributions by the employer 125.5 45.0 - -Benefits paid (63.5) (34.7) - -Fair value of plan assets at thebeginning of the year
469.4 417.7 - -
Adjustment to opening balance - 1.2 - -Fair value of plan assets at the end of the year 580.9 469.4 - -
III) Reconciliation of PVO and fair value of plan assets:PVO at end of the year 652.4 594.9 431.8 360.3Fair Value of plan assets at the end of the year 580.9 469.4 - -Funded status (71.5) (125.5) (431.8) (360.3)Unrecognised actuarial gain / (loss) - - - -Net liability recognised in the balance sheet (71.5) (125.5) (431.8) (360.3)
IV) Net cost for the year:Current service cost 102.6 94.4 70.8 252.6Past service cost - - - -Interest cost 45.4 38.6 29.0 24.4Expected return on plan assets (45.3) (40.3) - -Actuarial losses / (gain) (31.2) 34.0 (28.3) (6.7)Total expense recognised in the Statement of Profit and Loss (Refer note 25)
71.5 126.7 71.5 270.3
V) Category of assets as at the end of the year:Insurer Managed Funds (100%)(Fund is Managed by LIC as per IRDA guidelines, category-wise composition of the plan assets is not available)
580.9 469.4 NA NA
VI) Actual return on the plan assets: 49.5 40.2 NA NAVII) Assumptions used in accounting for the
gratuity plan:Discount rate (%) 9.2 8.1 9.2 8.1Salary escalation rate (%) 6.0 6.0 6.0 6.0Expected rate of return on plan assets (%) 9.1 9.5 NA NAEstimate of amount of contribution in immediate next year
71.5 125.5 NA NA
The estimates of salary escalation, considered in actuarial valuation, take account of inflation, seniority, promotion and other relevant factors, such as supply and demand in the employment market.
Annual Report 2014 | 169

(I in million)Gratuity (Funded) Year Ended
31.03.2014 31.03.2013 31.03.2012 31.03.2011 31.03.2010Experience adjustment
- On plan liabilities 32.6 6.1 90.5 # #- On plan assets 4.2 0.1 2.3 # #
Present value of benefit obligation (652.4) (594.9) (462.7) (384.6) (244.3)Fair value of plan assets 580.9 469.4 417.7 365.4 213.3Excess of (obligation over plan assets) / plan assets over obligation
(71.5) (125.5) (45.0) (19.2) (31.0)
# Experience adjustment information in respect of previous two years is not available, hence not disclosed.
B) The provident fund plan of the Company, except two plants, is operated by the “Lupin Limited Employees Provident Fund Trust” (the “Trust”). Eligible employees receive benefits from the said Provident Fund. Both the employees and the Company make monthly contributions to the Provident Fund Plans equal to a specified percentage of the covered employee’s salary. The minimum interest rate payable by the Trust to the beneficiaries every year is being notified by the Government. The Company has an obligation to make good the shortfall, if any, between the return from the investments of the Trust and the notified interest rate.
The ASB Guidance on Implementing AS-15, Employee Benefits (revised 2005) issued by Accounting Standards Board (ASB) states that benefit plans involving employer established provident funds, which require interest shortfalls to be recompensed are to be considered as defined benefit plans. As per the Guidance Note from the Actuarial Society of India, the Company has obtained the actuarial valuation of interest rate obligation in respect of Provident Fund as at March 31, 2014 and shortfall aggregating H 9.0 million (previous year H 19.9 million) has been provided for. The Company has an obligation to service the shortfall on account of interest generated by the fund and on maturity of fund investments and hence the same has been classified as Defined Benefit Plan.
The Company recognised H 257.0 million (previous year H 186.6 million) for provident fund contributions in the Statement of Profit and Loss.
Based on the actuarial valuation obtained in this respect, the following table sets out the status of the provident fund plan and the amounts recognised in the Company’s financial statements as at balance sheet date:
Sr. No.
Particulars Provident Fund (Funded)
As on 31.03.2014 As on 31.03.2013I in million I in million
I) Reconciliation in present value of obligations (‘PVO’) – defined benefit obligation:Current service cost 885.6 751.8Past service cost - -Interest cost 1.6 2.1Actuarial loss / (gain) (12.5) (6.8)Benefits paid (224.9) (160.8)PVO at the beginning of the year 2739.1 2152.8PVO at the end of the year 3388.9 2739.1
II) Change in fair value of plan assets:Expected return on plan assets 243.2 208.3Adjustment to opening balance - (7.6)Actuarial gain / (loss) - -Contributions by the employer 642.4 551.1Benefits paid (224.9) (160.8)Fair value of plan assets at the beginning of the year 2719.2 2128.2Fair value of plan assets at the end of the year 3379.9 2719.2
III) Reconciliation of PVO and fair value of plan assets:PVO at end of the year 3388.9 2739.1Fair Value of plan assets at the end of the year 3379.9 2719.2
170 | Lupin Limited

Sr. No.
Particulars Provident Fund (Funded)
As on 31.03.2014 As on 31.03.2013I in million I in million
Funded status (9.0) (19.9)Unrecognised actuarial gain / (loss) - -Net liability recognised in the balance sheet (9.0) (19.9)
IV) Net cost for the year:Current service cost 885.6 751.8Past service cost - -Interest cost 1.6 2.1Expected return on plan assets (243.2) (208.3)Actuarial losses / (gain) (12.5) (6.8)Interest expense pertaining to the Trust 642.4 543.5Net expense recognised in the Statement of Profit and Loss (Refer note 25)
(10.9) (4.7)
V) Category of assets as at the end of the year:Investment in PSU bonds 22% 56%Investment in Government Securities 44% 29%Bank Special Deposit 6% 8%Investment in other securities 26% 5%Bank Savings Deposit 2% 2%
VI) Actual return on the plan assets: 243.2 208.3VII) Assumptions used in accounting for the provident fund plan:
Discount rate (%) 9.2 8.1Salary escalation rate (%) 6.0 6.0Expected rate of return on plan assets (%) 8.8 8.7
41. (i) The Company has entered into foreign currency forward contracts which are not intended for trading or speculative purposes but for hedge purposes to establish the amount of reporting currency required or available at the settlement date of certain payables. The following are the outstanding foreign currency forward contracts entered into by the Company:
Currency Amount Buy or Sell Cross CurrencyAs on 31.03.2014 As on 31.03.2013
USD 10149602 - Buy INR
(ii) The year-end foreign currency exposures that have not been hedged by a derivative instrument or otherwise are given below:
a. Amount receivable in foreign currency on account of the following:
Particulars Foreign Currency As on 31.03.2014 As on 31.03.2013I in million Amount in
Foreign CurrencyH in million Amount in
Foreign CurrencyExport of goods
AUD 125.3 2259636 133.5 2363665ACUD 9.1 152575 2.0 36850EURO 660.6 8025239 688.4 9902683GBP 420.1 4216617 262.7 3199195JPY 20.7 35384214 - -USD 24545.7 409675022 14714.5 271059596
Other receivablesEURO 7.1 86818 - -JPY 7.9 13495560 1.4 2375288UZS 0.1 2973852 H 30188 1161058USD 759.8 12680846 14.4 264596RUB 0.1 47325 1.1 646264KZT 1.9 5710111 0.6 1689291
Annual Report 2014 | 171

Particulars Foreign Currency As on 31.03.2014 As on 31.03.2013I in million Amount in
Foreign CurrencyH in million Amount in
Foreign Currency
RMB 3.4 348403 1.1 122533UAH 0.1 25879 H 26009 3822
b. Amount payable in foreign currency on account of the following:
Particulars Foreign Currency As on 31.03.2014 As on 31.03.2013I in million Amount in
Foreign CurrencyH in million Amount in
Foreign CurrencyImport of goods and services
USD 1515.5 25294703 2334.2 42999601GBP 47.4 475248 137.6 1676038
EURO 95.0 1154647 133.3 1917463AUD 2.7 47940 3.4 59669JPY 7.7 13227862 5.5 9510000CAD 35.8 658358 - -CHF 1.2 17808 0.4 6618SEK 0.2 22593 0.1 15751KZT - - 0.1 391061SGD - - 0.6 14434BRL - - 1.1 39756
Secured and Unsecured loans payable
USD - - 5703.7 105069863
Interest accrued and not due on Secured and Unsecured loans
USD - - 0.2 2964
Other payablesUSD 282.4 4713239 181.2 3337497RUB 0.5 297112 0.7 420588KZT 0.4 1120778 0.9 2544909
ACUD 0.9 15187 0.7 12112UAH 2.7 489197 2.9 422213EURO 45.0 546687 56.9 818855AUD 1.0 17525 2.0 34562AED 0.3 18594 0.3 18594JPY 0.3 500000 - -BRL 0.5 18684 - -RMB H 10224 1060 - -UZS 0.1 4809250 - -
42. Details of Derivative Contracts: The Company enters into forward and option contracts in order to hedge and manage its foreign currency exposures towards
future export earnings. Such derivative contracts are entered into by the Company for hedging purposes only, and are accordingly classified as cash flow hedges.
The category wise break-up thereof is as under:
(Amount in million)Particulars Currency As at 31.03.2014 As at 31.03.2013 Cross CurrencyForward contracts USD 129.0 244.0 INROption contracts USD 0.8 7.5 INR
The changes in the fair value of the derivative contracts during the year ended March 31, 2014, aggregating H 265.5 million (previous year H 441.9 million) designated and effective as hedges have been credited to the Cash Flow Hedge Reserve and
H 36.8 million (previous year H 11.8 million debited) is credited to the Statement of Profit and Loss, being the ineffective portion thereof.
172 | Lupin Limited

43. The aggregate amount of revenue expenditure incurred during the year on Research and Development and shown in the respective heads of account is H 8112.0 million (previous year H 6472.7 million).
44. The information regarding Micro Enterprises and Small Enterprises has been determined to the extent such parties have been identified on the basis of information available with the Company. This has been relied upon by the auditors.
Particulars As on 31.03.2014
As on 31.03.2013
I in million H in millioni. Principal amount remaining unpaid to any supplier as at the end of the
accounting year285.2 262.1
ii. Interest due thereon remaining unpaid to any supplier as at the end of the accounting year
- -
iii. The amount of interest paid along with the amounts of the payment made to the supplier beyond the appointed day
- -
iv. The amount of interest due and payable for the year - -v. The amount of interest accrued and remaining unpaid at the end of the
accounting year- -
vi. The amount of further interest due and payable even in the succeeding year, until such date when the interest dues as above are actually paid
- -
45. As per best estimate of the management, provision has been made towards probable non-saleable return of goods from customers, as per Accounting Standard 29 (AS-29) notified under Companies (Accounting Standards) Rules, 2006.
Particulars 2013-2014 2012-2013I in million H in million
Carrying amount at the beginning of the year 78.0 80.0Add : Additional Provisions made during the year 697.5 440.0Less : Amounts used / utilised during the year 673.0 442.0Carrying amount at the end of the year 102.5 78.0
46. Details of purchases, sale of goods and inventories: A) Details of purchases of stock-in-trade:
Classification Year ended31.03.2014 31.03.2013I in million I in million
a) Formulations:Tablets 3206.0 2903.0 Liquids 842.1 1386.3 Capsules 851.2 840.7 Injections:
- Liquids 114.3 180.3 - Vials 2877.6 2113.5
Creams and Powder 184.1 180.8 Inhalers 2.7 8.7
b) Bulk Drugs, Intermediates and Chemicals - 13.7 c) Others 213.9 133.3
Total 8291.9 7760.3
Purchases of formulations includes samples.
Annual Report 2014 | 173
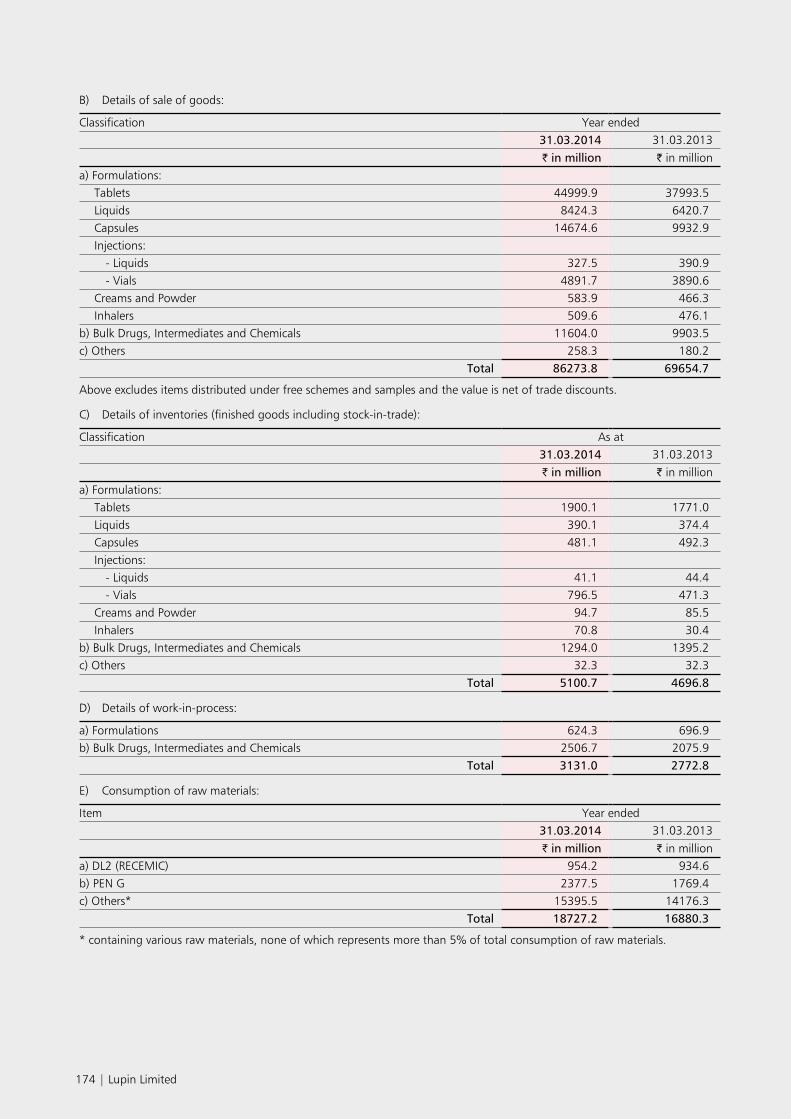
B) Details of sale of goods:
Classification Year ended31.03.2014 31.03.2013I in million I in million
a) Formulations: Tablets 44999.9 37993.5 Liquids 8424.3 6420.7 Capsules 14674.6 9932.9 Injections:
- Liquids 327.5 390.9 - Vials 4891.7 3890.6
Creams and Powder 583.9 466.3 Inhalers 509.6 476.1
b) Bulk Drugs, Intermediates and Chemicals 11604.0 9903.5 c) Others 258.3 180.2
Total 86273.8 69654.7
Above excludes items distributed under free schemes and samples and the value is net of trade discounts.
C) Details of inventories (finished goods including stock-in-trade):
Classification As at31.03.2014 31.03.2013I in million I in million
a) Formulations: Tablets 1900.1 1771.0 Liquids 390.1 374.4 Capsules 481.1 492.3 Injections:
- Liquids 41.1 44.4 - Vials 796.5 471.3
Creams and Powder 94.7 85.5 Inhalers 70.8 30.4
b) Bulk Drugs, Intermediates and Chemicals 1294.0 1395.2 c) Others 32.3 32.3
Total 5100.7 4696.8
D) Details of work-in-process:
a) Formulations 624.3 696.9 b) Bulk Drugs, Intermediates and Chemicals 2506.7 2075.9
Total 3131.0 2772.8
E) Consumption of raw materials:
Item Year ended31.03.2014 31.03.2013I in million I in million
a) DL2 (RECEMIC) 954.2 934.6b) PEN G 2377.5 1769.4c) Others* 15395.5 14176.3
Total 18727.2 16880.3
* containing various raw materials, none of which represents more than 5% of total consumption of raw materials.
174 | Lupin Limited

47. Related Party Disclosures, as required by Accounting Standard 18 (AS-18) are given below : A. Relationships - Category I : Subsidiaries: Lupin Pharmaceuticals, Inc., USA Kyowa Pharmaceutical Industry Co., Limited, Japan Lupin Australia Pty Limited, Australia Lupin Holdings B.V., Netherlands Pharma Dynamics (Proprietary) Limited, South Africa Hormosan Pharma GmbH, Germany Multicare Pharmaceuticals Philippines Inc., Philippines Lupin Atlantis Holdings SA, Switzerland [Refer note 30 (a)] Lupin (Europe) Limited, UK Amel Touhoku, Japan (upto 28 February 2013) Lupin Pharma Canada Limited, Canada Lupin Mexico SA de CV, Mexico Generic Health Pty Limited, Australia Bellwether Pharma Pty Limited, Australia Max Pharma Pty Limited, Australia Lupin Philippines Inc., Philippines Lupin Healthcare Limited, India Generic Health SDN. BHD., Malaysia I’rom Pharmaceutical Co., Limited, Japan Lupin Middle East FZ-LLC, UAE (from 13 June 2012) Lupin GmbH, Switzerland (from 15 August 2013) Lupin Inc., USA (from 27 June 2013) Farma World Importacao e Exportacao De Medicamentos LTDA - EPP, Brazil (from 17 December 2013)
Nanomi B.V., Netherlands (from 30 January 2014)
Category II: Key Management Personnel: Dr. D. B. Gupta Chairman Dr. Kamal K. Sharma Vice Chairman Mrs. Vinita Gupta Chief Executive Officer Mr. Nilesh Gupta Managing Director Mrs. M. D. Gupta Executive Director
Category III: Others (Relatives of Key Management Personnel and Entities in which the Key Management Personnel have control or significant influence)
Dr. Anuja Gupta (Daughter of Chairman) Mrs. Kavita Gupta Sabharwal (Daughter of Chairman) Dr. Richa Gupta (Daughter of Chairman) Mrs. Pushpa Khandelwal (Sister of Chairman) Bharat Steel Fabrication and Engineering Works D. B. Gupta (HUF) Lupin Human Welfare and Research Foundation Lupin International Pvt. Limited Lupin Investments Pvt. Limited Lupin Holdings Pvt. Limited (formerly Lupin Marketing Pvt. Limited) Matashree Gomati Devi Jana Seva Nidhi Novamed Investments Pvt. Limited Polynova Industries Limited Rahas Investments Pvt. Limited Synchem Investments Pvt. Limited Visiomed Investments Pvt. Limited (formerly Visiomed (India) Pvt. Limited) Zyma Laboratories Limited
Annual Report 2014 | 175

B. Transactions with the related parties:
(I in million unless other wise stated)Sr.No.
Transactions Subsidiaries Key Management
Personnel
Others Total
1. Sale of Goods 45966.2 - - 45966.2
(32028.8) ( - ) ( - ) (32028.8)
2. Sale - Research Services-IP 638.5 - - 638.5
( - ) ( - ) ( - ) ( - )
3. Sale - Research Services-Others 226.0 - - 226.0
(151.4) ( - ) ( - ) (151.4)
4. Income from Royalty 64.2 - - 64.2
(50.2) ( - ) ( - ) (50.2)
5. Guarantee Commission Income 5.0 - - 5.0
(6.4) ( - ) ( - ) (6.4)
6. Rent Expenses - - 90.9 90.9
( - ) ( - ) (101.0) (101.0)
7. Expenses Recovered / Rent Received 35.1 - 3.0 38.1
(18.7) ( - ) (2.9) (21.6)
8. Remuneration Paid - 572.1 - 572.1
( - ) (398.4) ( - ) (398.4)
9. Purchases of Goods / Materials 5.5 - - 5.5
(H 1114/-) ( - ) ( - ) (H 1114/-)
10. Investments during the year 3010.1 - - 3010.1
(7.5) ( - ) ( - ) (7.5)
11. Advance against Investment 14.6 - - 14.6
( - ) ( - ) ( - ) ( - )
12. Donations Paid - - 135.9 135.9
( - ) ( - ) (91.4) (91.4)
13. Dividend Paid - 46.4 1424.8 1471.2
( - ) (20.1) (651.4) (671.5)
14. Services Received 2068.3 - - 2068.3
(1865.7) ( - ) ( - ) (1865.7)
15. Expenses Reimbursed 576.3 - - 576.3
(432.3) ( - ) ( - ) (432.3)
16. Dividend Income 3020.2 - - 3020.2
( - ) ( - ) ( - ) ( - )
17. Deposits paid for Leave and Licence arrangement for premises
- - 0.4 0.4 ( - ) ( - ) ( - ) ( - )
18. Refund of Deposits paid for Leave and Licence arrangement for premises
- - 7.9 7.9 ( - ) ( - ) ( - ) ( - )
19. Deposits received for Leave and Licence arrangement for premises
- - 0.1 0.1 ( - ) ( - ) ( - ) ( - )
20. Corporate guarantee withdrawn by the Company to the bankers of wholly owned subsidiary companies
576.2 - - 576.2
(141.6) ( - ) ( - ) (141.6)
Out of the above items transactions in excess of 10% of the total related party transactions are as under :
(I in million unless other wise stated)Sr.No.
Transactions Related party relation
For the year ended 31.03.2014
For the year ended 31.03.2013
1. Sale of Goods Lupin Pharmaceuticals, Inc. Subsidiary Company 44056.6 31291.4
2. Sale - Research Services-IP Lupin Atlantis Holdings SA Subsidiary Company 638.5 -
176 | Lupin Limited

(I in million unless other wise stated)Sr.No.
Transactions Related party relation
For the year ended 31.03.2014
For the year ended 31.03.2013
3. Sale - Research Services-Others Lupin Atlantis Holdings SA Subsidiary Company 226.0 148.1
4. Income from Royalty Generic Health Pty Limited Subsidiary Company 64.2 50.2
5. Guarantee Commission Income Kyowa Pharmaceutical Industry Co., Limited Subsidiary Company 5.0 6.4
6. Rent Expenses Lupin Investments Pvt. Limited Others 72.2 82.0 Bharat Steel Fabrication and Engineering Works Others 10.3 10.3
7. Expenses Recovered / Rent Received Lupin Pharmaceuticals, Inc. Subsidiary Company 10.3 2.9 Polynova Industries Limited Others 3.0 2.9 Generic Health Pty Limited Subsidiary Company - 12.7 Pharma Dynamics (Proprietary) Limited Subsidiary Company 6.2 - Kyowa Pharmaceutical Industry Co., Limited Subsidiary Company 11.3 0.7
8. Remuneration Paid Dr. D. B. Gupta Key Management
Personnel 371.5 219.7
Dr. Kamal K. Sharma Key Management Personnel
134.7 123.4
Mr. Nilesh Gupta Key Management Personnel
60.7 50.1
9. Purchases of Goods / Materials Kyowa Pharmaceutical Industry Co., Limited Subsidiary Company 5.5 H 1114/-
10. Investments during the year Lupin Middle East FZ-LLC Subsidiary Company - 7.5 Lupin Atlantis Holdings SA Subsidiary Company 2993.7 -
11. Advance against Investment Lupin Middle East FZ-LLC Subsidiary Company 14.6 -
12. Donations Paid Lupin Human Welfare and Research Foundation Others 129.2 83.6
13. Dividend Paid Lupin Holdings Pvt. Limited(formerly Lupin Marketing Pvt. Limited)
Others 282.8 129.3
Rahas Investments Pvt. Limited Others 319.9 146.2 Visiomed Investments Pvt. Limited(formerly Visiomed (India) Pvt. Limited)
Others 304.6 139.2
Zyma Laboratories Limited Others 384.7 175.9 14. Services Received
Lupin Pharmaceuticals, Inc. Subsidiary Company 1746.4 1538.5 Lupin (Europe) Limited Subsidiary Company 262.4 291.0
15. Expenses Reimbursed Lupin Pharmaceuticals, Inc. Subsidiary Company 384.9 391.4 Hormosan Pharma GmbH Subsidiary Company 73.4 6.5 Lupin Atlantis Holdings SA Subsidiary Company 76.3 - Lupin Australia Pty Limited Subsidiary Company 32.3 27.2 Lupin (Europe) Limited Subsidiary Company 2.6 2.9 Pharma Dynamics (Proprietary) Limited Subsidiary Company - 1.0
16. Dividend Income Lupin Pharmaceuticals, Inc. Subsidiary Company 3020.2 -
Annual Report 2014 | 177

(I in million unless other wise stated)Sr.No.
Transactions Related party relation
For the year ended 31.03.2014
For the year ended 31.03.2013
17. Deposits paid for Leave and Licence arrangement for premises Bharat Steel Fabrication and Engineering Works
Others 0.4 -
18. Refund of Deposits paid for Leave and Licence arrangement for premises Lupin Investments Pvt. Limited Others 7.9 -
19. Deposits received for Leave and Licence arrangement for premises Polynova Industries Limited Others 0.1 -
20. Corporate guarantee withdrawn by the Company to the bankers of wholly owned Subsidiary company Kyowa Pharmaceutical Industry Co., Limited Subsidiary Company 576.2 141.6
Ms. Vinita Gupta, who was appointed as Chief Executive Officer of the Company w.e.f. September 1, 2013, is an Executive Director but not in whole-time employment of the Company. She is an employee of Lupin GmbH, Switzerland, a wholly-owned subsidiary of Lupin Atlantis Holdings SA, Switzerland. Ms. Vinita Gupta renders management services to the Company in terms of the Services Agreement between the Company and Lupin GmbH, effective January 1, 2014. No amount is charged to the Company for the year in respect of her services pending approval of the same from the Reserve Bank of India, which has been received subsequent to the year end.
C. Balances due from / to the related parties:
(I in million)Sr.No.
Transactions Subsidiaries Key Management
Personnel
Others Total
1. Investments 9870.3 - - 9870.3
(6860.2) ( - ) ( - ) (6860.2)
2. Advance against Investment 14.6 - - 14.6
( - ) ( - ) ( - ) ( - )
3.Deposits paid under Leave and Licence arrangement for office premises
- - 54.7 54.7 ( - ) ( - ) (62.2) (62.2)
4. Trade Receivables 22077.2 - - 22077.2
(12236.2) ( - ) ( - ) (12236.2)
5. Trade Payables 947.3 - - 947.3
(883.8) ( - ) ( - ) (883.8)
6. Commission Payable - 323.5 - 323.5 - (178.0) ( - ) (178.0)
7. Expenses Payable 211.2 - - 211.2 (52.6) ( - ) ( - ) (52.6)
8. Expenses Receivable 9.0 - 0.1 9.1
( - ) ( - ) ( - ) ( - )
9. Income Receivable 1.0 - - 1.0
(1.4) ( - ) ( - ) (1.4)
10.Deposits received under Leave and Licence arrangement for office premises
- - 0.1 0.1 ( - ) ( - ) ( - ) ( - )
11.Letter of Comfort issued by the Company to the bankers of subsidiary companies
133.5 - - 133.5 (133.0) ( - ) ( - ) (133.0)
12.Corporate guarantee issued by the Company to the bankers of wholly owned subsidiary companies
2264.2 - - 2264.2
(2738.9) ( - ) ( - ) (2738.9)
i) Figures in brackets are for previous year. ii) Related party relationship is as identified by the Company and relied upon by the Auditors.
178 | Lupin Limited

48. Excise duty (Refer note 27) includes H 34.2 million (previous year H 3.2 million) being net impact of the excise duty provision on opening and closing stock.
49. No borrowing cost has been capitalised during the year.
50. Previous year’s figures have been regrouped / reclassified wherever necessary to correspond with the current year’s classification / disclosure.
Signatures to Note 1 to 50
For Lupin Limited
Dr. Desh Bandhu Gupta Dr. Kamal K. Sharma Vinita GuptaChairman Vice Chairman Chief Executive Officer
Nilesh Gupta M. D. Gupta Dr. Vijay KelkarManaging Director Executive Director Director
Richard Zahn R. A. Shah Dr. K. U. MadaDirector Director Director
Dileep C. ChoksiDirector
Place : Mumbai R. V. SatamDated : May 7, 2014 Company Secretary
Annual Report 2014 | 179

STA
TEM
ENT
PURS
UA
NT
TO S
ECTI
ON
212
OF
THE
CO
MPA
NIE
S A
CT,
195
6 RE
LATI
NG
TO
SU
BSID
IARY
CO
MPA
NIE
SN
ame
of t
he
subs
idia
ry c
ompa
nyFi
nanc
ial y
ear/
per
iod
of
the
subs
idia
ry c
ompa
nyD
ate
from
whi
ch it
be
cam
esu
bsid
iary
Exte
nt o
f in
tere
st o
f th
e ho
ldin
g C
ompa
ny i
n th
e C
apit
al a
nd R
eser
ves
of t
he s
ubsi
diar
y co
mpa
ny a
t th
e en
d of
the
fin
anci
al y
ear/
peri
od o
f th
e su
bsid
iary
com
pany
Net
agg
rega
te a
mou
nt o
f th
e su
bsid
iary
com
pany
’s p
rofit
/ (lo
ss)
not
deal
t w
ith
in t
he
hold
ing
Com
pany
’s a
ccou
nts
Net
agg
rega
te a
mou
nt o
f th
e su
bsid
iary
com
pany
’s p
rofit
/ (lo
ss)
deal
t w
ith
in t
he h
oldi
ng
Com
pany
’s a
ccou
nts
(H in
mill
ion)
a) N
umbe
r of
sha
res
held
b) E
xten
t of
ho
ldin
gC
urre
ntye
ar/p
erio
dPr
evio
usye
ars/
peri
ods
Cur
rent
year
/per
iod
Prev
ious
year
s/pe
riod
s
Lupi
n Ph
arm
aceu
tical
s In
c., U
SAYe
ar e
nded
31.
03.2
014
30.0
6.20
031,
500,
000
shar
es o
f th
e fa
ce v
alue
of
US
$ 1
each
(Not
e 1)
100%
1424
.927
23.7
Nil
Nil
Kyow
a Ph
arm
aceu
tical
Indu
stry
Co.
, Ltd
., Ja
pan
Year
end
ed 3
1.03
.201
418
.10.
2007
196,
000
Ord
inar
y Sh
ares
of
the
face
val
ue o
f JP
Y 50
0 ea
ch (N
ote
2)10
0%99
7.3
3689
.4N
ilN
ilLu
pin
Aus
tral
ia P
ty L
td.,
Aus
tral
iaYe
ar e
nded
31.
03.2
014
01.1
2.20
0480
0,00
0 O
rdin
ary
Shar
es o
f th
e fa
ce v
alue
of
AU
$ 1
eac
h10
0%(6
.5)
(0.5
)N
ilN
ilLu
pin
Hol
ding
s B.
V.,
Net
herla
nds
Year
end
ed 3
1.03
.201
430
.03.
2007
105,
829
Ord
inar
y Sh
ares
of
the
face
val
ue o
f Eu
ro 1
000
each
100%
1051
.516
16.7
Nil
Nil
Phar
ma
Dyn
amic
s (P
ropr
ieta
ry) L
td.,
Sout
h A
fric
aYe
ar e
nded
31.
03.2
014
01.0
3.20
0860
,000
Equ
ity S
hare
s of
the
fac
e va
lue
of S
outh
Afr
ican
Ran
d 1
each
(Not
e 2)
60%
415.
711
69.5
Nil
Nil
Hor
mos
an P
harm
a G
mbH
, Ger
man
yYe
ar e
nded
31.
03.2
014
25.0
7.20
0812
2,90
0 Eq
uity
Sha
res
of t
he f
ace
valu
e of
Eur
o 1
each
(Not
e 2)
100%
(171
.9)
(700
.3)
Nil
Nil
Mul
ticar
e Ph
arm
aceu
tical
s Ph
ilipp
ines
Inc.
, Phi
lippi
nes
Year
end
ed 3
1.03
.201
426
.03.
2009
4,57
8,52
5 Eq
uity
Sha
res
of t
he f
ace
valu
e of
PH
P 10
eac
h (N
ote
2)51
%67
.082
.8N
ilN
ilLu
pin
Atla
ntis
Hol
ding
s SA
, Sw
itzer
land
Year
end
ed 3
1.03
.201
405
.06.
2007
2,48
6 Eq
uity
Sha
res
of t
he f
ace
valu
e of
CH
F 10
00 e
ach
(Not
e 4)
10
0%(1
278.
6)75
2.8
Nil
Nil
Lupi
n (E
urop
e) L
td.,
U.K
.Ye
ar e
nded
31.
03.2
014
05.0
6.20
0925
1,00
0 O
rdin
ary
Shar
es o
f G
BP 1
eac
h10
0%(1
17.0
)(3
0.3)
Nil
Nil
Lupi
n Ph
arm
a Ca
nada
Ltd
., Ca
nada
Year
end
ed 3
1.03
.201
418
.06.
2009
330,
000,
100
Com
mon
Sha
res
(Sha
res
do n
ot h
ave
face
val
ue) (
Not
e 5)
100%
(1.5
)(1
35.9
)N
ilN
ilLu
pin
Mex
ico
SA d
e CV
, Mex
ico
Year
end
ed 3
1.03
.201
423
.08.
2010
113,
293
Com
mon
Sha
res
of M
XN
$ 1
00 e
ach
(Not
e 2)
100%
(12.
6)(1
6.5)
Nil
Nil
Gen
eric
Hea
lth P
ty L
td.,
Aus
tral
iaYe
ar e
nded
31.
03.2
014
27.0
9.20
1018
8,40
5,37
8 O
rdin
ary
Shar
es o
f no
par
val
ue (N
ote
2)91
.04%
(103
.1)
(858
.9)
Nil
Nil
Bellw
ethe
r Ph
arm
a Pt
y Lt
d., A
ustr
alia
Year
end
ed 3
1.03
.201
427
.09.
2010
1,00
0,00
0 O
rdin
ary
Shar
es o
f no
par
val
ue (N
ote
6)91
.04%
471.
4(1
5.5)
Nil
Nil
Max
Pha
rma
Pty
Ltd.
, Aus
tral
iaYe
ar e
nded
31.
03.2
014
27.0
9.20
102,
885,
714
Ord
inar
y Sh
ares
of
no p
ar v
alue
(Not
e 6)
91.0
4%N
il(7
9.4)
Nil
Nil
Lupi
n Ph
ilipp
ines
, Inc
., Ph
ilipp
ines
Year
end
ed 3
1.03
.201
420
.12.
2010
4,79
0,13
6 Co
mm
on S
hare
s of
the
fac
e va
lue
of P
HP
10 e
ach
(incl
udin
g 5
shar
es
held
by
nom
inee
s) (N
ote
2)10
0%31
.5(4
9.5)
Nil
Nil
Lupi
n H
ealth
care
Ltd
., In
dia
Year
end
ed 3
1.03
.201
417
.03.
2011
2,61
6,67
7 Eq
uity
Sha
res
of t
he f
ace
valu
e of
H 1
0/-
each
(inc
ludi
ng 6
sha
res
held
by
nom
inee
s)10
0%0.
4(3
.7)
Nil
Nil
Gen
eric
Hea
lth S
DN
. BH
D.,
Mal
aysi
aYe
ar e
nded
31.
03.2
014
18.0
5.20
1112
1,44
4 O
rdin
ary
Shar
es o
f th
e fa
ce v
alue
of
RM 1
eac
h (N
ote
2)10
0%(0
.8)
(1.4
)N
ilN
ilI’r
om P
harm
aceu
tical
Co.
, Ltd
., Ja
pan
Year
end
ed 3
1.03
.201
430
.11.
2011
31,6
00,0
00 O
rdin
ary
Shar
es o
f JP
Y N
il ea
ch (N
ote
3)10
0%3.
9
2
87.2
Nil
Nil
Lupi
n M
iddl
e Ea
st F
Z-LL
C, D
ubai
Year
end
ed 3
1.03
.201
413
.06.
2012
500
Shar
es o
f th
e fa
ce v
alue
of
AED
100
0 ea
ch10
0%(1
0.2)
(3.0
)N
ilN
ilFa
rma
Wor
ld Im
port
acao
e E
xpor
taca
o de
Med
icam
ento
s LT
DA
- E
PP, B
razi
l
From
17.
12.2
013
to 3
1.03
.201
417
.12.
2013
20,0
00 S
hare
s of
the
fac
e va
lue
of B
RL 1
eac
h (N
ote
2)10
0%(2
.5)
N.A
.N
ilN
.A.
Lupi
n G
mbH
, Sw
itzer
land
From
15.
08.2
013
to 3
1.03
.201
415
.08.
2013
200
Ord
inar
y Sh
ares
of
the
face
val
ue o
f CH
F 10
0 ea
ch (N
ote
7)10
0%0.
03N
.A.
Nil
N.A
.
Lupi
n In
c., U
SAFr
om 2
7.06
.201
3to
31.
03.2
014
27.0
6.20
1350
,000
,000
Sha
res
of t
he f
ace
valu
e of
US
$ 0.
001
each
(Not
e 7)
100%
(284
.1)
N.A
.N
ilN
.A.
Nan
omi B
.V.,
Net
herla
nds
From
30.
01.2
014
to 3
1.03
.201
430
.01.
2014
1,81
8,18
1 Sh
ares
of
the
face
val
ue o
f Eu
ro 0
.01
each
(Not
e 7)
100%
(55.
3)N
.A.
Nil
N.A
.
Not
es:
1.Lu
pin
Inc.
, USA
, hol
ds 1
,200
,000
Sha
res
and
Lupi
n Li
mite
d, 3
00,0
00 S
hare
s.2.
Shar
es a
re h
eld
by L
upin
Hol
ding
s B.
V.,
Net
herla
nds,
who
lly-o
wne
d su
bsid
iary
of
the
Com
pany
.3.
Shar
es a
re h
eld
by K
yow
a Ph
arm
aceu
tical
Indu
stry
Co.
, Ltd
., Ja
pan,
who
lly-o
wne
d su
bsid
iary
of
Lupi
n H
oldi
ngs
B.V
., N
ethe
rland
s.4.
Dur
ing
the
year
, Lup
in L
imite
d ac
quire
d th
e en
tire
shar
ehol
ding
of 2
,486
Equ
ity S
hare
s in
Lup
in A
tlant
is H
oldi
ngs
SA, S
witz
erla
nd (L
AH
SA) w
hich
wer
e he
ld b
y Lu
pin
Hol
ding
s B.
V., N
ethe
rland
s. C
onse
quen
tly, L
AH
SA b
ecam
e a
dire
ct s
ubsid
iary
of t
he C
ompa
ny.
5.Lu
pin
Hol
ding
s B.
V.,
Net
herla
nds,
hol
ds 3
30,0
00,0
00 S
hare
s an
d Lu
pin
Atla
ntis
Hol
ding
s SA
, Sw
itzer
land
, 100
Sha
res.
6.Sh
ares
are
hel
d by
Gen
eric
Hea
lth P
ty L
td.,
Aus
tral
ia, a
sub
sidi
ary
of L
upin
Hol
ding
s B.
V.,
Net
herla
nds.
7.Sh
ares
are
hel
d by
Lup
in A
tlant
is H
oldi
ngs
SA, S
witz
erla
nd, w
holly
-ow
ned
subs
idia
ry o
f th
e Co
mpa
ny.
For
and
on
beha
lf of
the
Boa
rd o
f D
irec
tors
R.
V. S
atam
D
r. D
esh
Band
hu G
upta
N
ilesh
Gup
ta
Com
pany
Sec
reta
ry
Cha
irman
M
anag
ing
Dire
ctor
Mum
bai,
May
7, 2
014
Full
acco
unts
of
the
afor
esai
d su
bsid
iarie
s ar
e av
aila
ble
for
insp
ectio
n at
the
Reg
iste
red
Off
ice
of t
he C
ompa
ny a
nd o
n re
ques
t w
ill b
e se
nt t
o m
embe
rs f
ree
of c
ost.
180 | Lupin Limited

LUPIN LIMITEDCorporate OfficeLaxmi Towers, ‘B’ Wing, Bandra Kurla ComplexBandra (East)Mumbai 400 051IndiaTel.: +91 (22) 6640 2222
Registered Office159, C.S.T. Road, KalinaSantacruz (East)Mumbai 400 098IndiaTel.: +91 (22) 6640 2323
Websitewww.lupinworld.com

www.lupinworld.com


